Article

Geochemical Characteristics and Sedimentary Paleoenvironment of the Coal-Bearing Strata in the Xishanyao Formation: A Case Study of the Yihua Coal Mine in the Zhundong Coalfield, Xinjiang

1
Key Laboratory of Coalbed Methane Resources & Reservoir Formation Process, Ministry of Education, China University of Mining & Technology, Xuzhou 221008, China
2
School of Resources and Geosciences, China University of Mining & Technology, Xuzhou 221116, China
3
School of Geology and Mining Engineering, Xinjiang University, Urumqi 830047, China
*
Author to whom correspondence should be addressed.
Minerals 2024, 14(5), 461; https://doi.org/10.3390/min14050461
Submission received: 10 March 2024 / Revised: 16 April 2024 / Accepted: 24 April 2024 / Published: 26 April 2024
(This article belongs to the Special Issue Geochemistry and Mineralogy of Coal-Bearing Rocks, 2nd Edition)

Abstract

:
The eastern Junggar Basin in Xinjiang harbors abundant coal resources within the Middle Jurassic Xishanyao Formation. However, the formation environment associated with these coal-bearing strata remains unclear. Geochemical characteristics serve as crucial geological indicators of the sedimentary period. Therefore, it is imperative to explore the geochemical attributes and sedimentary context of the coal-rich layers within the Middle Jurassic Xishanyao Formation in the Zhundong region to enhance the prospects of coal extraction and utilization. The elemental compositions, both major and trace, of the Xishanyao Formation were analyzed through X-ray fluorescence spectrometry (XRF) and inductively coupled plasma mass spectrometry (ICP-MS). A comprehensive analysis was conducted on the sediment provenance, tectonic background, and depositional environment of the coal-bearing strata in the Xishanyao Formation. Moreover, through the utilization of a range of discrimination indices, including Sr/Cu, B/Ga, Sr/Ba, V/Cr, Ni/Co, and δCe, the paleo-depositional setting of the coal-containing layers was reconstructed. The findings suggest that the primary source rocks of the coal-bearing beds in the Xishanyao Formation consist of continental tholeiites, with the predominant material composition in the source region being felsic volcanic rocks originating from the upper crust. The tectonic backdrop of the source region is marked by a continental island arc environment. During the sedimentation period of the Xishanyao Formation, the depositional environment was characterized by a freshwater oxidizing setting. Additionally, it experienced a transition from arid-hot to humid-hot before returning to arid-hot conditions.

Graphical Abstract

1. Introduction

Situated in the northern expanse of Xinjiang, China, nestled between the Altai Mountains and the Tianshan Mountains, the Junggar Basin holds its majestic place as the nation’s second-largest inland basin. The eastern part of the Junggar Basin is the Zhundong coalfield, which covers an area of approximately 7800 km2. The estimated coal reserves in the Zhundong coalfield are around 164 Gt [1,2,3]. It is one of the largest coal-producing regions in China, with a favorable supply of coal resources, overall. The coal seams in this region are renowned for their substantial thickness and superior quality, distinguished by minimal ash, sulfur, and phosphorus content, alongside elevated levels of volatile matter and calorific value [4,5]. This coal-rich area holds significant economic value.
The Junggar Basin is a multi-cycle superimposed basin, rich in various fossil energy resources such as petroleum, natural gas, and coal. The Mesozoic sedimentary strata within the basin boast exceptional preservation, with the significant Middle Jurassic Xishanyao Formation as a vital coal-bearing layer. Throughout the sedimentary rock deposition, the composition of major and trace elements is shaped by the mineral makeup of the source rocks, depositional milieu, and ensuing diagenetic transformations. This intricate geochemical modulation is intricately linked not only to the physical and chemical attributes of the sediments and aquatic realms but also to the lithological composition of the source rocks, tectonic context, and depositional conditions. The elemental content of sedimentary rocks serves as an important tool for reconstructing the nature of the source rocks, tectonic background, and ancient depositional environments. Among them, Sr/Cu can reflect paleoclimate [6]; Sr (ppm) and Sr/Ba can reflect paleosalinity [7,8]; V/Cr, Ni/Co, V/(V + Ni), and V/Sc can reflect paleo-redox conditions [9,10,11]; and Co can reflect sedimentation rates, enabling calculations of paleo-water depth [12]. By employing interdisciplinary methods such as lithofacies analysis, paleogeomorphology, and petrology, the reconstruction of ancient environments can be achieved [13].
Coal, known as one of the most intricate substances in nature, encompasses nearly all naturally transpiring elements present on the periodic table [14]. Certain elements found in coal can present potential hazards to both human health and the environment during the utilization of coal, such as arsenic (As) and mercury (Hg) [15,16]. However, coal also holds significant industrial mining and utilization potential for certain elements, such as Ge [17,18], Ga [19,20], U [21], REE [22], and others. Therefore, the background values of trace element contents in coal can provide guidance for the exploration and utilization of associated elements in coal, as well as for environmental protection research. Ketris et al. [23] and Dai et al. [24] have collated the baseline values of trace elements in coal and coal ash on a global scale, and the baseline values of major and trace elements in Chinese coal, respectively. Furthermore, as a special sedimentary organic rock with reducing and adsorptive properties, coal is highly sensitive to factors such as depositional environment and temperature during its formation, undergoing corresponding changes and leaving traces. Understanding the abundance [15,23], occurrence state [24,25], spatial–temporal distribution characteristics, and sources of elements in coal can provide insights into the sedimentary source areas of coal basins [26,27], help analyze the depositional environment of coal formation [28], and offer valuable information for understanding regional geological evolution and sudden geological events. Hence, investigations into the elements present in coal [14,15,22,24,25,29,30,31,32] play a crucial role in unraveling fundamental theoretical inquiries concerning the geological genesis, depositional context, regional geological evolution, and abrupt geological occurrences linked to coal deposits. Additionally, such research holds substantial practical importance for fostering environmentally friendly and sustainable advancements in the coal industry, and for safeguarding strategic reserves of essential metal resources for the nation.
This study is centered on an investigation of the levels and dispersion of major and trace elements within the B1 coal seam and the associated overlying rocks in the Xishanyao Formation at the Yihua coal mine in the Zhundong coalfield, Xinjiang. Through a thorough examination of the sources of materials and depositional settings of the coal seam and overlying strata, the study seeks to reconstruct the paleoenvironment prevalent during the deposition phase. The findings are anticipated to furnish a scientific groundwork for subsequent activities such as exploration, extraction, and sustainable utilization of the coal seam.

2. Geological Setting

The Junggar Basin lies in the northern part of Xinjiang, as illustrated in Figure 1a. The Zhundong region refers to the area to the east of the Wucaiwan–Fukang line in the Junggar Basin. It represents a primary tectonic division in the region, consisting of 15 secondary tectonic units that originated during the Late Permian and Triassic Periods. Throughout the Early Jurassic to Middle Jurassic epochs, the Junggar Basin underwent extension and subsidence, leading to the formation of a broad basin characterized by shallow waters and the emergence of inland coal-bearing basins. From the Middle Jurassic to Late Jurassic, the Junggar Basin underwent compressional and torsional activities due to the collision of surrounding blocks. The Badaowan Formation (J1b) represents a rapid infilling and consolidation of clastic sediments following the Indosinian orogeny. Following this, the Zhundong region transitioned into a period of stable sedimentation, during which the Sangonghe Formation (J1s), Xishanyao Formation (J2x), and Toutunhe Formation (J2-3t) were sequentially deposited. The Xishanyao Formation represents a terrestrial clastic sedimentary succession mainly consisting of sandstone, mudstone, and coal seams. The depositional setting of the Xishanyao Formation is defined by a shallow lake-marsh environment. Throughout the sedimentation phase of the Xishanyao Formation, the evolution of swamp coal facies was notably pronounced, leading to a substantial buildup of sediment and the establishment of the Zhundong coalfield.
The Zhundong coalfield is positioned amidst the Cara Hill to the north and the Bogeda Mountain to the south. Within this region lies the Yihua coal mine in the Wucaiwan mining area of the Zhundong coalfield (refer to Figure 1b), located within the Shazhang fault-fold belt and on the western flank of the Zhangpenggou anticline. The principal exploitable coal seam is the B1 coal seam, originating from the Middle Jurassic Xishanyao Formation (refer to Figure 1c). The B2 coal seam in the mining vicinity is constituted of carbonaceous mudstone and lacks significant mining value.

3. Materials and Methods

3.1. Collection and Preparation of Sample

In accord with Chinese National Standard GB/T 482-2008 [33], a total of 22 samples were obtained vertically from the Yihua coal mine working face situated in the Wucaiwan mining area within the Zhundong coalfield, Changji Hui Autonomous Prefecture, Xinjiang, China. These samples comprised 12 coal samples (C3, C4, C5, C6, C8, C9, C11, C12, C15, C16, C19, and C20), 5 parting samples (C7-P, C10-P, C13-P, C14-P, and C17-P), 2 roof samples (C21-R and C22-R), 2 floor samples (C1-F and C2-F), and 1 through-layer crack sample (C18-L). Additionally, 16 samples of overlying strata were collected at equidistant intervals and labeled as SXX (where XX represents a number). The sampling locations are illustrated in Figure 1c.
Each sample, weighing around 200 g, underwent drying in a vacuum drying oven at a consistent temperature of 60 °C until reaching a stable weight. Subsequently, the dried samples were finely ground into powder form and preserved for subsequent applications. A 200-mesh sieve, equivalent to approximately 71 μm, was utilized to screen samples intended for experimental and analytical purposes, encompassing assessments for major elements, trace elements, and rare earth elements.

3.2. Analytical Procedures

The major elemental oxides (including SiO2, Al2O3, Fe2O3, TiO2, CaO, Na2O, MgO, K2O, P2O5, and MnO) of the 38 samples were analyzed using the Axiosmax X-ray fluorescence spectrometer (XRF, S8 Tiger, Bruker, Germany) following the guidelines outlined in Chinese National Standard GB/T14506.28-2010 [34]. The analyses of trace elements and rare earth elements were carried out using an inductively coupled plasma mass spectrometer (ICP-MS, iCAPTM Q, Thermo Fisher Scientific, Waltham, MA, USA), and following the guidelines of Chinese National Standard GB/T14506.30-2010 [35].

4. Results and Analysis

4.1. Analysis of Major Elements

4.1.1. Major-Element Analyses of Coal Seam Samples

The content levels of major elemental oxides in coal, as shown in Table 1, can provide insights into the coal-forming environment and the diverse geological processes that influenced the formation of the coal seam [36]. The thickness-weighted average values offer a more precise portrayal of the oxide content in the coal seam, undisturbed by outlier data points. The thickness-weighted average values (Coal-av) of major elemental oxides in Yihua coal, along with their concentration coefficients (CC = thickness-weighted average value/Chinese coal), are detailed in Table 1. In comparison to the average values for Chinese coal [15], the levels of CaO, MgO, and Na2O in Yihua coal are notably elevated, standing at 2.28 wt%, 0.79 wt%, and 0.39 wt%, respectively. The MnO content closely aligns with the average value for Chinese coal, while the quantities of SiO2, Al2O3, TiO2, Fe2O3, K2O, and P2O5 are considerably lower than the average values for Chinese coal. The primary components of the major elemental oxides are CaO and MgO, representing 53.94 wt% and 18.64 wt%, respectively, followed by Na2O, SiO2, Al2O3, and Fe2O3, accounting for 9.16 wt%, 8.12 wt%, 4.63 wt%, and 3.93 wt%, respectively. The proportions of other elemental oxides are all less than 1 wt%. The SiO2, Al2O3, and Fe2O3 content, which forms the ash content of Yihua coal, is notably lower than the average value observed in Chinese coal. This aligns with the distinctive trait of Yihua coal, which is known for its exceptionally low ash content.
The concentration coefficient of a major element is the ratio of the thickness-weighted average of the content in the coal to the corresponding elemental content of the Chinese coal. It can reflect the depletion and enrichment status of major elemental constituents in coal. According to the classification method proposed by Dai et al. [15], the concentration coefficients are divided into six categories: depletion (<0.5), normal (0.5~2), slight concentration (2~5), concentration (5~10), high concentration (10~100), and abnormal concentration (>100). In Yihua coal, MgO and Na2O exhibit slight concentration, with concentration coefficients of 3.57 and 2.42, respectively. CaO and MnO are classified as normal, with concentration coefficients of 1.85 and 0.53, respectively. The other major elemental constituents are in a depleted state (Figure 2).

4.1.2. Major-Element Analyses of Overlying Rock Strata

The content levels of major elemental oxides in the overlying rock strata of the B1 coal seam are documented in Table 2. Among them, SiO2 and Al2O3 are the predominant constituents, with average values of 59.78 wt% and 16.07 wt%, respectively. Following them are Fe2O3, CaO, MgO, K2O, and Na2O with lesser amounts of about 1 wt%~6 wt%. The remaining elements are less than 1 wt%. As shown in Figure 3, the contents of SiO2, Al2O3, and TiO2 in the rock samples have similar trends. The contents of Fe2O3 and CaO have similar trends. MgO, K2O, and Na2O tend to decrease as depth increases. It is noteworthy that the SiO2, Al2O3, and TiO2 contents in S2 and S12 are significantly lower than those in other rocks, while the Fe2O3 content is significantly higher.
The overlying rock samples exhibit high SiO2 (ranging from 11.25 wt% to 72.34 wt%, with an average of 59.78 wt%) and Al2O3 (ranging from 3.68 wt% to 25.86 wt%, with an average of 16.07 wt%). The average MgO content is 1.32 wt% (ranging from 0.11 wt% to 9.36 wt%), the average K2O content is 2.06 wt% (ranging from 0.41 wt% to 2.77 wt%), and the average Na2O content is 1.45 wt% (ranging from 0.6 wt% to 3.86 wt%). The Rittmann index (σ), which stands at 0.56, is below 3.3, indicating the subalkaline character of the rocks. From the TAS diagram (TAS classification of volcanic rocks, Figure 4a), the content of the overlying rock samples is normalized to fall mainly in andesite region [38], which represents the medium-acidic volcanic rocks. The AFM diagram (Figure 4b) shows that the overlying rock samples belong to the calc-alkaline series [39]. The average A/CNK (A/CNK = Al2O3/102/[CaO/56 + Na2O/62 + K2O/94]) value of the samples is 2.26, indicating peraluminous rocks.

4.2. Trace Element Analysis

4.2.1. Trace Element Analyses of Coal Seam Samples

The trace element contents of the coal samples from the Xishanyao Formation of the Middle Jurassic in the Yihua coal mine exhibit notable variances, as outlined in Table 3. The trace element concentration coefficients in coal were determined by comparing the thickness-weighted average of the trace element content in coal with the corresponding element content in world low-rank coal (CC = samples/world low-rank coal, shown in Figure 5a). The concentration coefficients for the floor, parting and roof were determined by comparing the average trace element content in these layers with the corresponding elements in world clay (CC = samples/world clay, as shown in Figure 5b–d).
Based on the element concentration coefficient grading index [40], the enrichment factors for Cr, Ni, Sr, and Ba in the coal were determined to be 0.89, 0.53, 1.71, and 0.65, respectively, indicating a normal state. However, the remaining elements were found to be depleted. The floor exhibited slight concentrations of Ga, Zr, Nb, In, Hf, and Bi with concentration coefficient of 2.39, 3.25, 2.55, 2.46, 3.42, and 2.41, respectively. Co, Zn, Rb, Sr, Cd, Cs, Ba, and Tl were present in lower concentrations, indicating depletion, while the remaining elements were within normal ranges. In the parting, Sr and Ta were normal, with concentration coefficients of 0.85 and 0.61, respectively, while the other elements were depleted. As for the roof, Sc, V, Cu, Ga, Zr, Nb, In, Hf, and Pb were in a normal state, while the remaining elements were depleted.

4.2.2. Trace Element Analyses of Overlying Rock Strata

The trace element contents of the overlying rock samples from the Xishanyao Formation in the Yihua coal mine are presented in Table 4. The concentration coefficients for the trace elements in the overlying rock were determined by comparing their average content in samples with those in world clay (CC = samples/world clay), as illustrated in Figure 6. The concentration coefficients for Mo, Cd, C, and Tl in the overlying rock were relatively small at 0.46, 0.13, 0.38, and 0.30, respectively, indicating depletion. However, the concentration coefficients for the remaining elements were in the range of 0.5 to 2, indicating a normal state. The spider diagram of trace elements in the overlying rock (Figure 7) displays an enrichment of large ion lithophile elements like Cs, Rb, Th, U, K, and Pb, whereas high field-strength elements such as Nb, Ti, and P were found to be depleted. This distribution pattern is similar to that of the upper crust, suggesting that the magmatic activity of the overlying rocks may have originated from the upper crust. The depletion of Sr may be related to the separation of plagioclase during the crystallization differentiation process of the magma.

4.3. Rare Earth Element Analysis

In general, the rare earth element (REE) content in particular samples, like those from the upper crust and chondrite, is employed for standardizing the REE content in coal. The study opted to use upper crust samples (UCC) to normalize the rare earth element (REE) content of coal, as coal exhibits greater resemblance to the natural characteristics of the upper crust. Additionally, chondrite samples (Cl) were used for standardizing the REE content levels in the floor, roof, parting, and overlying rocks. The rare earth elements were categorized into three groups based on the classification method proposed by Seredin and Dai [15]: light rare earth elements (LREEs), middle rare earth elements (MREYs), and heavy rare earth elements (HREEs). Content levels of rare earth elements and yttrium in coal seam samples are listed in Table 5 and content levels of rare earth elements and yttrium in the overlying rock strata are listed in Table 6.

4.3.1. Analysis of Rare Earth Elements in Coal Seam Samples

Table 7 presents the rare earth element (REE) geochemical parameters of coal seam samples obtained from the Yihua coal mine. The average total rare earth element (∑REE) content in the 12 coal samples is 3.57 μg/g, with individual samples ranging from 1.76 to 6.78 μg/g. This average value is notably lower than the average for world low-rank coals (65.27 μg/g) and the average for Chinese coals (138 μg/g). The average total REE content in the five parting samples is 7.97 μg/g (ranging from 3.71 to 14.85 μg/g), which is comparable to the coal content but still much lower than the averages for world low-rank coal and Chinese coal. The average total REE content levels of the floor and roof samples are 80.49 μg/g and 163.9 μg/g, respectively, indicating significantly higher REE content compared to the coal and parting samples. The rare earth element (REE) content of the coal at Yihua is primarily influenced by the input of terrestrial clasts. The ash yield of Yihua coal falls within a relatively low range of 2.93% to 7.92%, with an average of 4.51%. This suggests a significant lack of terrestrial clastic supply during the coal formation process, leading to extremely low REE content in Yihua coal. The ranges of light, middle, and heavy rare earth element content in the 12 coal samples are 0.94 μg/g to 4.35 μg/g (average 2.35 μg/g), 0.49 μg/g to 2.16 μg/g (average 0.92 μg/g), and 0.20 μg/g to 0.55 μg/g (average 0.29 μg/g), respectively. In the five parting samples, the ranges of light, middle, and heavy rare earth element content are 2.53 μg/g to 13.39 μg/g (average 6.75 μg/g), 0.57 μg/g to 1.22 μg/g (av-erage 0.93 μg/g), and 0.20 μg/g to 0.36 μg/g (average 0.28 μg/g), respectively. The floor samples have light, middle, and heavy rare earth element content levels of 34.72 μg/g, 36.67 μg/g, and 9.11 μg/g, respectively. The roof samples have light, middle, and heavy rare earth element content levels of 128.7 μg/g, 29.45 μg/g, and 5.80 μg/g, respectively. The dominant rare earth elements in the Yihua coal seam samples are light rare earth elements, followed by middle and heavy rare earth elements (Figure 8).
The ratios of light to middle rare earth elements (L/M), light to heavy rare earth elements (L/H), and middle to heavy rare earth elements (M/H) in the 12 coal samples vary from 1.50 to 3.38 (average of 2.56), 4.82 to 11.32 (average of 7.83), and 2.41 to 3.97 (average of 3.06), respectively. These ratios indicate a significant fractionation of rare earth elements in the coal, with the fractionation degree following the order of LREE > MREY > HREE. In the parting samples, the average values of L/M, L/H, and M/H are 7.33, 25.70, and 3.38, respectively, suggesting a higher degree of rare earth element fractionation compared to the coal samples. Similarly, the roof samples exhibit higher rare earth element fractionation, with average values of L/M, L/H, and M/H being 4.64, 24.05, and 5.12, respectively. In contrast, the floor samples show a lower degree of rare earth element fractionation, with average values of L/M, L/H, and M/H being 1.01, 3.95, and 3.96, respectively, indicating comparable levels of light and middle rare earth element content.
Upon standardizing the rare earth elements in the 12 coal samples to the corresponding elements in the upper crust, the distribution pattern of rare earth elements in coal (shown in Figure 9a,b) reveals that the Yihua coal samples predominantly demonstrate a medium-heavy rare earth element enrichment type. The coal samples exhibit a negative anomaly in Ce and significant positive anomalies in Tb, Tm, and Yb. The lower coal samples C3, C4, and C5, and the upper coal samples C15, C16, C19, and C20 show slight positive anomalies in Eu, while the middle coal layers C6, C8, C9, C11, and C12 exhibit pronounced positive anomalies in Eu. The average value of δCe in the coal samples is 0.72 (ranging from 0.45 to 0.85), indicating a negative anomaly, while the average value of δEu is 2.42 (ranging from 0.99 to 11.32), indicating a positive anomaly.
The distribution patterns of REE in the roof and floor, as well as in the parting and through-layer crack samples, standardized to the chondritic meteorite, are shown in Figure 9c,d. Roof, floor, parting and through-layer crack samples all show a light rare earth element enrichment type. The δEu values for the floor and roof samples are 0.68 and 0.74, respectively, indicating a negative anomaly, while the δCe values are 0.99 and 1.01, respectively, indicating no significant anomaly. The parting samples display notable positive anomalies in Tb, Tm and Yb, with δCe and δEu values of 0.86 and 1.83, respectively, similarly to the anomalous elements in coal. However, parting samples C7-P and C10-P from the lower coal seams exhibit a slight negative anomaly in Eu, while parting samples C14-P and C17-P from the upper coal seams exhibit a pronounced positive anomaly in Eu.
Rare earth elements exhibit similar geochemical properties and behaviors, mainly in the +3 valence state. However, the valence state of Ce, Eu, Tb, Tm and Yb can vary under different conditions. Ce4+ has a stable Xe electron configuration and is the only element that can exist stably in low-temperature, oxidizing and alkaline conditions in shallow surface water environments. Under high-temperature and reducing conditions, Eu3+ can be reduced to Eu2+. Therefore, anomalies in Ce and Eu can reflect the redox conditions during deposition and the geochemical composition of sediment provenance.

4.3.2. Rare Earth Element Analyses of Overlying Rock Strata

The geochemical parameters of rare earth elements (REE) in the overlying rock strata of the B1 coal seam are detailed in Table 8. The average total rare earth element content (∑REY) in the rock samples is 171.76 μg/g, ranging from 100.40 to 243.82 μg/g, which closely aligns with the total rare earth element content in the upper crust (168.30 μg/g). The ranges of light, middle, and heavy rare earth elements in the 16 rock samples are 64.49 μg/g to 155.53 μg/g (average of 120.87 μg/g), 26.15 μg/g to 91.33 μg/g (average of 42.72 μg/g), and 5.76 μg/g to 12.91 μg/g (average of 8.17 μg/g), respectively. The ratios of LREE to MREY (L/M), LREE to HREE (L/H), and MREY to HREE (M/H) range from 0.88 to 10.99 (with an average of 3.47), 3.61 to 54.65 (with an average of 17.33), and 2.69 to 7.07 (with an average of 5.06) respectively, indicating significant fractionation of rare earth elements in the rocks.
The distribution pattern of rare earth elements in the rock samples (as shown in Figure 10) indicates that the rock samples display a light rare earth element enrichment type, characterized by a distribution curve that slopes downwards to the right. There is a significant negative anomaly in Eu (with an average δEu value of 0.75, ranging from 0.64 to 0.87). All rock samples show similar distribution curves, indicating that these rocks are products of the same magmatic crystallization process. The negative anomaly in δEu is a result of plagioclase feldspar fractionation during the magmatic crystallization process.

5. Discussion

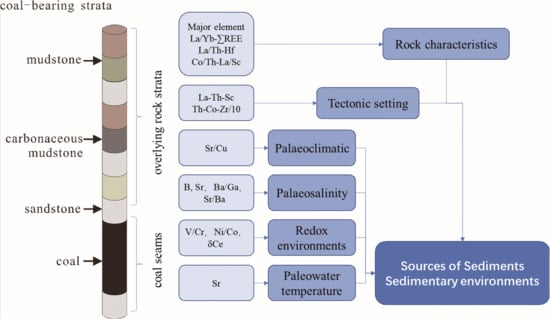
5.1. Sources of Sediments

5.1.1. Rock Characteristics of Source Area

The rock samples from the Xishanyao Formation in the Yihua coal mine in the Zhundong coalfield show a SiO2 content of 59.78 wt%, an Al2O3 content of 16.07 wt%, and relatively low contents of MgO and Fe2O3 at 1.32 wt% and 5.38 wt%, respectively, suggesting that the parent rock is likely derived mostly from the upper crust. On the provenance discrimination diagram for F3–F4 [41], it can be observed that the sediment mainly originates from a quartzy sedimentary rock source area (Figure 11a). The tectonic environment discrimination diagram for F1–F2 reveals that the Xishanyao Formation was likely formed in an environment characterized by an oceanic island arc, an active continental margin, and a continental island arc, as shown in Figure 11b. However, the specific formation environment within these classifications still requires further investigation for a definitive determination.
The La/Yb-∑REE diagram (as shown in Figure 12a) can provide insights into the characteristics of the source rock. In this diagram, the rock samples from the Xishanyao Formation predominantly lie within the continental tholeiite region. This positioning suggests that the source rock of the samples is primarily composed of continental tholeiite. However, the coal seam and parting samples fall outside this region, with lower La/Yb and ∑REE, suggesting that the coal seam was minimally influenced by external sources during coal formation. The Co-Th-Hf ternary diagram (Figure 12b) shows that the material composition of the rock samples is predominantly felsic volcanics and quartzite, while the coal seam samples fall within the greywacke region. The Th and Hf elements are relatively stable and present in lower concentrations, further indicating minimal external influence during coal deposition. In the La/Th-Hf diagram (Figure 12c), the rock samples are mainly concentrated in the felsic source region and are distributed close to the average composition of the upper crust, with lower trace and rare earth element contents in the coal seam samples. In the Co/Th-La/Sc diagram (Figure 12d), the rock samples are distributed in the region between felsic volcanic rocks and andesite, with the average composition closer to the felsic volcanic rock region, indicating that the source rock of the rock samples is primarily felsic volcanic rock, while the coal samples are more dispersed. In conclusion, the sedimentary source rocks of the Xishanyao Formation in the Yihua coal mine exhibit characteristics of felsic source rocks and are mainly derived from the upper crust.

5.1.2. Tectonic Setting of the Source Area

The major elemental composition of the samples from the Xishanyao Formation in the Yihua coal mine indicates their formation in environments such as oceanic island arcs, active continental margins, and continental island arcs. To further determine the tectonic background of the Xishanyao Formation, the La-Th-Sc and Th-Co-Zr/10 tectonic discrimination diagrams established by Bhatia et al. [41] for sandstone and mudstone samples were employed. These diagrams provide insights into the tectonic settings controlling the sedimentary processes.
In the La-Th-Sc diagram (depicted in Figure 13a), the rock samples exhibit a predominant distribution in the continental island arc region. Conversely, the coal seam samples are primarily located in the continental island arc, active continental margin, and passive continental margin regions. In the Th-Sc-Zr/10 diagram (illustrated in Figure 13b), the data points are predominantly clustered in the continental island arc region, with the rock samples showing a tendency towards oceanic island arcs, while the coal samples tend towards passive continental margins. The combined analysis of both diagrams indicates that the source rock of the Xishanyao Formation samples in the Yihua coal mine is predominantly associated with a continental island arc tectonic background, with additional characteristics of oceanic island arcs and passive continental margins.
Comparing the REE parameters of the coal and rock samples from the Xishanyao Formation in the Yihua coal mine with four different tectonic background sedimentary rocks (Table 9), it is evident that the coal samples exhibit extremely low REE contents. However, the ratios of La/Yb and ∑LREE/∑HREE in the coal samples are closer to those observed in oceanic island arc environments. On the other hand, the parameters of the overlying rock samples are more similar to those of a continental island arc environment.
In conclusion, the sedimentary source rocks of the Xishanyao Formation in the Yihua coal mine are primarily composed of continental tholeiites, with the material composition mainly derived from felsic volcanic rocks, which are predominantly from the upper crust. The tectonic background of the source region is primarily that of the continental island arc environment.

5.2. Sedimentary Environments

5.2.1. Paleoclimatic Characteristics

Under weathering conditions, the stability of the element Sr is relatively low, leading to a decrease in its content levels, particularly in warm and humid environments [42]. The Sr/Cu ratio can serve as an indicator of paleoclimate change. In the context of coal, the Sr/Cu ratio can be utilized to infer the paleoclimate characteristics present during the formation of coal deposits. By examining this ratio, researchers can gain insights into the environmental conditions which prevailed during the coal formation process [43]. A Sr/Cu ratio between 1.3 and 5 indicates a relatively humid climate, while Sr/Cu > 5 suggests a dry climate.
The range of Sr/Cu ratios in the coal seam sample from the Yihua coal mine is 2.27 to 276.5 (with an average of 93.59), indicating a dry climate (Figure 14a). The range of Sr/Cu ratios in the rock samples is 1.18 to 15.14 (with an average of 5.25). From the two diagrams in Figure 14 it can be noticed that both the coal and rock samples show an increasing trend in Sr/Cu ratios, from the lower to the upper part. This indicates that the climate during coal deposition was arid, and as coal thickness increased, the climate became more arid. During the overlying rock deposition, there was a transition from a relatively humid to a progressively arid climate. Therefore, the paleoclimate during the coal formation period of the Xishanyao Formation gradually changed from relatively humid to dry, followed by a sudden transition to a humid environment during sedimentation, and then a gradual return to a dry environment occurred as sedimentation continued.

5.2.2. Paleosalinity Characteristics

Paleosalinity is an important indicator of environmental changes during geological history. Boron (B) is an unstable element with fairly strong mobility and is commonly used to indicate paleosalinity. In freshwater environments, the B content is generally less than 60 × 10−6, while in saltwater, the B content ranges from 80 to 125 × 10−6. The average B content in the coal samples from the Yihua coal mine is 81.44 μg/g (ranging from 16.12 to 161.01 μg/g), indicating a brackish water environment. The average B content in the overlying rock samples is 49.44 μg/g (ranging from 20.12 to 73.28 μg/g), indicating a freshwater environment. The Sr content can also be used to determine the paleosalinity of sedimentary formations. In freshwater environments, the Sr content ranges from 100 to 300 × 10−6. The Sr content levels in the coal and rock samples from the Yihua coal mine are 205.35 μg/g (ranging from 60.1 to 453 μg/g) and 134.49 μg/g (ranging from 40.8 to 401 μg/g), respectively, indicating a freshwater environment for both the coal seams and rock strata. Gallium (Ga) has weak mobility and tends to precipitate; thus, the B/Ga ratio is often used to indicate the salinity of ancient water bodies. It has been found that B/Ga < 3 indicates a continental freshwater environment, while B/Ga > 6 indicates a marine saltwater environment [44]. The average B/Ga ratios for the coal and rock samples are 352.8 (ranging from 1.08 to 838.9) and 2.68 (ranging from 2.19 to 3.16), respectively.
In continental sedimentation processes, barium (Ba) tends to precipitate before strontium (Sr) as the degree of mineralization increases. Therefore, the Sr/Ba ratio can be utilized to assess the paleosalinity of water bodies. A Sr/Ba ratio of less than 0.6 typically indicates a continental freshwater environment, while a ratio greater than 1 suggests a marine saltwater environment. The Sr/Ba ratios for the coal and rock samples from the study area are significantly different, with the coal samples showing a high Sr/Ba ratio of 14.73 (ranging from 0.34 to 120.55). This suggests a marine saltwater environment during the deposition of the coal. In contrast, the rock samples exhibit a much lower Sr/Ba ratio of 0.40 (ranging from 0.14 to 1.55), indicative of a continental freshwater environment during their formation.
Due to the significant differences in the trace element contents of coal, the determination results may be inaccurate. Therefore, the paleosalinity characteristics are mainly determined based on the parameters of the overlying rock samples of the B1 coal seam in the Xishanyao Formation.
In the rock samples of the Xishanyao Formation in the Yihua coal mine, the majority of B/Ga ratios fall within the range of B/Ga < 3, as shown in Figure 15a. Additionally, the majority of Sr/Ba ratios in these rock samples fall within the range of Sr/Ba < 0.6, as depicted in Figure 15b.
By combining the discrimination parameters (Table 10) and diagrams of paleosalinity, the comprehensive analysis of the results indicates that the sedimentary water bodies in the Xishanyao Formation have low paleosalinity, suggesting an overall freshwater environment.

5.2.3. Redox Environments

Based on the content level of dissolved oxygen and the concentration of hydrogen sulfide in the water, the redox state can be classified into five categories: oxic, dysoxic, suboxic, anoxic, and euxinic [45,46]. Elements such as vanadium (V), chromium (Cr), nickel (Ni), cobalt (Co), and molybdenum (Mo) show varying degrees of enrichment under different redox conditions. By analyzing the concentrations or ratios of these elements in sedimentary rocks, researchers can gain insights into the redox environment that prevailed during the deposition of the sediments. These elements can serve as proxies for determining the redox conditions of the sedimentary environment in which the rocks were formed [28,47]. Studies have shown that Mo has a low abundance in the upper crust, with an average value of about 3.7 ppm, and it tends to enrich in relatively anoxic environments [48]. V and Cr can be reduced and preserved as insoluble substances under anoxic conditions, with V being more easily reduced than Cr [49]. Research findings have proposed that the V/Cr ratio can be used to determine the redox conditions of an environment. A V/Cr ratio of less than 2 typically indicates an oxic environment, while a V/Cr ratio ranging from 2 to 4.24 suggests a dysoxic environment. A V/Cr ratio exceeding 4.24 indicates a suboxic/anoxic environment. Similarly, the Ni/Co ratio is another indicator of redox conditions. A Ni/Co ratio of less than 5 is indicative of an oxic environment, while a ratio between 5 and 7 suggests a dysoxic environment. A Ni/Co ratio surpassing 7 points to a suboxic/anoxic environment. These ratios provide valuable insights into the oxygenation levels of the sedimentary environment during the deposition of rocks and can aid in reconstructing past redox conditions [50]. The δCe is a sensitive indicator of the redox conditions in sedimentary environments, with a δCe < 0.95 indicating negative anomalies and an oxidizing environment, and a δCe > 1 indicating positive anomalies and a reducing environment.
In the coal samples from the Xishanyao Formation in the Yihua coal mine, the majority of the V/Cr ratios fall below 2. Similarly, most of the overlying rock samples also exhibit V/Cr < 2, with four samples falling within the range of 2 to 4.24. This suggests that during the deposition of the coal seams, the peat swamps were in an oxidizing environment, while the sedimentary period of the rock strata experienced both oxidizing and dysoxic conditions. The majority of the coal samples have Ni/Co ratios below 5, whereas most rock samples have Ni/Co ratios above 7. This indicates that the coal deposition period was characterized by an oxidizing environment, while the sedimentary period of the rock strata was marked by suboxic/anoxic conditions. The δCe values for the coal samples from the Xishanyao Formation in the Yihua coal mine range from 0.45 to 1.05, with an average of 0.82. On the other hand, the δCe values for the rock samples range from 0.79 to 1.04, with an average of 0.95. The similar range and average values of δCe for both the coal and rock samples suggest that they were deposited in an oxidizing environment. This information further supports the notion that the sedimentary environment during the deposition of both coal and rock samples was characterized by oxidative conditions.
Based on the V/Cr-Ni/Co and Mo-Ni/Co diagrams [9], it can be observed that the majority of the sample points from the B1 coal seam in the Yihua coal mine fall within the oxidizing region, while the sample points from the overlying rock strata mainly fall within the suboxic/anoxic region (Figure 16a). Additionally, the coal samples generally exhibit lower Mo content compared to the overlying rock samples (Figure 16b). Based on these findings, it can be inferred that during the coal formation period, the water in the peat swamps had relatively high oxygen content, indicating an oxidizing state. As the coal and rock layers were deposited, the oxygen content in the water gradually decreased, but overall, the environment remained oxidizing.

5.2.4. Paleowater Temperature

Previous studies have established an empirical formula relating Sr element content to paleowater temperature: T = (2578 − Sr)/80.8, where T represents the paleowater temperature and Sr represents the Sr element content in the samples [51]. By calculating this formula, the paleowater temperatures of the coal samples range from 26.30 to 31.11 °C, with an average of 29.36 °C. The paleowater temperatures of the overlying rock samples range from 26.94 to 31.40 °C, with an average of 30.24 °C. This indicates that the sedimentary paleowater temperatures in the Xishanyao Formation are relatively high.
From the vertical distribution diagram of paleowater temperatures (Figure 17a), it can be seen that the paleowater temperature of the coal seams decreases from floor to roof as the coal seams are deposited. On the roof of the coal seams the temperature suddenly increases to 31 °C. The paleowater temperature of the overlying rock strata remains relatively stable, but in the upper part of the rock strata the paleowater temperature decreases to below 30 °C. Overall, the sedimentary paleowater temperatures in the Xishanyao Formation of the Yihua coal mine are relatively high.

6. Conclusions

In pursuit of unravelling the geochemical characteristics and paleoenvironment of the coal-bearing strata in the Xishanyao Formation of the Zhundong coalfield, samples were carefully selected from the Yihua coal mine in Xinjiang. An in-depth investigation was carried out to determine the geochemical characteristics and paleoenvironment of the Xishanyao Formation in the Zhundong coalfield using analytical techniques such as XRF and ICP-MS. The main conclusions are as follows:
(1)
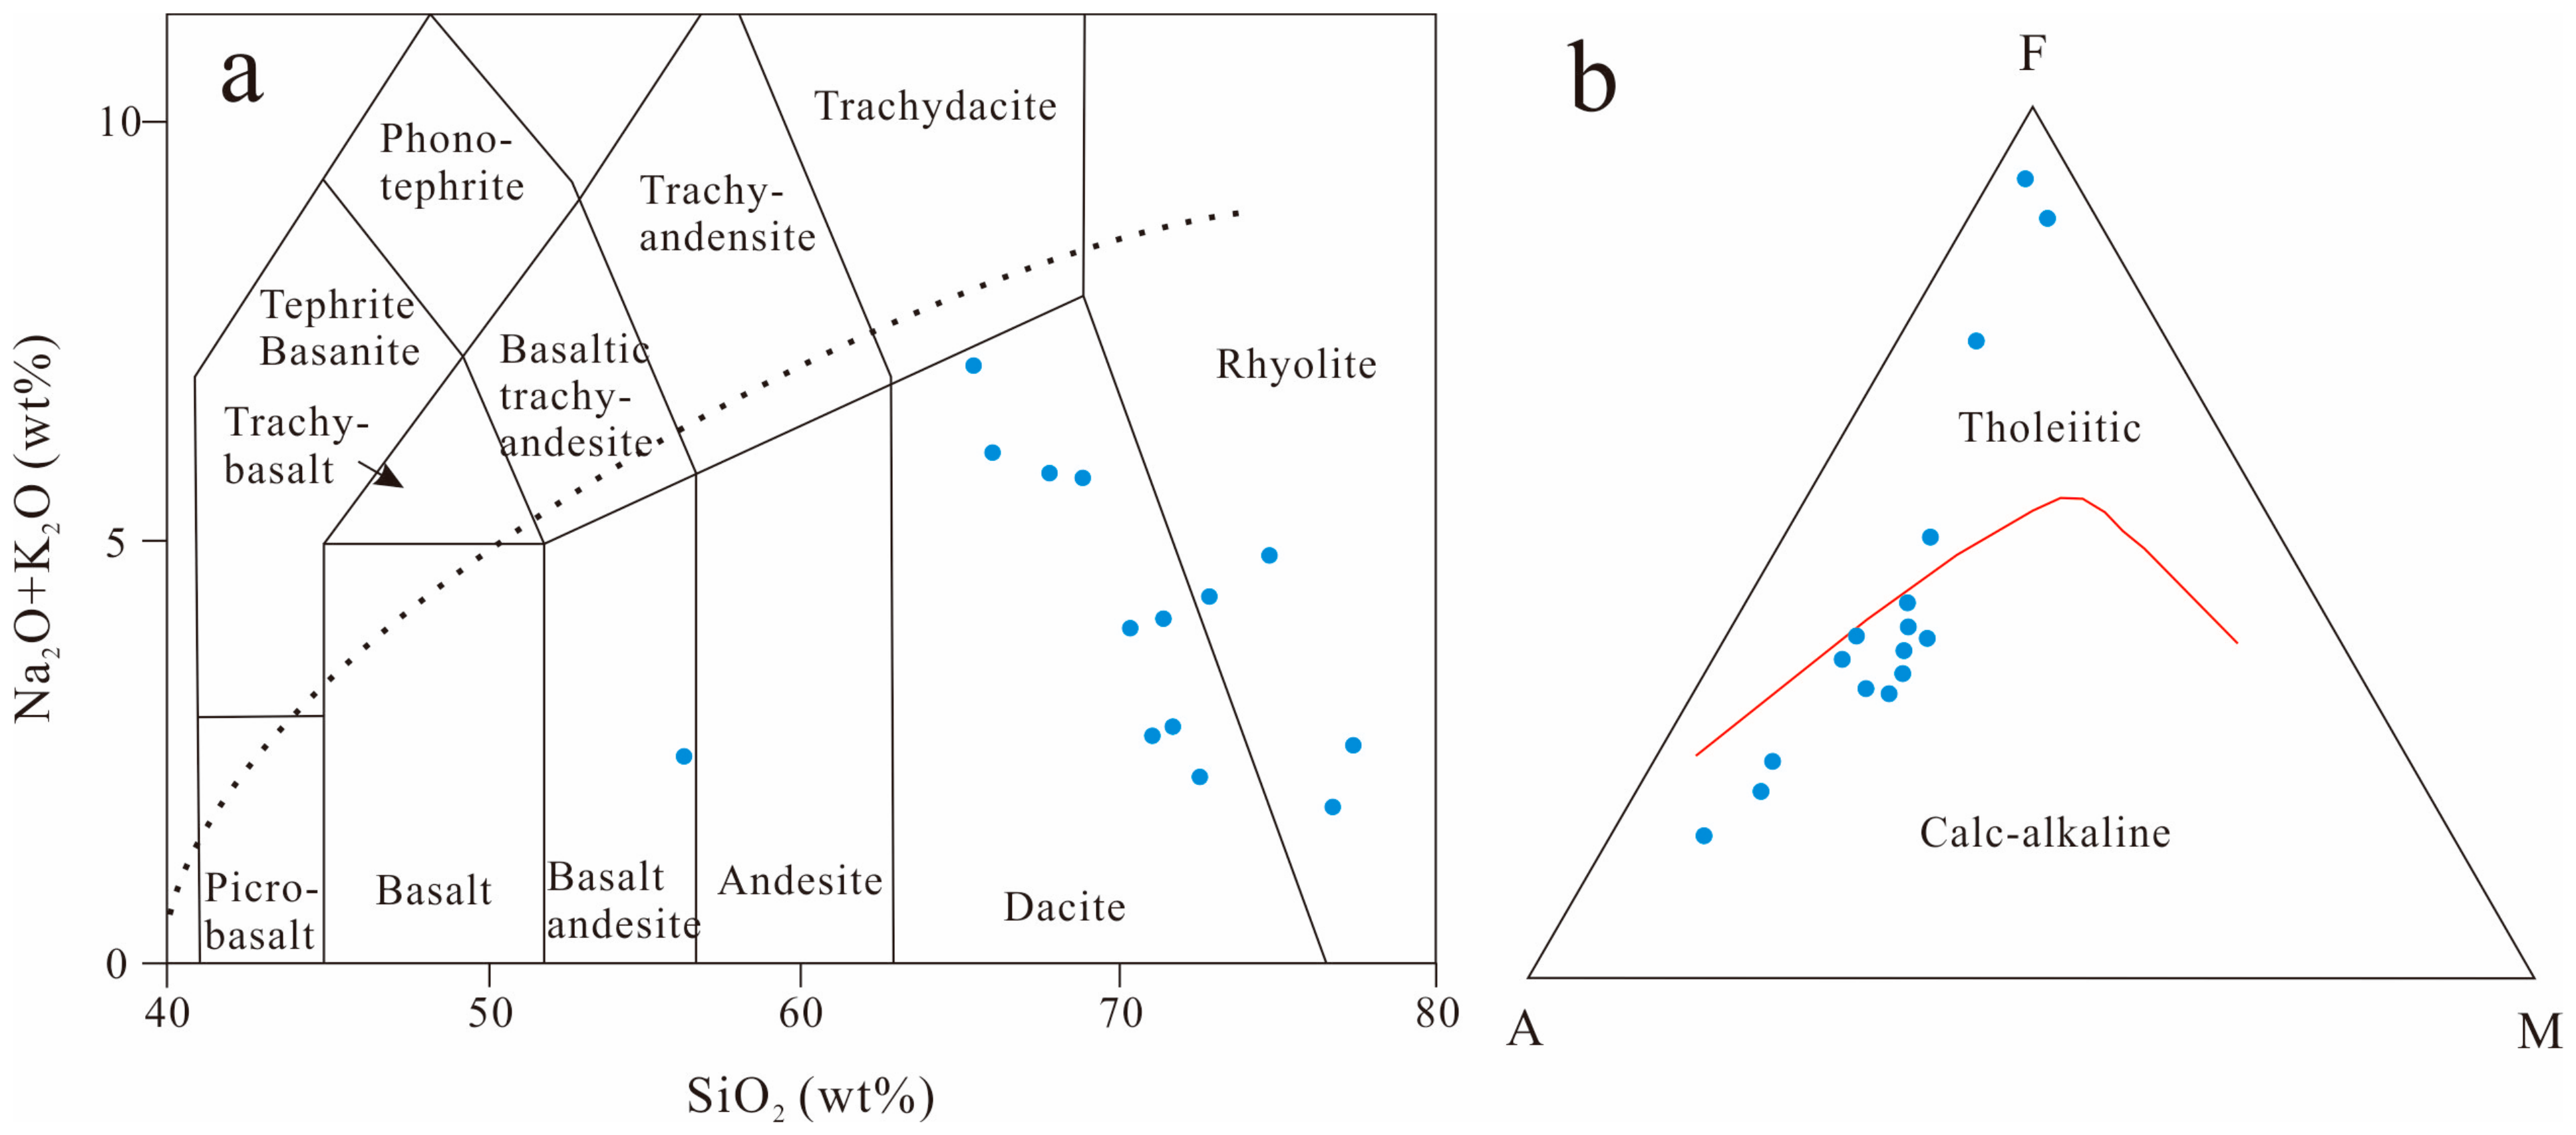
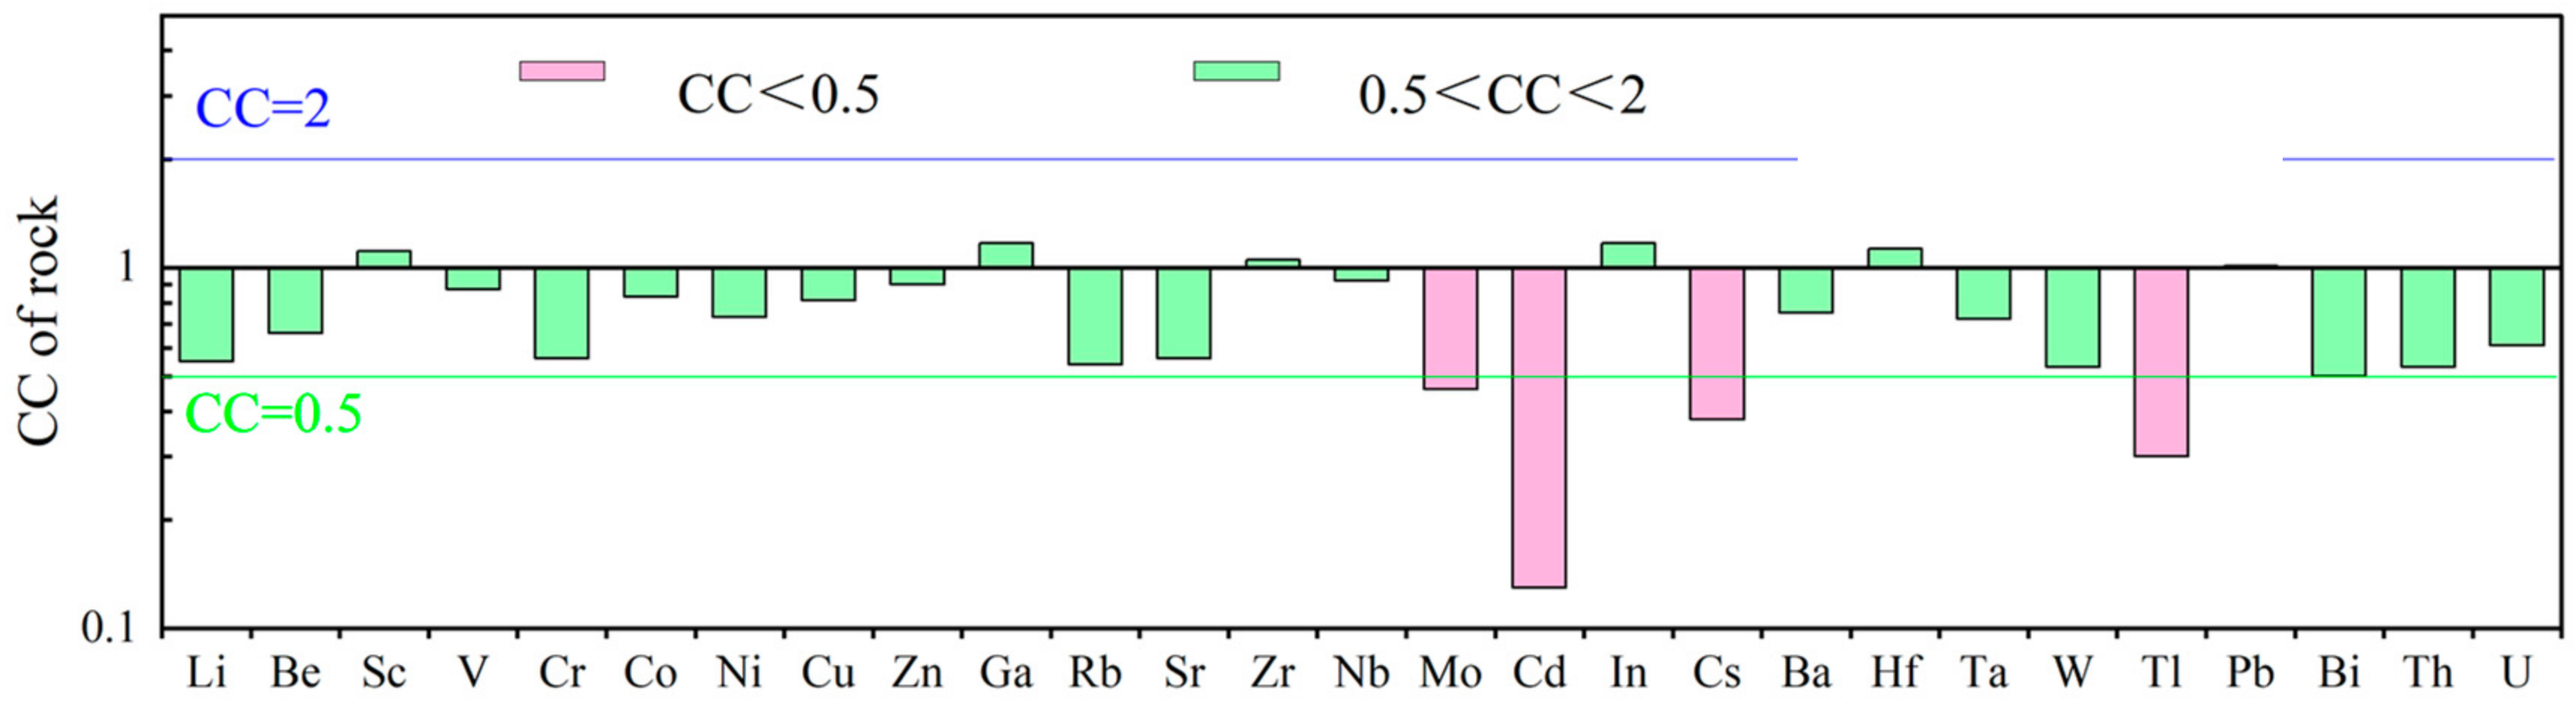
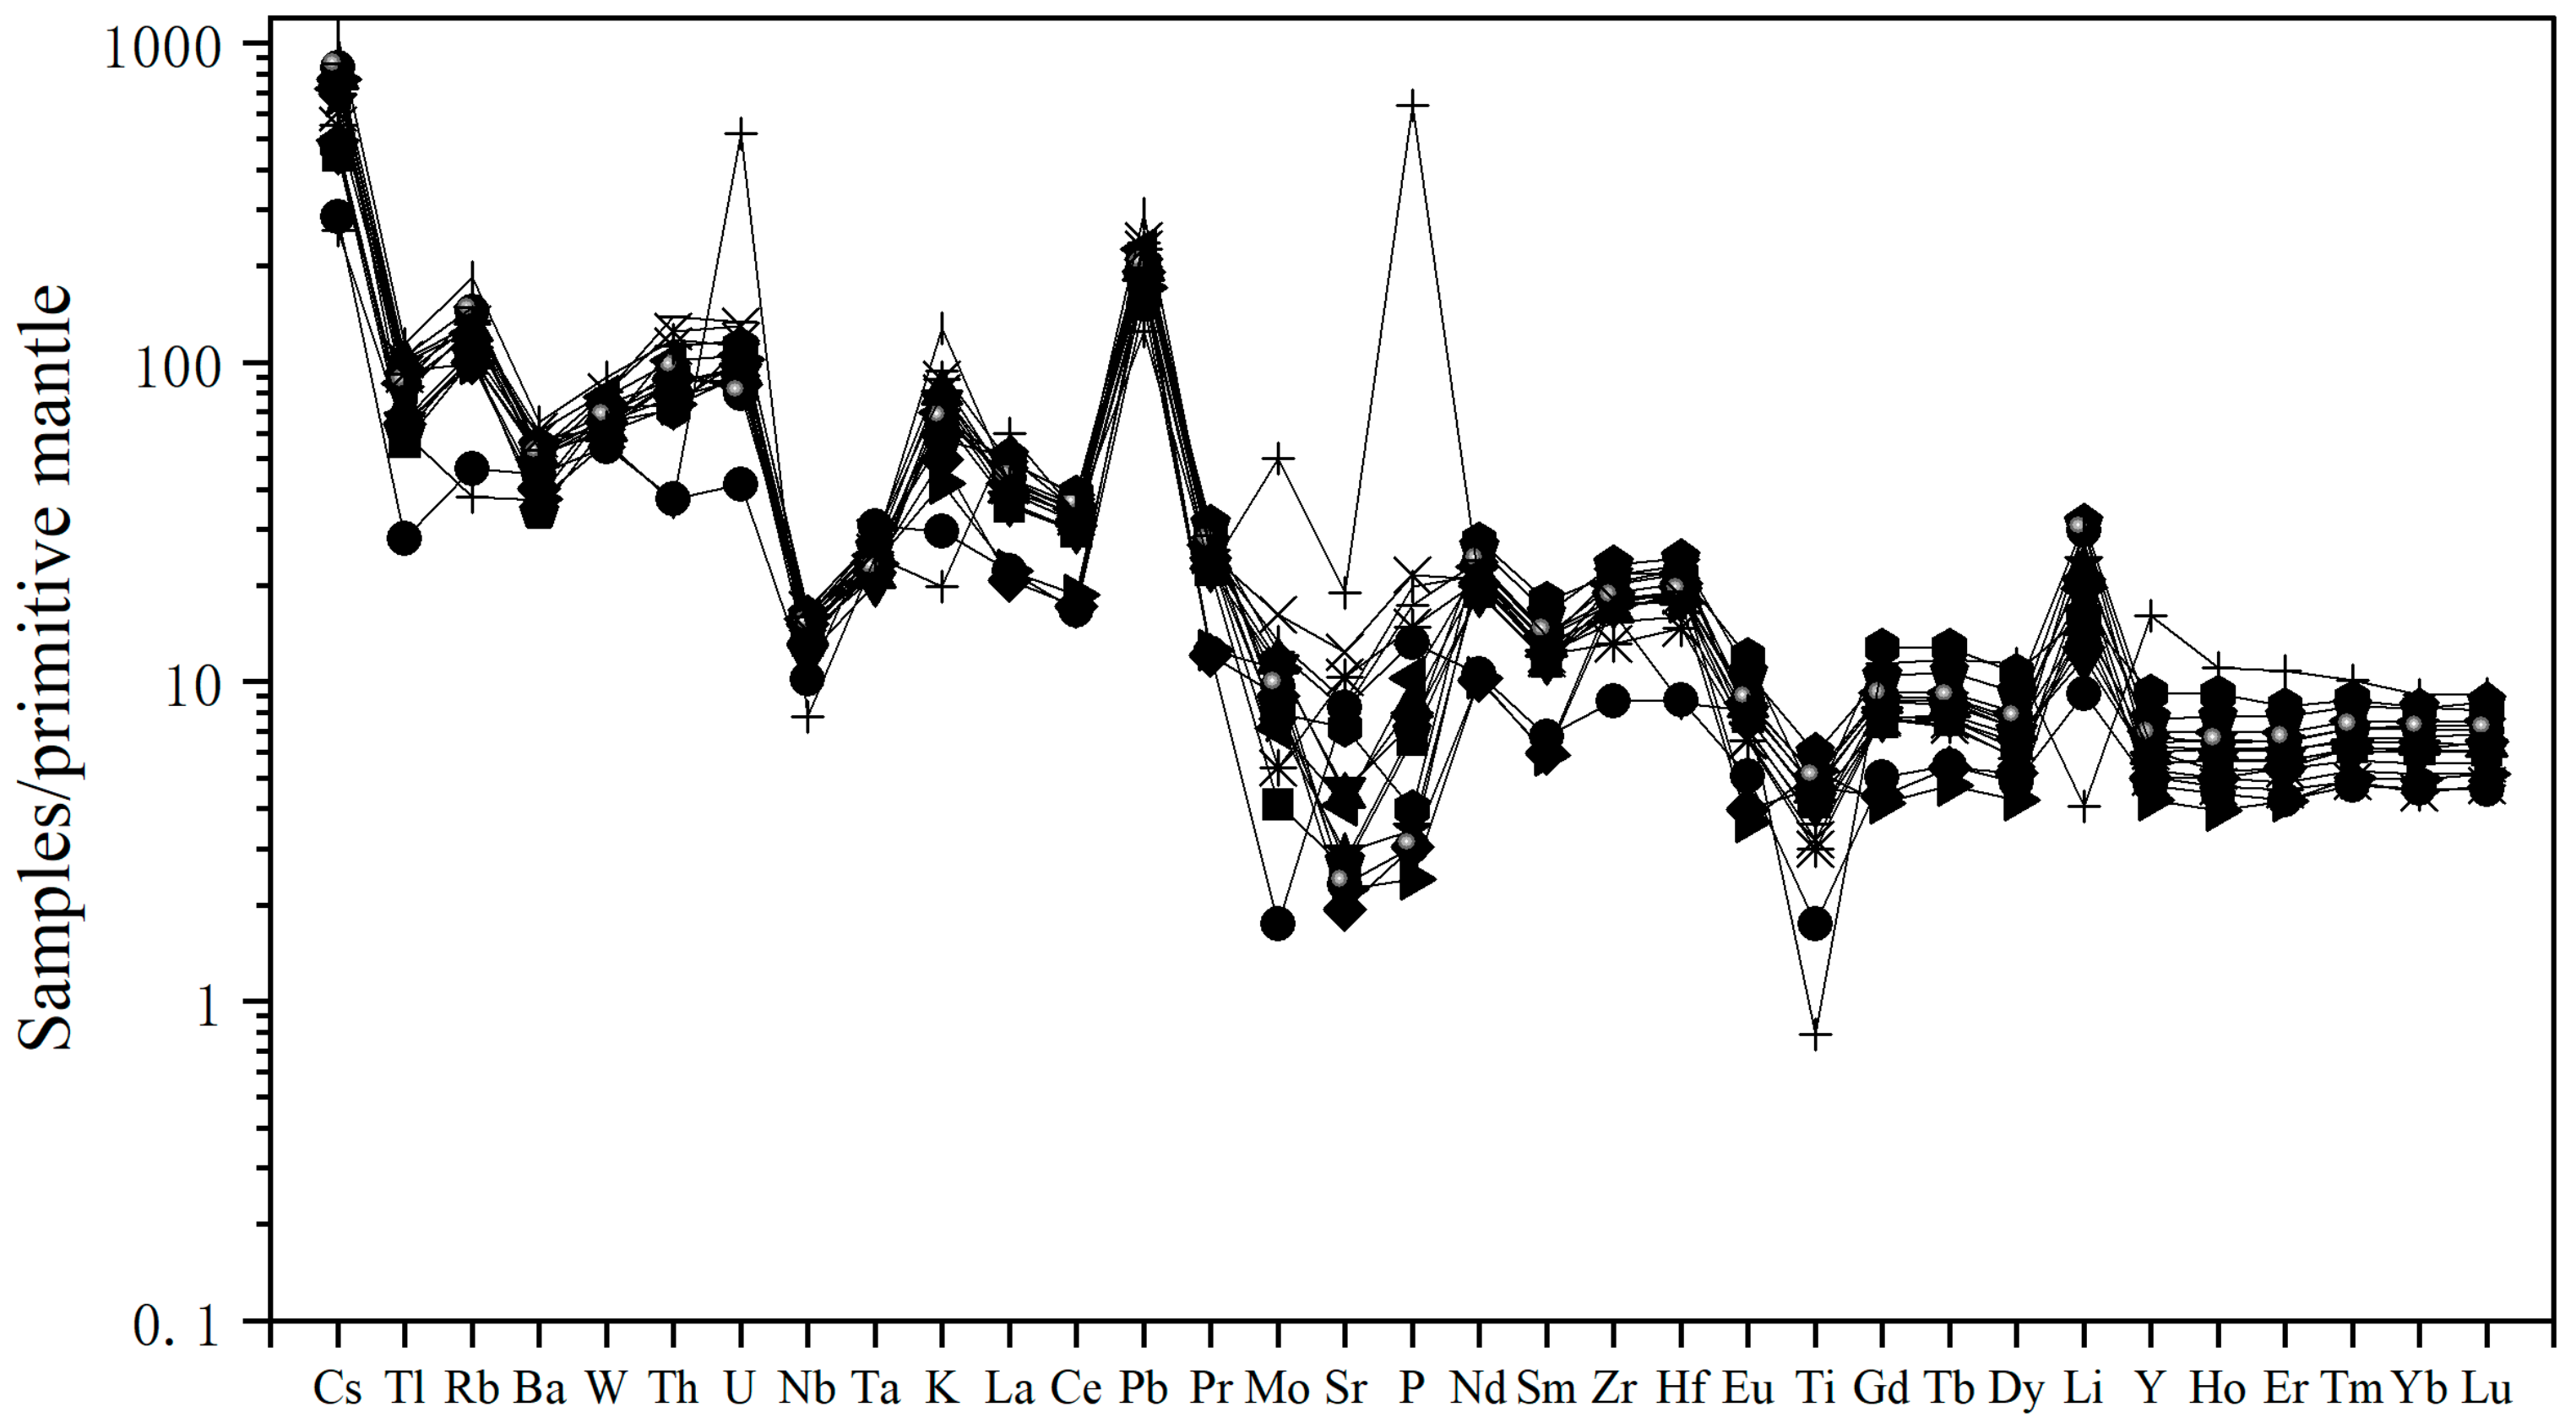
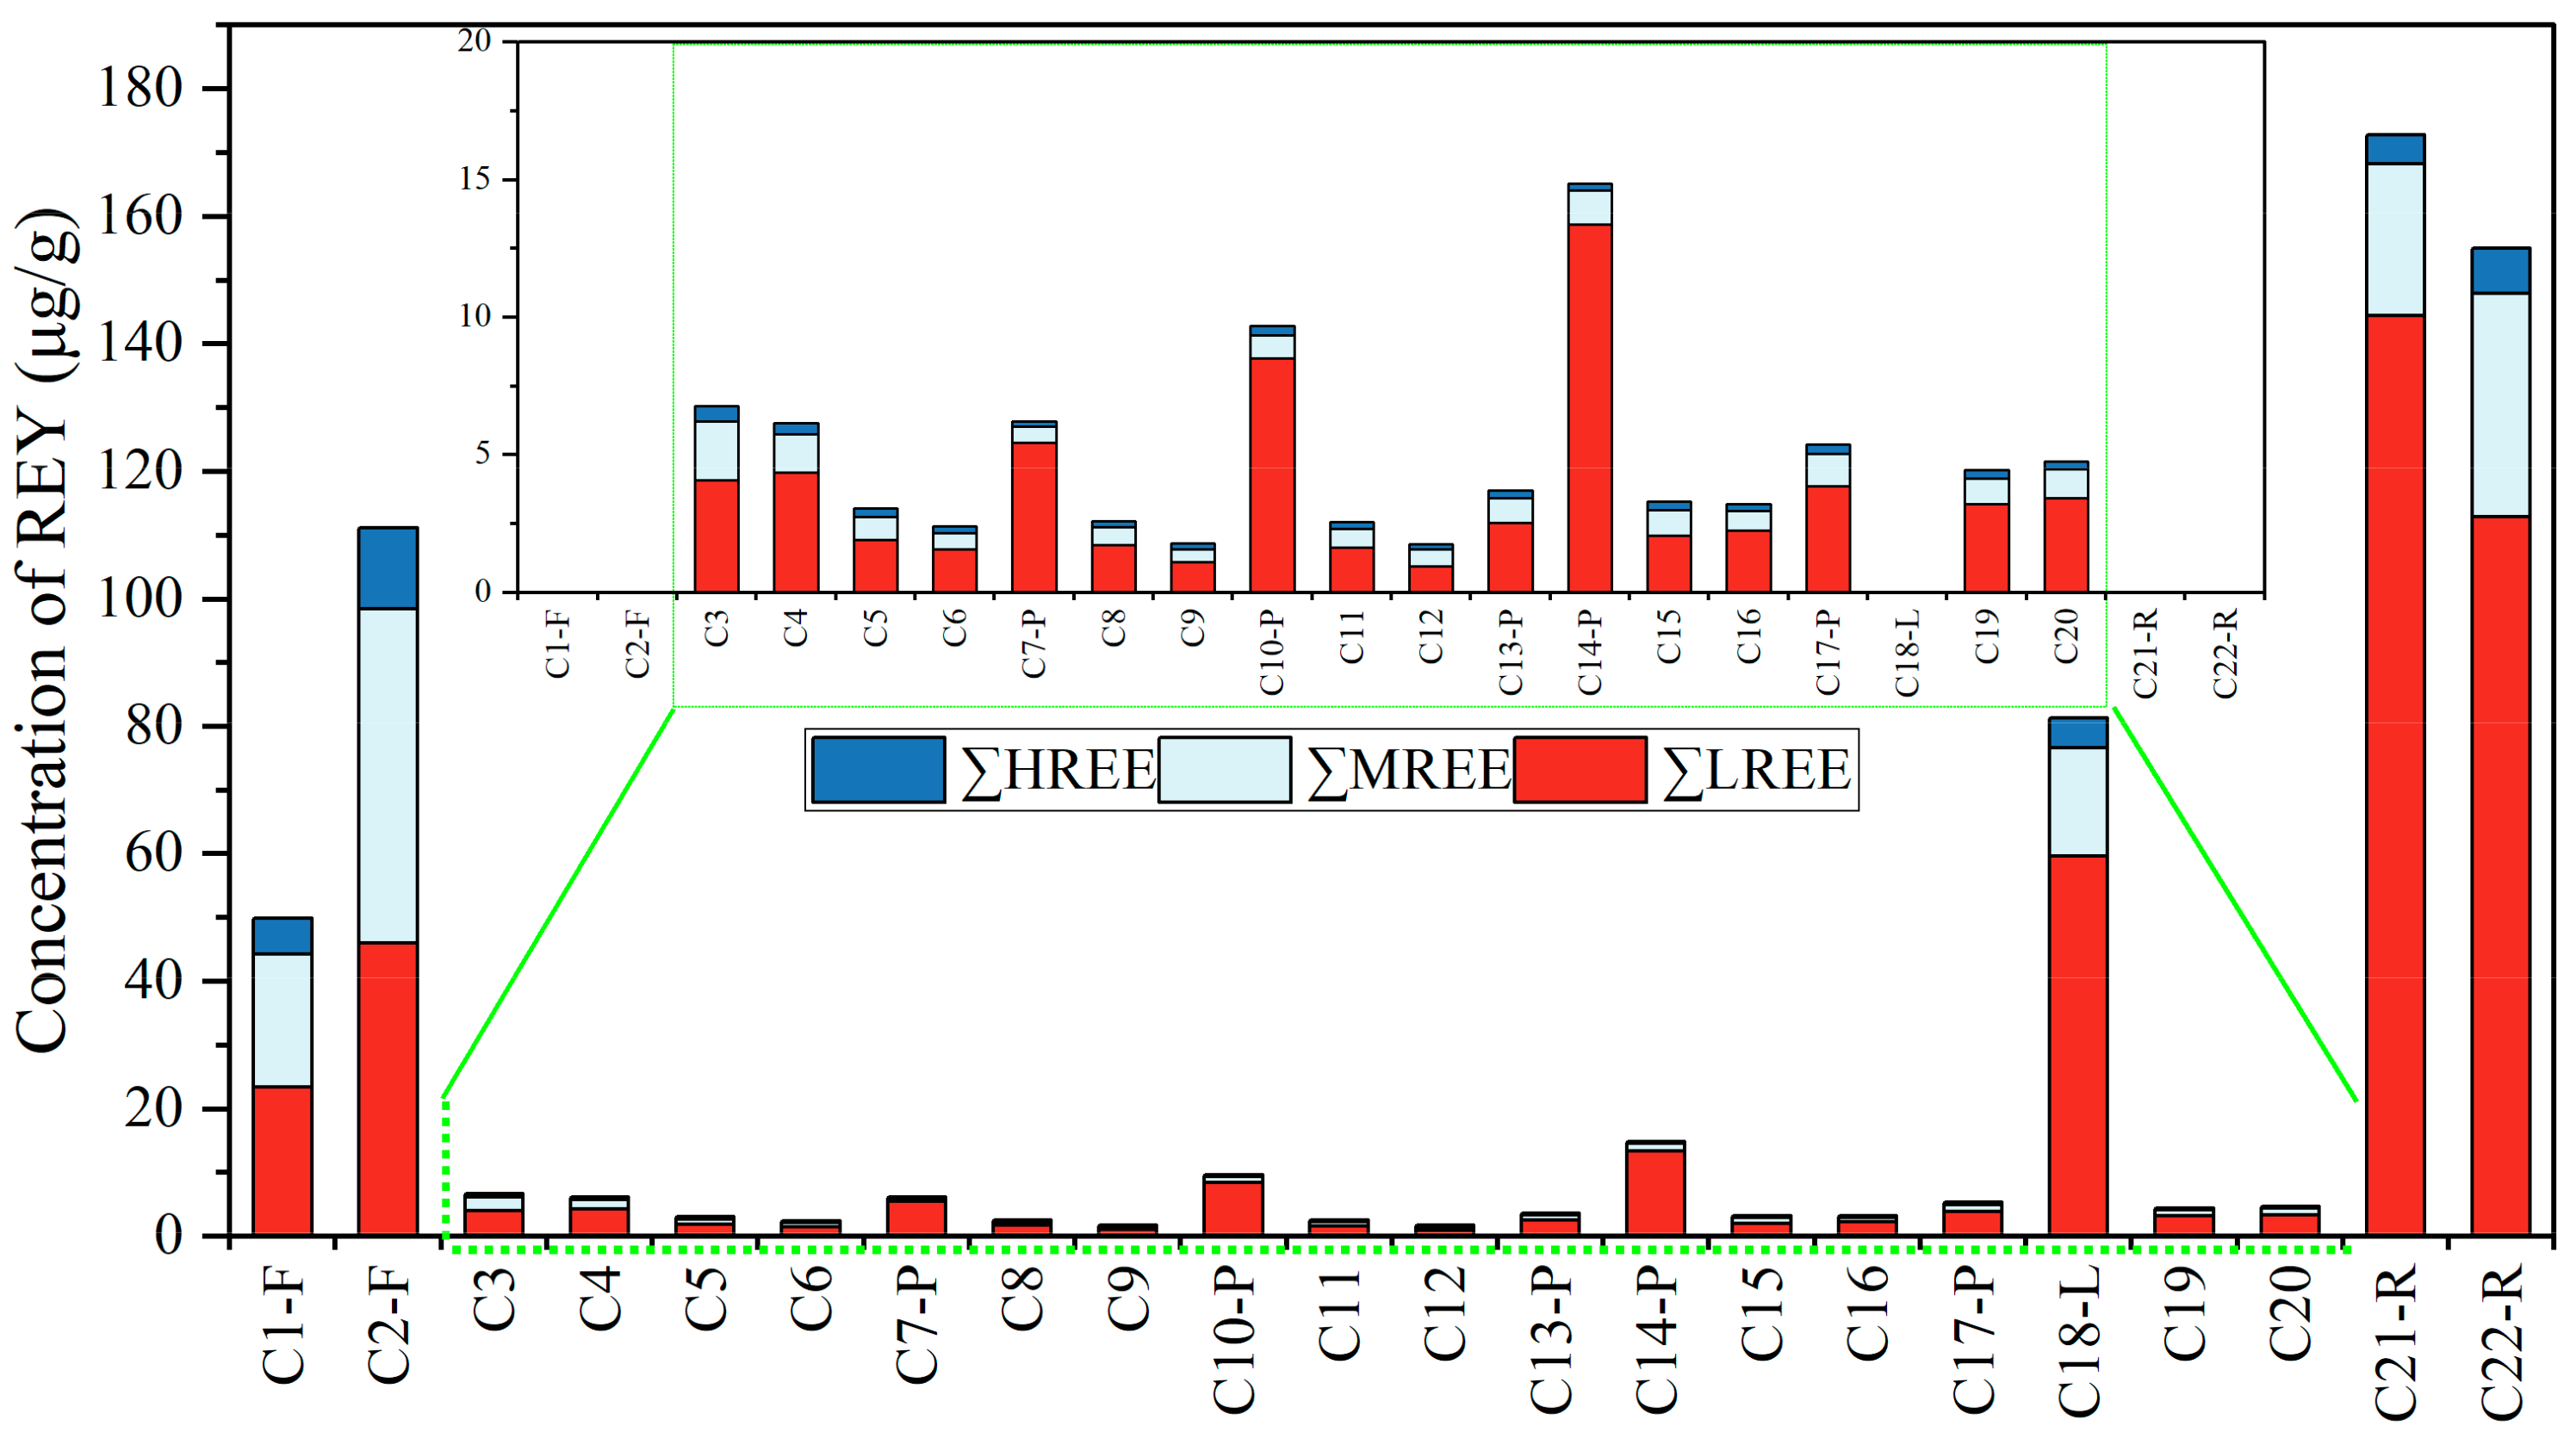
The coal samples from the Yihua coal mine exhibit relatively low concentrations of major, trace, and rare earth elements, predominantly displaying a depleted state. There is significant variation in the content levels of trace and rare earth elements, with the coal samples demonstrating an enrichment pattern of medium to heavy rare earth elements, while the floor, parting, and roof of the coal seam exhibit a light rare earth element enrichment pattern. In contrast, the overlying rock strata showcase mostly normal concentrations of major, trace, and rare earth elements. These rocks belong to the intermediate-acidic volcanic rock and calc-alkaline series. The trace element enrichment is dominated by large ion lithophile elements, while high field strength elements are depleted, suggesting a potential source from the upper crust. The REE enrichment pattern in these rock strata is characterized by LREE enrichment, with similar distribution curves indicating their origin as co-magma crystallization products.
(2)
Based on comprehensive interpretations using La/Yb-∑REE, Co-Th-Hf, La/Th-Hf, and Co/Th-La/Sc diagrams, it can be inferred that the source rocks of the Xishanyao Formation in the Yihua coal mine are mainly continental tholeiite. The material composition of the source region is mainly composed of felsic volcanic rocks, indicating a major contribution from the upper crust. Analysis of the La-Th-Sc and Th-Sc-Zr/10 diagrams indicates that the tectonic setting of the source region is mainly characterized by a continental island arc environment, with possible influences from oceanic island arcs and passive continental margins.
(3)
During the depositional period of the coal seam in the Yihua coal mine, the paleoclimate was relatively arid. As the thickness of the coal seam increased, the environment became even drier. However, with the deposition of the overlying rock strata, the sedimentary environment suddenly changed to a relatively humid state. As the thickness of the rock strata increased, the environment gradually transitioned from relatively humid to arid conditions. Throughout the depositional period of the Xishanyao Formation, the paleosalinity of the sedimentary water was low, indicating a primarily freshwater environment. The redox environment was generally oxidizing, with a gradual decrease in dissolved oxygen with increasing depositional thickness. In addition, the paleowater temperature was relatively high. In summary, the sedimentary environment of the Xishanyao Formation in the Yihua coal mine can be described as a freshwater-oxidizing environment, undergoing a transition from arid-hot to humid-hot to arid-hot conditions.

Author Contributions

Conceptualization, Y.W.; Data curation, W.W. (Wenfeng Wang); Formal analysis, Y.W.; Funding acquisition, W.W. (Wenfeng Wang); Investigation, W.W. (Wenlong Wang); Methodology, Y.W.; Project administration, W.W. (Wenfeng Wang); Resources, W.W. (Wenfeng Wang); Supervision, W.W. (Wenfeng Wang); Validation, W.W. (Wenfeng Wang) and P.D.; Visualization, Y.W. and P.D.; Writing—original draft, Y.W.; Writing—review and editing, W.W. (Wenfeng Wang). All authors have read and agreed to the published version of the manuscript.

Funding

This research was supported by the National Natural Science Foundation of China (no. U1903207 and no. 41972176), the Third Xinjiang Scientific Expedition Program (no. 2022xjkk1003), the Major Science and Technology Special Project of Xinjiang Uygur Autonomous Region (no. 2022A03014), the Major Science and Technology Special Project of Xinjiang Uygur Autonomous Region (no. 2022A01002), and the National Natural Science Foundation of China (no. 42072192).

Data Availability Statement

The original contributions presented in the study are included in the article material, and further inquiries can be directed to the corresponding author.

Acknowledgments

We extend our sincere gratitude to all the editors and reviewers who contributed to enhancing and facilitating the publication of this paper. Thank you for your valuable assistance and support.

Conflicts of Interest

The authors declare no conflicts of interest.

References

  1. Zhou, J.B.; Zhuang, X.G.; Alastuey, A.; Querol, X.; Li, J.H. Geochemistry and mineralogy of coal in the recently explored Zhundong large coal field in the Junggar basin, Xinjiang province, China. Int. J. Coal Geol. 2010, 82, 51–67. [Google Scholar] [CrossRef]
  2. Li, X.; Bai, Z.Q.; Bai, J.; Han, Y.N.; Kong, L.X.; Li, W. Insight into the Effects of Sodium Species with Different Occurrence Modes on the Structural Features of Residues Derived from Direct Liquefaction of Zhundong Coal by Multiple Techniques. Energy Fuels 2015, 29, 7142–7149. [Google Scholar] [CrossRef]
  3. Gan, H.J.; Wang, H.; Chen, J.; Zhuang, X.G.; Cao, H.Y.; Jiang, S. Geochemical characteristics of Jurassic coal and its paleoenvironmental implication in the eastern Junggar Basin, China. J. Geochem. Explor. 2018, 188, 73–86. [Google Scholar] [CrossRef]
  4. Li, J.; Zhuang, X.G.; Querol, X.; Font, O.; Moreno, N.; Zhou, J.B.; Lei, G.M. High quality of Jurassic Coals in the Southern and Eastern Junggar Coalfields, Xinjiang, NW China: Geochemical and mineralogical characteristics. Int. J. Coal Geol. 2012, 99, 1–15. [Google Scholar] [CrossRef]
  5. Li, J.; Zhuang, X.G.; Querol, X.; Font, O.; Moreno, N.; Zhou, J.B. Environmental geochemistry of the feed coals and their combustion by-products from two coal-fired power plants in Xinjiang Province, Northwest China. Fuel 2012, 95, 446–456. [Google Scholar] [CrossRef]
  6. Xu, C.; Shan, X.; He, W.; Zhang, K.; Rexiti, Y.; Su, S.; Liang, C.; Zou, X. The influence of paleoclimate and a marine transgression event on organic matter accumulation in lacustrine black shales from the Late Cretaceous, southern Songliao Basin, Northeast China. Int. J. Coal Geol. 2021, 246, 103842. [Google Scholar] [CrossRef]
  7. Li, D.; Li, R.; Zhu, Z.; Wu, X.; Cheng, J.; Liu, F.; Zhao, B. Origin of organic matter and paleo-sedimentary environment reconstruction of the Triassic oil shale in Tongchuan City, southern Ordos Basin (China). Fuel 2017, 208, 223–235. [Google Scholar] [CrossRef]
  8. Zhang, X.; Lin, C.; Zahid, M.A.; Jia, X.; Zhang, T. Paleosalinity and water body type of Eocene Pinghu Formation, Xihu Depression, East China Sea Basin. J. Pet. Sci. Eng. 2017, 158, 469–478. [Google Scholar] [CrossRef]
  9. Rimmer, S.M. Geochemical paleoredox indicators in Devonian-Mississippian black shales, central Appalachian basin (USA). Chem. Geol. 2004, 206, 373–391. [Google Scholar] [CrossRef]
  10. Yan, D.; Li, S.; Fu, H.; Jasper, D.M.; Zhou, S.; Yang, X.; Zhang, B.; Mangi, H.N. Mineralogy and geochemistry of Lower Silurian black shales from the Yangtze platform, South China. Int. J. Coal Geol. 2021, 237, 103706. [Google Scholar] [CrossRef]
  11. Sindhuja, C.S.; Manikyamba, C.; Saha, S.; Narayanan, S.; Sridhar, B. Geochemical and carbon isotopic studies of carbonaceous phyllites from Dharwar craton, India-Reconstruction of Precambrian depositional environment. Precambrian Res. 2022, 372, 106575. [Google Scholar] [CrossRef]
  12. Xie, Q.F.; Cai, Y.F.; Dong, Y.P.; Zhai, M.G.; Li, D.P. Geochemical characteristics of the Permian marine mudstone and constraints on its provenance and paleoenvironment in the Fenghai area, Fujian Province, southeastern China. Pet. Sci. 2019, 16, 527–540. [Google Scholar] [CrossRef]
  13. Kraus, M.J. Paleosols in clastic sedimentary rocks: Their geologic applications. Earth-Sci. Rev. 1999, 49, 41–70. [Google Scholar] [CrossRef]
  14. Dai, S.; Finkelman, R.B.; French, D.; Hower, J.C.; Graham, I.T.; Zhao, F. Modes of occurrence of elements in coal: A critical evaluation. Earth-Sci. Rev. 2021, 222, 103815. [Google Scholar] [CrossRef]
  15. Dai, S.F.; Ren, D.Y.; Chou, C.L.; Finkelman, R.B.; Seredin, V.V.; Zhou, Y.P. Geochemistry of trace elements in Chinese coals: A review of abundances, genetic types, impacts on human health, and industrial utilization. Int. J. Coal Geol. 2012, 94, 3–21. [Google Scholar] [CrossRef]
  16. Duan, P.; Wang, W.; Liu, X.; Qian, F.; Sang, S.; Xu, S. Distribution of As, Hg and other trace elements in different size and density fractions of the Reshuihe high-sulfur coal, Yunnan Province, China. Int. J. Coal Geol. 2017, 173, 129–141. [Google Scholar] [CrossRef]
  17. Dai, S.; Wang, X.; Seredin, V.V.; Hower, J.C.; Ward, C.R.; O’Keefe, J.M.K.; Huang, W.; Li, T.; Li, X.; Liu, H.; et al. Petrology, mineralogy, and geochemistry of the Ge-rich coal from the Wulantuga Ge ore deposit, Inner Mongolia, China: New data and genetic implications. Int. J. Coal Geol. 2012, 90, 72–99. [Google Scholar] [CrossRef]
  18. Dai, S.; Liu, J.; Ward, C.R.; Hower, J.C.; Xie, P.; Jiang, Y.; Hood, M.M.; O’Keefe, J.M.K.; Song, H. Petrological, geochemical, and mineralogical compositions of the low-Ge coals from the Shengli Coalfield, China: A comparative study with Ge-rich coals and a formation model for coal-hosted Ge ore deposit. Ore Geol. Rev. 2015, 71, 318–349. [Google Scholar] [CrossRef]
  19. Dai, S.; Li, D.; Chou, C.L.; Zhao, L.; Zhang, Y.; Ren, D.; Ma, Y.; Sun, Y. Mineralogy and geochemistry of boehmite-rich coals: New insights from the Haerwusu Surface Mine, Jungar Coalfield, Inner Mongolia, China. Int. J. Coal Geol. 2008, 74, 185–202. [Google Scholar] [CrossRef]
  20. Dai, S.; Jiang, Y.; Ward, C.R.; Gu, L.; Seredin, V.V.; Liu, H.; Zhou, D.; Wang, X.; Sun, Y.; Zou, J.; et al. Mineralogical and geochemical compositions of the coal in the Guanbanwusu Mine, Inner Mongolia, China: Further evidence for the existence of an Al (Ga and REE) ore deposit in the Jungar Coalfield. Int. J. Coal Geol. 2012, 98, 10–40. [Google Scholar] [CrossRef]
  21. Dai, S.; Xie, P.; Jia, S.; Ward, C.R.; Hower, J.C.; Yan, X.; French, D. Enrichment of U-Re-V-Cr-Se and rare earth elements in the Late Permian coals of the Moxinpo Coalfield, Chongqing, China: Genetic implications from geochemical and mineralogical data. Ore Geol. Rev. 2017, 80, 1–17. [Google Scholar] [CrossRef]
  22. Seredin, V.V.; Dai, S. Coal deposits as potential alternative sources for lanthanides and yttrium. Int. J. Coal Geol. 2012, 94, 67–93. [Google Scholar] [CrossRef]
  23. Ketris, M.P.; Yudovich, Y.E. Estimations of Clarkes for Carbonaceous biolithes: World averages for trace element contents in black shales and coals. Int. J. Coal Geol. 2009, 78, 135–148. [Google Scholar] [CrossRef]
  24. Dai, S.; Hower, J.C.; Finkelman, R.B.; Graham, I.T.; French, D.; Ward, C.R.; Eskenazy, G.; Wei, Q.; Zhao, L. Organic associations of non-mineral elements in coal: A review. Int. J. Coal Geol. 2020, 218, 103347. [Google Scholar] [CrossRef]
  25. Jia, R.; Liu, J.; Han, Q.; Zhao, S.; Shang, N.; Tang, P.; Zhang, Y. Mineral matter transition in lignite during ashing process: A case study of Early Cretaceous lignite from the Hailar Basin, Inner Mongolia, China. Fuel 2022, 328, 125252. [Google Scholar] [CrossRef]
  26. Dai, S.; Zhang, W.; Seredin, V.V.; Ward, C.R.; Hower, J.C.; Song, W.; Wang, X.; Li, X.; Zhao, L.; Kang, H.; et al. Factors controlling geochemical and mineralogical compositions of coals preserved within marine carbonate successions: A case study from the Heshan Coalfield, southern China. Int. J. Coal Geol. 2013, 109, 77–100. [Google Scholar] [CrossRef]
  27. Dai, S.; Guo, W.; Nechaev, V.P.; French, D.; Ward, C.R.; Spiro, B.F.; Finkelman, R.B. Modes of occurrence and origin of mineral matter in the Palaeogene coal (No. 19-2) from the Hunchun Coalfield, Jilin Province, China. Int. J. Coal Geol. 2018, 189, 94–110. [Google Scholar] [CrossRef]
  28. Dai, S.; Bechtel, A.; Eble, C.F.; Flores, R.M.; French, D.; Graham, I.T.; Hood, M.M.; Hower, J.C.; Korasidis, V.A.; Moore, T.A.; et al. Recognition of peat depositional environments in coal: A review. Int. J. Coal Geol. 2020, 219, 103383. [Google Scholar] [CrossRef]
  29. Chou, C.L. Sulfur in coals: A review of geochemistry and origins. Int. J. Coal Geol. 2012, 100, 1–13. [Google Scholar] [CrossRef]
  30. Dai, S.; Graham, I.T.; Ward, C.R. A review of anomalous rare earth elements and yttrium in coal. Int. J. Coal Geol. 2016, 159, 82–95. [Google Scholar] [CrossRef]
  31. Dai, S.; Yan, X.; Ward, C.R.; Hower, J.C.; Zhao, L.; Wang, X.; Zhao, L.; Ren, D.; Finkelman, R.B. Valuable elements in Chinese coals: A review. Int. Geol. Rev. 2018, 60, 590–620. [Google Scholar] [CrossRef]
  32. Dai, S.; Finkelman, R.B. Coal as a promising source of critical elements: Progress and future prospects. Int. J. Coal Geol. 2018, 186, 155–164. [Google Scholar] [CrossRef]
  33. GB/T 482-2008; Sampling of Coal Seams. China Coal Industry Association: Beijing, China, 2008.
  34. GB/T14506.28-2010; Methods for Chemical Analysis of Silicate Rocks—Part 28: Determination of 16 Major and Minor Elements Content. Ministry of Natural Resources: Beijing, China, 2010.
  35. GB/T 14506.30-2010; Methods for Chemical Analysis of Silicate Rocks—Part 30: Determination of 44 Elements. Ministry of Natural Resources: Beijing, China, 2010.
  36. Ward, C.R. Analysis and significance of mineral matter in coal seams. Int. J. Coal Geol. 2002, 50, 135–168. [Google Scholar] [CrossRef]
  37. Wang, Y.; Wang, W.; Wang, W.; Duan, P.; He, X.; Lu, Q. Distribution, Occurrence and Enrichment Causes of Sodium in Middle Jurassic Coal from Zhundong Coalfield, Xinjiang. Minerals 2024, 14, 1–24. [Google Scholar] [CrossRef]
  38. Wilson, M.A. Chemical Classification of Volcanic Rocks Based on the Total Alkali-Silica Diagram. J. Petrol. 1986, 27, 745–750. [Google Scholar] [CrossRef]
  39. Wright, J.B. A simple alkalinity ratio and its application to questions of non-orogenic granite genesis. Geol. Mag. 1969, 106, 370–384. [Google Scholar] [CrossRef]
  40. Dai, S.; Seredin, V.V.; Ward, C.R.; Hower, J.C.; Xing, Y.; Zhang, W.; Song, W.; Wang, P. Enrichment of U-Se-Mo-Re-V in coals preserved within marine carbonate successions: Geochemical and mineralogical data from the Late Permian Guiding Coalfield, Guizhou, China. Miner. Depos. 2015, 50, 159–186. [Google Scholar] [CrossRef]
  41. Bhatia, M.R.; Crook, K.A.W. Trace element characteristics of graywackes and tectonic setting discrimination of sedimentary basins. Contrib Miner. Pet. 1986, 92, 181–193. [Google Scholar] [CrossRef]
  42. Chen, J.; Wang, Y.J.; Chen, Y.; Liu, L.W.; Ji, J.F.; Lu, H.Y. Rb and Sr geochemical characterization of the Chinese Loess stratigraphy and its implications for palaeomonsoon climate. Acta Geol. Sin. Engl. Ed. 2000, 74, 279–288. [Google Scholar] [CrossRef]
  43. Wang, L.; Lv, D.; Hower, J.C.; Zhang, Z.; Raji, M.; Tang, J.; Liu, Y.; Gao, J. Geochemical characteristics and paleoclimate implication of Middle Jurassic coal in the Ordos Basin, China. Ore Geol. Rev. 2022, 144, 104848. [Google Scholar] [CrossRef]
  44. Wei, W.; Algeo, T.J. Elemental proxies for paleosalinity analysis of ancient shales and mudrocks. Geochim. Et Cosmochim. Acta 2020, 287, 341–366. [Google Scholar] [CrossRef]
  45. Tribovillard, N.; Algeo, T.J.; Lyons, T.; Riboulleau, A. Trace metals as paleoredox and paleoproductivity proxies: An update. Chem. Geol. 2006, 232, 12–32. [Google Scholar] [CrossRef]
  46. Algeo, T.J.; Li, C. Redox classification and calibration of redox thresholds in sedimentary systems. Geochim. Et Cosmochim. Acta 2020, 287, 8–26. [Google Scholar] [CrossRef]
  47. Algeo, T.J. Can marine anoxic events draw down the trace element inventory of seawater? Geology 2004, 32, 1057–1060. [Google Scholar] [CrossRef]
  48. Algeo, T.J.; Tribovillard, N. Environmental analysis of paleoceanographic systems based on molybdenum-uranium covariation. Chem. Geol. 2009, 268, 211–225. [Google Scholar] [CrossRef]
  49. Scheffler, K.; Buehmann, D.; Schwark, L. Analysis of Late Palaeozoic glacial to postglacial sedimentary successions in South Africa by geochemical proxies—Response to climate evolution and sedimentary environment. Palaeogeogr. Palaeoclimatol. Palaeoecol. 2006, 240, 184–203. [Google Scholar] [CrossRef]
  50. Jones, B.; Manning, D.A.C. Comparison of geochemical indices used for the interpretation of palaeoredox conditions in ancient mudstones. Chem. Geol. 1994, 111, 111–129. [Google Scholar] [CrossRef]
  51. Xu, B.; Diao, H.; Wang, N.; He, J.; Shi, J.; Hu, B.; Zhou, X. Geochemical characteristics and indicative significance of trace elements in the Paleocene in Lishui Sag, East China Sea Basin. Mar. Geol. Front. 2022, 38, 64–74. (In Chinese) [Google Scholar] [CrossRef]
Figure 1. Location of the Yihua coal mine in Zhundong coalfield and its sedimentary stratigraphic column and sampling profile. (a) Junggar basin in XinJiang (b) location of Yihua coal mine (c) stratigraphic profile of Yihua coal mine.
Minerals 14 00461 g001
Figure 2. Concentration coefficients of major elements in Yihua coal.
Minerals 14 00461 g002
Figure 3. Vertical distribution of major-element oxide contents in the overlying rock layers of the B1 coal seam (adapted from Wang et al. [37]).
Minerals 14 00461 g003
Figure 4. (a) TAS classification diagram and (b) AFM diagram (A: K2O + Na2O; F: TFeO; M: MgO).
Minerals 14 00461 g004
Figure 5. Concentration coefficients of coal (a), floor (b), parting (c), and roof (d).
Minerals 14 00461 g005
Figure 6. Concentration coefficient of overlying rock strata.
Minerals 14 00461 g006
Figure 7. Spider diagram of trace elements in overlying rock strata.
Minerals 14 00461 g007
Figure 8. Rare earth element content levels and distribution of coal seam samples from the Yihua coal mine.
Minerals 14 00461 g008
Figure 9. REE partitioning pattern in coal seam samples from the Yihua coal mine. (a) the lower coal seam samples; (b) the upper coal seam samples; (c) roof, floor and through-fracture samples (d) parting samples.
Minerals 14 00461 g009
Figure 10. REE partitioning pattern of overlying rock samples.
Minerals 14 00461 g010
Figure 11. Discrimination diagrams for sediment source and tectonic environment: ((a), F3–F4 source area discrimination diagram; (b), F1–F2 tectonic environment discrimination diagram; F1 = −0.0447SiO2 − 0.927TiO2 + 0.008Al2O3 − 0.267Fe2O3 + 0.208FeO − 3.082MnO + 0.140MgO + 0.195CaO + 0.719Na2O − 0.032K2O + 0.510P2O5 + 0.303; F2 = −0.421SiO2 + 1.988TiO2 − 0.526Al2O3 − 0.551Fe2O3 − 1.61FeO + 2.720MnO + 0.88MgO − 0.907Cao − 0.177Na2O − 1.840K2O + 7.244P2O5 + 43.57; F3 = −1.773TiO2 + 0.607Al2O3 + 0.76Fe2O3T − 1.5MgO + 0.616CaO + 0.509Na2O − 1.224K2O − 9.09; F4 = 0.445TiO2 + 0.07Al2O3 − 0.25Fe2O3T − 1.142MgO + 0.438CaO + 0.475Na2O + 1.426K2O − 6.861. ACM: active continental margin; PM: passive continental margin; CIA: continental island arc; OIA: oceanic island arc. Figure based on Bhatia, 1986 [41]).
Minerals 14 00461 g011
Figure 12. La/Yb-∑REE (a), Co-Th-Hf (b), La/Th-Hf (c), and Co/Th-La/Sc (d) diagrams of Yihua coal mine samples.
Minerals 14 00461 g012
Figure 13. La-Th-Sc (a) and Th-Sc-Zr/10 (b) diagrams for Middle Jurassic samples from the Yihua coal mine (ACM: active continental margin; PM: passive continental margin; CIA: continental island arc; OIA: oceanic island arc).
Minerals 14 00461 g013
Figure 14. Sr/Cu paleoclimatic discrimination ((a): Sr/Cu of coal seam samples; (b): Sr/Cu of rock seam samples).
Minerals 14 00461 g014
Figure 15. Paleosalinity discrimination diagram. (a) B and Ga ratios of the overlying rock strata; (b) Sr and Ba ratios of the overlying rock strata.
Minerals 14 00461 g015
Figure 16. Redox environment discrimination diagrams ((a), V/Cr-Ni/Co diagram; (b), Mo-Ni/Co diagram; base diagram from Rimmer, 2004 [9]).
Minerals 14 00461 g016
Figure 17. Paleowater temperature discrimination ((a): Paleowater temperature of coal seam samples; (b): Paleowater temperature of rock samples).
Minerals 14 00461 g017
Table 1. The content levels of major elemental oxides (wt%) in Yihua coal.
SamplesThicknessLithologySiO2Al2O3TiO2Fe2O3CaOMgOK2ONa2OMnOP2O5
C1-F0.2sandstone43.8435.952.030.520.240.270.540.130.010.03
C2-F0.2sandstone24.5511.293.250.031.020.350.190.220.000.03
C30.05coal0.680.720.093.131.940.610.010.300.010.01
C41.2coal0.670.520.050.052.310.730.020.330.010.01
C51.5coal0.170.140.040.211.690.560.010.300.010.01
C60.5coal0.350.280.030.041.910.650.020.330.010.01
C7-P0.15parting0.230.150.0131.336.170.250.010.090.070.01
C82.5coal0.280.260.020.162.220.740.010.350.010.01
C90.8coal0.290.090.020.111.550.610.020.460.010.01
C10-P0.6parting0.030.070.010.0732.150.440.010.090.090.01
C110.7coal0.290.060.020.061.960.810.020.360.010.01
C121.7coal0.210.100.020.101.520.790.010.360.010.01
C13-P0.05parting0.530.370.031.132.770.950.010.360.010.01
C14-P0.05parting0.340.190.0120.3034.720.610.010.130.240.01
C151.5coal0.250.080.020.224.380.850.030.500.030.01
C160.4coal0.960.200.020.571.971.080.040.670.010.03
C17-P0.15parting0.190.110.011.5039.310.490.000.100.390.01
C18-L-quartz82.046.670.730.451.020.270.870.150.020.02
C190.3coal0.540.230.020.352.411.270.020.410.020.02
C200.7coal0.540.140.020.072.541.320.020.440.010.05
C21-R0.5sandstone67.4112.610.490.060.200.271.130.170.020.03
C22-R0.5sandstone60.5816.520.850.030.410.471.430.220.010.06
Coal-av--0.340.200.030.172.280.790.020.390.010.01
China 1--8.475.980.334.851.230.220.190.160.020.09
CC--0.040.030.080.031.853.570.102.420.530.14
1 Average concentrations of elements in common Chinese coals [15].
Table 2. Major-element oxide content levels (wt%) in overlying rock strata of the B1 coal seam.
SamplesThicknessLithologySiO2Al2O3TiO2Fe2O3CaOMgOK2ONa2OMnOP2O5
S11.2sandstone72.3416.470.910.570.250.180.412.030.280.01
S20.8sandstone25.586.870.381.2833.150.992.770.890.990.50
S30.9mudstone68.4017.940.991.210.500.360.702.411.570.01
S41.0sandstone70.6316.740.900.710.360.250.532.262.220.01
S50.8mudstone67.5418.691.012.930.210.110.781.500.450.01
S60.9sandstone66.2519.721.101.540.300.210.812.100.410.01
S71.1mudstone71.0516.141.141.560.180.180.651.260.390.01
S81.5sandstone64.5513.930.912.790.454.560.902.021.560.05
S90.8mudstone66.9118.041.012.640.320.330.882.321.400.02
S100.8mudstone51.0525.861.308.930.160.130.781.720.370.14
S111.1sandstone66.0319.681.082.480.330.110.892.000.430.01
S120.6sandstone11.253.680.1720.0928.479.361.330.601.742.76
S131.3mudstone65.3515.640.693.180.861.592.092.432.970.06
S141.0sandstone64.3515.410.654.031.061.642.192.672.770.05
S151.2sandstone62.7716.200.784.151.691.012.702.822.870.07
S160.8mudstone62.4316.210.794.331.260.722.753.862.800.25
Average0.99-59.78 16.07 0.86 5.38 1.36 1.32 2.06 1.45 0.25 0.53
Table 3. Trace element contents (μg/g) of coal seam samples from the Yihua coal mine.
SamplesBScV Cr CoNiCu GaRbSrZr Nb Mo Cs BaHf Th
C1-F49.6711.90113.0098.202.7834.508.4945.8039.3064.10443.0031.401.459.5380.7013.5016.50
C2-F44.5511.20238.0069.903.0044.4034.4030.8011.10173.00791.0024.800.342.5653.0020.7026.00
C3118.940.517.2312.108.6512.604.090.770.67293.0016.101.350.010.3013.300.481.49
C467.370.494.8716.506.3310.903.660.420.22305.006.581.000.160.242.530.190.42
C559.730.354.2613.502.246.832.620.170.32170.005.750.400.140.232.980.190.34
C661.190.204.2014.000.563.422.460.360.49148.003.650.550.030.2351.000.120.26
C7-P21.760.033.5513.200.413.051.240.180.1198.901.170.370.020.2623.600.030.12
C8109.060.113.7714.200.422.141.540.130.07179.001.480.430.030.2243.100.050.14
C9125.940.033.7912.900.442.532.080.160.16140.001.510.460.070.2264.100.040.10
C10-P88.210.254.0312.101.097.891.620.250.30202.007.495.900.020.2578.500.190.21
C11110.150.223.8512.400.373.801.680.170.12139.001.980.590.040.2287.300.060.14
C1291.810.064.0112.500.412.911.620.200.25171.001.520.510.030.23506.000.050.11
C13-P116.010.094.0411.500.462.901.980.230.20206.004.730.580.050.2320.200.130.23
C14-P47.930.123.5513.900.864.921.150.170.42318.002.872.870.050.27846.000.080.14
C15115.980.053.6012.600.473.491.790.180.14184.003.880.630.060.225.970.110.18
C16110.440.114.038.180.432.001.630.150.16231.002.600.500.090.2620.500.070.17
C17-P53.450.123.7313.004.1411.701.620.450.12278.0012.207.600.270.23557.000.320.22
C18-L16.124.6423.2023.802.184.0315.406.5727.20335.00153.007.240.411.45338.004.444.67
C19131.110.174.2113.602.566.461.840.200.63294.002.490.520.020.238.930.070.24
C20161.010.024.1612.503.8211.902.220.210.23453.003.310.610.090.2330.800.100.20
C21-R38.706.4235.2025.906.989.1812.0011.0028.7066.90129.005.290.611.14189.003.944.85
C22-R52.5415.6097.4060.009.9513.7030.3016.7051.1068.70177.008.240.544.08189.005.466.58
Coal-av105.20.194.3312.922.235.752.270.260.29225.64.240.630.060.2469.710.130.32
Floor47.1111.55175.584.052.8939.4521.4538.325.2118.661728.10.96.0566.8517.121.25
Parting57.250.183.8912.461.47.341.560.260.24203.96.884.910.060.25177.50.180.2
Roof45.6211.0166.342.958.4711.4421.1513.8539.967.81536.770.582.611894.75.72
Table 4. Trace element contents (μg/g) of overlying rock strata.
SamplesBScV Cr CoNiCu GaRbSrZr Nb Mo Cs BaHf Th
S148.2613.298.658.82.578.721.618.364.955.12299.550.263.513526.926.62
S225.3118.790.636.258.611614.28.0429.417697.47.250.112.253122.713.17
S359.6317.711467.440.958.628.92080.792.718710.20.736.163585.857.39
S445.5415.28959.414.921.822.616.865.197.11958.560.73.633625.626.17
S558.6914.712456.54.9714.721.121.863.240.821210.80.576.082816.267.52
S660.5719.7117807.5224.831.922.978.286.822611.20.455.663476.728.58
S753.3513.810651.69.9132.326.119.162.747.119611.40.696.092615.56.27
S839.5224.993.25910.624.428.815.669.31522449.560.53.783816.716.04
S955.2114.41146211.125.637.42081.561.724210.40.465.223837.127.31
S1073.2825.416461.711.330.238.428.867.257.626011.50.533.82377.57.42
S1160.5820.414589.510.63541.624.691.24920410.70.616.623605.898.12
S1220.129.8556.826.317.958.440.76.37244011845.523.162.052582.643.09
S1343.4312.980.254.210.225.124.819.883.7261203121.024.774245.7310.6
S1437.5811.567.149.610.423.614.416.583.821814710.30.344.374044.549.53
S1553.5917.611286.114.531.629.620.294.317319811.40.786.823705.9111.8
S1656.3717.110779.117.740.243.120.4117183172110.848.284544.9410
Average49.4416.69 104.9 61.09 15.85 35.69 29.08 18.70 72.26 134.5 199.8 10.08 0.73 4.94347 5.66 7.48
Table 5. Content levels of rare earth elements and yttrium in coal seam samples from the Yihua coal mine (μg/g).
SamplesLaCePrNdSmEuGdTbDyYHoErTmYbLuREY
C1-F5.4111.31.164.61.020.241.240.362.5116.50.581.820.342.370.3849.45
C2-F10.5212.349.412.70.693.410.967.0240.41.474.380.775.270.83110.32
C31.041.750.220.890.170.040.180.080.261.60.050.160.050.260.036.75
C41.291.90.210.80.150.030.140.070.161.010.040.090.040.210.026.13
C50.530.730.10.450.090.020.080.060.100.610.020.060.030.180.013.05
C60.440.60.0950.360.070.030.060.050.060.390.010.040.030.150.012.39
C7-P1.732.490.240.890.110.030.100.050.050.340.010.030.020.130.016.22
C80.490.680.10.390.070.030.070.050.080.410.020.040.030.140.012.59
C90.330.360.070.280.050.030.050.050.050.310.010.030.030.130.011.78
C10-P2.793.930.351.270.160.050.140.060.080.540.020.130.030.140.019.68
C110.430.640.100.410.070.040.060.060.080.440.020.050.030.150.012.56
C120.270.260.060.280.070.150.050.050.050.320.010.030.030.130.011.76
C13-P0.611.060.150.590.120.030.110.060.10.590.020.060.030.160.013.70
C14-P4.216.320.562.040.260.240.220.070.110.580.020.050.030.140.0114.85
C150.480.820.130.550.090.030.090.060.110.630.020.070.030.180.013.29
C160.620.890.130.50.100.020.080.060.090.480.010.040.030.150.013.20
C17-P0.731.80.230.960.150.170.140.060.110.680.020.120.030.170.015.38
C18-L14.229.82.94111.720.431.590.332.112.60.471.540.32.020.3281.04
C190.891.420.160.610.120.030.10.060.110.650.020.060.030.170.014.43
C200.811.470.190.810.140.040.130.060.120.70.030.070.030.170.014.76
C21-R31.270.57.6729.85.261.144.190.673.2314.60.571.620.271.760.26172.48
C22-R24.351.96.0825.65.011.174.40.814.5824.10.892.550.442.820.42154.65
Table 6. Content levels of rare earth elements and yttrium in overlying rock strata (μg/g).
SamplesLaCePrNdSmEuGdTbDyYHoErTmYbLuREY
S124.352.36.1425.95.131.34.460.824.7525.40.932.70.463.020.45158.06
S215.329.63.3814.330.8530.593.5721.60.732.050.352.290.34100.95
S327.359.36.7529.15.781.425.190.915.2827.41.012.950.483.180.47176.52
S424.952.96.2125.55.141.34.570.854.9725.30.932.740.452.960.45159.17
S514.330.53.3313.72.660.672.610.583.8222.70.822.580.463.030.48102.24
S628.761.87.41316.181.445.5215.8831.91.143.330.563.690.56190.11
S715.333.13.4613.92.620.612.480.513.1519.40.652.030.372.440.38100.4
S833.368.48.4937.47.942.017.641.387.87421.54.020.654.090.6227.29
S926.956.16.8429.65.931.385.130.955.4329.31.083.120.533.580.54176.41
S1034.760.98.635.87.231.796.211.166.8234.81.273.740.624.080.64208.36
S1129.963.17.53326.31.475.350.965.6430.71.063.140.533.50.52191.7
S1241.259.66.2227.25.361.376.781.278.4173.51.815.190.754.480.68243.82
S1329.660.36.9428.35.241.114.650.824.5427.50.862.560.422.740.41175.99
S1428.358.26.8528.25.431.14.60.794.2322.80.772.210.362.220.35166.41
S153368.87.932.46.131.25.230.945.2528.712.920.493.30.51197.77
S1628.861.17.0529.15.471.184.560.784.2824.10.822.330.392.540.38172.88
Table 7. Rare earth element parameters of coal seam samples from the Yihua coal mine.
Samples∑LREE (μg/g)∑MREY (μg/g)∑HREE (μg/g)∑REY (μg/g)L/ML/HM/HLa/YbδCeδEu
Coal-av2.350.920.293.572.567.833.063.770.722.42
Floor34.7236.679.1180.491.013.953.962.080.990.68
Parting6.750.940.287.977.3325.703.3813.610.861.83
Roof128.729.455.80163.94.6424.055.1212.111.010.74
Notes: L/M: ∑LREE/∑MREY; L/H: ∑LREE/∑HREE; M/H: ∑MREY/∑HREE.
Table 8. Rare earth element parameters of overlying strata samples from the Yihua coal mine.
Samples∑LREE (μg/g)∑MREY (μg/g)∑HREE (μg/g)∑REY (μg/g)L/ML/HM/HLa/YbδCeδEu
Max155.5391.3312.91243.8210.9954.657.079.201.040.87
Min64.4926.155.76100.400.883.612.696.440.790.64
Average120.8742.728.17171.763.4717.335.068.520.950.75
Notes: L/M: ∑LREE/∑MREY; L/H: ∑LREE/∑HREE; M/H: ∑MREY/∑HREE.
Table 9. Correlation parameters of coal seam and rock strata.
La (μg/g)Ce (μg/g)∑REE (μg/g)La/Yb∑LREE/∑HREEδEu
OIA8 ± 1.719 ± 3.758 ± 104.2 ± 1.33.8 ± 0.91.04 ± 0.11
CIA27 ± 4.559 ± 8.2146 ± 2011.0 ± 3.67.7 ± 1.70.79 ± 0.13
ACM377818612.59.10.6
PM398521015.98.50.56
CS-av4.709.6229.576.954.111.9
OR-av27.2454.75171.768.5217.330.75
CS-av: average value of coal seam samples; OR-av: average of samples from overlying rock strata.
Table 10. Paleosalinity discrimination parameters and ranges.
MethodRangeEnvironmentCoal Seam Rock
80~125saltwater
B (μg/g)60~80brackish water81.44 μg/g49.44 μg/g
<60freshwater
800~1000saltwater
Sr (μg/g)300~800brackish water205.35 μg/g134.49 μg/g
100~300freshwater
>4.5saltwater
B/Ga3.3~4.5brackish water352.82.68
<3.3freshwater
>1saltwater
Sr/Ba0.6~1brackish water14.730.40
<0.6freshwater
Disclaimer/Publisher’s Note: The statements, opinions and data contained in all publications are solely those of the individual author(s) and contributor(s) and not of MDPI and/or the editor(s). MDPI and/or the editor(s) disclaim responsibility for any injury to people or property resulting from any ideas, methods, instructions or products referred to in the content.

