1. Introduction
Coal gangue is the discarded coal-containing rocks in coal production, and its most conventional treatment is accumulation on the ground [
1,
2,
3]. The total storage capacity of coal gangue in China has exceeded 7 billion tons, and accumulating a large amount of coal gangue will bring severe environmental problems while occupying land resources [
1,
4,
5,
6]. These environmental issues are of great concern in China and have gained widespread attention globally [
7,
8].
Coal gangue made into a gangue-based slurry that is used to fill mining holes can be a way to dispose of enormous amounts of waste gangue. It can effectively control the ground subsidence to achieve green mining [
9,
10]. The slurry filling must be transported from the ground to the stratum or hollow area through a pre-constructed pipeline. However, the physical properties of gangue particles, such as particle size and shape, will affect the fluidity of gangue slurry in the pipeline. Changes in fluidity increase the number of settled particles, resulting in pipeline clogging during slurry transportation [
11,
12,
13]. The clogging of the grouting pipeline will cause economic losses and delay the progress of the filling project. Moreover, it even affects settlement management, which will bring more significant safety hazards [
10,
14,
15,
16,
17]. Therefore, it is necessary to study the flow state of gangue slurry in grouting pipes to avoid the phenomenon of gangue slurry clogging in the grouting pipeline.
The fluidity of gangue slurry directly affects its transportation performance [
18,
19]. If the prepared gangue slurry’s viscosity is too high, resistance in pipeline transportation is apparent. Suppose that the viscosity of the slurry is too low. In that case, stratification and segregation can quickly occur and many particles settle, resulting in pipeline clogging in the slurry transportation process [
9,
11,
20]. However, the research at this stage does not consider the influence of the viscosity change of the slurry on the rule of motion of the coal gangue slurry. The more common perception is that the viscosity of gangue slurry is not constant [
2,
12,
18]. The viscosity change will inevitably affect the slurry flow and particle deposition laws. Therefore, it is necessary to study the flow characteristics of slurry with viscosity change. The motion behavior of gangue slurry in the pipeline results from the interaction between gangue particles and slurry [
14,
21,
22]. The coupled CFD-DEM method is used to solve the interaction between particles and fluid [
23,
24,
25,
26,
27,
28], which is very suitable for simulating the flow process of gangue slurry in the pipeline [
13,
19]. The CFD-DEM method has been utilized in various applications involving the coupling of fluids and solids in geotechnical engineering [
29,
30]. It is highly accurate in describing the microscopic motion patterns of particles in the flow field [
31,
32].
In this paper, through the simulation of gangue slurries of different particle sizes during pipeline transportation, we determine the apparent gangue slurry mass concentration, particle size, and viscosity changes, as well as the impact of the pipeline angle on the deposition behavior of the particles. Then, the correlation between these factors and the particles deposited in the blockage phenomenon will be determined. The research results provide a basis for the design of gangue slurry filling systems and the selection of slurry materials.
2. Analysis of Physical and Chemical Properties of Materials
2.1. Gangue Materials
The gangue used is a mixture of carbonaceous, muddy, sandy mudstone and sandstone, of which mudstone accounts for a relatively large proportion. Moreover, the particles are cohesive after crushing and ball milling to make a slurry. As a component of coal strata, the gangue is mainly composed of quartz sand and clay minerals. The selected gangue was scanned by electron microscopy (Zeiss Sigma500, Oberkochen, Germany), and the resulting scanning electron microscope pictures are shown in
Figure 1a,b, magnified 500 times and 2000 times.
From the scanning electron microscope image, it can be seen that there are cracks and pores on the surface, and the whole surface is broken and in an uneven state. At the same time, it can be observed that there are many flaky structures and some blocky structures. In order to analyze the mineral composition further and understand the swelling and modification of the gangue when it meets water, the gangue was analyzed using the XRD diffraction test.
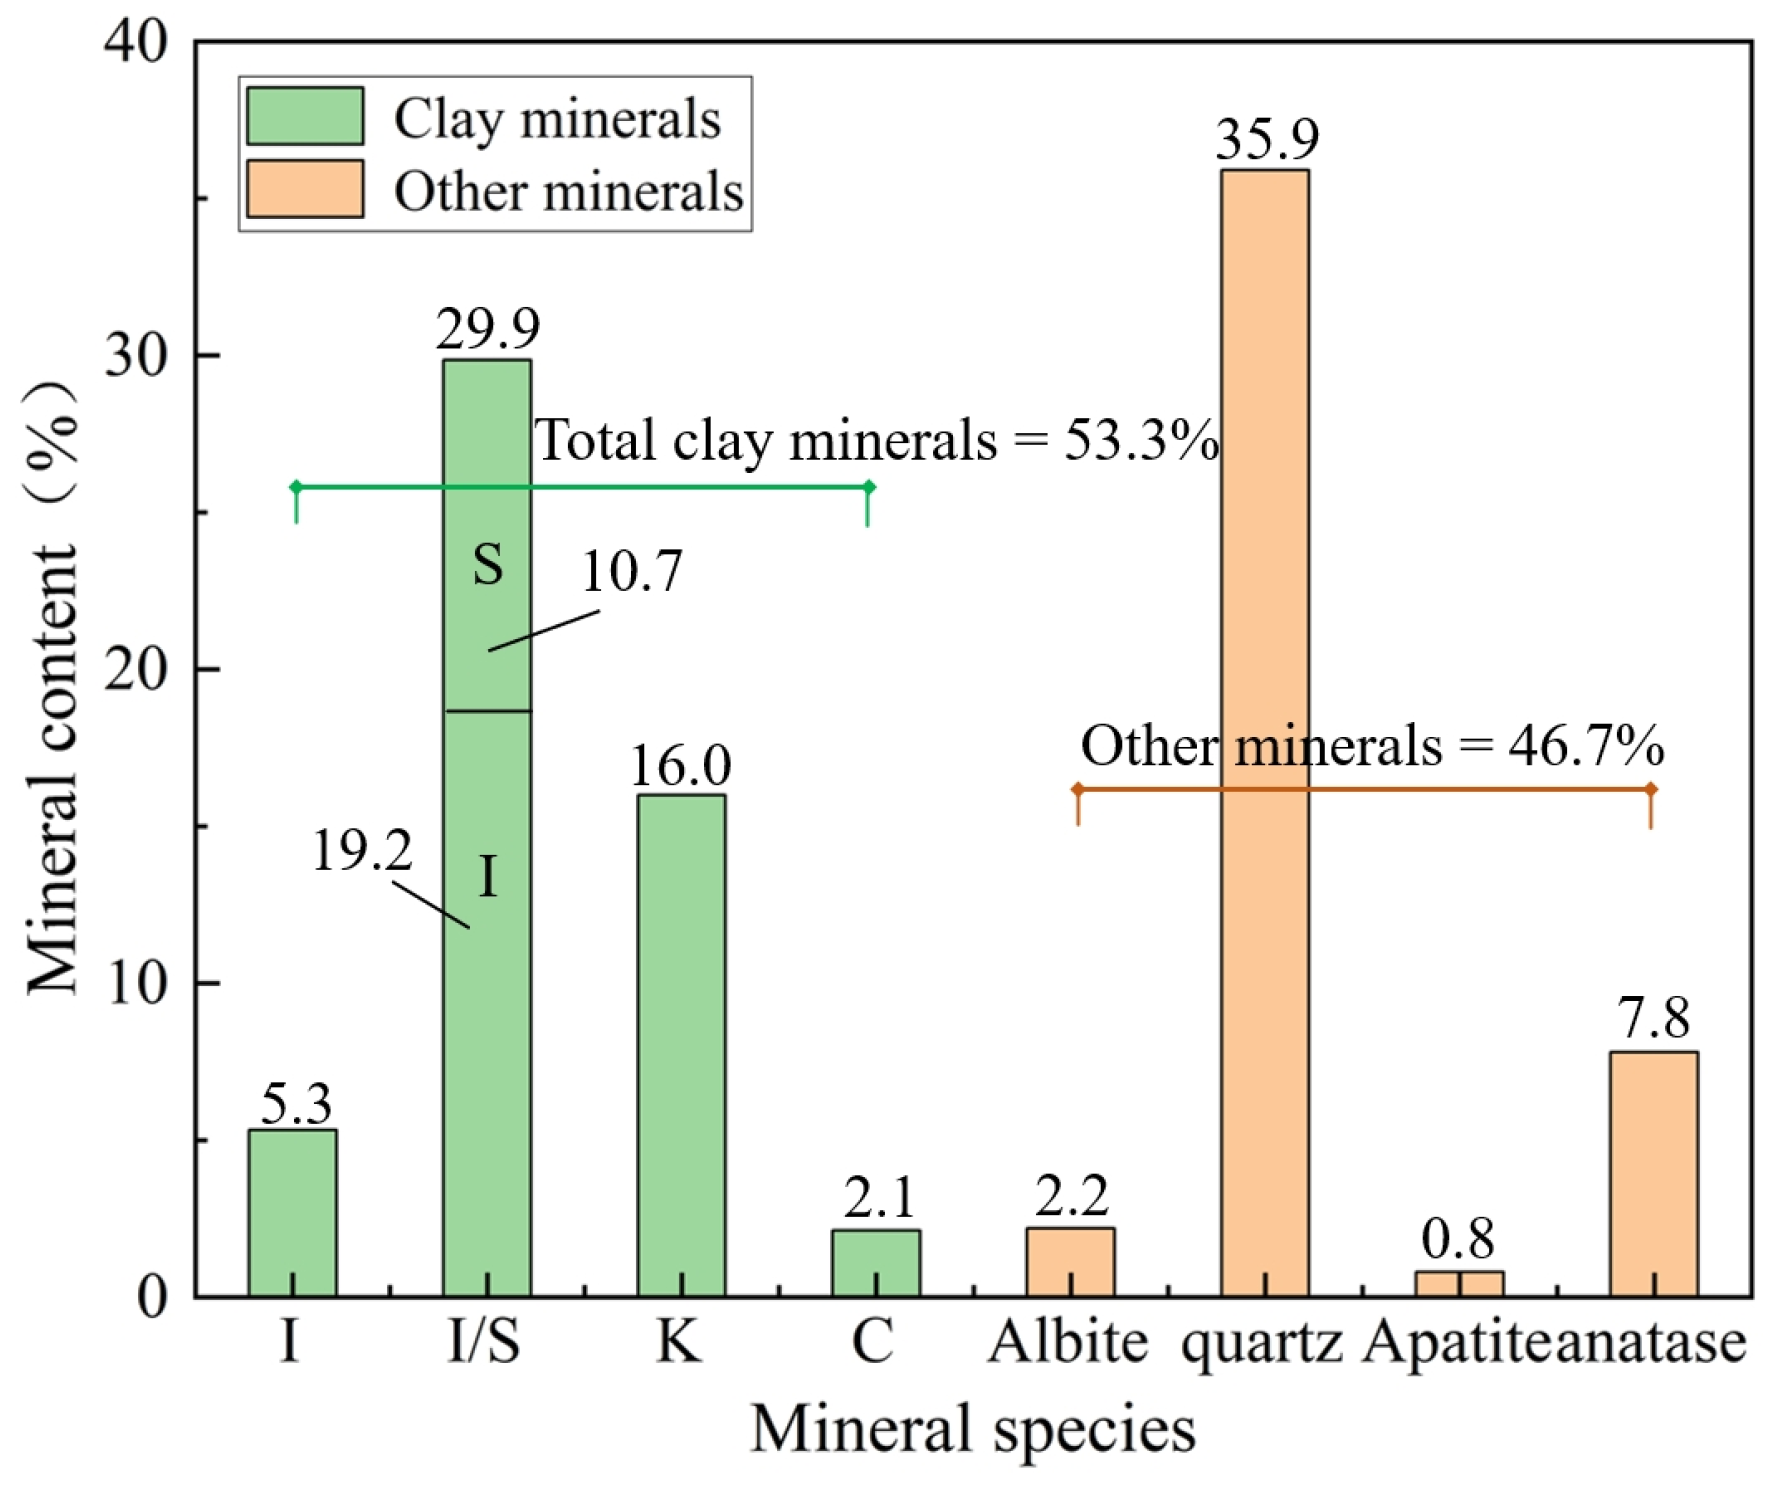
The results of the mineral composition analysis are shown in
Figure 2. From the XRD analysis results, it can be seen that the clay minerals in the coal gangue accounted for 53.3%. Clay’s illite/smectite formation components swell with water, and kaolinite and chlorite components mud with water. Both make the gangue particles in the slurry transport process easy to swell, disintegrate, and mud [
33,
34]. These phenomena will affect the overall rheological properties of the gangue slurry, which in turn affects the slurry’s flow law and the particles’ deposition law.
2.2. Slurry Fluidity
The rheological properties of gangue slurry at different particle sizes (0.15 mm, 0.5 mm, 1.0 mm, 2.0 mm) for each mass concentration were measured using a rheometer (Antonpa-MCR30, Graz, Austria). According to the experimental results, the viscosity characteristics of gangue slurry under different conditions were obtained, as shown in
Figure 3.
Figure 3 shows that the plastic viscosity of the gangue slurry becomes more significant with the increase in mass concentration. With the increase in the number of particles, the shear rate increases, and the gangue particles collide, resulting in a shear thickening phenomenon, and the viscosity of the slurry gradually increases [
2,
9,
18]. At the same time, there is a concentration interval in which the viscosity growth rate is significant. Before this interval, the viscosity growth is more moderate. According to the change in viscosity of the slurry, it can be seen that the rapid viscosity growth occurs when the mass concentration is low for the gangue slurry with a small particle size. The smaller the particle size, the larger the surface area; thus, the gangue slurry is more likely to form a high-viscosity slurry. When the viscosity of the slurry enters the rapid growth stage, the viscosity of this time is very sensitive to changes in mass concentration. In order to ensure the fluidity of the slurry in the pipeline for a long time, we tested gangue with a particle size of 0.15 mm, using a slurry concentration of 40%; gangue with a particle size of 0.5 mm, using a slurry concentration of 60%; gangue with a particle size of 1.0 mm, using a slurry concentration of 65%; and gangue with a particle size of 2.0 mm, using a slurry concentration of 70%.
At the same time, the rheology of gangue slurry also changes with time. According to existing research, the viscosity of some gangue slurry is positively correlated with time [
18]. In pipeline transportation, the longer the time duration, the greater the slurry’s viscosity. According to the measured values of the viscosity of gangue slurry at different times [
2,
11,
18], the trend of gangue slurry with time and its fitting curve can be obtained and is shown in
Figure 4.
3. Numerical Simulation
This chapter uses the CFD-DEM coupling method to simulate the gangue slurry pipeline flow process and study the gangue slurry based on pipeline slurry flow and particle deposition laws. This chapter analyses the distribution characteristics of the deposition and blockage of particles of different particle sizes in the pipeline under viscosity change. It clarifies the flow law of slurry in the pipeline under viscosity change. A reasonable slurry transport scheme ensures the stable operation of the pipeline conveying system.
3.1. Control Equations
3.1.1. Fluid Control Equations
The controlling equation for the fluid as a continuous phase consists of the fluid continuity equation derived based on the law of conservation of mass and the momentum equation derived based on Newton’s second law [
35,
36]. The equation is given as
where
ρf is the fluid density;
uf is the velocity of fluid motion;
ε is the porosity of the solid cell; ∇ is the Laplace operator;
p is the fluid pressure;
μf is the coefficient of viscosity; and
Ff,p is the force of interaction between the particles and the fluid.
3.1.2. Particle–Fluid Interaction Forces
Consider that the main interaction forces of the particles subjected to the fluid are those of the trailing force (
Fd) with the pressure gradient force (
Fb). The effect of the lift force, virtual mass force, and other interaction forces can be neglected. The formula is
where the pressure gradient force (
Fb) is
The trailing force (
Fd) can be obtained from Equation (5) [
37]:
β is the momentum transfer coefficient with the following expression:
where
Cd is the coefficient of traction;
VP is the volume of the particle;
dP is the diameter of the particle;
up is the velocity of motion of the particle; and Re
p is the Reynolds number of the particle, whose expression is
3.1.3. Particle Control Equations
The discrete element method (DEM) solves the particle’s state of motion. Based on Newton’s second law and adding the derivation to derive the force between the fluid and the particles, the particle governing equations were derived [
38] (Equation (9)):
where
ui is the velocity of particle
i;
Fij is the contact force on particle
i;
FG;i is the gravitational force on particle
i;
Ii is the rotational moment of inertia of the particle;
ωi is the rotational angular velocity of particle
i; and
Mij is the rotational moment on the ith particle by particle
j or by the wall.
3.2. CFD-DEM Coupling Process
In the framework of CFD-DEM coupling, the liquid-phase equations of motion are calculated using the ANSYS FLUENT program, and the particle-phase equations of motion are calculated using EDEM. The information is transferred through the CFD-DEM coupling module (API).
The CFD-DEM coupling process is as follows: the CFD calculates the particle–fluid interaction forces transferred to the DEM, and the DEM updates the particle’s parameter information such as position, volume, and velocity; the computational data are updated between the CFD and the DEM according to the time step. The particle information is then submitted to CFD and matched with the fluid cell, after which the flow field calculation is performed in the next time step. During the coupled CFD-DEM computation process, data exchange continues to cycle until the end of the computation.
3.3. Fluid Domain Settings
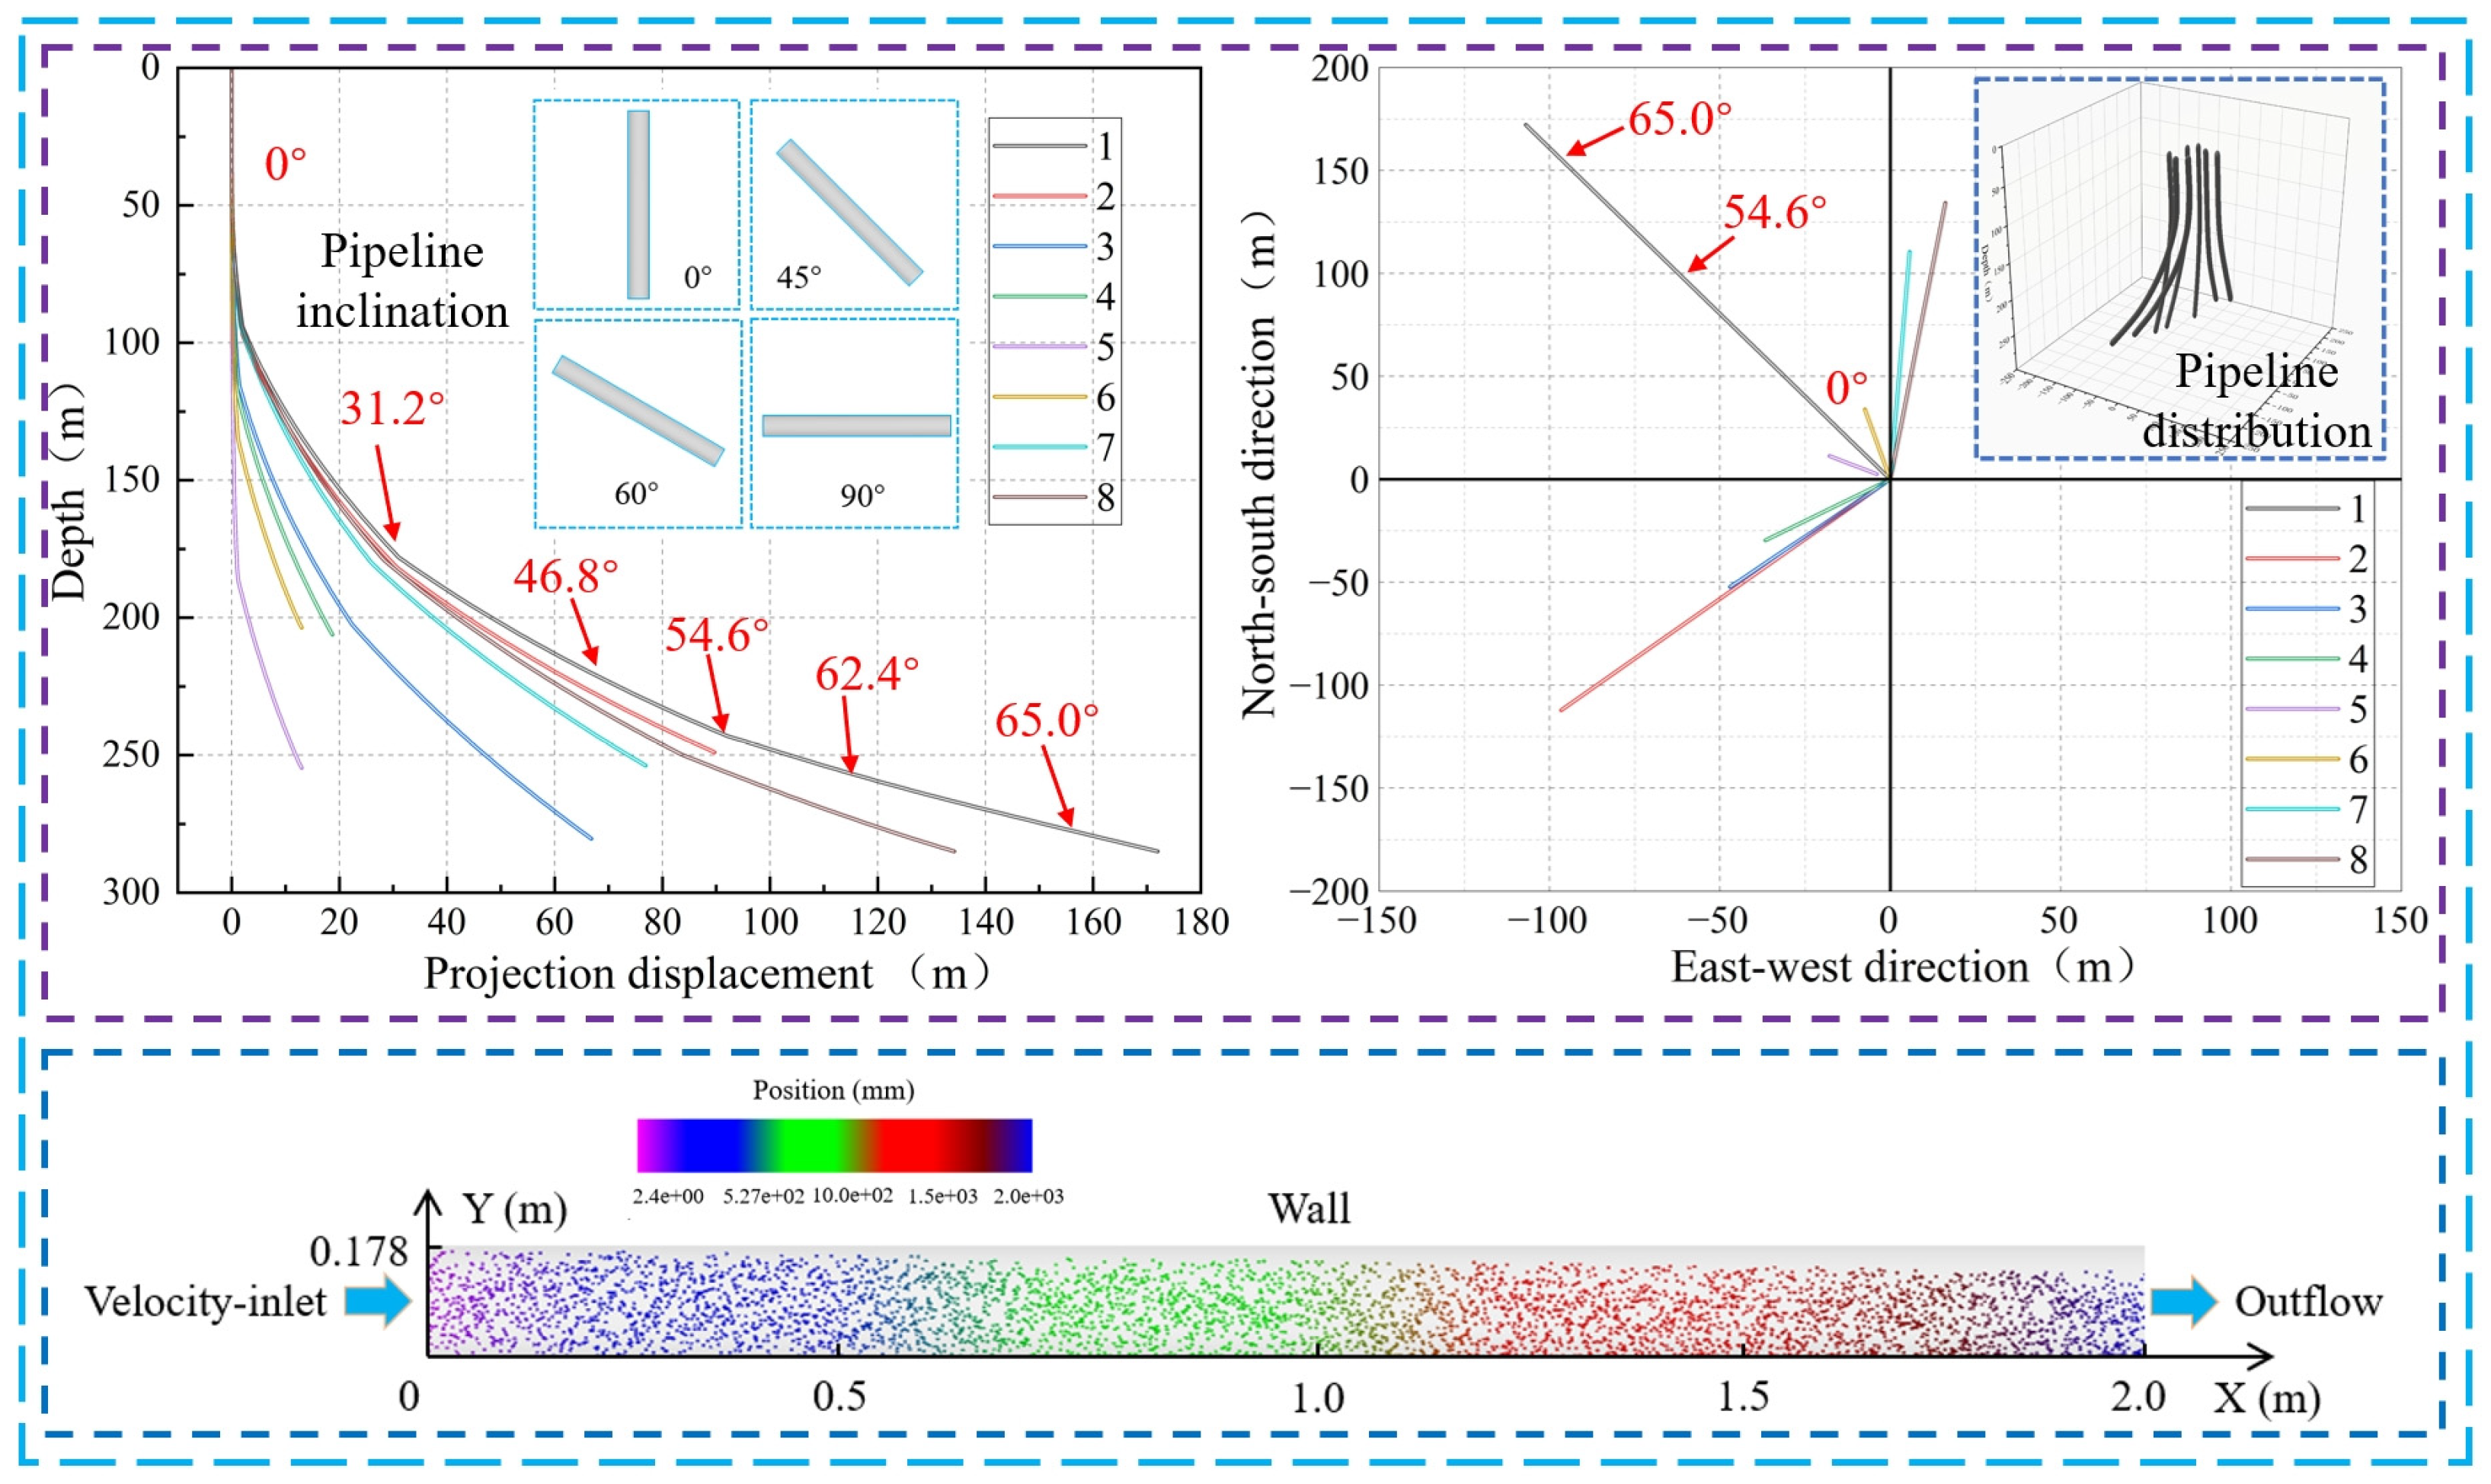
This paper establishes a pipeline model based on constructing the grouting system in the Zhaozhuang No. 2 shaft coal mine. The grouting holes are all directional drill holes and the azimuth and inclination of the grouting pipeline change with the increase in depth. Different well inclination angles (0~90°) were selected for gangue slurry flow simulation.
The diameter of the surface grouting pipe of the mine is 140 mm, and the diameter of the grouting pipe in the range of 285 m below the surface is 177.8 mm. The pipe simulation model is the same as the actual grouting pipe, with an inner diameter of 178 mm. The actual length of the pipe is too long, so a unit pipe model with a length of 2 m is defined in combination with the available experimental data [
13,
17,
21]. The mesh of the CFD simulation model meets the calculation requirements. The boundary conditions at the inlet, wall, and outlet are set as Velocity—inlet, Wall, and Outflow, respectively. The standard flow rate of the slurry pump used in the Zhaozhuang No. 2 shaft coal mine is 1.5 m/s, so the inlet flow rate is set at 1.5 m/s. The dimensions of the pipeline simulation model are shown in
Figure 5. At the same time, according to the gangue slurry viscosity with the time fitting equation to define the fluid viscosity, the viscosity change UDF is written in the CFD module and loaded into the fluid calculation to realize that the fluid viscosity grows with the increase in the existence time. The initial viscosity of gangue slurry was 0.1 Pa·s.
3.4. Granular Domain Settings
Before making the gangue slurry, the gangue needs to be crushed and ball milled, alongside other preparation processes. The particle size must meet the requirements before the slurry can be made. Currently, the most commonly used gangue slurry particle sizes are less than 0.15 mm [
3,
10,
12]. The stability of large-particle-size gangue slurry pipeline transport needs to be further analyzed. This study selects four particle sizes: 0.15 mm, 0.5 mm, 1.0 mm, and 2.0 mm. The simulation particle shape is modeled according to eight actual shapes, which is more in line with the actual movement of particles. The contact force between particles was modeled by the JKR contact model, which simulates the strong viscous interaction between particles through the cohesive force between particles. It considers the van der Waals force on particle motion and is highly accurate for simulating wet particles [
39,
40].
The gangue particle parameters need to be determined before particle domain calculations [
41,
42,
43]. The funnel method was utilized to measure the particle angle of repose to calibrate the particle parameters used in the simulation [
19,
44]. The measurement process of the angle of repose of gangue using the funnel method is shown in
Figure 6. At the same time, the same funnel simulation model was used for the particle rest angle experimental simulation. By comparing the actual measurement results and simulation results, we were able to adjust and define the optimal particle parameters. The final obtained particle parameters are shown in
Table 1.
4. Analysis of Simulation Results
4.1. Particle Distribution in the Pipeline
Figure 7 shows the spatial distribution of gangue particles through the horizontal pipeline at an inlet flow rate of 1.5 m/s. The blue particles in the figure are lumpy particles with a particle size of 2 mm, the green particles are flaky particles with a particle size of 2 mm, the red particles are columnar particles with a particle size of 1mm, and the yellow particles are prismatic particles with a particle size of 0.5 mm. In order to observe the particle distribution more clearly, some of the particles were scaled during post-processing. By comparing the particle distribution of the pipeline cross-section at 0.2 m and 1.8 m from the inlet, it can be seen that the gangue particles are more uniformly distributed in the pipeline in the initial stage when the pipeline conveys gangue slurry. With the continuous action of subsequent gravity, large particles gradually sink, gathering in the lower half of the pipeline.
Moreover, the distribution of small particles in the pipeline is still relatively uniform. At the same time, it can be seen that the particles of the same size, due to the different shapes of the particles, lead to different fluid interactions. There are differences in the state of motion in the conveying process. In the pipeline conveying process, for large-size particles larger than 1 mm, gravity dominates compared with the shear force of the fluid on the particles. Thus, they are gradually deposited at the bottom of the pipeline. This is manifested in the macroscopic slurry conveying process as the phenomenon of slurry stratification and segregation, which can easily cause pipeline clogging.
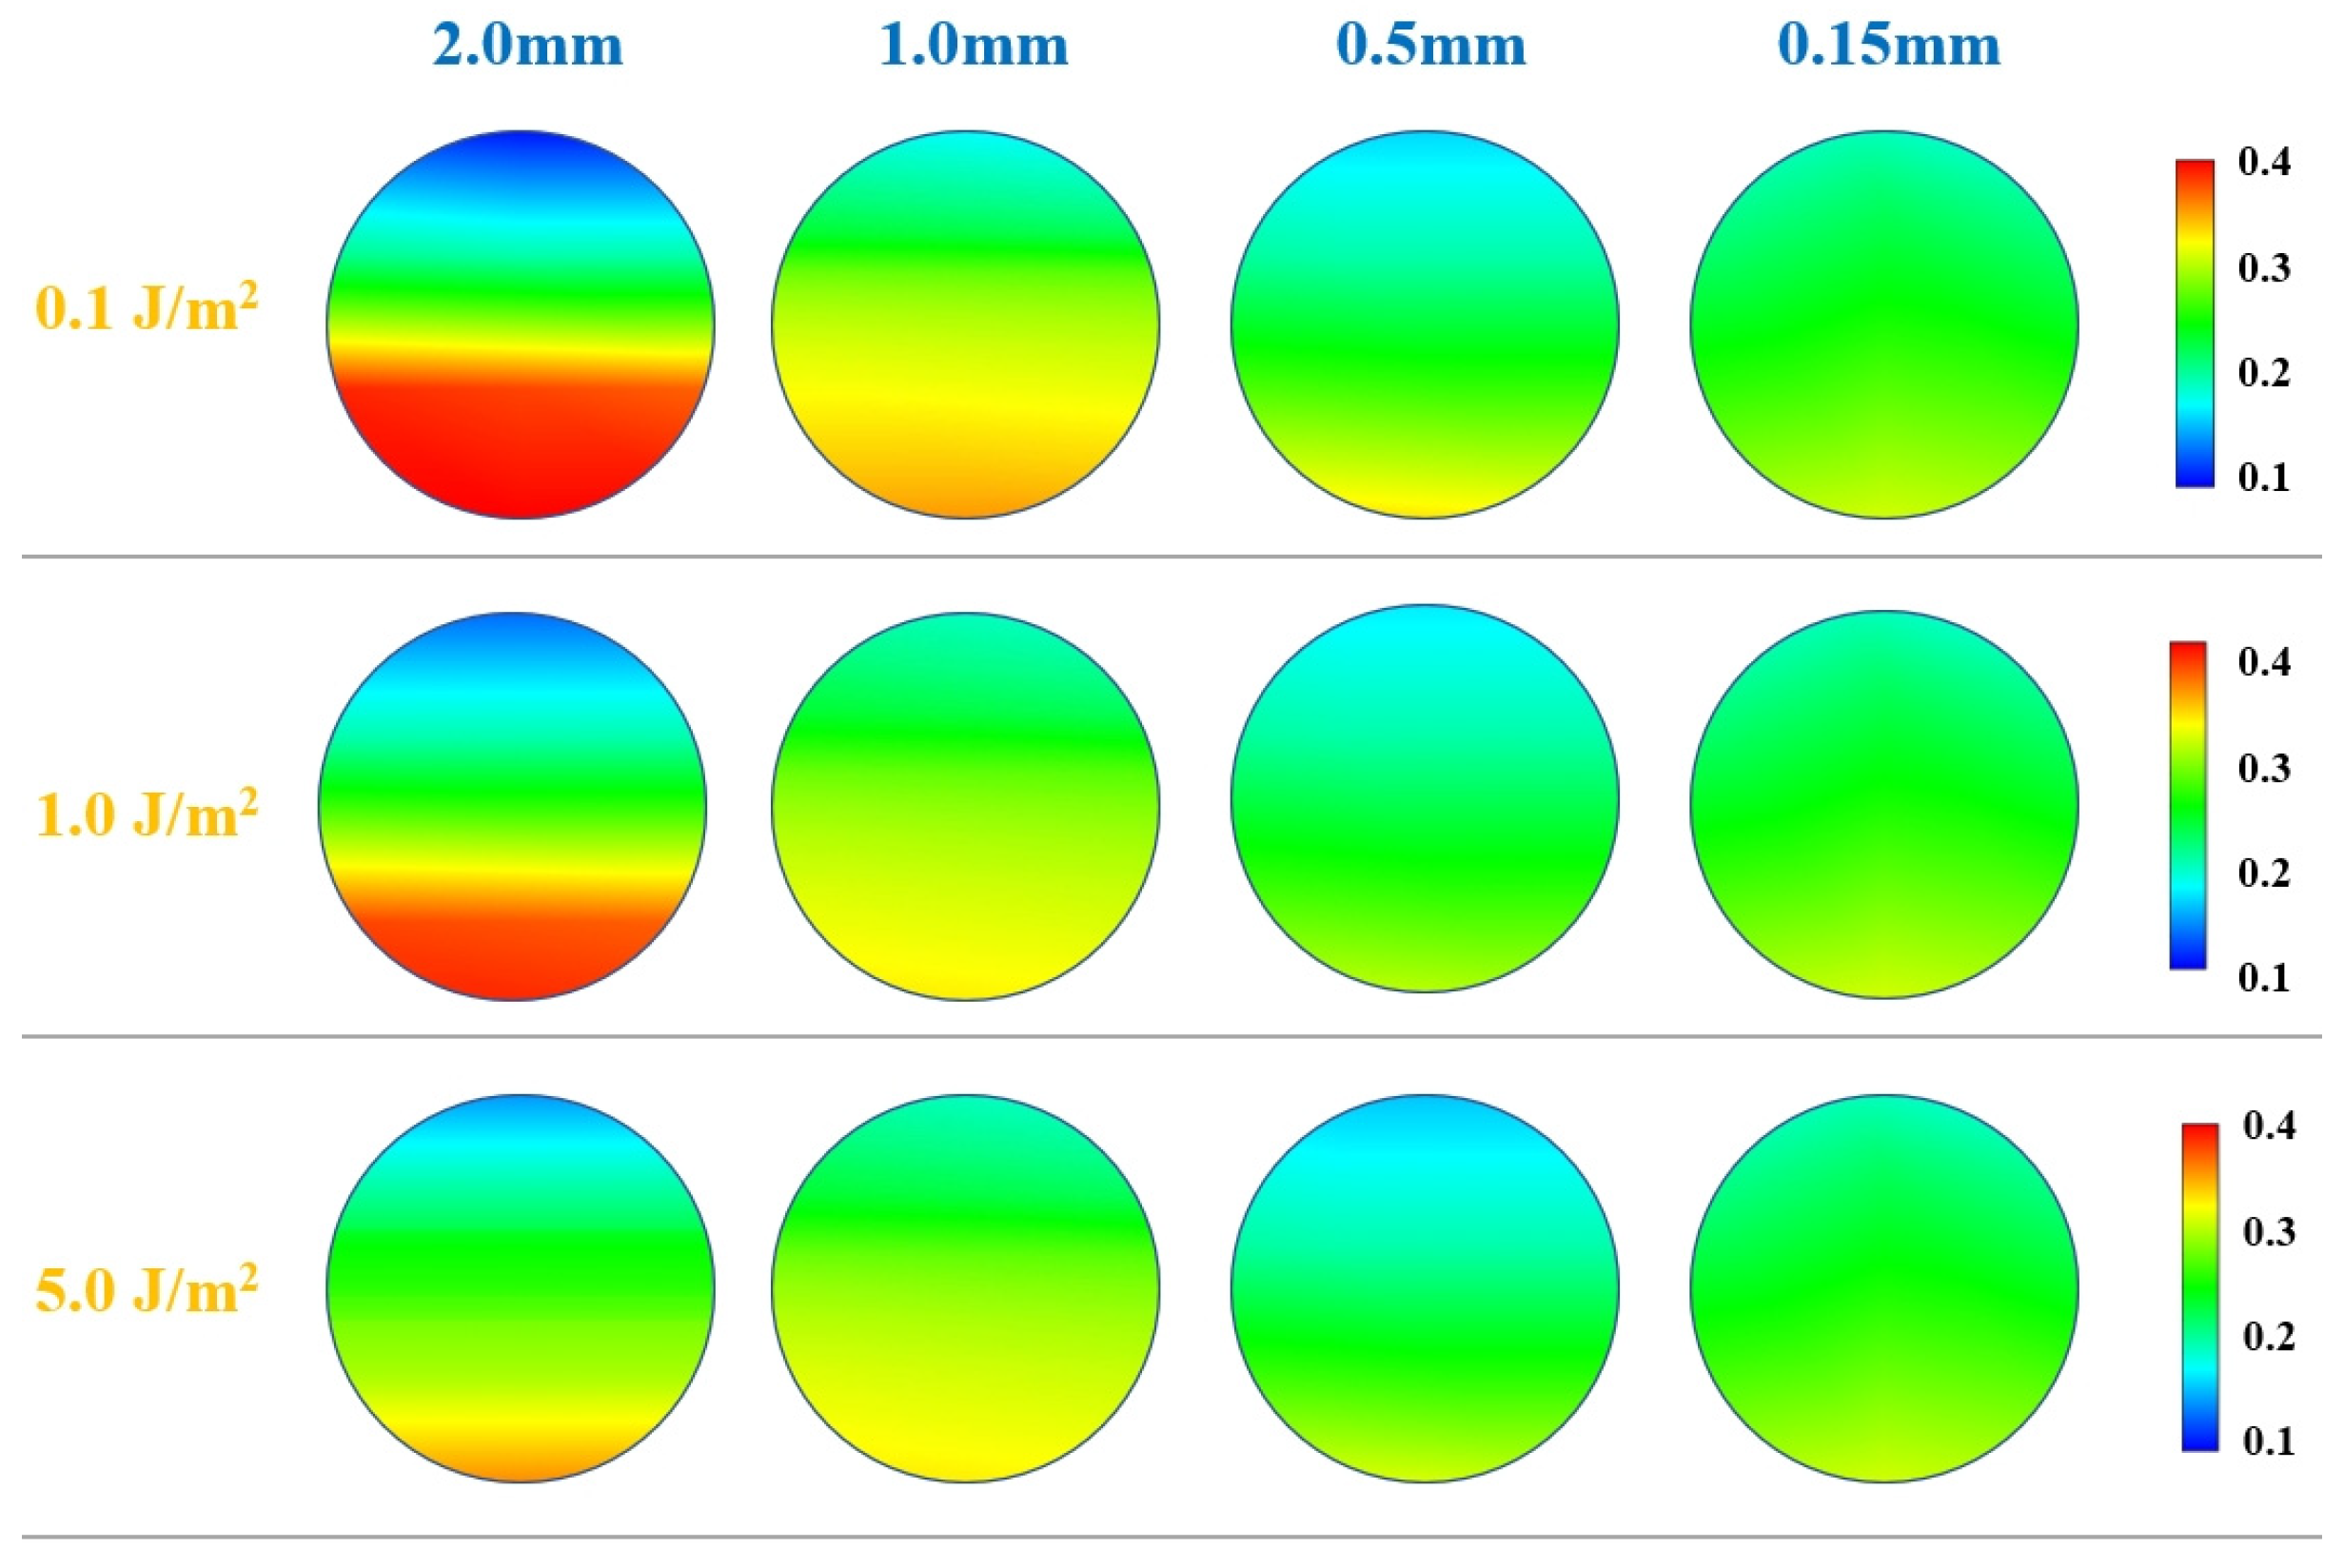
As an essential factor of pipeline clogging, the deposition behavior of gangue particles with different particle sizes must be further analyzed. In the DEM, the normal force applied to the particle is taken to be affected by the overlap and interaction parameters as well as the surface energy. The particle surface energy density is the particle energy per unit surface area [
27,
28]. Three surface energy densities (0.1 J/m
2, 1 J/m
2, 5 J/m
2) were selected based on the current research results to simulate the transport of gangue slurry with different particle sizes (0.15 mm, 0.5 mm, 1.0 mm, and 2.0 mm) in the pipeline and to analyze the distribution of particles for each particle size [
27,
44].
Figure 8 shows the volume fraction distribution of gangue slurry with bound particles in the pipeline. The amount of particles deposited increases with increasing particle size in a nonlinear trend. The larger the surface energy density, the more uniform the distribution of particles. When the particle size is 2.0 mm, the particles in the surface energy density conditions of 0.1 J/m
2 and 1.0 J/m
2 are in the bottom of the pipeline concentration aggregation area. When the particle size is less than 1.0 mm, the volume fraction of gangue slurry changes slightly with the increase in surface energy density. The volume fraction at the bottom and the top of the pipeline has little difference, and the particle distribution is uniform. By analyzing the difference in volume fraction of the slurry under the conditions of a surface energy density of 0.1 J/m
2, 1.0 J/m
2, and 5.0 J/m
2, it can be seen that the effect of the surface energy density on the distribution of particles is a nonlinear relationship. The deposition behavior of gangue slurry with particle sizes larger than 1.0 mm in the pipeline can easily lead to clogging. Improving the fluidity of the slurry in the pipeline requires the provision of more kinetic energy of the slurry, but this will lead to an increase in economic costs.
4.2. Pipe Angle
Figure 9 shows the particle distribution at 1 m from the inlet at 5 min at five different well inclination angles (0°, 30°, 45°, 60°, 90°). The pipeline was divided into four equal areas, from top to bottom, along the diameter of S1, S2, S3, and S4. It can be seen from
Figure 9 that when the gangue slurry is transported downhole, gravity gradually plays a dominant role in the transportation of particles with the increase in the well inclination angle. For different angles, the overall distribution of particles is more uniform. When the well inclination angle is 0°~45°, the gangue particles are evenly distributed in the pipeline. There is almost no change in the particle distribution between 0° and 30° well inclination angles. After the well inclination angle is greater than 45°, the distribution pattern of particles in the pipeline changes. The number of particles in areas S1 and S2 decreases, the number of particles in areas S3 and S4 increases, and the particles are shifted to the bottom of the pipeline. When the well inclination angle is 60°, the particles in the pipeline shift, and the proportion of particles in regions S3 and S4 to the total number of particles increases. When the well inclination angle is 90°, the number of particles in the S3 and S4 areas is much larger than in the S1 and S2 areas. At this time, the difference in the number of gangue particles in different locations is increasing. The particles in the pipeline are subjected to an increasing angle between the fluid force and the force of gravity. Gravity causes the particles to continuously undergo sedimentation, inhibiting the uniform particle distribution in the pipeline, and it quickly causes pipeline blockage.
4.3. Particle Motion Law under Viscosity Change
Figure 10 compares the particle motion state under two conditions of constant viscosity (η = 0.6 Pa·s) and viscosity variation (η = 0.6~1.1 Pa·s). The inlet flow rate was set to 1.5 m/s, and the distribution characteristics of the particles in the tube at 5 min and 10 min were selected.
From the analysis of
Figure 10, it can be seen that the viscosity of the slurry affects the distribution characteristics of particles in the pipeline. In the range of 1.0~1.4 m from the inlet, when the viscosity of the slurry is small, the particles with large particle sizes and particle clusters are mainly distributed below the pipeline’s centerline. The upper part of the pipeline primarily consists of particles with small particle sizes, which leads to particle stratification and segregation in the pipeline. It can be seen that when the viscosity of the slurry is constant, the movement of particles in the pipeline is more stable. With the increase in time, the distribution of particles in the pipeline did not occur with structural changes. Under viscosity change, the motion state of particles in the pipeline changed with time. When
t = 5 min, the particles in the pipeline were stratified, and the particle clusters with larger sizes were mainly distributed below the centerline of the pipeline; however, when
t = 10 min, the particles inside the pipeline were uniformly distributed, and the particle stratification phenomenon did not occur. This is because the increase in viscosity leads to a more significant shear force on the particles. When the viscosity is small, gravity’s influence on large-size particles is more prominent, so the particles settle during transport; when the viscosity becomes large, the particles subjected to shear force become larger. Compared with gravity, shear force dominates the particle’s state of motion. Currently, the internal distribution of particles in the pipeline is uniform. However, the viscosity of gangue slurry can not be increased indefinitely. If the viscosity of the slurry is too large, the slurry receives more resistance along the way. However, it will reduce the kinetic energy of the slurry, which in turn affects the movement of gangue particles.
4.4. Pressure Loss along the Pipeline
Figure 11 shows the relationship between the pressure drop along the pipeline and the inlet flow rate of the horizontal pipeline at different mass concentrations. Under the same mass concentration condition, the pressure drop along the pipeline is positively correlated with the gangue slurry flow rate. With the increase in the gangue slurry mass concentration, the pressure drop along the pipe shows a growing trend. When the flow rate is 1.5 m/s, the pressure drop along the pipe with a 40% mass concentration is 435 Pa/m, the pressure drop along the pipe with a 70% mass concentration is 1217 Pa/m, and the pressure drop along the pipe with an 80% mass concentration is 2634 Pa/m. After the mass concentration is more than 70%, the pressure drop along the pipe is very sensitive to changes in the mass concentration and shows a sharp increase.
Figure 12 shows the relationship between different well inclination angles and the pressure drop along the pipeline when the inlet velocity is 1.5 m/s. From
Figure 9, it can be seen that gravity plays a positive role in the transportation of gangue slurry in the pipeline when the well inclination angle is 0°~90°. The pressure drop increases with the increase in the well inclination angle and reaches the maximum value when the pipeline is transported horizontally (well inclination angle of 90°). The pressure drop along the pipeline at 60° is 2.7 times greater than the pressure drop along the pipeline at 0°. The pressure drop along the pipeline at 90° is 3.5 times the pressure drop along the pipeline at 0°.
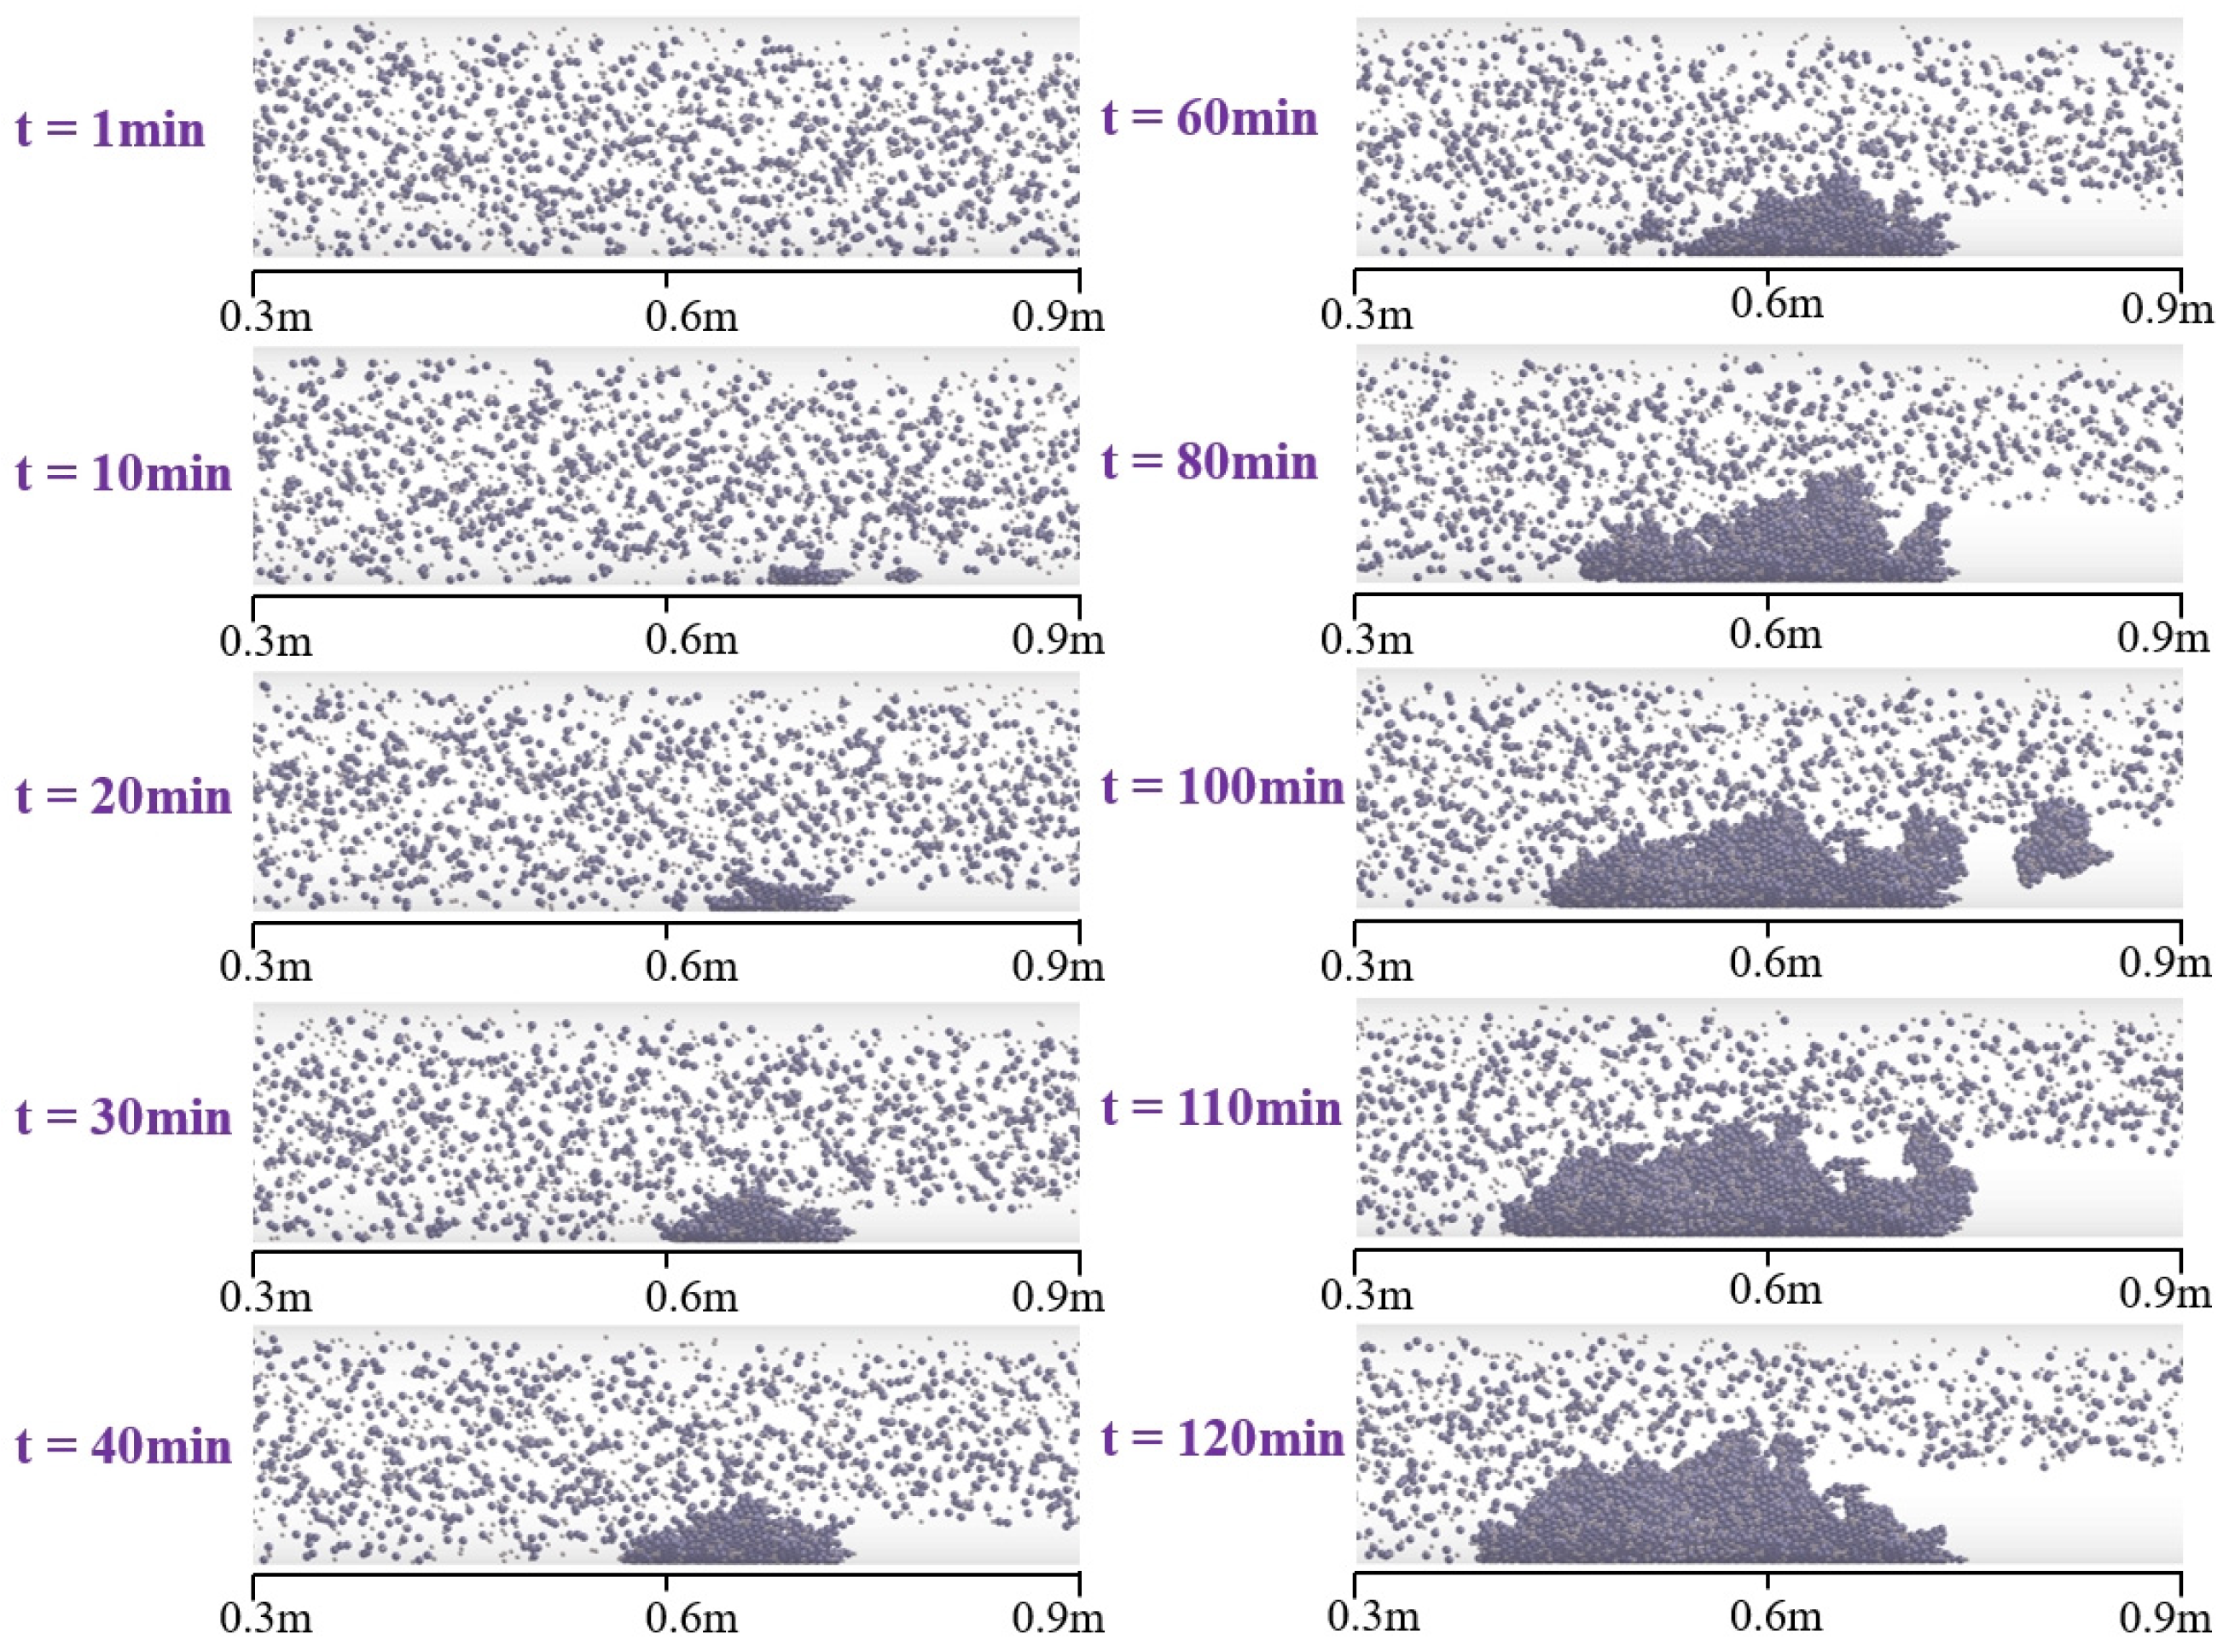
4.5. Particle Deposition Behavior
Figure 13 shows the deposition behavior of particles at 0.3 m to 0.9 m from the inlet with time under the conditions of an inlet flow rate of 1.5 m/s and viscosity variation. The morphology of the sediments gradually changes with the increase in the deposition time. The deposition of particles results from the combined effect of the interaction between the particles, the fluid, and the surface of the pipe. In the beginning stage, the particles are uniformly distributed inside the pipeline. It can be seen that with the increase in time, large particles are gradually deposited at the bottom of the pipe, and the range of deposition gradually expands. The sediment at the bottom of the pipeline has an intercepting effect on the particles, which are retained in front of the sediment, further increasing the number of particles deposited. Behind the sediment, there is a blank area where no particles are deposited due to the obstruction of the sediment. The fluid force on the particles dominates for small-sized particles, and the number of deposits is small. The interception by the sediment at the bottom is the main form of deposition. At the same time, it can be seen that the force between the particles forming the deposit cannot form a stable structure. When
t = 100 min, the contact area between the sediment and the fluid is large; the force between the particles can not resist the fluid force, and the sediment will be decomposed. At this time, the number of deposits will be reduced substantially.
Figure 14 shows the number of deposited particles from 0.3 m to 0.9 m from the inlet at different moments. The number of deposited particles showed an overall linear positive correlation with the deposition time. With time, the number of deposited particles first increased slowly and linearly. When
t = 40 min, the number of deposits began to increase sharply. When
t = 110 min, the number of deposited particles reached a certain number and again showed a slow increase. At the same time, the disintegration of the sediment by the fluid force decreased the number of deposited particles. When
t = 100~120 min, the growth rate of the particles decreased due to the disintegration of many particles, which were taken away. The number of particles deposited is affected by gravity, fluid interaction force, cohesion between particles, and interaction between particles and the pipe surface.
5. Conclusions
This paper investigates the deposition behavior of gangue slurry in a pipeline. The numerical simulation method explains the distribution law of gangue particles in the pipeline under the viscosity change. The research results can be used as a reference for the design and study of gangue slurry grouting systems. The main conclusions are as follows:
(1) Clay minerals in the gangue account for 53.3%, resulting in the gangue particles in the slurry conveying process being prone to expansion, disintegration, and sludging. This will lead to a change in the overall rheological properties of the gangue slurry. The plastic viscosity of the gangue slurry constantly becomes more significant with the increase in mass concentration. The rheology of gangue slurry also changes with time. The viscosity of the slurry is positively correlated with time.
(2) The effect of particle surface energy density on particle distribution is a nonlinear relationship. Gangue slurry with particle sizes greater than 1.0 mm in the pipeline can easily lead to pipeline clogging. Increasing the flow of the slurry through the pipe requires more kinetic energy to be supplied to the slurry. However, this will increase the economic cost.
(3) With the increase in the well inclination angle, the angle between the fluid force and gravity on the particles in the pipeline increases. Gravity causes the particles to continuously undergo sedimentation, inhibiting the particles’ uniform distribution in the pipeline.
(4) The increase in viscosity will lead to a larger shear force on particles. When the viscosity is small, the effect of gravity on large-size particles is more prominent. The particles are transported at the same time as settlement occurs. When the viscosity becomes large, the particles are subjected to shear force and become larger. Compared with gravity, shear force dominates the particle movement state. At that time, the internal distribution of particles inside the pipeline is uniform.
(5) The pressure drop along the pipeline is positively correlated with the slurry flow rate. With the increase in the gangue slurry quality concentration, the pipeline along the pressure drop shows a growing trend. When the flow rate is 1.5 m/s, the pressure drop along the pipeline with a 40% mass concentration is 435 Pa/m, the pressure drop along the pipeline with a 70% mass concentration is 1217 Pa/m, and the pressure drop along the pipeline with a 80% mass concentration is 2634 Pa/m. The pressure drop increases with the increase in the slope angle of the well and reaches the maximum value when the pipeline is horizontally transported.
(6) The morphology of the sediments in the pipeline changes gradually with the increase in the deposition time. The number of deposited particles shows an overall linear positive correlation with the deposition time. With the increase in time, the number of deposited particles first increases slowly, showing a linear relationship. Then, the number of deposits begins to increase rapidly. When the number of deposits reaches a certain number, the trend again shows a slow increase.
Author Contributions
Conceptualization, W.G.; methodology, Y.W.; software, Y.W.; validation, K.M. and Y.W.; formal analysis, D.X.; investigation, Y.W. and D.X.; resources, W.G.; data curation, H.Z. and S.Y.; writing—original draft preparation, Y.W. and Z.H.; writing—review and editing, Y.W.; visualization, Y.W.; supervision, W.G.; project administration, W.G.; funding acquisition, W.G. All authors have read and agreed to the published version of the manuscript.
Funding
This research was funded by the National Natural Science Foundation of China, grant number 52274103.
Data Availability Statement
The raw data supporting the conclusions of this article will be made available by the authors on request. The data are not publicly available due to privacy.
Conflicts of Interest
The authors declare no conflicts of interest.
References
- Wu, D. Mine Waste Management in China: Recent Development; Springer: Singapore, 2020. [Google Scholar]
- Wang, H.; Jiao, J.; Wang, Y.; Du, W. Feasibility of Using Gangue and Fly Ash as Filling Slurry Materials. Processes 2018, 6, 232. [Google Scholar] [CrossRef]
- Yao, Y.; Yan, H.; Chen, J.; Xu, J. Mining-Induced off-Layer Space Evolution Law and Gangue Grouting Filling Control Mechanism. Bull. Eng. Geol. Environ. 2023, 82, 457. [Google Scholar] [CrossRef]
- Wang, X.; Zhang, J.; Li, M.; Gao, F.; Taheri, A.; Huo, B.; Jin, L. Expansion Properties of Cemented Foam Backfill Utilizing Coal Gangue and Fly Ash. Minerals 2022, 12, 763. [Google Scholar] [CrossRef]
- Gu, W.; Chen, L.; Xu, D. Research on the Overburden Movement Law of Thick Coal Seam without-Support Gangue-Filling Mining. Minerals 2022, 13, 53. [Google Scholar] [CrossRef]
- Wang, C.; Yang, J.; Xu, S. Experimental Study of the Mechanical and Microstructure Characteristics of Coal Gangue Road Stabilization Materials Based on Alkali Slag Cementation. Materials 2021, 14, 3601. [Google Scholar] [CrossRef] [PubMed]
- Petlovanyi, M.; Malashkevych, D.; Sai, K.; Bulat, I.; Popovych, V. Granulometric Composition Research of Mine Rocks as a Material for Backfilling the Mined-out Area in Coal Mines. Min. Miner. Depos. 2021, 15, 122–129. [Google Scholar] [CrossRef]
- Acordi, J.; Simão, L.; Faraco, M.N.S.; Borgert, C.H.; Olivo, E.; Montedo, O.R.K.; Raupp-Pereira, F. Waste Valorization of Coal Mining Waste from a Circular Economy Perspective: A Brazilian Case Study Based on Environmental and Physicochemical Features. Resour. Policy 2023, 80, 103243. [Google Scholar] [CrossRef]
- Zhang, X.; Wang, H.; Wu, A. Study on Correlations between Tailings Particle Size Distribution and Rheological Properties of Filling Slurries. Minerals 2023, 13, 1134. [Google Scholar] [CrossRef]
- Zhang, J.Q.; He, X.; Yang, K.; Wei, Z.; Zhao, X.Y.; Fang, J.J. Diffusion Law of Coal Gangue Slurry and the Application of Fluidized Filling Technology of Gangue in Caving Area. Sci. Rep. 2023, 13, 13226. [Google Scholar] [CrossRef]
- Wang, H.; Chen, D.; Guo, R.; Tian, J.; Li, B. A Preliminary Study on the Improvement of Gangue/Tailing Cemented Fill by Bentonite: Flow Properties, Mechanical Properties and Permeability. Materials 2023, 16, 6802. [Google Scholar] [CrossRef]
- Shi, X.; Cai, Q.; Zhang, L.; Chen, Y.; Li, M. Study on Rheological Mechanism of Cement-Coal Gangue Cementitious Material (CGCM) Slurry. Geofluids 2022, 2022, 3236515. [Google Scholar] [CrossRef]
- Feng, G.; Wang, Z.; Qi, T.; Du, X.; Guo, J.; Wang, H.; Shi, X.; Wen, X. Effect of Velocity on Flow Properties and Electrical Resistivity of Cemented Coal Gangue-Fly Ash Backfill (CGFB) Slurry in the Pipeline. Powder Technol. 2022, 396, 191–209. [Google Scholar] [CrossRef]
- Inthavong, K. A Unifying Correlation for Laminar Particle Deposition in 90-Degree Pipe Bends. Powder Technol. 2019, 345, 99–110. [Google Scholar] [CrossRef]
- Wu, B.; Wang, X.; Liu, X.; Xu, G.; Zhu, S. Numerical Simulation of Erosion and Fatigue Failure the Coal Gangue Paste Filling Caused to Pumping Pipes. Eng. Fail. Anal. 2022, 134, 106081. [Google Scholar] [CrossRef]
- Krishna, R.; Kumar, N.; Gupta, P.K. Numerical Study of Wall Erosion Using Energy Approach for the Flow of Dense Slurry in 90° Horizontal Pipe Bend. Powder Technol. 2023, 426, 118623. [Google Scholar] [CrossRef]
- Gu, W.; Zhu, L.; Song, T. Research on Key Parameters of Pipeline Transportation of Waste Rock Treatment in Underground Residual Space. Front. Earth Sci. 2023, 10, 1098674. [Google Scholar] [CrossRef]
- Sun, K.; Wu, X. Experimental Study on Rheological Properties of Coal Gangue Slurry Based on Response Surface Methodology. Processes 2023, 11, 1205. [Google Scholar] [CrossRef]
- Sun, Z.; Chen, L.; Ma, G.; Zhang, J.; Zhang, S.; Ma, H.; Li, P.; Gao, K. Flow Characteristics of Moist-Mixed Materials for Shotcrete: From Experiment to CFD-DEM Simulation. Powder Technol. 2023, 428, 118821. [Google Scholar] [CrossRef]
- Cheng, B.; Li, H.; Pan, G.; Deng, R.; Gong, Y.; Xu, S.; Zhou, K.; Zheng, Z. Study on Hydrodynamic Diffusion Law of the Swelling Particle Slurry in Karst Pipeline. Particuology 2024, 87, 218–231. [Google Scholar] [CrossRef]
- Chen, Q.; Xiong, T.; Zhang, X.; Jiang, P. Study of the Hydraulic Transport of Non-Spherical Particles in a Pipeline Based on the CFD-DEM. Eng. Appl. Comput. Fluid Mech. 2020, 14, 53–69. [Google Scholar] [CrossRef]
- Li, X.; Li, C.; Ruan, Z.; Yan, B.; Hou, H.; Chen, L. Analysis of Particle Migration and Agglomeration in Paste Mixing Based on Discrete Element Method. Constr. Build. Mater. 2022, 352, 129007. [Google Scholar] [CrossRef]
- Wang, Y.; Wang, D.; Gao, C.; Xiong, S. Numerical Study on Deposition Behavior of Micron-Sized Suspended Solids in Broken Rock Mass within a Goaf Based on Coupled CFD-DEM Method. Water 2023, 15, 2314. [Google Scholar] [CrossRef]
- Yang, Y.; Li, X.G.; Li, H.Y.; Guo, Y.D.; Fang, Y.R. Assessing Clogging Potential and Optimizing Driving Parameter of Slurry Shield Tunneling in Clay Stratum Assisted with CFD-DEM Modeling. Undergr. Space 2024, 14, 197–218. [Google Scholar] [CrossRef]
- Zeng, D.; Zhang, E.; Ding, Y.; Yi, Y.; Xian, Q.; Yao, G.; Zhu, H.; Shi, T. Investigation of Erosion Behaviors of Sulfur-Particle-Laden Gas Flow in an Elbow via a CFD-DEM Coupling Method. Powder Technol. 2018, 329, 115–128. [Google Scholar] [CrossRef]
- Zhou, G.; Liu, Y.; Sun, B.; Liu, Z.; Xu, C.; Liu, R.; Zhang, Q.; Wang, Y. Study on the Fine Particles Deposition Law in the Bronchus of Miners Affected by Dust Pollution in the Anchor Excavation Working Environment. J. Mol. Liq. 2024, 393, 123620. [Google Scholar] [CrossRef]
- Liu, P.; Sun, M.; Chen, Z.; Zhang, S.; Zhang, F.S.; Chen, Y.; Chen, W.; Bate, B. Influencing Factors on Fines Deposition in Porous Media by CFD–DEM Simulation. Acta Geotech. 2023, 18, 4539–4563. [Google Scholar] [CrossRef]
- Liu, P.; Nie, S.; Wang, W.; Zhang, S.; Bate, B.; Chen, Y. CFD-DEM Study on Transport and Retention Behaviors of NZVI-Clay Colloids in Porous Media. J. Hazard. Mater. 2024, 465, 133048. [Google Scholar] [CrossRef] [PubMed]
- Joshi, T.; Parkash, O.; Gallegos, R.K.B.; Krishan, G. Parametric Investigation of Slurry Transport: Computational Insight into the Impact of Particle Composition and Prandtl Numbers. Phys. Fluids 2024, 36, 023308. [Google Scholar] [CrossRef]
- Joshi, T.; Parkash, O.; Krishan, G. Slurry Flow Characteristics through a Horizontal Pipeline at Different Prandtl Number. Powder Technol. 2023, 413, 118008. [Google Scholar] [CrossRef]
- Joshi, T.; Parkash, O.; Krishan, G.; Murthy, A.A. Numerical Investigation of Bi-Model Slurry Transportation through Horizontal Pipe Bend. Powder Technol. 2023, 418, 118284. [Google Scholar] [CrossRef]
- Joshi, T.; Parkash, O.; Murthy, A.A.; Krishan, G. Numerical Investigation of Bi-Model Slurry Transportation in a Straight Pipe. Results Eng. 2023, 17, 100858. [Google Scholar] [CrossRef]
- Liu, K.; Sheng, J.J.; Zhang, Z. A Simulation Study of the Effect of Clay Swelling on Fracture Generation and Porosity Change in Shales under Stress Anisotropy. Eng. Geol. 2020, 278, 105829. [Google Scholar] [CrossRef]
- Zhang, Y.; Zhang, W.; Wang, K.; Xie, K.; Song, K.; Wang, Y. Hydromechanical Properties and Engineering Applications of Weakly Cemented Soft Rock in Jurassic Strata. ACS Omega 2023, 8, 16373–16383. [Google Scholar] [CrossRef]
- Joshi, T.; Parkash, O.; Krishan, G. Estimation of Energy Consumption and Transportation Characteristics for Slurry Flow through a Horizontal Straight Pipe Using Computational Fluid Dynamics. Phys. Fluids 2023, 35, 053303. [Google Scholar] [CrossRef]
- Joshi, T.; Parkash, O.; Krishan, G. CFD Modeling for Slurry Flow through a Horizontal Pipe Bend at Different Prandtl Number. Int. J. Hydrogen Energy 2022, 47, 23731–23750. [Google Scholar] [CrossRef]
- Ergun, S.; Orning, A.A. Fluid flow through randomly packed columns and fluidized beds. Ind. J. Eng. Chem. 1949, 41, 1179–1184. [Google Scholar] [CrossRef]
- Marshall, J.S. Discrete-Element Modeling of Particulate Aerosol Flows. J. Comput. Phys. 2009, 228, 1541–1561. [Google Scholar] [CrossRef]
- Wang, Y.; Wang, G.; Wu, S.; Liu, Z.; Fang, Y. A Calibration Method for Ore Bonded Particle Model Based on Deep Learning Neural Network. Powder Technol. 2023, 420, 118417. [Google Scholar] [CrossRef]
- Shang, X.Y.; Zhao, K.; Qian, W.X.; Zhu, Q.Y.; Zhou, G.Q. On the Calculation of van Der Waals Force between Clay Particles. Minerals 2020, 10, 993. [Google Scholar] [CrossRef]
- Ma, G.; Sun, Z.; Ma, H.; Li, P. Calibration of Contact Parameters for Moist Bulk of Shotcrete Based on EDEM. Adv. Mater. Sci. Eng. 2022, 2022, 6072303. [Google Scholar] [CrossRef]
- Zhang, J.; Chang, Z.; Niu, F.; Chen, Y.; Wu, J.; Zhang, H. Simulation and Validation of Discrete Element Parameter Calibration for Fine-Grained Iron Tailings. Minerals 2023, 13, 58. [Google Scholar] [CrossRef]
- Aikins, K.A.; Ucgul, M.; Barr, J.B.; Jensen, T.A.; Antille, D.L.; Desbiolles, J.M.A. Determination of Discrete Element Model Parameters for a Cohesive Soil and Validation through Narrow Point Opener Performance Analysis. Soil Tillage Res. 2021, 213, 105123. [Google Scholar] [CrossRef]
- Yang, L.; Li, J.; Lai, Q.; Zhao, L.; Li, J.; Zeng, R.; Zhang, Z. Discrete Element Contact Model and Parameter Calibration for Clayey Soil Particles in the Southwest Hill and Mountain Region. J. Terramech. 2024, 111, 73–87. [Google Scholar] [CrossRef]
| Disclaimer/Publisher’s Note: The statements, opinions and data contained in all publications are solely those of the individual author(s) and contributor(s) and not of MDPI and/or the editor(s). MDPI and/or the editor(s) disclaim responsibility for any injury to people or property resulting from any ideas, methods, instructions or products referred to in the content. |
© 2024 by the authors. Licensee MDPI, Basel, Switzerland. This article is an open access article distributed under the terms and conditions of the Creative Commons Attribution (CC BY) license (https://creativecommons.org/licenses/by/4.0/).


