Article

Immobilization Forms of Cadmium and Mercury in a Potassium-Activated Metakaolin-Based Geopolymer

1
Division of Sustainable Resources Engineering, Graduate School of Engineering, Hokkaido University, Sapporo 060-8628, Japan
2
Division of Sustainable Resources Engineering, Faculty of Engineering, Hokkaido University, Sapporo 060-8628, Japan
*
Authors to whom correspondence should be addressed.
Minerals 2024, 14(3), 311; https://doi.org/10.3390/min14030311
Submission received: 16 February 2024 / Revised: 11 March 2024 / Accepted: 13 March 2024 / Published: 15 March 2024
(This article belongs to the Special Issue Environmental Mineralogy, 2nd Edition)

Abstract

:
Previous studies of cadmium and mercury immobilization in geopolymers have produced inconsistent results due to their different pozzolans, metal concentrations, and mixing procedures. Understanding the effects of these parameters on heavy metal immobilization is key to predicting their long-term stability. In this study, cadmium and mercury were incorporated into a metakaolin-based K-activated geopolymer by three mixing procedures and concentrations of 0.02–1.00 wt.%. The samples were then immersed in water for 90 d to determine their stability. The results show that mercury is readily leached from the geopolymer, but cadmium is retained. Adding the heavy metals in salt form converts the metals into cadmium hydroxide and mercury oxide that reside at the bottom of the geopolymer. Mixing the salts with water forms soluble heavy metals prior to geopolymerization. This procedure produces more-homogeneous geopolymers. Cadmium is associated with silicate and aluminate, giving a better stability, whereas mercury forms mercury oxide. Different cadmium and mercury concentrations do not change the metal speciation as mercury is affected by relativistic contribution.

Graphical Abstract

1. Introduction

Cadmium and mercury are heavy metals with high levels of toxicity [1]. Exposure to cadmium can damage the skeleton, kidneys, liver, and respiratory and cardiovascular systems. Mercury causes adverse health effects to the kidneys, liver, lungs, and reproductive and nervous systems [2]. These elements are contained in various industrial wastes, such as fly ash and wastewater [3,4,5]. Iron adsorbent sludge from wastewater treatment and fly ash are usually disposed of in landfills [6]. As such, the leaching of heavy metals from fly ash is possible, because some metals occur as soluble chloride or sulfate salts [7,8]. The adsorbed heavy metals can also undergo desorption [9]. These solid wastes require safe solidification/stabilization techniques to prevent secondary waste contamination.
Geopolymers are one option for the solidification/stabilization of solid wastes, as they possess excellent properties, including acid and thermal resistance, low permeability, and low CO2 emissions as compared with Portland cement [10]. Geopolymers are an alkali-activated material with little or no calcium that have a three-dimensional framework developed by the dissolution, polycondensation, and hardening of an aluminosilicate precursor in an alkali activator [10,11,12]. This material has a negative charge from the aluminate tetrahedral structure that is balanced by Na+ or K+ from the activator [13]. A Na-geopolymer is structurally similar to zeolite and can transform into this secondary stable phase, even at low temperatures [14]. Compared with Na-geopolymer, K-geopolymer remains amorphous and is denser and stronger [14,15,16].
Previous studies have investigated the ability of Na-geopolymer to immobilize heavy metals, but none has investigated K-geopolymer. Although further study of heavy metal retention during the transformation of Na-geopolymer to zeolite is required, Na-geopolymer has an excellent ability to retain metal cations [17]. The cations are thought to be retained by: (1) ion exchange; (2) covalent bonding to the aluminosilicate network; (3) precipitation as hydroxides, silicates, or carbonates; and (4) physical encapsulation by the low-permeability geopolymer [18]. Covalent bonding is thought to be the most favorable for stabilizing the heavy metals. Potassium-geopolymer may retain such bonding on longer timescales due to its stability.
Previous studies have proposed different immobilization mechanisms for cadmium and mercury (Table 1). This is possibly due to variations in the pozzolan and heavy metal concentrations in the different studies. The presence of calcium in pozzolan leads to the formation of a complex C–(A)–S–H system that participates in metal immobilization [19,20]. Heavy metal speciation is also controlled by the metals’ activity in a system, which is correlated with their concentration. In addition to these factors, the mixing procedure might also influence the results. Zhang et al. [21] mixed pozzolans with cadmium nitrate and added the Na-activator later. This process made the cadmium form a hydroxide precipitate. Distinctly, El-Eswed et al. [22] mixed cadmium nitrate with water before adding the pozzolans. The addition of the Na-activator then followed this step. This procedure incorporated cadmium into the alkali-activated material through an exchange with other cations. The mixing variance is also found in the effort to immobilize mercury. Donatello et al. [20] mixed mercury (II) chloride with a pozzolan before adding the alkali activator. In contrast, Qian et al. [23] first added mercury (II) nitrate to the alkali activator. While both procedures led to similar immobilization mechanisms for mercury oxide and mercury silicate, other mechanisms also occurred, such as incorporation into C–S–H, absorption onto N–A–S–H, and HgS precipitation. These results highlight the influence of the pozzolan composition.
Predicting the long-term stability of heavy metals in a geopolymer is challenging because the immobilization forms are not entirely conclusive. As such, the effects of heavy metal concentrations and the mixing processes need to be investigated. This was difficult in previous studies due to the use of various aluminosilicate precursors for the geopolymer production. In this study, a metakaolin-based geopolymer was used as the standard geopolymer. In addition, metakaolin, which consists mainly of silica and alumina, produces a model geopolymer system that is easy to characterize [16]. We also focused on a K-geopolymer rather than a Na-geopolymer to fill the research gap.

2. Materials and Methods

2.1. Materials

Metakaolin from Sobueclay Co., Ltd. (Nagoya, Japan) was used as the aluminosilicate precursor for the geopolymer. The metakaolin has a chemical composition of mainly SiO2 and Al2O3, with minimal CaO (Table 2). The alkali activator used in the manufacturing process was a mixture of potassium silicate solution, potassium hydroxide, and ultra-pure water. The molar ratio of SiO2:K2O:H2O was kept constant at 1:1:13 to ensure the highest workability of the geopolymer [11]. Potassium silicate solution was obtained from Fujifilm Wako Pure Chemical Corporation, Osaka, Japan, with K2O and SiO2 contents of 21.90 and 29.00 wt.%, respectively. The potassium hydroxide was obtained from Kanto Chemical Co., Inc., Tokyo, Japan, and had a purity of 86.0 wt.%. Cadmium chloride 2.5-hydrate with a purity of 98.0% (Kanto Chemical Co., Inc., Japan) and mercury (II) chloride with a purity of 99.5 wt.% (Fujifilm Wako Pure Chemical Corporation, Japan) were used as artificial pollutants.

2.2. Methods

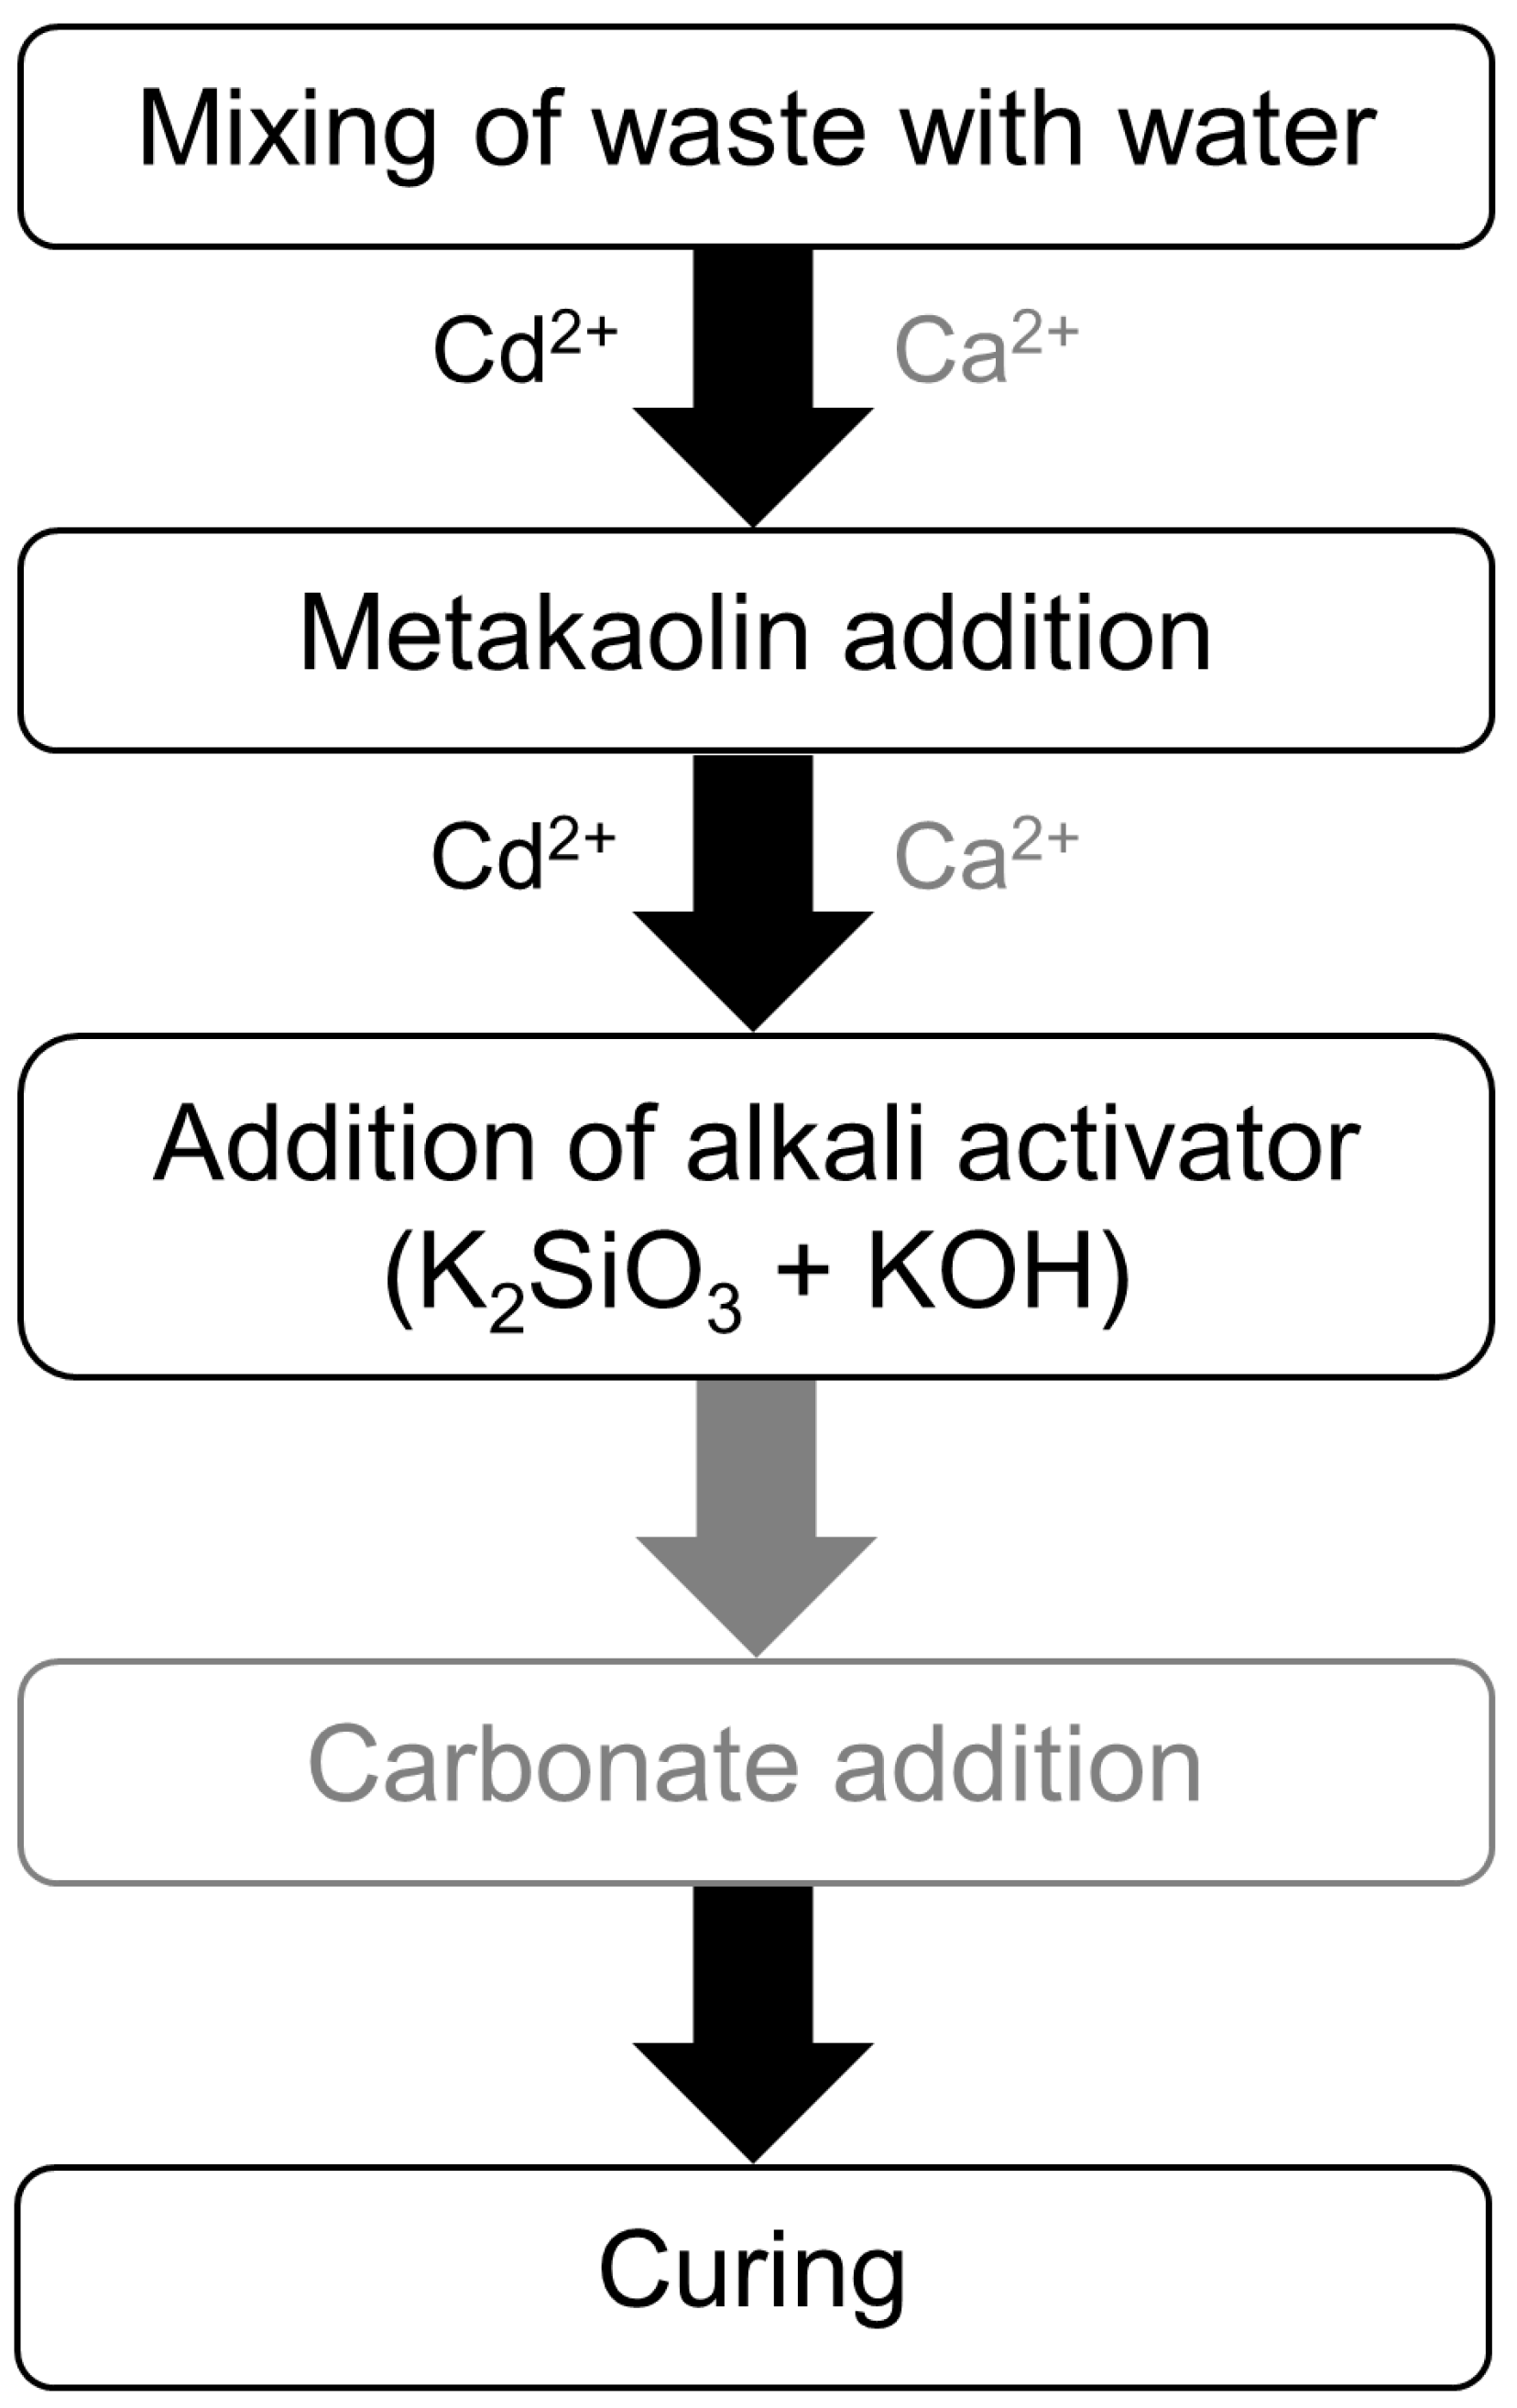
2.2.1. Sample Preparation

A geopolymer control was made by mixing 1.3 g of metakaolin with an alkali activator containing 1.2 g of potassium silicate and 0.4 g of potassium hydroxide. The amount of this alkali activator was adjusted to the Al2O3 content in the metakaolin to obtain an Al2O3:K2O molar ratio of 1. The mixture was stirred for 15 min, poured into PVC molds (1.3 cm diameter × 1.5 cm height), and covered with parafilm on both sides. The samples were cured for 24 h at 40 °C and another 24 h at 25 °C before demolding. The upper and bottom parts of the hardened samples were then separated for solid analysis.
Cadmium and mercury geopolymers were produced using three different mixing procedures, namely Salt, Ion, and Salt-AA.
i.
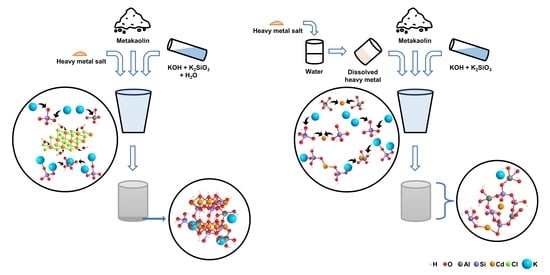
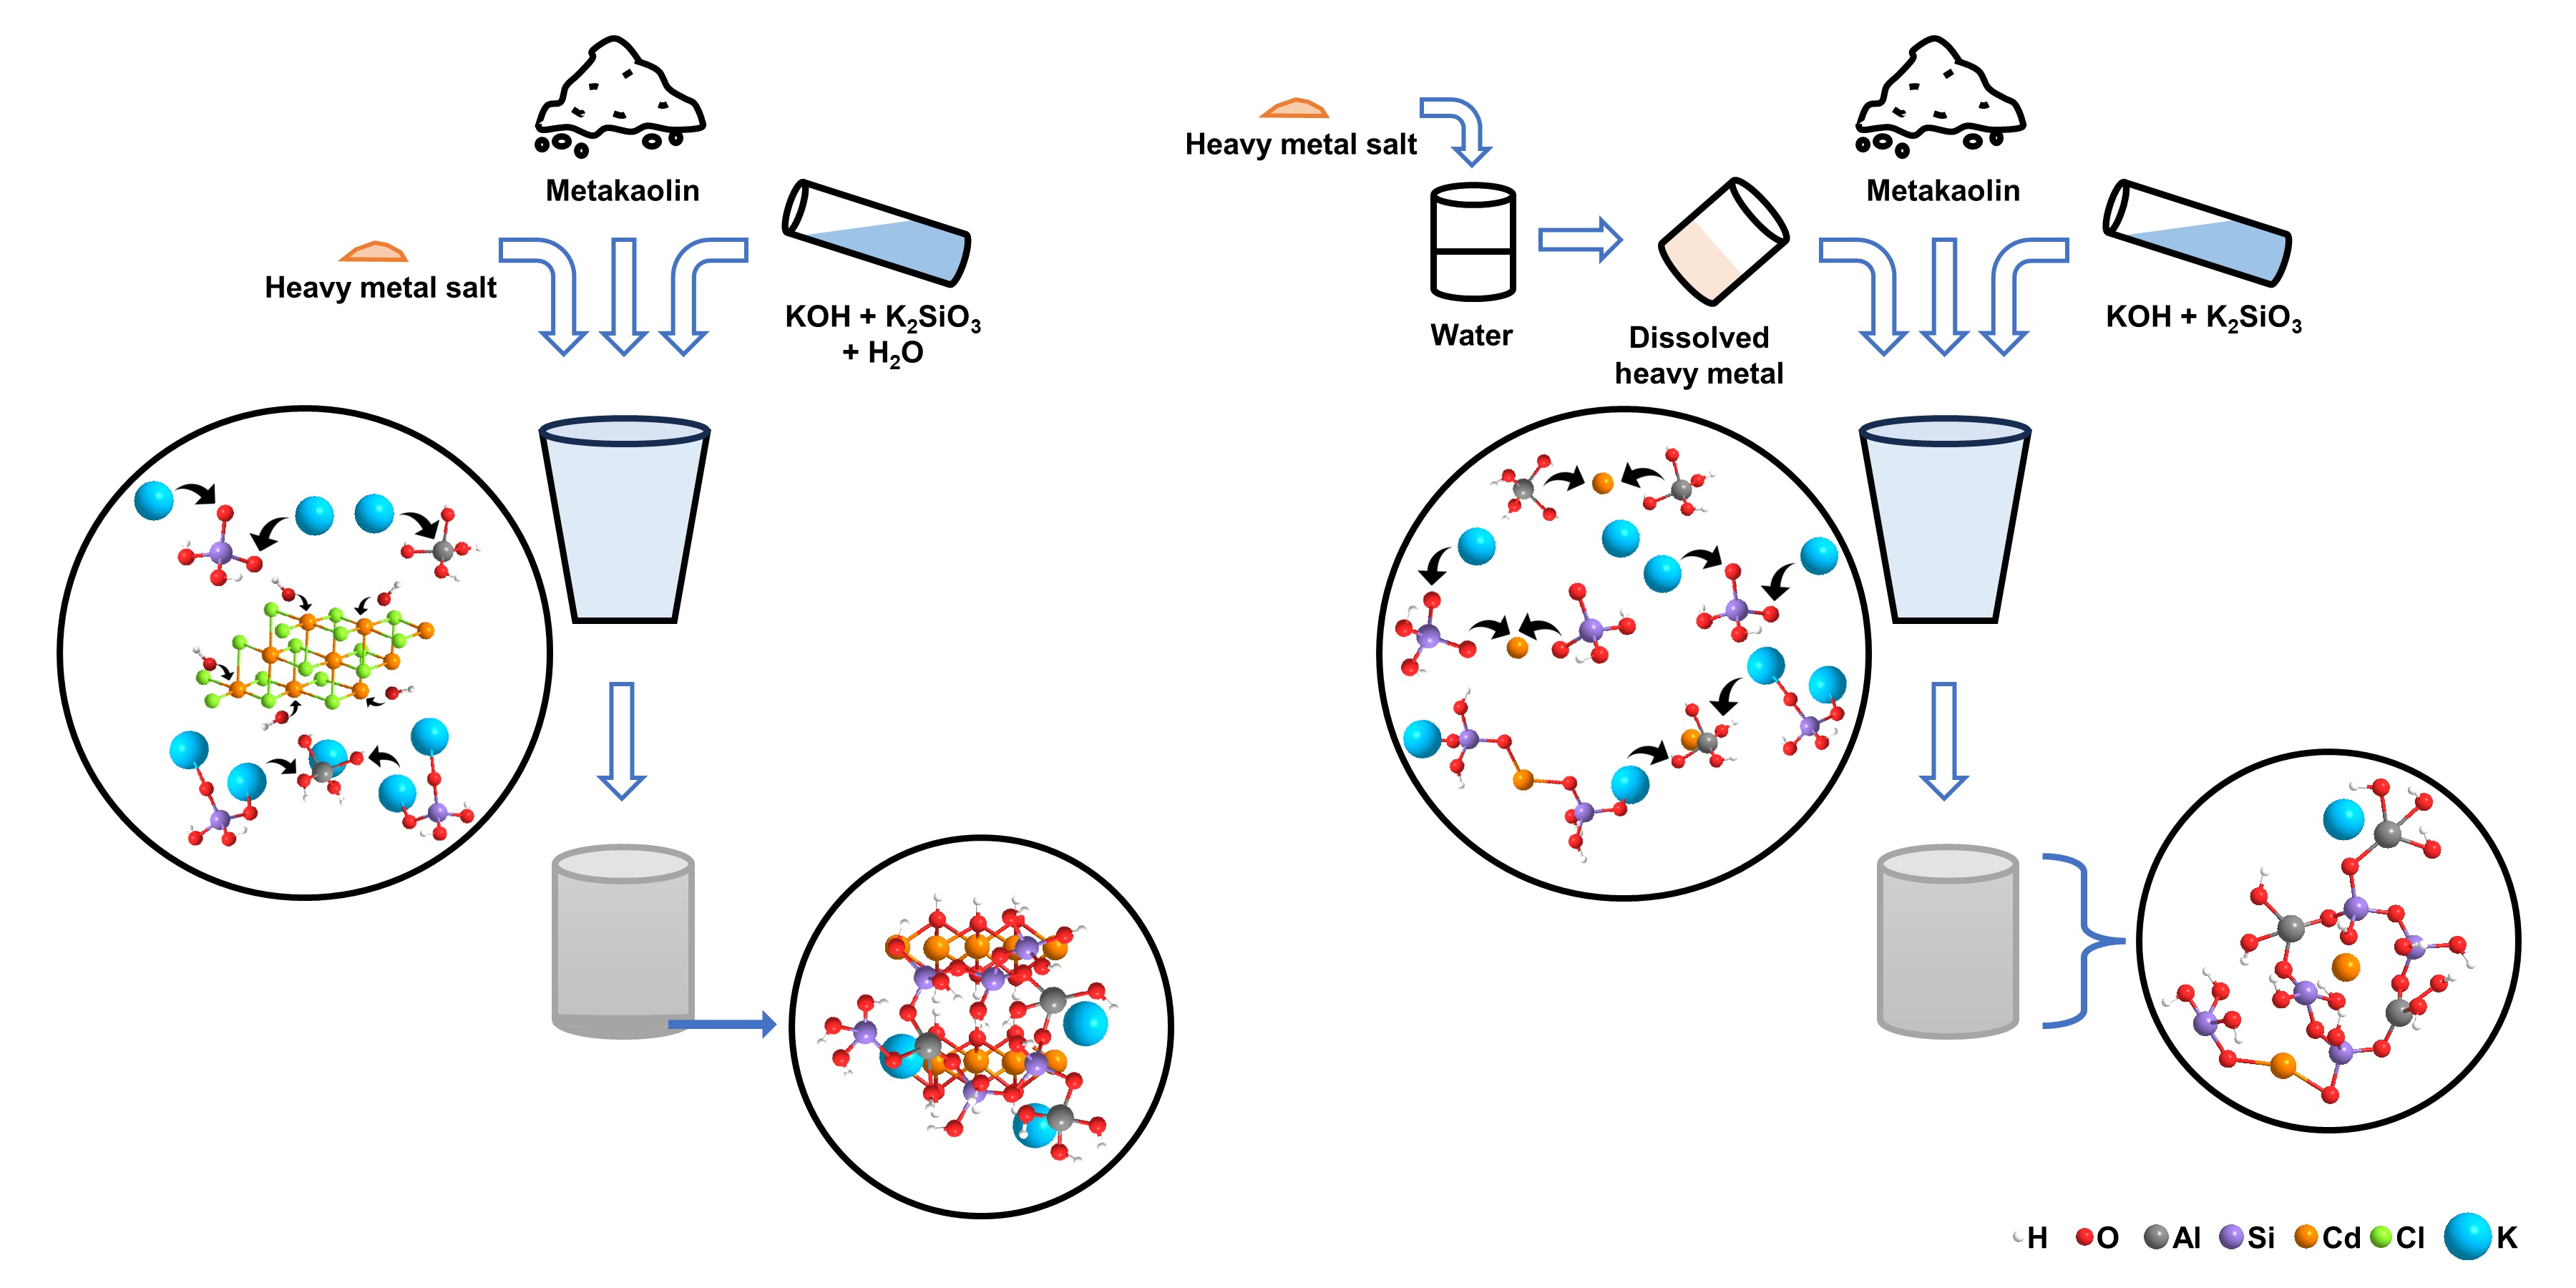
Salt: The heavy metal was solid mixed with metakaolin in its original salt form. The mixture was then blended with the alkali activator before molding.
ii.
Ion: The heavy metal–geopolymer was prepared in a similar way to Salt mixing procedure, but the heavy metal salt was first dissolved in ultra-pure water. The solution was then poured onto metakaolin and later added to a mixture of potassium hydroxide and potassium silicate.
iii.
Salt-AA: The heavy metal–geopolymer was produced in reverse order to the Salt mixing procedure, as the salt was first mixed with the alkali activator before being combined with metakaolin.
The above procedures were followed by the same method to make geopolymer control.
The experiments were carried out at a heavy metal concentration of 0.5 wt.%. Further experiments using the Ion mixing procedure were then conducted at other concentrations ranging from 0.02 to 1.00 wt.%. Figure 1 shows the initial concentrations and pH values in the experiments, as well as the predicted forms of cadmium and mercury.

2.2.2. Leaching Test

A leaching test was performed using the standard from the American Nuclear Society (ANSI/ANS-16.1-2003). Geopolymer samples weighing 3.4 g each were submerged in 88 mL of deionized water and then moved into a new batch of deionized water after 30 s, 2 h, 7 h, and 1, 2, 3, 4, 5, 19, 47, and 90 d. The temperature during leaching was kept constant at 25 °C.

2.2.3. Liquid Sample Analysis

The pH values of the leachates were measured with a W-22XD pH meter (Horiba, Kyoto, Japan). Heavy metal concentrations in the leachates were analyzed using an iCAP RQplus inductively coupled plasma mass spectrometry (ICP-MS; Thermo Scientific, Tokyo, Japan). The general-purpose mixed standard solution (XSTC-331; SPEX CertiPrep, Seishin Trading Co., Ltd., Kobe, Japan) and a mercury standard solution (Hg 1000; Fujifilm Wako Pure Chemical Corporation, Osaka, Japan) were used to make a calibration standard containing 0.01–10 ppb cadmium and mercury. Indium and bismuth were used as internal standards.

2.2.4. Solid Sample Analysis

The geopolymer control, cadmium geopolymer, and mercury geopolymer samples were analyzed by X-ray diffraction (RINT2100; Rigaku, Tokyo, Japan) to determine their crystallography. The CuKα radiation source was operated at 30 kV and 20 mA. The scanning was conducted at 0.02°/s at 2θ = 2°–70°. Samples were also examined with a XploRA PLUS Raman microscope (Horiba, Japan). The spectra were collected using a 532 nm excitation wavelength with a 50× objective lens, 100 µm entrance slit, and 1800 groove/mm grating. The surface composition and chemical state of the geopolymers were determined with a JPS-9200 X-ray photoelectron spectrometer (XPS; JEOL, Tokyo, Japan). Powdered samples were attached to carbon tape and subjected to MgKα radiation at 12 kV and 25 mA. The analyses were carried out over a 3 mm measurement area with a pass energy of 10 eV, 0.1 eV energy step, and dwell time of 0.1 s. The binding energy was calibrated based on the carbon 1s peak at 284.8 eV. The geopolymer morphology, crystallography, and chemical composition on the nano-scale were investigated with a JEM-2010 transmission electron microscope (TEM; JEOL, Tokyo, Japan) at an accelerating voltage of 200 kV.

3. Results and Discussion

3.1. Effect of Mixing Procedure

3.1.1. Effect of Mixing Procedure on Cadmium Immobilization

All the mixing procedures yielded high immobilization efficiencies with <0.012% of the cadmium leached at the end of the leaching test. Although all procedures resulted in very low levels of leaching, differences in leaching behavior were observed (Figure 2a). The Salt and Salt-AA mixing procedures yielded similar results, in which the amount of leached cadmium increased after 90 d of leaching. In comparison, the Ion mixing procedure resulted in more constant cadmium leaching from day 19 onwards. These differences occurred even when the leachate pH values were similar, and which decreased over time from 12 to ~8.5 (Figure 2b). The results indicate that the Salt and Salt-AA procedures produce strongly pH-dependent cadmium species, whereas the Ion mixing procedure does not.
The X-ray diffraction patterns (Figure 3) are consistent with the leaching data, because the Salt and Salt-AA samples are similar to each other and different to the Ion samples. All samples exhibit a broad hump in the patterns centered at ~28°. This hump is due to amorphous silica and is a characteristic of the geopolymer peak [25]. In addition, the samples made by the Salt and Salt-AA mixing procedures exhibit sharp peaks at 18.9°, 29.5°, 35.3°, 49.0°, 52.3°, and 56.1° due to the presence of Cd(OH)2 (Figure 3a,c). Both procedures resulted in the formation of Cd(OH)2, which later settles into the bottom part of the geopolymer due to its high density. Unlike Salt and Salt-AA, the Ion mixing procedure does not lead to Cd(OH)2 formation.
Raman spectroscopy was used to detect changes in covalent bonds due to cadmium incorporation. The control sample exhibits prominent peaks at 396, 502, 570, and 637 cm−1, which correspond to the Si–O–Al bending mode, Si–O–Si stretching vibration from long chains (C5,6,7) and short chains, and T–O symmetric stretching mode [26,27,28,29]. The 851 and 1056 cm−1 peaks are due to Si–O symmetric stretching of Q1 and Q3 [28]. The upper parts of the Salt, Ion, and Salt-AA samples have similar spectra to the geopolymer control sample, suggesting that no differences in covalent bonds can be observed by Raman spectroscopy (Figure 4b). The bottom parts of the Ion samples also have identical spectra (Figure 4a). However, a new peak at 231 cm−1 characterizes the Salt and Salt-AA samples. The original geopolymer peak at 396 cm−1, corresponding to the Si–O–Al bending mode for these samples, is also accompanied by a high-intensity peak at 382 cm−1. Both sharp peaks correspond to the vibrational modes of the Cd(OH)2 lattice [30]. Similar to the XRD results, Cd(OH)2 was only observed at the bottom parts of samples made by the Salt and Salt-AA mixing procedures. Hydroxide formation can explain the increasing leaching of these samples. After 90 d of leaching, the leachate pH is as low as 8.5, which triggers dissolution of Cd(OH)2 into its ionic constituents (Figure 1a).

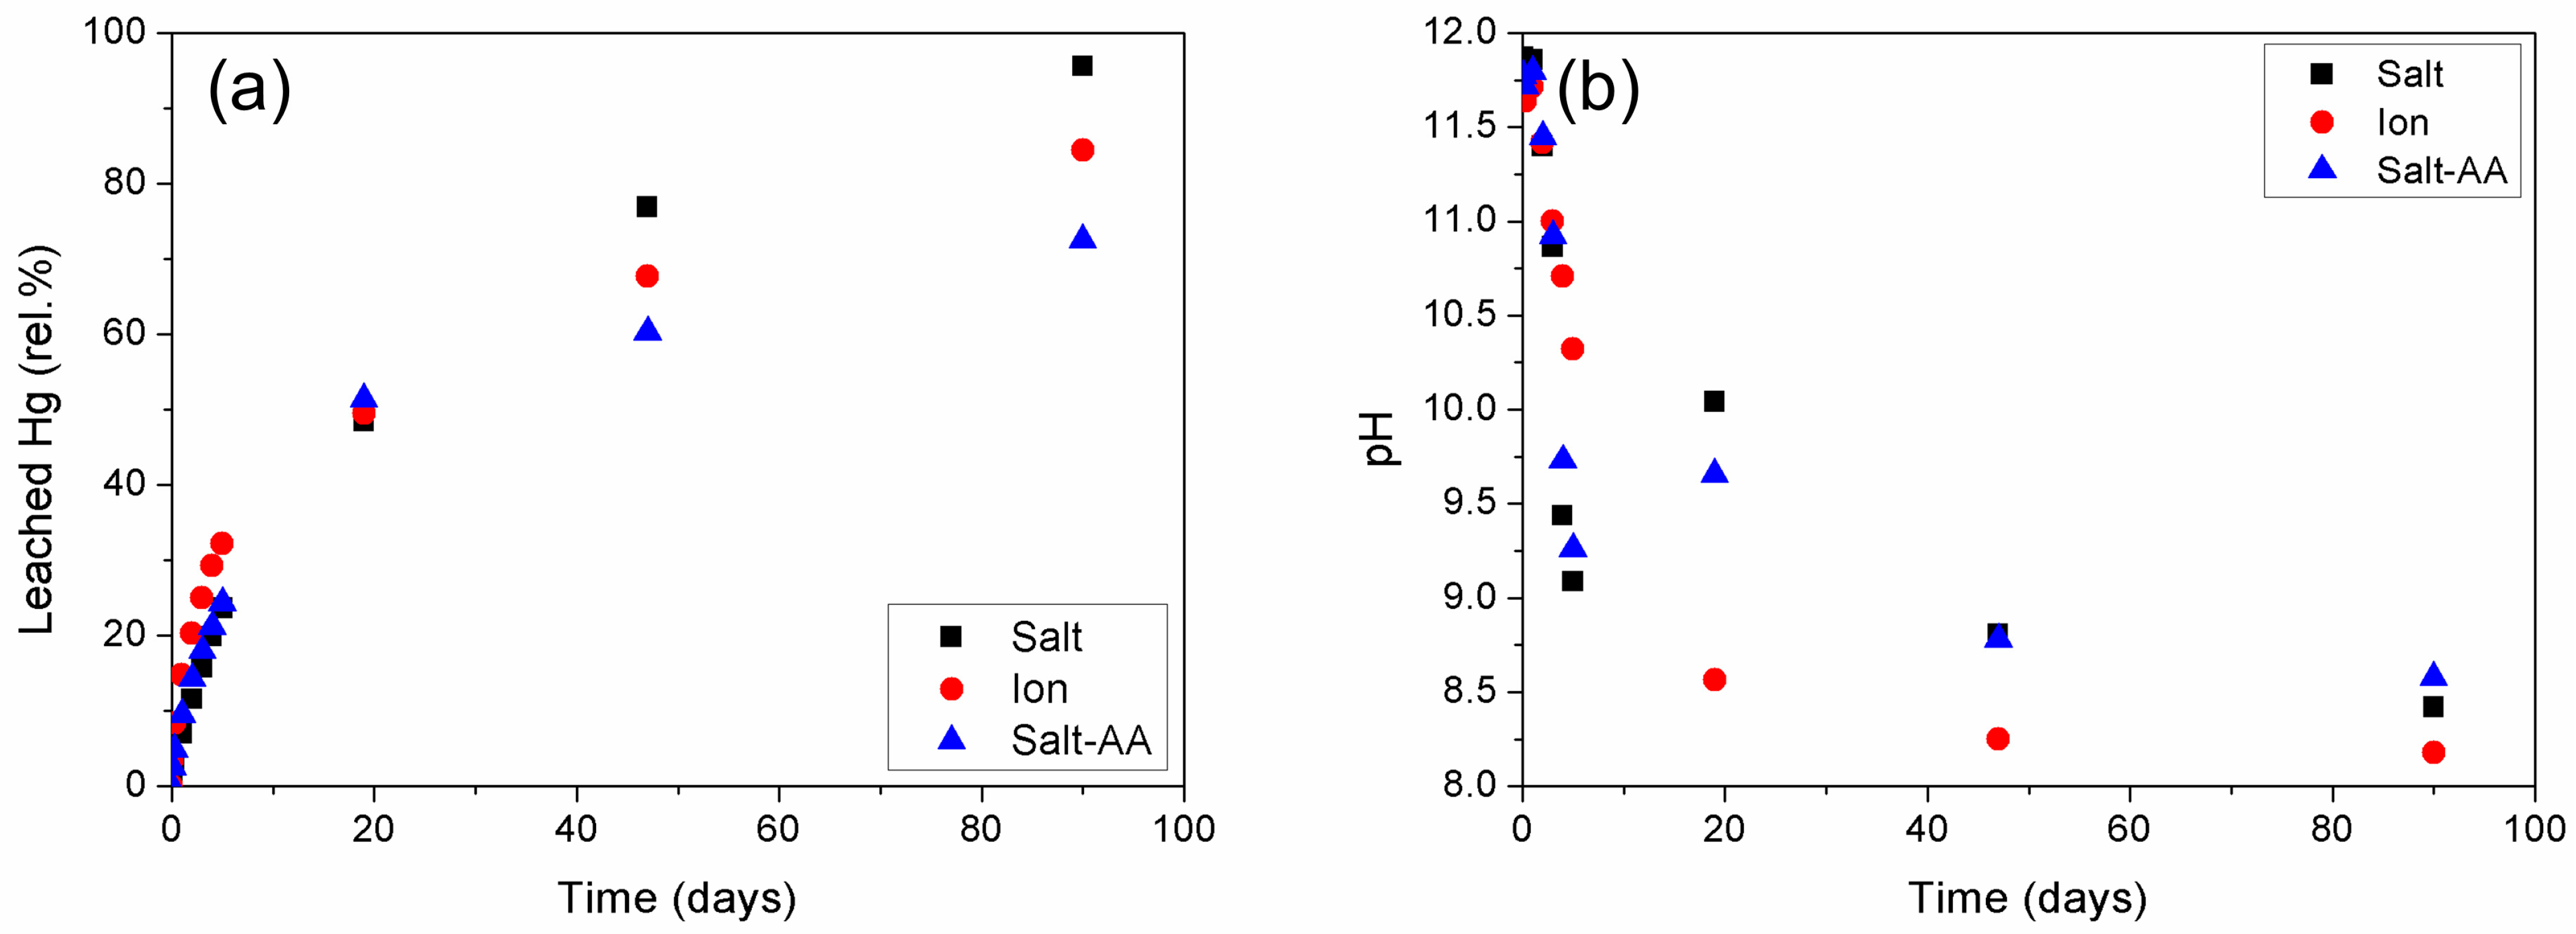
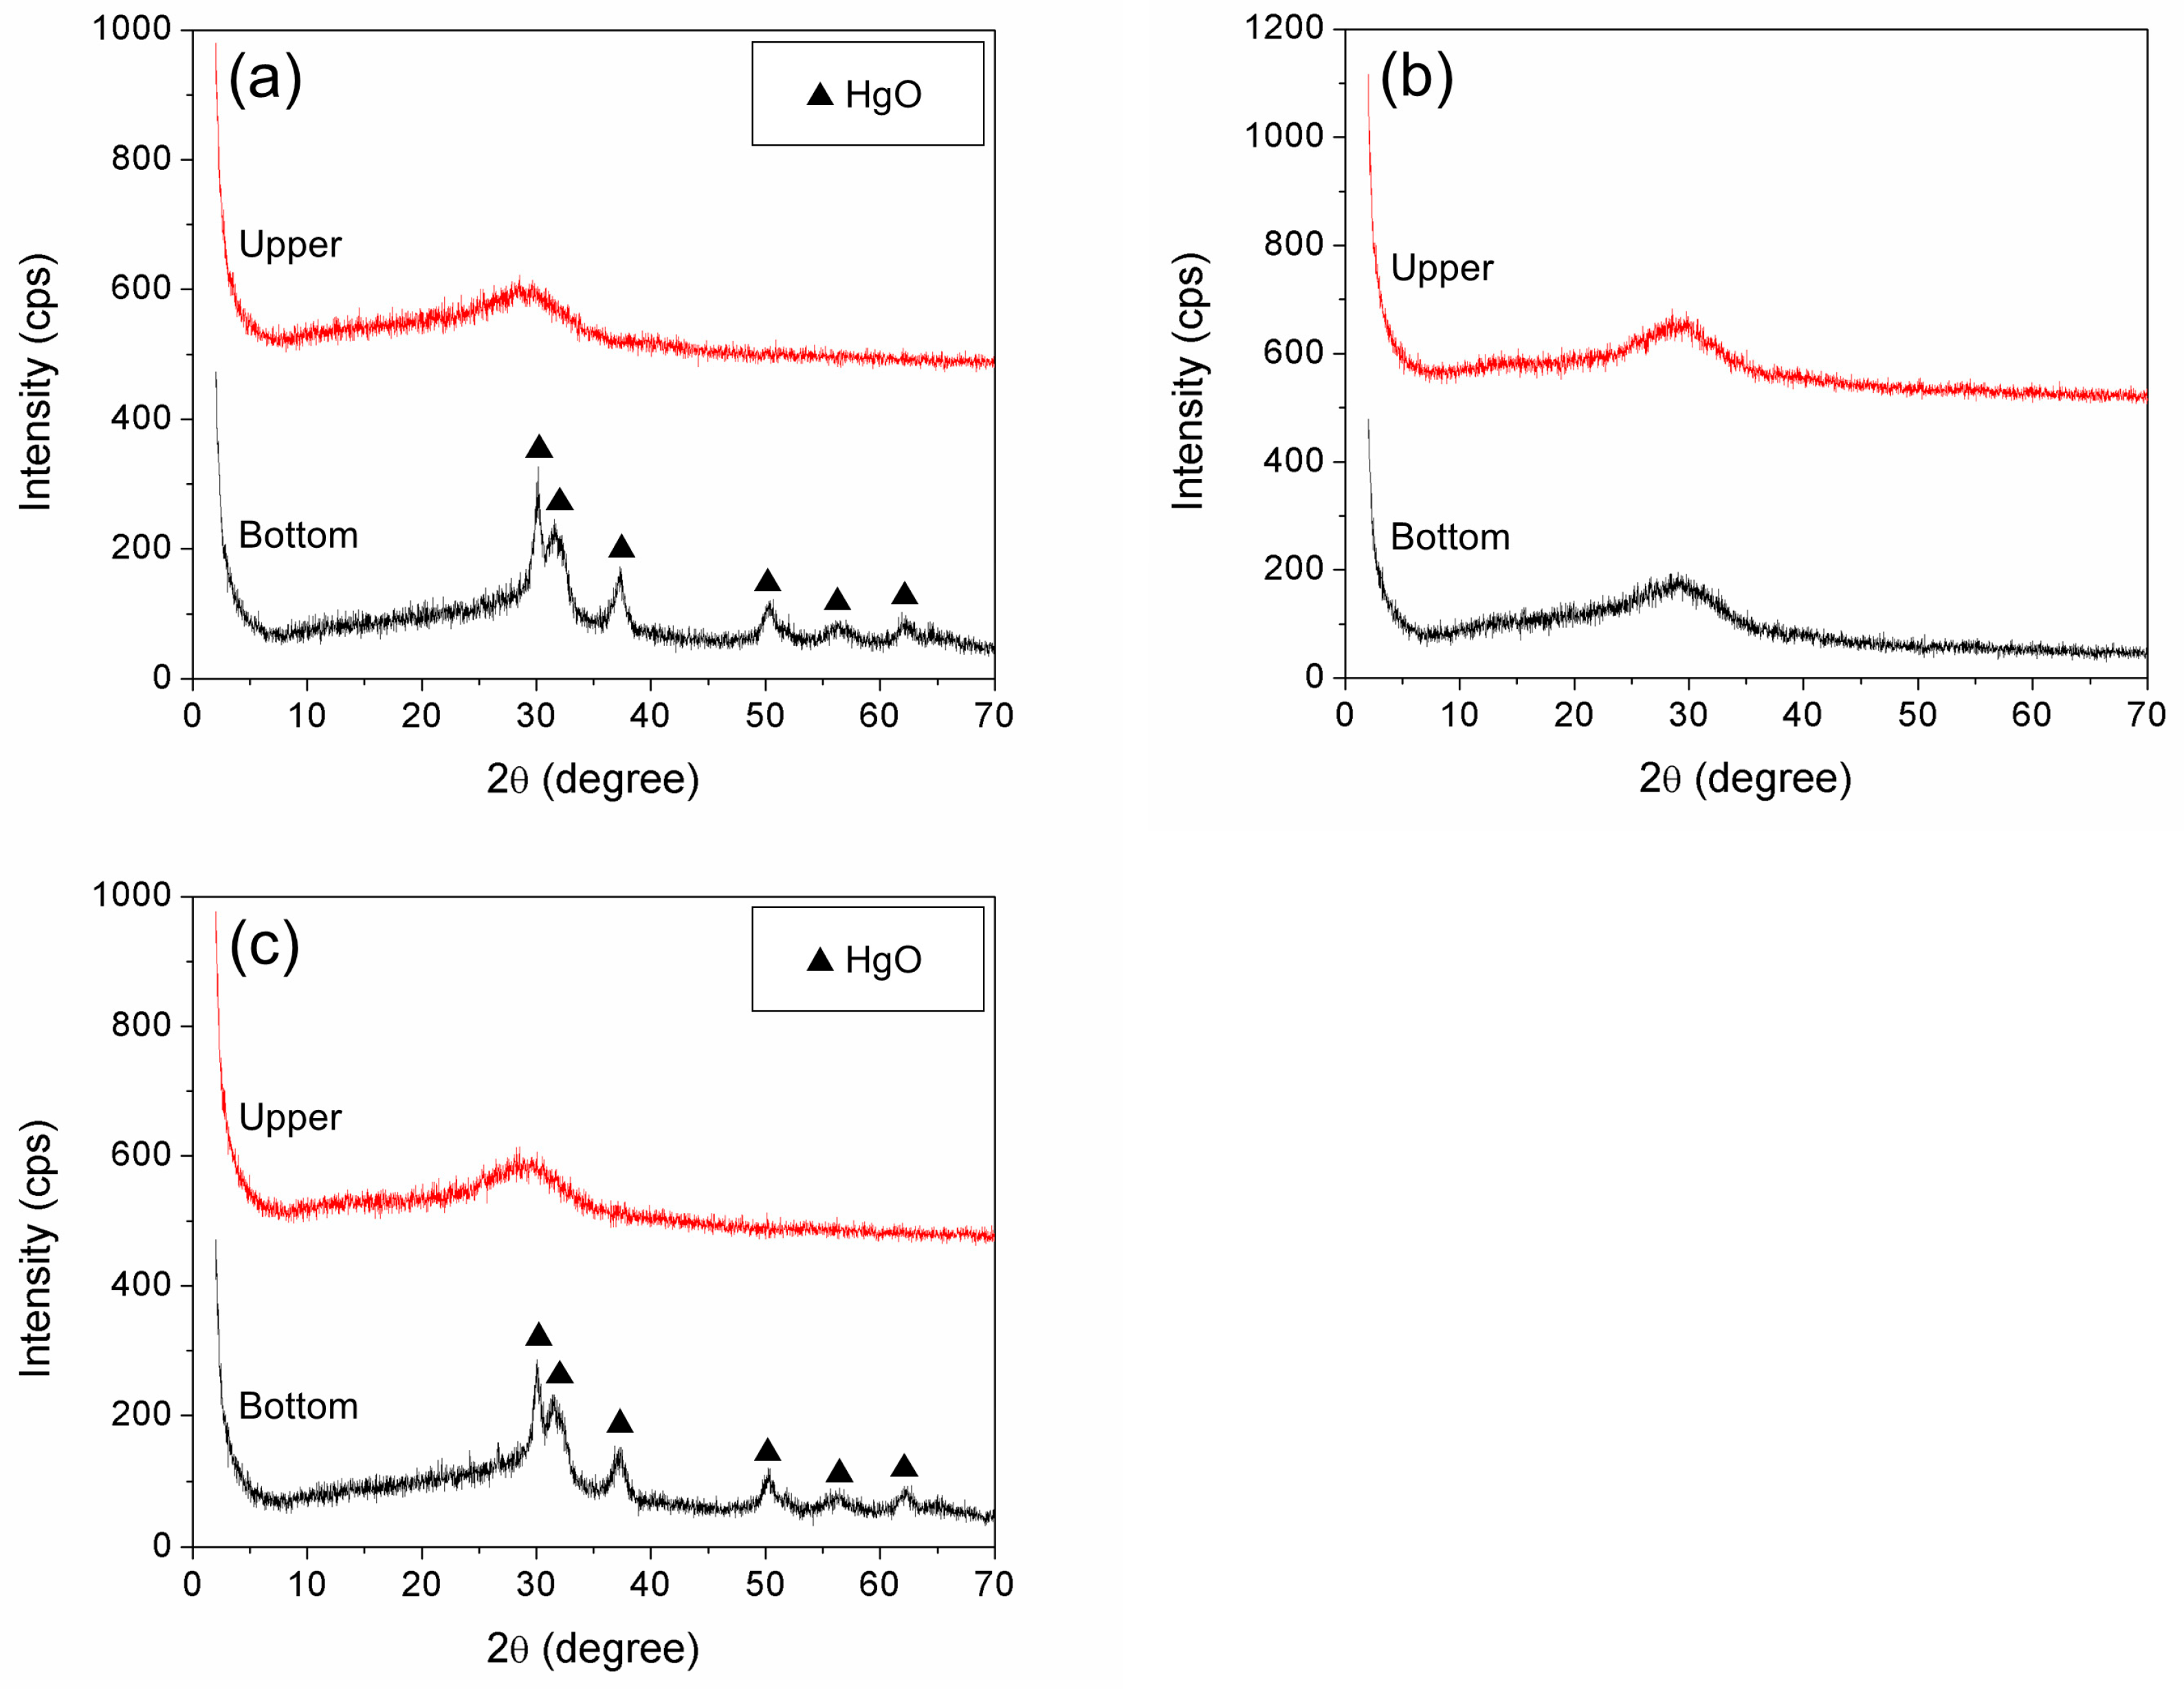
3.1.2. Effect of Mixing Procedure on Mercury Immobilization

Unlike cadmium, all the mixing procedures led to high mercury leaching of >70% (maximum of 95.6%), suggesting mercury was poorly retained in the geopolymer. The leaching was similar for all mixing procedures. Figure 5a shows the increasing amount of mercury leached until the last day of the experiments, and Figure 5b shows the pH data. No significant difference is evident between the three samples as the pH decreases from ~12 to 8.5 with time. The similar trends indicate mercury speciation was identical in the three samples.
The X-ray diffraction patterns for the bottom parts of the mercury geopolymers made by the Salt and Salt-AA mixing procedures (Figure 6) show that, apart from the amorphous silica peak, there are peaks at 30.1°, 31.5°, 37.3°, 50.3°, 56.4°, and 62.0°, which correspond to mercury oxide. Like cadmium, this metal oxide forms during manufacturing and settles due to its high density. The Ion mixing procedure did not result in different XRD patterns between the bottom and upper parts of the geopolymers.
Other results that compare the two parts of the mercury geopolymer are shown in Figure 7. The analyzed samples exhibit all the peaks shown by the geopolymer control sample, including the Si–O–Al bending mode at 396 cm−1, υs (Si–O–Si) at 502 and 570 cm−1, T–O symmetric stretching mode at 637 cm−1, and υs (Si–O-) at around 851 and 1056 cm−1 [26,27,28,29]. In addition, a new peak at 320 cm−1 due to Hg–O stretching characterizes the bottom parts of samples (Figure 7a) [31]. This peak is evident for the Salt and Salt-AA samples, and confirms the formation of mercury oxide, as is evident from the X-ray diffraction patterns. Although not detected by X-ray diffraction, the Hg–O covalent bonding in the samples made by the Ion mixing procedure is apparent from the Raman spectroscopy. This result is consistent with the mercury solubility diagram (Figure 1b). Moreover, this mercury species is found in the bottom and upper parts of the mercury geopolymer, which is not the case for the Salt and Salt-AA samples.
In general, the Salt and Salt-AA procedures yielded similar results. Mixing the heavy metal salts with pozzolan first or with an alkali activator first produces geopolymers with heavy metals concentrated in the lowest part. This highlights the insignificant effects of the mixing sequence in determining the heavy metal immobilization. Rather, heavy metals being in salt form at the initial stage for both cases is essential in defining their similarity. Under highly alkaline conditions, OH from the activator acts as a precipitant, which removes chloride to make metal hydroxide or oxide. In contrast, the Ion mixing procedure produces a more homogeneous geopolymer. It is beneficial to introduce the heavy metals in soluble form before geopolymerization to ensure they can move more freely and be more evenly distributed. Although the Ion sample for mercury produced the same species as the Salt and Salt-AA mixing procedures, this was not the case for cadmium.

3.2. Effects of the Initial Heavy Metal Concentration

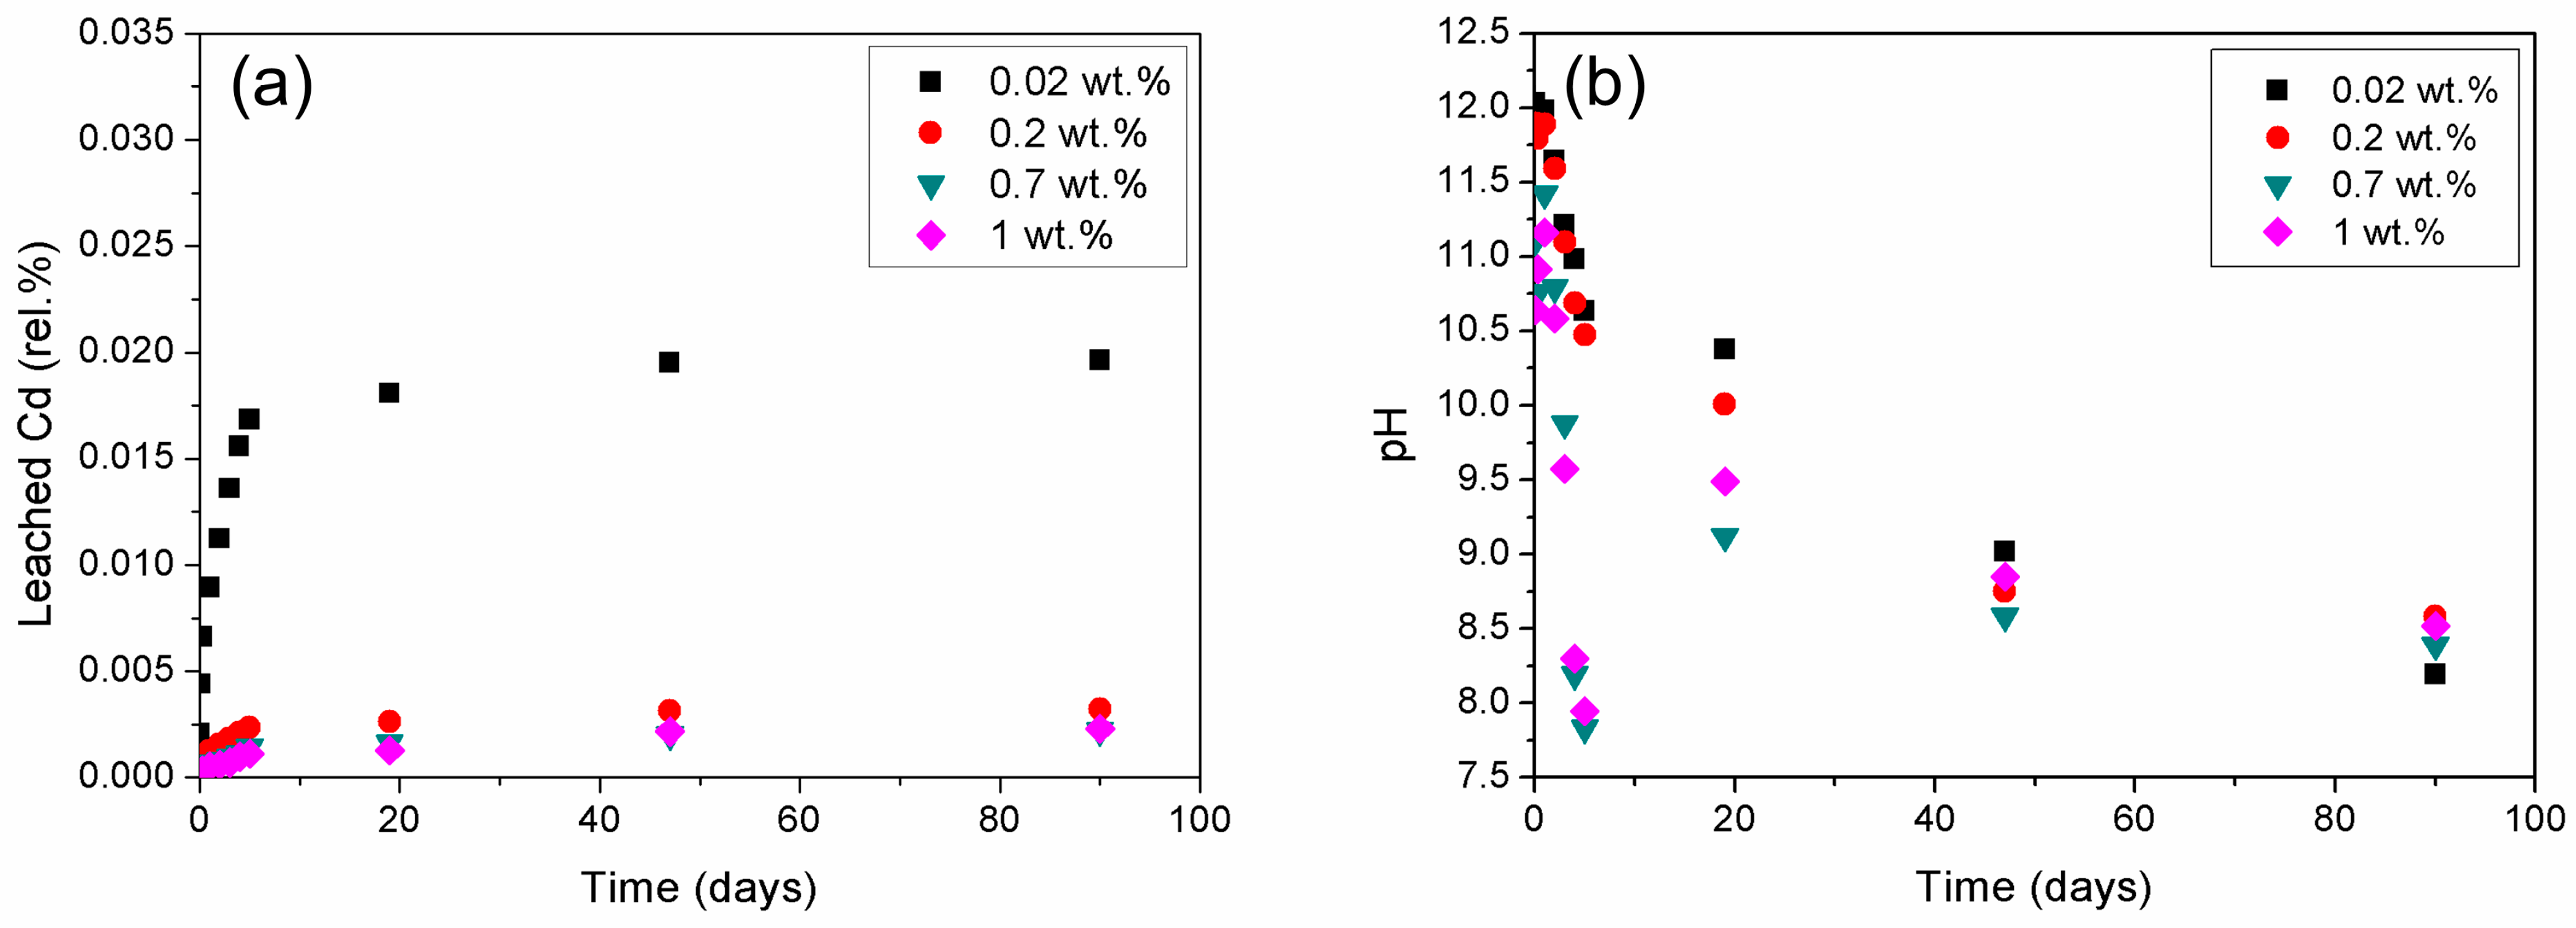
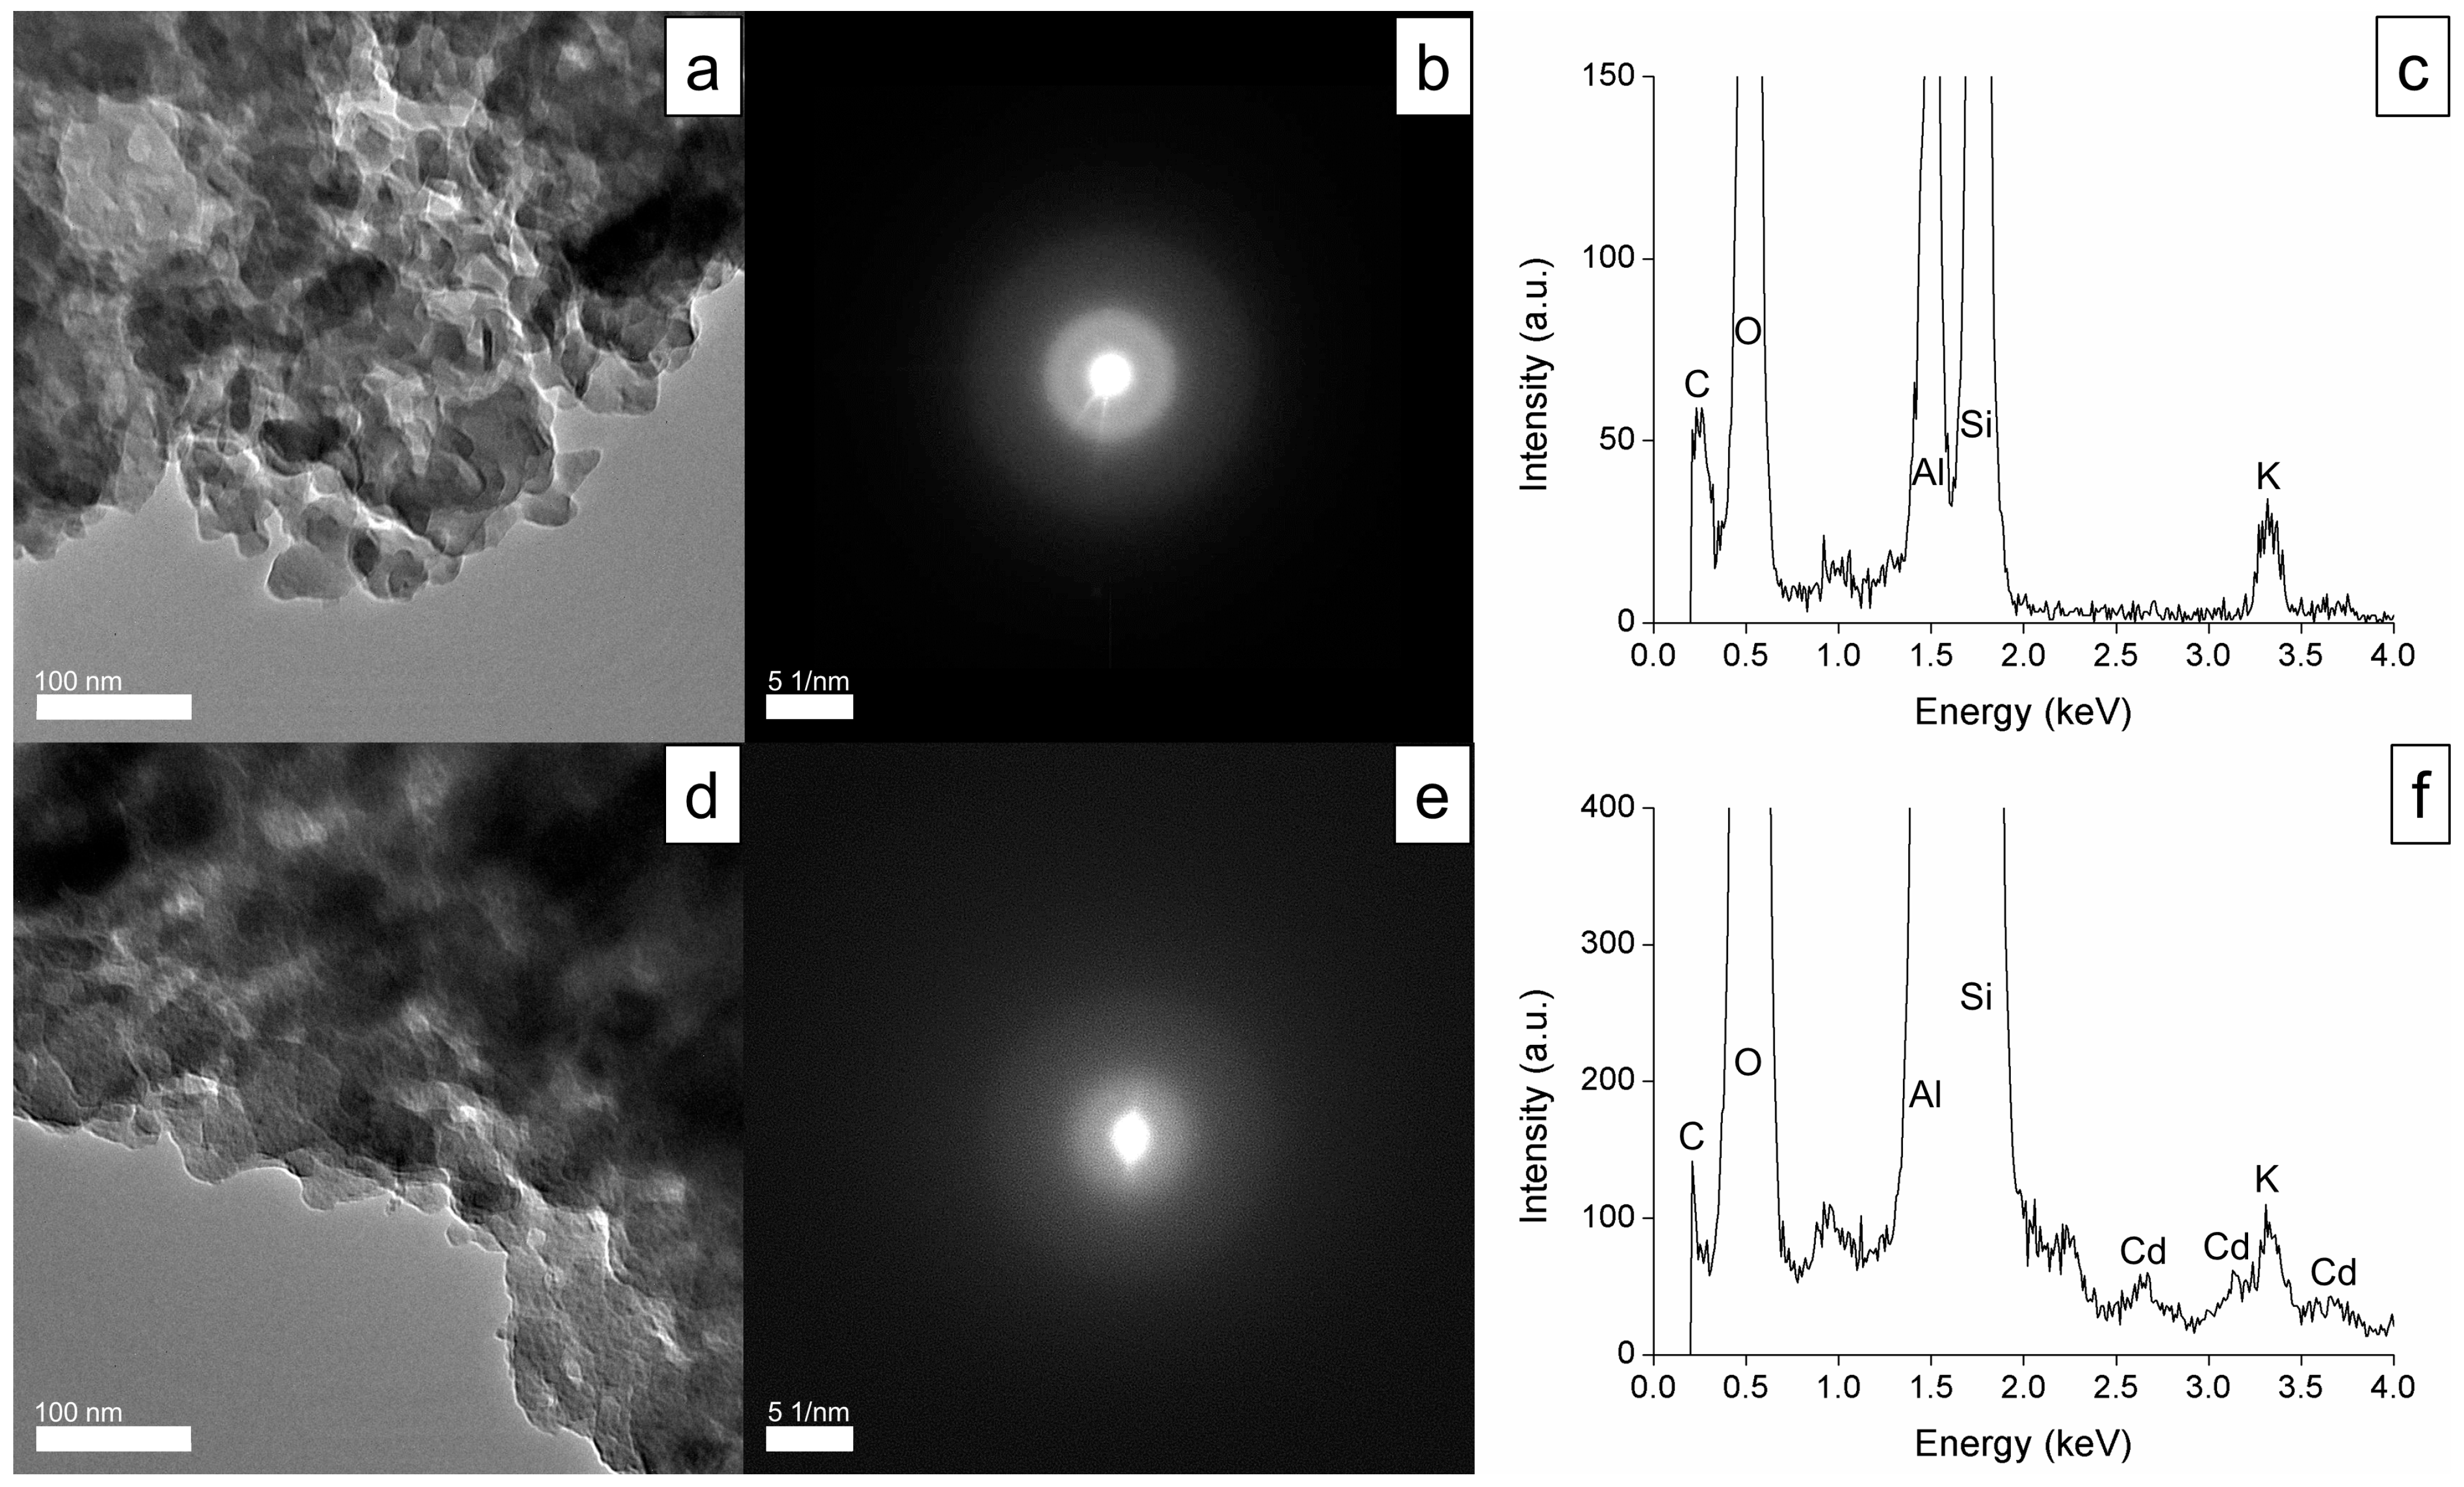
3.2.1. Effects of the Initial Heavy Metal Concentration on Cadmium Immobilization

The different concentrations of cadmium geopolymers leached a minimal amount of cadmium to water (Figure 8a). Up to the last day of the tests, <0.025% of the cadmium was leached, and this value was constant from day 19. This was the case even when the leachate pH decreased to 8.5 (Figure 8b). During the leaching tests, the geopolymers absorbed water and released OH. The geopolymers with an initially high alkalinity lost a large amount of OH during the earlier leaching stage and gradually became less alkaline. The identical leaching behavior in all tests indicates the cadmium may have been immobilized in the same form in all cases.
The cadmium solubility diagram in Figure 1a shows that the expected cadmium form in the geopolymer is Cd(OH)2 for all given concentrations. However, the solid sample analyses suggest there was no hydroxide formation, even at cadmium concentrations as high as 1 wt.%. The X-ray diffraction spectra in Figure 9a show that the cadmium geopolymers consist mainly of amorphous silica. In addition, the Raman spectra in Figure 9b show that the cadmium geopolymers have the same bands as the geopolymer control sample. Neither technique can determine the cadmium speciation in the geopolymers. Thus, other analysis was needed. The absence of differences between low and high concentrations of Cd-geopolymers makes it possible to represent the low-concentration samples by analyzing the high-concentration one.
The geopolymer control sample and cadmium geopolymer (1 wt.% Cd) were subjected to further analysis. The XPS results can yield information on the chemical state of the major elements. The Al2p, Si2p, and O1s peaks are evident in Figure 10. The Cd3d peak is also evident for the cadmium geopolymer sample. The Cd5/2 and Cd3/2 peaks occur at 405.4 and 412.2 eV, indicating that cadmium is incorporated in the geopolymers in its divalent state [24,32]. The binding energies of Al2p, Si2p, and O1s in the geopolymer control sample are 74.5, 102.6, and 531.3 eV, respectively. These binding energies shift to higher values in the presence of cadmium. In the cadmium geopolymers, the values are 74.7, 102.8, and 531.5 eV for Al2p, Si2p, and O1s, respectively. Silica and alumina tetrahedra may be affected by the high ionic potential of Cd2+. Cadmium can attract electrons, interact strongly with tetrahedral species, and reduce the electron cloud density around Al, Si, and O, thereby increasing the binding energies [33,34].
The effects of cadmium incorporation on the nano-scale can be assessed by comparing the TEM results for the geopolymer control and cadmium geopolymer samples. The geopolymer control sample consisting of Si, Al, O, and K has an amorphous structure (Figure 11). The diffuse and thick rings in the selected area electron diffraction (SAED) pattern (Figure 11b) show that electrons are randomly scattered by this amorphous sample. This does not change in the presence of cadmium. A halo around the bright centra spot in the SAED pattern (Figure 11e) precludes the possibility that cadmium exists as Cd(OH)2 or a different crystalline phase. Instead, cadmium is associated with silica and alumina tetrahedra, which explains the lack of a pH dependency and the stability of cadmium in the geopolymer. Cadmium association with silica and alumina tetrahedra can be explained by the theory of hard and soft acids and bases (HSAB). At the beginning of geopolymerization, the dissolution of metakaolin produces silicate and aluminate [35]. Both species are softer bases than OH [36]. Providing that the ionic form of cadmium is a soft acid, it can react more efficiently with silicate and aluminate to bind in the geopolymer framework [37].

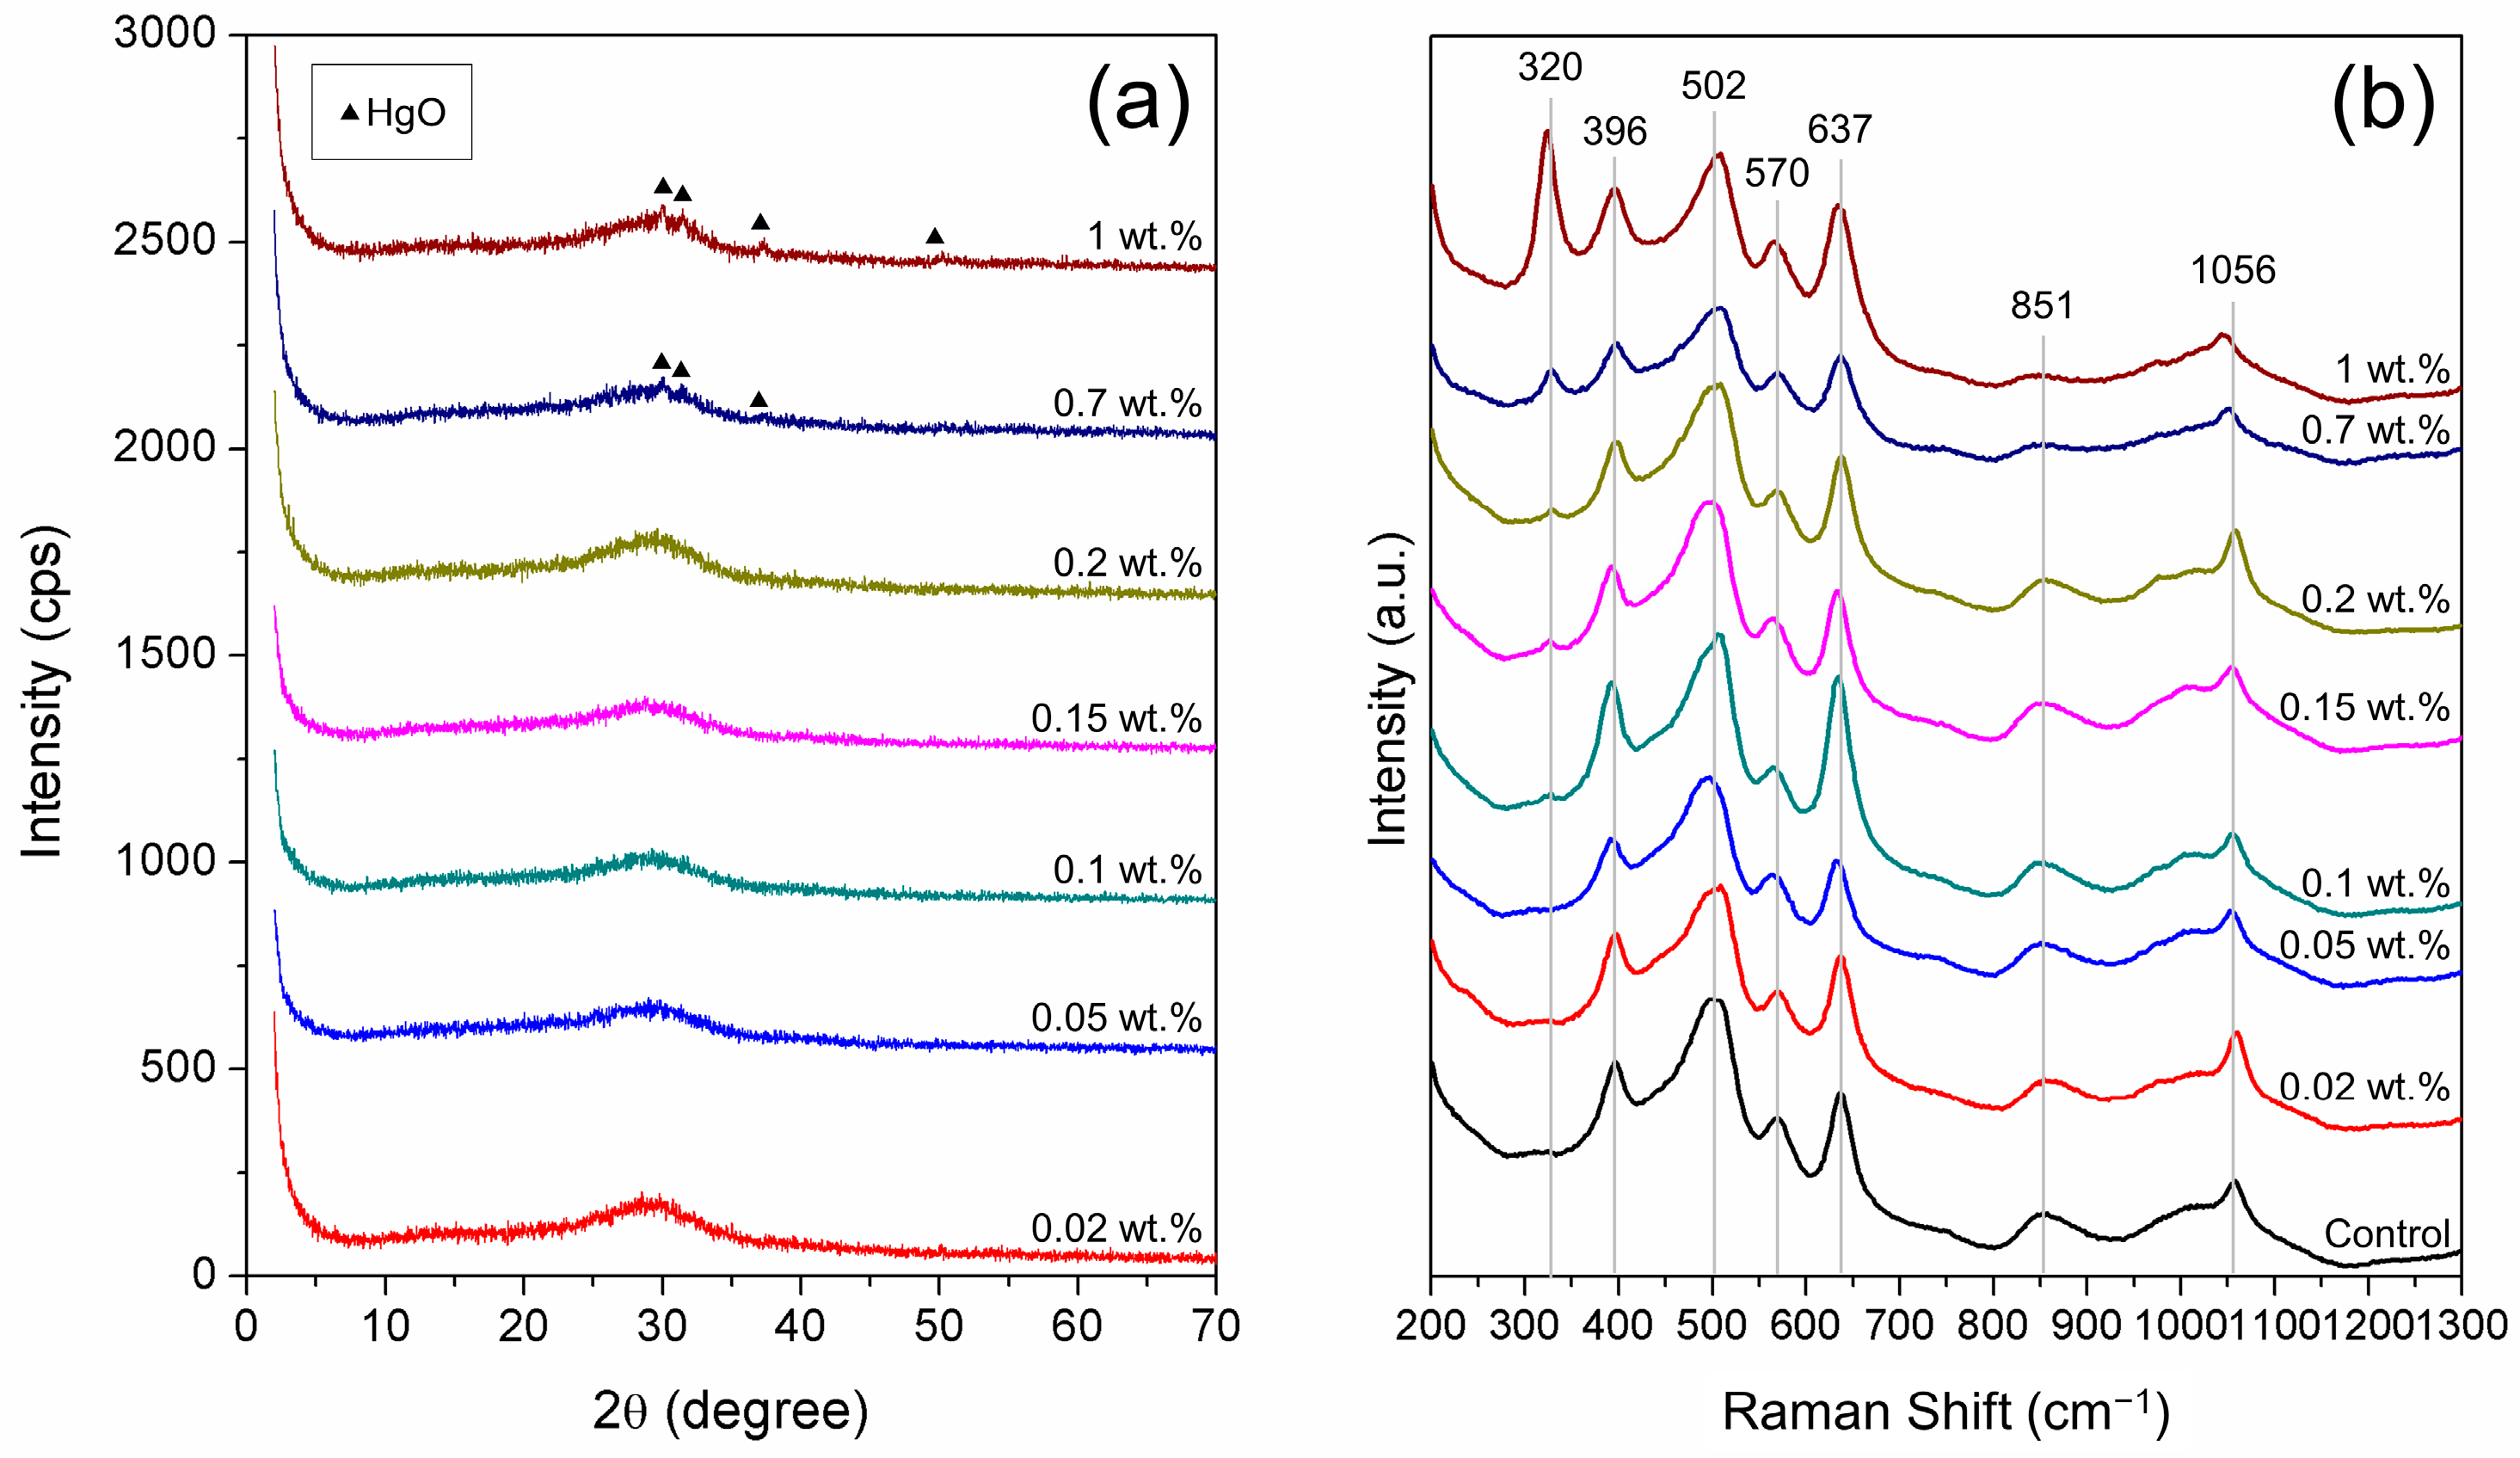
3.2.2. Effects of Initial Heavy Metal Concentration on Mercury Immobilization

Figure 1b shows that the main mercury species varies according to its concentration in a system. For concentrations of >0.2 wt.%, mercury is expected to occur mainly as mercury oxide, while at lower concentrations, mercury is in the soluble Hg(OH)2 form. Extra samples with 0.05, 0.10, and 0.15 wt.% mercury were prepared to investigate how these two different phases affect the immobilization. The leaching results are shown in Figure 12. Over a similar pH range, all the samples exhibit increasing leaching. The high leaching values show that the geopolymers only weakly immobilize the mercury.
X-ray diffraction analysis identified the mercury speciation in the 0.7 and 1 wt.% mercury geopolymer as being mercury oxide (Figure 13a). This is also consistent with the Raman spectroscopic data (Figure 13b). In addition to the high-concentration samples, the mercury oxide band at 320 cm–1 is evident for the low-concentration samples. The mercury oxide contents in the geopolymer samples with 0.20, 0.15, 0.10, 0.05, and 0.02 wt.% mercury are below the detection limits of the X-ray diffraction analysis. However, the Raman spectroscopy can detect mercury oxide in samples with mercury concentrations as low as 0.1 wt.%. The band intensity increases with increasing mercury concentration.
At a given concentration of mercury, the dominant mercury species is mercury oxide. Unlike cadmium, mercury does not appear to be associated with silica or alumina, and reacts with hydroxide instead. This preference is due to the relativistic effect, because mercury is a much heavier element than cadmium [38]. The relativistic contribution lowers the energy of the s shell and destabilizes the d shell, leading to strengthened Hg–O bonding and weakened O–H bonding [39]. Consequently, the O–H bond is likely to dissociate. This explains the presence of mercury oxide in the low-concentration samples, when the dominant species should be Hg(OH)2. However, this oxide form can be hydrolyzed during water immersion [40]. The hydrolysis product is readily leached because the geopolymer hardly retains a neutral substance. Due to the difficulty of direct immobilization, further studies are needed, such as finding an additive to lower the mercury solubility.
Although mercury still requires more work, geopolymer is an excellent candidate to retain cadmium. Its immobilization form can be controlled by the incorporation mechanism. This study has identified a procedure to process cadmium-containing waste that results in the most favorable immobilization form. Providing cadmium in its ionic form is ideal for geopolymerization. When processing actual waste, mixing of fly ash or iron sludge with water first is recommended, to dissolve the soluble or desorbed cadmium. Subsequently, blending the waste with metakaolin is necessary to adjust the aluminosilicate content. The next step is addition of the alkali activator. For waste containing calcium, such as fly ash, the formation of C–(A)–S–H may need to be eliminated, as this matrix immobilizes cadmium as Cd(OH)2 [41,42]. Therefore, an extra step could be included, involving the addition of carbonate ions to promote CaCO3 formation instead of C–(A)–S–H. A schematic diagram of the proposed treatment is shown in Figure 14.

4. Conclusions

This study has investigated the effects of heavy metal speciation and concentration on its final speciation form in a geopolymer. The initial speciation (i.e., salt or ionic) leads to different immobilization forms and/or geopolymer characteristics. The speciation can be controlled by the chosen mixing procedure. Introducing the cadmium and mercury to the geopolymer system in a salt form produces metal hydroxide and oxide, respectively. Cadmium hydroxide is unstable at low pH, whereas mercury oxide is hydrolyzed at any pH. Dissolving the heavy metal salts in water makes the resultant geopolymers more homogeneous. Although mercury occurs as an oxide, cadmium is associated with silicate and aluminate in the geopolymer framework. This procedure applied to heavy metal concentrations of 0.02–1.00 wt.% yielded the same species and geopolymer characteristics, which highlights its applicability to processing and managing waste of various concentrations. Different leaching behaviors, depending on the stabilized form of cadmium, demonstrate the importance of choosing the appropriate mixing procedure to process contaminated waste and for its long-term storage.

Author Contributions

Conceptualization, P.P. and T.S.; methodology, P.P. and T.S.; software, P.P.; validation, P.P.; formal analysis, P.P.; investigation, P.P., R.I.C. and Y.O.; resources, T.S., T.O. and R.K.; data curation, P.P.; writing—original draft preparation, P.P.; writing—review and editing, R.I.C., Y.O., T.O., R.K. and T.S.; visualization, P.P.; supervision, T.S.; project administration, T.S.; funding acquisition, T.S. All authors have read and agreed to the published version of the manuscript.

Funding

This research received no external funding.

Data Availability Statement

Data are contained within the article.

Acknowledgments

P.P. thanks the Ministry of Education, Culture, Sports, Science and Technology (MEXT) of Japan for providing a scholarship. Some of this research was conducted at the Laboratory of XPS Analysis and Laboratory of Nano–Micro Material Analysis, Joint-Use Facilities, Hokkaido University, and was supported by the Advanced Research Infrastructure for Materials and Nanotechnology in Japan (ARIM) of the Ministry of Education, Culture, Sports, Science and Technology (MEXT) of Japan. The proposal number was JPMXP1222HK0045.

Conflicts of Interest

The authors declare no conflicts of interest.

References

  1. U.S. Environmental Protection Agency. Water-Related Environmental Fate of 129 Priority Pollutants Volume I: Introduction and Technical Background, Metals and Inorganics, Pesticides and PCBs; U.S. Environmental Protection Agency: Washington, DC, USA, 1979. [Google Scholar]
  2. U.S. Environmental Protection Agency. Mercury Study Report to Congress Volume V: Health Effects of Mercury and Mercury Compounds; U.S. Environmental Protection Agency: Washington, DC, USA, 1997. [Google Scholar]
  3. Kisku, G.C.; Yadav, S.; Sharma, R.K.; Negi, M.P.S. Potential Environmental Pollution Hazards by Coal Based Power Plant at Jhansi (UP) India. Environ. Earth Sci. 2012, 67, 2109–2120. [Google Scholar] [CrossRef]
  4. Zucha, W.; Weibel, G.; Wolffers, M.; Eggenberger, U. Inventory of MSWI Fly Ash in Switzerland: Heavy Metal Recovery Potential and Their Properties for Acid Leaching. Processes 2020, 8, 1668. [Google Scholar] [CrossRef]
  5. Kinuthia, G.K.; Ngure, V.; Beti, D.; Lugalia, R.; Wangila, A.; Kamau, L. Levels of Heavy Metals in Wastewater and Soil Samples from Open Drainage Channels in Nairobi, Kenya: Community Health Implication. Sci. Rep. 2020, 10, 8434. [Google Scholar] [CrossRef]
  6. Zhao, X.; Yang, J.; Ning, N.; Yang, Z. Chemical Stabilization of Heavy Metals in Municipal Solid Waste Incineration Fly Ash: A Review. Environ. Sci. Pollut. Res. 2022, 29, 40384–40402. [Google Scholar] [CrossRef]
  7. Chen, W.; Wang, Y.; Sun, Y.; Fang, G.; Li, Y. Release of Soluble Ions and Heavy Metal during Fly Ash Washing by Deionized Water and Sodium Carbonate Solution. Chemosphere 2022, 307, 135860. [Google Scholar] [CrossRef]
  8. Dahlan, A.V.; Kitamura, H.; Sakanakura, H.; Shimaoka, T.; Yamamoto, T.; Takahashi, F. Possible Metal Speciation in the Fly Ash Produced from a Fluidized Bed of Municipal Solid Waste. In Proceedings of the 31st Annual Conference of JSMCWM, online, 16–18 September 2020; pp. 505–506. [Google Scholar]
  9. Liang, Y.; Tian, L.; Lu, Y.; Peng, L.; Wang, P.; Lin, J.; Cheng, T.; Dang, Z.; Shi, Z. Kinetics of Cd(II) Adsorption and Desorption on Ferrihydrite: Experiments and Modeling. Environ. Sci. Process. Impacts 2018, 20, 934–942. [Google Scholar] [CrossRef]
  10. Provis, J.L.; Bernal, S.A. Geopolymers and Related Alkali-Activated Materials. Annu. Rev. Mater. Res. 2014, 44, 299–327. [Google Scholar] [CrossRef]
  11. Niu, X.; Elakneswaran, Y.; Islam, C.R.; Provis, J.L.; Sato, T. Adsorption Behaviour of Simulant Radionuclide Cations and Anions in Metakaolin-Based Geopolymer. J. Hazard. Mater. 2022, 429, 128373. [Google Scholar] [CrossRef] [PubMed]
  12. Soonthornwiphat, N.; Kobayashi, Y.; Toda, K.; Kuroda, K.; Islam, C.R.; Otake, T.; Elakneswaran, Y.; Provis, J.L.; Sato, T. Encapsulation of Sr-Loaded Titanate Spent Adsorbents in Potassium Aluminosilicate Geopolymer. J. Nucl. Sci. Technol. 2020, 57, 1181–1188. [Google Scholar] [CrossRef]
  13. Chaerun, R.I.; Soonthornwiphat, N.; Toda, K.; Kuroda, K.; Niu, X.; Kikuchi, R.; Otake, T.; Elakneswaran, Y.; Provis, J.L.; Sato, T. Retention Mechanism of Cesium in Chabazite Embedded into Metakaolin-Based Alkali Activated Materials. J. Hazard. Mater. 2022, 440, 129732. [Google Scholar] [CrossRef]
  14. Rożek, P.; Król, M.; Mozgawa, W. Geopolymer-Zeolite Composites: A Review. J. Clean. Prod. 2019, 230, 557–579. [Google Scholar] [CrossRef]
  15. Van Jaarsveld, J.G.S.; Van Deventer, J.S.J.; Schwartzman, A. The Potential Use of Geopolymeric Materials to Immobilise Toxic Metals: Part II. Material and Leaching Characteristics. Min. Eng. 1999, 12, 75–91. [Google Scholar]
  16. da Silva Rocha, T.; Dias, D.P.; França, F.C.C.; de Salles Guerra, R.R.; da Costa de Oliveira Marques, L.R. Metakaolin-Based Geopolymer Mortars with Different Alkaline Activators (Na+ and K+). Constr. Build. Mater. 2018, 178, 453–461. [Google Scholar] [CrossRef]
  17. Ji, Z.; Pei, Y. Immobilization Efficiency and Mechanism of Metal Cations (Cd2+, Pb2+ and Zn2+) and Anions (AsO43− and Cr2O72−) in Wastes-Based Geopolymer. J. Hazard. Mater. 2020, 384, 121290. [Google Scholar] [CrossRef] [PubMed]
  18. El-Eswed, B.I. Chemical Evaluation of Immobilization of Wastes Containing Pb, Cd, Cu and Zn in Alkali-Activated Materials: A Critical Review. J. Environ. Chem. Eng. 2020, 8, 104194. [Google Scholar] [CrossRef]
  19. Gomaa, E.; Sargon, S.; Kashosi, C.; Gheni, A.; ElGawady, M.A. Mechanical Properties of High Early Strength Class C Fly Ash-Based Alkali Activated Concrete. Transp. Res. Rec. 2020, 2674, 430–443. [Google Scholar] [CrossRef]
  20. Donatello, S.; Fernández-Jiménez, A.; Palomo, A. An Assessment of Mercury Immobilisation in Alkali Activated Fly Ash (AAFA) Cements. J. Hazard. Mater. 2012, 213–214, 207–215. [Google Scholar] [CrossRef]
  21. Zhang, J.; Provis, J.L.; Feng, D.; van Deventer, J.S.J. Geopolymers for Immobilization of Cr6+, Cd2+, and Pb2+. J. Hazard. Mater. 2008, 157, 587–598. [Google Scholar] [CrossRef]
  22. El-Eswed, B.I.; Yousef, R.I.; Alshaaer, M.; Hamadneh, I.; Al-Gharabli, S.I.; Khalili, F. Stabilization/Solidification of Heavy Metals in Kaolin/Zeolite Based Geopolymers. Int. J. Min. Process. 2015, 137, 34–42. [Google Scholar] [CrossRef]
  23. Qian, G.; Sun, D.D.; Tay, J.H. Immobilization of Mercury and Zinc in an Alkali-Activated Slag Matrix. J. Hazard. Mater. 2003, 101, 65–77. [Google Scholar] [CrossRef]
  24. Ji, Z.; Pei, Y. Geopolymers Produced from Drinking Water Treatment Residue and Bottom Ash for the Immobilization of Heavy Metals. Chemosphere 2019, 225, 579–587. [Google Scholar] [CrossRef] [PubMed]
  25. Mladenović, N.; Kljajević, L.; Nenadović, S.; Ivanović, M.; Čalija, B.; Gulicovski, J.; Trivunac, K. The Applications of New Inorganic Polymer for Adsorption Cadmium from Waste Water. J. Inorg. Organomet. Polym. Mater. 2020, 30, 554–563. [Google Scholar] [CrossRef]
  26. Ivanović, M.; Nenadović, S.; Pavlović, V.P.; Radović, I.; Kijevčanin, M.; Pavlović, V.B.; Kljajević, L. The Influence of Thermodynamic Parameters on Alkaline Activators of Geopolymers and the Structure of Geopolymers. Maced. J. Chem. Chem. Eng. 2021, 40, 99–109. [Google Scholar] [CrossRef]
  27. Zhang, L.; Zhang, F.; Liu, M.; Hu, X. Novel Sustainable Geopolymer Based Syntactic Foams: An Eco-Friendly Alternative to Polymer Based Syntactic Foams. Chem. Eng. J. 2017, 313, 74–82. [Google Scholar] [CrossRef]
  28. Vidal, L.; Gharzouni, A.; Joussein, E.; Colas, M.; Cornette, J.; Absi, J.; Rossignol, S. Determination of the Polymerization Degree of Various Alkaline Solutions: Raman Investigation. J. Sol-Gel Sci. Technol. 2017, 83, 1–11. [Google Scholar] [CrossRef]
  29. Depla, A.; Verheyen, E.; Veyfeyken, A.; Van Houteghem, M.; Houthoofd, K.; Van Speybroeck, V.; Waroquier, M.; Kirschhock, C.E.A.; Martens, J.A. UV-Raman and 29Si NMR Spectroscopy Investigation of the Nature of Silicate Oligomers Formed by Acid Catalyzed Hydrolysis and Polycondensation of Tetramethylorthosilicate. J. Phys. Chem. C 2011, 115, 11077–11088. [Google Scholar] [CrossRef]
  30. Lutz, H.D.; Mdller, H.; Schmidt, M. Lattice Vibration Spectra. Part LXXXII. Brucite-Type Hydroxides M(OH)2 (M = Ca, Mn, Co, Fe, Cd)-IR and Raman Spectra, Neutron Diffraction of Fe(OH)2. J. Mol. Struct. 1994, 328, 121–132. [Google Scholar] [CrossRef]
  31. Cooney, R.P.J.; Hall, J.R. Vibrational Spectra of Mercury(L) And Mercury(II) Acetate Compounds. J. Inorg. Nucl. Chem. 1972, 34, 1519–1527. [Google Scholar] [CrossRef]
  32. Moulder, J.F.; Stickle, W.F.; Sobol, P.E.; Bomben, K.D. Handbook of X-Ray Photoelectron Spectroscopy; Perkin-Elmer Corporation: Eden Prairie, MN, USA, 1992. [Google Scholar]
  33. Wei, X.; Sun, Y.; Su, Y.; Shen, X.; Tang, Y.; Yan, F.; Zhang, Z. Structural Evolution of Geopolymers Incorporated with Heavy Metals: Solidification Mechanism of Pb2+ and Cd2+. J. Phys. Chem. C 2023, 127, 19563–19573. [Google Scholar] [CrossRef]
  34. Ji, Z.; Su, L.; Pei, Y. Synthesis and Toxic Metals (Cd, Pb, and Zn) Immobilization Properties of Drinking Water Treatment Residuals and Metakaolin-Based Geopolymers. Mater. Chem. Phys. 2020, 242, 122535. [Google Scholar] [CrossRef]
  35. Khale, D.; Chaudhary, R. Mechanism of Geopolymerization and Factors Influencing Its Development: A Review. J. Mater. Sci. 2007, 42, 729–746. [Google Scholar] [CrossRef]
  36. Kuenzel, C.; Cisneros, J.F.; Neville, T.P.; Vandeperre, L.J.; Simons, S.J.R.; Bensted, J.; Cheeseman, C.R. Encapsulation of Cs/Sr Contaminated Clinoptilolite in Geopolymers Produced from Metakaolin. J. Nucl. Mater. 2015, 466, 94–99. [Google Scholar] [CrossRef]
  37. Liu, Y.; Zhao, S.; Qiu, X.; Meng, Y.; Wang, H.; Zhou, S.; Qiao, Q.; Yan, C. Clinoptilolite Based Zeolite-Geopolymer Hybrid Foams: Potential Application as Low-Cost Sorbents for Heavy Metals. J. Environ. Manag. 2023, 330, 117167. [Google Scholar] [CrossRef] [PubMed]
  38. Das, A.; Das, U.; Das, A.K. Relativistic Effects on the Chemical Bonding Properties of the Heavier Elements and Their Compounds. Coord. Chem. Rev. 2023, 479, 215000. [Google Scholar] [CrossRef]
  39. Barysz, M.; Leszczyński, J.; Zielińska, B.; Bilewicz, A. Influence of Relativistic Effects on Hydrolysis of the Heavy Metal Cations. In Annual Report 2003; Institute of Nuclear Chemistry and Technology: Warszawa, Poland, 2004; pp. 57–59. [Google Scholar]
  40. Hocsman, A.; Di Nezio, S.; Charlet, L.; Avena, M. On the Mechanisms of Dissolution of Montroydite [HgO(s)]: Dependence of the Dissolution Rate on PH, Temperature, and Stirring Rate. J. Colloid Interface Sci. 2006, 297, 696–704. [Google Scholar] [CrossRef]
  41. Cartledge, F.K.; Butler, L.G.; Chalasani, D.; Eaton, H.C.; Frey, F.P.; Herrera, E.; Tittlebaum, M.E.; Yang, S.-L. Immobilization Mechanisms in Solidification/Stabilization of Cd and Pb Salts Using Portland Cement Fixing Agents. Environ. Sci. Technol. 1990, 24, 867–873. [Google Scholar] [CrossRef]
  42. Liu, J.; Wu, D.; Tan, X.; Yu, P.; Xu, L. Review of the Interactions between Conventional Cementitious Materials and Heavy Metal Ions in Stabilization/Solidification Processing. Materials 2023, 16, 3444. [Google Scholar] [CrossRef]
Figure 1. Solubility diagrams of (a) cadmium and (b) mercury calculated with the Visual MINTEQ database, along with the initial concentrations and pH values of the experiments.
Minerals 14 00311 g001
Figure 2. (a) Cumulative amount of leaching relative to the initial amount of cadmium and (b) leachate pH values of the cadmium geopolymers after various mixing procedures.
Minerals 14 00311 g002
Figure 3. X-ray diffraction patterns of the upper and bottom parts of the cadmium geopolymer made by the (a) Salt, (b) Ion, and (c) Salt-AA mixing procedures.
Minerals 14 00311 g003
Figure 4. Raman spectra of the (a) bottom and (b) upper parts of the cadmium geopolymers after various mixing procedures.
Minerals 14 00311 g004
Figure 5. (a) Cumulative amount of leaching relative to the initial amount of mercury and (b) leachate pH values of the mercury geopolymers after various mixing procedures.
Minerals 14 00311 g005
Figure 6. X-ray diffraction patterns of mercury geopolymers made by the (a) Salt, (b) Ion, and (c) Salt-AA mixing procedures.
Minerals 14 00311 g006
Figure 7. Raman spectra of the (a) bottom and (b) upper parts of the mercury geopolymers after various mixing procedures.
Minerals 14 00311 g007
Figure 8. (a) Cumulative amount of leaching relative to the initial amount of cadmium and (b) leachate pH values of the cadmium geopolymers produced at various initial concentrations.
Minerals 14 00311 g008
Figure 9. (a) X-ray diffraction patterns and (b) Raman spectra of the geopolymers at various cadmium concentrations.
Minerals 14 00311 g009
Figure 10. XPS spectra of (a) Al2p, (b) Si2p, (c) Cd3d, and (d) O1s from the geopolymer control sample and cadmium geopolymer (1 wt.%).
Minerals 14 00311 g010
Figure 11. (a) TEM image, (b) SAED pattern, and (c) EDS spectrum of the geopolymer control sample, and (df) equivalent data for the cadmium geopolymer.
Minerals 14 00311 g011
Figure 12. (a) Cumulative amount of leaching relative to the initial amount of mercury and (b) leachate pH values of the mercury geopolymer with variable initial concentrations.
Minerals 14 00311 g012
Figure 13. (a) X-ray diffraction patterns and (b) Raman spectra of the geopolymers at various mercury concentrations.
Minerals 14 00311 g013
Figure 14. Schematic diagram of the proposed treatment for cadmium-containing waste.
Minerals 14 00311 g014
Table 1. Previous studies of heavy metal immobilization using a Na-geopolymer.
ResearcherMetalPozzolanMetal Concentration (wt.%)Mechanisms
Zhang et al. [21]CdFly ash + sand0.5Cd(OH)2 precipitate
El-Eswed et al. [22]CdZeolite + kaolinite0.001 and 0.006Cation exchange
Ji and Pei [24]CdBottom ash + drinking water treatment residue1, 2, and 4Covalent bonding
Qian et al. [23]HgBlast furnace slag0.5 and 2Hg-silicate precipitate;
C–S–H lattice incorporation;
Physical encapsulation of HgO
Donatello et al. [20]HgFly ash0.5 and 5HgS;
HgO/Hg-silicate;
Hg absorbed onto N–A–S–H
Table 2. Chemical composition of the Sobueclay metakaolin.
ComponentPercentage (wt.%)
SiO251.25
Al2O345.82
TiO21.19
Fe2O30.58
Na2O0.06
K2O0.15
CaO0.23
MgO0.02
P2O50.13
Disclaimer/Publisher’s Note: The statements, opinions and data contained in all publications are solely those of the individual author(s) and contributor(s) and not of MDPI and/or the editor(s). MDPI and/or the editor(s) disclaim responsibility for any injury to people or property resulting from any ideas, methods, instructions or products referred to in the content.

