1. Introduction
The Yungang Grottoes, located in the precipitous cliffs of Wuzhou Mountain, 16 km west of Datong City in Shanxi Province, China (formerly the capital of the Northern Wei Dynasty), stand as one of the most significant complexes of large cave temples in the country. Comprising 254 caves, some of which still bear remnants of pigments on the stone carvings, the caves were commissioned for excavation under the auspices of the Northern Wei royal court, which occurred approximately between the years 460 and 524 AD. Since their inception, the grottoes and their surroundings have been the focal point of religious activities across various dynasties. In addition to multiple instances of painting on the stone carvings within the caves, rulers and devotees have also constructed temples in the vicinity, leaving behind a wealth of artifacts and traces of their religious practices.
Archaeological excavations at the Yungang Grottoes commenced in the late 1930s under the supervision of the Yungang Grottoes Survey Team, organized by Japanese scholars [
1,
2,
3]. Subsequently, in the late 1970s and early 1980s, limited-scale excavations were conducted in specific areas by the Yungang Grottoes Cultural Relics Preservation Institute. In the years from 1992 to 1993, thorough cleaning and excavation were carried out on the front ground of the Yungang Grottoes [
4]. Subsequently, from 2008 to 2012, an extensive excavation was conducted on the summit of the central and western areas of the Yungang Grottoes [
5]. The samples investigated in this study primarily originated from artifacts unearthed during the two large-scale archaeological excavations mentioned earlier. The excavation layers encompass periods spanning from the Northern Wei Dynasty (460–534 AD) through the Liao-Jin Period (907–1234 AD) to the Ming-Qing Dynasty (1368–1912 AD).
Previous researchers have conducted compositional studies of the pigments present on the stone carvings or clay sculptures in certain caves of the Yungang Grottoes, including Caves 1, 5, 6, 9, 10, 11, 12, and 13 [
6,
7,
8,
9]. Their analyses identified red pigments such as red earth, vermilion, and minium; white pigments like gypsum and anglesite; green pigments including atacamite, malachite, green earth, and emerald green; yellow pigments such as yellow earth, massicot, and orpiment; blue pigments like azurite, lapis lazuli, synthetic ultramarine, and Prussian blue; and black pigments comprising carbon black and plattnerite, formed from transformed lead pigment. Additionally, some areas revealed the use of gold leaf. However, previous studies only speculated on the painting periods associated with these pigments and lacked concrete evidence. The samples analyzed in this study, sourced from specific strata, precisely address this gap in knowledge. Further, the application of modern analysis and detection technologies can continuously promote people’s cognition of precious historical information such as ancient painting techniques, color matching, and material sources, thus providing an important scientific basis for the protection and restoration of Yungang Grottoes.
2. Sample Information
In this study, a total of 11 sets of unearthed samples were selected, as outlined in
Table 1. The Northern Wei samples consist of eight sets (Serial Numbers 1–8), including stone carving remnants excavated from the front of the caves (resulting from fallen cave sculptures), fragments of stone carvings unearthed from the remains of temple structures on the summit, pigment grinding tools, architectural ornaments, and mural fragments excavated from the front of the temples. These samples display surfaces adorned with red, yellow, white, green, black pigments, and gold leaf. The Liao-Jin samples comprise two sets (Serial Numbers 9–10), consisting of fragments of colored bricks and eave tiles, both displaying red coloration on the surface. The Ming-Qing sample set (Serial Number 11) originates from the front layers of the temple site and includes fragments of clay sculptures with red, green, blue, and white pigments.
These artifacts are stored in museums or storerooms, and they are forbidden to be taken out, so portable equipment and micro-sampling analysis methods were used. The sample collection methods involved two approaches: first, employing a surgical blade to scrape minute pigment layers or powder from concealed locations, and second, directly selecting small fragments with visible pigments for subsequent processing and analysis.
3. Detection Instruments and Methods
In situ microscopic observations of pigments were conducted using the Anyty ViewTer 500 portable digital microscope (3R Group Eddytek Corp., Beijing, China), with magnification ranging from 10 to 200 times and a resolution of 5 million pixels. Clear focusing was achieved before capturing photographs.
The in situ compositional analysis was conducted using the Olympus handheld X-ray fluorescence spectrometer Delta series (Evident Corporation, Tokyo, Japan), model DPO-6000+, with a silver (Ag) target X-ray tube and a silicon drift detector. The instrument was configured with the “cultural heritage and archaeology+” mode, employing an excitation voltage of 40 kV, a current of 100 μA, a determination time of 120 s, and a beam spot diameter of 10 mm. This setup allowed for the measurement of elemental concentrations, including Fe, Cu, Hg, As, Pb, Al, Si, S, Cl, and Ca, and the analytical errors are Fe ± 0.03%, Cu ± 0.001%, Hg ± 0.001%, As ± 0.005%, Pb ± 0.005%, Al ± 0.15%, Si ± 0.1%, S ± 0.05%, Cl ± 0.04%, and Ca ± 0.07%. A calibration check is performed with a 316 stainless steel standardized sample plate before testing. It is noteworthy that, due to the thinness of the remaining pigment layers and the uneven surfaces of many samples, the measured elemental content tends to be generally lower. However, this approach still allows qualitative judgment for the identification of characteristic elements, thereby providing a preliminary assessment of pigment types.
For the microscopic morphological analysis of pigment particles, the SOPTOP-CX40P (Ningbo, China) transmitted-reflected integrated polarizing microscope was employed. The method involved placing a small quantity of pigment powder on a glass slide, adding alcohol for homogenization, placing it on a heating stage, and solidifying it with Meltmount (refractive index = 1.662). The prepared sample was then observed under a polarizing microscope. The identification of pigment types was based on the characteristics of mineral pigment crystals, including size, shape, color, morphology, and extinction behavior. The same microscope was used in the reflected mode for observing sample cross-sections.
Microscopic morphology (secondary electron image) and spot elemental analysis (backscattered electron image and X-ray energy spectrum) were conducted using the HITACHI 3030 scanning electron microscope (Naka, Japan) equipped with the Bruker QUANTAX 70 energy dispersive X-ray spectrometer (Berlin, Germany) in low vacuum. Pigment particles or epoxy resin-embedded painted samples were directly fixed on a holder using conductive adhesive for measurements. The excitation voltage was set at 15 kV, the magnification was 15–30,000×, and the testing time exceeded 70 s to ensure comprehensive analysis.
Raman scattering analysis was carried out using the HORIBA Xplora Plus (HORIBA, Kyoto, Japan). The analysis involved directly placing pigment particles or previously embedded samples on glass slides. The excitation wavelength was selected based on requirements, with options of 532 nm or 785 nm; each spectrum was scanned twice, corresponding to a collection time of 30 s; the spectral resolution was less than 1 cm
−1; the microscope magnification was 50×, with a grating of 600 g/mm; and the frequency shift ranges were 60–8000 cm
−1 (532 nm) and 60–3200 cm
−1 (785 nm). To determine the pigment types, the obtained results were compared with existing literature [
10,
11,
12].
4. Results and Discussion
4.1. Analysis of Northern Wei Dynasty Excavated Samples
4.1.1. Stone Carving Fragments
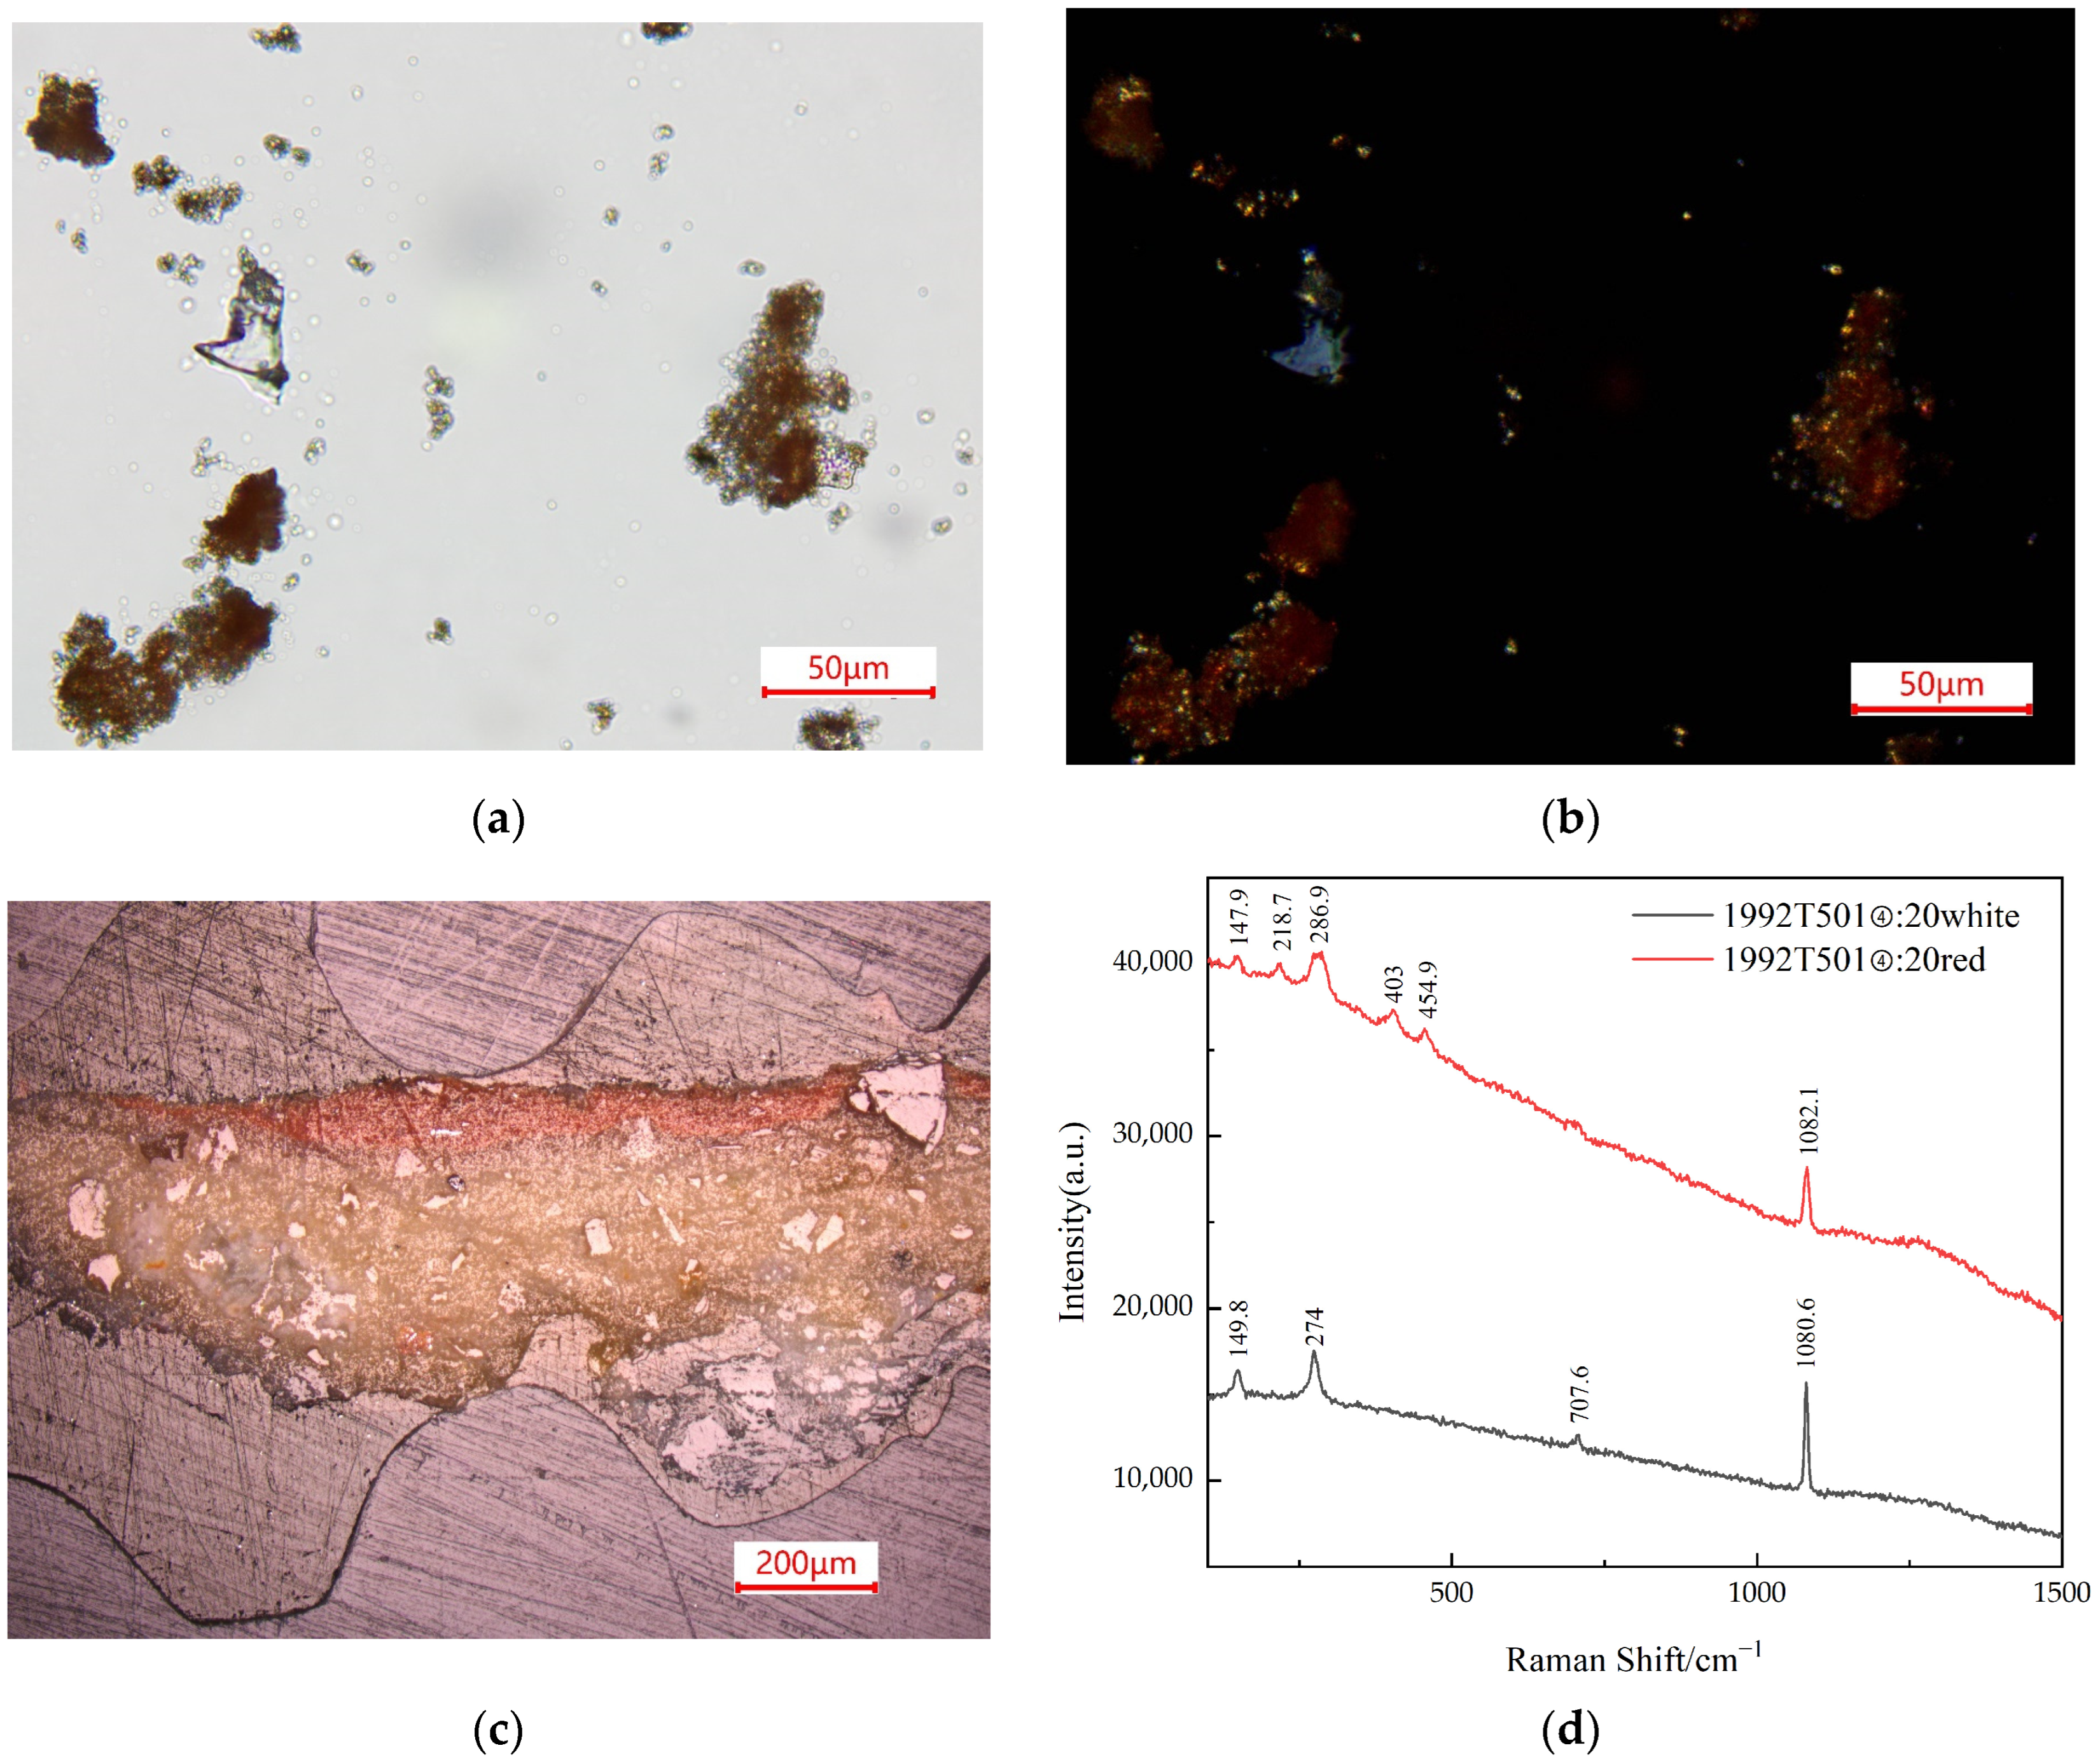
In the observation of a thin section prepared from a small quantity of pigment particles collected from sample 1992T501④:20 in front of Cave 20,
Figure 1a reveals that the red pigment appears earth red under single-polarized light, with a relatively rounded edge.
Figure 1b shows a dark red color under orthogonal polarized light, with no extinction when rotating the stage, while the white pigment appears transparent and crystalline in single-polarized light, taking on a rock-like structure, and exhibits strong extinction under orthogonal polarized light. In
Figure 1c, it can be observed that the surface of the sample is covered with a layer of red pigment, beneath which lies a white underlying layer. The results from scanning electron microscopy–energy dispersive X-ray spectrometry (SEM-EDS) are presented in
Table 2. The red pigment layer contains 44.9% O and 44.2% Fe, while the white underlying layer contains 40.1% Ca and 54.8% O. Raman test results in
Figure 1d show characteristic peaks of hematite in the red pigment at 218.7 cm
−1, 286.9 cm
−1, 403 cm
−1, and 454.9 cm
−1. Additionally, characteristic peaks of calcite are observed in the white pigment at 149.8 cm
−1, 274 cm
−1, 707.6 cm
−1, and 1080.6 cm
−1. In conclusion, the red pigment is identified as hematite, while the white pigment, identified as calcite, constitutes the underlying layer.
For the green pigment from sample 1992KQC:0773 collected inside Cave 18, observations under the polarizing microscope reveal different depths of green under single-polarized light, as shown in
Figure 2a. Some particles exhibit a rock-like structure, with localized black spots within the crystals.
Figure 2b demonstrates the appearance of four instances of extinction under orthogonal polarized light. In the in situ microscopic photograph (
Figure 2c), the pigment appears light green and is directly applied to the rock surface without an underlying layer. The pXRF results are shown in
Table 3, indicating that the samples contain not only significant amounts of Si, Al, Ca, and S but also small quantities of Cu. The SEM-EDS analysis results for pigment particles are presented in
Table 2, revealing that the samples contain 34% O and 23.9% Cu, with lower concentrations of other elements.
Figure 2d reveals Raman analysis results, showcasing characteristic peaks of gypsum at 414.3 cm
−1, 494.6 cm
−1, 618.9 cm
−1, 1008.4 cm
−1, and 1132.7 cm
−1. However, no distinctive peaks corresponding to the green pigment were detected. This absence could be attributed to impurities in the sample. It is inferred that the green pigment is likely malachite, potentially mixed with gypsum.
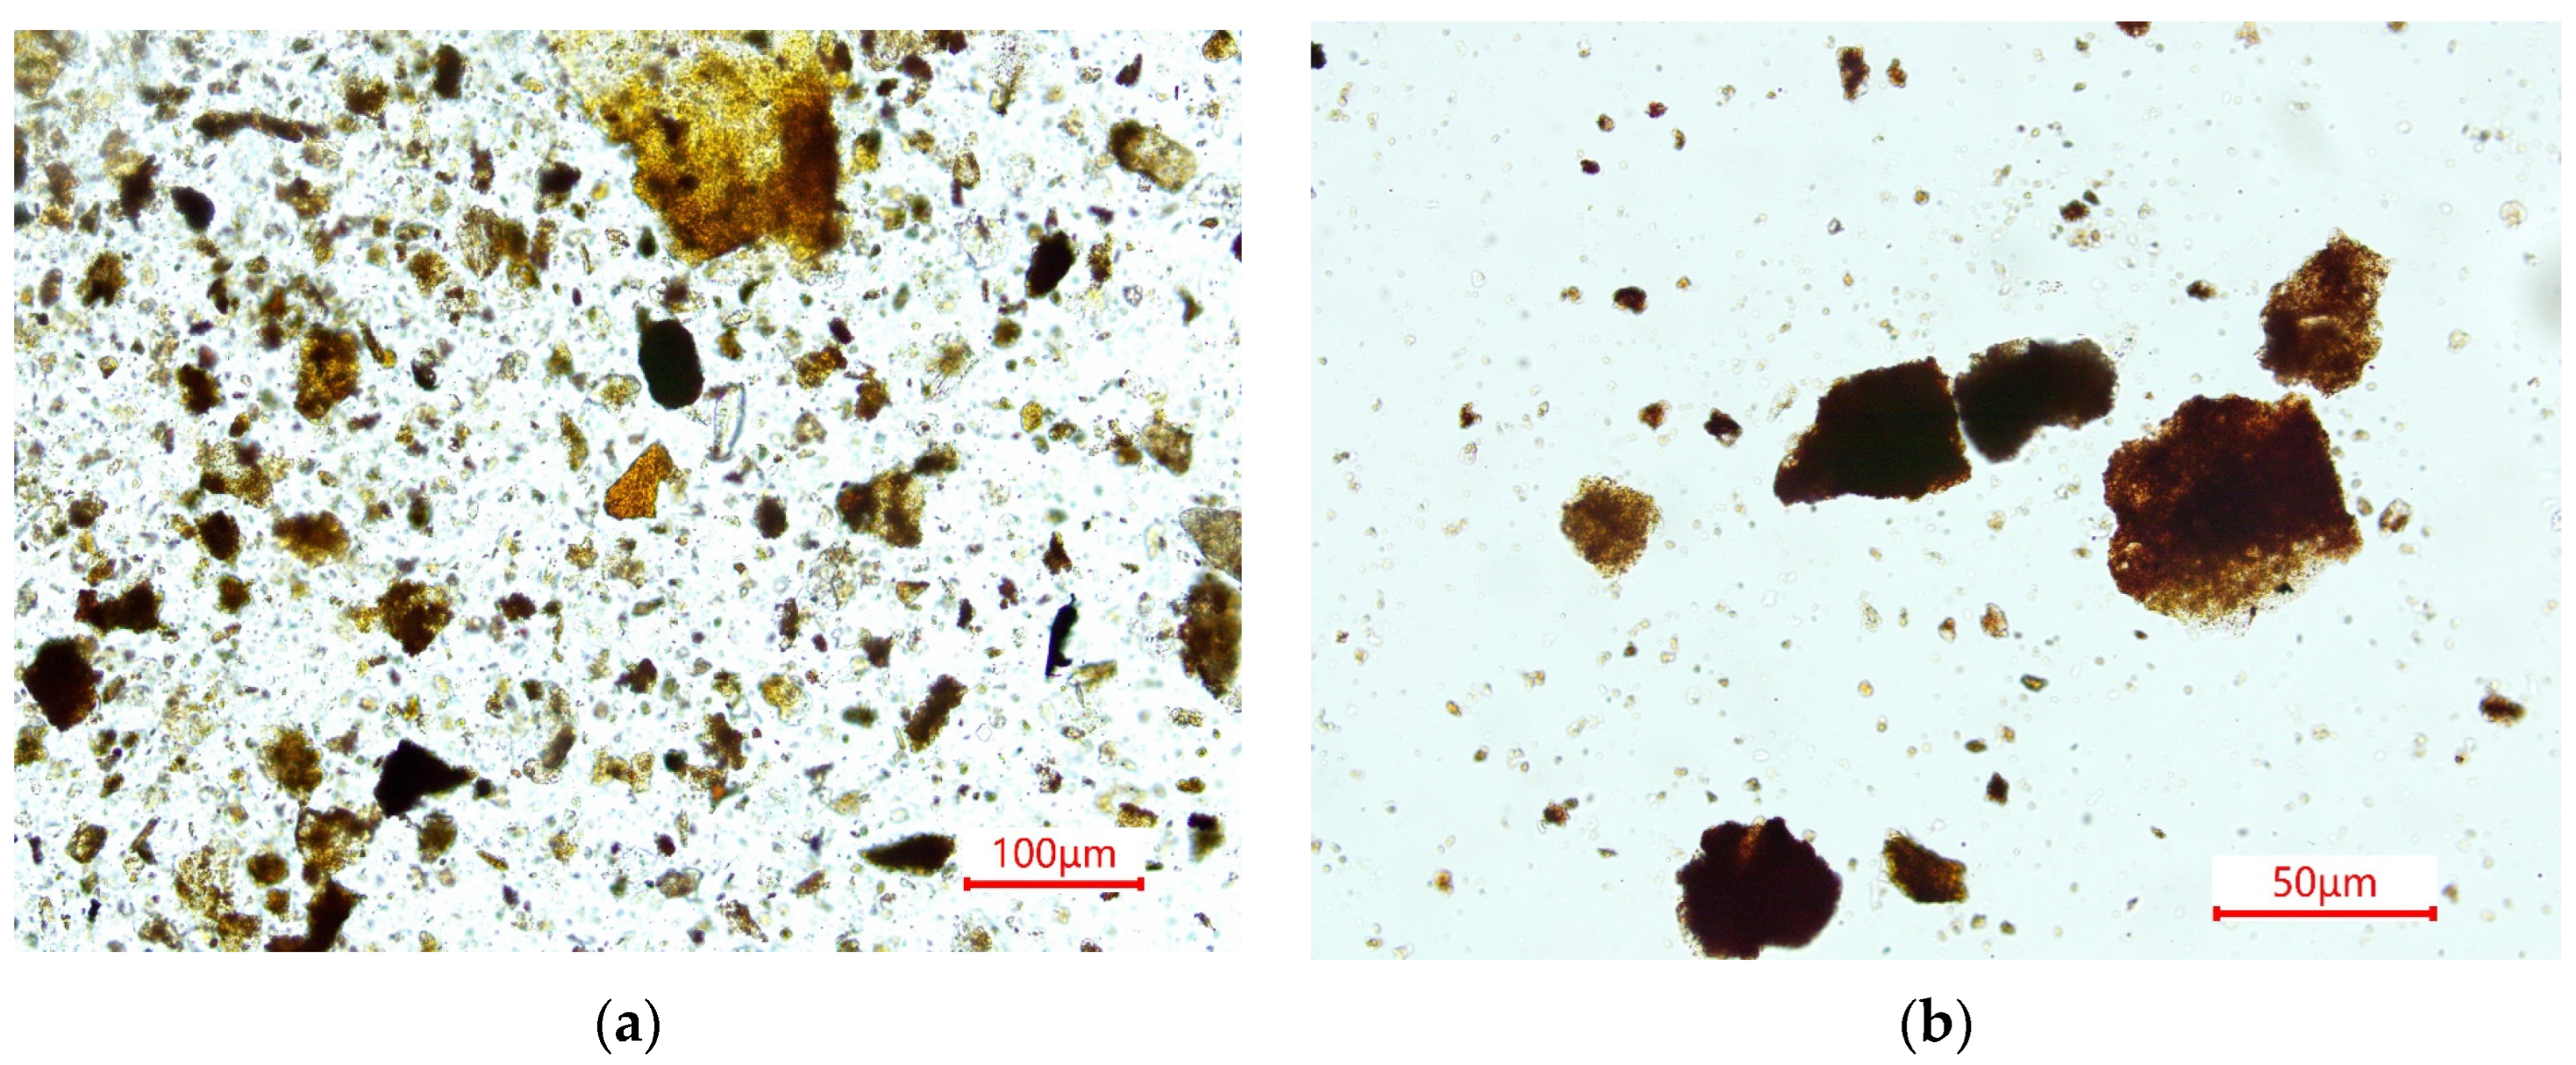
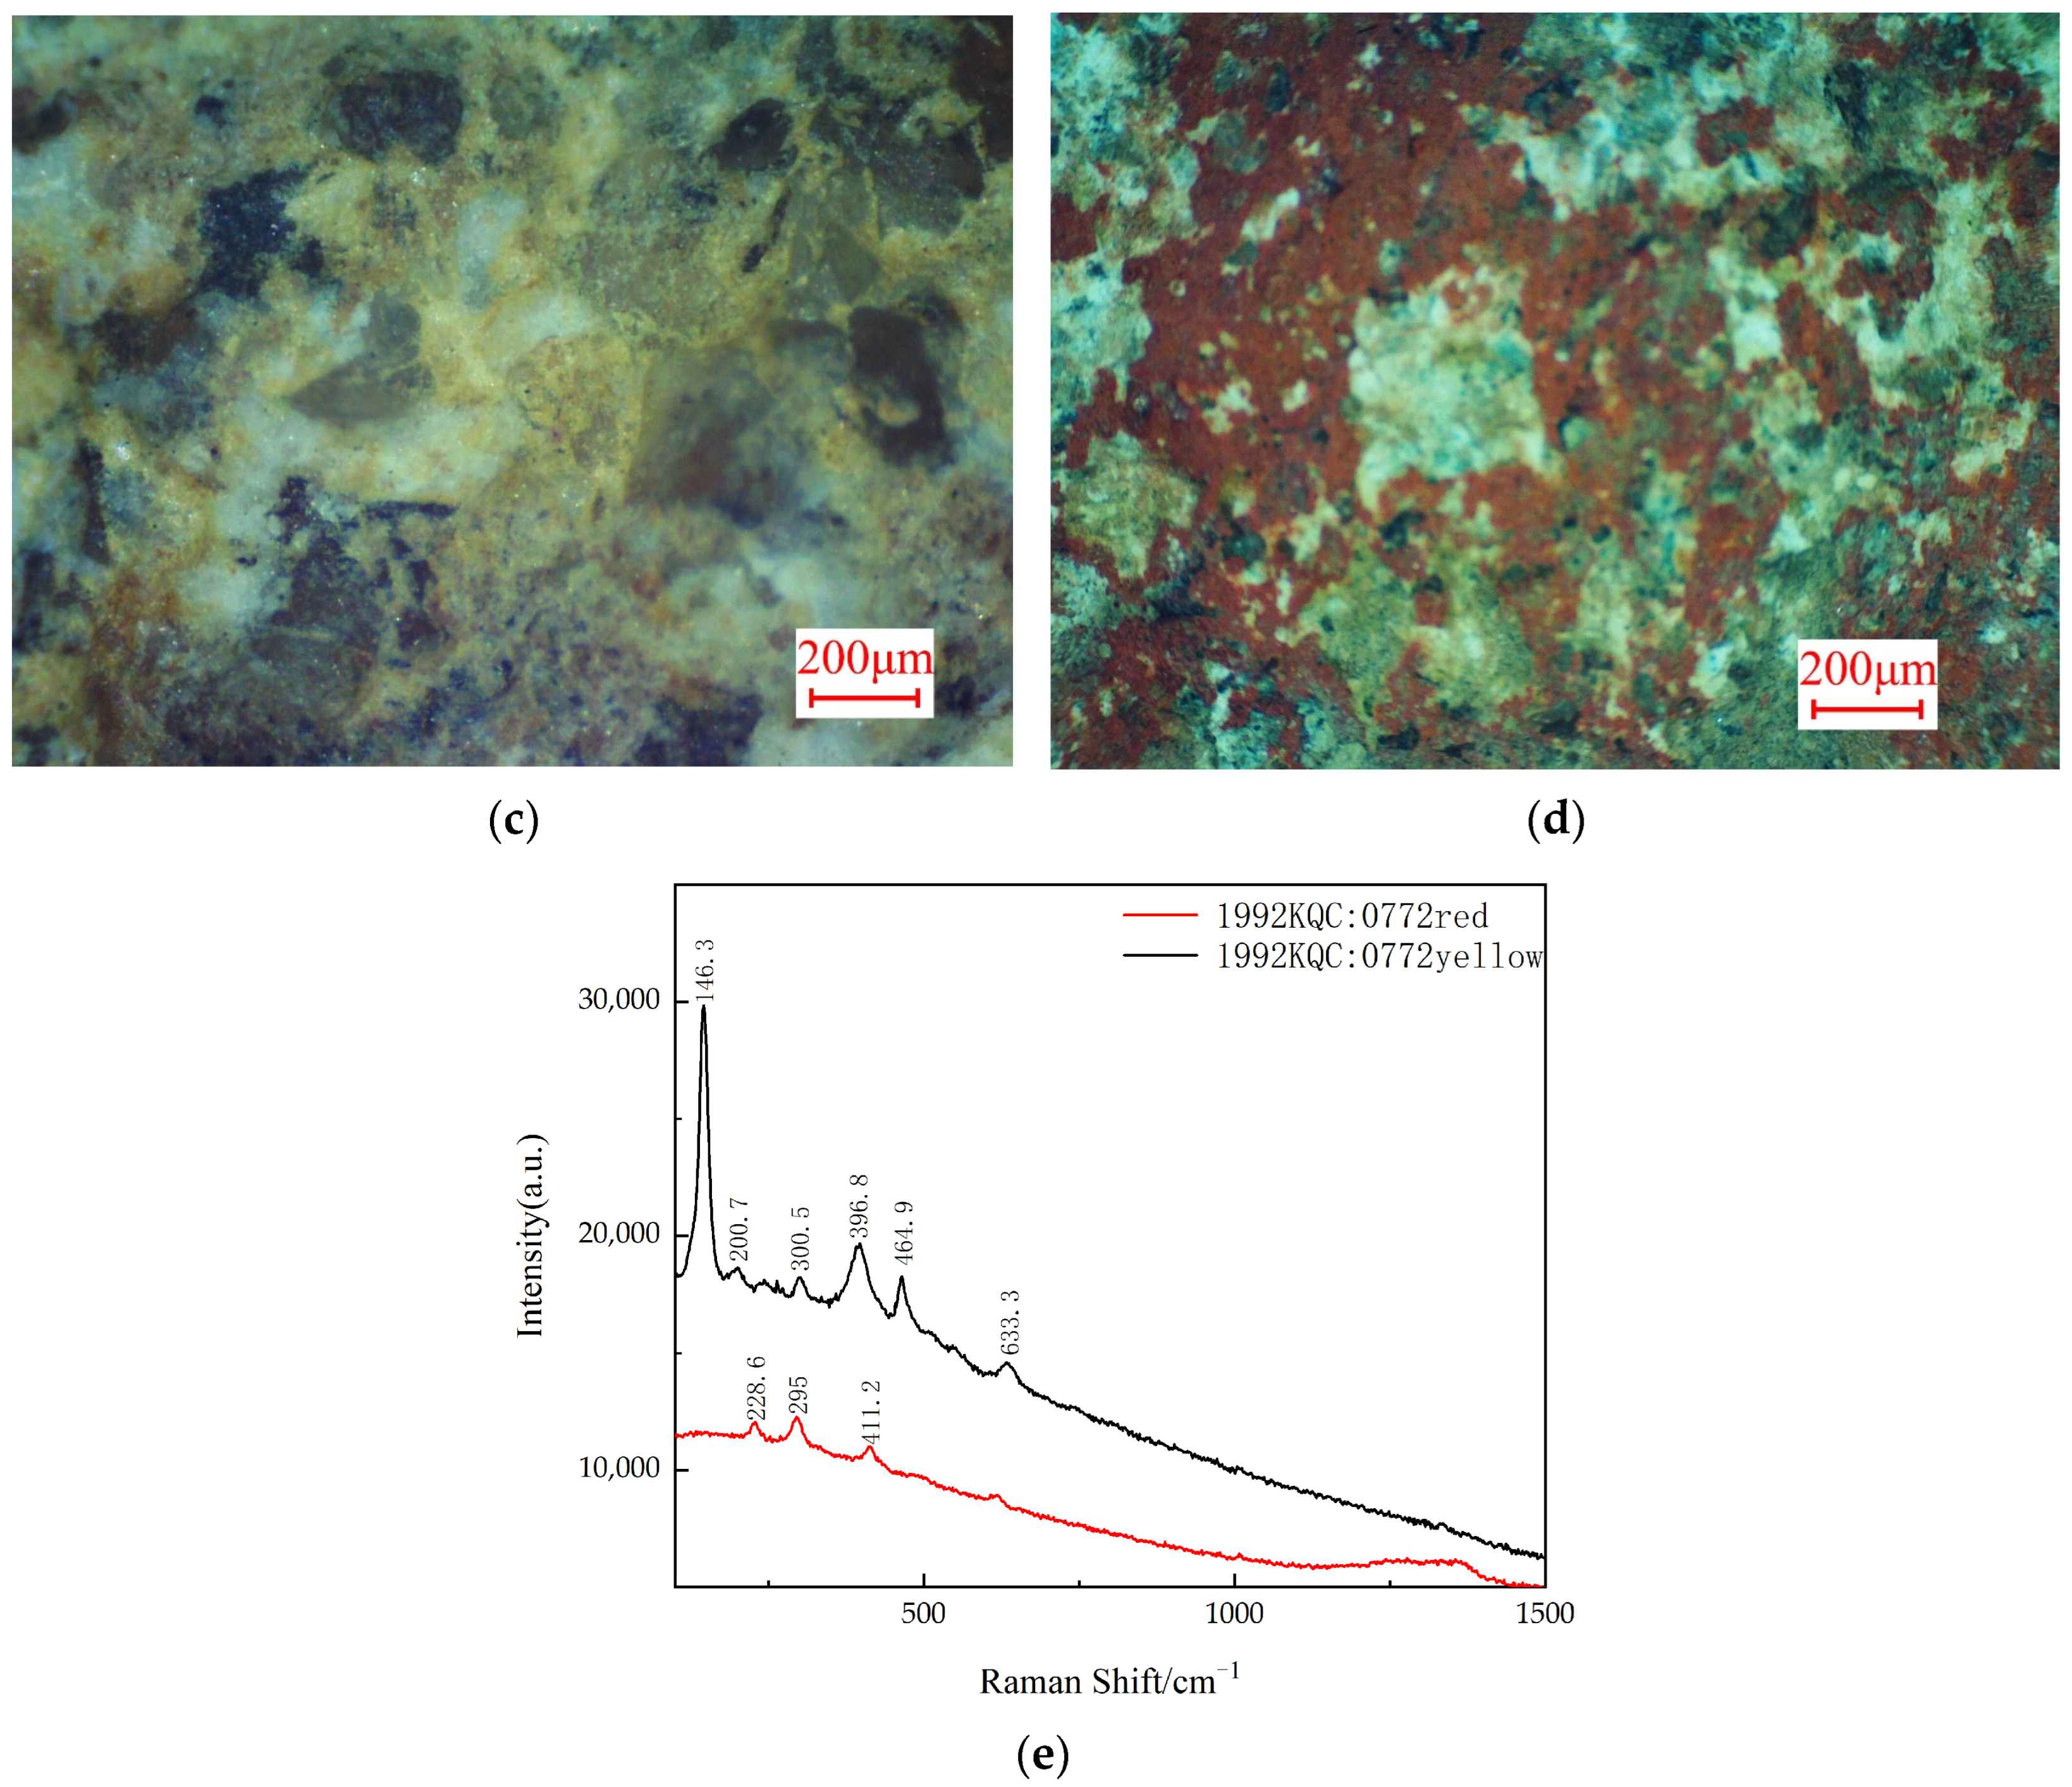
The yellow pigment from the sample 1992KQC:0772, collected in front of the cave, exhibits yellow ochre under single-polarized light, as depicted in
Figure 3a, appearing as fragmented rock-like structures. Additionally,
Figure 3b illustrates a red pigment from the same sample, showing a dark red color under single-polarized light with a fragmented rock-like appearance and complete extinction under orthogonal polarized light. Both
Figure 3c,d illustrate that the yellow and red pigments are directly applied to the rock surface without an underlying layer. The pXRF results, as shown in
Table 3, indicate that both the yellow and red pigments contain a significant amount of Si and Al, along with a considerable amount of Fe, while other elements are present in lower concentrations. As illustrated in
Table 2, the SEM-EDS results for yellow and red pigments are similar. The yellow pigment contains 51.7% O, 17.7% Si, 13.5% Fe, and 12.1% Al, while the red pigment consists of 54.4% O, 17.2% Si, 13.5% Fe, and 10.2% Al. The Raman results, as shown in
Figure 3e, reveal characteristic peaks for goethite in the yellow pigment at 300.5 cm
−1, 396.8 cm
−1, and 464.9 cm
−1, while the red pigment exhibits characteristic peaks for hematite at 228.6 cm
−1, 295 cm
−1, and 411.2 cm
−1. In conclusion, the yellow pigment is identified as goethite, and the red pigment as hematite.
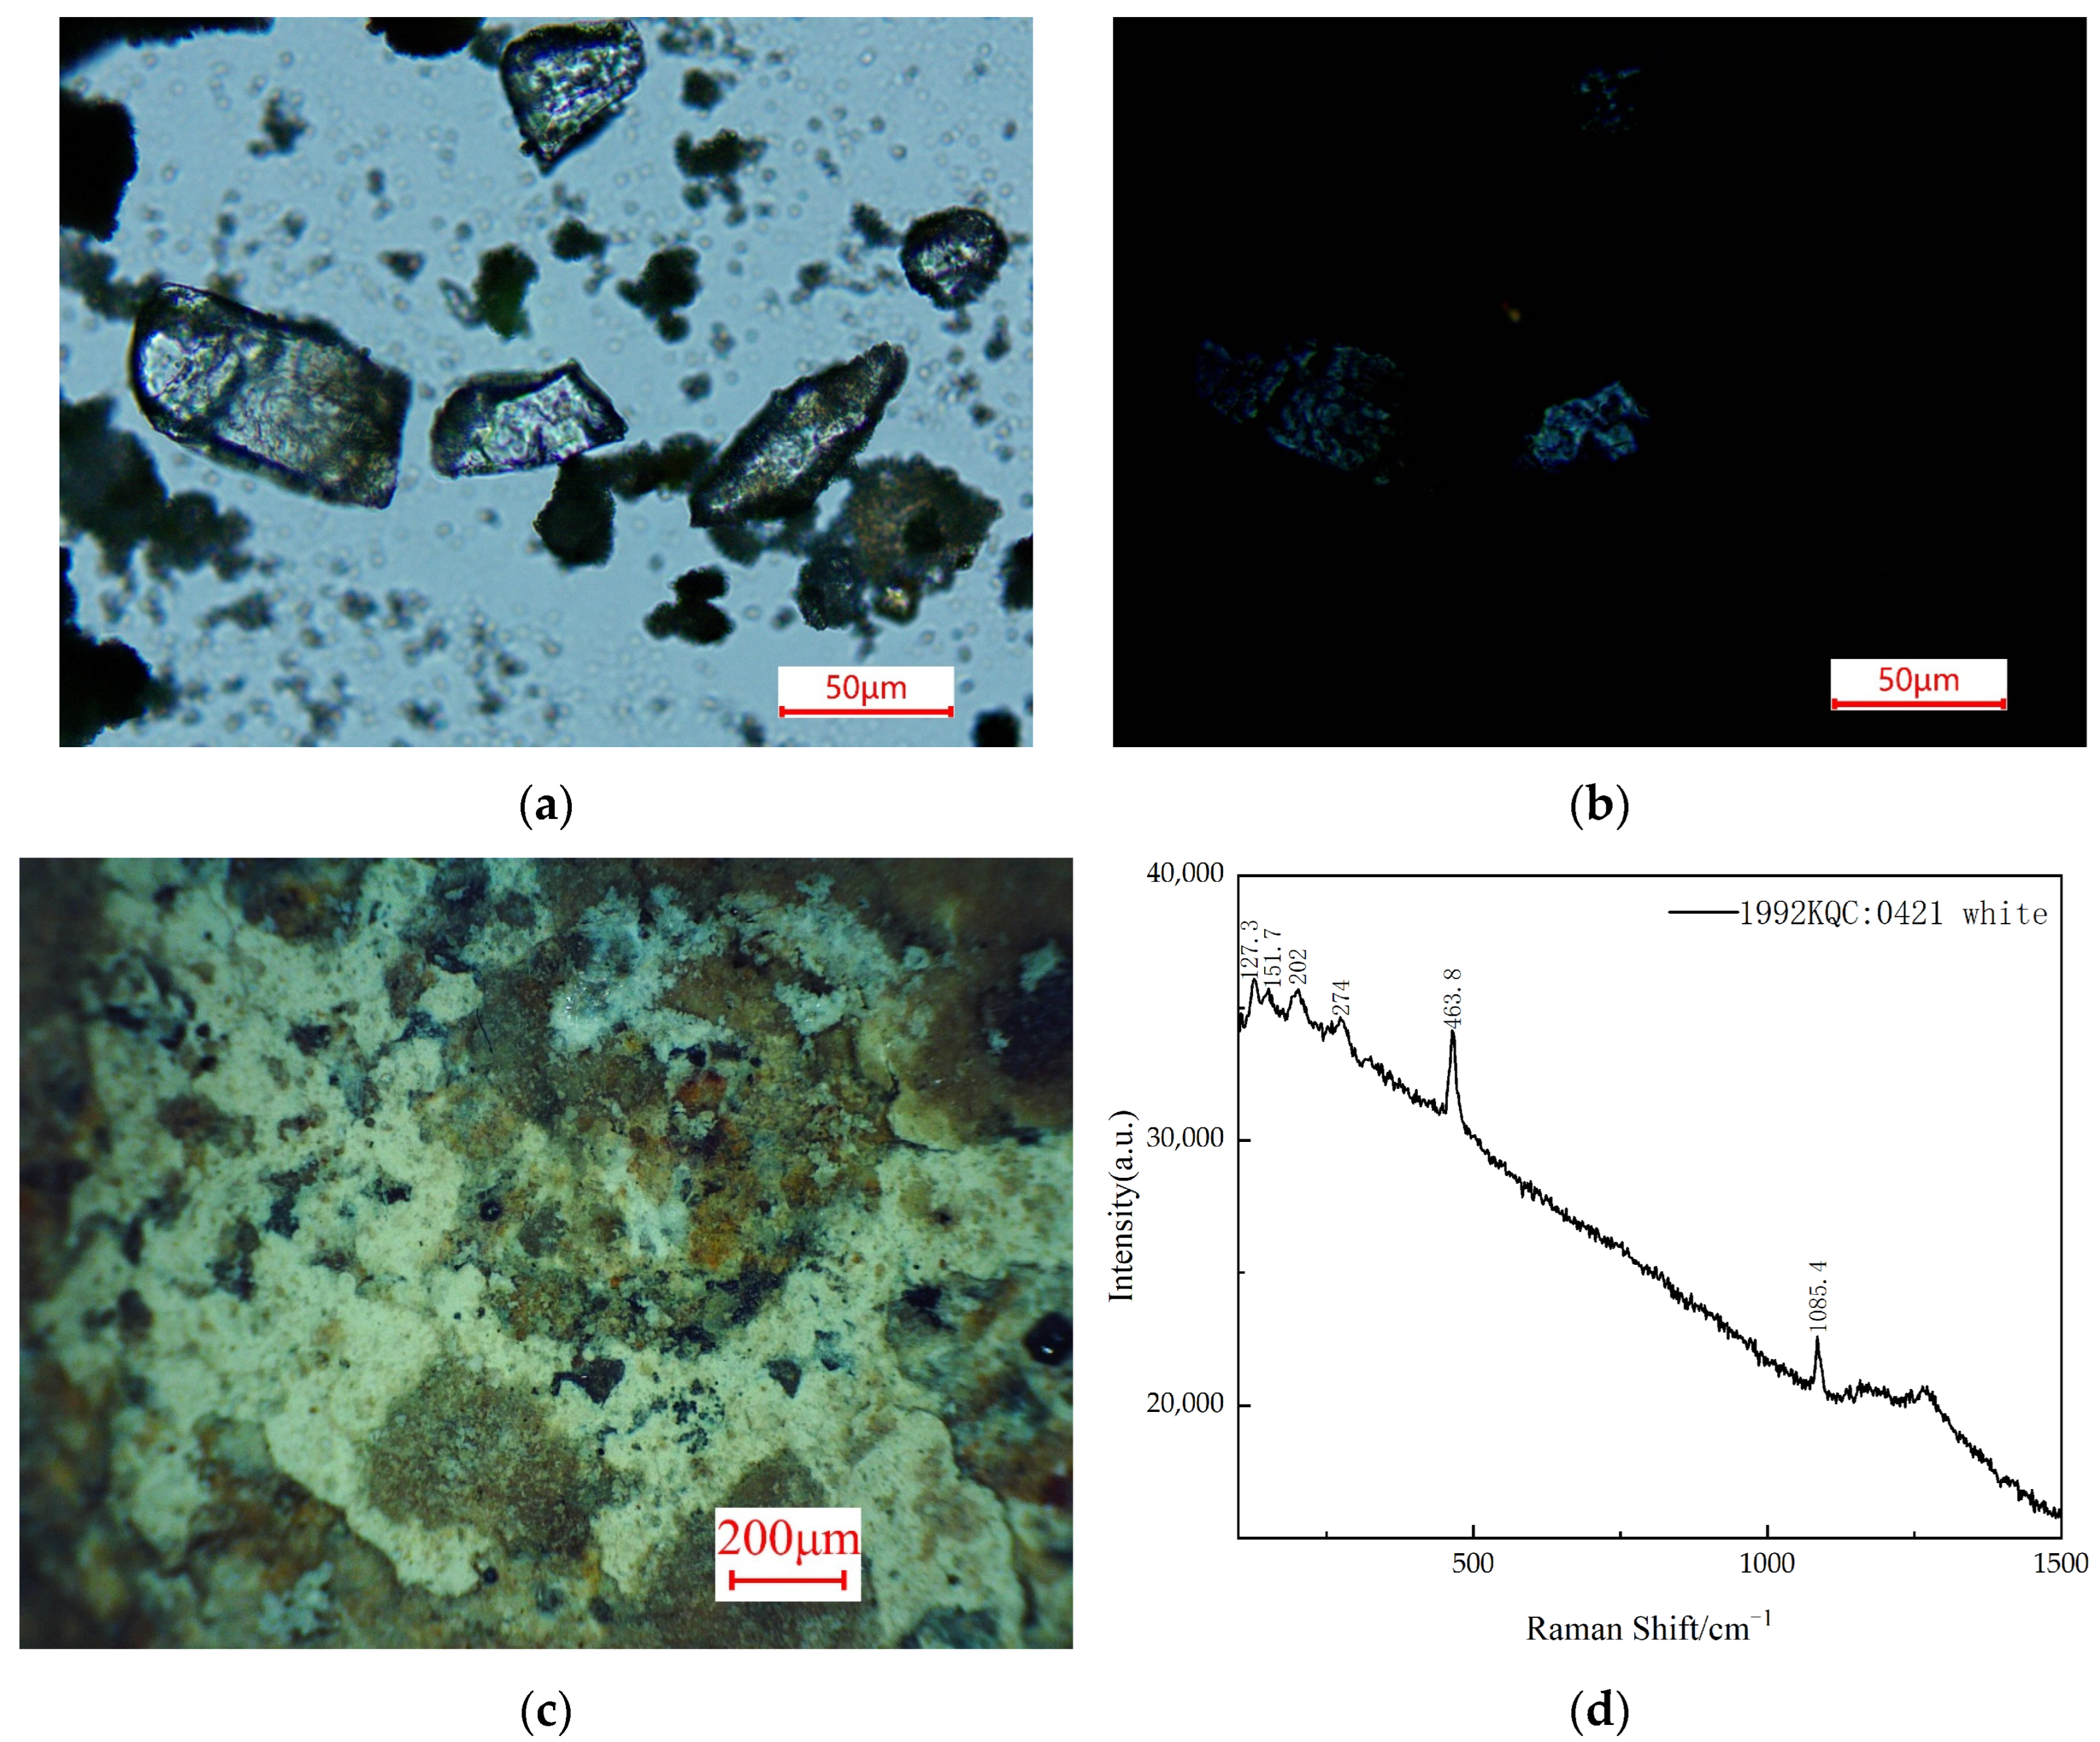
As shown in
Figure 4a,b, the white pigment of the sample 1992KQC:0421 collected from the front of the cave appears white and semi-transparent under single-polarized light, with well-defined crystals, and exhibits clear extinction under orthogonal polarized light. The in situ microscopy image in
Figure 4c reveals that the white pigment layer is relatively thick and is directly applied to the surface of the rock. The pXRF results for the sample, as shown in
Table 3, indicate that the white pigment contains a significant amount of Ca and S, along with small quantities of Si and Al. The SEM-EDS results, presented in
Table 2, reveal that the sample comprises 58.4% O, 14.9% Si, 11% Al, and 10.8% Ca. Raman spectroscopy results in
Figure 4d show characteristic peaks of calcite at 151.7 cm
−1, 274 cm
−1, 707.6 cm
−1, and 1085.4 cm
−1, confirming that the white pigment is composed of calcite.
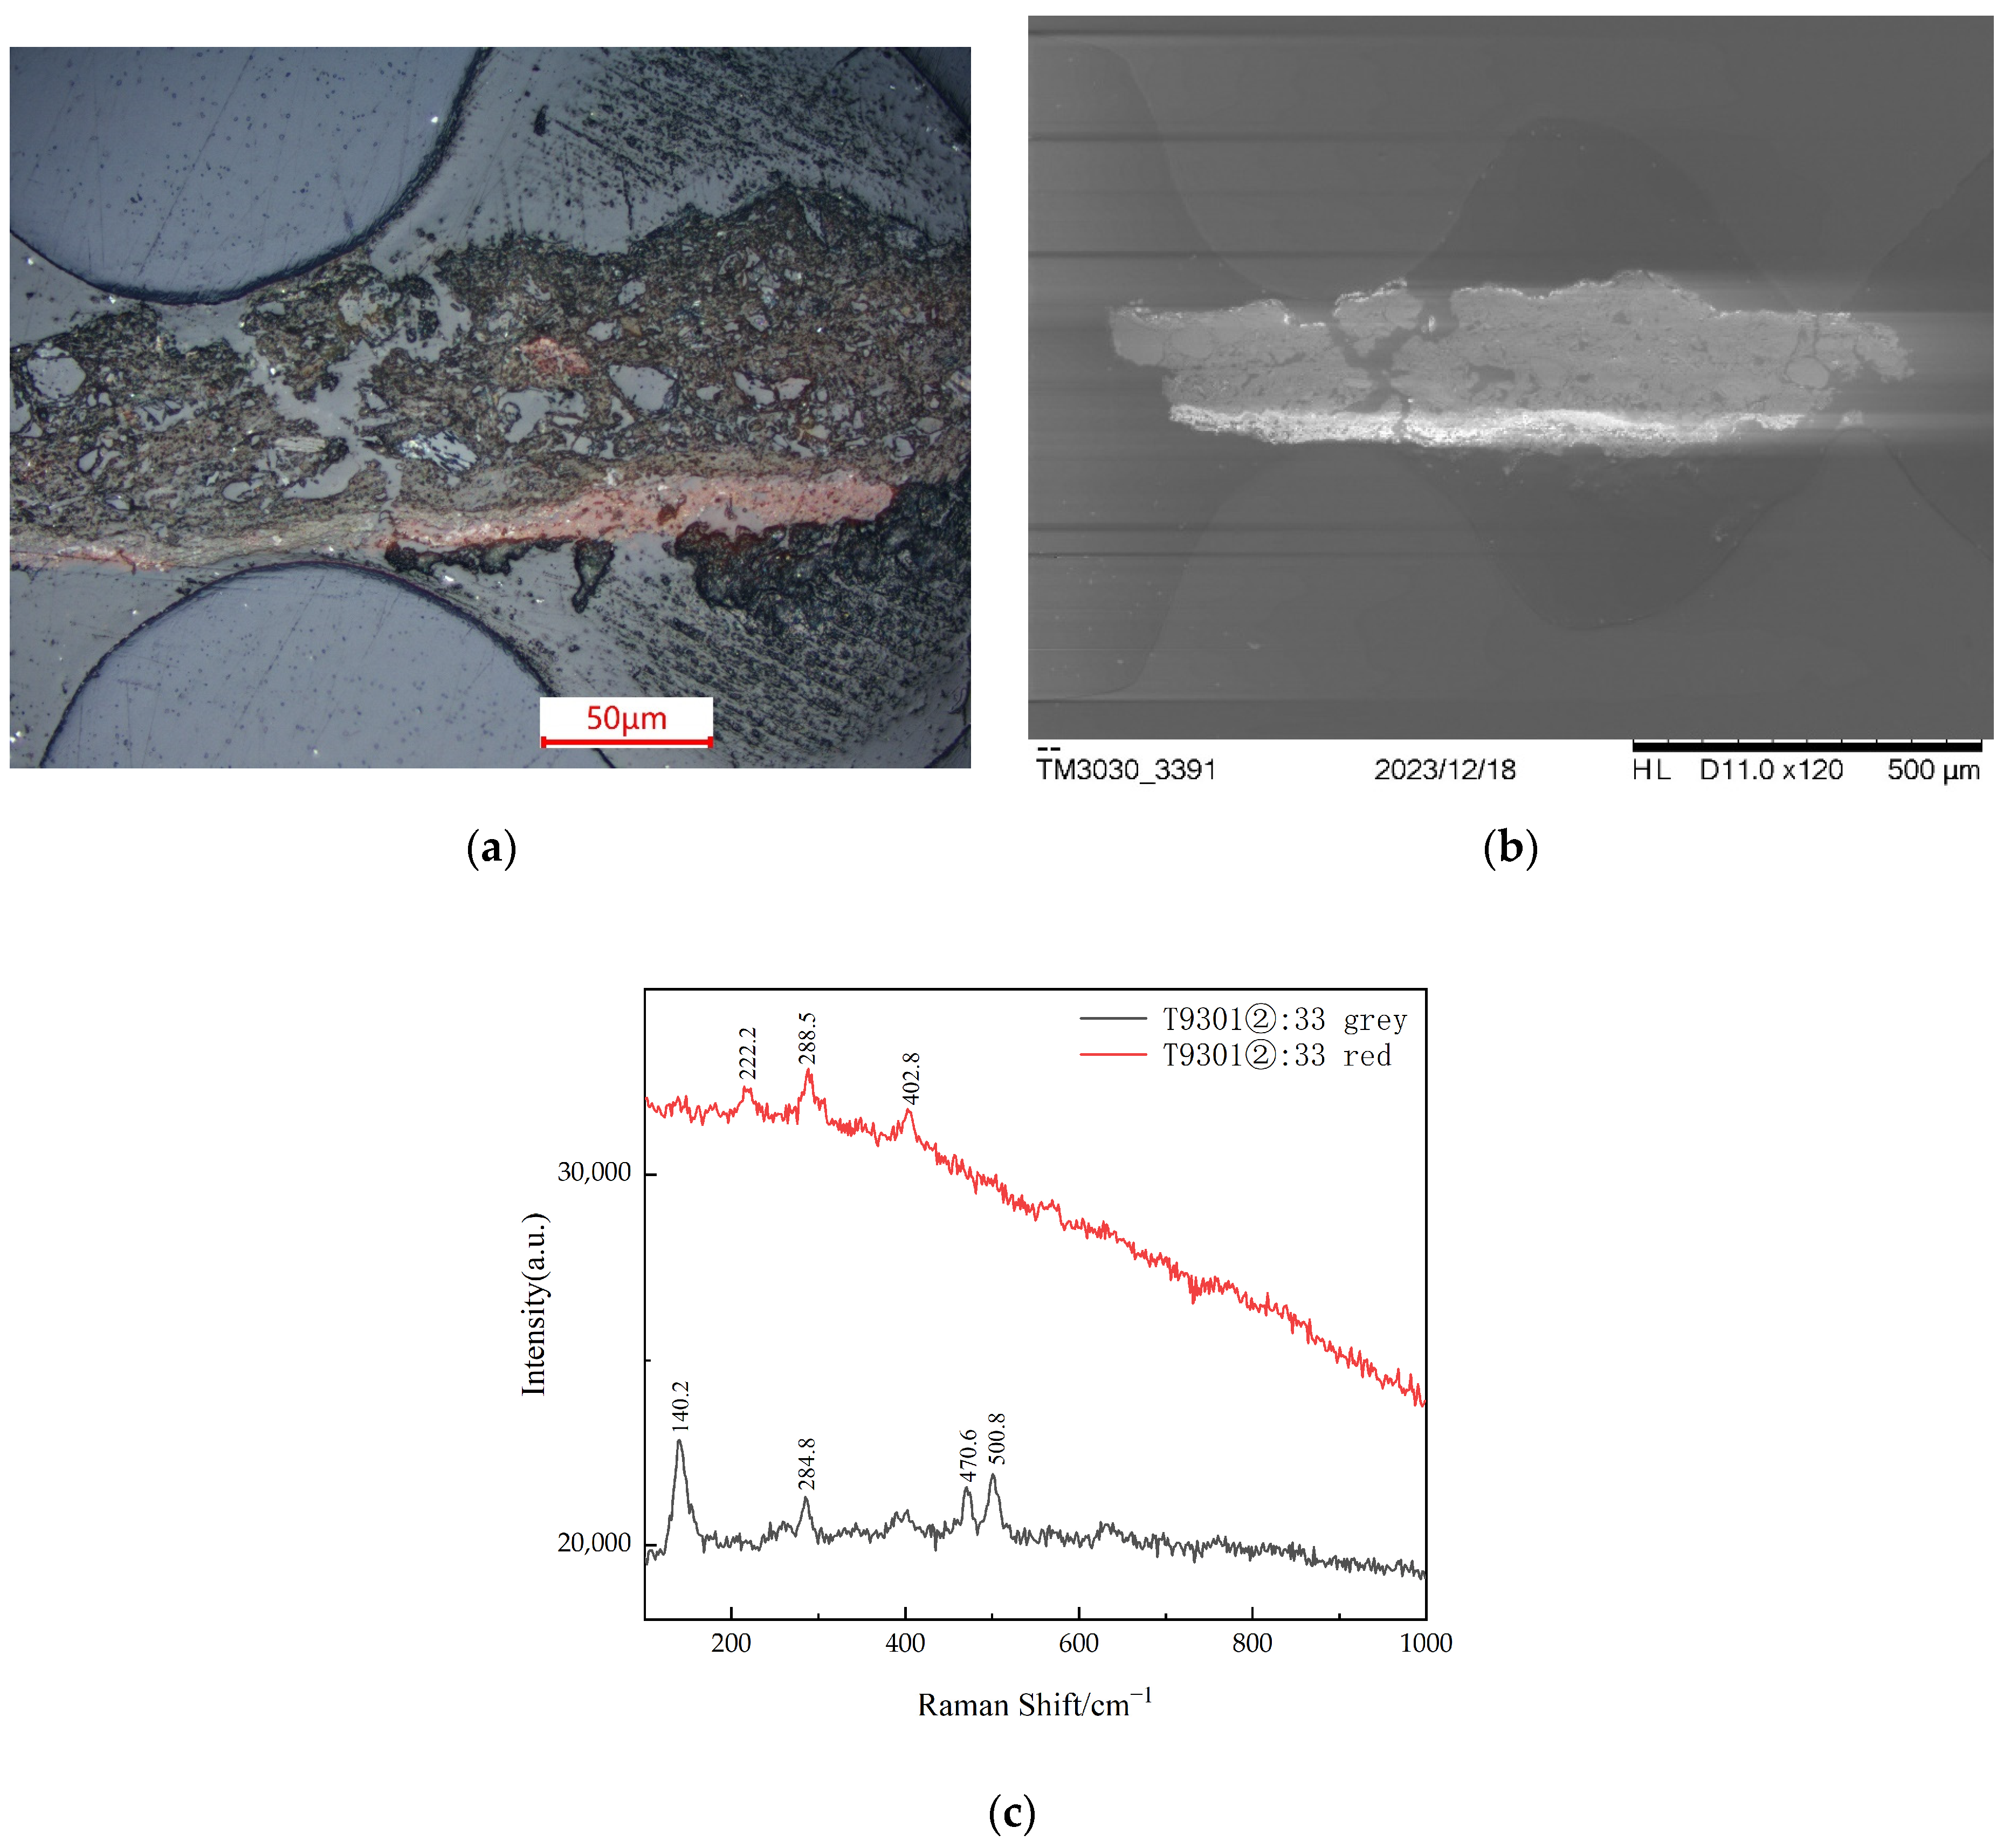
Unlike the stone carvings excavated from the front layers of the cave, Sample T9301②:33 originates from the remains of sculpted pieces within the temple situated on the eastern part of the summit. As is evident from both
Figure 5a,b, the sample exhibits three layers from the innermost to the outermost: red, white, and gray-black. SEM results are presented in
Table 2, indicating that the red layer contains 41.3% O, 18.8% Fe, and 12.5% Pb, along with trace amounts of Si, Al, and Ca. The white layer comprises 44.5% Pb, 27.3% O, and 15.5% Si. The gray-black layer includes 46.6% O, 21.2% Si, 10.6% Al, and 8.9% Ca. The Raman results in
Figure 5c reveal characteristic peaks of hematite in the red layer at 222.2 cm
−1, 288.5 cm
−1, and 402.8 cm
−1. Additionally, the gray-black layer exhibits characteristic peaks of albite at 140.2 cm
−1, 284.8 cm
−1, 470.6 cm
−1, and 500.8 cm
−1 [
13]. In summary, the coloring material/substance in the red layer is identified as hematite, while that in the white layer is lead white. The gray-black layer might have formed surface encrustations over an extended period, enriched with Si, Al, and Ca.
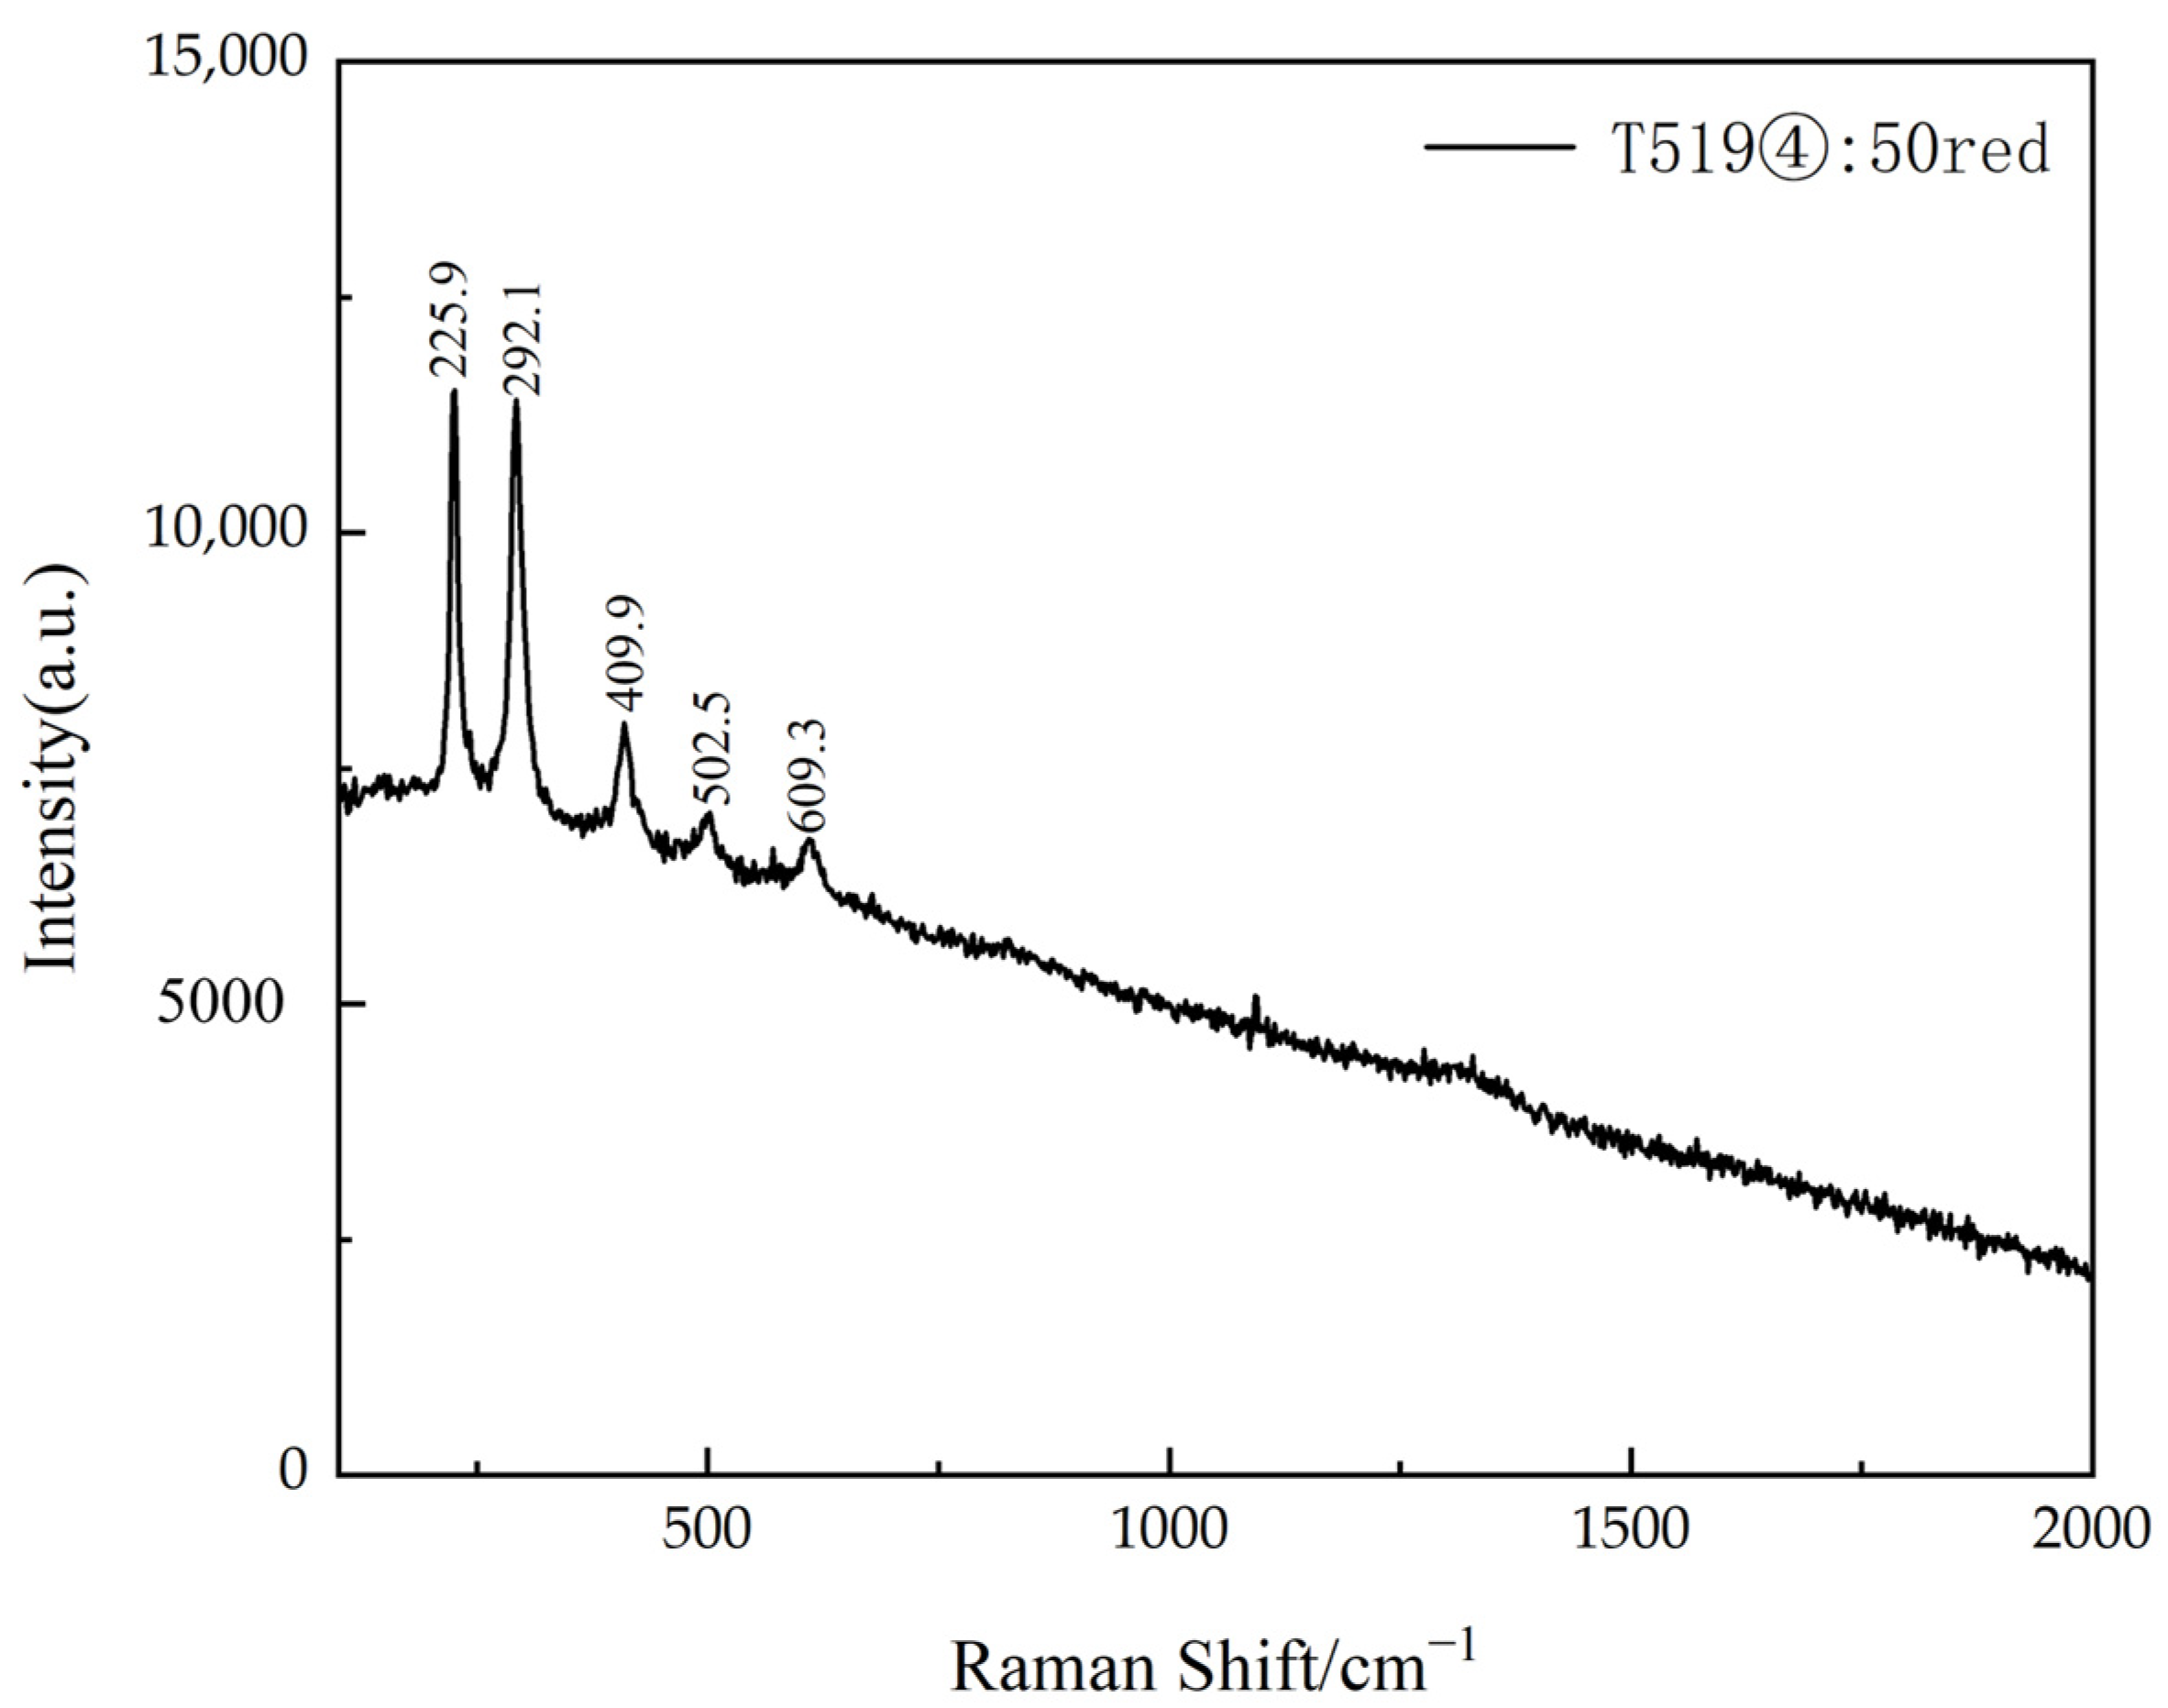
4.1.2. Stone Grinder
Sample T519④:50 is a stone pigment grinder. Observations under polarized light microscopy of the residual red pigment powder in the grinding pit revealed a dark red color with a relatively smooth edge under single-polarized light, while under orthogonal polarized light, it exhibited complete extinction. pXRF results, as shown in
Table 3, indicate that the sample contains essentially no elements other than Al, Si, and Fe. The Raman results, as depicted in
Figure 6, show characteristic peaks of hematite at 225.9 cm
−1, 292.1 cm
−1, 409.9 cm
−1, 502.5 cm
−1, and 609.3 cm
−1, confirming that the red pigment inside the grinder is hematite.
4.1.3. Architectural Component
The red pigment particles collected from the lotus architectural component T9303②:3 exhibit rounded boundaries and a deep red color under single-polarized light under microscopic observation, with complete extinction under orthogonal polarized light. The pXRF results, as shown in
Table 3, indicate higher levels of Fe in addition to Al and Si. It is inferred that the red pigment on the surface of the component is hematite.
4.1.4. Mural Fragment
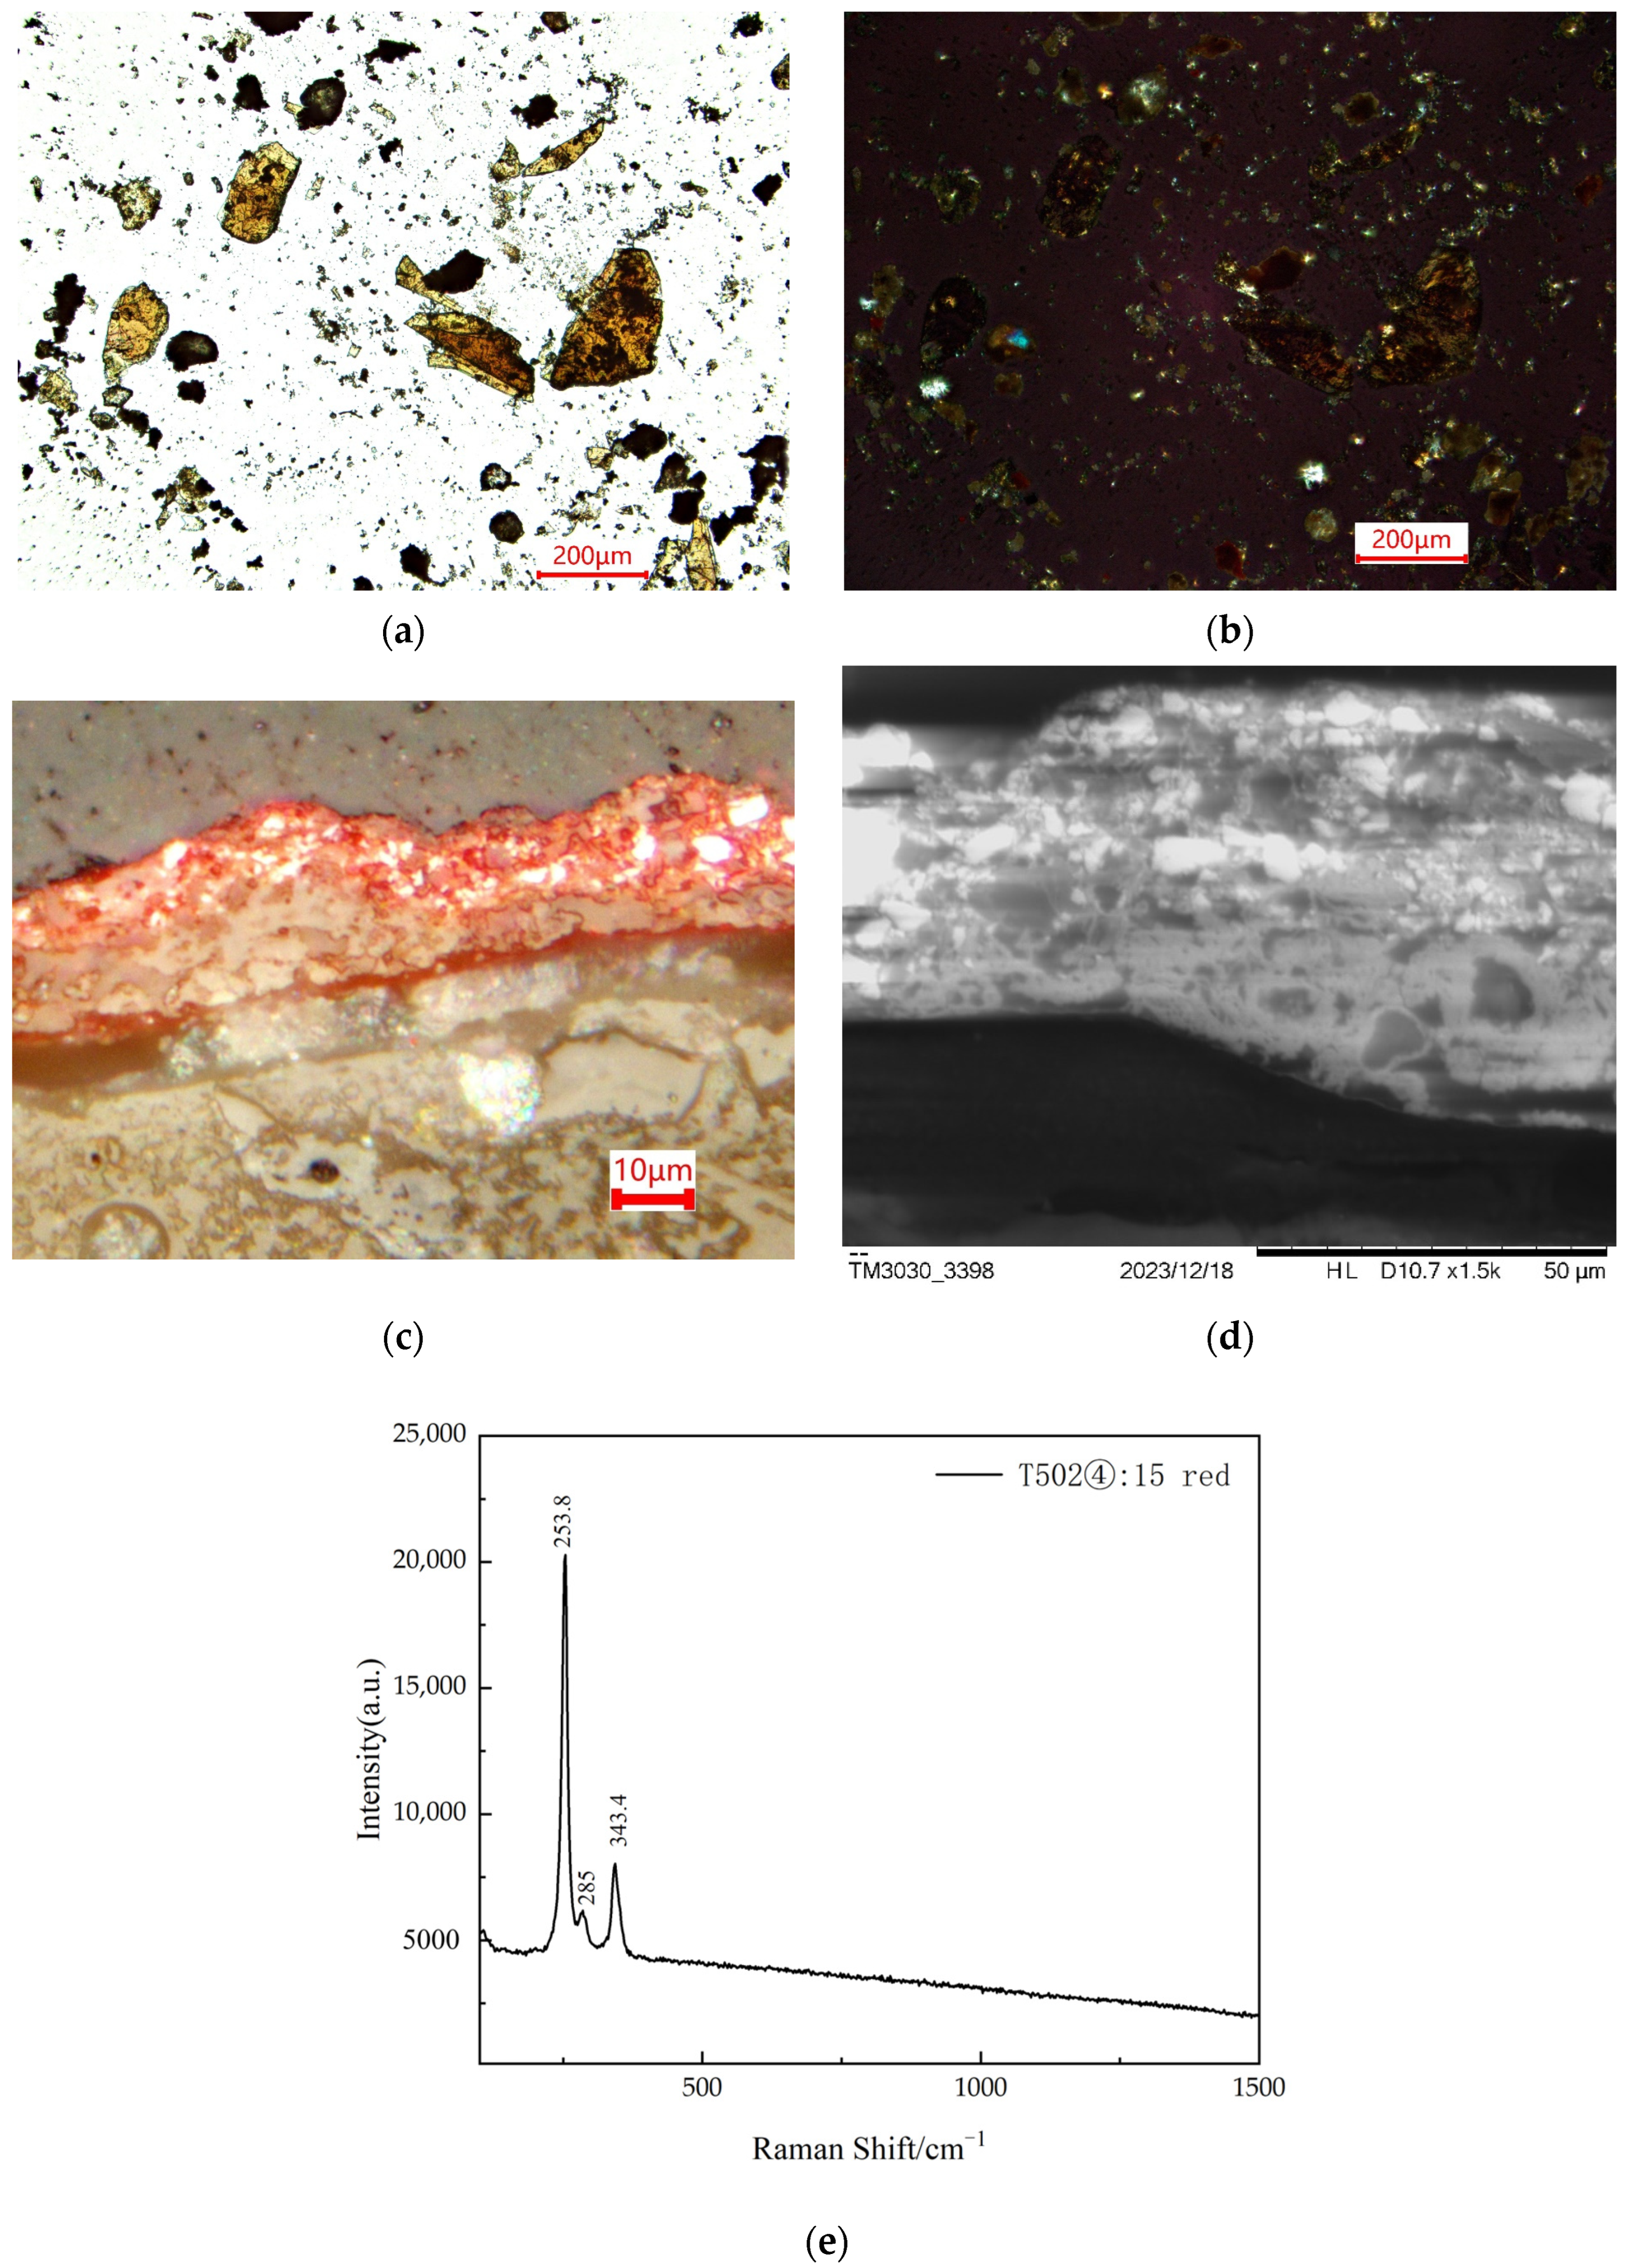
The mural fragment 1992T502④:15, originating from the temple site in front of the cave, displays red, white, and black pigments on its surface. The pXRF analysis results for the surface of the sample are presented in
Table 3, indicating that various pigments and the supporting structure contain a significant amount of Si and Ca, with other elemental contents being relatively low. It is noteworthy that the red pigment contains trace amounts of Hg and Pb elements.
The red pigment particles collected from 1992T502④:15 were observed under a microscope, as depicted in
Figure 7a. The sample appears yellow or orange in single-polarized light, with particles exhibiting fragmented rock-like or elongated shapes. Under orthogonal polarized light, as shown in
Figure 7b, a partial dark red color is observed, with no prominent interference colors. The sample’s cross-section and electron microscope images are illustrated in
Figure 7c and
Figure 7d, respectively. From the outer to the inner layers, there are a red layer and two layers of white pigment. The EDS results in
Table 2 reveal that the red layer contains 75.2% Hg and 13.8% S. The outer white layer contains 61.8% Pb, 15.2% O, and 14.6% Ca, while the inner white layer contains 43.8% O and 39% Ca. The Raman analysis results, as shown in
Figure 7e, reveal characteristic peaks of vermilion at 253.8 cm
−1, 285 cm
−1, and 343.4 cm
−1 in the red pigment. In summary, the red pigment is likely vermilion, the outer white layer is possibly lead white, and the inner white layer may be calcium carbonate.
- 2.
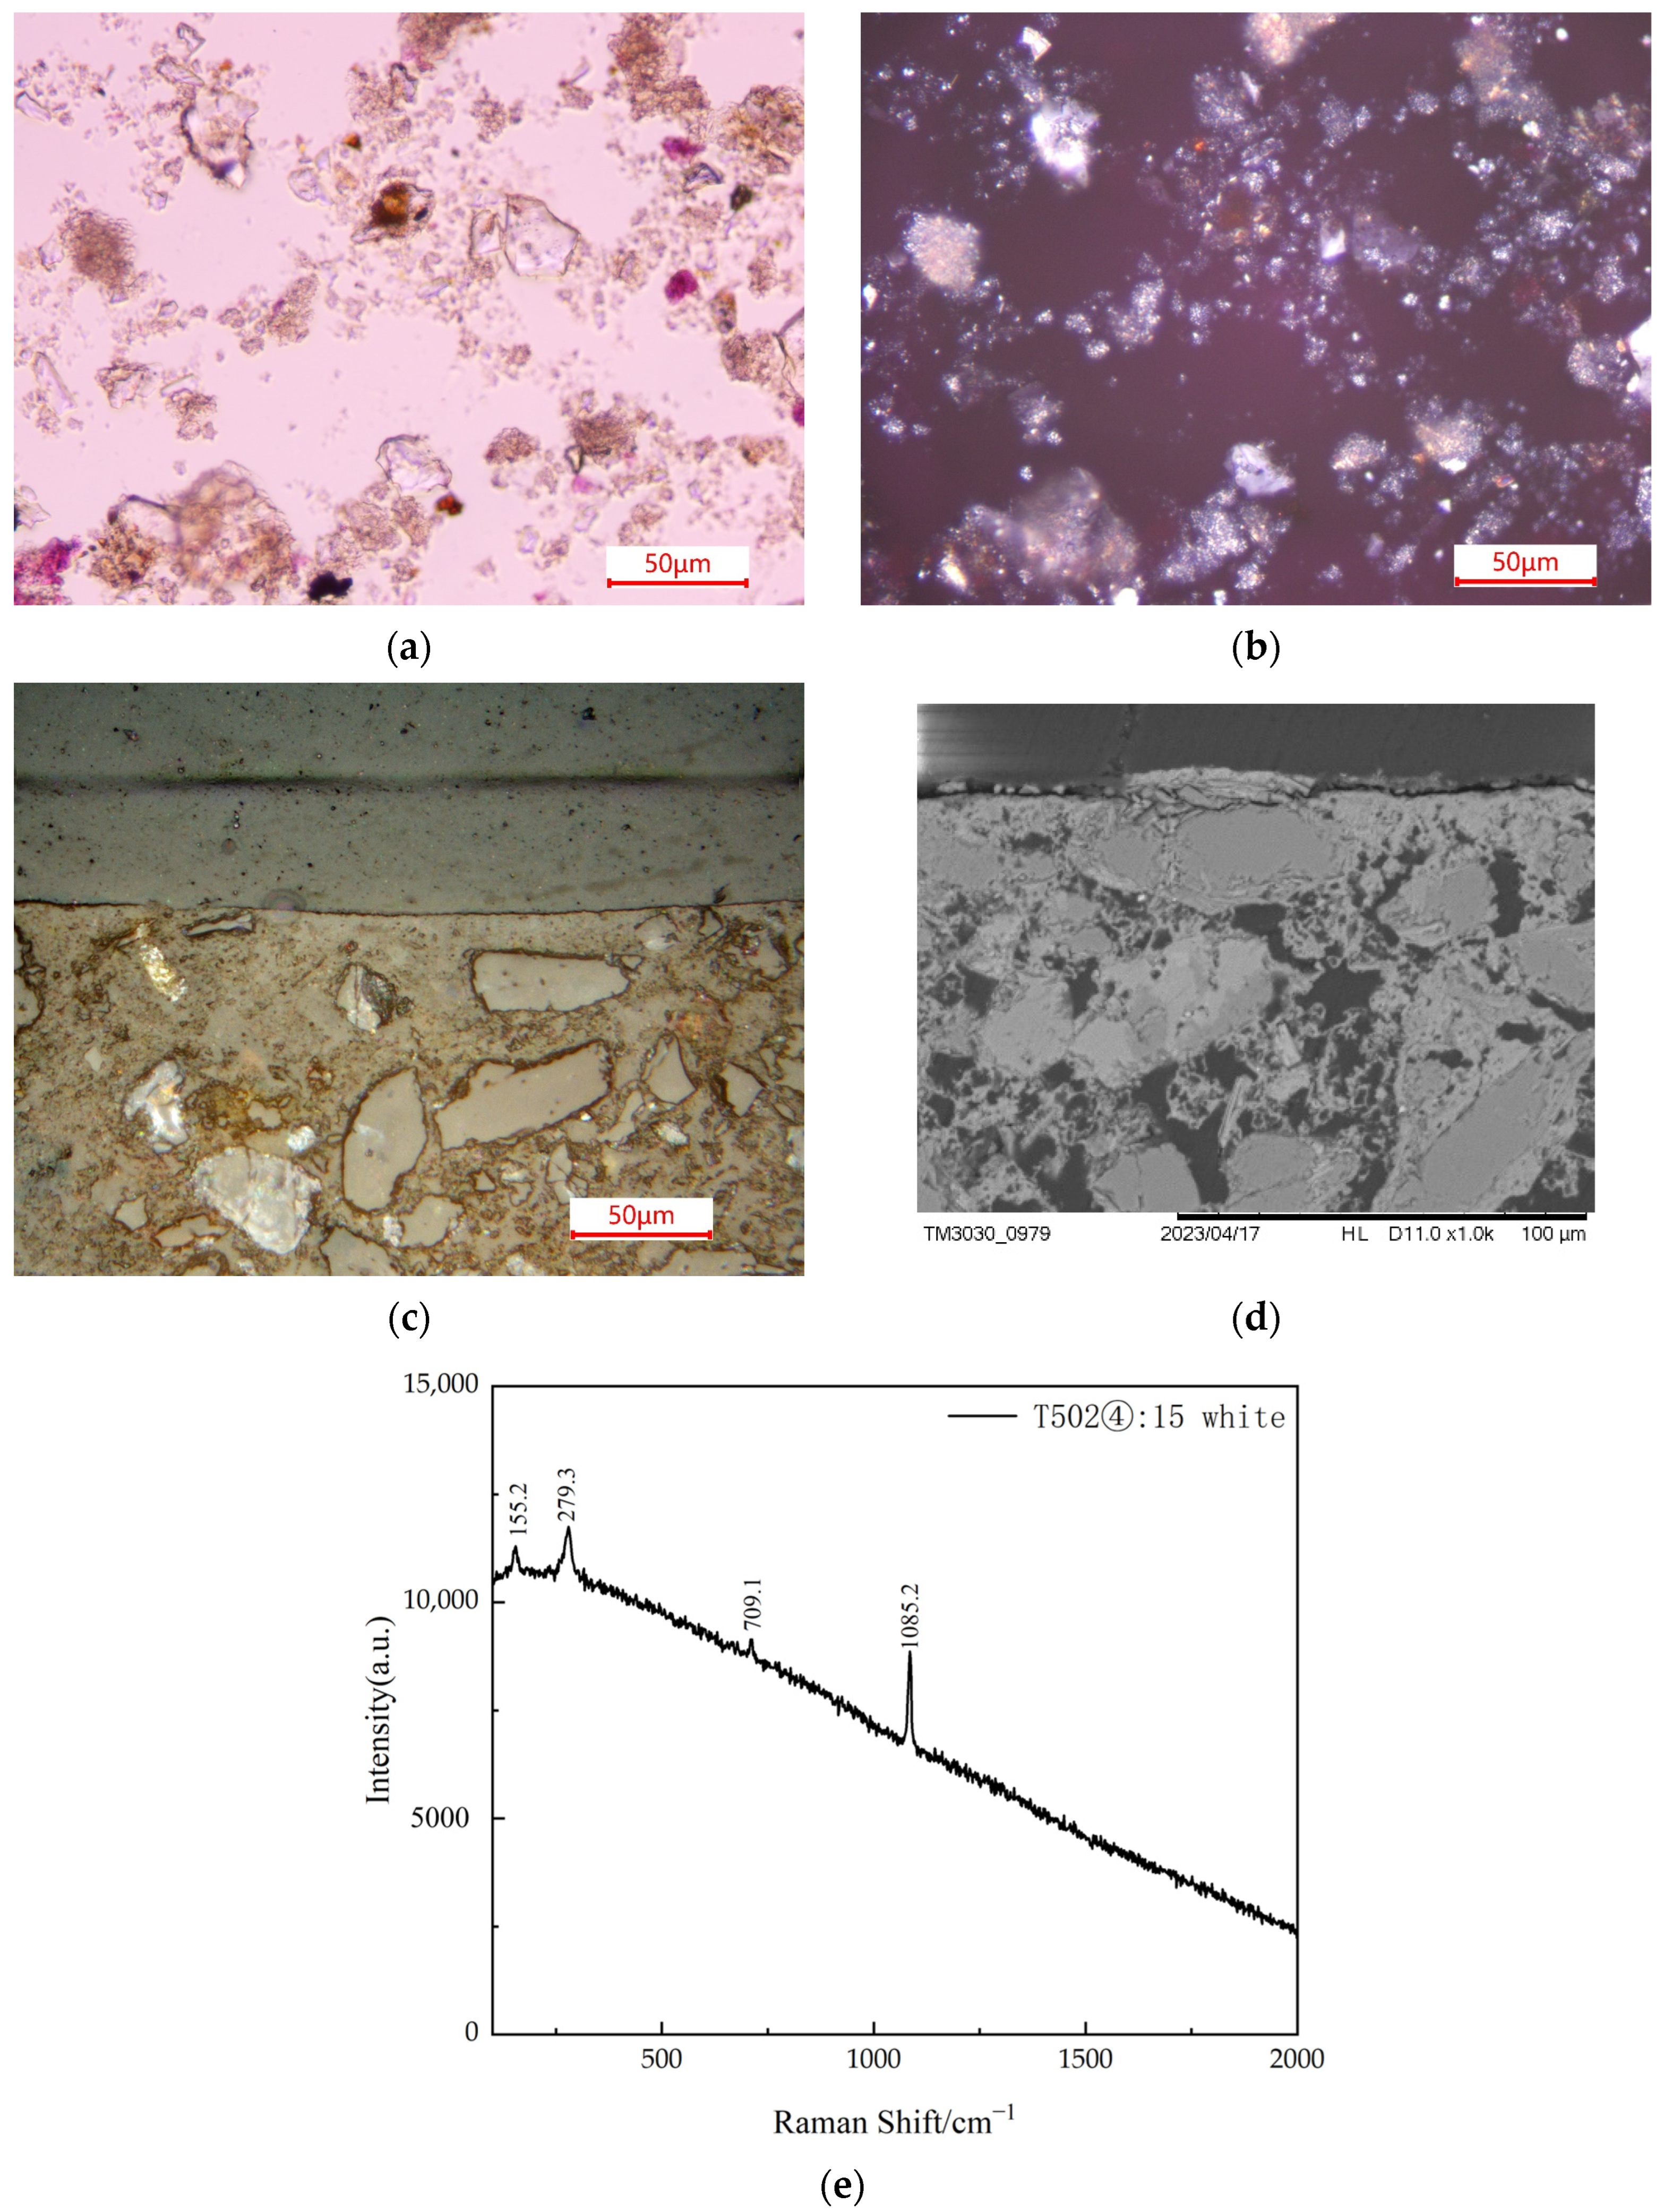
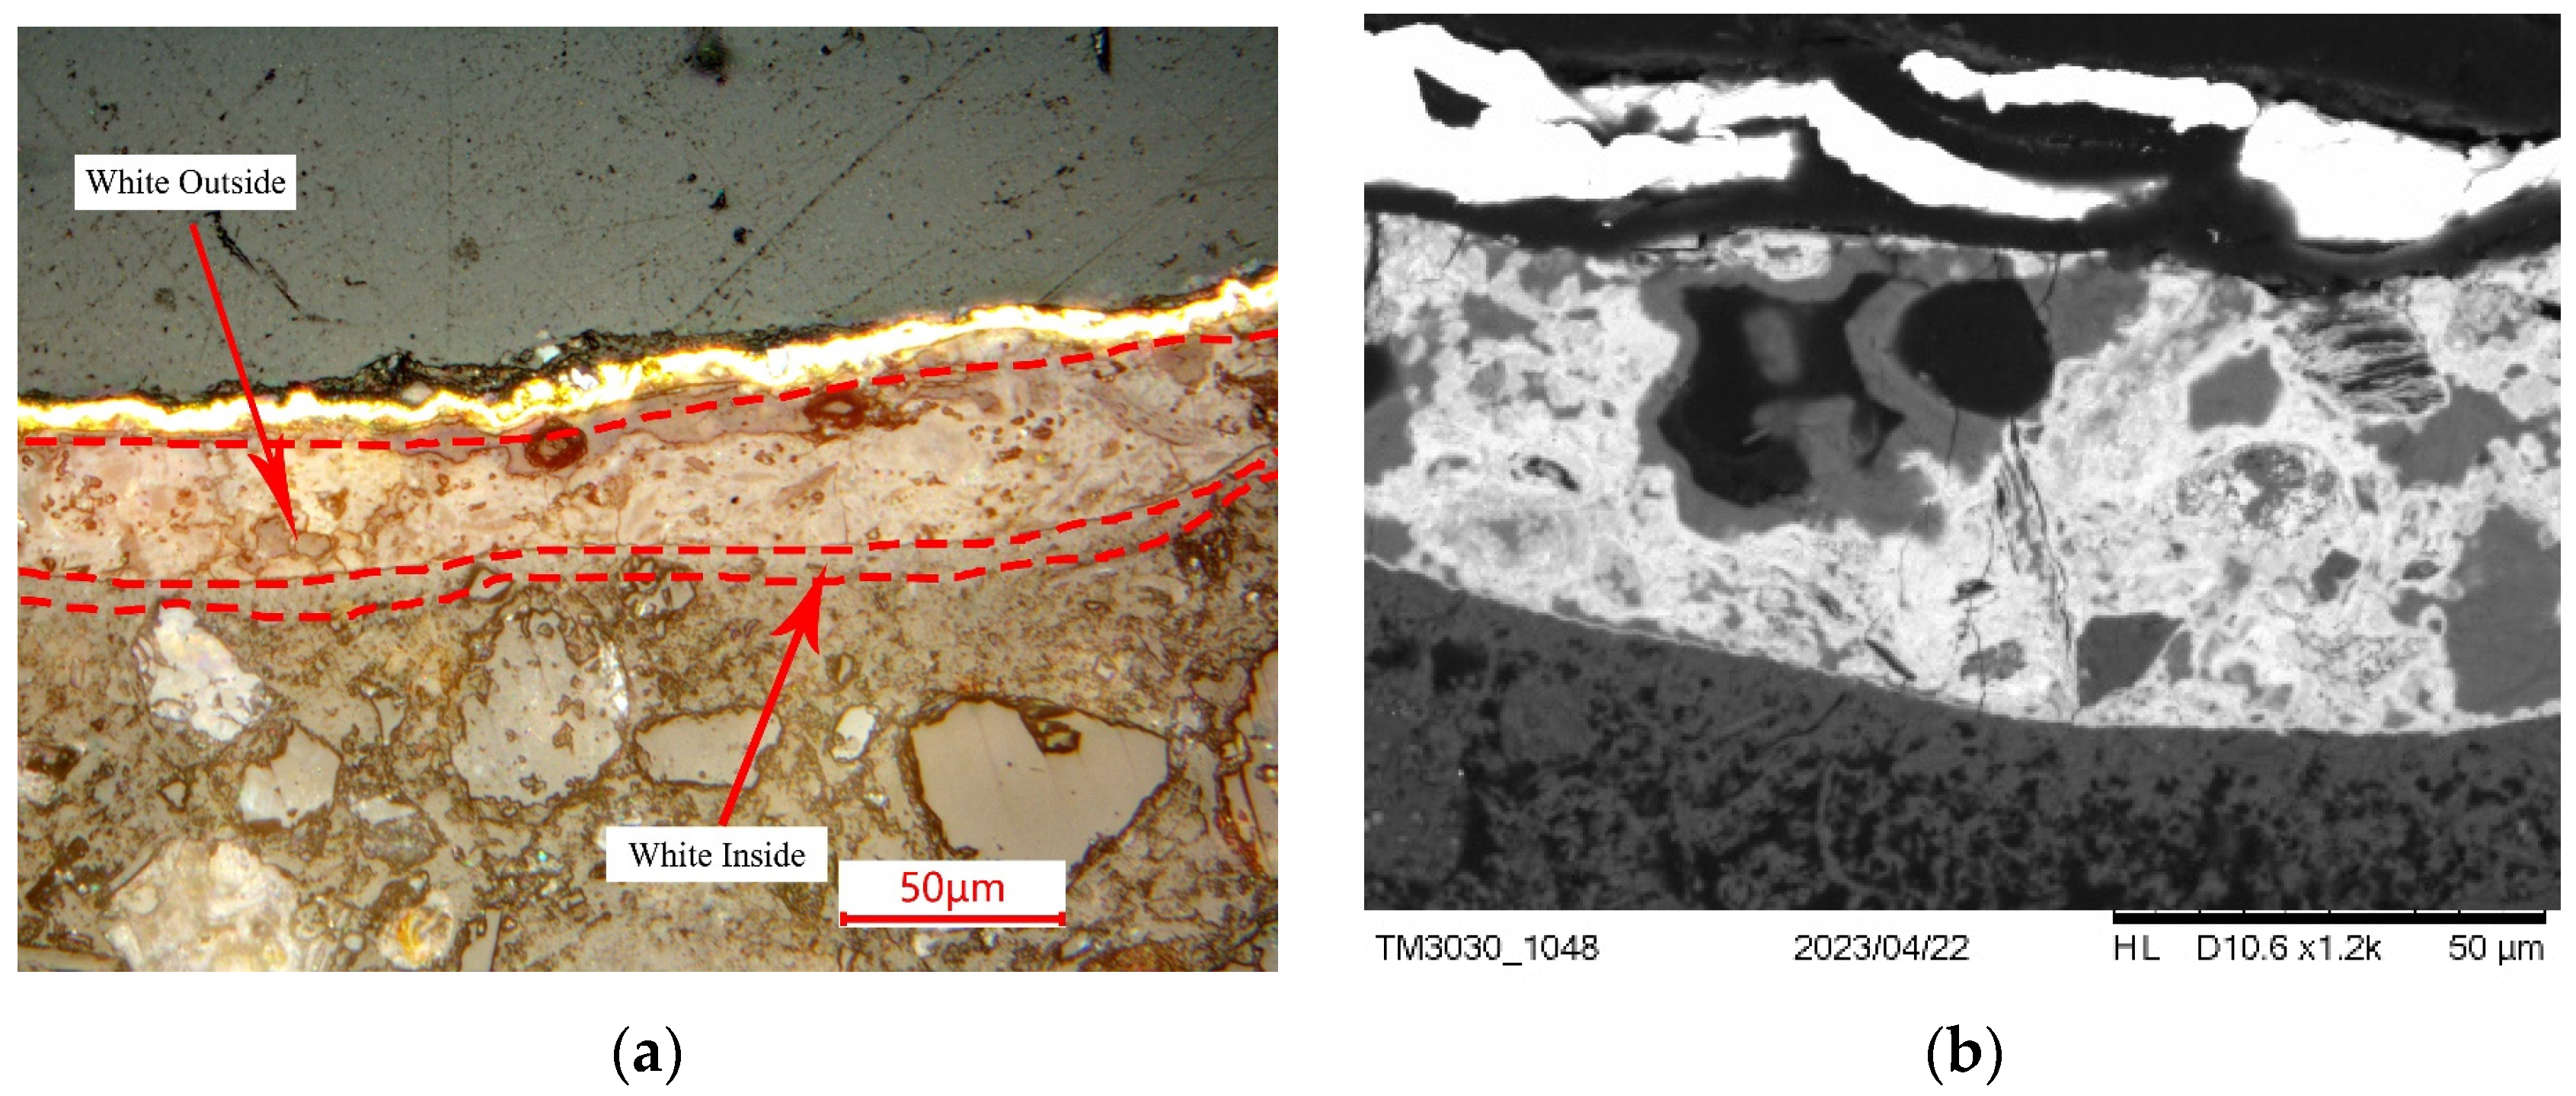
White pigment
The white pigment in
Figure 8a,b from sample 1992T502④:15 appears as white, transparent rock-like particles under single-polarized light, with diameters ranging from 10 to 25 μm. Under orthogonal polarized light, the particles exhibit strong extinction.
Figure 8c,d reveal that the white pigment layer is thin, consisting of only one layer. The EDS results, as shown in
Table 2, indicate compositions of 62.1% O and 32.3% Ca. Raman testing results, illustrated in
Figure 8e, exhibit characteristic peaks for calcium carbonate at 155.2 cm
−1, 279.3 cm
−1, 709.1 cm
−1, and 1085.2 cm
−1, confirming the presence of calcium carbonate in the white pigment.
- 3.
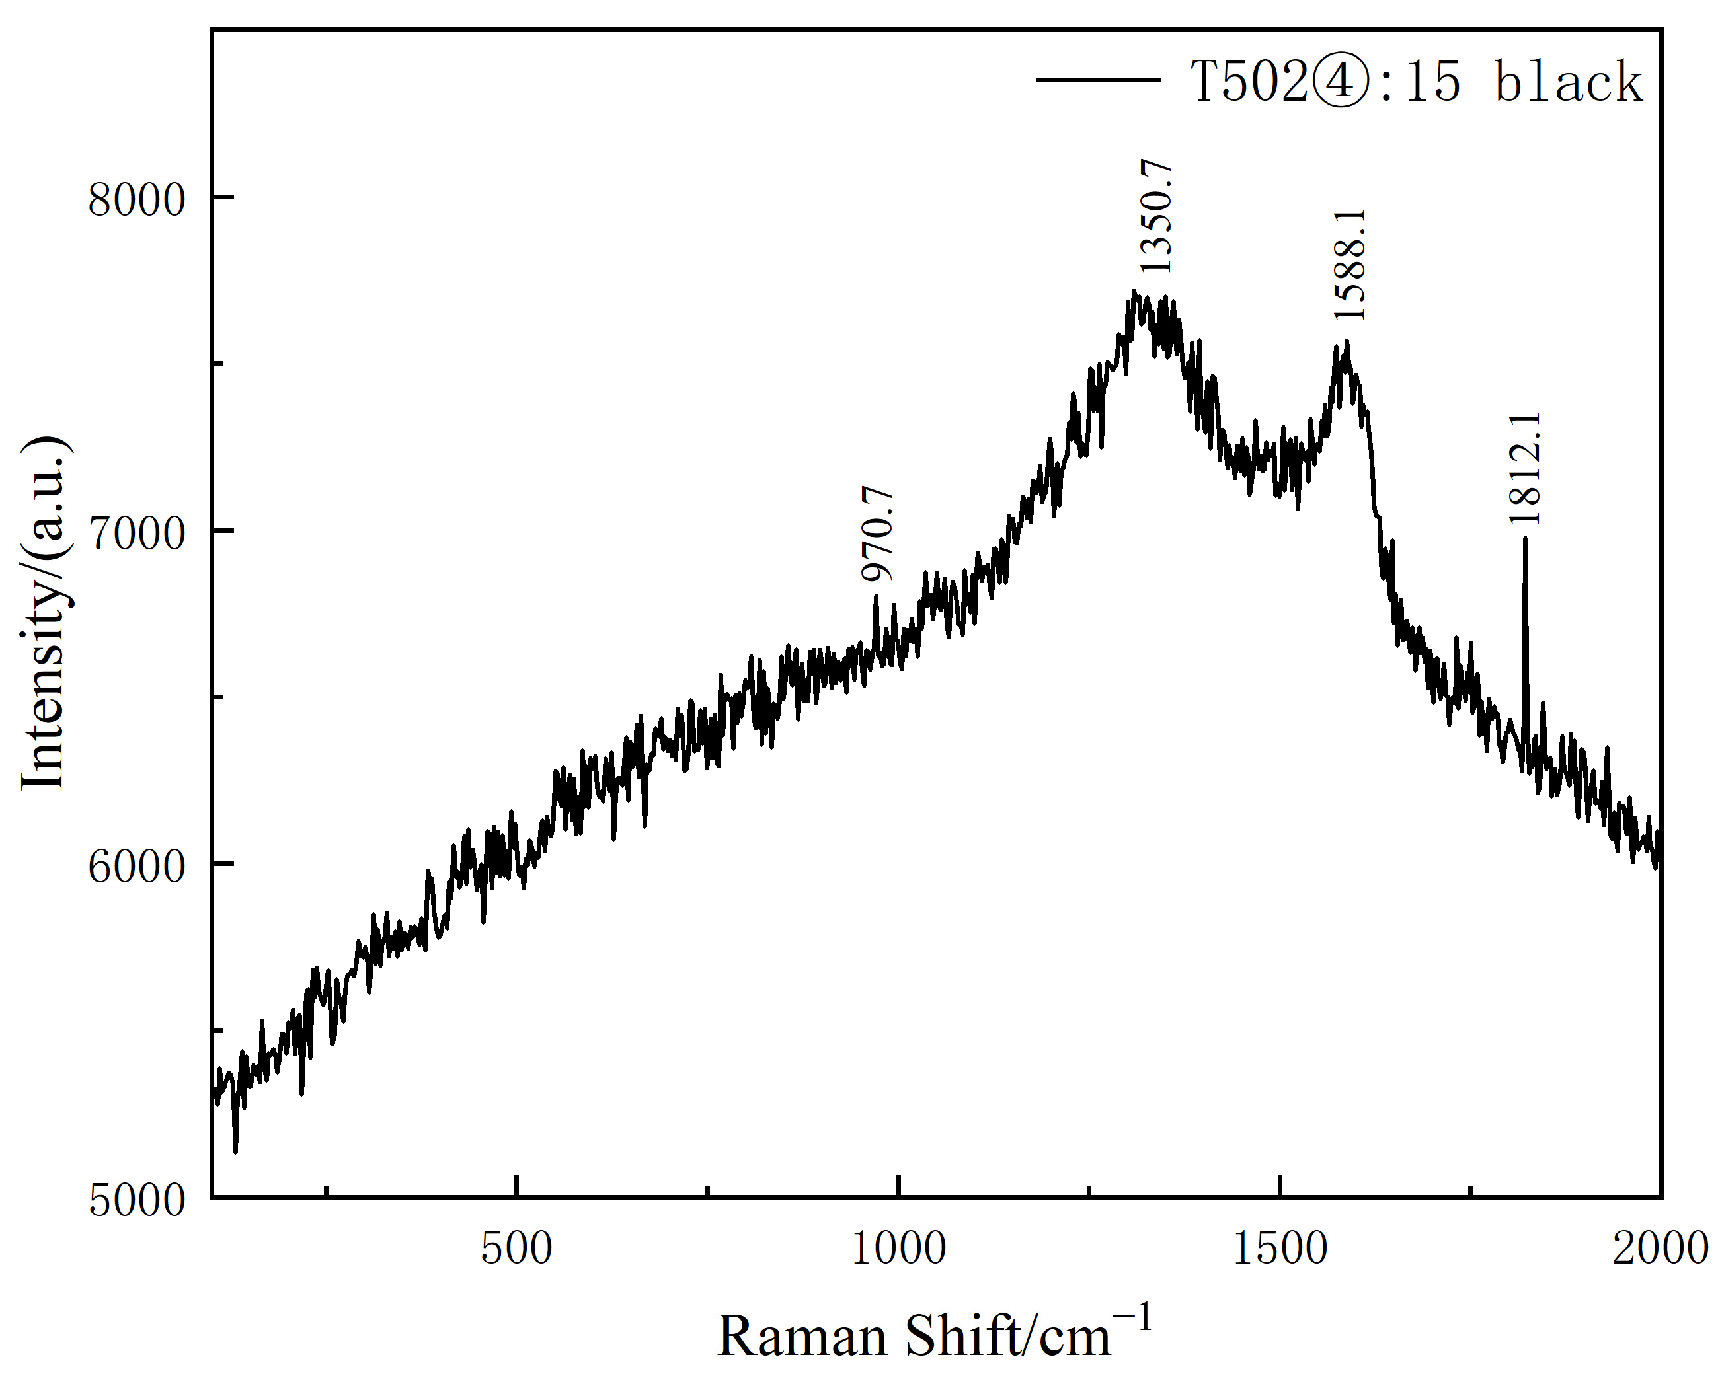
Black pigment
Table 3 indicates that the chemical composition of the black pigment in sample 1992T502④:15 does not show significant differences from the white pigment and the supporting material. Raman testing results, as depicted in
Figure 9, reveal characteristic peaks for graphite at 1350.7 cm
−1 and 1588.1 cm
−1. In addition, there is a very weak peak at 970.7 cm
−1, which shows the characteristic of the phosphate-stretching mode of hydroxyapatite, suggesting that the black pigment is likely ivory black [
10]. Furthermore, the peak at about 1582 cm
−1 is called band G (graphite), corresponding to an ideal graphitic lattice vibration mode with E symmetry; meanwhile, the peak appearing at about 1350 cm
−1 is usually called band D (disorder), which corresponds to a graphitic lattice vibration mode with A symmetry [
14]. The intensity ratio of bands D and G (I
D/I
G) is often used to indicate the level of graphitization of a material [
15]. The value of the I
D/I
G ratio of this sample is 0.95 by calculation, which proves the black pigment is very likely ivory black [
16].
- 4.
Gold leaf
Figure 10a,b illustrate that the gilded sample 1992T502④:15 is composed of a gold leaf layer and two layers of white pigment from outermost to innermost. SEM-EDS results, as presented in
Table 2, indicate that the gold leaf layer contains 83.4% Au. The outermost white layer consists of 56.3% Pb, 16.1% O, and 14.3% Ca, while the innermost white layer comprises 54.8% O, and 34.2% Ca. It is inferred that the outermost white layer is lead white, whereas the innermost white layer is calcium carbonate.
4.2. Analysis of Colored Brick Eaves and Tiles Excavated from the Liao-Jin Strata
Samples unearthed from the Liao-Jin strata only exhibit red pigments. The pXRF results, as presented in
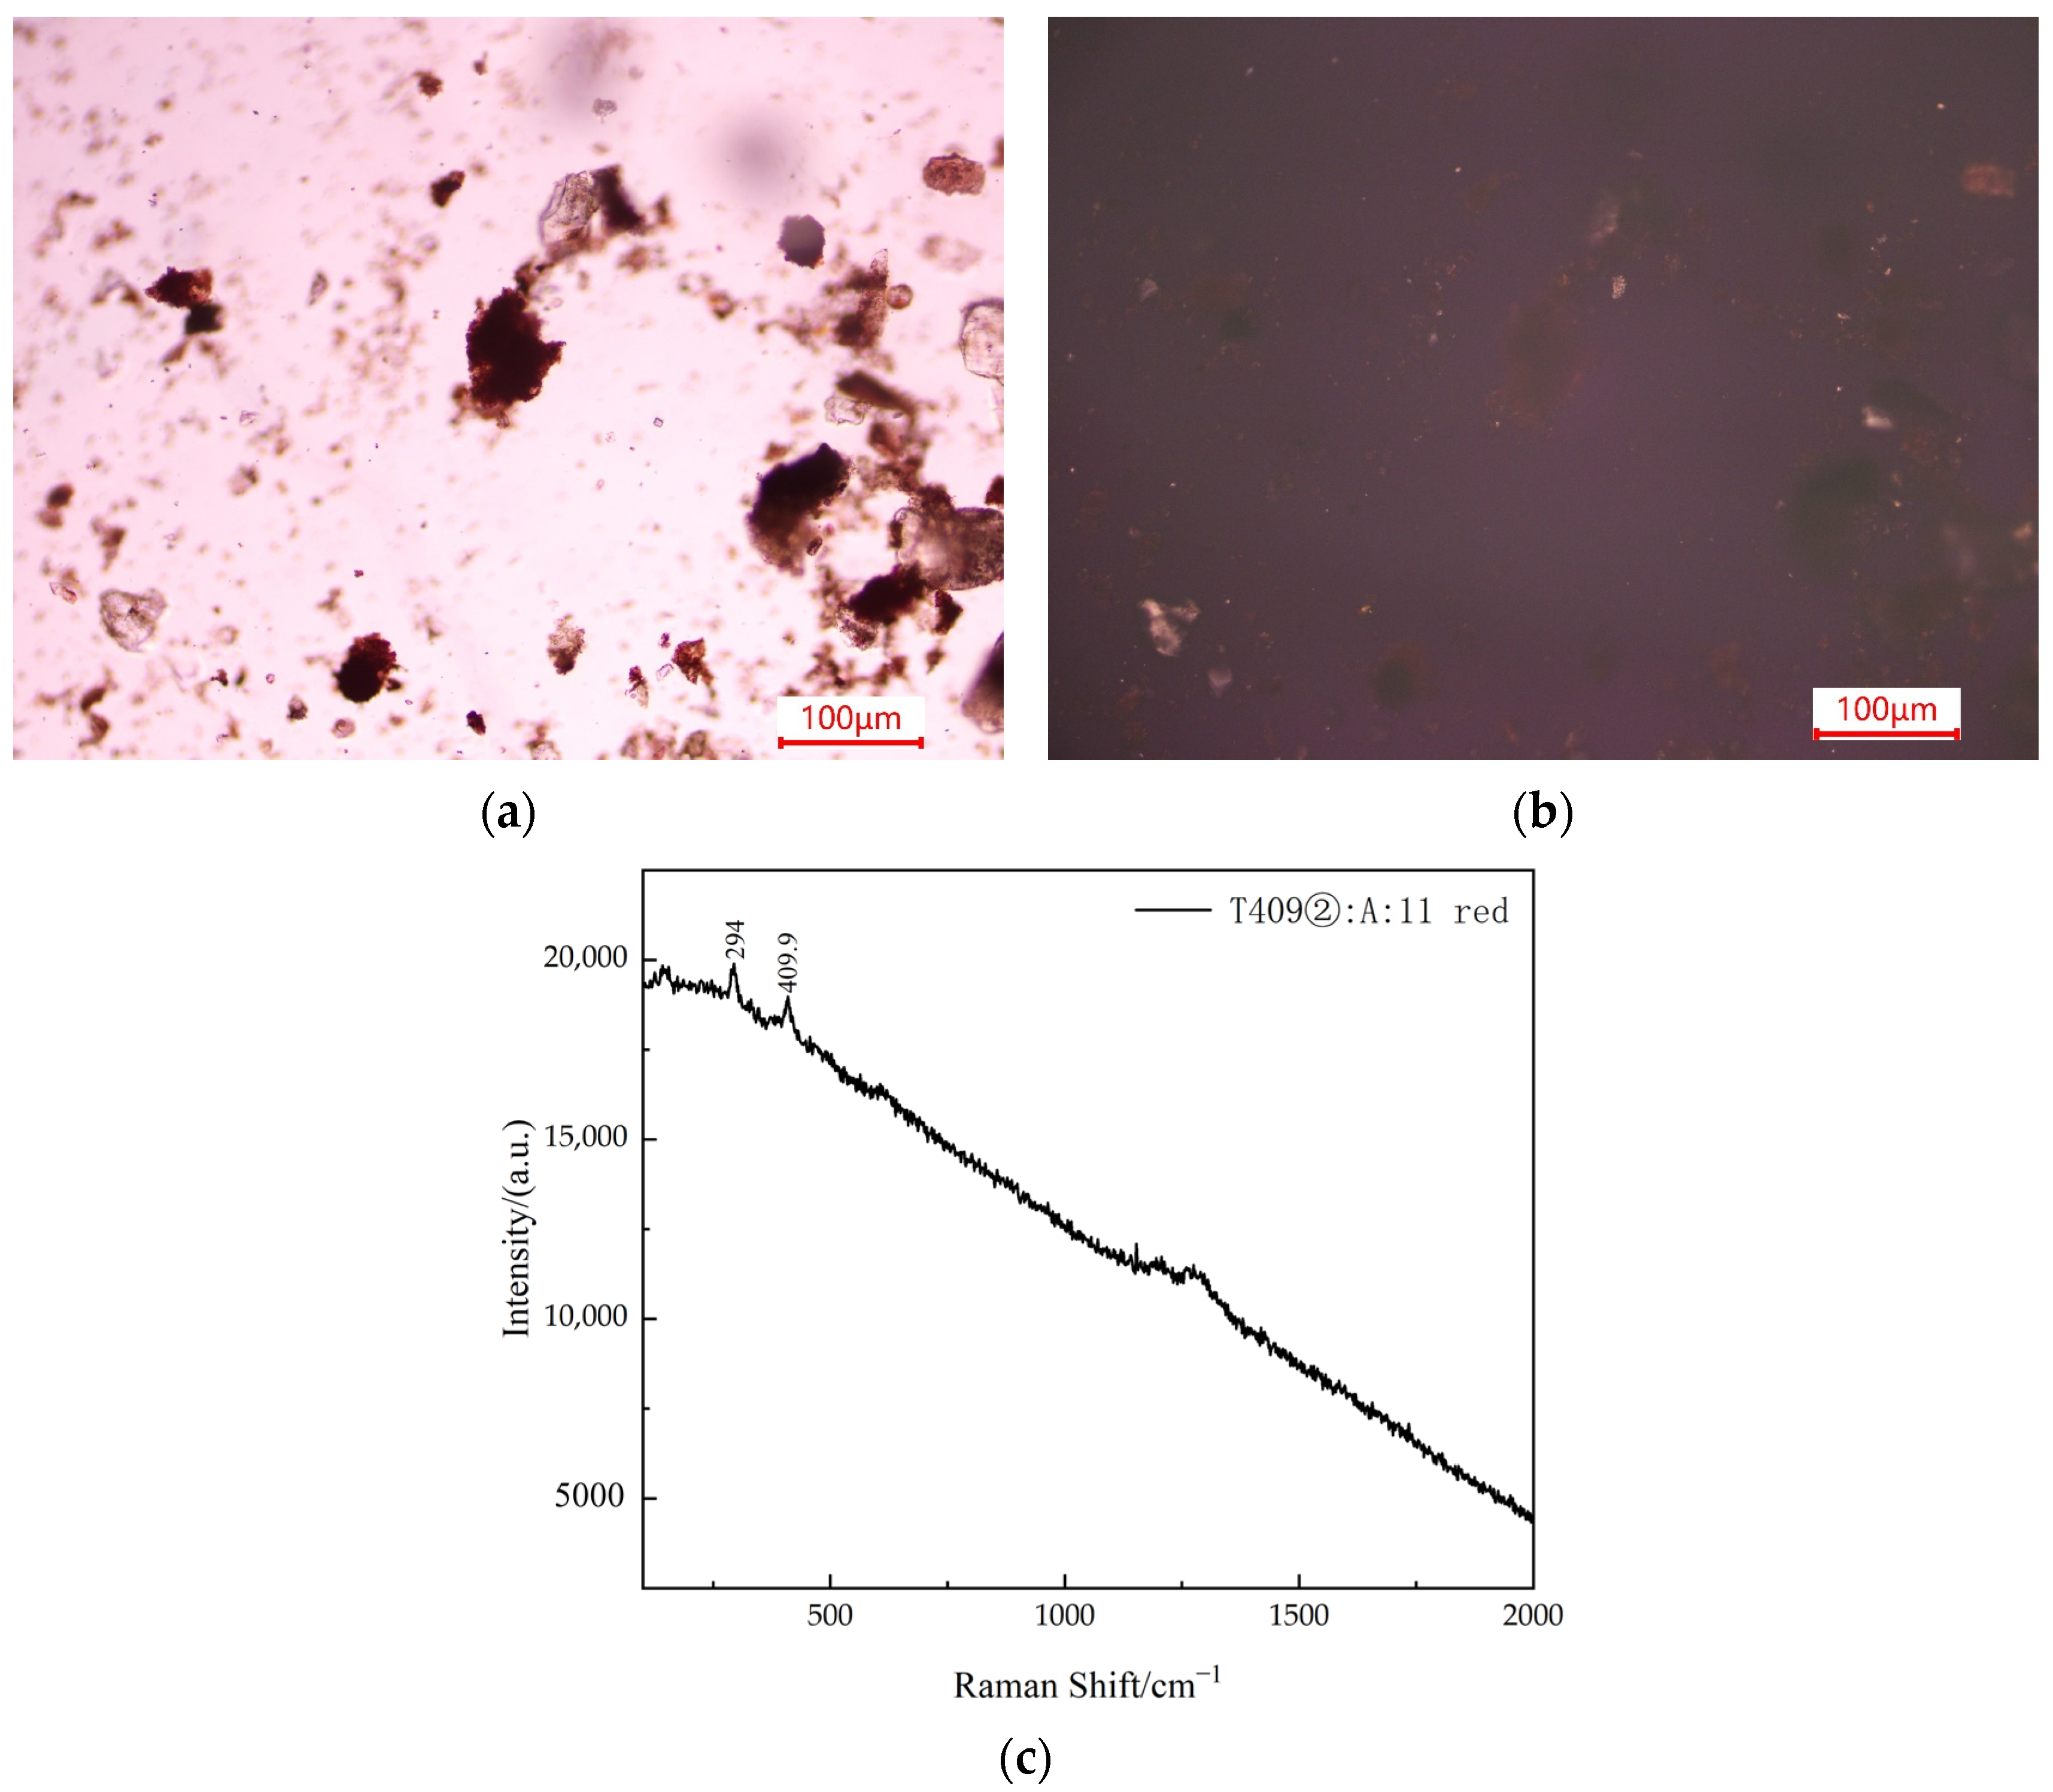
Table 4, indicate that for the eave-end tile remnants labeled 1992T525③A:6–9, the Fe content in the red pigment ranges from 4.2% to 5%, while the Fe content in the ceramic body is between 3.7% and 4.4%. In each sample, the Fe content in the red pigment is higher than that in the corresponding body. Moreover, no detectable levels of Hg and Pb were found in these samples. For the two pieces of colored brick fragments with sample numbers 1992T409②A:11 and 1992T410②A:23, the Fe content in the red pigments is 5.5% and 7.7%, respectively, whereas the Fe content in the body is only 3% and 3.3%. No Hg was detected, and the presence of Pb is nearly negligible. Examination of the pigment powder from 1992T409②A:11 under the microscope, as illustrated in
Figure 11a,b, reveals that the pigment particles exhibit a smooth-edged, dark red appearance under single-polarized light, while becoming entirely extinguished under orthogonal polarized light.
Figure 11c further illustrates that the red pigment displays characteristic peaks of hematite at 294 cm
−1 and 409.9 cm
−1 in the Raman spectrum. Therefore, it is inferred that the red pigment on the Liao Dynasty sample is hematite, and the pigments on the eave-end roof tile fragments might serve a certain marking function.
4.3. Analysis of Clay Sculpture Fragments Excavated from the Ming-Qing Strata
Samples from the Ming-Qing strata are all fragments of clay sculptures, exhibiting four distinct colors: red, green, blue, and white.
4.3.1. Red Pigment
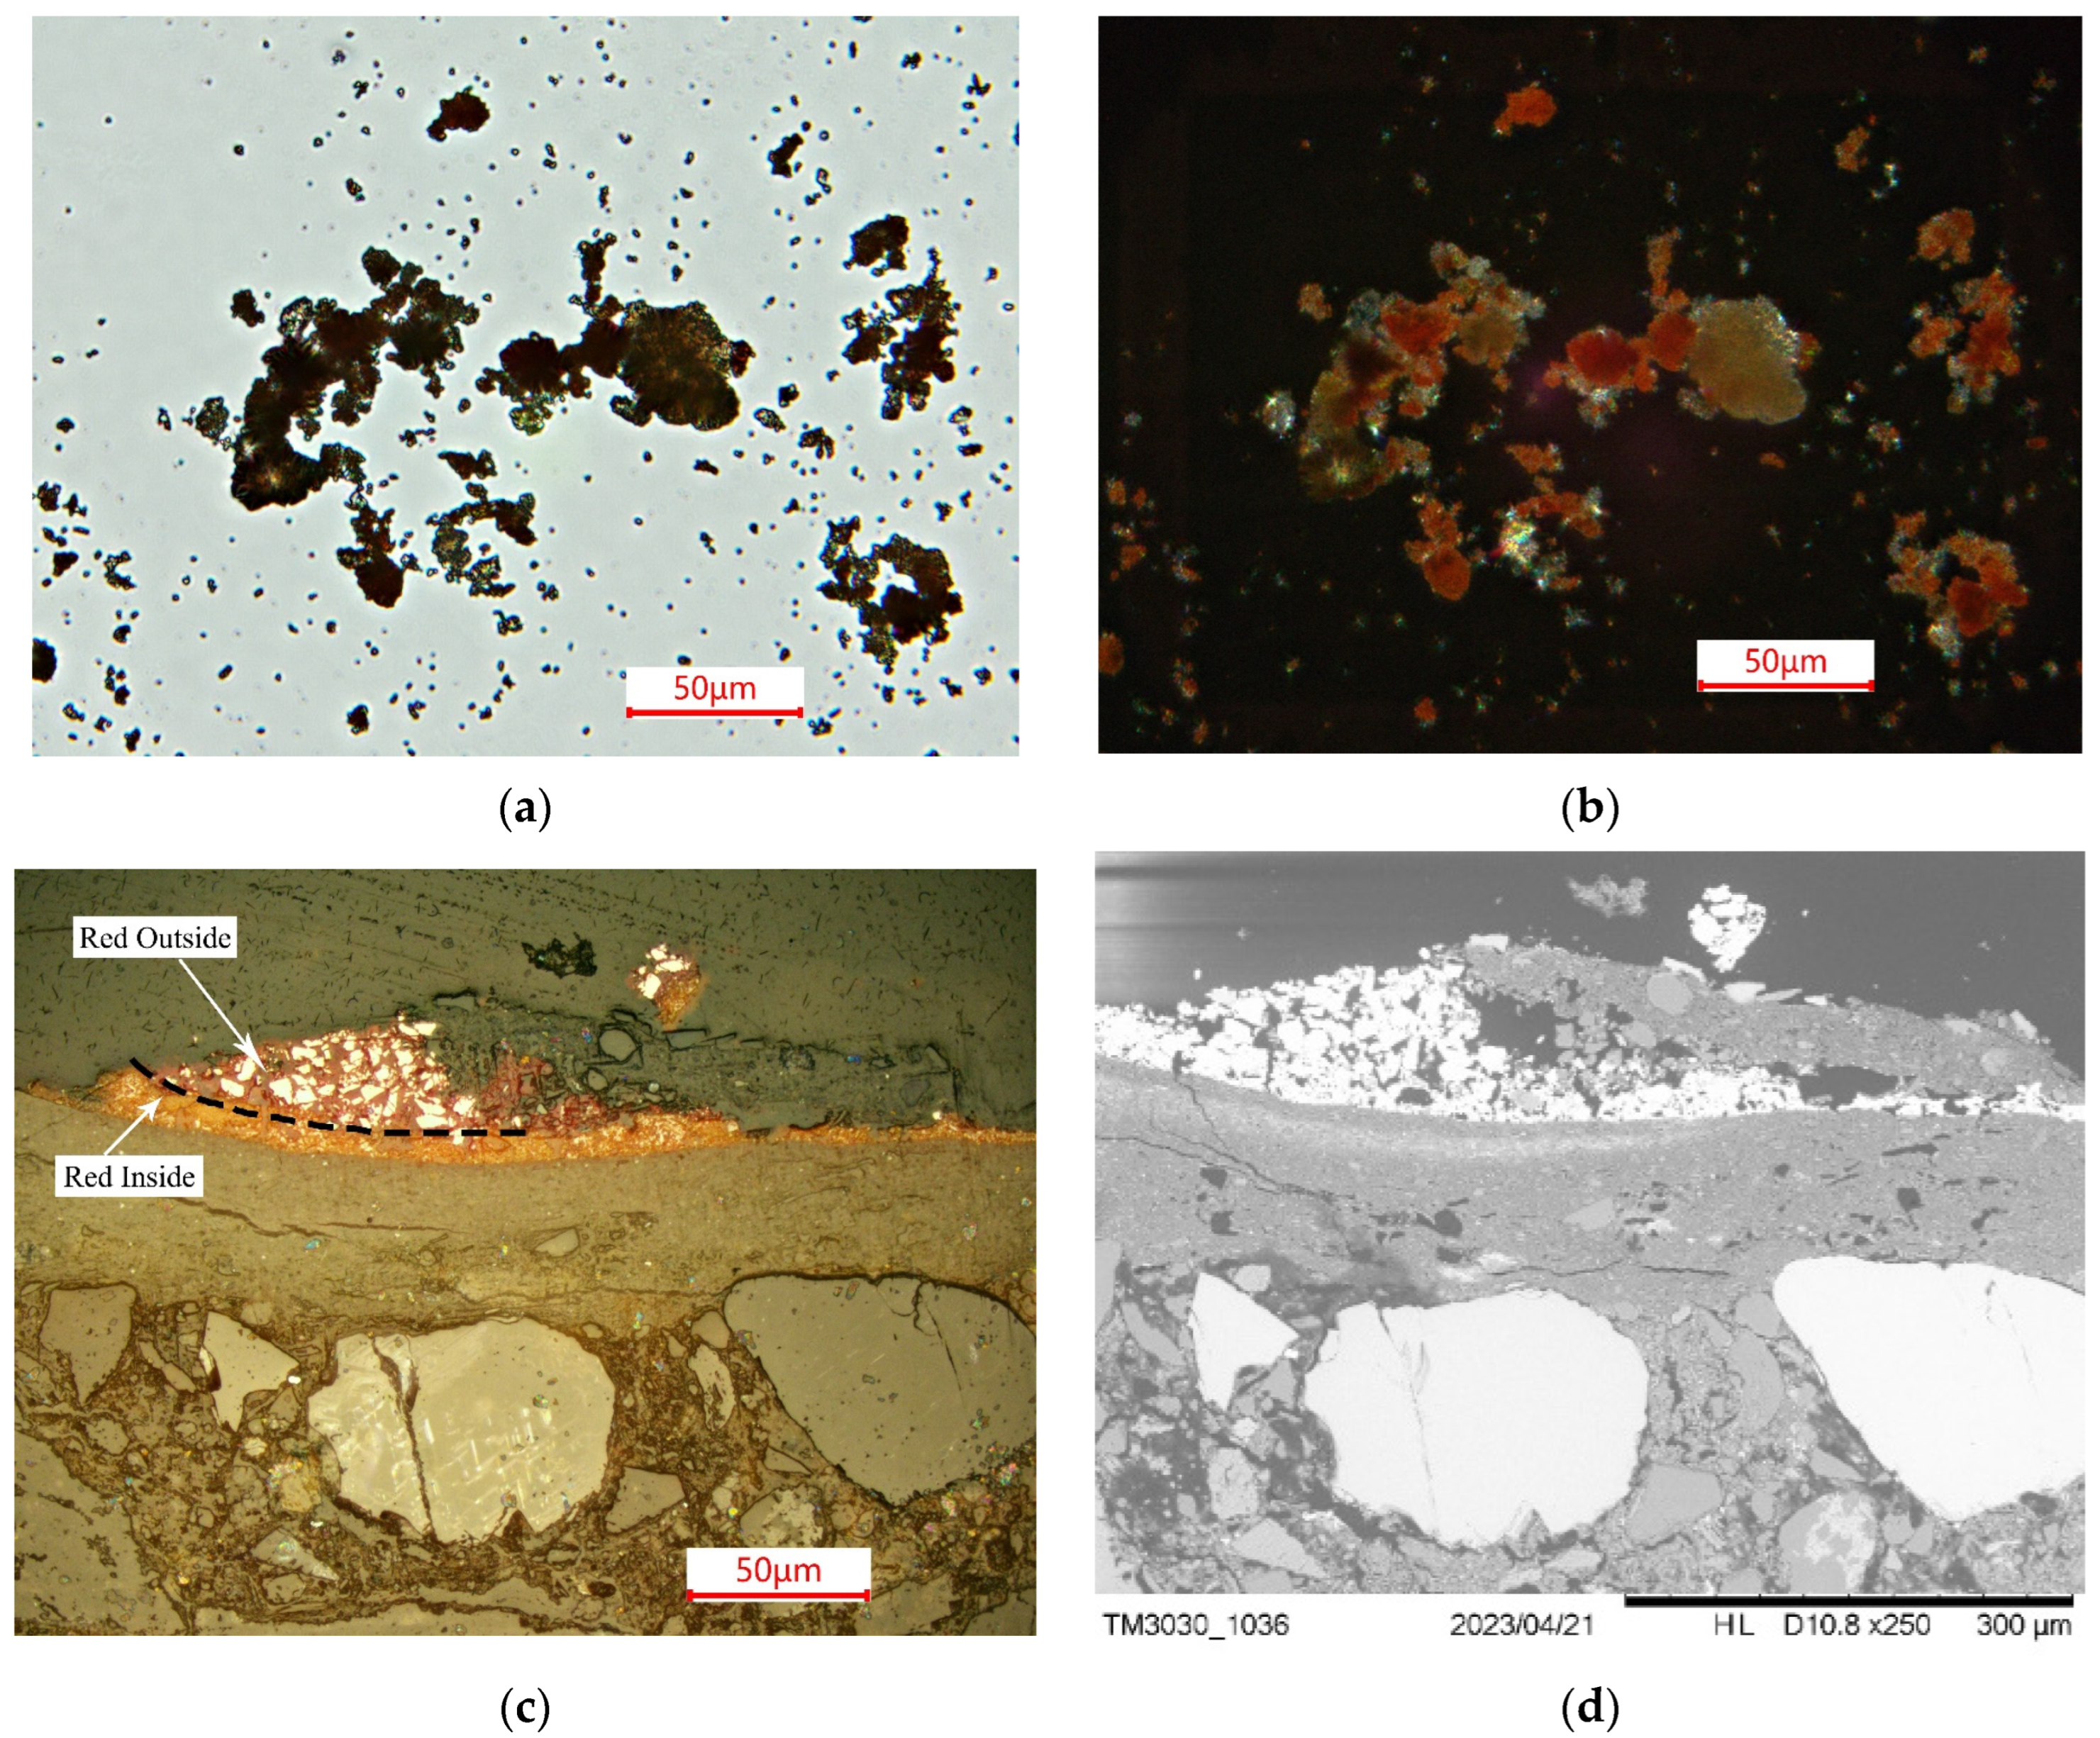
Table 5 indicates that the pXRF results for red pigments consistently show relatively high levels of Hg, Pb, and S, while the content of Fe is not notably elevated. Upon microscopic observation of the red pigment collected from sample 1992T408②A:9-13, as seen in
Figure 12a,b, the crystal particles appear black or dark red under single-polarized light and exhibit a fiery red color under orthogonal polarized light.
Figure 12c,d reveal that the cross-sectional profile of the sample exhibits two layers of red pigment. The outer layer consists of larger pigment particles; the inner layer consists of finer ones. Additionally, there is an underlying layer of white pigment on the inner side. EDS results, as presented in
Table 6, indicate that the outer layer of red pigment comprises 71.6% Hg, 15.6% S, and 6.7% O, with minimal presence of other elements. The inner layer of red pigment contains 64.9% Pb, 14.6% O, and 5.3% Si. The white underlying layer consists of 45.9% O, 24.5% Si, and 17.1% Al. In summary, it can be inferred that the outer and inner red pigments correspond to vermilion and minium, respectively. The underlying layer is likely composed of a clay mineral rich in silicon and aluminum.
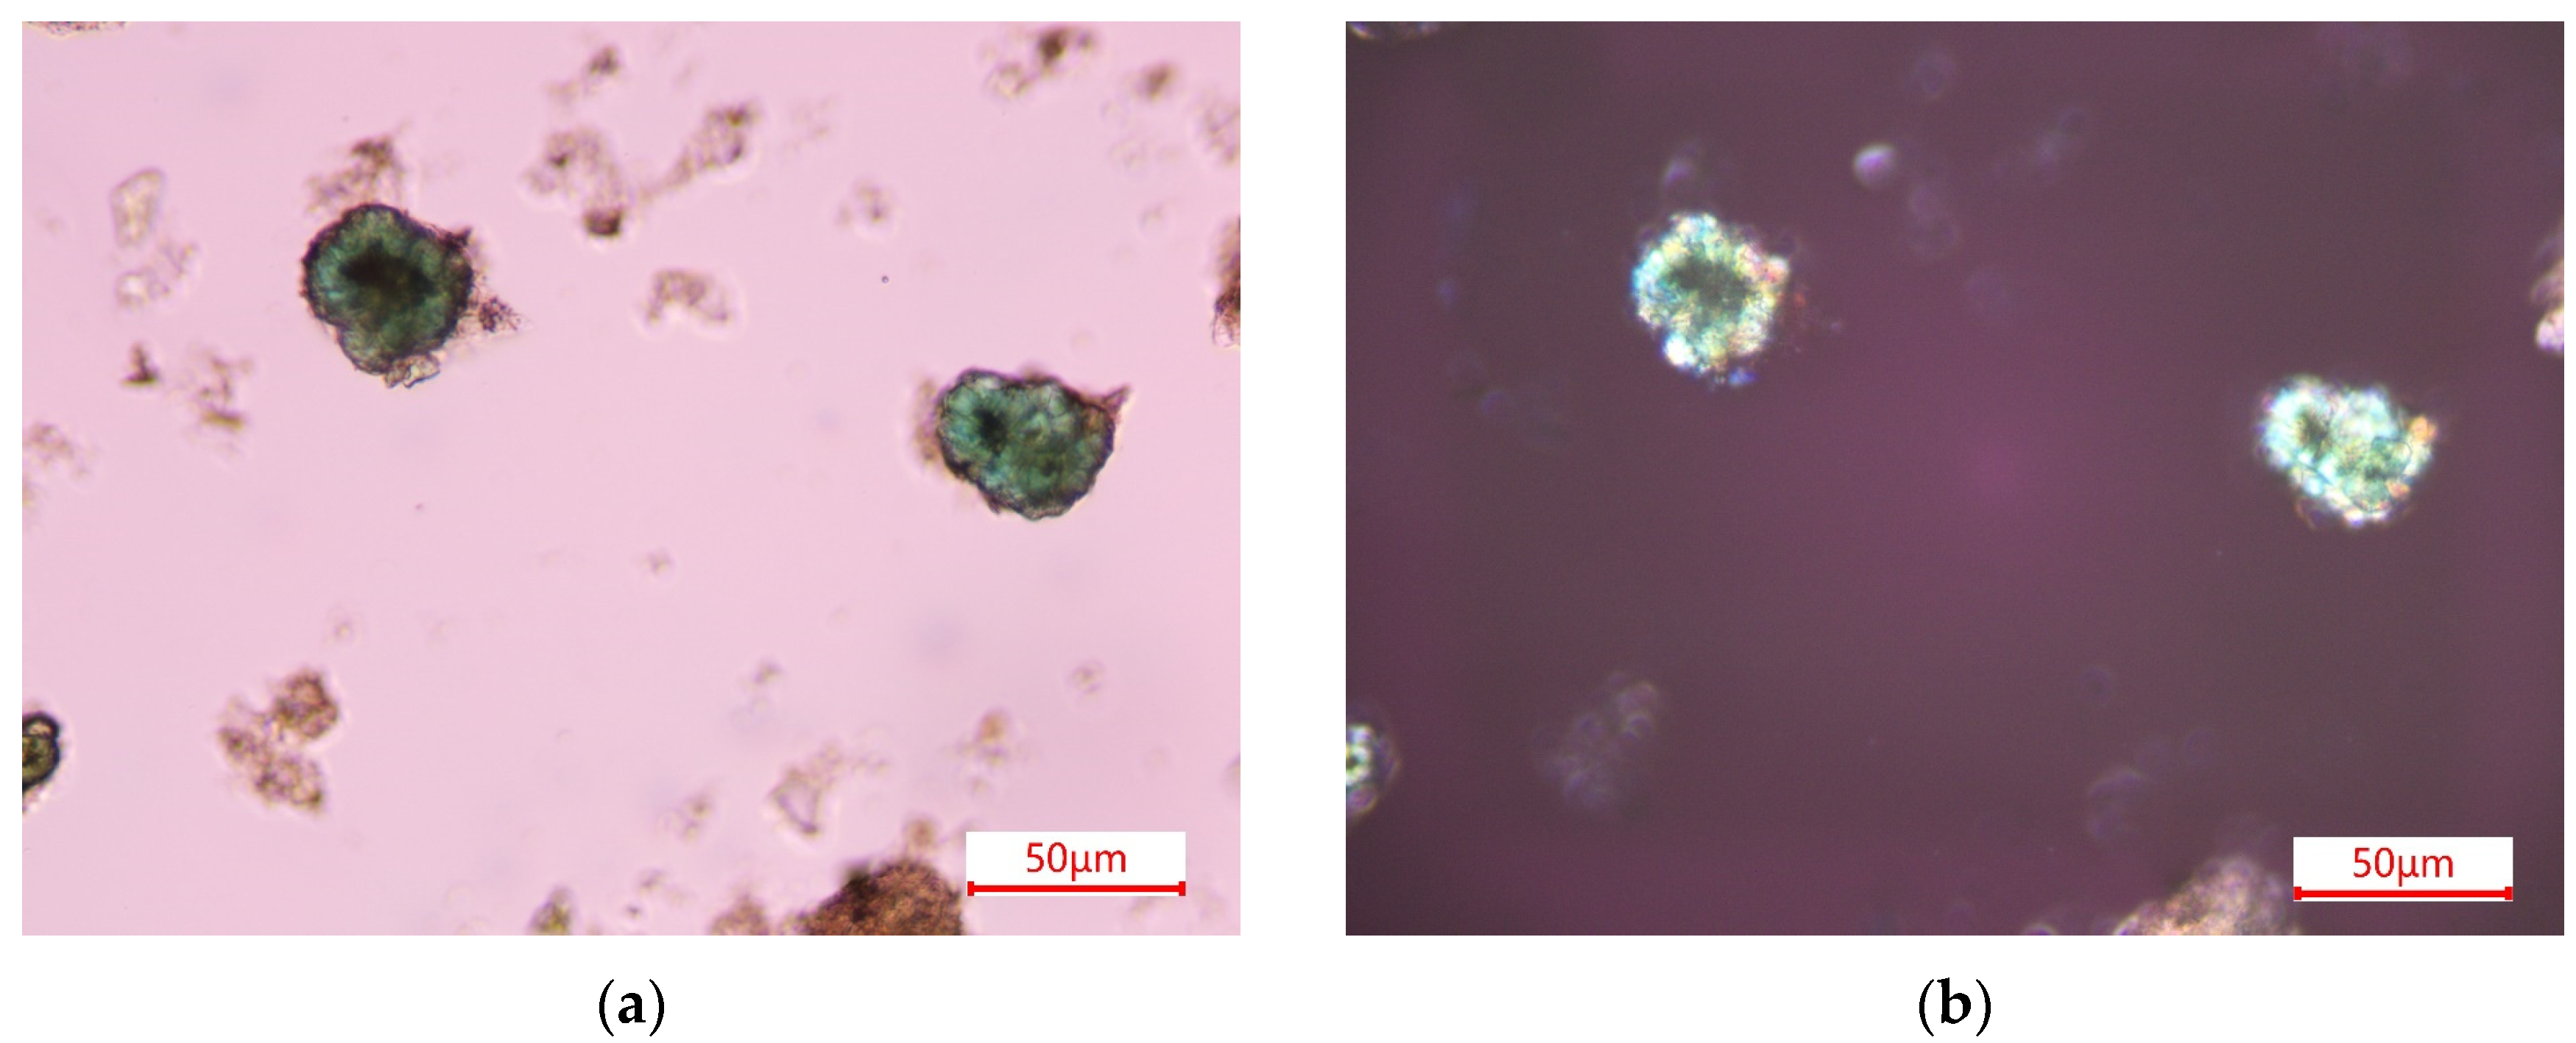
4.3.2. Green Pigment
As indicated in
Table 5, the pXRF test results for green samples consistently reveal relatively high levels of Cu and Cl. Upon observing the green pigment collected from T411②A:30-32 under a polarizing microscope, as shown in
Figure 13a,b, the pigment particles appear as circular, deep green crystals under single-polarized light. Both single and orthogonal polarized light reveal a dark inner core.
Figure 13c,d demonstrate that the green pigment is distributed in larger round particle formations on the surface. EDS results in
Table 6 show a composition containing 39.9% Cu, 33.1% O, and 14.5% Cl. Raman testing results showed in
Figure 13e that characteristic peaks of atacamite appeared in 65.3 cm
−1, 122 cm
−1, 150.2 cm
−1, 263.4 cm
−1, 361.9 cm
−1, 446.4 cm
−1, 513.8 cm
−1, 817.9 cm
−1, 912.5 cm
−1, and 974.7 cm
−1. In conclusion, the green pigment is identified as atacamite [
17,
18,
19].
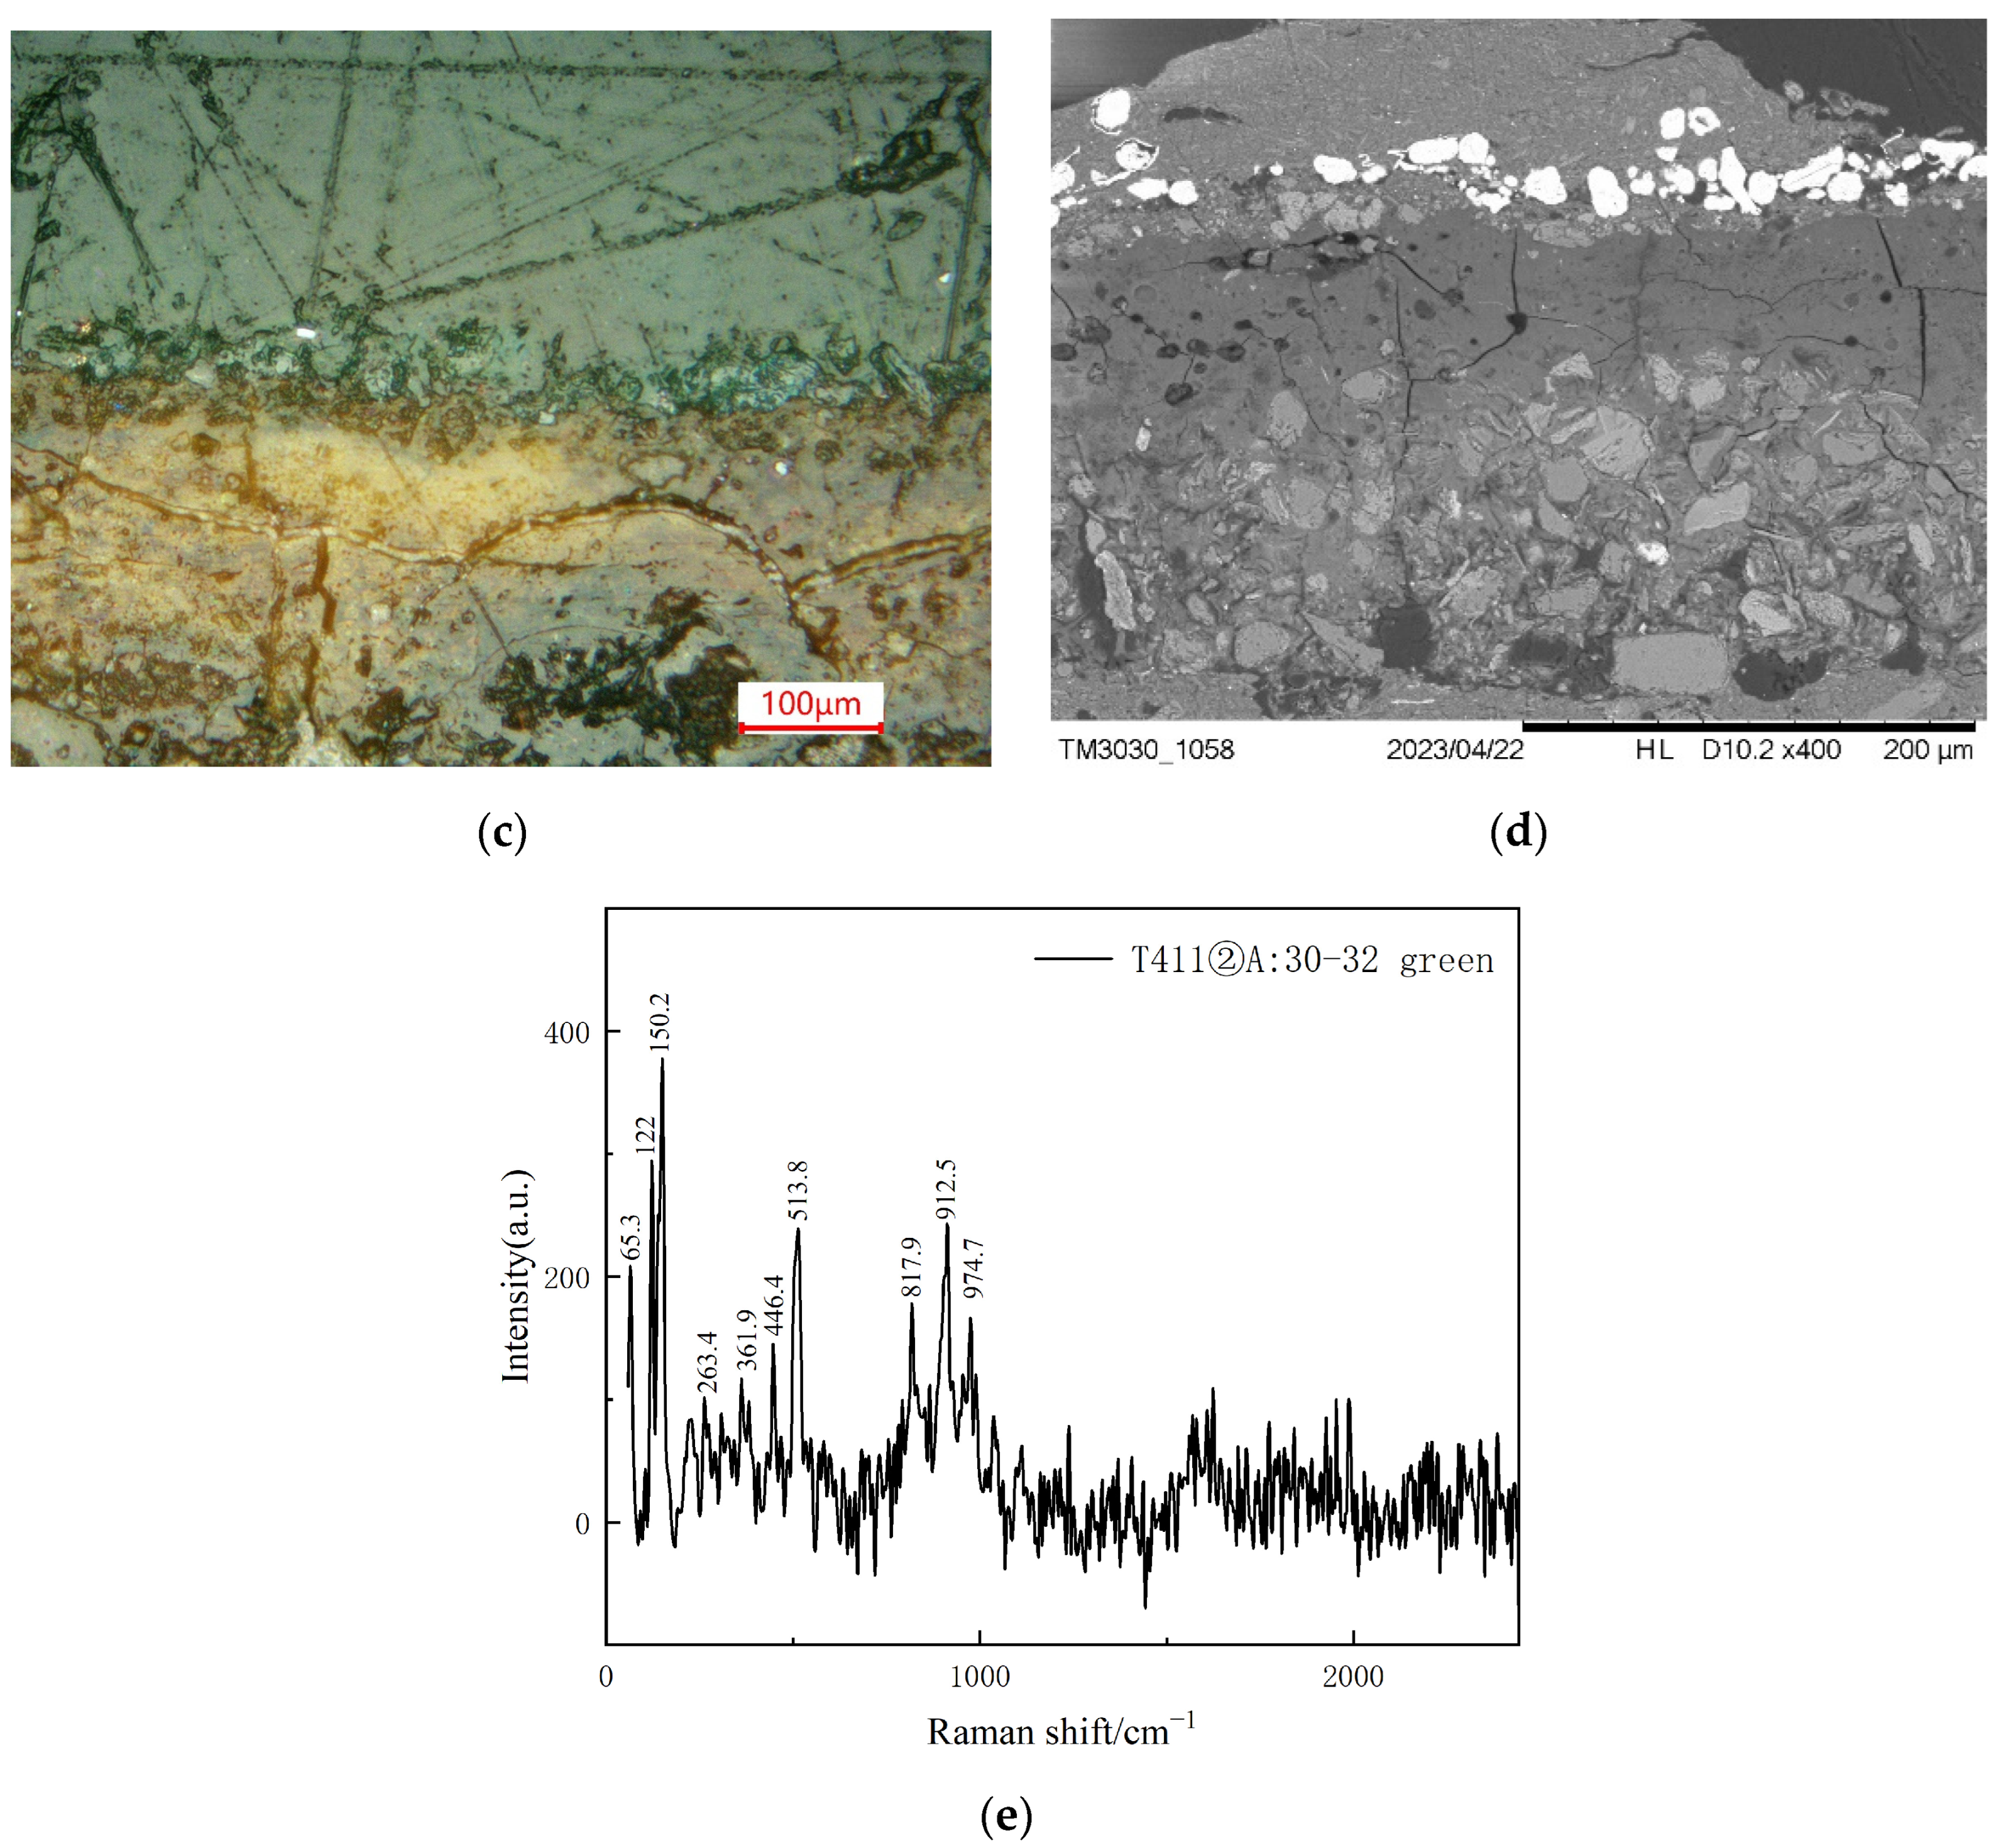
4.3.3. Blue Pigment
The pXRF test results for the blue samples, as presented in
Table 5, indicate a significant presence of Al and Si, while Cu is nearly absent, which indicates the absence of azurite. Upon observing the blue pigment collected from 1992T409②A:17 under a polarizing microscope, as depicted in
Figure 14a,b, the particles appear predominantly deep blue under single-polarized light, exhibiting uniform size with diameters ranging from 5 to 15 μm. The Raman spectrum in
Figure 14c shows that the characteristic peaks of Prussian blue appear at 272.6 cm
−1, 540.2 cm
−1, 2095.7 cm
−1, and 2154.1 cm
−1 [
20]. It is inferred that the blue pigment is Prussian blue.
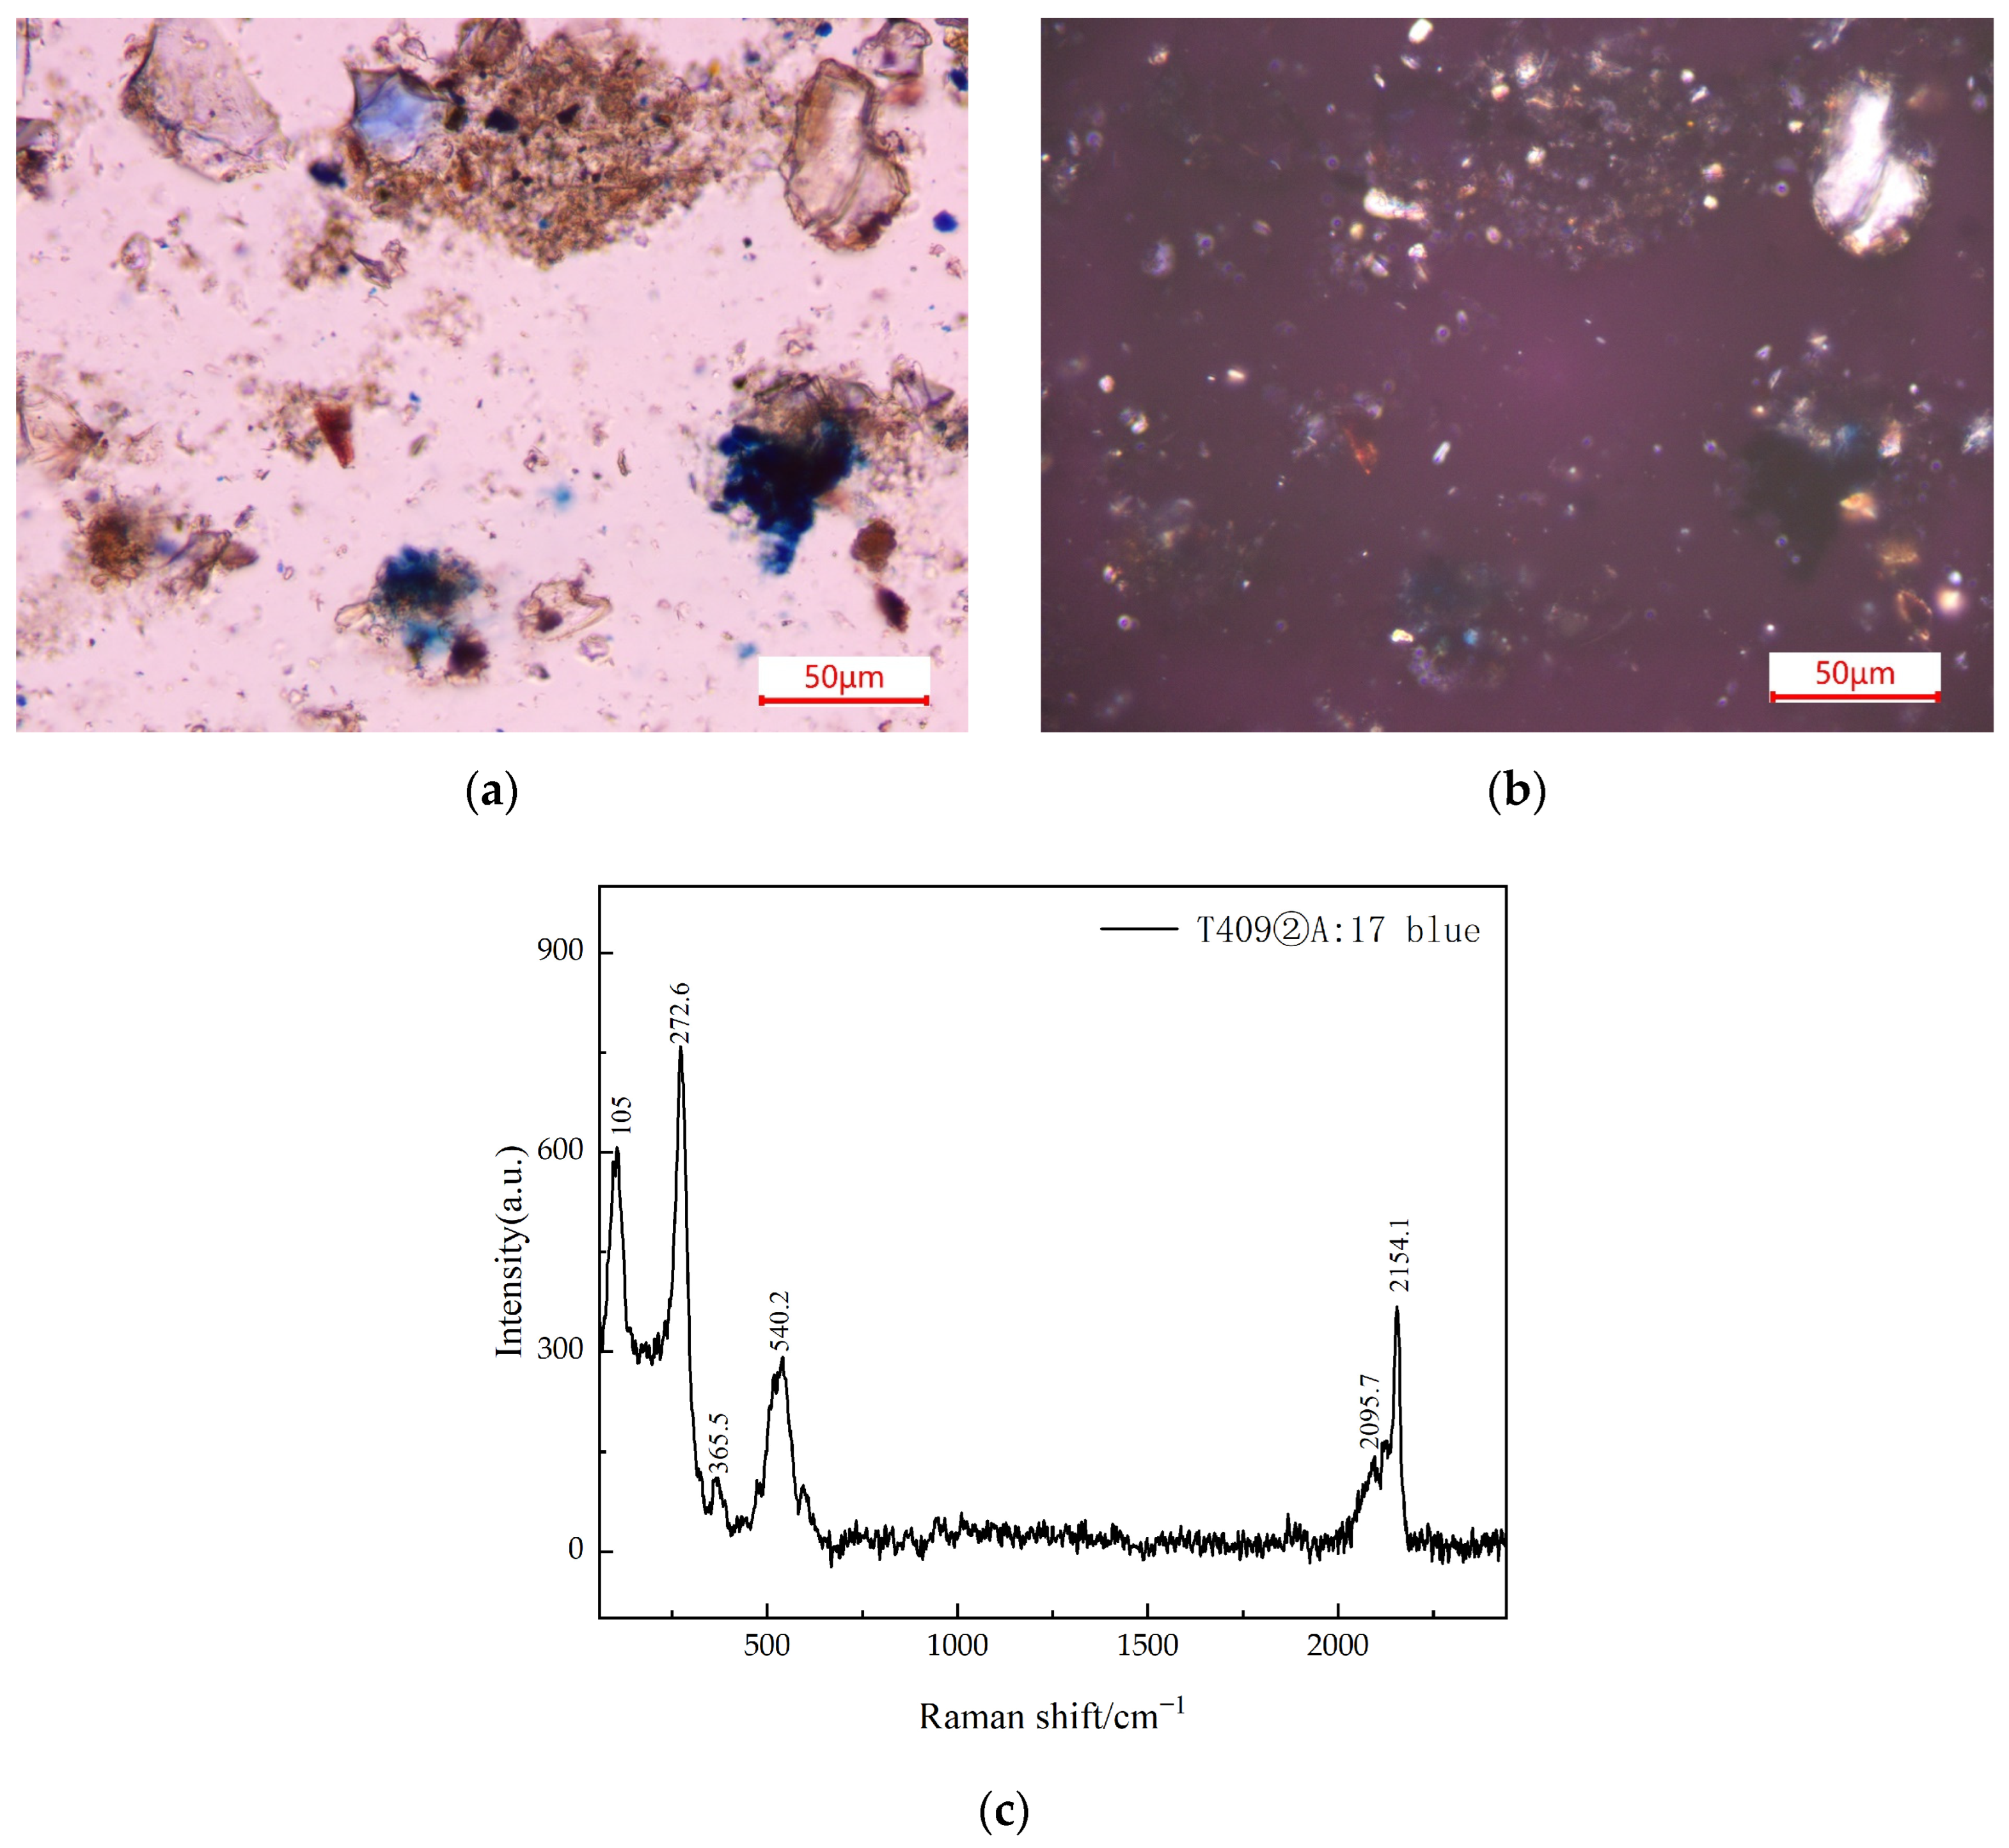
4.3.4. White Pigment
As indicated in
Table 5, the pXRF results for the white pigment from 1992T409②A:17 reveal a notable presence of Al, Si, and Ca. In
Figure 15a, the pigment particles appear hexagonal with yellowish white under single-polarized light, while
Figure 15b illustrates pale yellow under orthogonal polarized light. Furtherly, as can be seen from
Figure 15c, the Raman characteristic peak of lead white appears at 1047.9 cm
−1, which inferred that the white pigment is lead white.
5. Conclusions
The summarized results of the testing and analyses conducted in this study are presented in
Table 7. Comparison reveals the usage of distinct pigments in samples excavated from different stratigraphic layers. Moreover, even within artifacts from the same historical period, variations in pigments are observed on different types of relics.
In the Northern Wei stratigraphic layers, the unearthed fragments of fallen cave stone sculptures exhibit surfaces painted in red, yellow, green, and white colors. Analytical testing has revealed that these pigments correspond to red earth, yellow earth, green earth, and calcium carbonate. Importantly, these pigments were predominantly applied directly onto the rock surfaces.
In addition to the remnants of fallen cave stone sculptures, pigment grinders, and lotus-shaped architectural components unearthed from the Northern Wei strata have also been identified using hematite as a red pigment. Furthermore, vermilion traces were found on the lower part of the central–southern wall inside Room F6 of the Buddhist temple site from the Northern Wei Dynasty, situated on the western side of the Yungang Grotto summit. Similarly, remnants of red ochre color were found on the external walls of a Buddhist architectural site situated 300 m east of Cave 1. Archaeological reports suggest that these colorations are consistent with the pigments identified in the excavated lotus-shaped architectural ornaments, indicating a widespread use of hematite pigment during the Northern Wei Dynasty at the Yungang Grottoes.
Apart from the Yungang Grottoes, portions of roof tiles excavated from the Northern Wei Dynasty No. 2 in Caochang Town in Datong City and the walls of the house ruins at the corner of the Yonggu Mausoleum in Fangshan (the royal tomb of the Northern Wei Dynasty, located 25 km north of Datong City) were found to have utilized red pigments [
21,
22]. Although no sampling analyses were conducted at the time, it can be inferred that the color red, likely hematite, was extensively employed during the Northern Wei Dynasty, particularly in royal contexts, representing a form of high-status decoration.
The mural fragments from the Northern Wei temple exhibit distinct pigments compared to other contemporaneous artifacts. Analysis reveals that the red pigment is vermilion, the white pigment consists of lead white and calcium carbonate, and the black pigment is ivory black. Additionally, the use of gold leaf has been identified. It is noteworthy that lead white is not directly applied as the surface pigment. Beneath it, there is a layer of white calcium carbonate, and on top of it, there is either a red pigment or gold leaf. The practice of overlaying two layers of white pigment raises attention, suggesting the possibility that the murals might have undergone multiple repainting, perhaps intended to improve the coverage of the ground layer or enhance the color effect of the surface pigments.
The pigments unearthed from the Liao-Jin Dynasty strata are exclusively red, relatively 0, and are all found on the surfaces of architectural components. Analysis indicates the use of hematite. The red pigment on the colored brick fragments serves a decorative purpose, while the red lines on the eave tile might have been intended for some form of marking.
The analysis of pigments on the surfaces of Ming-Qing clay sculpture fragments reveals that the white pigment is calcium carbonate, the green pigment is atacamite, and the red pigment involves both minium and vermilion. Additionally, the blue pigment employs Prussian blue. Similar to the white pigment in the previous Northern Wei murals, the red pigment on the surface of the Ming-Qing clay sculpture fragments is also applied in layers, with vermilion located on the surface and minium uniformly distributed beneath. It is speculated that the surface of the clay sculpture might have undergone repainting, or it could represent a deliberate use of vermilion in certain areas to achieve different artistic effects during coloring.
In Chinese archaeological stratigraphy, the strata of Ming Dynasty (1368–1644) and Qing Dynasty (1644–1912) are often difficult to distinguish, and the archaeological report of Yungang Grottoes refers to their combination as the Ming and Qing Dynasties strata. As an artificial pigment, Prussian blue was first synthesized in 1706 and was subsequently adopted by artists in Europe [
23]. The earliest records of Chinese trade in Prussian blue come as early as 1775 from the East India Company’s factory in Guangzhou [
24]. Through the above evidence, we can not only determine the formation of these clay pieces in the Qing Dynasty, but also more accurately believe that their painting time may be as early as the late 18th century.
Another pigment worth discussing is atacamite, which has three other isomers: clinoatacamite, botallackite, and anatacamite [
18,
25]. Previous research suggested three sources of this pigment: (1) natural minerals; (2) the alteration products of malachite, azurite, or verdigris; or (3) the corrosion of copper, bronze, or brass [
26]. In the Chinese grottoes, atacamite was found as early as Dunhuang murals in the Northern Dynasty (386–581AD), and since the Five Dynasty (907–960AD), people have tended to use atacamite, which could be synthetic, as a green pigment rather than malachite. There are also records in ancient Chinese books of the use of copper board, NaCl, and vinegar to make copper green [
27,
28]. Furthermore, some experiments were carried out with coating copper sheets with a mixture of honey and NaCl, and successfully produced atacamite [
29]. The samples in this test have circular and dark core morphology and are also round under SEM images, which indicates that they are not natural minerals. Indeed, atacamite was also found in previous research of Yungang Grottoes, which shows this green pigment was widely used and might be synthetic.
In summary, the analysis of pigments excavated from archaeological sites provides a direct basis of age for conducting research on the pigments in the Yungang Grotto cave paintings. Simultaneously, it serves as a reference for the use of pigments in the surrounding cultural heritage.


