Article

An Evaluation of Three Halogens (Cl, Br, and I) Data from a Geological Survey of Japan Geochemical Reference Materials by Radiochemical Neutron Activation Analysis

1
Department of Chemistry, Graduate School of Science, Tokyo Metropolitan University, Hachioji 192-0397, Japan
2
Faculty of Science, Kanagawa University, 3-27-1 Rokkakubashi, Kanagawa-ku, Yokohama 221-8686, Japan
3
Institute for Integrated Radiation and Nuclear Science, Kyoto University, 2 Asashiro-nishi, Kumatori 590-0494, Japan
4
Department of Earth Sciences, School of Education and Integrated Arts and Sciences, Waseda University, 1-6-1 Nishi-Waseda, Shinjuku-ku, Tokyo 169-8050, Japan
*
Author to whom correspondence should be addressed.
Deceased on December 2022.
Minerals 2024, 14(3), 213; https://doi.org/10.3390/min14030213
Submission received: 29 December 2023 / Revised: 4 February 2024 / Accepted: 13 February 2024 / Published: 20 February 2024

Abstract

:
Fifteen Geological Survey of Japan (GSJ) geochemical reference materials were analyzed to determine the contents of three halogens (Cl, Br, and I) by using instrumental neutron activation analysis (INAA) and/or radiochemical NAA (RNAA). Two reference materials (JCp-1 and JSO-1) were analyzed using both INAA and RNAA. Although there were discrepancies in Cl and Br for JCp-1 between the INAA and RNAA data, probably due to sample heterogeneity, the INAA and RNAA data for JSO-1 were consistent with each other, within less than 7%, indicating that our RNAA data are reliable. With the repeated analyses of JR-3, the external repeatability of the data obtained using RNAA was evaluated to be 18% for Cl, 11% for Br, and 19% for I. Our RNAA data are in agreement with literature values using NAA for the three halogens, as well as those using isotope dilution mass spectrometry and ion chromatography for Cl. Systematically lower values when using neutron irradiation noble gas mass spectrometry (NI-NGMS) and inductively coupled plasma mass spectrometry (ICP-MS) with pyrohydrolysis can be observed, implying that there are losses for noble gas nuclides produced through the beta-decay of the neutron capture halogen nuclides in NI-NGMS and the non-quantitative recovery of Br and I during procedures in ICP-MS, respectively.

1. Introduction

Among the five halogens, F, Cl, Br, and I are present in the environment as stable elements. Halogens are highly mobile, volatile, and incompatible elements in a range of geochemical processes [1]. Due to their chemical characteristics, these elements have been widely used to trace the water cycle in subduction zones [2], understand the mechanism of magma degassing [3], and evaluate the recycling of solid earth materials in the crust and mantle [4]. Despite the importance of halogens in geochemical processes, the determination of halogens in geological samples is scarce. The reason for this is the difficulty in determining these elements due to their volatility and low concentrations in geological samples.
The determination of halogens in geological and environmental samples has been performed by neutron activation analysis (NAA) [5,6,7,8,9,10], ion chromatography (IC) [11,12,13], isotope dilution mass spectrometry (ID-MS) [5,14], inductively coupled plasma mass spectrometry (ICP-MS) [11,15,16], and neutron irradiation noble gas mass spectrometry (NI-NGMS) [17,18,19,20]. Instrumental NAA (INAA) and prompt gamma ray analysis (PGA), which is one of the NAA, can nondestructively determine Cl or Br [6,8]. However, it is difficult to determine halogens in most geological samples using these methods due to their low concentrations. Thus, a separation technique for halogens from the matrix is required. Through the utilization of the volatility of halogens, the pyrohydrolysis technique was developed [11]. In pyrohydrolysis, the sample is heated with V2O5 in a quartz tube and the evaporated halogens are trapped in an alkaline solution. The trapped solutions are introduced to ICP-MS for Br and I, and to IC for Cl. ID-MS, which is considered one of the most accurate analytical methods, has been applied for the determination of halogens [5,14]. As halogens have large cross sections for neutron capture and NGMS has high sensitivity, trace amounts of halogens in mantle-derived samples have been determined by NI-NGMS [17,18,19,20]. RNAA is the most used method for the determination of halogens [5,7,9,10]. In RNAA, as chemical separation is performed after the irradiation of the sample, contamination during chemical procedures can be ignored. In addition, the chemical yield can be directly estimated by adding carriers before the chemical procedures.
In this paper, we present the concentrations for three halogens (Cl, Br, and I) in 15 Geological Survey of Japan (GSJ) geochemical reference materials. As it is acknowledged that NAA can produce more accurate data for halogens compared with other analytical methods such as ICP-MS, INAA and RNAA were used in this study. Firstly, the accuracy of RNAA data was evaluated by comparing INAA data with RNAA data. Analyses of JR-3 were repeated to evaluate the measurement repeatability of our RNAA data. Along with the data evaluation, our RNAA procedure was applied to a broad range of GSJ geochemical reference materials to demonstrate the applicability of our RNAA procedure. This will contribute to establishing certified or recommended values of these halogens for these materials and to expanding the utility of these materials for the determination of halogens.

2. Materials and Methods

2.1. Carriers and Calibrators

The carriers and calibrators were prepared from chemical reagents (KCl, KBr, and KI). These three chemical reagents were dissolved for the preparation of standard solutions using high-purity water (Milli-Q grade). For I, KOH was added to solutions to stabilize I in the solution. The standard solutions were used as carriers in RNAA. Individual standard solutions were further diluted, and known amounts were pipetted on the filter paper and dried under a heat lamp to prepare the calibrators for both INAA and RNAA. By using calibrators, a comparative method was used for quantification.

2.2. Geochemical Reference Materials

A total of 15 GSJ geochemical reference materials were analyzed for the determination of the abundance of three halogens in this study. A sample list is shown in Table 1, where sample names and rock types are given. To date, these three halogens for these reference materials have been analyzed less extensively compared with other elements such as rare earth elements, and as a result of this, certified or preferable values have been established only for a limited number of samples. Thus, these GSJ geochemical reference materials were selected to contribute to expanding the utility of these reference materials. As JB-2 and JB-3 were out of stock, JB-2a and JB-3a were prepared as the replacement samples for JB-2 and JB-3, respectively. Original rocks for JB-2 and JB-2a, and JB-3 and JB-3a were taken from the same location, meaning that it was expected that the elemental abundances for JB-2a and JB-3a would be similar to those of JB-2 and JB-3, respectively. Twelve reference materials were analyzed using RNAA, while five reference materials (JCp-1, JCt-1, JDo-1, JLk-1, and JSO-1) were analyzed using INAA. Among the 15 materials investigated in this study, JCp-1 and JSO-1 were analyzed using both INAA and RNAA.

2.3. Methods

INAA and RNAA were performed at the Institute for Integrated Radiation and Nuclear Science, Kyoto University. All neutron irradiations were performed at irradiation site Pn-3 using a pneumatic sample transfer system. The thermal neutron fluxes (in cm−2s−1) at 1 MW and 5 MW were 3.93–4.48 × 10¹² and 2.30–2.39 × 10¹³, respectively. The analytical procedures used in this study were the same as those described in Ebihara et al. [21]. For the determination of the three halogens, 38Cl (t1/2 = 37.18 m), 82Br (t1/2 = 35.34 h), and 128I (t1/2 = 25.0 m) were used in INAA and RNAA.

2.3.1. INAA

Each geochemical reference material weighing ~26–85 mg was doubly sealed in a clean plastic bag. Samples along with the three calibrators were irradiated for 15 s at 1 MW or 3 s at 5 MW. After irradiation, the outer plastic bag was replaced with a new plastic bag, and the samples were measured twice for gamma rays after different cooling intervals. The gamma rays emitted by 38Cl and 128I were measured for 5 to 15 min after cooling for 20 to 60 min. The measurement time was adjusted depending on the induced radioactivity of 38Cl and 128I. After one day of cooling, measurements of the gamma rays emitted by 82Br were performed. The counting time for 82Br was about one day.

2.3.2. RNAA

A known amount of each halogen carrier along with an appropriate amount of saturated NaOH solution and holdback carrier for Mn were added into a Ni crucible and gently heated on a hot plate. Geochemical reference material weighing 40–360 mg was weighed in a clean plastic vial. Two geochemical reference materials along with the three calibrators were placed in an irradiation capsule and irradiated with neutrons for 10 min at 1 MW or 2 min at 5 MW. After cooling for about 10 min, each geochemical reference material was transferred into a Ni crucible and fused with about 1 g of NaOH. The crucible was heated mildly for the first 3 min and then strongly for 5 min. After fusion, the fused cake was dissolved in water and the hydroxide precipitate was separated from the supernatant by centrifugation. About 3 mg of Na2SO3 was added to the supernatant solution, and then 6 mol L−1 HNO3 was added into the supernatant solution. A PdI2 precipitate was formed by adding an appropriate amount of Pd(NO3)2 solution and separated from the supernatant by centrifugation. The PdI2 precipitate was washed two times using 0.2 mol L−1 HNO3 and collected on filter paper. The obtained precipitate PdI2 was subjected to gamma ray counting of 128I. After the separation of the PdI2 precipitate, an appropriate amount of AgNO3 was added into the supernatant solution containing Cl and Br to form a mixture of AgCl and AgBr precipitates. The mixture of AgCl and AgBr precipitates was washed two times using 0.2 mol L−1 HNO3 and collected on filter paper. The measurement for gamma rays emitted from 38Cl was performed. After an appropriate cooling period of one day, the mixture of AgCl and AgBr precipitates was again subjected to the measurement of 82Br.
The chemical yields of the three halogens during radiochemical separation were determined using the reactivation method. Multiple precipitate samples were placed together in an irradiation capsule and irradiated with neutrons without a flux monitor. After the gamma ray counting of PdI2 and a mixture of AgCl and AgBr precipitates, these precipitates along with the calibrators, which were prepared by pipetting known amounts of standard solutions on filter paper, were irradiated with neutrons for a few seconds. After cooling for about 10 min, the precipitate of PdI2 and the mixture of AgCl and AgBr precipitates were subjected to the measurement of gamma rays. Gamma rays emitted by 38Cl, 82Br and 128I were measured for 2 to 20 min. The measurement time was adjusted depending on the induced radioactivity of 38Cl, 82Br, and 128I.

3. Results and Discussion

The analytical results for INAA and RNAA are shown in Table 2 and Table 3, respectively. The abundances of Cl and Br were determined using two different gamma ray energies, and the individual values are given in Supplementary Material Table S1. The chemical yields of the three halogens for all RNAA are summarized in Supplementary Material Table S2.

3.1. INAA

Sedimentary rocks have higher halogen abundances than igneous rocks, and their abundances can be determined even by INAA. Although it is well known that INAA can yield highly accurate data due to its nature as a non-destructive method, these values have a high level of uncertainty and a high detection limit due to the high background in the gamma ray spectrum. In this study, the GSJ geochemical reference materials such as sedimentary rock, sediment, and soil were analyzed using INAA. Among the samples investigated in this study, as JCt-1 has a lower abundance of the three halogens than the other materials [22], this reference material was not analyzed using INAA.
The analytical results obtained using INAA are shown in Table 2. The three GSJ geochemical reference materials (JDo-1, JLK-1, and JLs-1) were analyzed once. As JCp-1 and JSO-1 were analyzed twice, mean values were calculated and are indicated in Table 2. Among the components which affect uncertainties in INAA [26], as the counting statistics were significant, the uncertainties for individual values were calculated using counting statistics (Table S1). In the case of Cl and Br, two gamma ray peaks were used for quantification. Thus, uncertainties accompanied by the mean value were estimated as the standard deviation of the mean from the range of individual values (Table 2). Iodine for JDo-1 and JLs-1, and Cl for JLk-1 could not be detected, and their detection limits were calculated and are shown in Table 2. The detection limit is defined as a concentration corresponding to 3√N, where N denotes the background count for the peak area. No recommended values for the three halogens of the five materials analyzed by INAA are available [23]. Only preferable values for Br in JDo-1 and JLk-1 are available, and these values are listed in Table 2 along with the literature values [10,16,23]. The sample weights used in INAA were decided based on literature values for iodine [10,16,23]. JSO-1 and JLk-1 have higher iodine abundances, and approximately 30 mg of these samples were used. In contrast, the other three materials (JCp-1, JDo-1, and JLs-1) have lower iodine abundance than those of the other two reference materials, and approximately 80 mg of these samples were used.
Our data for the content of these three halogens for the five GSJ geochemical reference materials are in agreement with the corresponding literature values, except for Br in JLs-1. Our Br data for JLs-1 are about 2.5 and 1.6 times higher than those reported by Chai and Muramatsu [16] and Sekimoto and Ebihara [10], respectively. One possible explanation for this difference is the spectral interferences in INAA. As shown in Supplementary Material Table S2, our Br data obtained using 554 and 776 keV are consistent with each other, and there is the possibility of spectral interferences from 77Ge (553.98 and 775.85 keV) and 233Th (554.04 and 774.00 keV) for these gamma-ray energies with the same degree of contribution to these peaks. For the gamma ray counting of 82Br, the cooling time was about one day. After one day, most of the 233Th was decayed due to the short half live of 233Th (t1/2 = 22.3 m). The highest intensity ratio of gamma rays emitted from 77Ge was 264.42 keV, and this peak was not detected. Therefore, it is unlikely that our higher Br values for JLs-1 can be explained by the spectral interferences in INAA. Thus, sample heterogeneity could explain our higher Br values in JLs-1. Among the five GSJ reference materials, preferable values of Br in JDo-1 and JLk-1 and I in JLk-1 are available [23]. Our Br data for JLk-1 is consistent with the preferable value [23], while our data for Br in Jdo-1 and I in JLk-1 are higher than the preferable values [23]. The preferable value of Br in Jdo-1 was reported as mean values calculated from two INAA data (0.57 and 0.60 μg g−1) and IC data (1.2 μg g−1) [23]. Our Br value for Jdo-1 agrees with the INAA value. Thus, the difference in the Br value of Jdo-1 between our INAA data and preferable data can be explained using a higher IC value for the estimation of the preferable value. As mentioned above, our Br value of Jdo-1 is consistent with literature values obtained using ICP-MS combined with pyrohydrolysis and RNAA [10,16]. Only one INAA data was used for the estimation of the preferable value of I in JLk-1 [23]. As shown in Table 2, our INAA data for I in JLk-1 is consistent with literature values [16,22]. It seems that the INAA data used in Imai et al. [23] is unreliable. Thus, it was strongly suggested that the preferable values of Br in Jdo-1 and I in JLk-1 should be reevaluated.

3.2. RNAA

The abundances of Cl, Br, and I for twelve GSJ geochemical reference materials were determined using RNAA (Table 1), and the analytical results are summarized in Table 3. Each geological reference material was analyzed twice, except for JSO-1 and JCp-1, and JR-3, which were analyzed once and eleven times, respectively. Individual analytical data for each material are given in Table 3, where the mean values are also indicated. As observed in the previous study [21], the uncertainties (19%) of neutron fluctuation and neutron attenuation during the irradiation of precipitates significantly contribute to uncertainty in the chemical yield (Tables S1 and S2) due to the irradiation of multiple samples at the same time. As a result, the uncertainty of individual values obtained using each gamma ray peak (Table S2) was calculated by combining neutron fluctuation and neutron attenuation, and counting statistics. For the cases of Cl and Br, mean values were calculated using two gamma ray energies, and uncertainties accompanied by the mean value were estimated as the standard deviation of the mean from the range of individual values (Table 3). In the case of JR-3, uncertainties were estimated by standard deviation with the 11 analyses. For comparison, recommended, preferable, and compilation values [24,25] are also indicated in Table 3.
It is acknowledged that RNAA can yield accurate data due to the direct estimation of the chemical yield. The chemical yields of the three halogens for all analyses were determined using the reactivation method in this study. These values are summarized in Supplementary Material Table S2. The analytical procedure used in this study was the same as the previous studies [7,9,10,21,27] whose chemical yields for Cl, Br, and I were reported to be more than 80%, 70%, and 70%, respectively. As shown in Supplementary Material Table S2, the chemical yields for Cl, Br, and I of most samples were similar to those reported in previous studies, and the mean values for the chemical yields were 72% for Cl, 58% for Br, and 67% for I in this study. The exceptions are 1.9% for Cl in JGb-1, 4.5% for Br in JGb-1, 6.6% for Br in JH-1, and 7.8% for Br in JP-1. These chemical yields are considered to be anomalous, possibly due to the poor coagulation of AgCl and/or AgBr precipitate at the final step of analytical procedures. Thus, the quantitative values calculated using anomalously low chemical yields are shown in italics in Table 3 and were not used for the calculation of mean values.

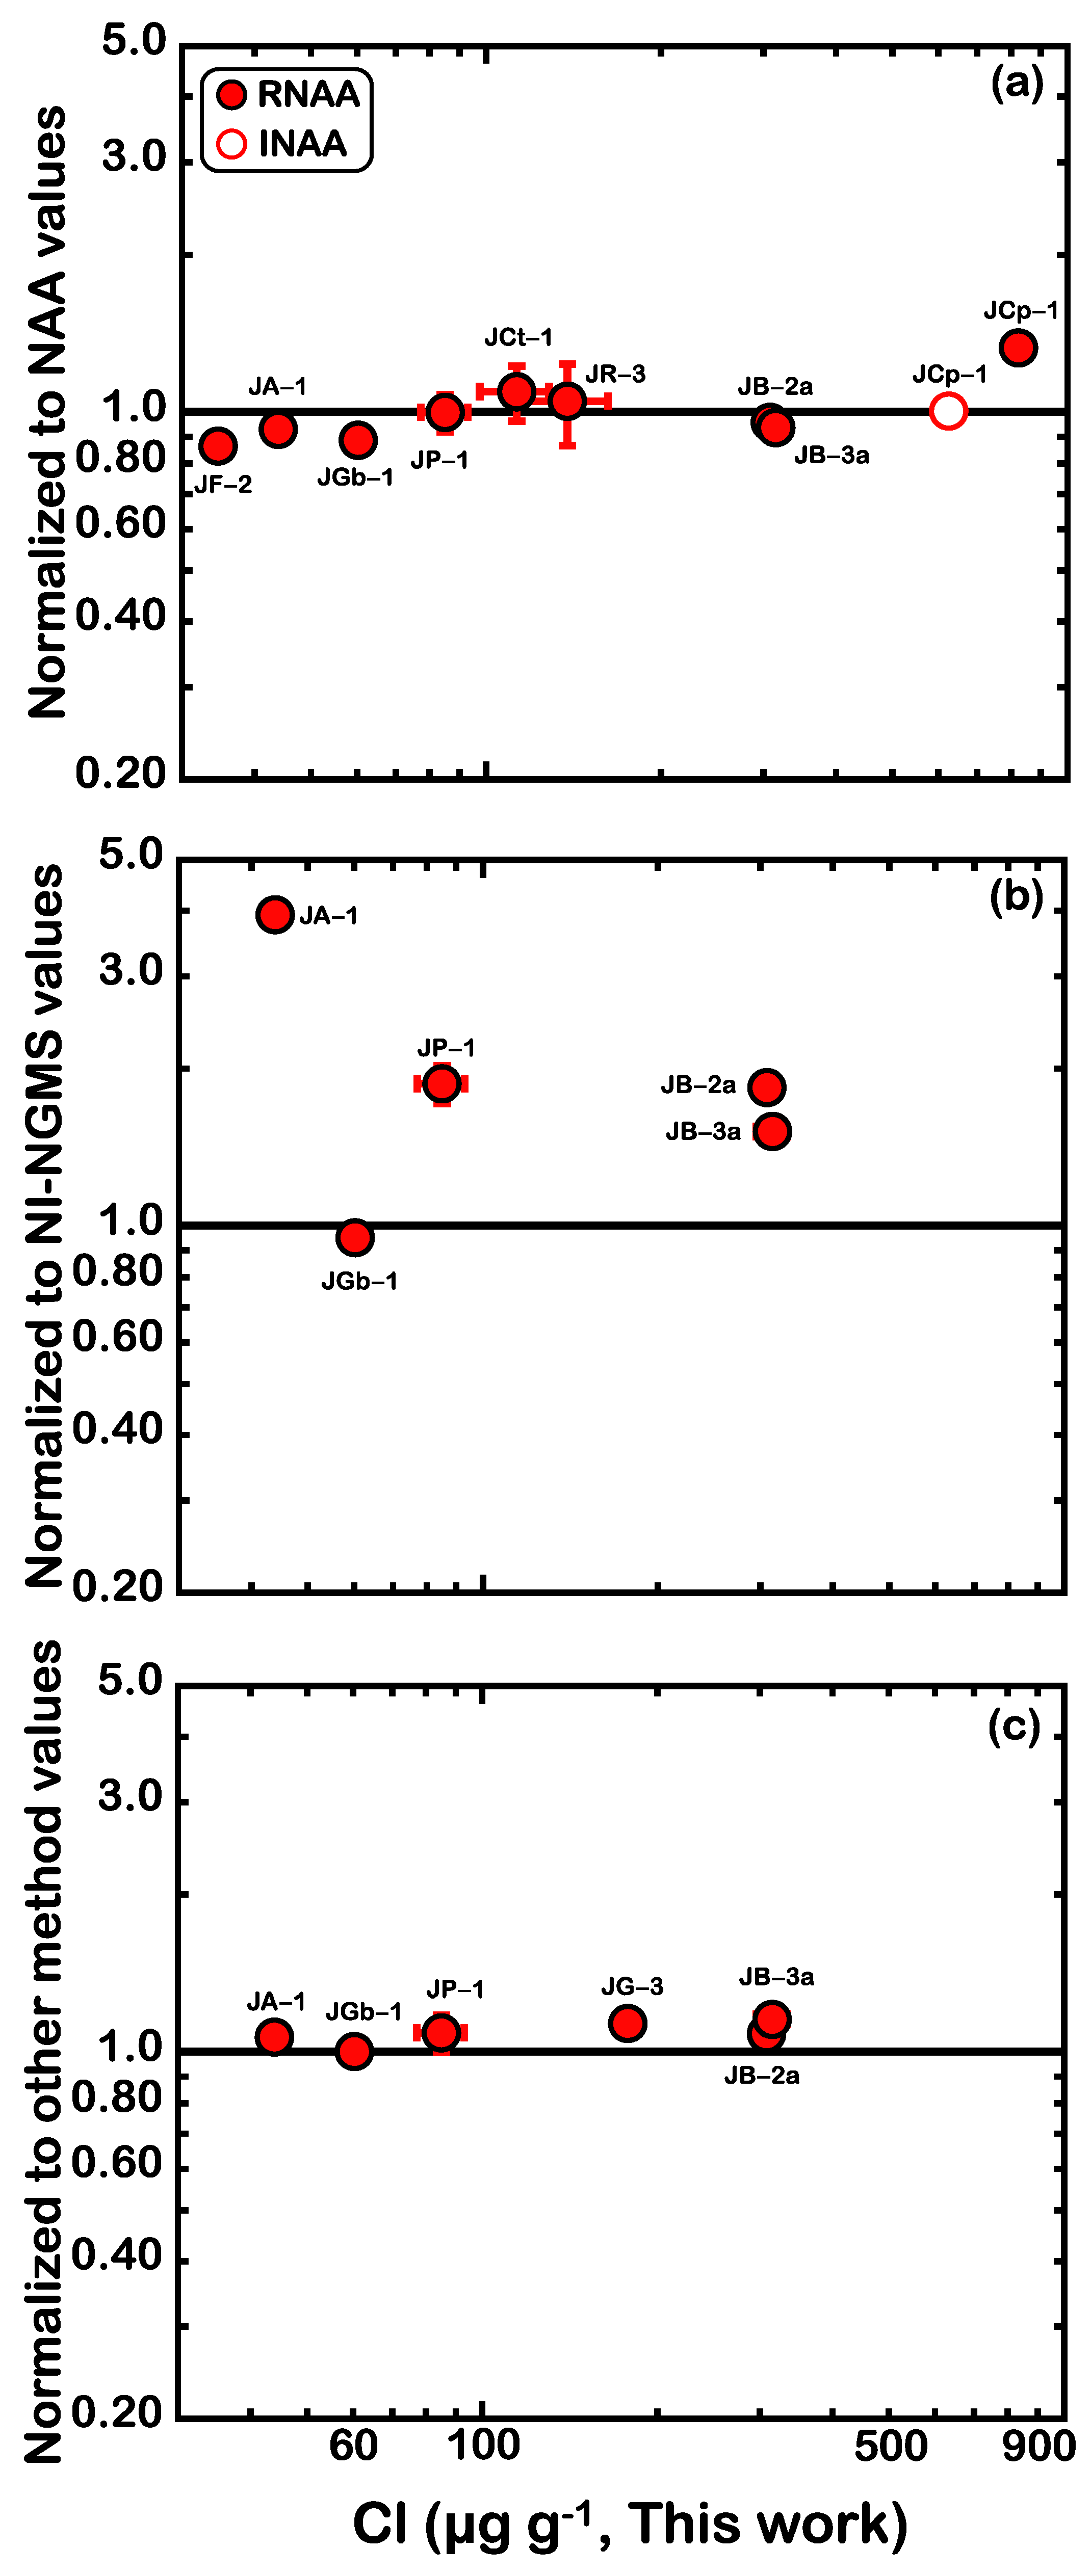
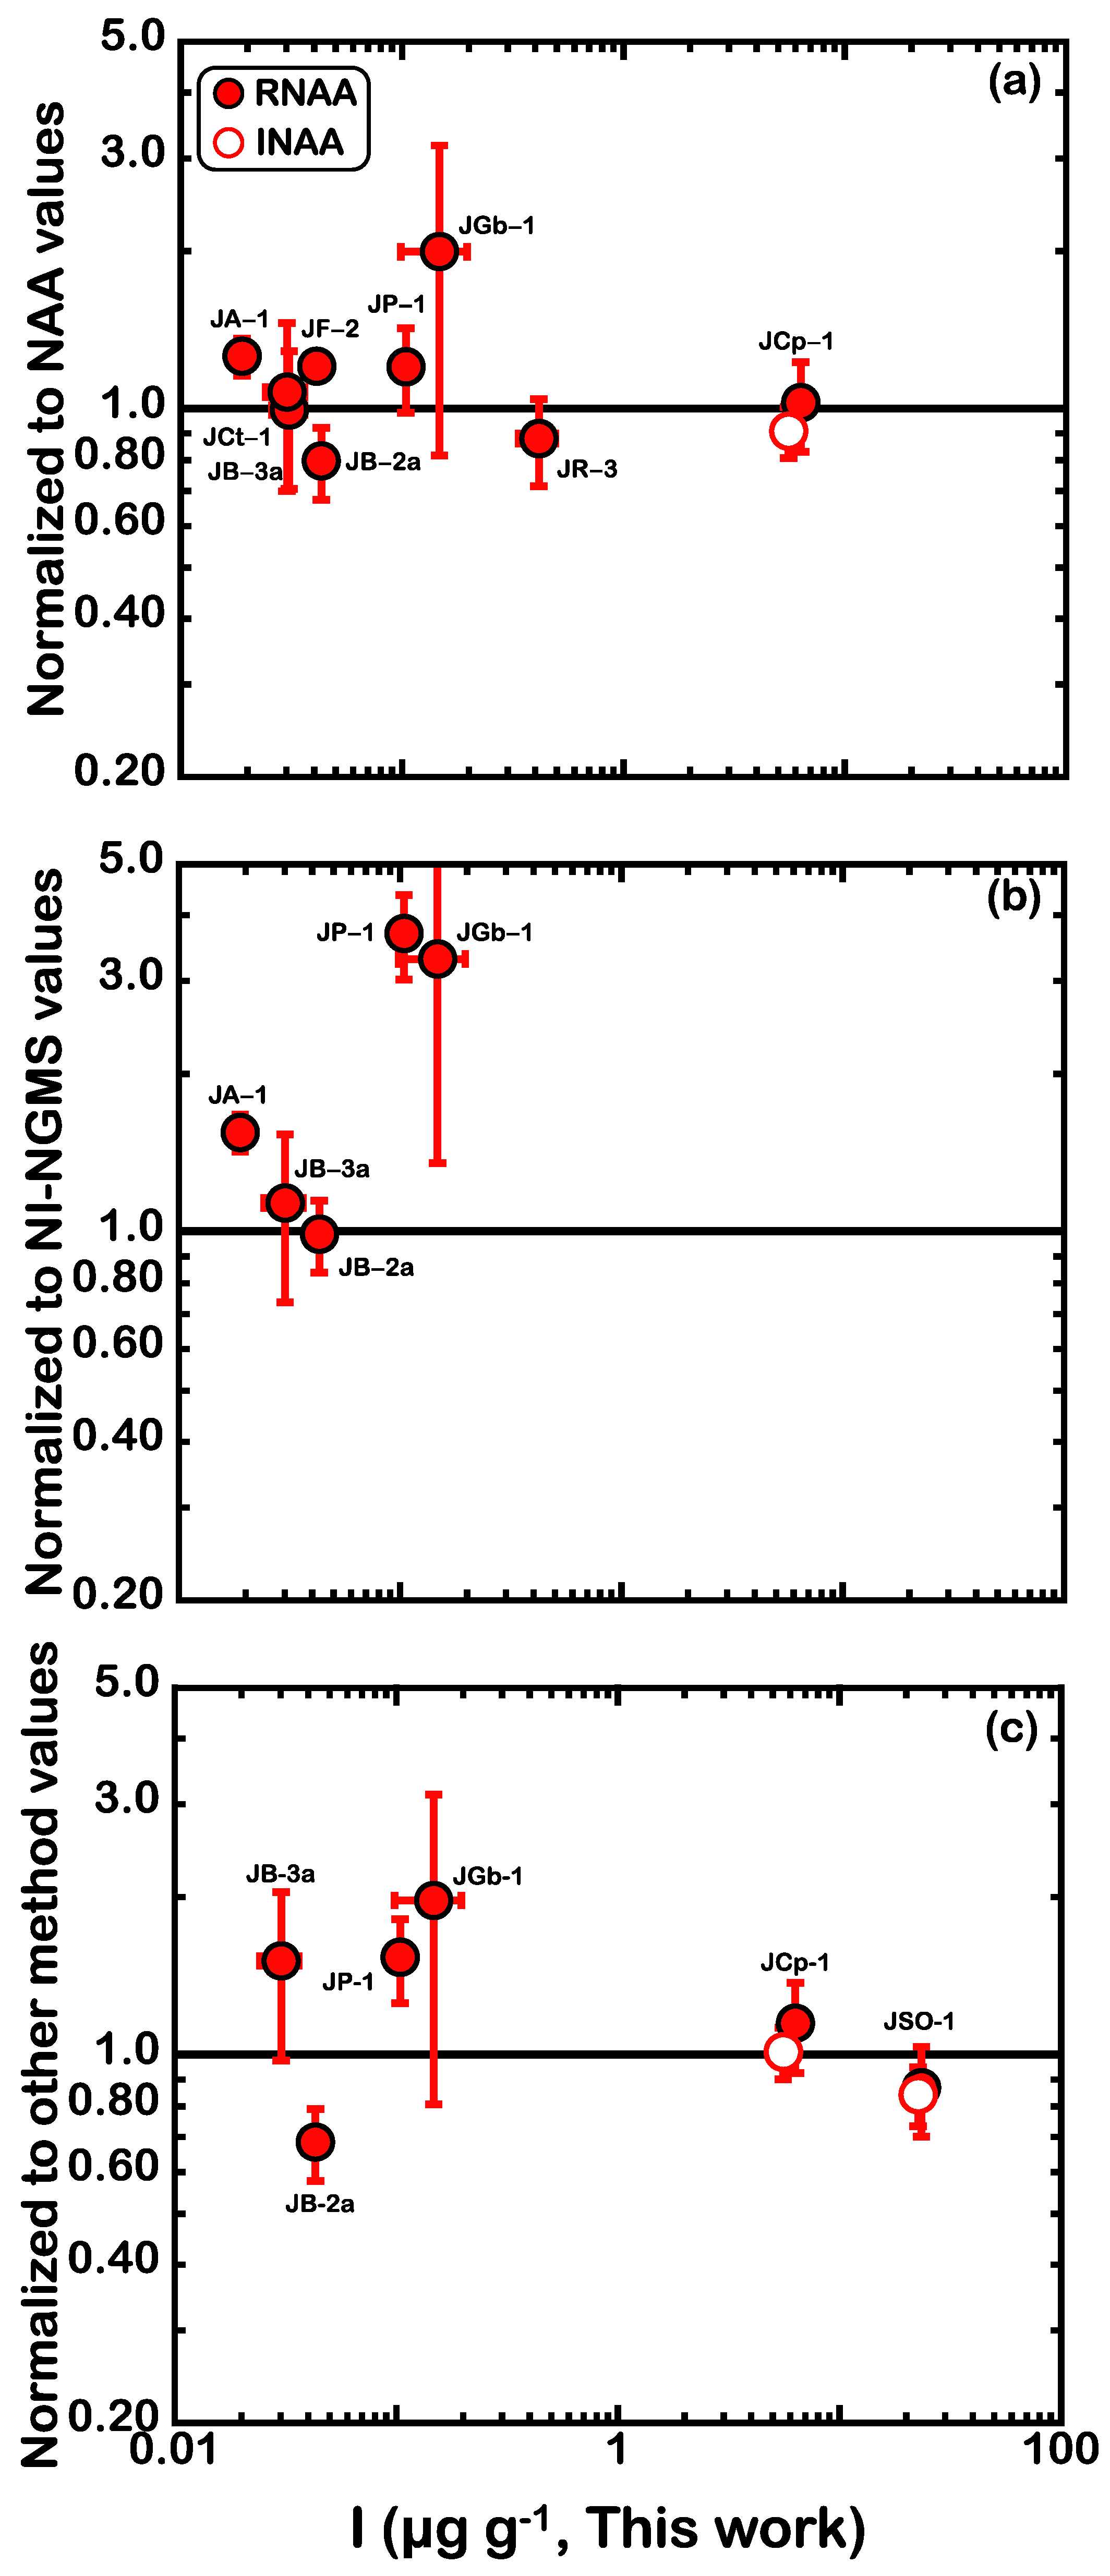
3.2.1. Comparison with INAA Data

Among the 12GSJ geochemical reference materials analyzed by RNAA, JCp-1 and JSO-1 were also analyzed using INAA. The evaluation of our RNAA data for these halogens can be performed by comparing these data with INAA data (Table 3). In the case of JSO-1, our RNAA values for Cl, Br, and I are consistent with our INAA values within 7%, 3%, and 3%, respectively. Approximately 30 mg of JSO-1 was used for INAA and RNAA. Considering that our RNAA and INAA values are consistent with each other, the three halogens are homogeneously distributed in JSO-1 at a scale of 30 mg. In contrast with JSO-1, there are significant differences in the Cl and Br values of JCp-1 between our RNAA and INAA data. Our RNAA data for Cl and Br are 32% and 40% higher than our INAA data, respectively. The observed differences between our INAA and RNAA data can be also seen in comparison with the literature values [16,22]. Our RNAA data for Cl and Br are about 33% and 30% higher than these literature values, respectively. The sample weight of JCp-1 used in INAA was higher than that of JSO-1, meaning that it can be considered that the observed differences in the Cl and Br of JCp-1 between the INAA data and RNAA data can be explained by the self-absorption of gamma rays in the sample. It is well known that the degree of self-absorption at a lower energy peak is higher than that at a higher energy peak. The gamma ray peak of 128I (443 keV) has a lower energy than those of 38Cl (1642 and 2168 keV) and 82Br (554 and 776 keV). However, a difference in the I of JCp-1 between the INAA and RNAA data can be seen (Table 3). The self-absorption of gamma rays in the sample cannot explain the observed differences in Cl and Br. Considering that there is an agreement between our RNAA and INAA data for JSO-1, Cl and Br are heterogeneously distributed in JCp-1 at a scale of about 100 mg, while I is homogeneously distributed within 15%.

3.2.2. JR-3

Similar to [10], JR-3 was used as a control sample during the six RNAA runs. Sekimoto and Ebihara [10] analyzed JR-3 three times, and the external repeatability (n = 3, 1s) for Cl, Br, and I was 9%, 8%, and 8%, respectively. A total of 11 analyses of JR-3 were performed in this study, and the external repeatability (1s) in this study was estimated to be 18% for Cl, 11% for Br, and 19% for I. Our external repeatability was significantly higher than that estimated by Sekimoto and Ebihara [10], which could be explained by analytical artifacts.
A reactivation method was used to estimate the chemical yield for the radiochemical purification process in this study. As mentioned by Ebihara et al. [21], attention should be paid to neutron fluctuation in the irradiation capsule and the neutron attenuation by the sample when multiple samples are analyzed at the same time. By analyzing the 18 PdI2 precipitates, it was observed that such effects could cause as much as a 20% divergence in chemical yield [21]. Our individual RNAA data for the three halogens in JR-3 are plotted against individual chemical yields in Figure 1, where our mean values and the literature values [7,9] are also indicated for comparison. As shown in Figure 1a,c, negative correlations can be seen in Cl and I, while no correlation can be seen in Br. Similar to the previous study [21], chemical yields for the three halogens were determined using a single irradiation for multiple samples. As shown in Figure 1a,c, the difference in Cl values between the minimum and maximum values is larger than that of I values. The chemical yields for Cl and I were determined by the reactivation of a mixture of AgCl and AgBr precipitates and a PdI2 precipitate, respectively. The neutron capture cross section of 105Pd (22 barn), which has the highest value among those for Pd isotopes, is lower than that of 109Ag (87 barn), indicating that the chemical yields for Cl and Br are affected by the neutron attenuation of their precipitate more than those for I. Thus, inaccurate chemical yields due to the neutron fluctuation in the irradiation capsule and the neutron attenuation of precipitates are responsible for the observed external repeatability in this study. As proposed by Ebihara et al. [21], the neutron flux at each sample position can be monitored by a flux monitor attached to each sample. Thus, the reliability of chemical yields could increase, and lower external repeatability could be obtained. In the following discussion, the estimated external repeatability (18% for Cl, 11% for Br, and 19% for I) is used.

3.2.3. Comparisons with Other Analytical Methods

Our RNAA data for the three halogens in the GSJ geochemical reference materials are compared with literature values in Figure 2, Figure 3 and Figure 4. For the GSJ geochemical reference materials investigated in this study, the abundance of all three halogens (Cl, Br, and I) was determined using RNAA [5,22] and NI-NGMS [20]. Other analytical methods such as PGA [8], IC [12,13,28], and ID-MS [5,14] for Cl, INAA for Br [6], and ICP-MS for both Br and I [15,16] have been applied. Literature values provided by NAA (PGA, INAA, and RNAA), NI-NGMS, and other analytical methods such as IC, ID-MS, and ICP-MS are summarized in Supplementary Material Tables S3, S4 and S5, respectively. In the case that literature values were obtained using the same analytical method, mean values were calculated and used for comparison. As literature values for Cl in JH-1 and JSO-1, Br in JH-1, and I in JG-3 and JH-1 are not available, these values are first reported in this study.
Our RNAA values for Cl are in excellent agreement with the literature values using NAA (PGA and RNAA), ID-MS, and IC within the repeatability (Figure 2a,c). Although our Cl value for JGb-1 is consistent with the NI-NGMS value, there are inconsistencies in the result for the other four reference materials (JA-1, JP-1, JB-2a, and JB-3a) between our RNAA data and NI-NGMS data (Figure 2b). In contrast with the case for Cl, the consistency for Br between our RNAA data and NAA data from the literature is poor (Figure 3a). These differences can be seen in JA-1 (73%), JGb-1 (79%), JF-2 (14%), JG-3 (30%), and JB-3a (24%). Among these reference materials, JF-2, JG-3, and JB-3 were analyzed by INAA [6] and the corresponding INAA values displayed about 30% uncertainty. In considering the uncertainty of INAA values, our RNAA data are consistent with the literature values provided by INAA. JA-1 and JGb-1 were analyzed by RNAA [5], and our analytical procedure was the same as that used in Shinonaga et al. [5]. 80Br (t1/2 = 17.68 m) was used in Shinonaga et al. [5], while 82Br (t1/2 = 35.3 h) was used in this study. The 616.2 keV peak of 80Br suffers from the interference of the 619.1 keV peak of 82Br. Although the reason for the observed differences in JA-1 and JGb-1b between our RNAA data and the literature values of RNAA are not clear, it is likely that these differences stem from improper interference correction. Inconsistencies in the Br data are observed in NI-NGMS data for JGb-1, JA-1, and JP-1, ICP-MS data for JCp-1 and JP-1, and ID-MS data for JA-1, as shown in Figure 3b,c. In the case of I, agreements between our RNAA data and literature values from RNAA can be seen in Figure 4a except for JGb-1. JGb-1 was analyzed twice in this study, and the abundance values of I were 0.197 ± 0.016 μg g−1 and 0.0985 ± 0.0067 μg g−1. The low value is consistent with a literature value [5]. The chemical yield for the high value is 29.0% (Supplementary Material Table S2), and this chemical yield is significantly lower than those for other samples. Thus, the high value could be overestimated due to the lower chemical yield. Similar to the case for Br, inconsistencies in I were observed for most reference samples, except for the NI-NGMS values for JB-2 and JB-3 (Figure 4b,c).
Our RNAA data for the three halogens are in agreement with literature values using NAA, ID-MS, and IC, except for some reference materials (Br for JGb-1 and JA-1). Almost all of our RNAA data are higher than the NI-NGMS [20] and ICP-MS [11] data shown in Figure 2b, Figure 3b,c and Figure 4b,c. Analyses of reference materials were performed twice by NI-NGMS, and the abundance values of the three halogens provided by these two analyses were consistent with each other. The sample weight used in Kobayashi et al. [20] was 40 to 52 mg, which was lower than that used in this study. Thus, the lower values provided by NI-NGMS could be explained by the sample heterogeneity. However, it can be seen that lower values are obtained by using NI-NGMS, except for Cl for JGb-1, and Br and I for JB-2 and JB-3 (Figure 2b, Figure 3e and Figure 4h). Thus, the systematically lower values provided by NI-NGMS may not be explained by the sample heterogeneity. In NI-NGMS, the sample is irradiated with a high dose of neutrons, and the noble gas nuclides produced through beta-decay of the neutron capture halogen nuclides are extracted by stepwise heating. It is likely that the lower values produced by NI-NGMS can be explained by the loss of noble gasses during the procedure. In the ICP-MS procedure with pyrohydrolysis, a sample mixed with V2O5 is placed into a quartz tube and heated at 1000 °C. The evaporated Br and I are collected in a trap solution containing tetramethylammonium hydroxide. 125I is added to the sample before combustion to estimate chemical yields [11]. The chemical yields were observed to be 90–100%. Although the distribution of I in geochemical reference material is not exactly known, it is expected that the behaviors of spiked-125I and I from the sample might be different from each other, and spiked-125I could be easily collected in the trap solution during the pyrohydrolysis procedure. Thus, it seems that the use of 125I during the procedure does not always provide an accurate chemical yield. INAA and RNAA data for JSO-1 (this study) and CLB-1 [21] are in excellent agreement with each other, indicating that equilibrium occurred between the sample and the carrier during alkali fusion in RNAA. Thus, the chemical yields for RNAA are more accurate than those for ICP-MS using 125I [11]. Our higher Br and I values using RNAA can be explained by the fact that the quantitative collection of Br and I cannot be achieved in the ICP-MS procedure combined with pyrohydrolysis [11].

4. Conclusions

The contents of three halogens (Cl, Br, and I) were determined for 15 GSJ geochemical reference materials by using INAA and/or RNAA, with the objective of expanding the utility of these geochemical reference materials. The five GSJ reference materials (JCp-1, JSO-1, JDo-1, JLk-1, and JLs-1) were analyzed by INAA. Our INAA data are consistent with literature values obtained using RNAA and ICP-MS, while inconsistencies between our INAA data and preferable values can be found for Br in JDo-1 and I in JLk-1, strongly suggesting that these two preferable values should be reevaluated. The accuracy of RNAA data was evaluated using INAA data for JSO-1 and JCp-1. The excellent agreement between INAA and RNAA data indicates that our analytical procedure using RNAA can produce reliable data for the three halogens. The external repeatability of our RNAA data was evaluated by repeated analyses of JR-3. The obtained repeatability is higher than expected, possibly due to the inaccurate chemical yield caused by the neutron fluctuation in an irradiation capsule and the neutron attenuation by samples. Our RNAA data are consistent with literature values obtained using NAA for Cl, Br, and I, and using IC and ID-MS for Cl. The values obtained using NI-NGMS and ICP-MS with pyrohydrolysis are systematically lower than our RNAA data. These observations can be explained by the loss of noble gas nuclides produced through beta-decay of the neutron capture halogen nuclides in NI-NGMS and the non-quantitative collection of Br and I during procedures in ICP-MS with pyrohydrolysis. The data for the three halogens in JH-1, I in JG-3, and Cl in JSO-1 were newly determined. It was demonstrated that our analytical procedure using RNAA can simultaneously produce accurate data for three halogens in rock samples.

Supplementary Materials

The following supporting information can be downloaded at: https://www.mdpi.com/article/10.3390/min14030213/s1, Table S1: Abundances of Cl and Br (in μg g−1) in GSJ geochemical reference materials analyzed by INAA and RNAA; Table S2: Chemical yields (in %) of Cl and Br in RNAA; Table S3: Literature values (in μg g−1) for Cl, Br, and I in the GSJ geochemical reference materials using NAA; Table S4: Literature values (in μg g−1) for Cl, Br, and I in the GSJ geochemical reference materials using NI-NGMS; Table S5: Literature values (in μg g−1) for Cl, Br, and I in the GSJ geochemical reference materials using other methods.

Author Contributions

N.S., S.S. and M.E.; methodology, N.S., S.S. and M.E.; software, N.S., S.S. and M.E.; validation, N.S., S.S. and M.E.; investigation, N.S., S.S. and M.E.; resources, M.E.; Writing—Original draft preparation, N.S., S.S. and M.E.; writing—review and editing, N.S. and M.E.; supervision, M.E.; project administration, M.E.; funding acquisition, S.S. and M.E. All authors have read and agreed to the published version of the manuscript.

Funding

This research was supported by the JSPS KAKENHI (grant no. JP18957117 to N.S. and S.S.) and a fund from Waseda University through the Waseda University Grant for Special Research Projects (2020C-142 to M.E.).

Data Availability Statement

The data presented in the tables are openly available in the references stated with the tables or upon request from the corresponding author.

Acknowledgments

This research was performed by using facilities of the Institute for Integrated Radiation and Nuclear Science, Kyoto University. We are thankful to anonymous reviewers for their helpful and constructive comments.

Conflicts of Interest

The authors declare no conflicts of interest.

References

  1. Harlov, D.E.; Aranovich, L. The Role of Halogens in Terrestrial and Extraterrestrial Geochemical Processes: Surface Crust, and Mantle, 1st ed.; Springer: Cham, Switzerland, 2018. [Google Scholar]
  2. Broadley, M.W.; Ballentine, C.J.; Chavrit, D.; Dallai, L.; Burgess, R. Sedimentary halogen and noble gases within Western Antarctic xenoliths: Implications of extensive volatile recycling to the sub continental lithospheric mantle. Geochim. Cosmochim. Acta 2016, 176, 139–156. [Google Scholar] [CrossRef]
  3. Villemant, B.; Boudon, G. Transition from dome-forming to Plinian eruptive styles controlled by H2O and Cl degassing. Nature 1998, 392, 65–69. [Google Scholar] [CrossRef]
  4. Muramatsu, Y.; Fehn, U.; Yoshida, S. Recycling of iodine in fore-arc areas: Evidence from the iodine brines in Chiba, Japan. Earth Planet. Sci. Lett. 2001, 192, 583–593. [Google Scholar] [CrossRef]
  5. Shinonaga, T.; Ebihara, M.; Nakahara, H.; Tomura, K.; Heumann, K.G. Cl, Br and I in igneous standard rocks. Chem. Geol. 1994, 115, 213–225. [Google Scholar] [CrossRef]
  6. Korotev, R.L. A self-consistent compilation of elemental concentration data for 93 geochemical reference samples. Geostand. Newslett. 1996, 20, 217–245. [Google Scholar] [CrossRef]
  7. Ebihara, M.; Ozaki, H.; Kato, F.; Nakahara, H. Determination of chlorine, bromine and iodine in rock samples by radiochemical neutron activation analysis. J. Radioanal. Nucl. Chem. 1997, 216, 107–112. [Google Scholar] [CrossRef]
  8. Sano, T.; Fukuoka, T.; Hasenaka, T. Determination of chlorine contents in Geological Survey of Japan reference materials by prompt gamma neutron activation analysis. Geostand. Geoanal. Res. 2004, 28, 443–448. [Google Scholar] [CrossRef]
  9. Ozaki, H.; Ebihara, M. Determination of trace halogens in rock samples by radiochemical neutron activation analysis coupled with the k0-standardization method. Anal. Chim. Acta 2007, 583, 384–391. [Google Scholar] [CrossRef]
  10. Sekimoto, S.; Ebihara, M. Accurate determination of chlorine, bromine, and iodine in sedimentary rock reference samples by radiochemical neutron activation analysis and a detailed comparison with inductively coupled plasma mass spectrometry literature data. Anal. Chem. 2013, 85, 6336–6341. [Google Scholar] [CrossRef]
  11. Schnetger, B.; Muramatsu, Y. Determination of halogens, with special reference to iodine, in geological and biological samples using pyrohydrolysis for preparation and inductively coupled plasma mass spectrometry and ion chromatography for measurement. Analyst 1996, 121, 1627–1631. [Google Scholar] [CrossRef]
  12. Shimizu, K.; Itai, T.; Kusakabe, M. Ion chromatographic determination of fluorine and chlorine in silicate rocks following alkaline fusion. Geostand. Geoanal. Res. 2007, 30, 121–129. [Google Scholar] [CrossRef]
  13. Wang, Q.; Makishima, A.; Nakamura, E. Determination of fluorine and chlorine by pyrohydrolysis and ion chromatography: Comparison with alkaline fusion digestion and ion chromatography. Geostand. Geoanal. Res. 2010, 34, 175–183. [Google Scholar] [CrossRef]
  14. Fujitani, T.; Nakamura, N. Determination of chlorine in nine rock reference materials by isotope dilution mass spectrometry. Geostand. Geoanal. Res. 2006, 30, 113–120. [Google Scholar] [CrossRef]
  15. Schnetger, B.; Muramatsu, Y.; Yoshida, S. Iodine (and other halogens) in twenty six geological reference materials by ICP-MS and ion chromatography. Geostand. Newslett. 1998, 22, 181–186. [Google Scholar] [CrossRef]
  16. Chai, J.Y.; Muramatsu, Y. Determination of bromine and iodine in twenty-three geochemical reference materials by ICP-MS. Geostand. Geoanal. Res. 2007, 31, 143–150. [Google Scholar] [CrossRef]
  17. Kendrick, M.A. High precision Cl, Br and I determination in mineral standards using the noble gas method. Chem. Geol. 2012, 292–293, 116–126. [Google Scholar] [CrossRef]
  18. Kendrick, M.A.; D’Andres, J.; Hoolden, P.; Ireland, T. Halogens (F, Cl, Br, I) in thirteen USGS, GSJ and NIST international rock and glass reference materials. Geostand. Geoanal. Res. 2018, 42, 499–511. [Google Scholar] [CrossRef]
  19. Marks, M.A.W.; Kendrich, M.A.; Eby, G.N.; Zack, T.; Wenzel, T. The F, Cl, Br and I contents of reference glasses BHVO-2G, BIR-1G, BCR-2G, GSD-1G, GSE-1G, NIST SRM 610 and NIST SRM 612. Geostand. Geoanal. Res. 2017, 41, 107–122. [Google Scholar] [CrossRef]
  20. Kobayashi, M.; Sumino, H.; Saito, T.; Nagao, K. Determination of halogens in geological reference materials using neutron irradiation noble gas mass spectrometry. Chem. Geol. 2021, 582, 120420. [Google Scholar] [CrossRef]
  21. Ebihara, M.; Shirai, N.; Sekimoto, S. Redetermination of mass fractions of three halogens (Cl, Br, I) for seventeen USGS geochemical reference materials. Geostand. Geoanal. Res. 2023, 47, 931–944. [Google Scholar] [CrossRef]
  22. Sekimoto, S.; Homura, Y.; Ho, V.D.; Inagaki, M.; Shirai, N.; Ohtsuki, T. Neutron activation analysis of carbonate reference materials: Coral (JCp-1) and giant clam (JCt-1). J. Radioanal. Nucl. Chem. 2019, 322, 1579–1583. [Google Scholar] [CrossRef]
  23. Imai, N.; Terashima, S.; Itoh, S.; Ando, A. 1996 compilation of analytical data on nine GSJ geochemical reference samples, “sedimentary rock series”. Geostand. Newslett. 1996, 20, 165–216. [Google Scholar] [CrossRef]
  24. Imai, N.; Terashima, S.; Itoh, S.; Ando, A. 1994 compilation of analytical data from minor and trace elements in seventeen GSJ geochemical reference samples, “Igneous rock series”. Geostand. Newslett. 1995, 19, 135–213. [Google Scholar] [CrossRef]
  25. Imai, N.; Terashima, S.; Itoh, S.; Ando, A. 1998 compilation of analytical data for five GSJ geochemical reference samples: The “Instrumental Analysis series”. Geostand. Newslett. 1999, 23, 223–250. [Google Scholar] [CrossRef]
  26. Greenberg, R.R.; Bode, P.; De Nadai Fernandes, E.A. Neutron activation analysis: A primary method of measurement. Spectrochim. Acta Part B 2011, 66, 193–241. [Google Scholar] [CrossRef]
  27. Nakamoto, T.; Oura, Y.; Ebihara, M. Comparative study of activation analyses for the determination of trace halogens in geological and cosmochemical samples. Anal. Sci. 2007, 23, 1113–1119. [Google Scholar] [CrossRef]
  28. Shimizu, K.; Suzuki, K.; Saitoh, M.; Konno, U.; Kawagucci, S.; Ueno, Y. Simultaneous determinations of fluorine, chlorine, and sulfur in rock samples by ion chromatography combined with pyrohydrolysis. Geochem. J. 2015, 49, 113–124. [Google Scholar] [CrossRef]
Figure 1. Comparison of chemical yield with analytical data for (a) Cl, (b) Br, and (c) I in JR-3. Line and shaded area represent mean value and external repeatability (1 s) for our data and literature values [9,10], respectively.
Minerals 14 00213 g001
Figure 2. Comparison of the abundance of Cl in the GSJ geochemical reference materials obtained in this study with literature values using (a) NAA, (b) NI-NGMS, and (c) other analytical methods such as ID-MS, IC and ICP-MS. Literature values are taken from Supplementary Material Tables S3–S5.
Minerals 14 00213 g002
Figure 3. Comparison of the abundance of Br in the GSJ geochemical reference materials obtained in this study with literature values using (a) NAA, (b) NI-NGMS, and (c) other analytical methods such as ID-MS and ICP-MS. Literature values are taken from Supplementary Material Tables S3–S5.
Minerals 14 00213 g003
Figure 4. Comparison of the abundance of I in the GSJ geochemical reference materials obtained in this study with literature values using (a) NAA, (b) NI-NGMS, and (c) other analytical methods such as ICP-MS. Literature values are taken from Supplementary Material Tables S3–S5.
Minerals 14 00213 g004
Table 1. Description of GSJ geochemical reference materials analyzed in this study.
SampleRockApplied Method *
NameTypeINAARNAA
Igneous rock
JA-1Andesite
JB-2aBasalt
JB-3aBasalt
JF-2Feldspar
JG-3Granodiorite
JGb-1Gabbro
JH-1Hornblendite
JP-1Peridotite
JR-3Rhyolite
Sedimentary rock
JCp-1Coral
JCt-1Fossil shell
JDo-1Dolomite
JLs-1Limestone
Sediment
JLk-1Lake sediment
Soil
JSO-1Soil
* A circle denotes that the corresponding material was analyzed using the indicated analytical method.
Table 2. Cl, Br, and I abundances (in µg g−1) in GSJ geochemical reference materials analyzed by INAA in this study and from the literature.
SampleSourceMethodClBrI *
NameMass (mg)
JCp-170.7This work (individual)INAA620±202.86±0.125.93±0.50
66.9This work (individual)INAA629±233.12±0.315.23±0.51
This work (mean) **INAA (n = 2)625±82.99±0.235.58±0.62
Chai and Muramatsu [16]ICP-MS (n = 5) 3.25±0.075.5±0.2
Sekimoto et al. [22]RNAA6203.226.14
JSO-131.1This work (individual)INAA164±3595.0±2.321.0±4.2
25.9This work (individual)INAA184±495.6±2.324.3±2.8
This work (mean)INAA (n = 2)174±1895.3±0.522.7±2.9
Chai and Muramatsu [16]ICP-MS (n = 4) 98±226.9±0.2
JDo-172.9This work (individual)INAA40.5±4.30.572±0.068<1.7
Imai et al. [23]preferable value 0.79
Chai and Muramatsu [16]ICP-MS (n = 6) 0.53±0.020.71±0.06
Sekimoto and Ebihara [10]RNAA (n = 3)35.9±5.00.622±0.0510.789±0.039
JLk-126.1This work (individual)INAA<1208.29±1.7211.9±4.4
Imai et al. [23]preferable value 8.725
Chai and Muramatsu [16]ICP-MS (n = 4) 8.0±0.39.4±0.1
Sekimoto and Ebihara [10]RNAA (n = 3)59.1±1.87.82±0.539.05±0.62
JLs-184.5This work (individual)INAA14.2±2.50.167±0.008<0.62
Chai and Muramatsu [16]ICP-MS (n = 10) 0.068±0.0070.260±0.020
Sekimoto and Ebihara [10]RNAA (n = 3)16.4±1.40.105±0.0120.318±0.028
* Individual values with their associated combined uncertainties (see text for details). ** Mean values of duplicate results (unweighted means) with their associated uncertainties calculated as the standard deviation of the mean from the range of individual values. See text for details.
Table 3. Cl, Br, and I abundances (in µg g−1) in GSJ geochemical reference materials analyzed by RNAA.
SampleSourceMethodClBrI *
NameMass (mg)
JA-1231.0This work (individual)RNAA44.9±2.00.108±0.0040.0181±0.0041
316.9This work (individual)RNAA43.0±3.00.116±0.0050.0198±0.0050
This work (mean) **RNAA (n = 2)43.9±1.70.112±0.0070.0189±0.0015
Imai et al. [24]recommended value43.0
Imai et al. [24]preferable value 0.015
JB-2a323.2This work (individual)RNAA320±10.627±0.0040.0469±0.0100
279.5This work (individual)RNAA296±40.641±0.0070.0393±0.0087
This work (mean)RNAA (n = 2)308±210.634±0.0120.0431±0.0068
JB-2 Imai et al. [24]recommended value281
Imai et al. [24]preferable value 0.049
JB-3a356.8This work (individual)RNAA334±40.679±0.0370.0362±0.0077
278.2This work (individual)RNAA296±120.640±0.0080.0242±0.0053
This work (mean)RNAA (n = 2)315±340.659±0.0350.0302±0.0106
JB-3 Imai et al. [24]preferable value259 0.028
JF-2300.8This work (individual)RNAA32.8±0.50.108±0.0100.0398±0.0084
358.6This work (individual)RNAA36.3±1.20.106±0.0060.0424±0.0087
This work (mean)RNAA (n = 2)34.6±30.107±0.0020.0411±0.0023
JG-3293.0This work (individual)RNAA180±40.112±0.0030.0121±0.0028
298.4This work (individual)RNAA176±110.197±0.0150.0130±0.0035
This work (mean)RNAA (n = 2)178±30.154±0.0750.0125±0.0008
Imai et al. [24]preferable value156
JGb-1346.4This work (individual)RNAA1760±50 ††0.150±0.0150.197±0.041
332.8This work (individual)RNAA60.3±2.10.0601±0.00440.0985±0.0201
This work (mean)RNAA (n = 2)60.3±0.20.0601±0.00440.148±0.087
Imai et al. [24]preferable value81
JH-1302.9This work (individual)RNAA258±130.126±0.0070.0498±0.0144
318.3This work (individual)RNAA155±30.0832±0.00080.0237±0.0065
This work (mean)RNAA (n = 2)207±910.0832±0.00080.0368±0.0231
Imai et al. [25]compilation value 2.20
JP-1255.0This work (individual)RNAA77.2±2.90.279±0.0010.0929±0.0202
272.1This work (individual)RNAA93.0±0.70.272±0.0260.114±0.023
This work (mean)RNAA (n = 2)85.1±14.00.279±0.0010.104±0.019
Imai et al. [24]preferable value97
JR-3102.7This work (individual)RNAA127±20.469±0.0120.400±0.079
109.8This work (individual)RNAA150±160.565±0.0330.468±0.092
259.8This work (individual)RNAA122±30.459±0.0210.480±0.095
250.6This work (individual)RNAA140±50.537±0.0040.573±0.112
116.3This work (individual)RNAA120±20.478±0.0180.379±0.076
185.9This work (individual)RNAA128±30.486±0.0100.348±0.071
100.1This work (individual)RNAA111±130.423±0.0020.372±0.083
95.5This work (individual)RNAA150±70.542±0.0370.304±0.066
206.8This work (individual)RNAA129±80.520±0.0650.350±0.069
202.8This work (individual)RNAA143±80.564±0.0420.408±0.089
222.9This work (individual)RNAA202±70.618±0.0050.485±0.095
This work (mean) †RNAA (n = 11)138±240.515±0.0570.415±0.078
Imai et al. [25]compilation value 3
JCp-1119.5This work (individual)RNAA824±54.19±0.186.32±1.23
This work (mean) §INAA (n = 2)625±82.99±0.235.58±0.62
JCt-1316.8This work (individual)RNAA128±170.251±0.0040.0360±0.0079
330.7This work (individual)RNAA97.5±2.20.216±0.0120.0258±0.0054
This work (mean)RNAA (n = 2)113±270.233±0.0320.0309±0.0090
JSO-139.1This work (individual)RNAA162±598.8±4.723.4±4.5
This work (mean)INAA (n = 2)174±1895.3±0.522.7±2.9
* Individual values with their associated combined uncertainties (see text for details). ** Mean values of duplicate results (unweighted means) with their associated uncertainties calculated as the standard deviation of the mean from the range of individual values. † Mean values of replicate analyses with standard deviation (1 s). †† Analytical data shown in italics are considered doubtful due to the lower chemical yield. § INAA data are taken from Table 2.
Disclaimer/Publisher’s Note: The statements, opinions and data contained in all publications are solely those of the individual author(s) and contributor(s) and not of MDPI and/or the editor(s). MDPI and/or the editor(s) disclaim responsibility for any injury to people or property resulting from any ideas, methods, instructions or products referred to in the content.

