Article

The Long-Term Tectonism of the Longshou Shan in the Southwest Alxa Block—Constrained by (U-Th)/He Thermochronometric Data

1
Guangdong Provincial Key Laboratory of Geodynamics and Geohazards, School of Earth Sciences and Engineering, Sun Yat-sen University, Guangzhou 510275, China
2
Southern Marine Science and Engineering Guangdong Laboratory (Zhuhai), Zhuhai 519082, China
*
Author to whom correspondence should be addressed.
Minerals 2024, 14(2), 143; https://doi.org/10.3390/min14020143
Submission received: 14 December 2023 / Revised: 26 January 2024 / Accepted: 26 January 2024 / Published: 28 January 2024
(This article belongs to the Special Issue Thermal History Modeling of Low-Temperature Thermochronology)

Abstract

:
The Longshou Shan, located in western China, plays a crucial role in connecting the Tarim Continent with the North China Craton. It provides valuable insights into the Cenozoic intracontinental deformation, the complex dynamics of Eurasian tectonics, and the relationship between the pre-Cenozoic Tethys and Central Asian orogenic systems. Consequently, comprehending the evolution of the Phanerozoic era in this region holds immense significance. Zircon (U-Th)/He (ZHe) dating was conducted on three granite samples (n = 18) collected from the Longshou Shan. The ZHe dates of these granite rocks range from 7.2 to 517.7 Ma, showing a negative correlation with eU values. Furthermore, a limestone sample from the Longshou Shan yielded ZHe (n = 4) ages of 172.0–277.1 Ma and AHe (n = 4) ages of 17–111.9 Ma. The area has undergone complex tectonic processes involving multiple phases of uplift and burial. Using both forward and inverse modeling methods, we aim to establish plausible thermal histories. Our models reveal: (1) Late Paleozoic unroofing; (2) Early Mesozoic cooling and Late Mesozoic regional stabilization; and (3) Cenozoic reheating and subsequent cooling. By investigating the intricate thermal history of the Longshou Shan through multi-method modeling, we compare different approaches and assess the capabilities of single ZHe dating for understanding a thermal history. This research contributes to unraveling the region’s geological complexities and aids in evaluating various modeling methods.

1. Introduction

The area north of the Tarim continent and North China Craton is called the Central Asian orogenic belt, which evolved from the Late Paleozoic to the Early Mesozoic during the existence of the Paleo-Asian Ocean [1,2,3,4]. While it is established that the configuration of Eurasia is intricately tied to the Phanerozoic tectonic evolution of the Tethys and Central Asian orogenic belts, the precise spatiotemporal correlation remains ambiguous [5,6,7,8]. Critical unknown factors regarding the assembly and genetic relationships among these regions encompass the timing and context of the metamorphism of Precambrian basement rocks, the method and timing of Phanerozoic deformation, and the attributes of their Cenozoic tectonic activity [9]. The Longshou Shan area, positioned between the Qilian Orogen and the Alxa block, stands as one of the most enigmatic zones concerning the Phanerozoic evolution of the Tethys orogen and the Central Asian Orogen [10] (Figure 1).
The Longshou Shan area functions as an exceptionally important geological laboratory due to its intricate structural faults, the strata of varying ages encompassing the Precambrian advanced metamorphic rock series and the Phanerozoic, as well as the presence of multiple unconformities [14]. These indicators suggest that the crystalline basement surface of the Longshou Shan forms a complex erosion surface, likely recording the uplift of basement rocks due to multi-stage tectonic movements during East Asia’s Phanerozoic era [15]. However, ongoing research into the age and mechanism of geological structures from the Late Paleozoic to the Cenozoic in the Longshou Shan area remains insufficient. These unknown factors primarily revolve around the rock thermal history of Precambrian metamorphic rocks and Paleozoic granites exposed in the Longshou Shan area. Despite the presence of geochemical and geochronological data for the region, much of this information lacks a clear structural and stratigraphic background, hindering the establishment of a comprehensive structural model [16,17]. To bridge the gap caused by long-term deformation in the region’s dataset and to fill the time-temperature void in thermochronological data, we employed an integrated geological research approach, combining field rock structure observations with low-temperature thermochronology.
We hereby introduce the Zircon Helium (ZHe) and Apatite Helium (AHe) dates from the Longshou Shan. ZHe dates for each sample exhibit significant intrasample variability, enabling us to generate a series of forward and inverse thermal history models [18]. Utilizing the radiation damage accumulation and annealing model, our innovative thermal history models capture various cooling and reheating events that correlate with known geological occurrences. These models establish a vital link between different higher-temperature 40Ar/39Ar cooling ages and lower-temperature apatite (U-Th)/He datasets, enhancing our broader comprehension of the late Paleozoic-Cenozoic tectonic evolution of East Asia [19]. This is pivotal for evaluating Eurasia’s evolution and unraveling the movement and extent of the Cenozoic strain. Finally, we compare the long-term temperature history of rocks in this location using both inverse and forward models, pinpointing an enhanced application of the ZHe thermochronology approach.

2. Geological Setting

The Longshou Shan area spans approximately 30 km in width and 300 km in length, forming an ancient uplift trending northwestward. Situated on the southwest perimeter of the Alxa block, it closely aligns with the NWW trend and runs parallel to the Qilian Shan and Hexi Corridor (Figure 1 and Figure 2a). The northern section of the Longshou Shan is demarcated from the Mesozoic strata of the Alxa block by the Longshou Shan North Fault, characterized by a network of multi-branched faults (Figure 2a,b).

2.1. Regional Stratigraphy

The Longshou Shan showcases a distinctive geological composition featuring Proterozoic crystalline basement rocks, such as carbonate rock, limestone, schist, marble, and various other advanced metamorphic rocks [21] (Figure 2). Within the Longshou Shan Phanerozoic strata, multiple unconformities are observed, with regional unconformities being the principal ones [22] (Figure 3).
The Cambrian stratum, predominantly observed in the southeast of the Longshou Shan, overlays the proterozoic layer. Its formation is attributed to littoral-shallow marine siliciclastics [21]. Prevalent lithologies include quartz sandstone, gravel-bearing sandstone, and metamorphic sandstone. In the late Paleozoic period, granitic magma and medium-acidic magma intruded into the Proterozoic metamorphic basement and Cambrian light metamorphic sedimentary rocks (Figure 3). Upper Silurian to Devonian layers comprise conglomerate and argillaceous quartz sandstone. Amygdala basalt and andesite tuff are found sporadically throughout [23,24].
The Lower Carboniferous layers are predominantly constituted by the Xiuniugou Formation and Yanghugou Formation, which encompass marine to continental rocks [20]. The Upper Carboniferous Taiyuan Formation includes coal-bearing strata, primarily sandy shale, carbonaceous shale, and quartz sandstone with thin coal seams [21]. The Permian’s Dahuanggou Group, primarily composed of continental clastic sediments, contains purple and gray fine-grained sandstone intercalated with quartz sandstone, along with a thin layer of gravelly sandstone at its base (Figure 3).
The Triassic period predominantly comprises lavender gravelly coarse sandstone interspersed with sandstone lenses. The occurrence of sand ball formations is a distinctive characteristic of the higher sandstone layers [21]. Representing the lower and middle series, the Qingtujing Group predominantly displays gray-white, variegated conglomerate, and siltstone, occasionally exhibiting thin coal seams. The Lower Cretaceous lithology primarily consists of sandstone, silty mudstone intercalated with gravelly sandstone, and dark purple-red, purple-brown conglomerate (Figure 3).
The Cenozoic strata in the area have undergone significant development. The lower and middle Cenozoic strata are primarily composed of alluvial fan facies deposits along with fluvial and lacustrine facies deposits [20]. The Neogene Shulehe formation is mainly composed of silty clay and gravelly fine sandstone, which are unconformably overlaid on late Paleozoic granite (Figure 4a). In contrast, the late Cenozoic strata consist predominantly of alluvial and alluvial coarse clastic sediments, alongside continental aeolian sediments. Notably, most of these strata exhibit either negligible or very minimal cementation (Figure 3).

2.2. Tectonic Evolution

After the breakup of the Proterozoic Rodinia supercontinent, the Paleo-Qilian Ocean developed between the Paleo-Qaidam Block and the North China Craton, and the Longshou Shan experienced tectonic events such as the expansion of the Paleo-Qilian Ocean and the formation of passive continental margin [14,22]. This led to the subduction of the Paleo-Qilian Ocean in the early Neoproterozoic, the collision between the North China Craton and the Qaidam-Middle Qilian microblock, the re-continental splitting and the formation of the North Qilian Ocean [22]. Subsequently, in the late Neoproterozoic to Cambrian period, the Longshou Shan, situated at the southern margin of the Alxa Block, transformed into the passive continental margin of the North Qilian Ocean [25]. The subduction and closure of the northern Qilian Ocean during the Ordovician and Silurian periods led to the development of a significant magmatic arc in the Longshou Shan [26]. The early Paleozoic Qilian orogeny induced regional uplift and terrestrial clastic sedimentation in the Longshou Shan during the Silurian–Devonian period [27]. By the early Carboniferous, the elevated terrain linked to the Qilian orogeny subsided, and carbonate rocks were extensively deposited throughout the region [14]. Until the Late Carboniferous, the subduction of the middle segment of the Paleo-Asian Ocean at the northern margin of Alxa caused the activities of the Alxa Block, and the stratigraphic unconformity of the lower Carboniferous and upper Carboniferous-lower Permian was formed in the northern and southern margin (Longshou Shan) of Alxa [14,28]. Since the Mesozoic era, the Longshou Shan has wholly entered the phase of intracontinental tectonic evolution, with its average elevation above sea level. During the Yanshan Period of the Jurassic-Cretaceous era, significant geological movements occurred. These movements involved the westward subduction of the entire East Asian region by the Paleo-Pacific Ocean, northward subduction by the Middle Tethys Ocean, and southward subduction by the Mongol-Okhotsk Ocean [29,30,31,32,33,34,35,36,37]. These complex tectonic activities contributed to the shaping and transformation of the geological landscape in that period. Multi-stage extrusion and extension deformation occurred in the Longshou Shan region, yet the specific deformation mechanism remains contentious.
In the Cenozoic era, intraplate deformation, induced by the India-Eurasia collision, extensively developed in the Longshou Shan [15,17]. The Longshou Shan has experienced deformations related to Neoproterozoic, early Paleozoic, Mesozoic, and Cenozoic events. Major collision and suture events occurred in the southern or northern regions, leading to the development of two thrust faults on the north and south sides of the region, respectively, forming a reconstituted-style fault system (Figure 2a).

3. Materials & Methods

3.1. (U-Th)/He Thermochronology

This study introduces a helium diffusion model that accounts for a correlation between zircon (U-Th)/He (ZHe) dates and the accumulation and annealing of radiation damage within zircon crystals [38]. This relationship is often demonstrated by ZHe dates within a single sample that occasionally span hundreds of millions of years. For grains subjected to similar thermal histories, disparities in ZHe dates arise from differences in the effective uranium content (eU = U + 0.235Th) [39]. These differences manifest as either positive or negative ZHe date-eU relationships. The variations in these relationships are determined by the capacity of each grain to retain helium, which is reliant on eU values. Positive and negative trends observed in ZHe date-eU correlations represent the collective influence of the overall thermal history and the impact of radiation damage on helium diffusion. These trends enable the reconstruction of continuous thermal histories. According to helium diffusion models in zircon, there exists a temperature sensitivity window spanning approximately 210 to 50 °C [40]. This window partially overlaps with temperature ranges observed in zircon fission-track and K-feldspar 40Ar/39Ar data at the higher end, and with apatite fission-track and (U-Th)/He techniques at the lower end. The broad temperature sensitivity window in ZHe analysis facilitates the constraint of more comprehensive and continuous thermal histories. This presents an opportunity to bridge the gap between methods operating at higher and lower temperatures.
Our research employed diverse modeling methodologies to simulate the response of age-eU relationships concerning distinct thermal histories in the context of radiation damage accumulation, annealing, and helium diffusion [38]. Focused on the granitic basement rocks of the Longshou Shan area, this study prioritized grains with analogous Phanerozoic low-temperature thermal histories, ensuring ample representation for the most realistic t-T paths. Within this chapter, we concurrently employed forward and inverse modeling approaches to authenticate thermal history.
The objectives of forward and inverse thermal history modeling encompassed two primary facets: (a) evaluating the extent to which radiation damage effects account for observed age variations, (b) investigating the primary cooling times, heating durations, and reheating peak temperatures influencing observed ZHe-eU data variations, and (c) assessing the reliability of using ZHe exclusively in the simulations. For the first objective, we scrutinized the fundamental correlation between ZHe ages and eU concentrations while acknowledging that not all dispersion could be explained solely by damage-diffusion relationships [38]. In essence, the dataset reveals deviations beyond the primary ZHe-eU trend, potentially attributed to U and Th zoning effects, lacking conventional quantification methods but indirectly measurable via grain size. Consequently, three independent ZHe-eU curves (mean grain size ± 2 standard deviations) were utilized in the final inverse model to establish a domain validating the model’s accuracy [41,42] Simultaneously, we juxtaposed the relationship between ZHe-eU model outputs across all conditions with observed data to discern if the damage-diffusion relationship elucidates all observed age dispersions or if other factors (such as U, Th zoning) play a role [43]. Considering the 400 Ma timescale under consideration and the relatively confined nature of our t-T space, our initial use of the ZRDAAM forward model aimed to explore the spectrum of feasible t-T paths, identifying the most sensitive portions of observed ZHe-eU correlations within specific thermal history scenarios for potential modification [35]. In this context, our objective is not to seek the optimum-fit t-T path. Instead, subsequent inverse modeling was conducted to test multiple pathways and identify the best-fit solution, guided by our initial forward approach.
Since all samples exhibit a range of ZHe ages and eU values, the forward modeling approach was initially employed to constrain long-term thermal histories post-crystallization [44]. These simulations enabled the calculation of thermal geochronological ages via He diffusion and annealing kinetics along specified time-temperature paths. For each path, we manipulated the highest or lowest temperatures during various stages of the sample’s thermal evolution. Utilizing Matlab scripts [45], ZHe-eU curves were derived from each t-T path, integrating Guenthner et al.’s Zircon Radiation Damage Accumulation and Annealing Model (ZRDAAM). Inputs encompassed specific time-temperature paths, zircon eU values, and zircon grain sizes. Subsequently, these ZHe-eU paths were compared with ZHe ages, and the model’s ZHe-eU path closest to observed data was considered the most probable thermal history. Incremental adjustments to the model ZHe-eU paths for each sample were made by refining different segments of the thermal history, culminating in best-fit models closely resembling observed data obtained through this methodology. This approach assumes that helium diffusion associated with crystal damage and annealing is the sole controlling factor for ZHe ages [46].
Furthermore, we employed inverse simulations to further refine potential thermal histories. While forward simulations assessed numerous potential paths, inverse simulation methods allowed the exploration of tens of thousands of potential paths within a defined margin of error to match observed He ages. Two distinct inverse simulation softwares were employed: HeFTy (version 1.9.3) and QTQt (version 5.8.0) [47,48]. HeFTy was utilized to evaluate the consistency between ZHe and other available thermal history constraints such as K-feldspar 40Ar/39Ar data, AHe data, and relative age constraints from Phanerozoic strata deposition [47]. Diverse assumed time-temperature paths were scrutinized based on known geological conditions, encompassing the formation of various unconformities, Paleozoic and Mesozoic sedimentation periods, and potential exhumation during deformation events on the northeastern margin of the Qinghai-Tibet Plateau. With limited geological constraints, QTQt was exclusively applied to utilize ZHe data (LSS-1/LSS-4/LSS-6) to explore critical t-T domains. QTQt computational simulation software provided ample flexibility to explore the most probable thermal history [48]. Moreover, we conducted QTQt inverse simulations utilizing ZHe and AHe data from LSN-10.

3.2. Sampling Strategy

We gathered three geochronological samples (LSS-1, LSS-4, LSS-6) from exposures of Paleozoic granite situated along the southern boundary of the Longshou Shan, with a minor altitude variation ranging from 2289 to 2543 m (Table 1) (Figure 4a–c). These samples are relatively close in horizontal distance, approximately 4 km apart, suggesting analogous thermal histories post-granite formation (Figure 5). Additionally, at the highest altitude within the eastern Longshou Shan section, we collected one Precambrian crystalline basement limestone sample (LSN-10). We applied apatite (U-Th)/He and zircon (U-Th)/He dating methods to the LSN-10 samples. However, exclusively zircon (U-Th)/He dating was conducted for the LSS-1, LSS-4, and LSS-6 samples. Nonetheless, a substantial number of grains underwent testing utilizing zircon’s radioactive damage and annealing accumulation models to evaluate the thermal history experienced by the granite along the Longshou Shan’s southern boundary. The sample collection sites were situated at least 1 km away from any Late Paleozoic intrusion and at least 500 m from any mapped dykes, to avoid heat resetting unrelated to burial and excavation processes.

3.3. Experimental Analysis Process

The National Institute for Natural Hazards Control’s U-Th/He laboratory performed the AHe and ZHe testing for this investigation. The heavy minerals were separated for the screening of the paramagnetic minerals apatite and zircon using conventional water level, magnetic, and density separation techniques. Apatite and Zircon grains with good crystallinity, no inclusions, no fissures, and grain lengths greater than 70 μm were first selected under a microscope, and then the size of each mineral grain was measured (Figure 6). The measured apatite and zircon grains were placed in Pt and Nb metal packages, respectively, and the samples were heated with a 970 nm laser to extract 4He. The 4He isotopes were determined via Alphachron quadrupole mass spectrometry, and the measured He samples were then used to determine the U and Th isotope contents using the 235U-230Th isotope dilution method on an Agilent 7900 ICP–MS [49,50].
Apatite and Zircon require different chemical processes for measuring their U and Th isotope contents. Apatite needs to be dissolved in a solution with diluent and 50% HNO3 for 12 h. Zircon, on the other hand, is more difficult to dissolve and requires that the zircon sample after 4He measurement be heated at 225 °C for 48 h in a high-pressure dissolution tank with diluent and HF solution, evaporated, and then heated for another 24 h at 200 °C with HCl solution to dissolve the fluoride. Finally, the solution is acid diluted to 10% for ICP–MS analysis.

4. Results

This chapter presents the ages of 18 ZHe grains extracted from the granite located at the southern boundary of the Longshou Shan (LSS-1/LSS-4/LSS-6) (Table 2). Figure 7a illustrates a graph depicting the ZHe ages of these grains plotted against effective uranium concentration (eU). The corrected age spectrum of these grains falls between 7.2 and 517.7 Ma, while the eU concentration spans from 77.62 to 1872.18 ppm. Notably, the dispersion observed in zircon helium data significantly surpasses the analytical precision and does not display a discernible correlation between age and eU. Given that variations in eU concentration in zircon crystals with identical time-temperature (t-T) histories correlate with discrepancies in radiation damage, leading to a spectrum of crystal-specific helium diffusion coefficients due to damage-diffusion coefficient relationships [38], the eU value can reflect the influence of radiation damage on Helium ages. However, solely correlating with eU concentration is occasionally inadequate in explaining the observed dispersion. Consequently, we segmented the samples into multiple groups to analyze the age-eU correlations for each group of grains.
At lower eU contents, approximately <200 ppm, ZHe ages correspondingly range from 7.2 to 70.8 Ma. Within the eU range of 200–1000 ppm, a notable negative correlation between ZHe ages and eU is apparent, spanning ages between 170.3 and 517.7 Ma. When eU concentrations exceed 1000 ppm, a declining trend in ages is observed, ranging from 35.7 Ma to 171.6 Ma. Most of the tested zircon grains fall within the grain size range of 35–60 μm, displaying no significant age trend concerning grain size (Figure 7b). Among the tested ZHe grains, maximum ages of 516.2 and 517.7 Ma were recorded, significantly surpassing the estimated age of the granite at 427.2 Ma.
The ZHe ages (172.0–277.1 Ma) of the limestone sample LSN-10 exhibit a negative correlation with eU (Figure 7a), indicating that this sample also underwent repeated reheating [38]. The “closure temperature” theory suggests that larger grain sizes tend to preserve older ages under situations of stagnation or repeated reheating [51]. Figure 7b confirms the historical evidence of reheating or stagnation for LSN-10, rather than merely quick monotone cooling, by showing a substantial positive correlation among the four grains of LSN-10. Additionally, the ages of five AHe grains in sample LSN-10 range between 17.0 and 111.9 Ma (Table 2).
Table 2. Dating results of AHe and ZHe grains in the Longshou Shan.
SampleGrainUThHe[eU]RawRsFTCorrectedError
AgeAge
ID ppmppmppmppmMaμm Ma±1σ
LSS-1LSS-1-1-1Z1265.88 2579.98 3.12 1872.18 76.74 47.74 0.73 105.6 1.7
LSS-1-1-2Z1062.81 2204.97 0.90 1580.98 26.39 50.48 0.74 35.7 0.5
LSS-1-1-3Z47.61 127.70 0.01 77.62 5.21 47.59 0.72 7.2 0.1
LSS-1-1-4Z164.17 297.42 1.23 234.06 238.97 49.73 0.74 324.0 9.0
LSS-1-1-5Z818.09 1772.42 1.08 1234.61 40.48 50.61 0.74 54.7 0.8
LSS-1-1-6Z579.85 764.83 2.07 759.58 124.96 48.48 0.73 170.3 2.6
LSS-1-1-7Z143.69 247.72 0.23 201.90 53.34 53.02 0.75 70.8 1.0
LSS-1-1-8Z356.33 304.49 2.26 427.88 239.97 46.14 0.72 331.1 5.0
LSS-1-1-9Z316.23229.033.02370.1367.143.580.71516.218.3
LSS-1-1-10Z589.11469.315.80699.4372.845.230.72517.720.5
LSS-4LSS-4-1-1Z300.75 718.75 1.85 469.65 179.77 56.83 0.77 234.5 3.5
LSS-4-1-2Z644.89 1368.46 3.40 966.48 160.71 54.14 0.76 212.4 3.4
LSS-4-1-3Z524.65 521.62 2.72 647.23 191.81 53.54 0.76 252.7 4.3
LSS-4-1-4Z601.33 1109.00 2.84 861.95 150.77 50.76 0.74 203.1 3.2
LSS-6LSS-6-1-1Z530.56 215.07 2.58 581.10 202.56 41.67 0.70 287.8 6.6
LSS-6-1-2Z302.50 116.01 1.34 329.76 185.63 42.00 0.71 262.8 6.0
LSS-6-1-3Z740.40 576.62 3.21 875.91 167.65 37.47 0.67 251.0 5.3
LSS-6-1-4Z1440.37 1147.39 4.41 1710.01 118.23 40.28 0.69 171.6 3.7
LSN-10LSN-10-1-1A0.28 2.14 0.00 0.78 21.71 56.07 0.65 33.3 4.1
LSN-10-1-3A0.15 14.79 0.00 3.63 7.93 37.91 0.47 17.0 1.6
LSN-10-1-4A1.35 8.35 0.00 3.32 65.63 46.88 0.59 111.9 7.5
LSN-10-1-5A9.98 16.99 0.00 13.97 12.30 45.35 0.59 20.9 1.3
LSN-10-1-6A12.49 24.57 0.01 18.26 26.92 35.47 0.47 57.0 3.7
LSN-10-1-1Z321.14 768.56 1.22 501.75 111.37 36.31 0.65 172.0 2.5
LSN-10-1-2Z350.97 794.55 1.54 537.69 131.58 38.82 0.67 196.8 2.9
LSN-10-1-3Z150.21 257.11 0.89 210.63 192.61 46.94 0.72 266.2 4.1
LSN-10-1-4Z67.00 91.53 0.36 88.51 185.79 38.50 0.67 277.1 5.0
The grains are numbered “A” for apatite and “Z” for zircon. The equivalent radius Rs is equal to the radius of a sphere with the same ratio of surface area to volume as that of a crystal cylinder [52]. FT is the α-ejection correction parameter [53]. Effective uranium content [eU] = [U] + 0.235 × [Th] [54].

5. Thermal History Modeling

5.1. Forward Modeling Approach

Constructing hypothetical time-temperature paths for the chronology samples within specific time periods serves two primary purposes. Firstly, employing forward simulations within a broader time-temperature range allows for the exclusion of thermal histories conflicting with observed ages (LSS-1/LSS-4/LSS-6) and initiates the refinement of potential thermal histories. Secondly, utilizing forward modeling aids in identifying the periods of burial or uplift within the path that exert the most significant influence on the final ZHe-eU model, distinguishing them from events with comparatively minor impact [38]. In essence, the setup of forward modeling investigates the sensitivity (or lack thereof) of the ZHe-eU correlation to various Phanerozoic thermal environments [44].
Key time-temperature constraints for specific tests encompass chronological evidence such as zircon U-Pb age (427 Ma, 750 °C) [55]; K-feldspar 40Ar/39Ar age (410 Ma, 250 °C) [20]; regional unconformities between Paleogene-Neogene strata and Paleozoic granite (65 Ma, 15 °C); heating subsequent to the deposition of Paleogene-Neogene strata (20 Ma, 160 °C) [17,56]; and the current surface temperature (15 °C). We have formulated seven sets of representative time-temperature paths for the Longshou Shan, each encapsulating a distinct piece of thermal history.

5.1.1. Model Design

The initial set of representative paths delves into the continuous cooling process endured by Paleozoic magmatic rocks since their formation, traversing from high temperatures (750 °C) to lower temperatures (15 °C) through individual and combined tests. This exploration indirectly evaluates the reliability of the cited zircon U-Pb age and K-feldspar 40Ar/39Ar age (Figure 8a). Undoubtedly, preserving a 400+ Ma span of temperature alteration represents an oversimplified model. However, this approach serves to effectively distinguish between various cooling scenarios, aiding in determining whether there exists a predominant period of early Paleozoic cooling that most aptly elucidates the data.
To examine the Paleozoic-Mesozoic cooling combination, we investigated a two-step monotonic cooling process. The second set of representative paths involves altering the erosion timing of the Paleozoic-Mesozoic rock mass before the Cenozoic deposits. This assessment evaluates whether a two-step monotonic temperature decline occurred since the known age of K-feldspar 40Ar/39Ar at 410 Ma and 250 °C (Figure 8b). Building upon the second set, the third group of representative paths aims to further refine the occurrence time of monotonic cooling in the second step (Figure 8c).
Given the regional stratigraphic deposition and angular unconformity observed in the Longshou Shan during the Late Paleozoic to Mesozoic, we investigate the plausibility of a sequence of events, such as reheating followed by subsequent cooling over a brief period after the granite sample experienced secondary monotonic cooling (Figure 3). The fourth set of representative paths examines the reheating of the formation of post-secondary monotonic cooling (Figure 8d). Meanwhile, the fifth set compares the cessation time of the formation reheating with the initiation of cooling (Figure 9a). Similarly, we explore the prospect of inter-Mesozoic reheating (Figure 9b), necessitating the establishment of an intermediate maximum heating temperature between 30 °C and 210 °C, with an increment of 45 °C per path. All of the aforementioned investigations (two-step cooling and reheating scenarios) are assumed for the Paleozoic-Mesozoic thermal history of the region.
In the Cenozoic phase of the t-T path, we simulated maximum reheating and cooling at 20 Ma to ascertain the highest heating temperature during the late Neogene (Figure 4a). Each path incrementally sets a temperature range between 70 °C and 220 °C, increasing by 30 °C per path (subsequent sections will discuss the consistency of these increments with previous estimates of maximum Neogene reheating) (Figure 9c). Our focus will center on the analysis and comparison of results derived from each test path in subsequent sections.

5.1.2. The Results of Forward Modeling

Figure 8a displays cooling trends ranging from high (750 °C) to low (15 °C) temperatures at three different periods, 427–406 Ma, 427–65 Ma, and 86–65 Ma (with identical Cenozoic history), aiming to assess the impact of initial cooling on the thermal history. Following varying ranges of thermal history input, it is evident that Paleozoic cooling paths exert primary effects on the resultant ZHe-eU curve.
The maximum age and slope of the ZHe-eU curve simulated with forward modeling exhibit fluctuations based on the timing of granite cooling: earlier cooling periods position the maximum ZHe age within the medium eU range (200–400 ppm). Conversely, later cooling of granite significantly reduces the maximum apparent age on the ZHe-eU model curve, resulting in lower eU concentrations (<500 ppm) showing the narrowest age range (<40 Ma). Notably, the most congruent with the observed data is the monotonic cooling of granite within the 427–406 Ma timeframe. While identifying the definitive best-fit curve remains inconclusive, the model results encompass observations for a majority of the samples. From these comprehensive analyses, several general conclusions regarding the Paleozoic cooling period within the dataset can be drawn: the magmatic rocks in the southern region of the Longshou Shan underwent a relatively rapid cooling and crystallization process when they intruded near the surface during the Paleozoic. This result aligns strongly with stratigraphic observation, zircon U-Pb age, and K-feldspar 40Ar/39Ar age.
The simplified two-stage cooling tests, spanning from the Paleozoic to the Mesozoic, utilized initial cooling from 427 Ma at 750 °C to 410 Ma at 250 °C, followed by uncertain secondary cooling periods of 410–406 Ma, 410–65 Ma, and 86–65 Ma (Figure 8b). The age of the second cooling period indeed influences the date corresponding to the oldest segment of the ZHe-eU curve. However, certain aspects such as the maximum age position of the curve, the segment displaying high eU concentrations with younger ages, and the general curve shape remain unaltered. In the zircon helium partial retention zone, an extended Paleozoic-Mesozoic duration has thermally reset the grains with the lowest eU concentration (thus possessing the lowest degree of damage). However, this duration is insufficient to anneal the zircon grains with high levels of radiation damage. Consequently, this disparity in annealing leads to changes in the morphology of the ZHe-eU curve. The resultant model output from the cooling event between 410 and 65 Ma encompasses nearly all of the observed relationships among the ZHe-eU grains in the southern region of the Longshou Shan (Figure 8b). This suggests the likelihood of a secondary Paleozoic-Mesozoic cooling phase in the area. To ascertain the specific timing of this cooling phase, secondary cooling was configured within periods of 321–310 Ma, 256–245 Ma, 166–155 Ma, and 126–115 Ma (Figure 8c), with the post-115 Ma segments of these paths remaining consistent. Among the four proposed cooling hypotheses, a majority of the ages predicted by rapid cooling from 321 to 310 Ma closely align with the observed ages. This outcome strongly supports the occurrence of a second rapid cooling phase around 321–310 Ma, succeeded by an extended period of surface stabilization.
Maximum heating time points of 250 Ma, 170 Ma, 110 Ma, and 70 Ma were established to explore late Paleozoic to Mesozoic sedimentary burial events. These paths, constrained by Paleozoic burial temperature limits of 200 °C, are depicted in Figure 8d. The resulting ZHe-eU curve exhibits variability within the eU range of 200–1000 ppm. However, interestingly, at eU concentrations < 200 ppm and >1600 ppm, the projected ages for all paths significantly coincide. Among these paths, the curves indicating no heating and the maximum heating at the 250 Ma time point more accurately represent the observed age data within the 200–1000 ppm eU range. Conversely, the ZHe-eU curve resulting from the maximum heating occurring after 250 Ma generates a relatively flat prediction curve. To further discern the possibility of a rapid initial-stage cooling subsequent to burial heating, cooling periods of 255–250 Ma, 170–165 Ma, and 110–105 Ma were considered. In determining the specific timing of these three cooling periods, the ZHe-eU curve simulated by the 255–250 Ma cooling, as depicted in Figure 9a, closely resembles the maximum heating curve produced at 250 Ma in Figure 8d. Notably, these curves do not exhibit significant deviations from the observed ZHe-eU relationship, implying that earlier burial and subsequent cooling phases align more closely with the observed data.
In the investigation of heating events ranging from 250 to 65 Ma at the Longshou Shan, we incorporated various thermal history curves from 140 Ma at temperatures between 30 °C and 200 °C. Figure 9b illustrates the comparison between the modeling output data and the measured data. Our exploration of Mesozoic reheating scenarios revealed minimal discrepancy in the ZHe-eU curves when compared to an extended residence in the upper crust. The simulated ZHe-eU curves, for the most part, exhibit a consistent shape, slope, and high eU age across the various paths, except for the path subjected to heating at 200 °C. In essence, these paths predominantly indicate redeposition or reheating to a maximum temperature of merely 140 °C. As a result, we deduce that the primary factor influencing the ZHe-eU curve is more closely associated with the Paleozoic tectonic history rather than the large-scale reheating events occurring in the Mesozoic. This conclusion will be further scrutinized and investigated through inversion simulations in subsequent analyses.
A forward model exploring the maximum temperature range during Cenozoic reheating (ranging from 220 °C to 70 °C over 20 Ma) exhibits the broadest distribution of ZHe-eU among all tested hypotheses (as depicted in Figure 9c). The modeling ZHe-eU curve, with each 30 °C increment in temperature, displays significantly distinct maximum ages and demonstrates a negative correlation concerning positions in the eU space. Decreasing the reheating temperature leads the produced ZHe-eU curve to shift towards higher eU values, subsequently increasing both the age of grains with large eU values and the maximum age within the curve. This variance arises because the most recent phase of heating tends to reset the age of the high eU grains, contingent upon the maximum temperature of heating during that period. While the observed data of high eU concentrations exhibit scattered patterns, no single curve can encompass all of the high eU data points. However, in terms of overall age performance, encompassing both low and high eU concentrations, the ZHe-eU curve is able to reproduce the observed data trends. These results indicate that the eU curve produced by reheating to 160 °C closely aligns with the observed data from the Longshou Shan (as depicted in Figure 9c). Conversely, reheating to temperatures above 190 °C yields a flat ZHe-eU curve that fails to capture these observed ages.
The preliminary forward modeling studies conducted above have yielded a singular t-T (time-temperature) path that roughly aligns with the observed ZHe-eU data. These outcomes strongly suggest that radiation-induced damage and annealing effects on helium diffusion through the lattice serve as the primary controlling factors influencing the observed age of ZHe. Other potential factors influencing ZHe age, such as crystal size, U and Th zonation within the zircon crystal, and helium intrusion into neighboring grains, appear to exert only a limited influence. The exploration through forward modeling of different time-temperature paths has revealed several key insights: (a) A two-stage cooling curve during the Paleozoic in the Longshou Shan exhibits greater consistency with the measured data compared to a single-stage cooling scenario. These model results support the interpretation that the basement rock samples underwent deposition, burial by late Paleozoic strata, and subsequent erosion. (b) The Late Paleozoic to Early Mesozoic likely experienced reheating and rapid cooling phases, indicating complex thermal events during this period. (c) The model results suggest that the maximum reheating temperature of the Longshou Shan samples during the Mesozoic reached only 140 °C. This finding implies that these samples might not have undergone burial and reheating processes significant enough to reset all grain ages at a later stage. This limitation in the models underscores the challenge in providing a comprehensive assessment of the specific temporal thermal evolution of the region. (d) Cenozoic reheating temperatures in the Longshou Shan, as per the model results, range from 130 °C to 190 °C, showcasing a varied thermal environment during this period. In summary, these forward modeling analyses provide valuable insights into the thermal history of the Longshou Shan region, emphasizing the complexities and intricacies of its geological evolution, especially concerning cooling, reheating, and the varying temperatures experienced throughout different geological epochs.

5.2. Inverse Models

The forward modeling method previously employed has successfully identified a potential t-T (time-temperature) path that aligns with the observed ZHe-eU curve. In this section, an inversion simulation method is adopted to further refine the thermal history of the region. The primary objectives of this thermal history inversion method encompass several key goals: (1) Refinement and Exploration: The continuation of refining the thermal history while exploring additional possible t-T paths that might not have been considered during the forward modeling analysis. (2) Consistency Testing: Testing the consistency of ZHe data with other dating methods such as U-Pb, 40Ar/39Ar, and AHe data to ensure congruence among multiple dating techniques. (3) The Assessment of ZHe Data’s Sole Ability: Evaluating the capability of ZHe data independently in exploring the time-temperature thermal history, employing various inversion simulation methods. To achieve these objectives, two distinct computer inversion simulation programs, namely HeFTy and QTQt, have been utilized [47,48,57]. These simulation programs serve as tools to explore, validate, and refine the proposed thermal history models, offering a comprehensive assessment of the geological evolution of the Longshou Shan.

5.2.1. HeFTy Inverse Models

The HeFTy program is employed for t-T (temperature-time) path inversion, requiring the specification of temperature-time parameters like start time, end time, and associated temperatures. Input data include the concentrations of U, Th, and Sm, grain radius, measurement age, and age uncertainty. HeFTy utilizes Monte Carlo simulations with an algorithm akin to ZRDAAM, employing the degree of fit (GOF) statistics to identify the most fitting path among 100,000 explored paths. An “acceptable” path is characterized by a degree of fit parameter of 0.05, while a “good” path possesses a degree of fit parameter exceeding 0.5.
The damage model within the HeFTy inversion method serves to assess the quantified dispersion of the damage-diffusion relationship. Prior research efforts simulated ZHe and AHe data using a synthetic grain method to account for second-order dispersion, categorizing age based on eU concentration and using an average of age (with a 15% error margin), eU concentration, and grain size [58]. Given the substantial age disparity between eU segments and the limited available data for input in HeFTy, all granite samples from the southern boundary of the Longshou Shan (specifically ZHe input from LSS-1/LSS-4/LSS-6, sharing similar thermal histories post-magmatic rock formation) were combined. These grains were categorized into three eU intervals: 0–500 ppm, 500–1000 ppm, and 1000–2000 ppm (Table 3). For AHe input, the simulation utilized a previously published sample, LS8, with a comparable elevation and matching lithology to the eastern sample, indicating an age of 7.0 ± 1.04 Ma [17].
In configuring HeFTy, further specification of constraint box s is necessary to simulate the t-T path randomly. Similar to the constraint box utilized in forward modeling applications, the absolute ages of the constraint box are derived from other studies on chronology. These constraint boxes are established based on various geological contexts: (1) zircon U-Pb (427 ± 10 Ma, 750 ± 50 °C) and K-feldspar 40Ar/39Ar (410 ± 10 Ma, 250 ± 100 °C) chronologies; (2) regional unconformities between the granites and Paleogene-Neogene strata indicating near-surface presence at the onset of the early Cenozoic, with constraint box at 65 ± 10 Ma, 40 ± 20 °C; (3) Post-Paleogene-Neogene stratigraphic deposition, burial, and subsequent heating intervals set at 42 ± 18 Ma, 135 ± 55 °C, and 16 ± 4 Ma, 135 ± 55 °C, respectively; and (4) stratigraphic unconformities observed in the Longshou Shan spanning between 400 and 80 Ma (Figure 10a). The setting of constraint boxes based on unconformities is speculative, considering these unconformities might be caused by deposition, heating, or cooling denudation from the formation. Hence, during the setting process, wide temperature intervals and minor temperature changes in adjacent constraint boxes were employed to enhance the tolerance of the constraint box placement. Moreover, during the inversion process calculation, the validity of the constraint box can automatically be verified. Properly set constraint boxes enhance the utility of measured He data, generating more plausible time-temperature paths (Figure 10a, 400–250 Ma). Conversely, if the constraint boxes are too unreasonable, their effects can be observed in the output. However, the relative placement of these temperature constraint boxes does not significantly impact the inversion output’s t-T path. Ultimately, the measured input age data and the actual thermal history experienced by the measured grains profoundly affect the output path, while the relative placement of these constraint boxes has minimal impact [40].
Figure 10b displays the outcomes of the HeFTy inversion modeling. Despite setting 15 constraint boxes and inputting 3 ZHe data and 1 AHe data, the modeling generated a substantial number of acceptable and good paths (1238 acceptable paths and 174 good paths) from 100,000 operational iterations. This signifies the generation of numerous paths despite the constraints applied during the inversion process. The forward modeling results of the best paths aligned well with both the input synthetic grains and the original grains, highlighting a high degree of consistency [41,42]. This further confirms the compatibility of the measured primary data results in this chapter with the defined constraint box. The good and best paths derived from the inversion modeling suggest a thermal history characterized by specific temperature changes at distinct time intervals: (1) Rapid cooling of the 427 Ma granite to the K-feldspar 40Ar/39Ar sealing temperature, then cooling to 100 °C by 400 Ma, weak heating to 140 °C at 400–330 Ma, and subsequent cooling to 40 °C at 300 Ma. (2) Significant temperature fluctuations observed at 260–240 Ma with initial cooling from 130 °C to 50 °C followed by rapid heating to 150 °C at 240 Ma. These substantial temperature changes in a short period may be attributed to local intrusions or hydrothermal activity rather than formation deposition. (3) A period from 240 to 80 Ma where the granite samples maintained an approximate temperature of around 130 °C without significant fluctuations despite multiple periods of assumed cooling during inversion. (4) A cooling from 120 °C to about 50 °C at 80–65 Ma. (5) The reheating of the Longshou Shan to 140 °C around 40–20 Ma, followed by rapid cooling to 20 °C at 7–5 Ma. These findings are consistent with previous AFT (apatite fission track) thermal history models [15].

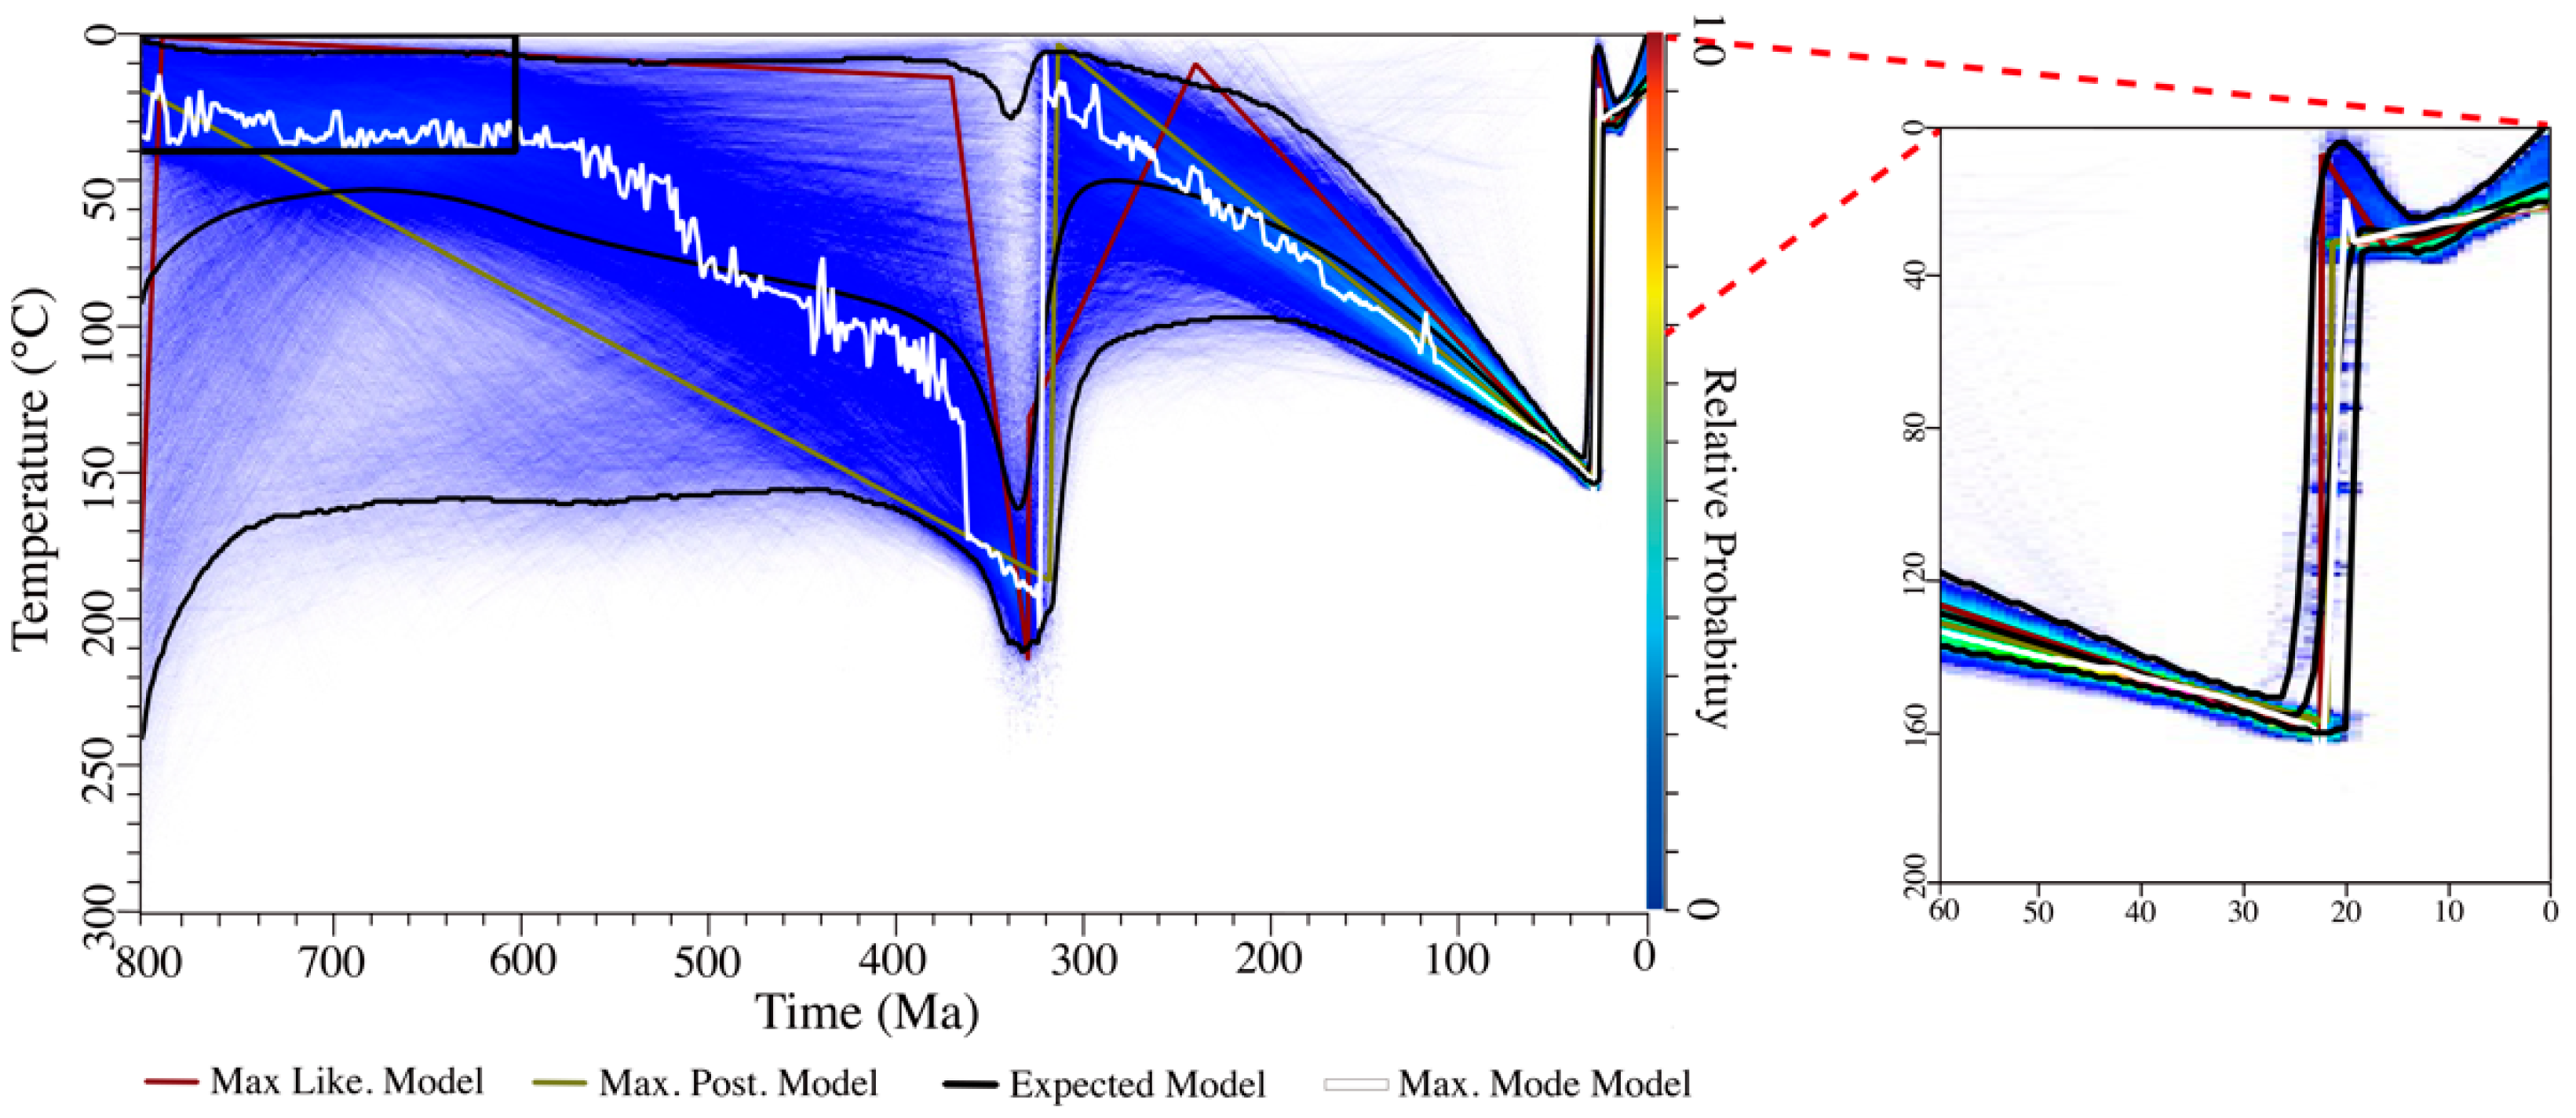
5.2.2. QTQt Inverse Models

The HeFTy inversion modeling employed multiple constraint boxes to validate ZHe data against various geological and thermochronological constraints in the Longshou Shan, outlining the probable time-temperature path experienced. Conversely, our utilization of QTQt focused on examining the sensitivity of ZHe data and the corresponding time-temperature path, utilizing a single constraint box based on the U-Pb age of the granite substrate sample (427 ± 10 Ma, 750 ± 50 °C) (Figure 11). In this analysis, we solely incorporated individual grain data (LSS-1/LSS-4/LSS-6), inputting original grain age and error, U and Th content, and three-dimensional grain data (length, width, and thickness). Employing the He kinetic model, based on ZRDAAM model, generated a probabilistic time-temperature path [38]. Similarly, within this section, we conducted QTQt inversion for the Sinian advanced metamorphic rock LSN-10, establishing the constraint box as the initial depositional age of the original rock (700 ± 100 Ma, 20 ± 20 °C) (Figure 12). The data input consisted of individual ZHe and AHe data for each grain, involving original age and error, U and Th content, and three-dimensional grain size data (length, width, and thickness). To analyze apatite and zircon, distinct He kinetic models were applied—the RDAAM model for apatite and the ZRDAAM model for zircon [38,54]. This model underwent 800,000 iterations. Due to the absence of a comprehensive set of constraint boxes, it is anticipated that the t-T paths generated by QTQt might represent regions within t-T space that conflict with other geological or thermochronological constraints. Therefore, our primary objective is to assess QTQt results by evaluating the sensitivity of ZHe data to the most plausible thermal experiences. We aim to pinpoint the key t-T segments that exert the most influence on the ZHe-eU curve.
The QTQt modeling reveals the thermal history of the granite (LSS-1/LSS-4/LSS-6). It illustrates several significant periods within the t-T paths (Figure 11): (1) Approximately 427–300 Ma: The paths show a wide distribution and an extensive temperature range (800–200 °C). This suggests a lack of sensitivity in the ZHe data to distinguish high-temperature cooling processes in the granite during this period. (2) 300–200 Ma: The granite gradually cools, with temperatures gradually concentrating at 200–60 °C. Around 300 Ma, there is a convergence to an unroofing temperature consistent with 200 °C. (3) 180–170 Ma: Rapid cooling occurs during this period, within a temperature range of about 100 °C. (4) 170–60 Ma: Importantly, the t-T path refocuses to temperatures between 120 and 40 °C during this period, suggesting a constant temperature or mild heating phase. (5) 60–30 Ma: There is evidence of Cenozoic reheating to around 160 °C, consistent with burial conditions corresponding to the largest known Paleogene-Neogene strata. However, there is also rapid cooling observed at around 3–2 Ma. These findings highlight different phases of cooling and reheating within the granite’s history, revealing specific temperature ranges and key periods of thermal evolution over millions of years.
The thermal history simulation of the Sinian metamorphic rocks (LSN-10) using QTQt provides insights into its evolution over different timeframes (Figure 12): (1) 800–400 Ma: The paths show a broad distribution and a wide temperature range of about 170–20 °C, indicating a lack of convergence and temperature consistency during this period. (2) 600–330 Ma: A gradual heating process is observed, increasing from 40 °C to 200 °C. This suggests a potential metamorphic age for the Sinian Hanmushan Group rocks between 500 and 330 Ma. (3) 330–300 Ma: There is evidence of a first-stage cooling with temperatures decreasing from 120 to 40 °C. (4) 300–25 Ma: Reheating from 20 °C to about 160 °C occurs, with the main heating phase around <150 Ma. Additionally, at 25–20 Ma, the maximum reheating temperature matches the maximum burial temperature of the Paleogene-Neogene strata. (5) <23 Ma: The modeling reveals two phases of cooling: 23–17 Ma and <12 Ma. The former shows a temperature change from about 160 to 40 °C, while the latter indicates a change from 40 to 15 °C. These results illustrate the complex thermal history of the Sinian metamorphic rocks, indicating multiple heating and cooling phases over millions of years, providing insights into their evolution and environmental conditions during different geological periods.

6. Discussion

6.1. A Comparison of Thermal History Modeling Results

The comparison between the QTQt models for granites (LSS-1/LSS-4/LSS-6) and metamorphic rocks (LSN-10) highlights significant differences in their early thermal histories due to differing protoliths. (1) Early History (before 300 Ma): The granite underwent rapid cooling between 427 and 300 Ma, while the metamorphic rock experienced sedimentary metamorphism between 700 and 300 Ma. (2) Later Consistent History (after 300 Ma): Between 320 and 280 Ma, there was a short period of rapid cooling for both, reaching temperatures below 200 °C by around 300 Ma. Between 30 and 20 Ma, a period of reheating transpired, followed by a cooling phase post-20 Ma. Despite different constraint boxes used in the QTQt models, the convergence of thermal histories after 300 Ma between these two types of rocks underscores the reliability and confidence in the QTQt models. This similarity in thermal histories despite different lithologies further reinforces the robustness of the models.
The comparison between HeFTy and QTQt models in analyzing ZHe data highlights the necessity of combining multiple geological and thermochronological observations for a comprehensive understanding of thermal history. Here are the key points from the comparison. When additional geological constraints like U-Pb and 40Ar/39Ar analyses are considered, the data derived from HeFTy models show greater concentration and most of the resulting t-T paths are reasonable. The QTQt path in the range of 427~300 Ma has a certain range of variation for rapid cooling after granite formation. The outcomes derived from both models, as illustrated in Figure 10 and Figure 12, underscore the ZHe data’s sensitivity to diverse thermal events occurring during the initial phases. The trajectory of cooling revealed by ZHe data is influenced by the input used for analysis. HeFTy suggests a cooling path around 250 Ma, while QTQt indicates a rapid cooling period around 180 Ma. The difference in inferred cooling periods arises from the distribution of grains with eU concentrations (200–1000 ppm) and their apparent ages (170–330 Ma). HeFTy’s cooling to 250 Ma is due to the corrected age of 262.7 Ma derived from synthetic grains, while QTQt places greater emphasis on younger grains in its calculations, leading to the inference of cooling around 180 Ma [59]. HeFTy and QTQt models diverge in their predictions for later heating and cooling events.
It appears that both the forward modeling and inversion paths (HeFTy and QTQt) in the Longshou Shan demonstrate similarities despite the complexities considered in the sample’s thermal history. The modeling paths share common features: (1) Near Surface Conditions: Around 300 Ma, the samples were positioned close to the surface at temperatures below 200 °C. (2) Mesozoic Insensitivity and Stable Burial Temperature: From approximately 160 to 60 Ma, the samples remained at a stable burial temperature ranging between 20 °C and 140 °C. (3) Reheating and Rapid Cooling: Between 60 and 20 Ma, there was reheating to around 160 °C. Subsequently, between 20 and 10 Ma, there was a phase of rapid cooling. The Cenozoic phase in the forward models aligns with the inversion models, although the inversion models allow for more variation in the path. These shared characteristics across different modeling methods and inversion models indicate consistent trends in the thermal history of the samples from the Longshou Shan. This consistency reinforces the reliability and robustness of the models in capturing the key aspects of the region’s thermal evolution during specific time intervals.
The observed inconsistencies between the forward and inversion modeling paths highlight divergences in the reconstructed thermal history. These inconsistencies are as follows: (1) Divergent Interpretations in Cooling Events: HeFTy modeling suggests that the sample remained in the shallow crust around 400 Ma, followed by heating from 400 Ma to 330 Ma. In contrast, the most reliable range derived from QTQt models indicates slow cooling from 400 Ma to 300 Ma. Forward modeling reveals two distinct cooling periods (427–410 Ma and 321–300 Ma), which contradicts the predictions from the inversion models. (2) Reheating and Rapid Cooling Events Discrepancy: The HeFTy and granite samples QTQt inversion modeling path predict reheating and rapid cooling occurring at 250 Ma and 180 Ma, respectively. However, the forward models suggest a similar cooling event around 250 Ma. The forward path’s setting of 180–160 Ma for reheating and rapid cooling seems to mainly cover younger ages of eU concentrations (200–1000 ppm) (Figure 9a).
The discrepancies between the forward and inversion modeling might result from differences in their methodologies, such as how they interpret and weigh the input data and constraints. The forward models attempt to determine the most plausible time-temperature path by comparing predicted data with all measured data, potentially leading to the identification of a cooling event around 250 Ma within the broader 330–100 Ma timeframe (Figure 9a). Yet, the defined timeframe of 180–160 Ma in the forward modeling process for reheating and rapid cooling appears to predominantly encompass younger ages (Figure 9a). Rectifying these discrepancies may necessitate a deeper analysis using more grain ZHe data, coupled with a meticulous reevaluation of modeling algorithms or recalibration of input data interpretations.
Understanding the variations in data due to different modeling algorithms is essential in comprehensively interpreting the thermal histories derived from these models. While the forward models and the two inversion models exhibit similarities, it is crucial to acknowledge that relying on a single modeling approach might oversimplify the exploration of the complete spectrum of potential thermal histories. To address this, consolidating the common elements observed across all modeling results becomes pivotal in providing a more comprehensive and robust interpretation of the data. By focusing on these commonalities, the discussion can aim to enhance reliability and credibility by drawing insights from the intersection of various simulation outcomes. This inclusive approach allows for a more nuanced and holistic understanding of the thermal evolution of the studied area, considering the consensus points among diverse modeling techniques.
In summary, while ZHe data hold promise in uncovering thermal history, relying solely on it for rapid cooling events has limitations. Integrating this data with other geological and thermochronological observations, such as U-Pb and 40Ar/39Ar analyses, is crucial for a more accurate and comprehensive understanding of the region’s thermal evolution. Simultaneously, these findings suggest that, within this specific research area, the ZHe dataset does not manifest sensitivity towards the timing or magnitude of Mesozoic deformation. Instead, the ZHe-eU is predominantly influenced by the timing and magnitude of earlier and later events within the rocks’ thermal history. Considering this, the consequences of both ends of the temporal spectrum are scrutinized to delve into the evolutionary history of late Paleozoic intracontinental deformation in the Hexi Corridor-Alxa region, along with the distinctive characteristics of recent activities at the foremost boundary of the northeastern margin of the Tibetan Plateau.

6.2. Late Paleozoic Unroofing

The modeling outcomes imply that individual ZHe data exhibit a considerably high sensitivity primarily towards the early thermal events, particularly within the Paleozoic era. Following the deposition of foreland basin-type continental clastic deposits during the Silurian-Devonian period and the subsequent high topographic subsidence linked to Early Carboniferous carbonate, associated with the Qilian orogenic belt [14,21], the depth-time thermal history analysis of the Longshou Shan indicates a notable unroofing event that took place between 330 and 300 Ma. The first-order trend between the older age of these grains and the medium eU concentration (200 ppm–600 ppm) in the Longshou Shan enables modeling to predict the cooling phase of the late Carboniferous.
During the late Carboniferous period, the subduction of Paleo-Asian oceanic lithosphere instigated uplift, erosion, and the formation of an unconformity between the early Carboniferous and late Carboniferous–early Permian strata (Figure 3). The geochemistry and chronological evidence, in correspondence with model results, is consistent with findings from Wu et al. (2022) and Xue et al. (2017), which suggest regional formation in a tectonic setting associated with plate compression. Arc plutons dating to the late Carboniferous period (309–315 Ma) observed in the Longshou Shan region are construed to be associated with this subduction event [14]. Additionally, around 330 Ma, the Adakitic rocks found in the Longshou Shan area might have originated from melted oceanic lithosphere or deep-seated crustal rocks during the stages of subduction [60].
Certainly, the unroofing event during the Late Carboniferous seems to coincide with a more extensive regional uplift, suggesting a possible far-field effect related to the initial subduction in the middle Paleo-Asian Ocean along the Bei shan and the north edge of Alxa [61,62,63] (Figure 13a). The observed unroofing event during the Late Carboniferous era in the Longshou Shan implies that the rock mass in this area underwent substantial structural cooling, reaching near-surface temperatures of around 200 °C. The subsequent Meso-Cenozoic cooling phase, therefore, cannot be simply explained as cooling after Mesozoic magmatic activation but is more likely of tectonic origin. These findings provide empirical evidence for the structural understanding of the Longshou Shan’s geological history, setting the stage for further discussions on its structural aspects.

6.3. Early Cooling and Late Regional Stabilization in the Mesozoic

The integrated results from HeFTy and forward models indicate a cooling event around 255 Ma, while the QTQt models suggest a cooling around 180 Ma. This discrepancy stems from differences in the modeling mechanisms. However, it is important to note that the presence of a cooling phase cannot be disregarded in either inversion phase, thus warranting consideration of both phases in the subsequent discussion. During the middle to late Mesozoic period, the regional geological structure exhibited relative stability, and these findings underscore the ZHe method’s limited sensitivity to the structural history during this intermediate period.
Observations from stratigraphy reveal a transition from original Permian marine and continental sediments to Triassic intracontinental alluvial fan strata, with regional unconformities between the Permian-Triassic layers (Figure 3). This transition may be attributed to regional cooling triggered by right-lateral shear strike-slip stress associated with the Permian-Early Triassic south Longshou Shan fault situated at the southern boundary of the Longshou Shan [65,66]. This regional activity is probably related to the closing of the Middle Paleo-Asian Ocean and the subduction of the Eastern Paleo-Asian Ocean (Solonker Ocean) along the Beishan-Alxa-Solonker suture [1,63,67,68,69,70,71] (Figure 13b).
During the Middle Jurassic, approximately 180 Ma, there was a rapid erosion event in the Longshou Shan. Considering the global plate-scale influences, the zircon U-Pb age of the Paleo-Pacific subduction-accretion complex in the Nadanhada area is dated at 216 ± 5 Ma, indicating that the Paleo-Pacific subduction commenced during the Late Triassic, preceding the mid-Jurassic tectonic activity in the Longshou Shan region [33]. Additionally, the direction of the subduction of the Paleo-Pacific, which is west-northwest (WNW), stands perpendicular to the tectonic stress and deformation direction in the study area [37]. Consequently, the regional tectonic compressions can be likely linked to the northward movement of the Lhasa Plate and the far-field effect of the subduction of the Meso-Tethys Ocean [72,73,74] (Figure 13c).
The modeling outcomes indicate a relatively stable period from the middle to late Mesozoic era, with temperatures consistently ranging between 30 and 140 °C across the region. Within the Hexi Corridor-Alax area, there was substantial extension occurring from the Middle Jurassic to the Cretaceous period, leading to the formation of the Chaoshui Basin and Ejinaqi Basin. However, the specific tectonic mechanism driving this extension remains a subject of contention among researchers. Some scholars assert that it stems from the back-arc extension following the closure of the Paleo-Tethys Ocean [75,76], while others propose it is a result of the subduction and rollback of the Pacific plate [77]. Additionally, an alternative viewpoint suggests it might be attributed to the eastward stretching of the Mongol-North China orogenic belt [30,34].
These pieces of evidence collectively suggest that the intracontinental deformation observed in the Longshou Shan area of central East Asia was predominantly influenced by the Tethys Ocean within the framework of the Paleo-Asiatic tectonic domain during the Early and Middle Mesozoic eras.

6.4. The Reheating and Cooling of the Cenozoic

The study’s key methodological discovery is the high sensitivity of modeling to the early and later part of the thermal history, providing insights into various facets of Cenozoic evolution in the Longshou Shan. Through the joint inversion of Zircon Helium (ZHe) and Apatite Helium (AHe) data, the findings indicate a temperature peak of 160 °C preceding the last cooling phase, suggesting a cooling trend in the eastern Longshou Shan post-20 Ma. This thermal trend occurs within the 40–20 Ma timeframe. This outcome is a direct result of our zircon data, which include a set of relatively consistent dates between ~7 and ~100 Ma at high U concentrations (>1000 ppm). These highest eU concentration grains close at temperatures below ~50 °C and overlap in timing and temperature sensitivity with our apatite He results from this range [17,38,39]. The plausibility of 100 °C heating for the stratigraphic sediments is substantiated by several factors: (1) Sedimentary Thickness: The Palaeogene-Neogene strata in the Hexi Corridor adjacent to the Longshou Shan exhibit a thickness of 3 km. The regional unconformities between these strata and the granite in the study area suggest a potential material basis for sedimentary overlay on the granite (Figure 4a). (2) Palaeo-elevation: There is a minimal difference, only 300 m, between the average elevation of the granite in the study area and that of the Hexi Corridor. This indicates that during the deposition of Cenozoic strata in the Hexi Corridor, the Longshou Shan did experience sedimentary deposition due to its relatively low elevation. This provides environmental conditions conducive to sedimentary coverage over the granite. These results offer considerable support for the reliability of the modeling outcomes, particularly regarding the temperature reaching up to 160 °C around 20 Ma.
During the Cenozoic era, the collision between the India Plate and the Asian Plate instigated substantial uplift of the Qinghai-Tibet Plateau [78,79,80]. The Qilian orogenic belt, influenced by the NE-SW compression resulting from the Qinghai-Tibet Plateau, underwent significant and forceful uplift [80] (Figure 13d). The lithosphere underwent flexure due to an excessive load, leading to the overall subsidence of the Hexi Corridor basin, ultimately forming the Qilian Mountains foreland Basin [81]. Extensive deposits of Paleogene-Neogene strata were laid down within the corridor and the adjoining Longshou Shan area (Figure 3). By the Middle Miocene epoch, the significant uplift of the North Qilian Shan and the Longshou Shan prompted a countercurrent expansion, indicating the extension of the northeastern boundary of the Tibetan Plateau to the Alax Block [82,83,84].

7. Conclusions

Through various modeling methods, the study has aimed to elucidate the impact of radiation damage on observed ages, explore the primary cooling and heating events of the basement rocks in the Longshou Shan since the Phanerozoic, and assess the confidence of modeling outcomes when relying on ZHe data. Finally, the tectonic evolution history of the Phanerozoic in the Longshou Shan is deduced based on the aforementioned analysis.
  • The findings indicate that the utilization of ZHe data alone can effectively address multiple cooling and reheating cycles across geological timescales. However, combining ZHe data with multiple thermochronometers notably enhances modeling accuracy. Contrary to expectations, the ZHe-eU values seem to be primarily affected by the timing and scale of preceding and subsequent thermal events within the geological history of the rocks.
  • A significant unroofing is observed during the 330–300 Ma period, resulting in the cooling of granite and metamorphic rocks in the study area to temperatures below 200 °C, coinciding with the subduction of the Paleo-Asian Ocean.
  • The modeling results demonstrate short-term cooling events around the Early-Middle Mesozoic, with relative stability observed in the Longshou Shan between 160 and 60 Ma. This indicates that the intracontinental deformation witnessed in the Longshou Shan region was primarily impacted by the Tethys Ocean within the context of the Paleo-Asiatic tectonic domain during the Early and Middle Mesozoic periods.
  • At around 60–20 Ma, the Longshou Shan experienced reheating up to 160 °C, followed by subsequent 20–10 Ma rapid cooling. The observed event is attributed to the far-field effect resulting from the Indo-Asian collision.
The findings highlight the significance of employing chronology as a valuable method to unravel the intricate and enduring structural history. The study delineates the recurrent tectonic activity in the Longshou Shan, situated in central East Asia, spanning the Phanerozoic era. These episodes are discernible through the recurring patterns of cooling and subsequent burial of basement rocks. Such repetitive reactivation phases establish a pre-existing structural framework that shapes and impacts subsequent faulting and sedimentary activities.

Author Contributions

C.F.: Conceptualization, Formal analysis, Methodology, Data Curation, Software, Writing—Original Draft Preparation, Writing—Review & Editing. W.Z.: Conceptualization, Project Administration, Methodology, Funding Acquisition, Investigation, Resources, Supervision, Writing—review & editing, Validation. J.J.: Investigation, Data Curation, Formal Analysis, Software, Methodology. S.W.: Formal Analysis, Investigation, Data Curation, Software, Methodology. W.W.: Validation, Resources, Methodology, Software, Data Curation. All authors have read and agreed to the published version of the manuscript.

Funding

This work was supported by the Second Tibetan Plateau Scientific Expedition and Research Program (STEP; grant no. 2019QZKK0901), the National Science Foundation of China (grant nos. 42174062 and 41774049), and the Guangdong Province Introduced Innovative R&D Team of Deep Earth Exploration and Resource Environment (grant no. 2017ZT07Z066).

Data Availability Statement

The original contributions presented in the study are included in the article.

Acknowledgments

The authors would like to thank Yipeng Zhang for help with fieldwork and Xiaoming Shen for helping with the U-Th/He test and many discussions. Thanks to Tingting Ji, Tang Qing, and Ting Liu for their comments and suggestions on this study. Thanks to the four reviewers for their valuable suggestions.

Conflicts of Interest

The authors declare that they have no known competing financial interest or personal relationships that could have appeared to influence the work reported in this paper.

References

  1. Eizenhöfer, P.R.; Zhao, G.; Zhang, J.; Sun, M. Final Closure of the Paleo-Asian Ocean along the Solonker Suture Zone: Constraints from Geochronological and Geochemical Data of Permian Volcanic and Sedimentary Rocks: Xar Moron Manuscript. Tectonics 2014, 33, 441–463. [Google Scholar] [CrossRef]
  2. Xiao, W.; Windley, B.; Sun, S.; Li, J.; Huang, B.; Han, C.; Yuan, C.; Sun, M.; Chen, H. A Tale of Amalgamation of Three Permo-Triassic Collage Systems in Central Asia: Oroclines, Sutures, and Terminal Accretion. Annu. Rev. Earth Planet. Sci. 2015, 43, 477–507. [Google Scholar] [CrossRef]
  3. Song, D.; Xiao, W.; Windley, B.F.; Mao, Q.; Ao, S.; Wang, H.Y.C.; Li, R. Closure of the Paleo-Asian Ocean in the Middle-Late Triassic (Ladinian-Carnian): Evidence from Provenance Analysis of Retroarc Sediments. Geophys. Res. Lett. 2021, 48, e2021GL094276. [Google Scholar] [CrossRef]
  4. Zhu, Y.; Gao, R.; Zhao, G. Permian to Cretaceous Tectonic Evolution of the Jiamusi and Songliao Blocks in NE China: Transition from the Closure of the Paleo-Asian Ocean to the Subduction of the Paleo-Pacific Ocean. Gondwana Res. 2022, 103, 371–388. [Google Scholar] [CrossRef]
  5. Horton, B.K.; Dupont-Nivet, G.; Zhou, J.; Waanders, G.L.; Butler, R.F.; Wang, J. Mesozoic-Cenozoic Evolution of the Xining-Minhe and Dangchang Basins, Northeastern Tibetan Plateau: Magnetostratigraphic and Biostratigraphic Results: Mesozoic-Cenozoic Evolution of NE Tibet. J. Geophys. Res. Solid Earth 2004, 109. [Google Scholar] [CrossRef]
  6. Yin, A.; Dubey, C.S.; Kelty, T.K.; Webb, A.A.G.; Harrison, T.M.; Chou, C.Y.; Célérier, J. Geologic Correlation of the Himalayan Orogen and Indian Craton: Part 2. Structural Geology, Geochronology, and Tectonic Evolution of the Eastern Himalaya. Geol. Soc. Am. Bull. 2010, 122, 360–395. [Google Scholar] [CrossRef]
  7. Wu, C.; Yin, A.; Zuza, A.V.; Zhang, J.; Liu, W.; Ding, L. Pre-Cenozoic Geologic History of the Central and Northern Tibetan Plateau and the Role of Wilson Cycles in Constructing the Tethyan Orogenic System. Lithosphere 2016, 8, 254–292. [Google Scholar] [CrossRef]
  8. Peng, H.; Wang, J.; Liu, C.; Ma, M.; Ma, Q.; Li, K.; Pan, J.; Li, J.; Qin, Y.; Xie, Q.; et al. Meso-Cenozoic Growth of the Eastern Qilian Shan, Northeastern Tibetan Plateau Margin: Insight from Borehole Apatite Fission-Track Thermochronology in the Xiji Basin. Mar. Pet. Geol. 2022, 143, 105798. [Google Scholar] [CrossRef]
  9. Wu, C.; Zuza, A.; Li, J.; Haproff, P.; Yin, A.; Chen, X.; Ding, L.; Li, B. Late Mesozoic−Cenozoic Cooling History of the Northeastern Tibetan Plateau and Its Foreland Derived from Low-Temperature Thermochronology. Geol. Soc. Am. Bull. 2021, 133, 2393–2417. [Google Scholar] [CrossRef]
  10. Zhang, J.; Li, J.; Li, Y.; Ma, Z. How Did the Alxa Block Respond to the Indo-Eurasian Collision? Int. J. Earth Sci. 2009, 98, 1511–1527. [Google Scholar] [CrossRef]
  11. Yin, A.; Harrison, T. Geologic Evolution of the Himalayan-Tibetan Orogen. Annu. Rev. Earth Planet. Sci. 2003, 28, 211–280. [Google Scholar] [CrossRef]
  12. Ren, J.; Niu, B.; Wang, J.; Jin, X.; Zhao, L.; Liu, R. Advances in Research of Asian Geology—A Summary of 1:5M International Geological Map of Asia Project. J. Asian Earth Sci. 2013, 72, 3–11. [Google Scholar] [CrossRef]
  13. Liu, K.; Chen, X.; Zuza, A.V.; Shao, Z.; Qin, X.; Han, L.; Zhang, Y.; Yu, W.; Wang, Z.; Shi, X.; et al. The Late Mesozoic Intracontinental Contraction–Extension Transition in the Beishan Fold-Thrust Belt, Central Asia: Constraints from Structural Analysis and Apatite (U–Th)/He Thermochronology. Tectonics 2023, 42, e2022TC007532. [Google Scholar] [CrossRef]
  14. Wu, C.; Li, J.; Zuza, A.; Haproff, P.; Yin, A.; Ding, L. Paleoproterozoic–Paleozoic Tectonic Evolution of the Longshou Shan, Western North China Craton. Geosphere 2022, 18, 1177–1193. [Google Scholar] [CrossRef]
  15. Zhang, B.; Zhang, J.; Wang, Y.; Zhao, H.; Li, Y. Late Mesozoic-Cenozoic Exhumation of the Northern Hexi Corridor: Constrained by Apatite Fission Track Ages of the Longshoushan. Acta Geol. Sin.-Engl. Ed. 2017, 91, 1624–1643. [Google Scholar] [CrossRef]
  16. Zeng, R.; Lai, J.; Mao, X.; Li, B.; Zhang, J.; Bayless, R.; Yang, L. Paleoproterozoic Multiple Tectonothermal Events in the Longshoushan Area, Western North China Craton and Their Geological Implication: Evidence from Geochemistry, Zircon U–Pb Geochronology and Hf Isotopes. Minerals 2018, 8, 361. [Google Scholar] [CrossRef]
  17. Li, J.; Zheng, W.; Wang, W.; Wang, Y.; Zhang, P.; Wang, Y. The northward growth of the northeastern Tibetan plateau in late Cenozoic: Implications from apatite (U-Th)/He ages of Longshou Shan. Seismol. Geol. 2020, 42, 472–491. [Google Scholar] [CrossRef]
  18. Guenthner, W.R.; Reiners, P.W.; Tian, Y. Interpreting Date–eU Correlations in Zircon (U-Th)/He Datasets: A Case Study from the Longmen Shan, China. Earth Planet. Sci. Lett. 2014, 403, 328–339. [Google Scholar] [CrossRef]
  19. Orme, D.A.; Guenthner, W.R.; Laskowski, A.K.; Reiners, P.W. Long-Term Tectonothermal History of Laramide Basement from Zircon–He Age-eU Correlations. Earth Planet. Sci. Lett. 2016, 453, 119–130. [Google Scholar] [CrossRef]
  20. Geological Survey of Gansu Province. Gansu Province: 1:250,000 Shandan County Sheet Construction Tectonic Map; Geological Press: Beijing, China, 2010.
  21. Bureau of Mineral Resources of Gansu Province. Regional Geological Survey; Ministry of Geology of China: Beijing, China, 1982.
  22. Liu, J.; Yin, C.; Zhang, J.; Qian, J.; Li, S.; Xu, K.; Wu, S.; Xia, Y. Tectonic Evolution of the Alxa Block and Its Affinity: Evidence from the U-Pb Geochronology and Lu-Hf Isotopes of Detrital Zircons from the Longshoushan Belt. Precambrian Res. 2020, 344, 105733. [Google Scholar] [CrossRef]
  23. Zhang, L. Magmatism and Deep Process after Paleozoic Collision in South Margin of North Qilian-Alashan Block; China University of Geosciences: Wuhan, China, 2019. [Google Scholar] [CrossRef]
  24. Chen, Y.; Zhao, R.; Wang, G.; Rong, X.; Li, T. Geochronology, geochemical characteristics and significances of quartz monzonite in Niujiaogou, Longshoushan, Gansu. J. East China Univ. Technol. (Nat. Sci.) 2020, 43, 21–29. [Google Scholar] [CrossRef]
  25. Zhao, S.; Li, S.; Cao, H.; Li, X.; Liu, X.; Yu, S.; Guo, X. A Missing Link of the Proto-Tethys Ocean between the Qinling and Qilian Orogens, China: Insights from Geochronology and Structural Geology. Geosci. Front. 2020, 11, 1495–1509. [Google Scholar] [CrossRef]
  26. Fu, C.; Yan, Z.; Aitchison, J.C.; Xiao, W.; Buckman, S.; Wang, B.; Li, W.; Li, Y.; Ren, H. Multiple Subduction Processes of the Proto-Tethyan Ocean: Implication from Cambrian Intrusions along the North Qilian Suture Zone. Gondwana Res. 2020, 87, 207–223. [Google Scholar] [CrossRef]
  27. Zhang, J.; Gong, J. Revisiting the nature and affinity of the Alxa Block. Acta Petrol. Sin. 2018, 34, 940–962. [Google Scholar] [CrossRef]
  28. Liu, Q.; Zhao, G.; Han, Y.; Zhu, Y.; Wang, B.; Eizenhöfer, P.R.; Zhang, X.; Tsui, R.W. Timing of the Final Closure of the Middle Segment of the Paleo-Asian Ocean: Insights from Geochronology and Geochemistry of Carboniferous–Triassic Volcanosedimentary Successions in Western Inner Mongolia, China. Geol. Soc. Am. Bull. 2019, 131, 941–965. [Google Scholar] [CrossRef]
  29. Vincent, S.J.; Allen, M.B. Evolution of the Minle and Chaoshui Basins, China: Implications for Mesozoic Strike-Slip Basin Formation in Central Asia. Geol. Soc. Am. Bull. 1999, 111, 725–742. [Google Scholar] [CrossRef]
  30. Cogné, J.-P.; Kravchinsky, V.A.; Halim, N.; Hankard, F. Late Jurassic-Early Cretaceous Closure of the Mongol-Okhotsk Ocean Demonstrated by New Mesozoic Palaeomagnetic Results from the Trans-Baïkal Area (SE Siberia). Geophys. J. Int. 2005, 163, 813–832. [Google Scholar] [CrossRef]
  31. Baxter, A.; Aitchison, J.; Zyabrev, S. Radiolarian Age Constraints on Mesotethyan Ocean Evolution, and Their Implications for Development of the Bangong-Nujiang Suture, Tibet. J. Geol. Soc. 2009, 166, 689–694. [Google Scholar] [CrossRef]
  32. Liu, D.; Huang, Q.; Fan, S.; Zhang, L.; Shi, R.; Ding, L. Subduction of the Bangong–Nujiang Ocean: Constraints from Granites in the Bangong Co Area, Tibet. Geol. J. 2014, 49, 188–206. [Google Scholar] [CrossRef]
  33. Zhou, J.; Cao, J.; Wilde, S.; Zhao, G.; Zhang, J.; Wang, B. Paleo-Pacific Subduction-Accretion: Evidence from Geochemical and U-Pb Zircon Dating of the Nadanhada Accretionary Complex, NE China. Tectonics 2014, 33, 2444–2466. [Google Scholar] [CrossRef]
  34. Jolivet, M. Mesozoic Tectonic and Topographic Evolution of Central Asia and Tibet: A Preliminary Synthesis. Geol. Soc. Lond. Spec. Publ. 2015, 427, 19–55. [Google Scholar] [CrossRef]
  35. Li, S.-M.; Zhu, D.-C.; Wang, Q.; Zhao, Z.; Zhang, L.-L.; Liu, S.-A.; Chang, Q.-S.; Lu, Y.-H.; Dai, J.-G.; Zheng, Y.-C. Slab-Derived Adakites and Subslab Asthenosphere-Derived OIB-Type Rocks at 156 ± 2 Ma from the North of Gerze, Central Tibet: Records of the Bangong–Nujiang Oceanic Ridge Subduction during the Late Jurassic. Lithos 2016, 262, 456–469. [Google Scholar] [CrossRef]
  36. Ma, A.; Hu, X.; Garzanti, E.; Han, Z.; Lai, W. Sedimentary and Tectonic Evolution of the Southern Qiangtang Basin: Implications for the Lhasa-Qiangtang Collision Timing. J. Geophys. Res. Solid Earth 2017, 122, 4790–4813. [Google Scholar] [CrossRef]
  37. Ma, Q.; Xu, Y.-G. Magmatic Perspective on Subduction of Paleo-Pacific Plate and Initiation of Big Mantle Wedge in East Asia. Earth-Sci. Rev. 2021, 213, 103473. [Google Scholar] [CrossRef]
  38. Guenthner, W.R.; Reiners, P.W.; Ketcham, R.A.; Nasdala, L.; Giester, G. Helium Diffusion in Natural Zircon: Radiation Damage, Anisotropy, and the Interpretation of Zircon (U-Th)/He Thermochronology. Am. J. Sci. 2013, 313, 145–198. [Google Scholar] [CrossRef]
  39. Johnson, J.E.; Flowers, R.M.; Baird, G.B.; Mahan, K.H. “Inverted” Zircon and Apatite (U–Th)/He Dates from the Front Range, Colorado: High-Damage Zircon as a Low-Temperature (<50 °C) Thermochronometer. Earth Planet. Sci. Lett. 2017, 466, 80–90. [Google Scholar] [CrossRef]
  40. Guenthner, W.; Reiners, P.; Decelles, P.; Kendall, J. Sevier Belt Exhumation in Central Utah Constrained from Complex Zircon (U-Th)/He Data Sets: Radiation Damage and He Inheritance Effects on Partially Reset Detrital Zircons. Geol. Soc. Am. Bull. 2015, 127, 323–348. [Google Scholar] [CrossRef]
  41. Ault, A.K.; Guenthner, W.R.; Moser, A.C.; Miller, G.H.; Refsnider, K.A. Zircon Grain Selection Reveals (de)Coupled Metamictization, Radiation Damage, and He Diffusivity. Chem. Geol. 2018, 490, 1–12. [Google Scholar] [CrossRef]
  42. DeLucia, M.S.; Guenthner, W.R.; Marshak, S.; Thomson, S.N.; Ault, A.K. Thermochronology Links Denudation of the Great Unconformity Surface to the Supercontinent Cycle and Snowball Earth. Geology 2018, 46, 167–170. [Google Scholar] [CrossRef]
  43. Peak, B.A.; Flowers, R.M.; Macdonald, F.A.; Cottle, J.M. Zircon (U-Th)/He Thermochronology Reveals Pre-Great Unconformity Paleotopography in the Grand Canyon Region, USA. Geology 2021, 49, 1462–1466. [Google Scholar] [CrossRef]
  44. Kaempfer, J.; Guenthner, W.; Pearson, D. Proterozoic to Phanerozoic Tectonism in Southwestern Montana Basement Ranges Constrained by Low Temperature Thermochronometric Data. Tectonics 2021, 40, e2021TC006744. [Google Scholar] [CrossRef]
  45. Guenthner, W.R. Implementation of an Alpha Damage Annealing Model for Zircon (U-Th)/He Thermochronology with Comparison to a Zircon Fission Track Annealing Model. Geochem. Geophys. Geosyst. 2021, 22, e2019GC008757. [Google Scholar] [CrossRef]
  46. Gautheron, C.; Hueck, M.; Ternois, S.; Heller, B.; Schwartz, S.; Sarda, P.; Tassan-Got, L. Investigating the Shallow to Mid-Depth (>100–300 °C) Continental Crust Evolution with (U-Th)/He Thermochronology: A Review. Minerals 2022, 12, 563. [Google Scholar] [CrossRef]
  47. Ketcham, R.A. Forward and Inverse Modeling of Low-Temperature Thermochronometry Data. Rev. Mineral. Geochem. 2005, 58, 275–314. [Google Scholar] [CrossRef]
  48. Gallagher, K. Transdimensional Inverse Thermal History Modeling for Quantitative Thermochronology: Transdimensional Inverse Thermal History. J. Geophys. Res. Solid Earth 2012, 117. [Google Scholar] [CrossRef]
  49. Evans, N.J.; Byrne, J.P.; Keegan, J.T.; Dotter, L.E. Determination of Uranium and Thorium in Zircon, Apatite, and Fluorite: Application to Laser (U-Th)/He Thermochronology. J. Anal. Chem. 2005, 60, 1159–1165. [Google Scholar] [CrossRef]
  50. Reiners, P.W.; Nicolescu, S. Measurement of parent nuclides for (U-Th)/He chronometry by solution sector ICP-MS. ARHDL Rep. 2006, 1, 1–33. [Google Scholar]
  51. Flowers, R.M.; Kelley, S.A. Interpreting Data Dispersion and “Inverted” Dates in Apatite (U–Th)/He and Fission-Track Datasets: An Example from the US Midcontinent. Geochim. Cosmochim. Acta 2011, 75, 5169–5186. [Google Scholar] [CrossRef]
  52. Meesters, A.; Dunai, T. Solving the Production–Diffusion Equation for Finite Diffusion Domains of Various Shapes: Part I. Implications for Low-Temperature (U–Th)/He Thermochronology. Chem. Geol. 2002, 186, 333–344. [Google Scholar] [CrossRef]
  53. Farley, K.A.; Wolf, R.A.; Silver, L.T. The Effects of Long Alpha-Stopping Distances on (U-Th)/He Ages. Geochim. Cosmochim. Acta 1996, 60, 4223–4229. [Google Scholar] [CrossRef]
  54. Flowers, R.M.; Ketcham, R.A.; Shuster, D.L.; Farley, K.A. Apatite (U–Th)/He Thermochronometry Using a Radiation Damage Accumulation and Annealing Model. Geochim. Cosmochim. Acta 2009, 73, 2347–2365. [Google Scholar] [CrossRef]
  55. Zhang, Z.; Wang, K.; Wang, G.; Liu, X.; Liu, W.; Wu, B. Petrogenesis and Tectonic Significances of the Paleozoic Jiling Syenite in the Mountain Longshou Area, Gansu Province. Geol. Rev. 2018, 64, 1017–1029. [Google Scholar] [CrossRef]
  56. Zhang, X.; Zhang, H.; Cao, Z. Genetic Analysis and Resource Evaluation of Dazhuang Geothermal Reservoir in the Minle Basin. Arab. J. Geosci. 2021, 14, 815. [Google Scholar] [CrossRef]
  57. Thurston, O.G.; Guenthner, W.R.; Karlstrom, K.E.; Ricketts, J.W.; Heizler, M.T.; Timmons, J.M. Zircon (U-Th)/He Thermochronology of Grand Canyon Resolves 1250 Ma Unroofing at the Great Unconformity and <20 Ma Canyon Carving. Geology 2022, 50, 222–226. [Google Scholar] [CrossRef]
  58. Colleps, C.L.; McKenzie, N.R.; Guenthner, W.; Sharma, M.; Gibson, T.; Stockli, D. Apatite (U-Th)/He Thermochronometric Constraints on the Northern Extent of the Deccan Large Igneous Province. Earth Planet. Sci. Lett. 2021, 571, 117087. [Google Scholar] [CrossRef]
  59. Vermeesch, P.; Tian, Y. Thermal History Modelling: HeFTy vs. QTQt. Earth-Sci. Rev. 2014, 139, 279–290. [Google Scholar] [CrossRef]
  60. Xue, S.; Ling, M.-X.; Liu, Y.-L.; Zhang, H.; Sun, W. The Genesis of Early Carboniferous Adakitic Rocks at the Southern Margin of the Alxa Block, North China. Lithos 2017, 278–281, 181–194. [Google Scholar] [CrossRef]
  61. Chen, N.H.-C.; Zhao, G.; Jahn, B.; Zhou, H.; Sun, M. Geochemistry and Geochronology of the Delinggou Intrusion: Implications for the Subduction of the Paleo-Asian Ocean beneath the North China Craton. Gondwana Res. 2017, 43, 178–192. [Google Scholar] [CrossRef]
  62. Xiao, W.; Windley, B.F.; Han, C.; Liu, W.; Wan, B.; Zhang, J.; Ao, S.; Zhang, Z.; Song, D. Late Paleozoic to Early Triassic Multiple Roll-Back and Oroclinal Bending of the Mongolia Collage in Central Asia. Earth-Sci. Rev. 2018, 186, 94–128. [Google Scholar] [CrossRef]
  63. Li, J.; Wu, C.; Chen, X.; Zuza, A.; Haproff, P.; Yin, A.; Shao, Z. Tectonic Evolution of the Beishan Orogen in Central Asia: Sub duction, Accretion, and Continent-Continent Collision during the Closure of the Paleo-Asian Ocean. Geol. Soc. Am. Bull. 2023, 135, 819–851. [Google Scholar] [CrossRef]
  64. Kapp, P.; Decelles, P. Mesozoic-Cenozoic Geological Evolution of the Himalayan-Tibetan Orogen and Working Tectonic Hypotheses. Am. J. Sci. 2019, 319, 159–254. [Google Scholar] [CrossRef]
  65. Wang, F.; Xu, W.; Xing, K.; Wang, Y.; Zhang, H.; Wu, W.; Sun, C.; Ge, W. Final Closure of the Paleo-Asian Ocean and Onset of Subduction of Paleo-Pacific Ocean: Constraints from Early Mesozoic Magmatism in Central Southern Jilin Province, NE China. J. Geophys. Res. Solid Earth 2019, 124, 2601–2622. [Google Scholar] [CrossRef]
  66. Zhang, B. The Paleozoic Tectonic Attribute of the Southern Alxa Block: Constrained by Detrital Zircon U-Pb Ages and Structural Deforamtion Analysis; Chinese Academy of Geological Sciences: Beijing, China, 2019; Available online: https://kns.cnki.net/KCMS/detail/detail.aspx?dbcode=CDFD&dbname=CDFDLAST2019&filename=1019146204.nh&v= (accessed on 3 June 2019).
  67. Xiao, W.; Windley, B.; Hao, J.; Zhai, M. Accretion Leading to Collision and the Permian Solonker Suture, Inner Mongolia, China: Termination of the Central Asian Orogenic Belt. Tectonics 2003, 22. [Google Scholar] [CrossRef]
  68. Fu, D.; Huang, B.; Kusky, T.M.; Li, G.; Wilde, S.A.; Zhou, W.; Yu, Y. A Middle Permian Ophiolitic Mélange Belt in the Solonker Suture Zone, Western Inner Mongolia, China: Implications for the Evolution of the Paleo-Asian Ocean. Tectonics 2018, 37, 1292–1320. [Google Scholar] [CrossRef]
  69. Wang, K.; Li, Y.; Xiao, W.; Zheng, J.; Wang, C.; Jiang, H.; Brouwer, F.M. Geochemistry and Zircon U-Pb-Hf Isotopes of Paleozoic Granitoids along the Solonker Suture Zone in Inner Mongolia, China: Constraints on Bidirectional Subduction and Closure Timing of the Paleo-Asian Ocean. Gondwana Res. 2024, 126, 1–21. [Google Scholar] [CrossRef]
  70. Liu, Q.; Zhao, G.; Han, Y.; Eizenhöfer, P.R.; Zhu, Y.; Hou, W.; Zhang, X.; Wang, B. Geochronology and Geochemistry of Per mian to Early Triassic Granitoids in the Alxa Terrane: Constraints on the Final Closure of the Paleo-Asian Ocean. Lithosphere 2017, 9, 665–680. [Google Scholar] [CrossRef]
  71. Didenko, A.N.; Li, Y.-F.; Peskov, A.Y.; Sun, S.-L.; Karetnikov, A.S.; Zhou, Y.-H. Closure of the Solonker Basin: Paleomagnetism of the Linxi and Xingfuzhilu Formations (Inner Mongolia, China). Russ. J. Pac. Geol. 2016, 10, 317–336. [Google Scholar] [CrossRef]
  72. Liu, Y.; Li, S.; Zhai, Q.; Tang, Y.; Hu, P.; Guo, R.; Liu, Y.; Wang, Y.; Yu, S.; Cao, H.; et al. Jurassic Tectonic Evolution of Tibetan Plateau: A Review of Bangong-Nujiang Meso-Tethys Ocean. Earth-Sci. Rev. 2022, 227, 103973. [Google Scholar] [CrossRef]
  73. Zhang, B.-C.; Fan, J.-J.; Luo, A.-B.; Zeng, X.-W. The First Identified Oceanic Core Complex in the Bangong–Nujiang Suture Zone, Central Tibet: New Insights into the Early Mesozoic Tectonic Evolution of the Meso-Tethys Ocean. J. Asian Earth Sci. 2022, 233, 105248. [Google Scholar] [CrossRef]
  74. Wang, W.; Zhai, Q.; Hu, P.; Tang, Y. Mesozoic Felsic Magmatism along the Bangong–Nujiang Suture Zone, Tibet: Temporospatial Variations and Tectonic Implications. Gondwana Res. 2024, 125, 284–300. [Google Scholar] [CrossRef]
  75. Song, P.; Ding, L.; Li, Z.; Lippert, P.C.; Yang, T.; Zhao, X.; Fu, J.; Yue, Y. Late Triassic Paleolatitude of the Qiangtang Block: Implications for the Closure of the Paleo-Tethys Ocean. Earth Planet. Sci. Lett. 2015, 424, 69–83. [Google Scholar] [CrossRef]
  76. Wang, P.; Zhao, G.; Liu, Q.; Yao, J.; Han, Y. Evolution of the Paleo-Tethys Ocean in Eastern Kunlun, North Tibetan Plateau: From Continental Rift-Drift to Final Closure. Lithos 2022, 422–423, 106717. [Google Scholar] [CrossRef]
  77. Wang, D.; Wang, Z.; Zhou, W.; Zuo, X.; Chen, S. Late Jurassic intraplate extension in southern Central Asian Orogenic Belt: Evidence from Beidashan mafic rocks in Alxa. Acta Petrol. Sin. 2023, 39, 1276–1292. [Google Scholar] [CrossRef]
  78. Molnar, P.; Tapponnier, P. Cenozoic Tectonics of Asia: Effects of a Continental Collision: Features of Recent Continental Tectonics in Asia Can Be Interpreted as Results of the India-Eurasia Collision. Science 1975, 189, 419–426. [Google Scholar] [CrossRef]
  79. Tapponnier, P.; Meyer, B.; Avouac, J.P.; Peltzer, G.; Gaudemer, Y.; Guo, S.; Xiang, H.; Yin, K.; Chen, Z.; Cai, S.; et al. Active Thrusting and Folding in the Qilian Shan, and Decoupling between Upper Crust and Mantle in Northeastern Tibet. Earth Planet. Sci. Lett. 1990, 97, 382–403. [Google Scholar] [CrossRef]
  80. Wang, W.; Zhang, P.; Garzione, C.; Liu, C.; Zhang, Z.; Pang, J.-Z.; Wang, Y.; Zheng, D.; Zheng, W.-J.; Zhang, H. Pulsed Rise and Growth of the Tibetan Plateau to Its Northern Margin since ca. 30 Ma. Proc. Natl. Acad. Sci. USA 2022, 119, e2120364119. [Google Scholar] [CrossRef] [PubMed]
  81. Wang, W.; Zhang, P.; Pang, J.-Z.; Garzione, C.; Zhang, H.; Liu, C.; Zheng, D.; Zheng, W.-J.; Yu, J. The Cenozoic Growth of the Qilian Shan in the Northeastern Tibetan Plateau: A Sedimentary Archive from the Jiuxi Basin. J. Geophys. Res. Solid Earth 2016, 121, 2235–2257. [Google Scholar] [CrossRef]
  82. Zheng, D.; Clark, M.K.; Zhang, P.; Zheng, W.; Farley, K.A. Erosion, Fault Initiation and Topographic Growth of the North Qilian Shan (Northern Tibetan Plateau). Geosphere 2010, 6, 937–941. [Google Scholar] [CrossRef]
  83. Wang, W.; Zheng, D.; Li, C.; Wang, Y.; Zhang, Z.; Pang, J.; Wang, Y.; Yu, J.; Wang, Y.; Zheng, W.; et al. Cenozoic Exhumation of the Qilian Shan in the Northeastern Tibetan Plateau: Evidence from Low-Temperature Thermochronology. Tectonics 2020, 39, e2019TC005705. [Google Scholar] [CrossRef]
  84. Zheng, W.; Zhang, B.; Yuan, D.; Chen, G.; Zhang, Y.; Yu, J.; Zhang, D.; Bi, H.; Liu, B.; Yang, J. Tectonic Activity in the Southern Alashan Block and the Latest Boundary of Outward Expansion on the Northeastern Tibetan Plateau, China. J. Earth Sci. Environ. 2021, 43, 224–236. [Google Scholar] [CrossRef]
Figure 1. Phanerozoic dynamic systems of continental Asia (modified after [11,12,13]). This shows the main suture zones in continental Asia: IT, Indus-Yarlung Tsangpo Suture zone; BN, Bangong-Nujiang Suture zone; JS, Jinsha Suture zone; KS, Kunlun Suture zone; SBASS, South Tianshan-Beishan-Alax-Solonker Suture zone; and MOS, the Mongol-Okhotsk suture zone.
Minerals 14 00143 g001
Figure 2. Distribution of stratigraphic units (a) (modified after [14,20]) and sample collection locations in the Longshou Shan (b) (modified after [20]).
Minerals 14 00143 g002
Figure 3. The stratigraphic contact relationship of the Phanerozoic in the Longshou Shan area (modified after [14,20]). Ord: Ordovician, Sil: Silurian, Devo: Devonian, Carb: Carboniferous, Per: Permian, Jur: Jurassic, Cre: Cretaceous, Neo: Neogene, Q: Quaternary.
Minerals 14 00143 g003
Figure 4. Field photographs of sample collection sites. (a) is the collection site of the LSS-1 sample, which also shows the stratigraphic unconformity between late Paleozoic granite and Neogene Shulehe formation. (b,c) are sample collection sites LSS-4 and LSS-6, respectively.
Minerals 14 00143 g004
Figure 5. Digital elevation model of the study area, on which sampling sites are compiled.
Minerals 14 00143 g005
Figure 6. Electron micrographs of some apatite and zircon minerals. “Z” for zircon and “A” for apatite.
Minerals 14 00143 g006
Figure 7. ZHe date-eU (a) and ZHe date-radius (b) plots for samples collected from the Longshou Shan.
Minerals 14 00143 g007
Figure 8. The left figure shows the thermal history path of the hypothetical region, i.e., the temperature (°C) and time (Ma) forward model. The figure on the right shows the age (Ma) of the individual zircon grains analyzed versus eU (ppm), and the superimposed color curve corresponds to the ZHe-eU trend predicted by the forward modeling thermal history. Different colored lines represent different thermal history path Settings (left) and corresponding forward modeling results (right). (ad) represent different thermal history paths for exploration, respectively. The gray bands represent the zircon Helium partial retention zone (160–200 °C).
Minerals 14 00143 g008
Figure 9. The left figure shows the thermal history path of the hypothetical region, i.e., the temperature (°C) and time (Ma) forward model. The figure on the right shows the age (Ma) of the individual zircon grains analyzed versus eU (ppm), and the superimposed color curve corresponds to the ZHe-eU trend predicted with the forward modeling thermal history. Different colored lines represent different thermal history path Settings (left) and corresponding forward modeling results (right). (ac) represent different thermal history paths for exploration, respectively. The gray bands represent the zircon helium partial retention zone.
Minerals 14 00143 g009
Figure 10. Inverse modeling results of the Longshou Shan samples using synthetic ZHe age. (a) Each black rectangle represents the set constraint box, the green thin line represents the acceptable path, the purple thin line represents the good path, and the best path is represented by the black thick line. The image on the right shows an enlarged view of 60–0 Ma, 200–0 °C. (b) The path with the best inversion output is presented and verified by comparing the forward model of the ZHe-eU curve with the measured value. The yellow dots and black error bars represent the input synthetic grain data, and the blue dots represent the data tested. The black line represents the ZHe-eU curve of the best path with an average grain size (48.03 μm), and the gray area represents the ZHe-eU range with an average grain size of ±2 standard deviations (15 μm).
Minerals 14 00143 g010
Figure 11. QTQt inversion modeling results of the Longshou Shan data (LSS-1/LSS-4/LSS-6 all grains as input). Constraint box only set at 427 ± 10 Ma, 750 ± 50 °C. The different colored lines represent different representations of the results of the inversion simulation. The color of the path area represents the fit with the relative probability.
Minerals 14 00143 g011
Figure 12. QTQt inversion modeling results of LSN-10 data of the Longshou Shan. A constraint box was only set at 700 ± 100 Ma, 20 ± 20 °C. The different colored lines represent different representations of the results of the inversion simulation. The color of the path area represents the fit with the relative probability.
Minerals 14 00143 g012
Figure 13. (ad) Stage tectonic evolution process and far-field effect mechanism (modified after [34,62,64]). PAO, Paleo-Asian Ocean; PTO, Paleo-Tethys Ocean; MTO, Meso-Tethys Ocean; AB, Amuria Block; NCC, North China Craton; QLOB, Qilian Orogenic Belt; KQB, Kunlun-Qaidam Block; QTB, Qiangtang Block; SGB, Songpan-Garze Block; LB, Lhasa Block; IC, Indian Craton. The red arrows represent the stress propagation direction of far-field effect corresponding to each stage.
Minerals 14 00143 g013
Table 1. Information on sample collection sites in the Longshou Shan area.
SampleLithologyLongitudeLatitudeAltitude
ID °E°Nm
LSS-1granite101.613738.64642289
LSS-4granite101.699138.63932397
LSS-6granite101.727538.64032543
LSN-10limestone101.769938.67132831
Table 3. HeFTy inversion input data.
Data TypeAgeError15%eURsUTheU Classification
(Ma)(Ma)ppmμmppmppmppm
ZHe164.6 24.69 322.7 49.05 241.01 347.83 0–500
195.9 29.39 770.2 47.33 601.54 717.84 500–1000
65.5 9.83 1599.4 47.28 1146.79 1926.19 1000–2000
AHe7.0 1.04 6.6 40.23 5.20 6.13 -
Disclaimer/Publisher’s Note: The statements, opinions and data contained in all publications are solely those of the individual author(s) and contributor(s) and not of MDPI and/or the editor(s). MDPI and/or the editor(s) disclaim responsibility for any injury to people or property resulting from any ideas, methods, instructions or products referred to in the content.

