Article

Characteristics of Ore-Forming Fluids and Genesis of the First Mining Area and Eastern Ore Section of the Pulang Porphyry Copper Deposit, Southeastern China: A Comparative Study

1
Yunnan Copper Mineral Resources Exploration and Development Co., Ltd., Kunming 650051, China
2
School of Land and Resources Engineering, Kunming University of Science and Technology, Kunming 650093, China
3
Diqing Nonferrous Metals Co., Ltd., Shangri-La 674400, China
4
Department of Natural Resources and Environment, Southwest United Graduate School, Kunming 650092, China
*
Authors to whom correspondence should be addressed.
Minerals 2024, 14(1), 98; https://doi.org/10.3390/min14010098
Submission received: 10 October 2023 / Revised: 13 January 2024 / Accepted: 14 January 2024 / Published: 16 January 2024
(This article belongs to the Special Issue Advances in Fluid Inclusions and Geofluids)

Abstract

:
The Pulang copper deposit, formed in the Late Triassic, is the largest porphyry Cu-Mo-Au deposit in the eastern Tethys, and its genetic type and mineralization potential have received widespread attention. Identifying the characteristics of ore-forming fluids and the sources of ore-forming materials in the deep and peripheral ore bodies of Pulang is particularly important for constructing a complete porphyry copper mineralization system. Based on detailed core logging and geological observations, this article provides extensive petrographic, fluid inclusion micro-thermometry, laser Raman spectroscopy, and H-O-S isotope data on the veins of the main mineralization stage (B veins) in the first mining area and eastern ore section of the Pulang porphyry copper deposit. The genetic correlation between the eastern ore section and the first mining area is clarified, and their mineralization potential is inferred. The results indicate that the deep vein bodies in the first mining area exhibit multi-stage characteristics, and the fluid in B veins exhibits both high-temperature and salinity characteristics. The magma-derived early ore-forming fluids underwent processes such as boiling and experienced immiscibility during meteoric water mixing, which could be the primary mechanism of the precipitation of Cu, Mo, Au, and other metals. The outer eastern ore section is located in a medium-to-low-temperature hydrothermal mineralization zone far from the mineralization center. This outer eastern ore section is a distant part of the magmatic–hydrothermal system of the first mining area.

1. Introduction

The Pulang deposit is located in the contiguous area between the northwestern Yunnan Province and the western Sichuan Province, China, lying in the Geza island arc in the southern section of the Yidun terrane [1,2], and is the largest Indosinian porphyry copper polymetallic deposit discovered in the area (Figure 1b). The Pulang deposit was first discovered during a cooperative exploration by the Yunnan Geology and Minera Exploration Bureau and the British company Billiton in the 1990s [3,4,5,6], and mining began in November 2017 using the natural block caving method and remote-controlled transportation. With the joint funding of the geological survey projects and the enterprises, the indicated copper resource is 5.11 million tons, with an average grade of 0.42%. It is also accompanied by 113 tons of gold with a grade of 0.18 g/t, and 170,000 tons of molybdenum with a grade of 0.01% [3,4,5,6].
The deposit consists of four sections: the first mining area (~96% of the total ore reserves) and the smaller east, south, and north sections. Previous studies conducted detailed analyses of the porphyritic ore body, such as petrography, geochemistry, ore-controlling structure, alteration, geochronology, ore-forming materials, and fluid sources analyses [9,10,11,12,13,14]. However, an understanding of the characteristics and genesis of the first mining area and surrounding ore bodies remains to be achieved [4,5,6]. It is still debated whether the eastern ore body is a distant part of the magmatic–hydrothermal system of the first mining area or an independent porphyry system [10,11,12].
Based on detailed field geology and diamond drill-hole logging, combined with fluid inclusion and H-O-S stable isotope analysis, this study discusses the correlation between the source and the evolution of ore-forming fluids in the first mining area and the eastern ore section at Pulang, aiming to scientifically and effectively guide the prospecting and exploration of regional porphyry copper deposits.

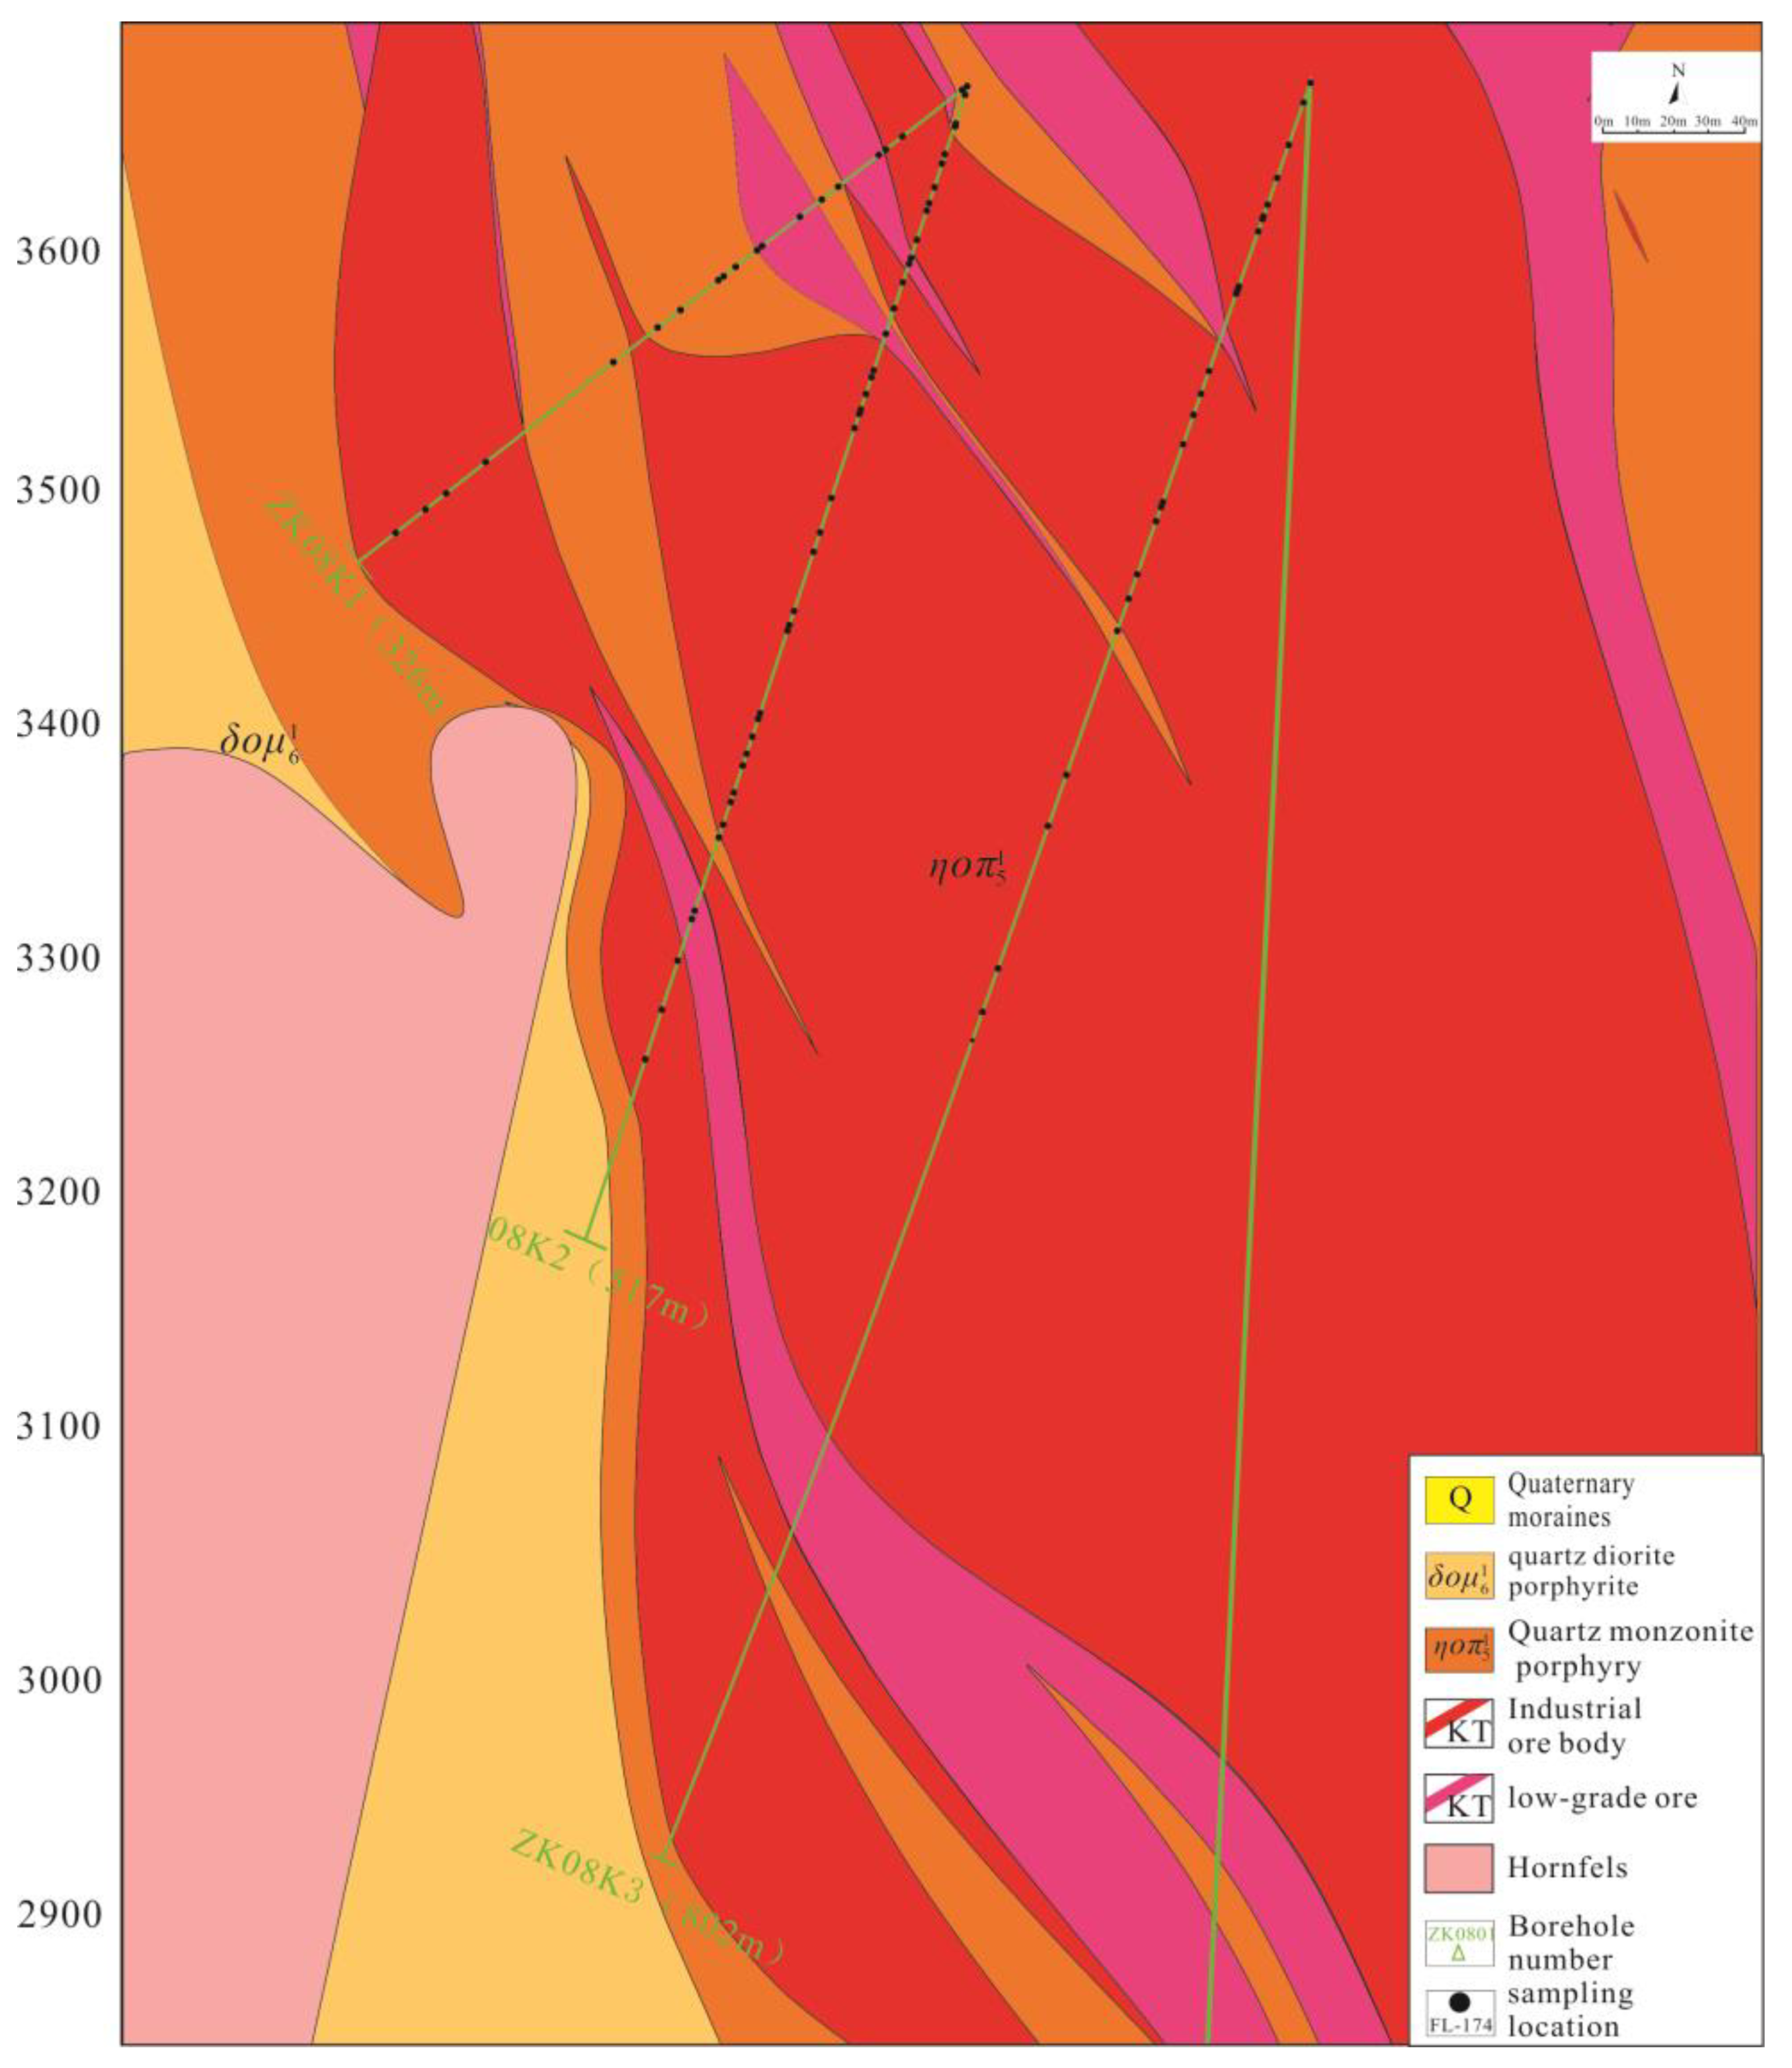
2. Geological Background

The primary exposed strata in the Pulang mining area are the Upper Triassic Tumgou Formation (T3t) and a small number of Quaternary strata (Figure 1b,c). The Tumgou Formation can be divided into two components. The first (T3t1) is distributed in the western section of the F1 fault in the mining area, with an NW trend. The overall trend is northwest, dipping towards SW, with an inclination of 68°~82°. The lithology is gray to dark gray slate, sericite slate, and metamorphic sandstone, with thin layers of limestone locally mixed. The rocks close to the rock bodies are hornfels, formed by thermal metamorphism, with a total thickness of more than 400 m. The second component of the Tumgou Formation (T3t2) is located on the southwest and eastern side of the mining area and is in conformable contact with the underlying of T3t1. The lithology is gray to dark gray slate, silty sericite slate, mixed with metamorphosed sandstone, andesite, etc., with a total thickness of >1000 m. The Quaternary stratum in the area consists mainly of glacial sediments with complex components, including fragments of varying sizes of metasandstone, slate, quartz monzonite porphyry, quartz diorite porphyry, and granite diorite porphyry, with a thickness of 0–74.96 m [7].
The Pulang porphyry complex consists of quartz diorite porphyries (oldest), quartz monzonite porphyries, and diorite porphyry (youngest) emplaced during the Indonesian period. Mineralization and alteration occur together, both consisting of veinlet-disseminated ores at the center of the intrusion. Veined ore bodies occur on the edge of the rock body and in their host rocks (Figure 1c). The classic porphyry-style alteration zonation pattern proposed by Lowell and Guilbert (1970) [15] does not apply to Pulang, in which epidote–chlorite alteration extends from the deposit core outward and has a strongly overprinted early potassic alteration [4,5,6]. The unusual pattern observed at Pulang may be attributed to fluids from a nearby porphyry deposit that overprinted an epidote–chlorite alteration onto a pre-existing copper mineralization and potassic alteration at Pulang. Alternatively, it could be the result of the collapse of epidote–chlorite stable fluids into the potassic-altered core during the waning hydrothermal activity [4,5,6].
The KT1 ore body in the first mining area is composed of quartz diorite porphyries, quartz monzonite porphyries, and granodiorite porphyries and occurs in the form of stocks, with an outcrop area of 6.53 km2. This orebody is in the form of a large lens. It lies along a NW trend, with a N–S length of 1760 m and widths of 500–620 m, 170–490 m, and 560–700 m, respectively, in their northern, central, and southern parts. The alteration types of this orebody mainly include potassic alteration and silicic alteration, followed by sericite alteration and albite alteration, with clay, chlorite, and saussurite alterations occurring locally. Sulfides broadly occurr in the former two zones, and the surrounding rocks in the outer contact zone feature hornfelization and irregularly dispersed pyrite (pyritization). The orebody KT1 controls 1425.89 million tons of ores and 4.82 million tons of metals, with an average grade of 0.34%.
A total of 15 large-veined copper ore bodies have been delineated in the eastern ore section of the deposit, mainly occurring in quartz diorite porphyries at the edge of the intrusion, with a few of them extending into the hornfels. The KT4, KT5, KT6, and KT19 orebodies are relatively large in size and are controlled by a series of near-EW trending joint–fault structures.

3. Hydrothermal Veinlets and Their Petrographic Characteristics

Different degrees of silicic alteration lead to the presence of extensive irregular quartz veinlets accompanied by the occurrence of sulfides (Figure 2a–f and Figure 3a–f). In this work, the first mining area and the eastern ore bodies of the Pulang porphyry copper deposit were divided into A-type veins (early mineralization stage), B-type veins (main mineralization stage), and D-type veins (late-mineralization stage), as documented by Gustafson and Hunt (1975) [16].
A-type veins are mainly related to potassic alteration (Figure 2a,f). Sulfides, such as pyrite and chalcopyrite, occur in clusters. B-type veins are closely related to potassic and epidote–chlorite alterations and could be produced at various depths. Pyrite and chalcopyrite are primarily formed in disseminated or clustered formations (Figure 2b–e and Figure 3a–d); molybdenite and pyrrhotite are mainly produced as fine veins or in disseminated style (Figure 2g–l). D-type veins may contain minor sulfides, but their overall mineralization is weak (Figure 2b,g and Figure 3e,f).

4. Sampling and Analytical Methods

The samples used to study fluid inclusions and stable isotopes in this article were taken from the deep-drill cores of the first mining area and the eastern ore section of the Pulang mining area (Figure 4). The samples included quartz diorite and quartz monzonite porphyry, involving quartz veins with different alteration types and sulfides. The main focus of the study was on comparing the characteristics of the ore-forming fluids in the main mineralization stage that formed in the first mining area and the eastern ore section of the Pulang deposit. Therefore, mainly B-type veins with potassic and epidote–chlorite alterations were selected for this investigation.

4.1. SEM-CL

The SEM-Cl analysis of quartz veins was completed at the Nanjing Hongchuang Geological Exploration Technology Service Co., Ltd. (Nanjing, China) using the TESCANMI-RA3LMH field-emission scanning electron microscope. Prior to the analysis, thin sections were coated with carbon. When capturing cathodeluminescence images, the acceleration voltage and current were set to 25 kV and 1.2 nA, respectively.

4.2. Microthermometry of Fluid Inclusions

Fluid inclusion microthermetric measurement was conducted at the Fluid Inclusion Laboratory of the School of Land and Resource Engineering at Kunming University of Science and Technology. The measurements were carried out using a LinkamTHMS600 heating/cooling stage (London, UK) in a temperature range from −195 to +600 °C. To ensure accuracy, we calibrated the stage by determining the melting points of various substances. These included pure water inclusions (0 °C), pure CO2 inclusions (−56.6 °C), and potassium bichromate (398 °C). The measured temperatures showed a precision of approximately ±0.2 °C during the cooling process and of roughly ±2 °C between 100 and 600 °C. The salinity of NaCl-H2O inclusions was determined from the final melting temperature of ice [17], while the salinity of CO2-bearing fluid inclusions was calculated from the melting temperatures of clathrates [18].

4.3. Laser Raman Spectroscopy Analysis

Laser Raman spectroscopy analysis was performed on fluid inclusions in the same laboratory. We used an Renishaw InVia-Reflex micro-confocal laser Raman spectrometer (London, UK) with a Spectra-Physics argon ion laser as the light source. The excitation wavelength used was 514 nm, with a minimum laser power of 20 mW. The spatial resolution was 1–2 μm, and the integration time was normally set to 180 s. The spectra were measured between 100 and 4000 cm−1.

4.4. Stable Isotope Analysis

Hydrogen and oxygen isotopic analyses were conducted at the Beijing Research Institute of Uranium Geology using a Finnigan MAT-253 mass spectrometer (San Jose, CA, USA). Oxygen gas was generated from the samples through a quantitative reaction with BrF5 in nickel vessels heated externally. The precision of the analyses was ±0.2‰ for δ18O and ±2‰ for δD. For detailed analysis and calculation methods, please refer to Zheng (1993) [19].
In situ sulfur isotope analysis was conducted at the GPMR laboratory of the China University of Geosciences (Wuhan, China), using a multi-receiver inductively coupled plasma mass spectrometer (MC-ICPMS) (Waltham, MA, USA) equipped with an S-155 Ar-F laser ablation system. The laser energy used was 3 J/cm2, with a spot diameter of 33 μm. During the analysis, we used natural pyrite WS-1 (with a δ34SV-CDT value of 1.1 ± 0.2‰) to calibrate the deviation, and CDT (Canyon Diablo Troilite) as a standard (δ34S) to adjust the data [5,6].

5. Results

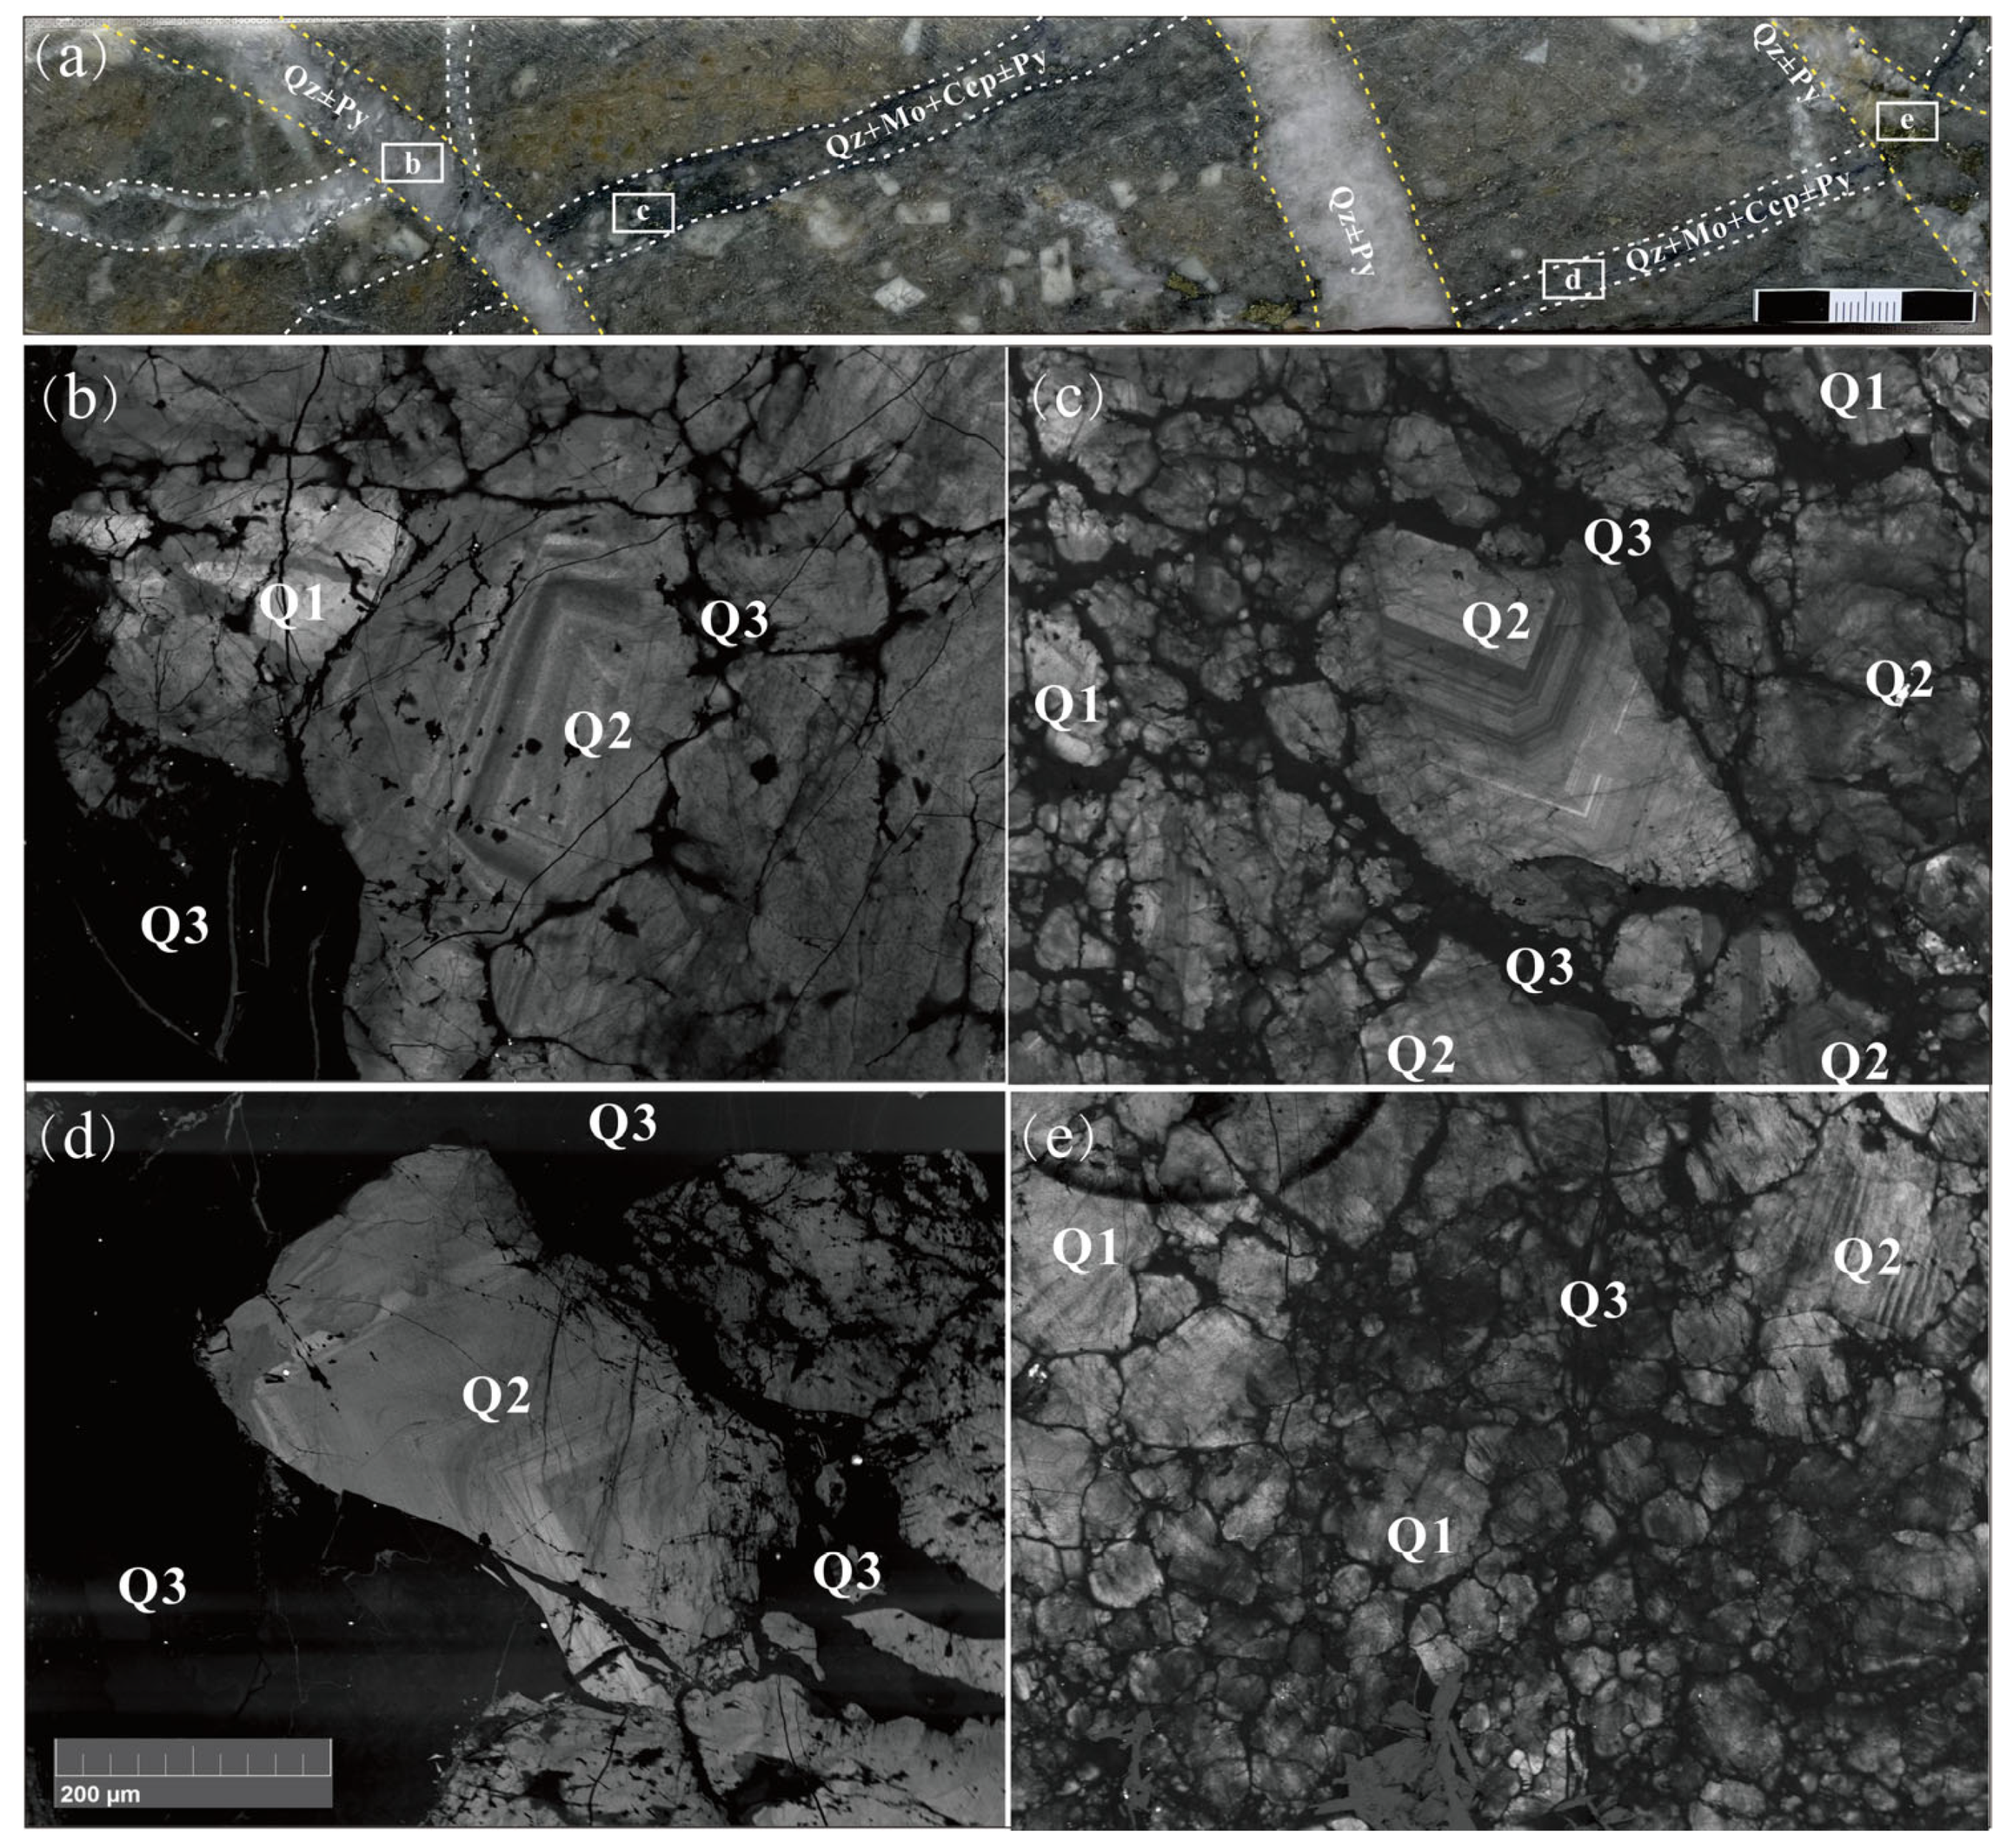
5.1. SEM-CL of Quartz Veins

The SEM-CL (Scanning Electron Microscopy Cathodoluminescence) imaging technology can reveal structural differences in quartz formed in different geological environments. Brightness differences and interrelationships can be used to identify hydrothermal quartz vein generations.
Based on the SEM-CL images of quartz veins, quartz in the hydrothermal veinlets of the first mining area and the eastern ore section of the Pulang deposit could be classified into three types: Q1 (early stage), Q2 (main stage), and Q3 (late stage). In the early Q1 stage, quartz appeared granular or irregularly elliptical in shape. It appeared bright gray under SEM-CL and was densely interlaced and arranged. It was also surrounded by late-stage quartz as a core (see Figure 5b,c). During the Q2 stage, quartz exhibited a mostly subhedral morphology and significant oscillatory bands (see Figure 5b,c). This suggests that there was strong hydrothermal activity and periodic changes in fluid composition. The main-stage quartz vein (Q2) appeared to be closely associated with various sulphides, and this type of quartz vein is the most studied in fluid inclusion investigations. Under SEM-CL, quartz in the Q3 stage exhibited the darkest brightness and was frequently filled with irregular veins in the microcracks of early fractures. We believe that the quartz in the Q3 stage was formed during the latest period (Figure 5b–e).

5.2. Petrographic Characteristics of Fluid Inclusions

Based on the SEM-CL images and phase characteristics at room temperature, fluid inclusions in these veins could be divided into L-type inclusions (liquid-rich two-phase inclusions), V-type inclusions (vapor-rich gas two-phase inclusions), S-type inclusions (mineral-bearing multi-phase inclusions), and C-type inclusions (CO2-bearing three-phase inclusions). Their characteristics are as follows (Figure 6):
L-type inclusions (liquid-rich two-phase inclusions) mainly showed elliptical, quasi-elliptical, and irregular shapes. Their size ranged from 4 to 30 μm and, for most of them, appeared to be in the range of 7–15 μm. The gas/liquid ratio was mainly 5%–10%, with very few inclusions reaching 30%–50% (Figure 6a,c). L-type inclusions are commonly found in both the first mining area and the eastern ore section, and their frequency is often higher than that of other types of inclusions, which makes them the predominant type of inclusion.
V-type inclusions (vapor-rich two-phase inclusions) appeared to be relatively rare in various types of veins in the first mining area and eastern ore section and mostly showed elliptical and quasi-elliptical shapes. Some appeared irregular in form, with sizes concentrated in the range of 5–10 μm. The gas/liquid ratio was generally above 70% (Figure 6b).
S-type inclusions (mineral-bearing multi-phase inclusions) appeared developed in both the first mining area and the eastern ore section and showed mainly elliptical and irregular shapes, with sizes concentrated in the range of 4–25 µm and gas/liquid ratios primarily from 5 to 40%. The daughter mineral was mostly NaCl, with a small amount of KCl. The NaCl crystals were characterized by a fine shape and appeared as large cubes, while the KCl crystals were slightly circular and relatively small (Figure 6d–f). A small number of orange–red metallic minerals (Figure 6f) were also found in the inclusions (S-type) of daughter minerals in quartz–pyrite veins and quartz–pyrite–chalcopyrite–molybdenite veins, which were later identified as chalcopyrite using Raman spectroscopy.
C-type inclusions (CO2-bearing three-phase inclusions) appeared to be mainly elliptical and quasi-elliptical in shape, with sizes ranging from 7 to 30 μm, primarily concentrated in the range of 7–15 μm. The proportion of CO2 gas phase was mostly 5%–10%, with very few CO2 gas phases accounting for more than 50%. C-type inclusions were only visible in pyrite–chalcopyrite–quartz veins, while other quartz veins did not contain C-type inclusions. Most high-density C-type inclusions exhibited three-phase features of a “double eyelid”. A few cases with low CO2 density only showed two phases, and after Raman identification, it was found that the gas phase contained a certain amount of CO2 (Figure 6g–i). This study only found many C-type inclusions in the first mining area, while CO2 was found in the eastern ore section.

5.3. Microthermometry

The detailed microthermometry results are listed in Table 1 and Figure 5. According to the types of inclusions, they can be described as follows:
(1)
L-type fluid inclusions. In the first mining area, the homogenization temperature range for this type of inclusion is 157.3–350.0 °C, with an average of 245.2 °C. These inclusions were found to mainly homogenize to the liquid phase. The freezing point ranges from −21.3 to −2.1 °C, with an average of −13.8 °C, corresponding to a salinity range of 4.5 to 23.2 wt%, with an average value of 16.8 wt% NaCleqv. The homogenization temperature range of this type of inclusion in the eastern ore section appeared to be 160.7–31.3 °C, with an average of 238.8 °C. The salinity of the inclusions was found to be concentrated at 1.9–18.8 wt%, with an average of 11.1 wt% NaCleqv.
(2)
V-type inclusions. The homogenization temperature range of this type of inclusion in the first mining area is 257.9–325.6 °C, with an average of 295.8 °C, and they appeared mainly homogenized to the vapor phase. The freezing point range is from −5.6 to −2.1 °C, with an average value of −3.6 °C. The corresponding salinity ranges from 3.6 to 8.7 wt%, with an average of 5.8 wt% NaCleqv. The homogenization temperature range of this type of inclusion in the eastern ore section is 253.7–298.3 °C, with an average of 265.0 °C. The salinity of the inclusion appeared concentrated between 2.1 and 5.6 wt%, with an average of 4.5 wt% NaCleqv.
(3)
S-type inclusions. The homogenization temperature range of this type of inclusion in the first mining area is 318.0–440.8 °C, with an average value of 369.4 °C. The main daughter mineral is NaCl, with a melting temperature range of 307.6–413.6 °C and an average of 343.3 °C. The corresponding inclusion salinity is 35.2–48.7 wt%, with an average of 42.0 wt% NaCleqv. During the measurements, bubbles disappeared before daughter crystals in some S-type inclusions, indicating a non-homogeneous capture. The homogenization temperature range of this type of inclusion in the eastern ore section is between 300.5 °C and 365.6 °C, with an average of 336.3 °C. The salinity range is 36.3–42.7 wt%, with an average value of 37.4 wt% NaCleqv.
(4)
C-type inclusions were only visible in veins in the first mining area, with a three-phase temperature range from −61.7 to −56.2 °C, with an average of −58.6 °C, indicating the presence of other vapor phases in these inclusions. The temperature range for the disappearance of CO2 clathrate is 0.8–5.9 °C, with an average value of 3.3 °C. The corresponding aqueous salinity is 7.5–14.6 wt%, with an average value of 11.3 wt% NaCleqv. The partial homogenization temperature range is 23.4–28.6 °C, with an average value of 26.6 °C. The complete homogenization temperature range is 262.2–325.9 °C, with an average of 295.9 °C (Figure 7). During the measurements, some C-type inclusions exploded before they were completely homogeneous, indicating a high internal pressure.

5.4. Raman Analysis Results

Laser Raman spectroscopy analysis (Figure 8) indicated that the vapor and liquid components of the L-type fluid inclusions at Pulang consist mainly of H2O. The vapor composition of the V-type inclusions primarily include H2O and CO2 (1387 cm−1). The vapor phase of the C-type inclusions is mainly CO2 (1284 cm−1 and 1387 cm−1), with a certain amount of CH4 (2917 cm−1), and the liquid phase composition is liquid H2O.

5.5. H-O-S Isotope Characteristics

The H-O isotope compositions of the Pulang porphyry copper deposit are listed in Table 2 and Figure 9. The inclusions in A veins such as pyrite–quartz veins and quartz–chalcopyrite veins with potassic alteration showed a δD value in the range from −88.1 to −86‰ and δ18O variation in the range from 11.5 to 17‰ [20]. In the main mineralization stage (B vein) of the first mining area, δD ranged from −110.6 to −83.7‰, with an average value of −96.4‰. The value of δ18O was between 7.11 and 14.5‰, with an average value of 12.3‰. The δD value for B veins in the eastern ore section ranged from −87.7 to −83.6‰, with an average value of −85.1‰. The δ18O value was between 8.8 and 13.2‰, with an average value of 11.4‰. The δD value for D veins with potassic and chlorite–epidote alterations in quartz monzonite was −83.9‰, while the δ18O value was 13.2‰ [20].
Representative sulfides were chosen for in situ sulfur isotope analysis to investigate the origin of ore-forming materials of the Pulang deposit. The results are shown in Table 3 and Figure 10. The sulfur isotope composition of the ore minerals in the first mining area and the eastern ore section appeared to be relatively homogenous. In the first mining area, the δ34S ranged from 2.4 to 5.3‰, with an average value of 4.0‰. In the eastern ore section, the δ34S ranged from 2.7 to 4.1‰, with an average value of 3.3‰. The average value of δ34S of chalcopyrite in the first mining area was 3.6‰, and the δ34S of pyrrhotite was 5.1‰. In the east ore section, the average value of δ34S of chalcopyrite was 2.7‰, and the δ34S of pyrrhotite was 3.4‰.

6. Discussion

6.1. Nature and Evolution of the Ore-Forming Fluids

Numerous fluid inclusions appeared developed in the quartz sulfide veins (B veins) at Pulang, including L-type, V-type, S-type, and C-type inclusions. C-type inclusions appeared typical in the first mining area but poorly developed in the eastern ore zone. The homogenization temperature and salinity range of the ore-forming fluid in the first mining area were found to be slightly higher than those in the eastern ore section (as shown in Table 4). This high-temperature and high-salinity fluid dissolved from magma in the early stage, and under high pressure, the fluid invaded the fractures, causing a decrease in the fluid pressure and temperature. A temperature reduction is the most critical mechanism for metal precipitation [4,5,6].
Laser Raman spectroscopy analysis found high-density CO2 in the vapor phase of L-type and S-type inclusions in the first mining area, as well as a certain amount of CH4, indicating that the ore-forming fluid in the first mining area belongs to the NaCl-H2O-CO2 ± CH4 system. However, no CO2 was found in the eastern ore section, indicating that, there, the ore-forming fluid belongs to the NaCl-H2O ± CH4 system. During the magmatic–hydrothermal evolution, there may have been contamination with carbonaceous layers, providing sufficient carbon for reducing fluids rich in CH4 [6,20,23,24,25].
The δD-δ18O diagram (Figure 9) shows that four values for the A vein are within the range of the gold–copper series magmatic water, and two values are to the left of this range. Most of the B vein data are projected to the left of the gold–copper series magmatic water, close to the meteoric water line. The data from the D vein appear located to the left of the meteoric water line. Overall, this shows that ore-forming fluids in early mineralization (A veins) and main mineralization (B veins) mainly derived from magmatic–hydrothermal fluids. Atmospheric precipitation might also have been involved in the late stage of mineralization.
Furthermore, the first mining area and the eastern ore section of Pulang copper mine showed δ34Spyrrhotite > δ34Schalcopyrite. These characteristics are consistent with the enrichment sequence of 34S during the sulfide crystallization process [26], indicating that sulfur isotope fractionation reached equilibrium during the sulfide precipitation process at Pulang. Figure 8 suggests that the sulfur source of the deposit is consistent with that of a typical porphyry copper deposit, with a relatively uniform sulfur source. It is inferred that its sulfur isotopes mainly derived from deep magma in the upper mantle or lower crust and are not contaminated by upper crust sediments.

6.2. Fluid Boiling and Metal Precipitation

In the first mining area of the Pulang porphyry copper deposit, evidence suggests that fluid boiling occurred in the ore Qtz-Ccp-Mo-Py veins. This is supported by the coexistence of V- and S-type inclusions, with similar homogenization temperatures but contrasting salinities (Figure 7). The V-type inclusions homogenize to the vapor phase, while the S-type inclusions homogenize to the liquid phase.
Pervasive fluid boiling in porphyry systems can cause hydraulic fracturing of wall rocks, creating pathways for the influx of meteoric water [27,28,29,30]. This mixing of magmatic fluid with low-temperature and low-salinity meteoric water is evident in our data (Figure 7). As a result of this mixing, there were reductions in temperature, salinity, fO2, fH2S, and SO 4 2 and an increase in fS2− [31]. These changes led to the precipitation of sulfide minerals in hydrothermal fractures and stockwork veins. The exsolution of volatile components from ore-forming fluids further promotes the enrichment of metals in the fluids [32,33]. CO2 degassing also plays a role in the precipitation of sulfide in hydrothermal systems [34,35].
Based on our findings, we conclude that fluid boiling and subsequent mixing with cooler meteoric water was likely the main mechanism of metal precipitation at the first mining area of the Pulang porphyry Cu(Mo) deposit. However, we found minimal evidence of fluid boiling in the hydrothermal veins at various mineralization stages in the eastern ore section. As mentioned earlier, the ore-forming fluid in the eastern ore section is a NaCl-H2O ± CH4 system, and the low content of volatile components such as CO2 may be an essential reason for the fluid’s failure to boil.

6.3. Implications for Ore Genesis

Zircon U-Pb dating indicated that the quartz–diorite porphyry in the eastern periphery and the diorite porphyry in the first mining area originated from contemporary magmatic activity and evolution stage [11,36,37,38]. Petrological and geochemical studies showed [11] that the sequence of porphyry magmatic activity in the first mining area is complete, with not only early-stage diorite porphyry (216.5 ± 1.5 Ma, [5,6]) but also, more importantly, late-stage quartz monzonite (215.5 ± 1.4 Ma, [5,6]) closely associated with mineralization, providing favorable conditions for the formation of porphyry deposits (Figure 11). The first mining area is the main mineralization center of the Pulang mining area. However, in the eastern ore section, only the marginal facies of early-stage diorite porphyrite appeared developed. Also the alteration appeared simple, mainly consisting of sericite and propylitization, without potassic alteration.
Combined with the fluid inclusions and stable isotope data, it was concluded that the peripheral eastern ore zone is located in a zone of medium-to-low-temperature hydrothermal mineralization far from the center and is a distant part of the magmatic–hydrothermal system of the first mining area. The prospects for deep porphyry deposits in this area are poor.

7. Conclusions

(1)
The ore-forming fluid of the main mineralization stage of the Pulang porphyry copper deposit appeared characterized by both high temperature and high salinity. Early ore-forming fluids were mainly derived from dissolved magmatic fluids, later undergoing processes such as boiling and mixing. The homogenization temperature and salinity in the first mining area appeared slightly higher than in the eastern ore section.
(2)
Fluid boiling and subsequent meteoric water mixing resulting in significant cooling were probably the main mechanisms of metal precipitation in the first mining area of the Pulang porphyry Cu(Mo) deposit. The low content of CO2 may be an essential reason for the fluid’s failure to boil in the eastern ore section.
(3)
Based on the mineralization characteristics, ore and alteration mineral assemblages, fluid inclusions, and H-O-S isotopic data, the eastern ore section on the periphery of the Pulang mining area is located in a medium-to-low-temperature zone, far from the mineralization center. It is a distant extension of the magmatic–hydrothermal system of the first mining area, and both are part of the same intrusive body.

Author Contributions

Methodology, F.Y., L.W. and T.R.; Formal analysis, T.R.; Investigation, S.L., Z.L. and L.W.; Resources, Z.L. and F.Y.; Data curation, S.L., Z.L., L.W. and T.R.; Writing—original draft, D.H.; Writing—review & editing, S.G. and Y.S. All authors have read and agreed to the published version of the manuscript.

Funding

This research was funded by “Comprehensive research project on metallogenic mechanisms and prospecting in the deep margin of the Pulang copper mining area”, and the grant number is 0120-ZB21703.

Data Availability Statement

All data generated or used during the study appear in the submitted article.

Conflicts of Interest

Authors Dengpan Hu and Fan Yang are employed by the company Yunnan Copper Mineral Resources Exploration and Development Co., Ltd. Authors Yan Su and Zhipeng Li are employed by the company Diqing Nonferrous Metals Co., Ltd. The remaining authors declare that the research was conducted in the absence of any commercial or financial relationships that could be construed as a potential conflict of interest.

References

  1. Mo, X.X.; Lu, F.X.; Shen, S.Y.; Zhu, Q.W.; Hou, Z.Q.; Yang, K.H.; Deng, J.F.; Liu, X.P.; He, C.X.; Lin, P.Y.; et al. ‘Sanjiang’ Tethys Volcanism and Mineralization; Geology Press: Beijing, China, 1993; pp. 58–64. [Google Scholar]
  2. Zeng, P.S.; Mo, X.X.; Yu, X.H.; Hou, Z.Q.; Xu, Q.D.; Wang, H.P.; Li, H.; Yang, C.Z. Porphyries and Porphyry Copper Deposits in Zhongdian Area, Northwestern Yunnan. Miner. Depos. 2003, 4, 393–400. [Google Scholar] [CrossRef]
  3. Li, W.C.; Yin, G.H.; Lu, Y.X.; Liu, X.L.; Xu, D.; Zhang, S.Q.; Zhang, N. The Evolution and 40Ar-39Ar Isotopic Evidence of the Pulang Complex in Zhongdian. Acta Geol. Sin. 2009, 83, 1421–1429. [Google Scholar] [CrossRef]
  4. Cao, K.; Xu, J.; Chen, J.; Huang, X.; Ren, J. Origin of porphyry intrusions hosting superlarge Pulang porphyry copper deposit in Yunnan Province: Implications for metallogenesis. Miner. Depos. 2014, 33, 307–322. [Google Scholar] [CrossRef]
  5. Cao, K.; Yang, Z.M.; Mavrogenes, J.; White, N.C.; Xu, J.F.; Li, Y. Geology and Genesis of the Giant Pulang Porphyry Cu-Au District, Yunnan, Southwest China. Econ. Geol. 2019, 114, 275–301. [Google Scholar] [CrossRef]
  6. Cao, K.; Yang, Z.M.; White, N.C.; Hou, Z.Q. Generation of the Giant Porphyry Cu-Au Deposit by Repeated Recharge of Mafic Magmas at Pulang in Eastern Tibet. Econ. Geol. 2022, 117, 57–90. [Google Scholar] [CrossRef]
  7. Li, W.C.; Yin, G.H.; Yu, H.J.; Xue, S.R.; Wang, K.Y.; Wang, C.Y.; Wang, W.X. Characteristics of the Ore-Forming Fluid and Genesis of the Pulang Copper Deposit in Yunnan Province. J. Jilin Univ. Earth Sci. Ed. 2013, 43, 1436–1447. [Google Scholar]
  8. Kunming Prospecting Design Institute of China Nonferrous Metals Industry (KPDI). Exploration Report of Pulang Copper Deposit; Yunnan Diqing Nonferrous Metal Co., Ltd.: Shangri-La, China, 2014; 251p. [Google Scholar]
  9. Zeng, P.S.; Li, W.C.; Wang, H.P.; Li, H. The Indosinian Pulang superlarge porphyry copper deposit in Yunnan, China: Petrology and chronology. Acta Petrol. Sin. 2006, 22, 989–1000. [Google Scholar] [CrossRef]
  10. Wang, K.; Jian, R.T.; Li, F.; Sun, Y.H.; Yang, T.; Li, F.R. Geological Characteristics and Prospecting of the Periphery Porphyry Copper Deposit in Pulang Area. Nonferrous Met. Min. Sect. 2016, 68, 40–44, (In Chinese with an English Abstract). [Google Scholar]
  11. Zhou, X.D.; Yang, F.; Wu, J.; Li, F.; Jian, R.T. A Study on Petrological and Geochemical Characteristics of the Porphyry Bodies in the Eastern Periphery of the Pulang Porphyry Copper Deposit, Yunnan. Bull. Mineral. Petrol. Geochem. 2018, 37, 731–740, (In Chinese with an English Abstract). [Google Scholar]
  12. Xia, Q.; Li, T.; Kang, L.; Leng, S.; Wang, X. Study on the PTX Parameters and Fractal Characteristics of Ore-Forming Fluids in the East Ore Section of the Pulang Copper Deposit, Southwest China. J. Earth Sci. 2021, 32, 390–407. [Google Scholar] [CrossRef]
  13. Li, W.C.; Yin, G.H.; Yu, H.J.; Lu, Y.X.; Liu, X.L. The porphyry metallogenesis of Geza volcanic magmatic arc in NW Yunnan. Acta Petrol. Sin. 2011, 27, 2541–2552. [Google Scholar]
  14. Wang, S.X.; Zhang, X.C.; Leng, C.B.; Qin, C.J. A tentative study of ore geochemistry and ore-forming mechanism of Pulang porphyry copper deposit in Zhongdian, northwestern Yunnan. Miner. Depos. 2007, 3, 277–288. [Google Scholar]
  15. Lowell, J.D.; Gumbert, J.M. Lateral and vertical alterationmineralization zoning in porphyry ore deposits. Econ. Geol. 1970, 65, 373–408. [Google Scholar] [CrossRef]
  16. Gustafson, L.B.; Hunt, J.P. The porphyry copper deposit at El Salvador, Chile. Econ. Geol. 1975, 70, 857–912. [Google Scholar] [CrossRef]
  17. Bodnar, R.J. Revised equation and table for determining the freezing point depression of H2O-NaCl solutions. Geochim. Cosmochim. Acta 1993, 57, 683–684. [Google Scholar] [CrossRef]
  18. Collins, P.L.F. Gas hydrates in CO2-bearing fluid inclusions and the use of freezing data for estimation of salinity. Econ. Geol. 1979, 74, 1434–1444. [Google Scholar] [CrossRef]
  19. Zheng, Y.F. Calculation of oxygen isotope fractionation in anhydrous silicate minerals. Geochim. Cosmochim. Acta 1993, 57, 1079–1091. [Google Scholar] [CrossRef]
  20. Yang, Z. Late Triassic Mineralization of the Porphyry Copper Deposits in Yidun Arc, Southwest China. Ph.D. Thesis, China University of Geosciences, Beijing, China, 2017. [Google Scholar]
  21. Zhang, C.Z. Study on the Fluid Characteristics and Ore-Forming Material Sources of the Peripheral Ore Bodies of Pulang Porphyry Copper Deposit in Northwest Yunnan. Master’s Thesis, Kunming University of Science and Technology, Kunming, China, 2020. [Google Scholar]
  22. Liu, J.T. Late-Trassic Cu Mineralization in Porphyry Environment, Northwest Yunnan, China. Ph.D. Thesis, China University of Geosciences, Beijing, China, 2014. [Google Scholar]
  23. Cao, M.J.; Qin, K.Z.; Li, G.M.; Jin, L.Y.; Noreen, J.E.; Yang, X.R. Baogutu: An example of reduced porphyry Cu deposit in western Junggar. Ore Geol. Rev. 2014, 56, 159–180. [Google Scholar] [CrossRef]
  24. Rowins, S.M. Reduced porphyry copper-gold deposits: A new variation on an old theme. Geology 2000, 28, 491. [Google Scholar] [CrossRef]
  25. Yang, X.H. Metallogenic Regularity, Exploration and Evaluation of Porphyry Copper Deposits in Zhongdian Area, Yunnan. Master’s Thesis, China University of Geosciences, Beijing, China, 2010. [Google Scholar]
  26. Zheng, Y.F.; Xu, B.L.; Zhou, G.T. Geochemical studies of stable isotopes in minerals. Earth Sci. Front. 2000, 2, 299–320. [Google Scholar] [CrossRef]
  27. Drummond, S.E.; Ohmoto, H. Chemical evolution and mineral deposition in boiling hydrothermal systems. Econ. Geol. 1985, 80, 126–147. [Google Scholar] [CrossRef]
  28. Fournier, R.O. Hydrothermal processes related to movement of fluid from plastic into brittle rock in the magmatic-epithermal environment. Econ. Geol. 1999, 94, 1193–1211. [Google Scholar] [CrossRef]
  29. Simmons, S.F.; Brown, K.L. The flux of gold and related metals through a volcanic arc, Taupo Volcanic Zone, New Zealand. Geology 2007, 35, 1099–1102. [Google Scholar] [CrossRef]
  30. Zhu, J.J.; Hu, R.Z.; Richards, J.P.; Bi, X.W.; Zhong, H. Genesis and Magmatic-Hydrothermal Evolution of the Yangla Skarn Cu Deposit, Southwest China. Econ. Geol. 2015, 110, 631–652. [Google Scholar] [CrossRef]
  31. Muntean, J.L.; Einaudi, M.T. Porphyry gold deposits of the Refugio district, Maricunga belt, northern Chile. Econ. Geol. 2001, 95, 1445–1472. [Google Scholar] [CrossRef]
  32. Bowers, T.S.; Helgeson, H.C. Calculation of the thermodynamic and geochemical consequences of nonideal mixing in the system H2O-CO2-NaCl on phase relations in geologic systems: Equation of state for H2O-CO2-NaCl fluids at high pressures and temperatures. Geochim. Cosmochim. Acta 1983, 47, 1247–1275. [Google Scholar] [CrossRef]
  33. Harris, A.C.; Kamenetsky, V.S.; White, N.C.; Achterbergh, E.V.; Ryan, C.G. Melt inclusions in veins: Linking magmas and porphyry Cu deposits. Science 2003, 302, 2109–2111. [Google Scholar] [CrossRef]
  34. Gammons, G.H.; Williams-Jones, A.E. Chemical mobility of gold in the porphyry epithermal environment. Econ. Geol. 1997, 92, 45–59. [Google Scholar] [CrossRef]
  35. Robb, L. Introduction to Ore-Forming Processes; Blackwell Publishing: London, UK, 2005. [Google Scholar] [CrossRef]
  36. Liu, X.L. Study on Geochemical Characteristics of Magmatic Rocks and Porphyry Copper Mineralization in Zhongdian Island Arc; Kunming University of Science and Technology: Kunming, China, 2009. [Google Scholar]
  37. Li, W.C.; Liu, X.L.; Zeng, P.S.; Yin, G.H. The characteristics of metallogenic rocks in the Pulang porphyry copper deposit of Yunnan Province. Geol. China 2011, 38, 403–414. [Google Scholar] [CrossRef]
  38. Liu, X.L. The Research on Porphyry Copper Metallogenic System and Post-Ore Modification & Preservation Since the in Dosinian in Geza Are, Yunnan, SW China. Ph.D. Thesis, China University of Geosciences, Beijing, China, 2010. [Google Scholar]
  39. Yang, Q.; Ren, Y.S.; Chen, S.B.; Zhang, G.L.; Zeng, Q.H.; Hao, Y.J.; Li, J.M.; Yang, Z.J.; Sun, X.H.; Sun, Z.M. Geological, Geochronological, and Geochemical Insights into the Formation of the Giant Pulang Porphyry Cu (-Mo-Au) Deposit in Northwestern Yunnan Province, SW China. Minerals 2019, 9, 191. [Google Scholar] [CrossRef]
Figure 1. Geological map of the Pulang mining area [7,8]. (a) Plate tectonic framework of the Chinese mainland; (b) geological structure of the Zhongdian arc; (c) geological map of the Pulang porphyry Cu deposit; and (d) geological map of the first mining area and east ore section of the Pulang porphyry Cu deposit.
Minerals 14 00098 g001
Figure 2. Photographs and photomicrographs under reflected light showing typical alterations and related hydrothermal veins in the first mining area of Pulang. (a) An early barren quartz vein (A vein) is cut by a later Qtz-Ccp vein (A vein) in quartz monzonite; (b) a late-stage calcite vein (D vein) cuts through an early Qz-Py-Ccp vein (B vein) in quartz diorite; (c) a Qtz-Mol-Ccp-Py vein (B vein) with selectively pervasive epidote in quartz monzonite; (d) a Qz-Po±Py vein (B vein) in quartz diorite; (e) intergrown chalcopyrite, pyrite, and pyrrhotite with epidote selectively in quartz monzonite; (f) a Qz±Py vein (A vein) with epidote and chlorite in quartz monzonite; (g,h) disseminated pyrite and chalcopyrite in the early stage A vein; (i) laminated molybdenite in the Qz-Mol ± Py vein (B vein); (jl) intergrown chalcopyrite, pyrite, molybdenite, and pyrrhotite in quartz monzonite. Abbreviations: Ccp = chalcopyrite, Mo = molybdenite, Po = pyrrhotite, Py = pyrite, Cal = calcite, Kfs = K-feldspar, Chl = chlorite, Ep = epidote, Bt = biotite, Qz = quartz.
Minerals 14 00098 g002
Figure 3. Photographs and photomicrographs under reflected light showing typical alterations and related hydrothermal veins in the eastern ore section of Pulang. (ac) The Qz-Mol-Ccp ± Py veins (B vein) in quartz diorite; (d) a Qz-Mol-Ccp vein (B vein) with epidote and chlorite in quartz diorite; (e) a Qz-Mol-Ccp ± Cal vein (B vein) in quartz diorite; (f) a Cal-Ccp vein (D vein) in quartz diorite; (g) chalcopyrite enclosing early euhedral pyrite in quartz diorite; (h) intergrown chalcopyrite and pyrrhotite in quartz diorite; (i) disseminated pyrite and chalcopyrite in quartz diorite; (jl) intergrown hematite, chalcopyrite, pyrite, and pyrrhotite in quartz diorite. Hem represents hematite, and other mineral abbreviations are explained in Figure 2.
Minerals 14 00098 g003
Figure 4. Representative sampling locations of the drill holes for exploration line 8 in the first mining area of the Pulang deposit.
Minerals 14 00098 g004
Figure 5. Representative SEM-CL images of hydrothermal quartz veins from the Pulang deposit. (a) intergrown quartz-sulfide veins in quartz diorite; (bd) main stage quartz (Q2) was surrounded by late-stage quartz (Q3) as a core; (e) early stage quartz (Q1) appeared granular or irregularly elliptical in shape.
Minerals 14 00098 g005
Figure 6. Transmitted light photomicrographs of fluid inclusions in Pulang copper deposit. (ac) Liquid-rich two-phase inclusions (L-type); (b) vapor-rich two-phase inclusions (V-type); (df) daughter mineral-bearing inclusions (S-type); (gi) CO2-bearing three-phase inclusions (C-type); and (jl) low-salinity, low-density fluid inclusions coexisting with high-salinity fluid inclusions, indicating the occurrence of fluid boiling.
Minerals 14 00098 g006
Figure 7. Histogram of the microthermometry results for the fluid inclusions from Pulang. (a) Histogram of the fluid inclusions in the first mining area and eastern ore section; (b) salinity histogram of fluid inclusions in the first mining area and eastern ore section.
Minerals 14 00098 g007
Figure 8. Laser Raman spectra of fluid inclusions in Pulang copper deposit. (a,b) L-type inclusions’ vapor and liquid phase spectral characteristics indicated that their vapor and liquid components consisted of H2O; (c,d) the vapor and liquid phase spectral characteristics of the V-type inclusions indicated that their liquid phase included mainly water. In contrast, their vapor phase was primarily a mixture of CO2, CH4, and water vapor; (e,f) C-type inclusions’ vapor and liquid phase spectral characteristics indicated that their liquid phase mainly included H2O. In contrast, their gas phase mainly consisted of CO2 and a certain amount of water vapor.
Minerals 14 00098 g008
Figure 9. δ18O H2O-δDV-SMOW isotopic diagram of fluid inclusions in the Pulang copper deposit (base map according to [7,20]).
Minerals 14 00098 g009
Figure 10. Distribution characteristics of S isotopes in the first mining area and eastern ore section of the Pulang porphyry copper deposit.
Minerals 14 00098 g010
Figure 11. Metallogenic model of the Pulang porphyry Cu (–Mo–Au) deposit (according to [39]).
Minerals 14 00098 g011
Table 1. Microthermometry results for the fluid inclusions from the Pulang porphyry Cu deposit.
Sample No.Type of VeinsType of F.I.AmountT(m, Ice)
(°C)
T(m, Clathrate)
(°C)
T(m, Halite)
(°C)
Th
(°C)
Salinity
(wt% NaCleqv)
First Mining AreaFL-114Qtz-Py
(B-type)
L15−17.6~−3.4 179.5~349.75.6~20.7
S10 358.8~413.6388.7~440.843.3~48.7
FL-105V5−5.6~−2.1 257.9~325.63.6~8.7
L17−18.8~−5.6 183.4~347.38.7~21.5
S9 319.8~398.3354.9~419.639.8~47.4
FL-110Qtz-Py-Ccp
(B-type)
C8 0.8~5.9 262.0~317.07.5~14.6
FL-122C11 1.5~5.3 270.9~325.98.5~13.8
FL-142Qtz-Py-Ccp-Mo
(B-type)
L13−21.3~−5.3 167.8~288.08.3~23.2
FL-180L18−21.3~−11.8 160.5~324.38.7~23.2
FL-100S6 307.6~376318.0~426.738.7~44.3
FL-160Qtz-Ccp-Mo-Po
(B-type)
L11−21.3~−2.7 157.3~350.04.5~23.2
East Ore SectionFL-101Qtz-Py-Po+Ccp
(B-type)
L15−12~−1.1 175.1~310.31.9~15.9
FL-135V3−3.8~−3.1 253.7~268.85.1~5.6
FL-177S5 275.2~355.3300.5~365.636.3~42.7
FL-191Qtz-Ccp-Po
(B-type)
L9−15.2~−6.7 160.7~214.610.1~18.8
L11−10.4~−1.6 227~291.72.7~14.4
V6−8.2~−3.0 260.1~298.34.9~11.9
FL-155L14−3.2~−1.2 207.4~238.02.1~5.3
S3 285.3~336.2311.2~355.037.1~41.2
Table 2. H-O isotope results for quartz in the Pulang copper deposit.
Sample No.Typeδ18OV-SMOW
δDVSMOW
Th/°C
(Average)
δ18OH2O
Data Sources
First Mining AreaPL15-3660-15A veins11.7−87.3344.06.2[7,13]
PL15-3736-717.0−86.011.5
PL15-3660-1311.5−88.13.6
FL-123Qtz-Py-Ccp
(B veins)
14.0−84.6288.16.55This Study
FL-18411.03−85.13.58
FL-13814.50−110.17.05
FL-280Qtz-Py-Ccp-Mo
(B veins)
12.0−93.9231.02.1
FL-27712.13−93.12.23
FL-21311.99−91.72.09
FL-182Qtz-Ccp
(B veins)
12.78−104.3275.04.93[21]
FL-4913.62−107.15.77
FL-3812.50−95.84.65
FL-17811.43−107.73.37
ZK2404-13D veins13.2−83.9178.60.1[7,13]
EastZKE401-1Qtz-Py-Ccp
(B veins)
8.8−83.6275.2−2.3[18]
ZKE401-212.3−87.72.46
Table 3. Sulfur isotope analysis results for the first mining area and eastern ore section of the Pulang porphyry copper deposit (‰).
Sample No.Mineralsδ34S (‰)Data Sources
First Mining AreaFL55J-B-CCP-1Ccp3.2This Study
FL196L-B-CCP-2Ccp2.4
FL196L-B-CCP-3Ccp2.4
FL35L-B-PO-1Po5.3
FL35L-B-PO-2Po4.8
PL18-9-4Ccp4.5[21]
PL18-9-5Ccp5.0
PL18-9-6Ccp4.3
East Ore
Section
PLZKE006-2Ccp2.7
PLZKE006-4Po4.1
LZKE402-3Po3.1
PLZKE602-4Po3.1
Table 4. Comparison of fluid characteristics between the east ore section and the first mining area.
First Mining
Area [22]
First Mining Area
(This Study)
East Ore Section [12]East Ore Section
(This Study)
Mineralization stages (main stage)B-type veinsB-type veinsB-type veinsB-type veins
Type of F.I.L, V, S, CL, V, S, CL, V, SL, V, S
Range of Th (°C)256.4~416.3157.3~440.8170.2~421.4160.7~365.6
Range of salinity (wt%)16.8~40.64.5~48.79.3~33.31.9~42.7
Vapor phaseH2O, CO2, CH4H2O, CO2, CH4H2O, CH4, N2H2O, CH4
Source of the fluidsMagmatic water, atmospheric precipitation
Note: The abbreviations in the table are consistent with those reported in the text.
Disclaimer/Publisher’s Note: The statements, opinions and data contained in all publications are solely those of the individual author(s) and contributor(s) and not of MDPI and/or the editor(s). MDPI and/or the editor(s) disclaim responsibility for any injury to people or property resulting from any ideas, methods, instructions or products referred to in the content.

