Article

Modelling of the Corrosion-Induced Gas Impact on Hydraulic and Radionuclide Transport Properties of Geological Repository Barriers

Nuclear Engineering Laboratory, Lithuanian Energy Institute, 3 Breslaujos Str., 44403 Kaunas, Lithuania
*
Author to whom correspondence should be addressed.
Minerals 2024, 14(1), 4; https://doi.org/10.3390/min14010004
Submission received: 21 November 2023 / Revised: 10 December 2023 / Accepted: 16 December 2023 / Published: 19 December 2023

Abstract

:
The geological disposal of high-level radioactive waste is the final step in the nuclear fuel cycle. It is realized via isolating the high-level radioactive waste in the geological environment with an appropriate system of engineered barriers. Radionuclides-containing materials must be isolated from the biosphere until the radioactivity contained in them has diminished to a safe level. In the case of high-level radioactive waste, it could take hundreds of thousands of years. Within such a long timescale, a number of physical and chemical processes will take part in the geological repository. For the assessment of radionuclide migration from a geological repository, it is necessary to predict the repository’s behavior once placed in the host rock as well as the host-rock response to disturbances due to construction. In this study, the analysis of repository barriers (backfill, concrete, inner excavation disturbed zone (EDZ), outer EDZ, host rock) thermo–hydraulic–mechanical (THM) evolution was performed, and the scope of gas-induced desaturation was analyzed with COMSOL Multiphysics. The analysis was based on modelling of a two-phase flow of miscible fluid (water and H2) considering important phenomena such as gas dissolution and diffusion, advective–diffusive transport in the gaseous phase, and mechanical deformations due to thermal expansion of water and porous media. The importance of proper consideration of temperature-dependent thermodynamic properties of water and THM couplings in the analysis of near-field processes was also discussed. The modelling demonstrated that such activities as 50 years’ ventilation of the waste disposal tunnel in initially saturated porous media, and such processes as gas generation due to corrosion of waste package or heat load from the waste, also led to desaturation of barriers. H2 gas generation led to the desaturation in engineered barriers and in a part of the EDZ close to the gas generation place vanishing soon after finish of gas generation, while the host rock remained saturated during the gas generation phase (50–100,000 years). Radionuclide transport properties in porous media such as effective diffusivity are highly dependent on the water content in the barriers determined by their porosity and saturation.

1. Introduction

The evidence of climate changes resulted in the active search of climate-neutral energy sources, and nuclear energy has gained attention again. As it is stated in [1], nuclear power plants do not produce greenhouse gas emissions during operation, and over the course of its life cycle, nuclear energy produces about the same amount of carbon-dioxide-equivalent emissions per unit of electricity as wind and one-third of the emissions per unit of electricity when compared with solar. While planning and designing new nuclear reactors, no one should forget about responsible and safe management of radioactive waste, which is the last step of the open nuclear fuel cycle. Regardless of the numerous options for long-term nuclear waste management analyzed in the past (rock-melting, sea disposal, disposal in outer space, disposal in ice sheets, etc.) [2], it is now broadly accepted at the technical level that, as stated in [3], at this time, deep geological disposal represents the safest and most sustainable option as the end point of the management of high-level waste and spent fuel considered as waste. Geological disposal is realized via isolating high-level radioactive waste in a geological environment with an appropriate system of engineered barriers. The radionuclides-containing materials must be isolated from the biosphere until the radioactivity contained in them has diminished to a safe level. In the case of high-level radioactive waste, it could take hundreds of thousands of years. Within such a long timescale, a number of physical and chemical processes will take part in the geological repository. For the assessment of radionuclide migration from a geological repository, it is necessary to predict the repository’s behavior once constructed in the host rock as well as the host-rock response to disturbances due to construction. The main transport mechanisms for the radionuclides in a porous medium are transport by convection (advection) and diffusion. Radionuclides could be transported in dissolved form or gaseous phase. In low-permeable host rock, diffusion plays a major role in the transport of radionuclides. Therefore, an effective diffusivity is a key parameter describing this phenomenon. It is well known that diffusivity in a porous medium is lower than in free water due to pore constrictivity, tortuosity, dead-end pores, etc. For unsaturated rocks, it also depends on water content in pores. Therefore, water- and gas-phase content plays a role in radionuclide migration by affecting the transport properties of various barriers. Thus, the assessment of unsaturated/saturated conditions and their evolution over time is obligatory.
Activities such as excavation and ventilation of a waste disposal tunnel in an initially saturated porous medium may result in the desaturation of barriers. Desaturation of a material means decreased permeability for the liquid phase and a longer time for resaturation. On the other hand, the permeability for the gaseous phase will increase and will lead to a faster movement of the gaseous phase and volatile nuclides. Once the construction and ventilation are over, the disposal system tends to return to equilibrium with the surrounding environment, and the barriers will become saturated with groundwater flowing from the host rock. Due to interaction with groundwater, metallic waste packages will corrode and lead to the generation of hydrogen gas. The amount and rate of the generated gas will depend on the gas-generating materials and the conditions prevailing in the repository (availability of water, oxygen, and chemical species that may promote metal corrosion (e.g., chloride or sulfate), pH, and temperature) [4].
It is widely accepted that there are four types of gas transport processes in clay-based porous media, i.e., advection/diffusion of dissolved gas, capillary-controlled two-phase flow, dilatancy-controlled gas flow, and microfracture flow [5,6]. Gas dissolution is governed by Henry’s law, and the advection/diffusion of dissolved gas is governed by Darcy and Fick’s law and is significantly restricted by the low hydraulic conductivity of the argillaceous rock [7]. The visco-capillary two-phase flow occurs when the difference between the gas- and the liquid-phase pressures exceeds the material gas entry value, which is a material property determined by the pore structure of the clay. Once the gas entry value is exceeded, the gas mobility is controlled mostly by the intrinsic permeability, the retention properties, and the relative permeability function of the clay [8]. If the gas pressure is high enough and exceeds a sum of minimal principal compressive stress and tensile strength, then gas-induced fractures may develop [8] and provide preferential pathways for groundwater flow and, subsequently, radionuclide migration. Thus, depending on corrosion and gas dissolution/transport rates, the engineered barriers and host rock may become unsaturated, and that will impact radionuclide transport properties.
Besides the gas, the temperature increase in a water-saturated porous medium with low permeability causes thermal pressurization, which is essentially the result of the difference between the thermal expansion coefficients of the pore water and the solid skeleton, as it is indicated in [9]. Non-uniform porewater pressure distribution will impact the existing hydraulic gradients and could also influence the quantity of the flow through the rock as well as the flow direction and thus potentially affect the advective transport of the radionuclides from the radioactive waste [10]. Thermal expansion leading to mechanical deformations will influence material porosity. Subsequently, porosity change will affect the water and gas movement in the medium because it is governed by material permeability for liquid and gaseous phases and the water retention model and their evolution. In summary, for the assessment of conditions (saturated/unsaturated), a number of coupled processes and properties need to be evaluated such as advective–diffusive transport of water and dissolved gas, advective–diffusive transport of vapor and gas, gas generation and dissolution, thermal expansion of water and barriers, and temperature-dependent properties of water, gas and porous medium.
Considering the initial and boundary conditions, the solution mass and energy balance equations allow the evaluation of water, gas and heat distribution within the modelled system. Based on this distribution, the impact on radionuclide transport properties could be evaluated. Analytical solutions of the mass and energy conservation equation are available for a rather simple system geometry, as well as simple initial and boundary conditions. Meanwhile, in a geological repository, there are several engineered barriers of different geometry, time-dependent boundary conditions, different initial conditions, and source terms. Therefore, mass and energy balance as well as radionuclide transport equations under disposal conditions are being solved extensively by numerical methods.
In this study, the analysis of repository barriers (backfill, concrete, inner excavation disturbed zone (EDZ), outer EDZ, host rock) was performed, and thermo–hydraulic–mechanical evolution and the scope of gas-induced desaturation were analyzed with COMSOL Multiphysics. This required modelling of a two-phase flow of miscible fluid (water and H2) considering important phenomena such as gas dissolution and diffusion, advective–diffusive transport in the gaseous phase, mechanical deformations due to thermal expansion of water and porous media and due to changes of effective stress.
This paper presents the modelling activities of the Lithuanian Energy Institute performed in the framework of the European joint program EURAD and the analysis of the corrosion-generated hydrogen gas impact on the state of engineered and natural barriers under geological disposal conditions. Within this current study, the THMG behavior of the clayrock host rock was analyzed at the repository near-field scale while considering ventilation, corrosion-induced gas generation and heat dissipation. The importance of proper consideration of temperature-dependent thermodynamic properties of water and THM couplings in the analysis of near-field processes was also discussed.

2. Methodology

The relevance of thermo–hydraulic–mechanical evolution of engineered and natural barriers of a geological repository and of understanding key phenomena is acknowledged by the international community. Thus, research into gas transport in geological repository conditions and its impact on barriers’ properties is being carried out within the EURAD program funded by the European Commission (Grant No. 847593). For the analysis of the corrosion-induced gas impact on barriers’ integrity and transport properties, a generic repository concept was proposed in [11], which includes elements of disposal concepts from different national programs (see Figure 1): Switzerland (ILLW storage zone A); Belgium (HLW storage zone B); France (HLW storage zone C).
In this study, a gas migration in zone B has been analyzed. The barriers in the deposition tunnel of zone B are summarized in Figure 2.
To improve the mechanistic understanding of gas transport processes in natural and engineered clay materials, their couplings with the mechanical behavior and their impact on the properties of these materials, the coupled thermo–hydro–mechanical processes and gas transport were analyzed under different conditions:
  • Isothermal conditions (H model);
  • Non-isothermal conditions (impact of temperature) (TH model);
  • Non-isothermal conditions under mechanical load (impact of mechanical deformations) (THM).
Additionally, the impact of the water retention model and temperature-related water properties was also discussed.

2.1. Mathematical Model

2.1.1. Radionuclide Transport

As has been already mentioned, radionuclides are transported in a porous medium by advection (convection) and diffusion. Mathematically, it could be described by a partial differential equation describing mass conservation over time in space [12]:
θ l c i t + ρ c p , i t + θ g c G , i t + q L · c i = · J i + R i
where c i denotes the concentration of species i in the liquid (mol/m3), c p , i is the amount adsorbed to the solid particles (moles per unit dry weight of the solid), c G , i is the concentration of species i in the gas phase, J i is dispersive–diffusive flux vector, R i is a production of consumption rate (mol/m3∙s), q L is the solvent (groundwater) velocity field (m/s), ρ is bulk density of porous medium ρ = ρ s 1 n , ρ s is a solid density of material, θ l is liquid volume fraction.
In a fully water-saturated porous medium, the liquid volume fraction is equal to porosity n, but for an unsaturated medium, it is related to water saturation θ l = n S w . The resulting gas volume fraction in the case of an unsaturated porous medium is
θ g = n θ l = 1 S w · n
During transport, the solute interacts with solid particles of the porous media and can be adsorbed. Assuming that the amount of the solute adsorbed to the solid is a function of the concentration in the fluid c i and the adsorption is a fast process (the solute concentration in the liquid and solid phases is in instant equilibrium), then the second term in Equation (1) could be expanded:
ρ c p , i t = ρ c p , i c i ρ c i t c p , i ρ s n t = ρ K p , i ρ c i t c p , i ρ s n t
where K p , i = c p , i c i is an adsorption isotherm.
Volatilization is the process where a solute species in the liquid is transferred to the gas phase due to vaporization. Assuming that the amount of the solute in the gas phase, c G , i , is a linear function of the liquid phase concentration, the volatilization term is defined as
θ g c G , i t = θ g c G , i c i c i t + k G , i c i θ g t = θ g k G , i c i t + k G , i c i θ g t
where k G , i = c G , i c i is linear volatilization. It is related to the inverse of dimensionless Henry constant ( k G , i = 1 H ).
Transport of species by advection describes the movement of a species, such as a radionuclide, with the bulk fluid velocity. The velocity field q L (Darcy velocity) is defined as volume flow rates per unit cross section of the medium.
Dispersive–diffusive flux vector describes the spreading of species due to mechanical mixing resulting from the porous media (dispersion) and from diffusion and volatilization to the gas phase:
J i = D D , i + D e , i c i
where D D , i is the dispersion tensor (m2/s), and D e , i is the effective diffusion coefficient for radionuclide (m2/s).
D D i i = α L q L i 2 q L + α T q L j 2 q L
D D i j = α L α T q L i · q L j q L
D D i i is the diagonal components of the dispersion tensor (m2/s), D D i j is the off-diagonal components of the dispersion tensor (m2/s), α L , α T are longitudinal and transverse dispersivities (m).

2.1.2. Water, Gas, Energy Transport

In this study, it was assumed that air mass in the total gas phase will be insignificant, and the gas phase will be mainly water vapor and gaseous hydrogen. Then, the mass and energy balance equations were defined for each component (water, hydrogen, enthalpy) of this type:
m t + l = Q ,   m = m w , m H 2 , h
Mass of components (volumetric density) and enthalpy were defined as the following [13,14]:
m w = m L + m V = ρ w e   S w 1 + e + ρ V e   1 S w 1 + e
m H 2 = m H 2 _ d + m H 2 = ρ H 2 n 1 S w 1 H
h = ρ s h s 1 + e + m L h w + m V h V + m H 2 h H 2
Here, m w is the total mass of water as a sum of liquid water and vapor, m H 2 is the total mass of hydrogen as a sum of dissolved hydrogen and in gas phase, e is the void ratio, h w , h V ,   h H 2 are the enthalpy of water, vapor and hydrogen, respectively, ρ w is the water density, ρ V is the vapor density, ρ H 2 is the hydrogen density.
Fluxes of each component were defined considering advective–diffusive transport in both phases:
l w = ρ w q L + ρ v q G + i v
l H 2 = ρ H 2 H q L + ρ H 2 q G + i H 2 + i H 2 _ d
l h = ρ W h L q L + h V ρ V q G + i V + h H 2 ρ H 2 q G + i H 2 + ρ H 2 H q L λ T
Here, λ is the material thermal conductivity.
The advective flow rate for liquid and gas phases was described by the extended Darcy law:
q L = k L k r L μ w P L + ρ w g
q G = k G k r G μ G P G
Here, k L ,   k r L are the intrinsic permeability and relative permeability of the material for the liquid phase, respectively, k G ,   k r G are the intrinsic permeability and relative permeability of the material for the gas phase, respectively, μ w , μ g are the dynamic viscosity of liquid and gas phases, respectively.
Diffusive fluxes are described:
i H 2 _ d = ρ w D e ρ H 2 _ d ρ w
i H 2 = ρ w D e , g ρ H 2 ρ w
i V = i H 2
Here, ρ H 2 _ d is the dissolved hydrogen density ( ρ H 2 _ d = H T ρ H 2 ). D e and D e , g are the effective hydrogen diffusion coefficients in liquid and gaseous phases, respectively.

2.1.3. Mechanical Deformations

Mechanical force balance equation is defined:
· σ = F v
Here, σ is the total stress tensor, F v is the body force. Gravity is not considered in the analysis, thus F v = 0.
The strains in a porous material are caused by effective stresses, described as follows:
σ i j = σ i j α · P ¯
Here, σ i j is the effective stress (Pa), α is the Biot coefficient (-), P ¯ is the equivalent pore pressure (Pa) equal to groundwater pressure in saturated conditions; sign convention as in soil mechanics.
The thermal expansion of porous media is considered as elastic volumetric strains ε t h under the assumption that the thermal expansion coefficient of the porous rock ( β T D ) is equal to that of the solid grains of this rock ( β T g ):
ε t h = β T D d T = β T g d T
The thermal load will impact the fluid’s density, viscosity, and the thermal expansion coefficient. Heat will also induce strains due to thermal expansion, and the changes in liquid and gas pressures will affect effective stress and lead to volumetric strains in the porous medium. These interactions were described as porosity change following [15]; it was solved in parallel to mass and energy balance equations. The updated porosity was fed into the component mass balance equations (two-way coupling):
n t = α n 1 α K D P ¯ t + 1 α β T D 1 n β T g T t + α d e v d t
P ¯ = S w · P L + 1 S w · P G
α = 1 K D K g
K g = K D 1 α
Here, K D is the drained bulk modulus of the material (Pa), K g is the solid (grain) bulk modulus (Pa), β T D is the thermal expansion coefficient of porous medium (1/°C), β T g is the thermal expansion coefficient of solid (1/°C), e v is the volumetric strain (-).
The first term in the porosity equation is related to a poroelastic material. For a non-poroelastic material, Biot’s coefficient is equal to 1, and this term will vanish. The second term describes porosity changes induced by different thermal expansion of water and solid grains. The last term represents porosity changes due to induced volumetric strains (whether it is driven by changes in effective stresses or/and thermal strains). The effective stress depends on liquid and gas pressure evolution over time.

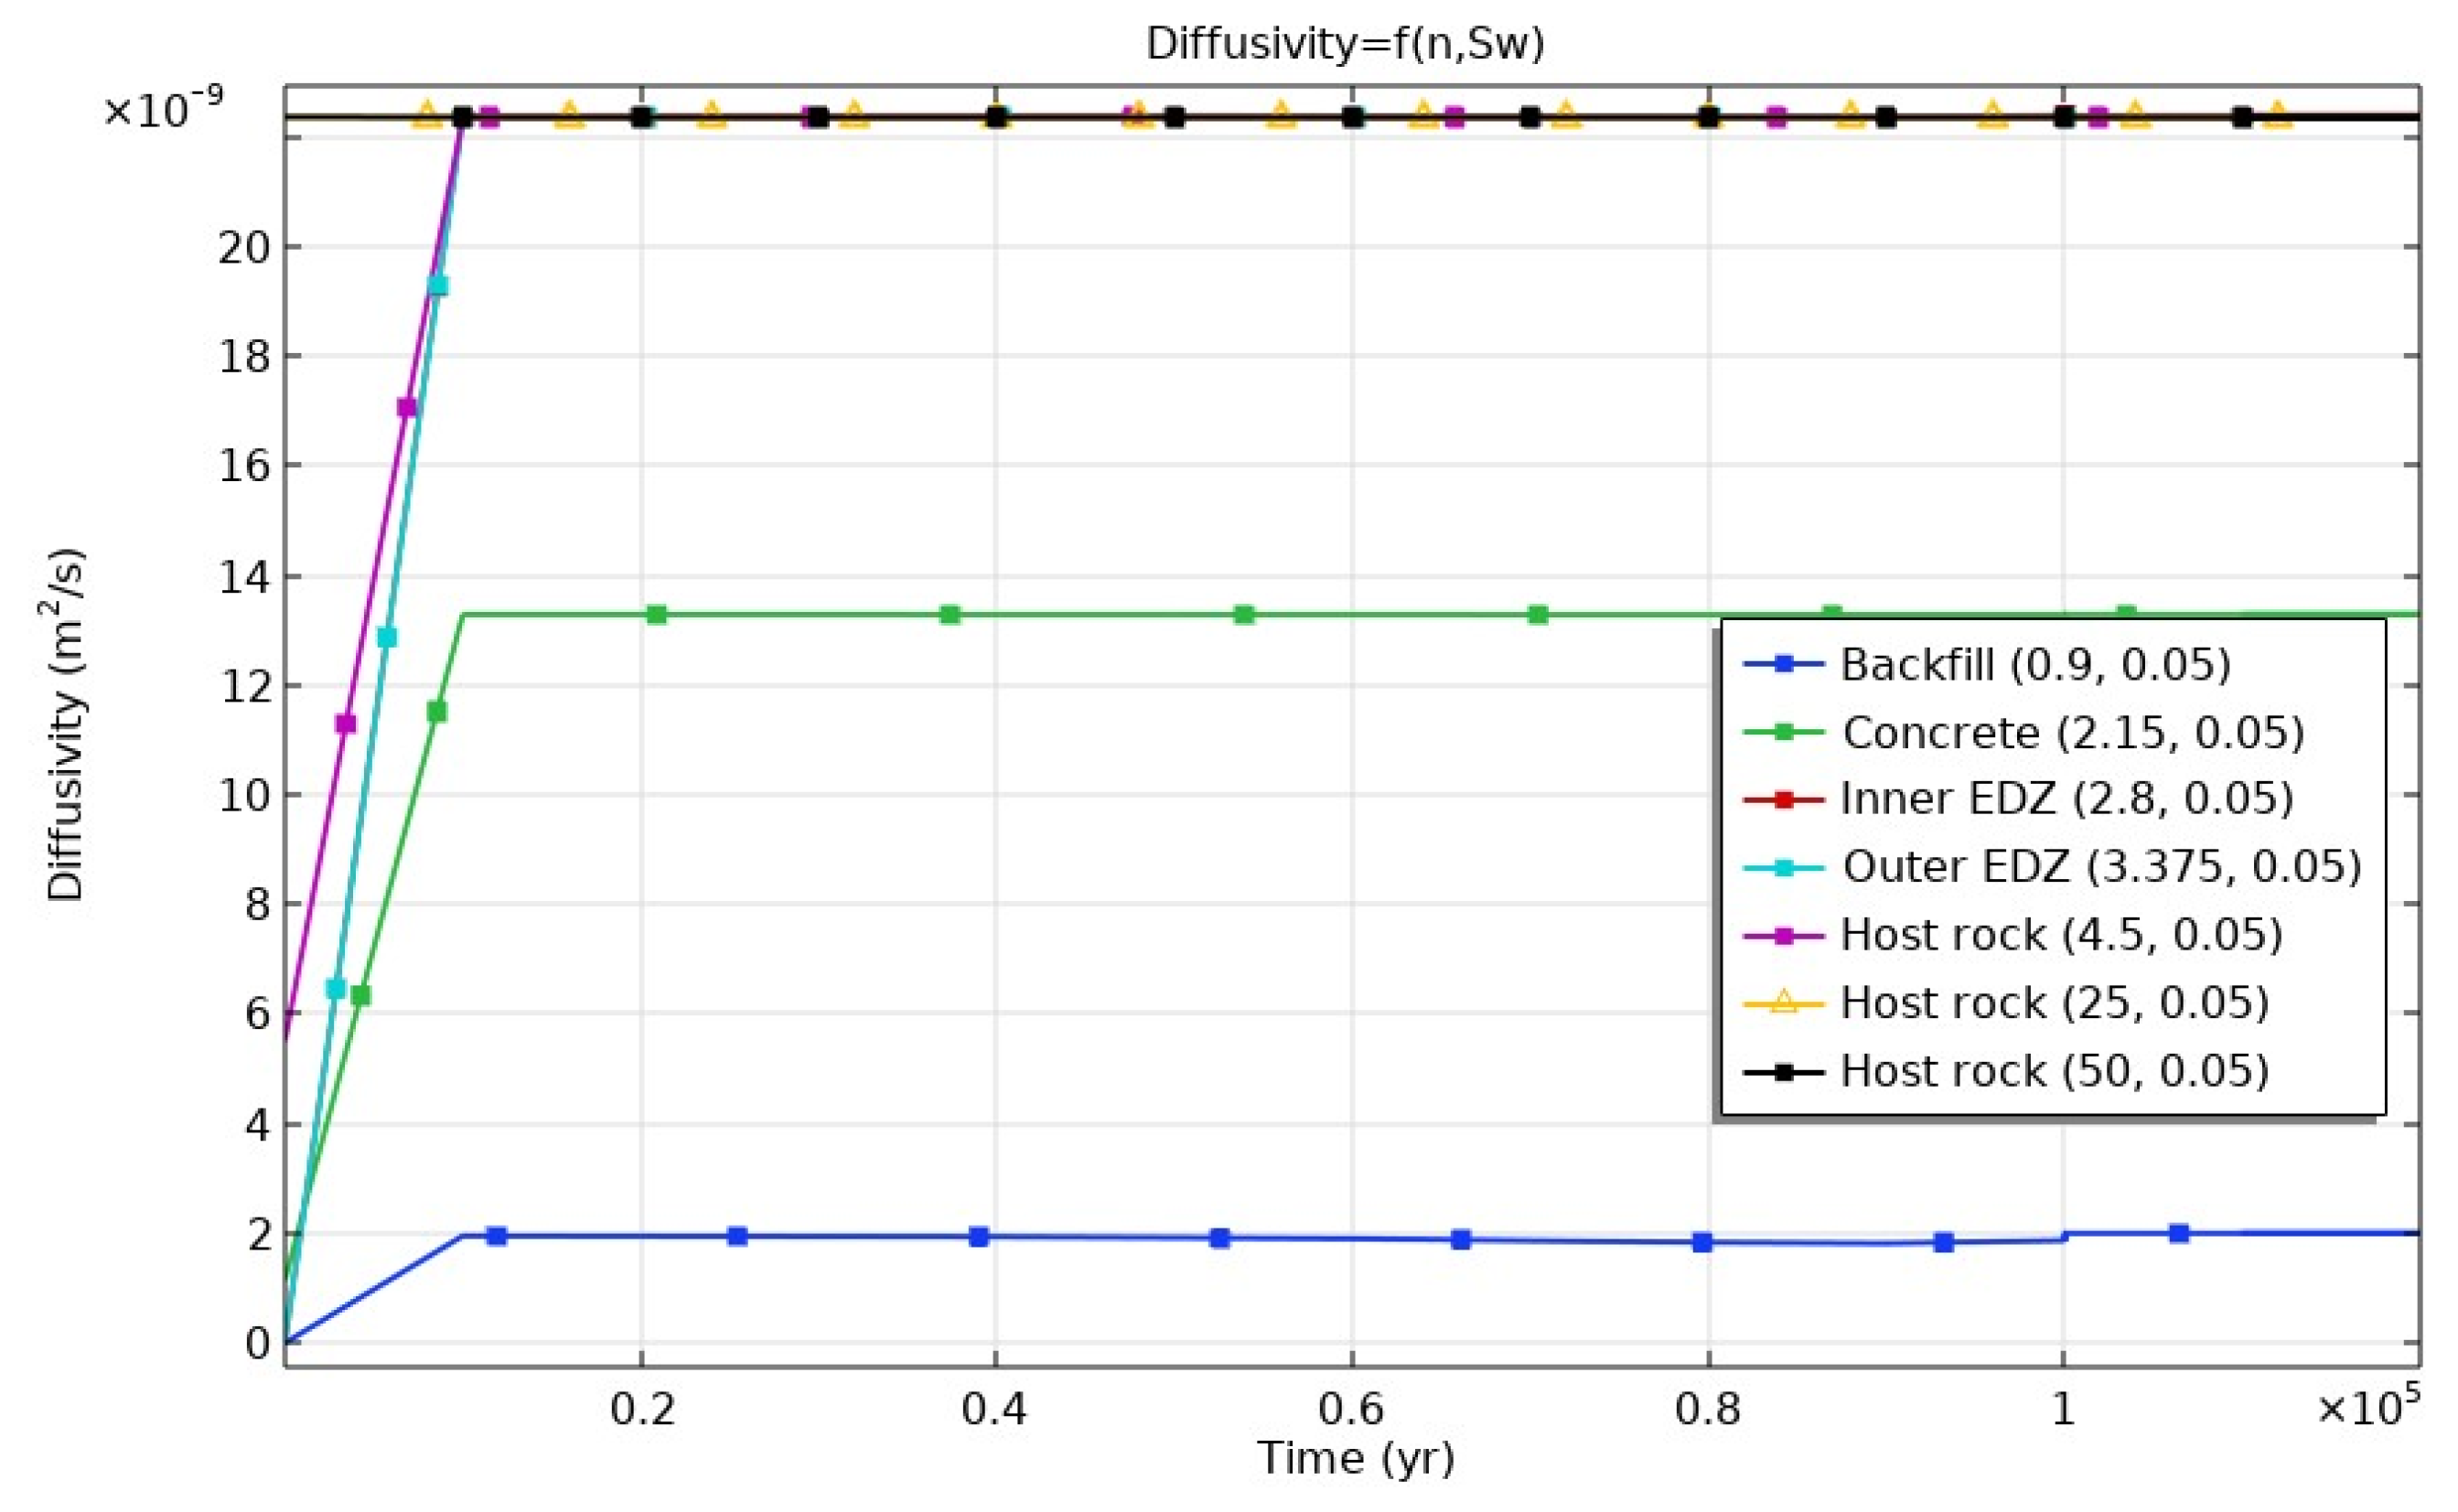
2.1.4. Effective Diffusivity

Effective diffusivity of radionuclides as well as hydrogen gas could be a linear function of saturation:
D e = τ n S w D 0
In this study, a nonlinear dependence (Millington–Quirk relation) of the effective diffusion coefficient on porous media saturation and tortuosity was defined according to [11]:
D e , w = n 1 + a S w , e b · D 0
D e , g = n 1 + a 1 S w , e b · D 0
S w , e = S w S w r 1 S w r
Here, a and b are model parameters, D 0 is the diffusivity in free liquid of the gas phase.

2.1.5. Water Retention

Evolution of material permeability and the water retention curve (WRC) need to be consistent with each other and based on the same measurement dataset. For this purpose, compatible relation between saturation and suction (water retention curve) and relative permeability functions of saturation were used based on [16]:
S w P c = S w r + S w s S w r ( 1 + ( α P c ) n ) m , i f   P c P e S w s , i f   P c P e
Here: S w s = S w r + ( S w s S w r ) ( 1 + ( α P e ) n ) m , m = 1 1 / n and α = 1 / P r , m ,   n ,   α ,   P r are van Genuchten WRC parameters.
With this formulation, unsaturated conditions prevail when PGPL > Pe, i.e., even though the gas pressure (Pv + PH2) is higher than the liquid pressure, the difference between these pressures is lower than the gas entry pressure, and the material remains saturated under such conditions. As it is stated in [16], this water retention curve definition reduces to the classical van Genuchten WRC with zero gas entry pressure. Thus, there was no need to define a different WRC or adapt the classical van Genuchten WRC with parameter values other than specified for materials with non-zero gas entry pressure (mainly host rock, EDZ) in specification [11].
Relative permeability for the liquid phase ( k r l ) and the gas phase ( k r g ) was implemented as follows [16]:
k r L = S w e S w e τ 1 ( 1 ( S w e ( P c ) ) 1 / m ) m 1 ( 1 S w e 1 / m ) m 2 , i f   P c P e 1 , i f   P c P e
k r G = S w e S w e τ · 1 1 ( 1 ( S w e ( P c ) ) 1 / m ) m 1 ( 1 S w e 1 / m ) m 2 , P c P e 0 , i f   P c P e
Here, S w e = S w ( P c ) S w r S w s S w r is the new effective saturation, S w e = S w s S w r S w s S w r is the maximum effective saturation.
It is in line with the WRC definition presented above and corresponds to the one defined in specification [11] with τ = 0.5 and τ’ = 0.5. With Pe = 0, it reduces to classical van Genuchten–Mualem permeability functions, and thus there was no need to define different functions for the analyzed materials in zone B or to adapt classical van Genuchten–Mualem permeability functions with parameter values other than specified in [11].

2.2. Numerical Model

For this purpose, mass and energy balance equations were defined via the Coefficient Partial Differential Equation (PDE) interface of COMSOL Multiphysics (6.0v) and solved with the finite element method. A modified van Genuchten–Mualem model (VGM/Pe model) with representation of the gas entry pressure as presented in [16] was implemented too. Mechanical deformations were solved by Solid Mechanics physics of COMSOL Multiphysics. Porosity evolution was defined via the Ordinary Differential Equation (ODE) interface and solved in parallel with other equations.
COMSOL Multiphysics is a general-purpose platform for modelling a number of various processes and their applications. It contains conventional physics-based user interfaces, as well as interfaces for the definition of partial differential equations by the user. The defined system of partial differential equations is solved with the finite element method.

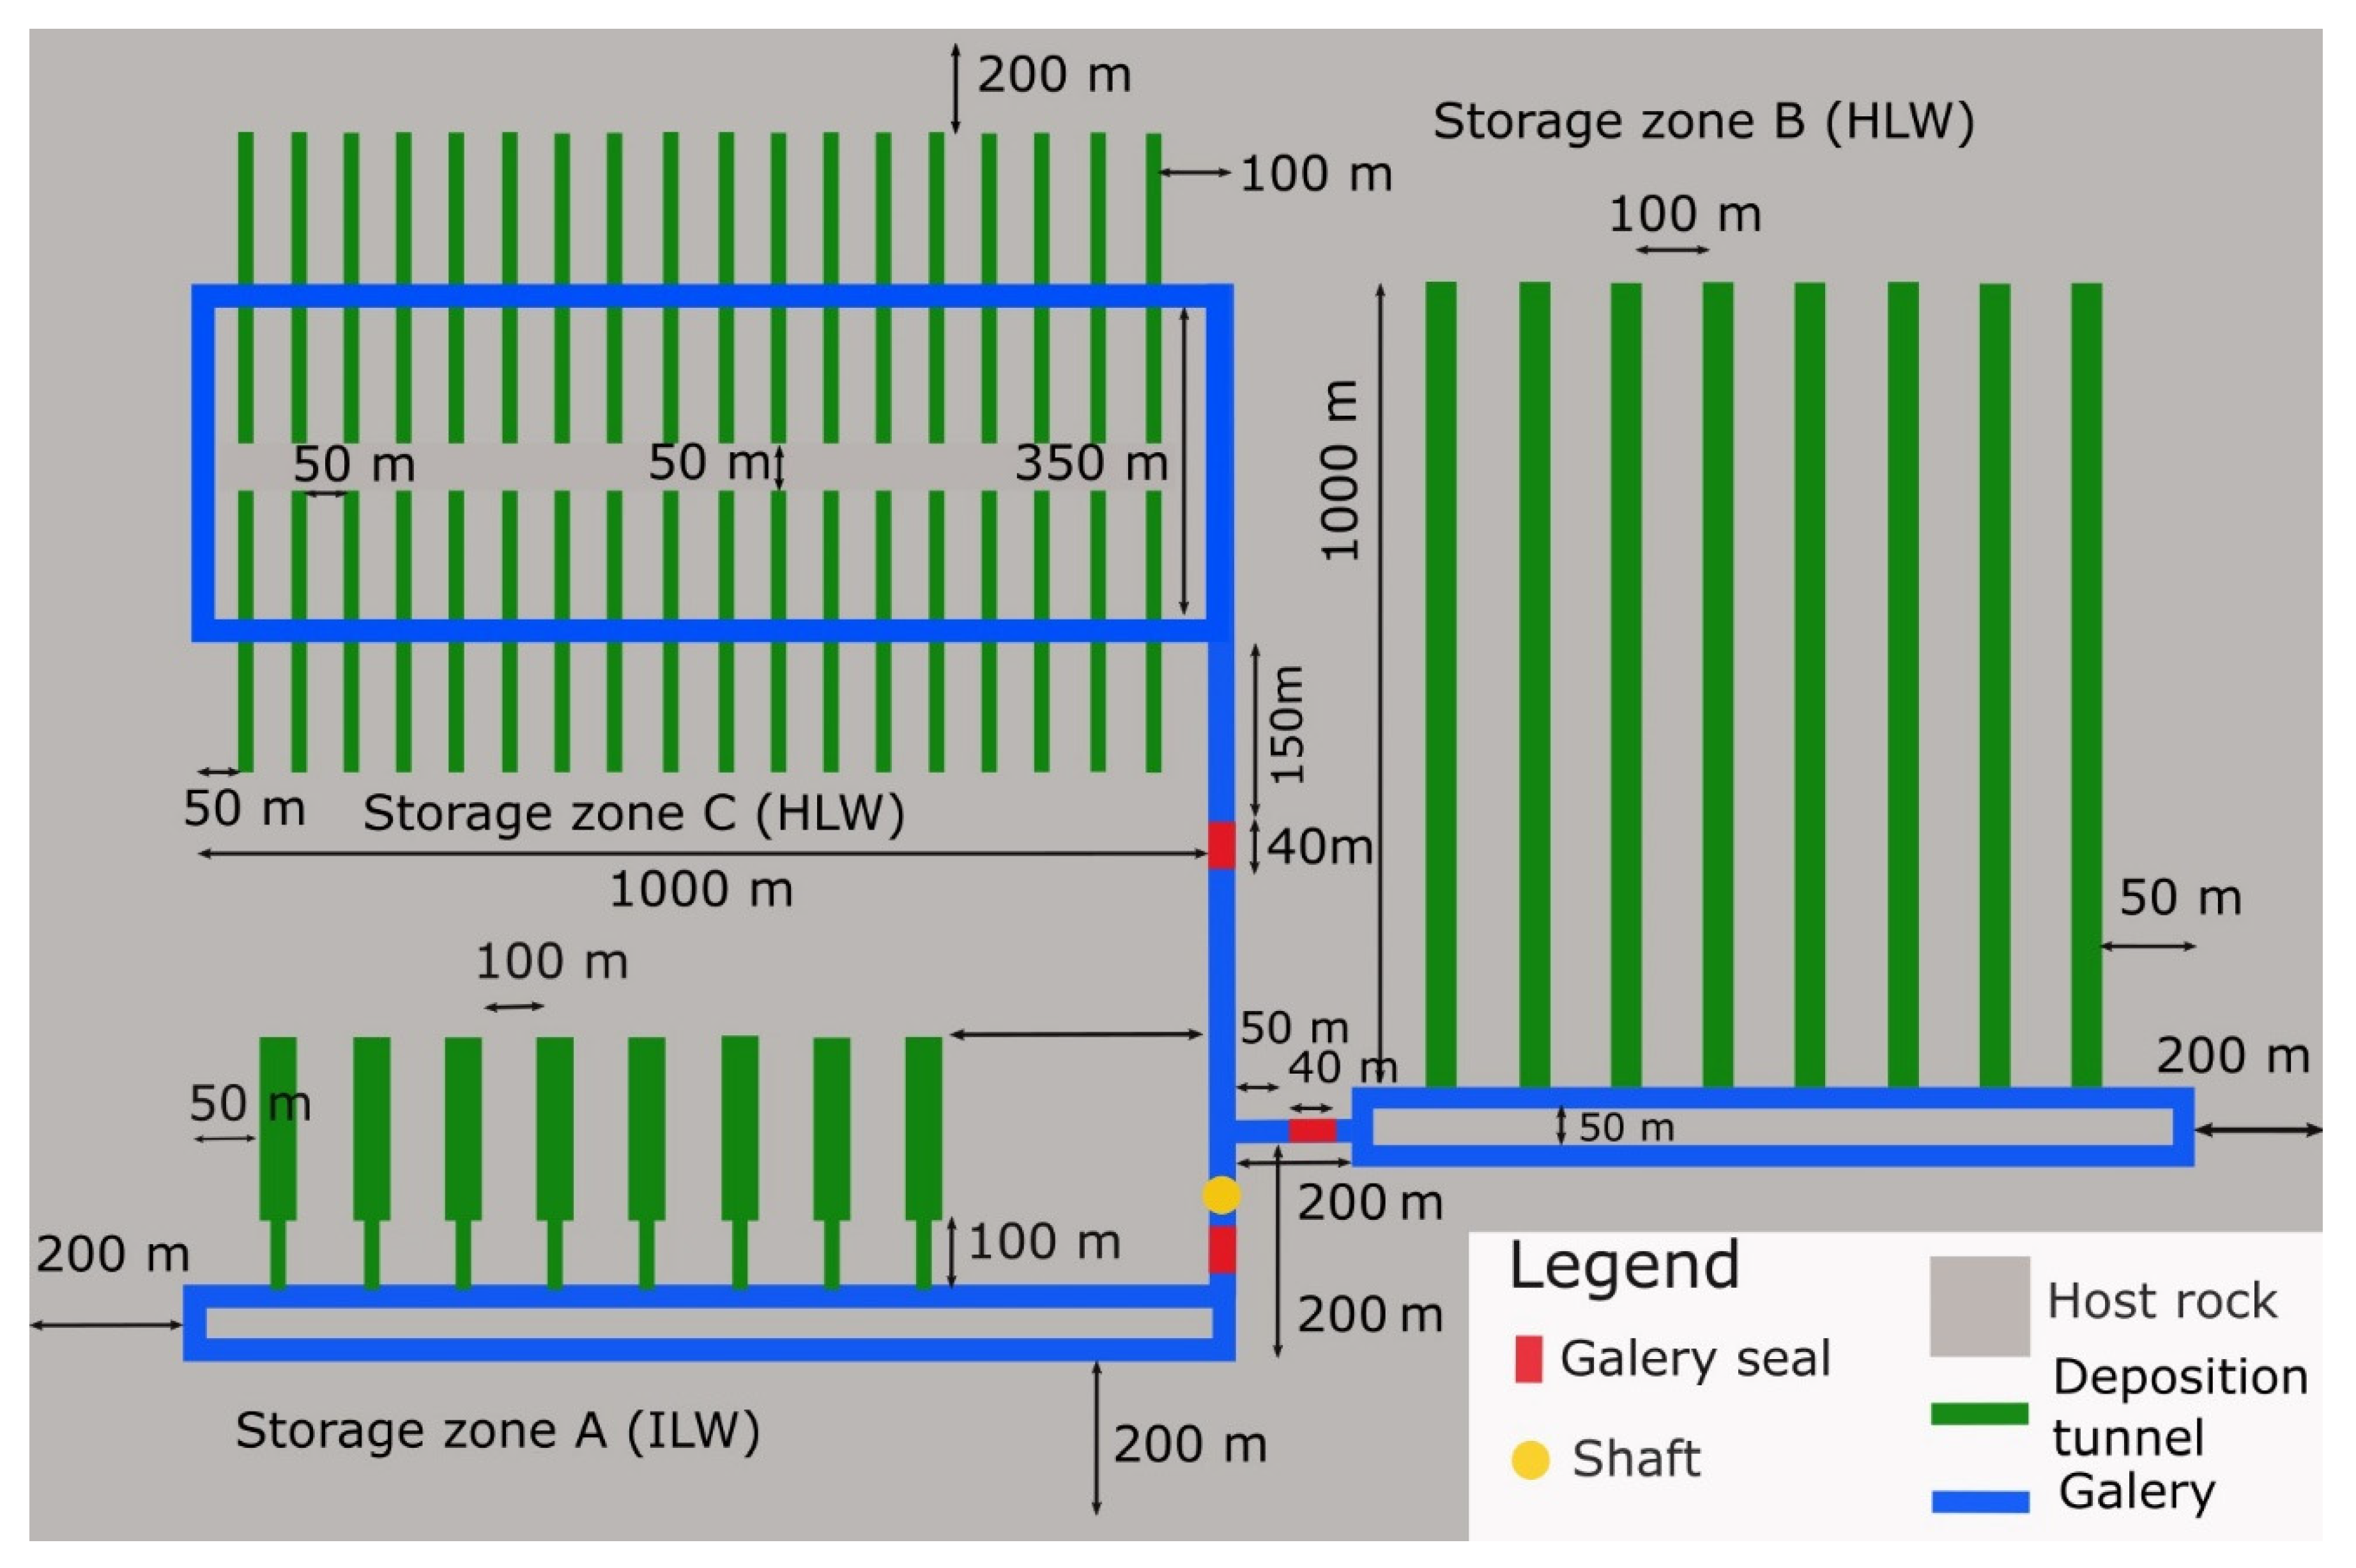
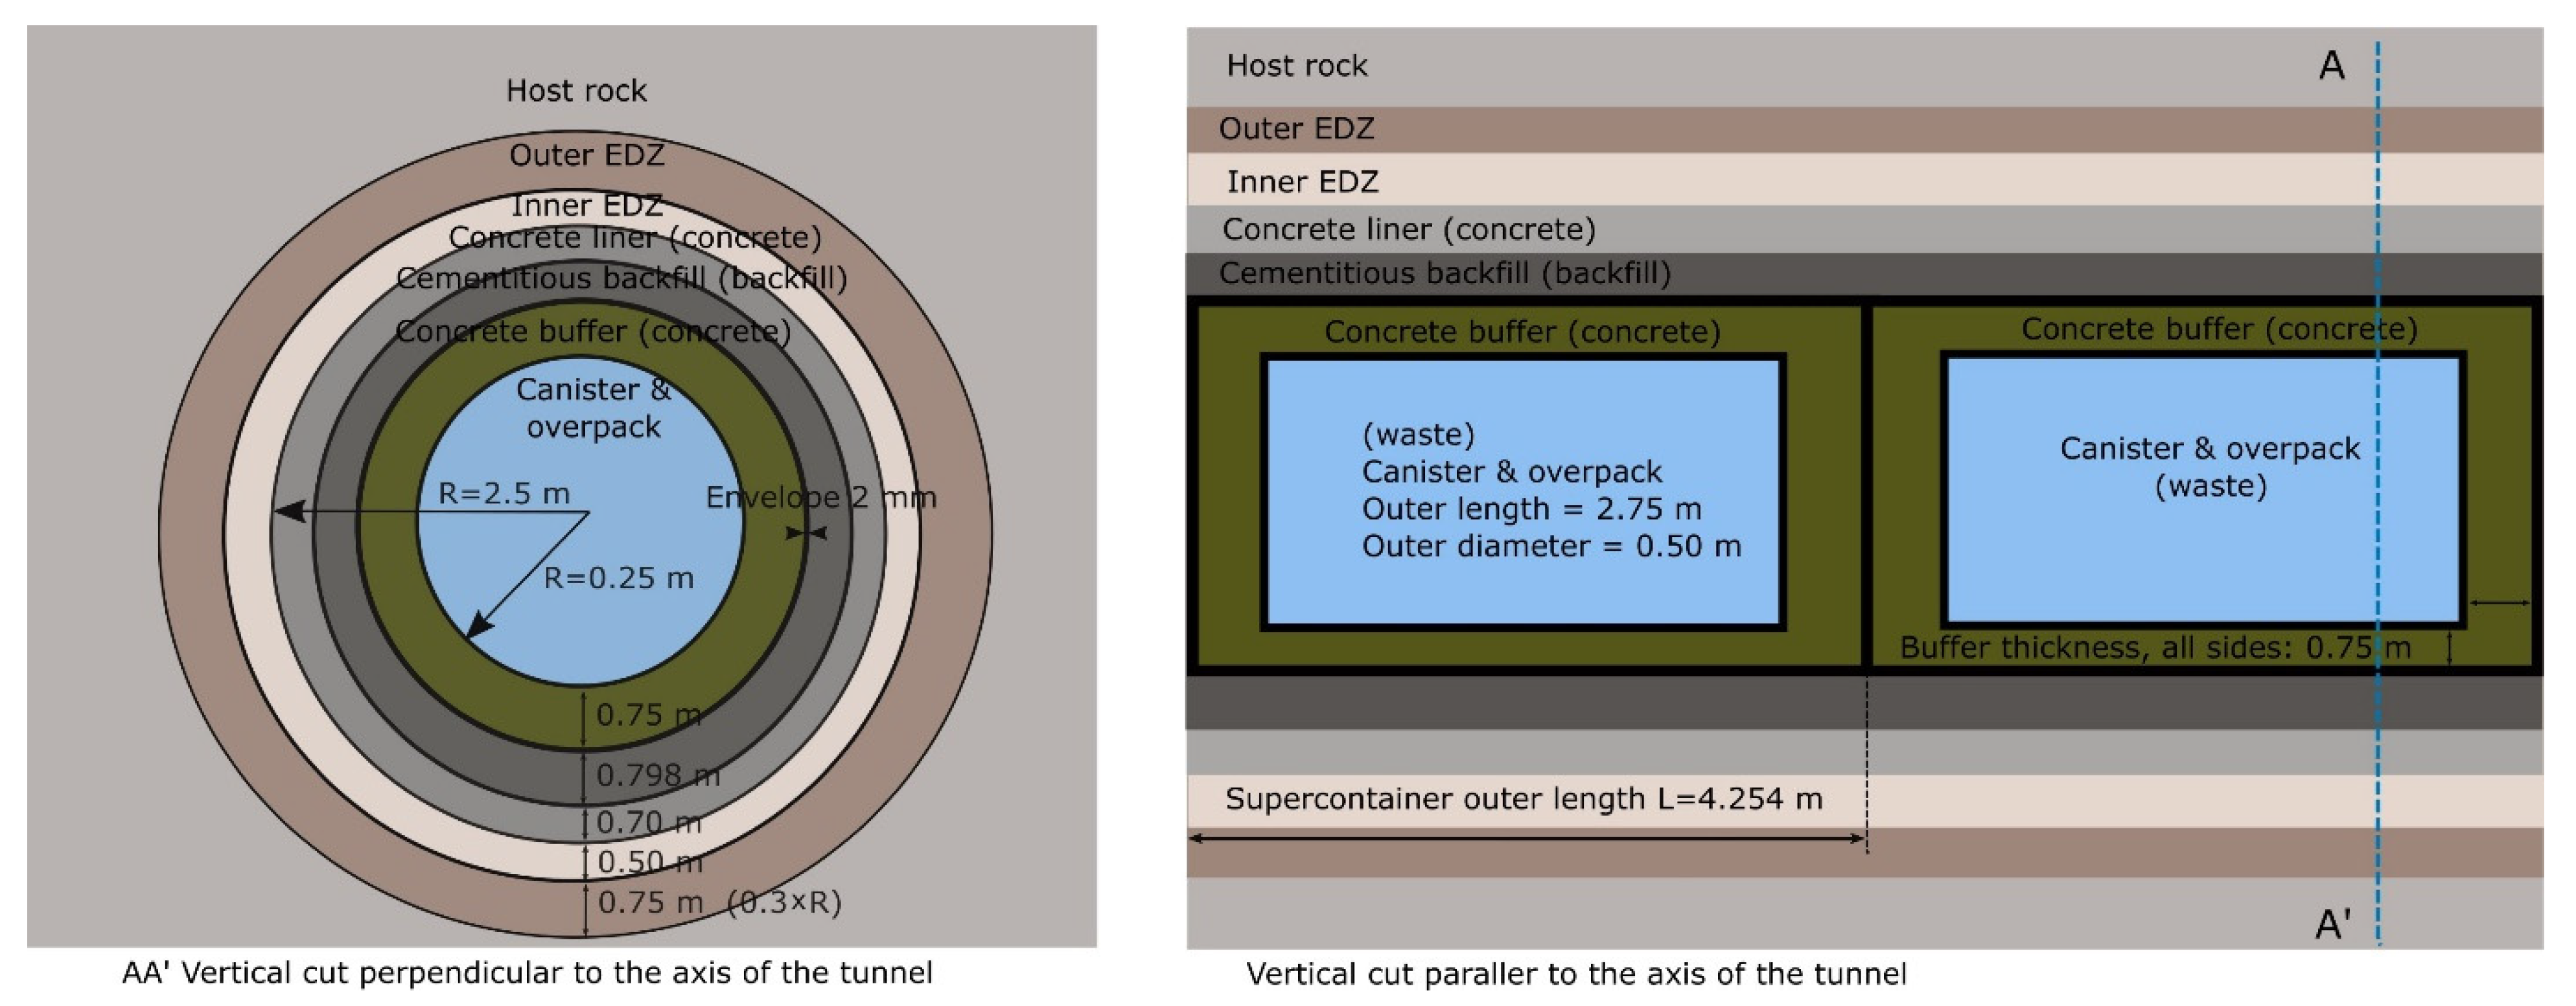
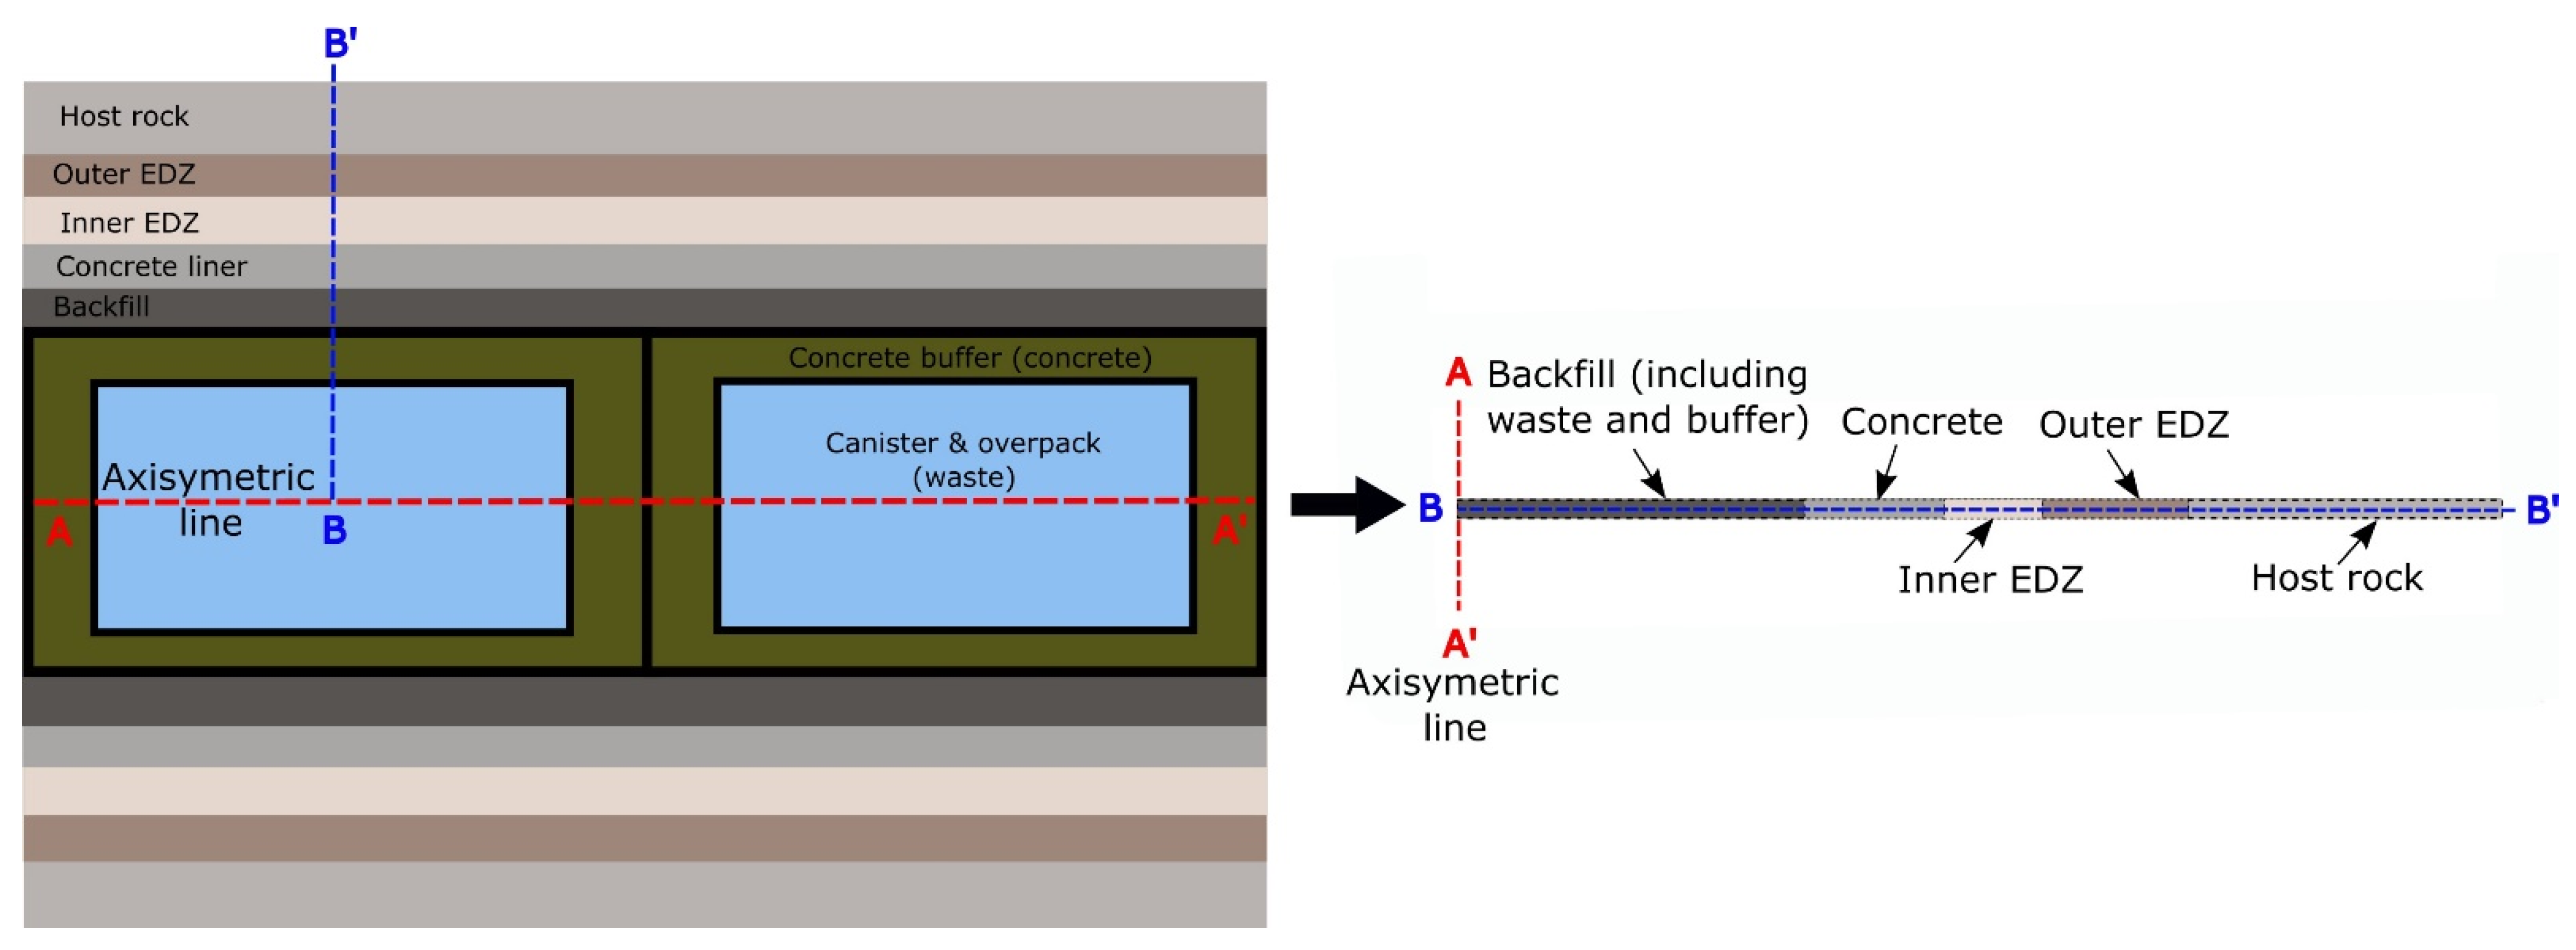
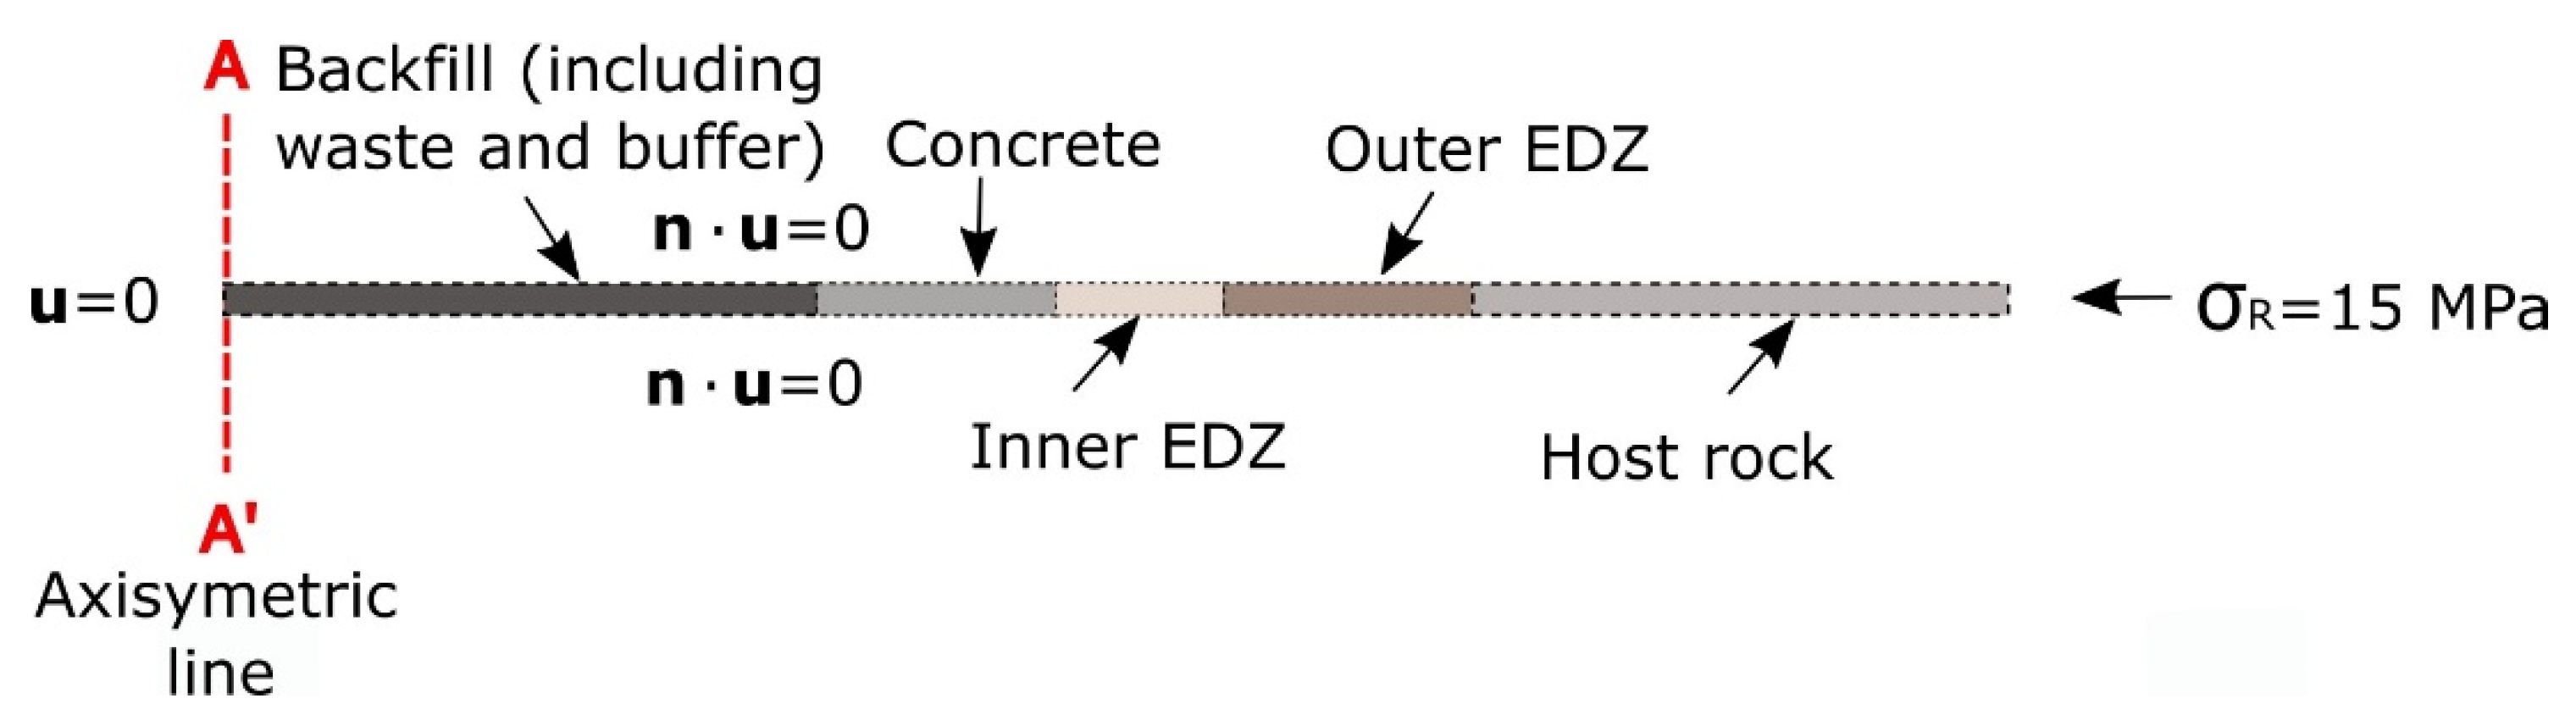
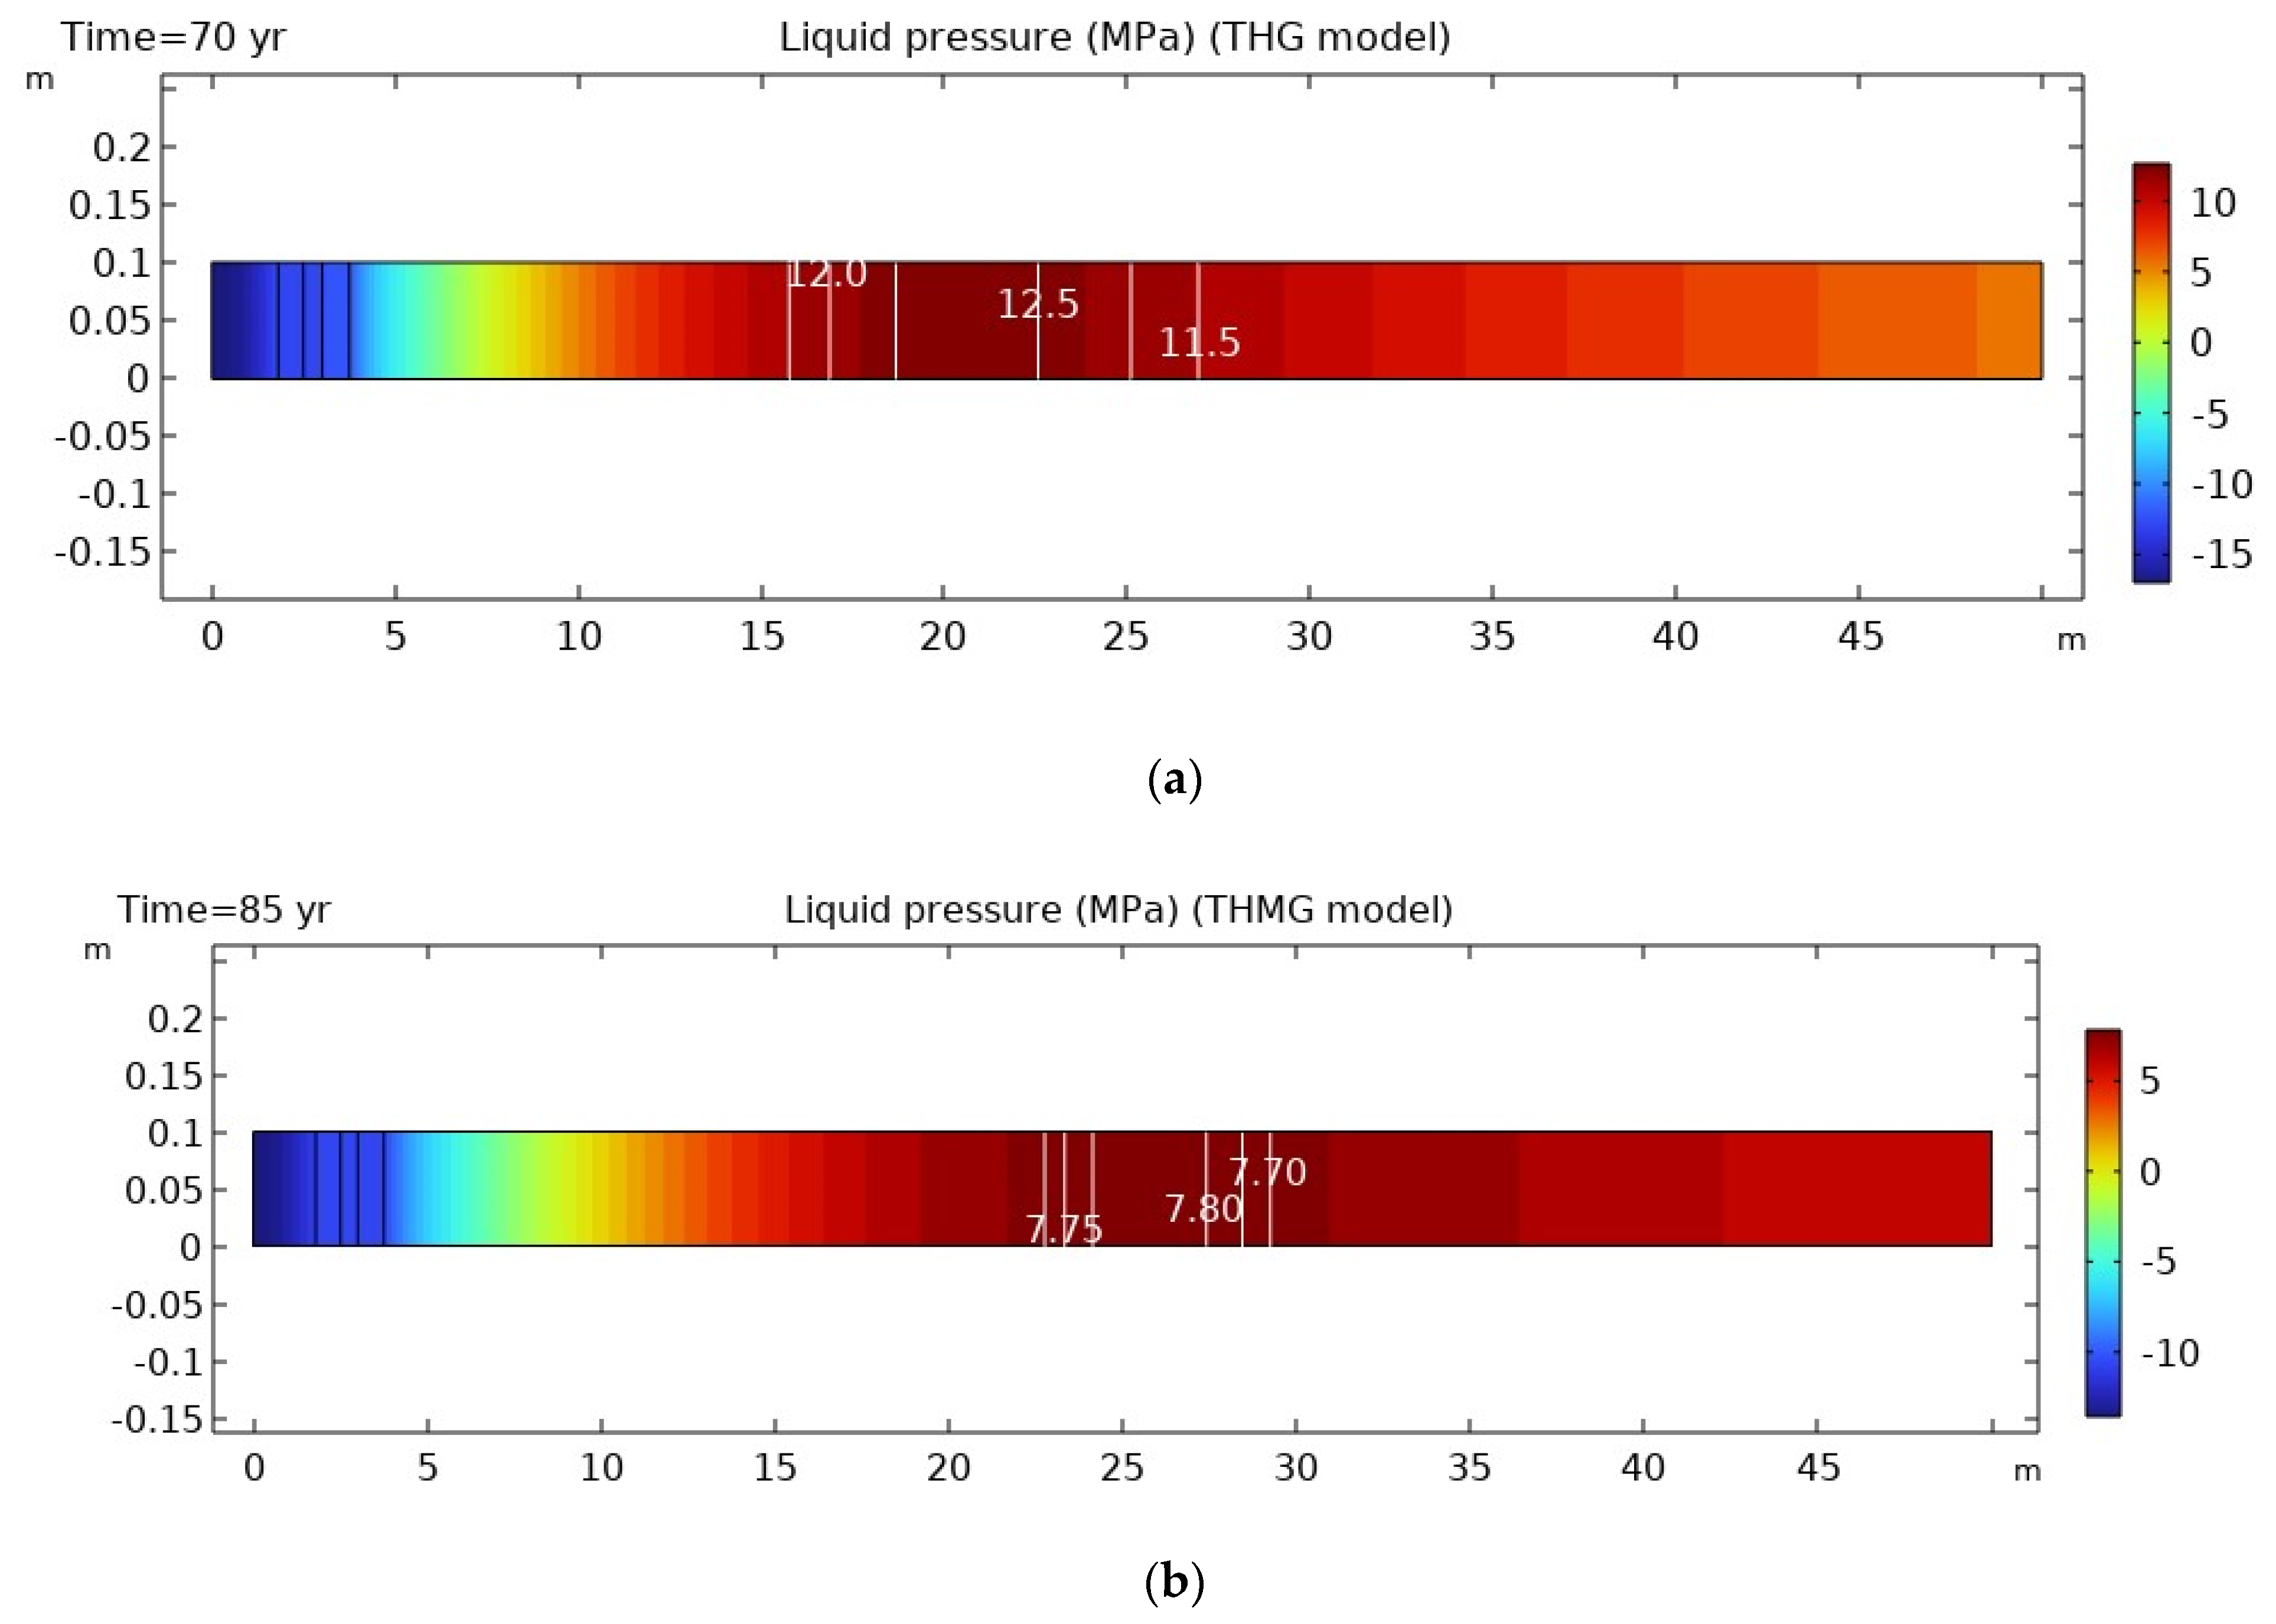
Geometry and Discretization

For the analysis of H2 gas behavior in the deposition tunnel of a generic repository (Zone B), a 2Daxisymetric model was created (R = 50 m, Z = 0.1 m). Such a model configuration will allow to analyze the evolution of water- and corrosion-induced gas flow around the deposition tunnel without a gradient along the tunnel. The extent of the model took into account a half-distance between two adjacent deposition tunnels and is 50 m long (see Figure 3). A simplification regarding Zone B materials was made: Canister and overpack (r = 0.25 m) and Envelope (d = 0.02 m) were represented by cementitious backfill. For this reason, 5 different materials were defined in the numerical model.
The modelling domain was discretized into triangular mesh elements (<4000).

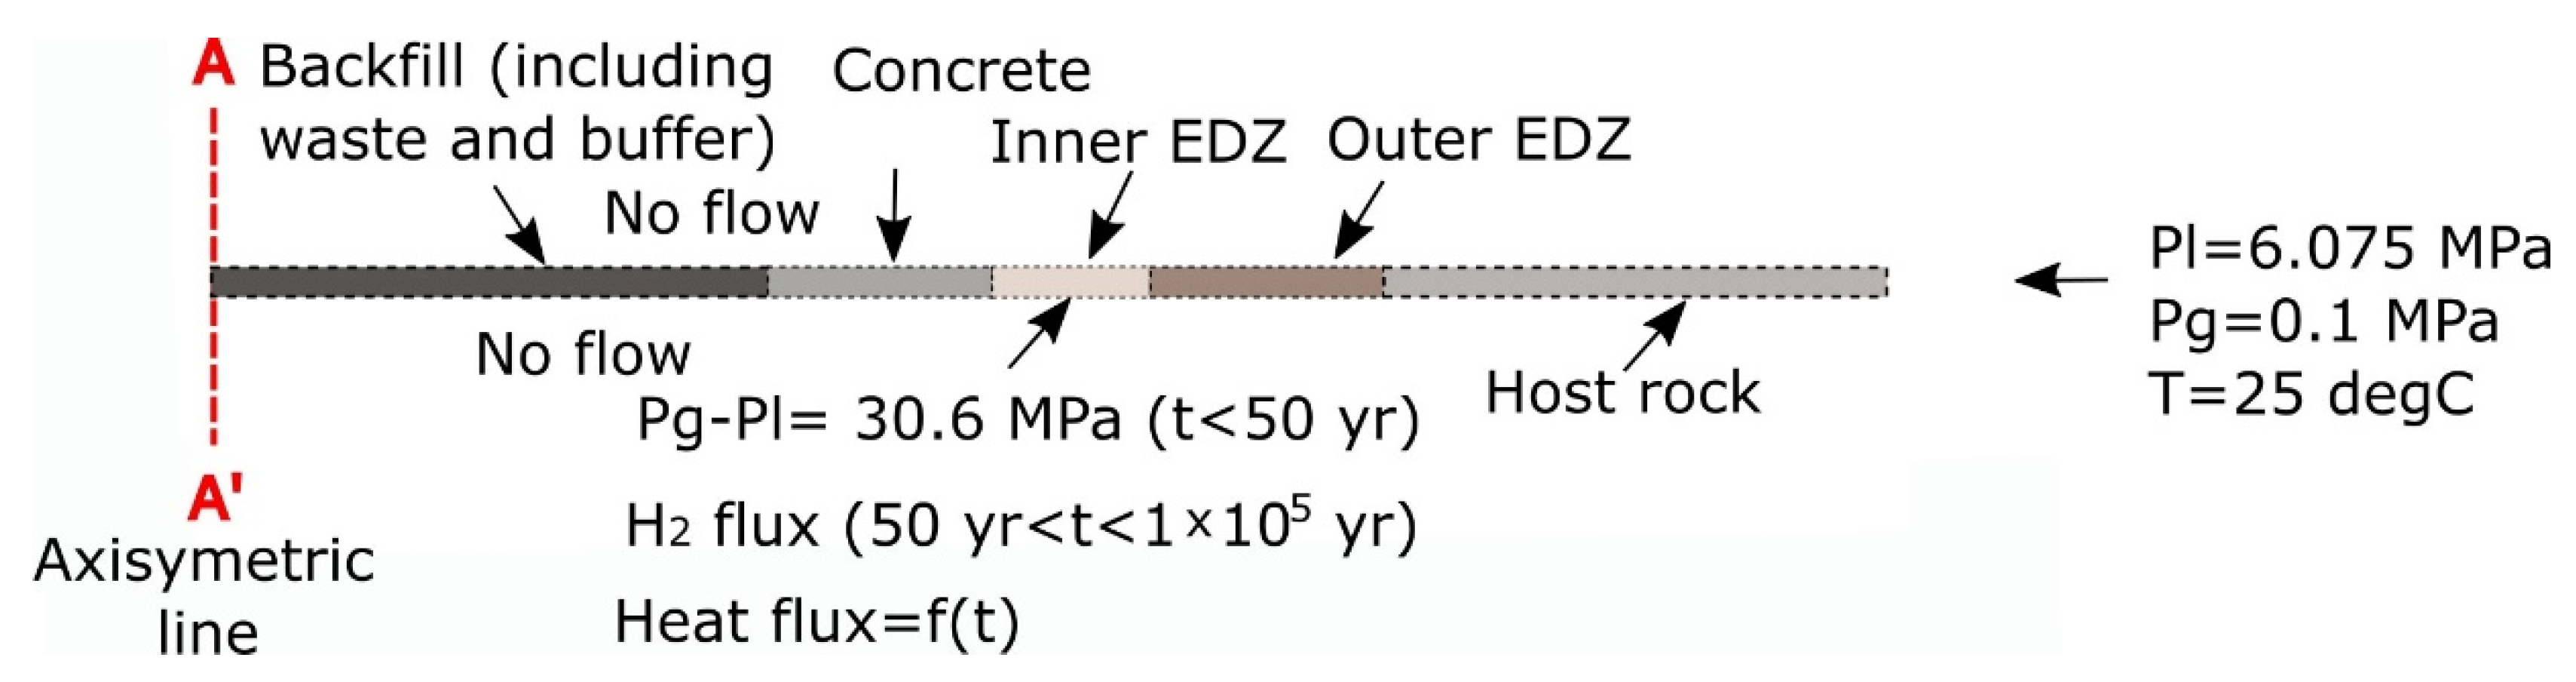
2.3. Initial and Boundary Conditions

Initial and boundary conditions for the numerical model were interpreted considering the information provided in specification [11]. It is specified that the disposal tunnels are situated in the middle of the host rock of 150 m thickness. The conditions on the host rock top are z = −525 m, T = 23 °C, Pw = 5.25 MPa, σv = 13.13 MPa. The conditions on the host rock bottom are z = −675 m, T = 27 °C, Pw = 6.9 MPa, σv = 16.88 MPa.
It was assumed that the deposition tunnel was excavated instantly. and all materials were placed there. The backfill and concrete were initially unsaturated (~80%). Then, the interface (at r = 2.5 m) between the concrete and the inner EDZ was ventilated for 50 years (at RH = 80%, corresponding to constant suction of 30.6 MPa). Initially, liquid and gas pressures in the host rock were 6.075 MPa and 0.1 MPa, respectively. Following axisymmetric model specialty, boundary conditions cannot be set different reflecting those on the top and bottom of host rock and between disposal tunnels. Thus, on the model boundary at 50 m, constant and Dirichlet boundary conditions were imposed (fixed liquid and gas pressures of 6.075 MPa and 0.1 MPa, respectively) (Figure 4). The liquid pressure corresponds to the groundwater pressure at the repository level.
Gas generation started after 50 years of ventilation (0.25 mol/y or 1.5 × 10⁻¹¹ kg/(m2∙s)), and it was specified at the interface between the backfill and concrete (at r = 1.8 m). Hydrogen gas generation at constant rate in the deposition tunnel lasted from T = 50 up to T = 100,000 years. At 100,000 years, gas generation stopped. After 100,000 years, the resaturation phase started and simulated till 150,000 years.
The initial temperature in the model domains and on the host rock boundary (at 50 m) was set equal to the temperature at the repository level (25 °C). The heat load from the disposal canister was represented via time-dependent (decreasing) heat flux specified at the backfill–concrete interface (at r = 1.8 m) (Table 1).
For the mechanical analysis, the initial stress in the host rock and the EDZ was simulated first with selected boundary conditions (Figure 5). The boundary load for the axisymmetric model geometry was assigned equal to the compressive total stress at the repository level (15 MPa). Steady–state stress distribution was set as the initial stress for the transient analysis.
For the analysis, several observation points were defined, as indicated in Table 2.

2.4. Input Parameters

THM-related properties of the analyzed barriers are provided in specification [11] and summarized in Table 3.

3. Results and Discussion

For the analysis of the hydrogen generation impact on relevant indicators, such as liquid and gas pressures, several cases were defined. Firstly, the evolution of pore pressure and gas pressure around the deposition tunnel was analyzed without heat load. The impact of the water retention curve was also tested. Then, the pressure evolution and desaturation/resaturation was simulated considering heat load. Finally, the mechanical processes (poroelasticity) were considered.

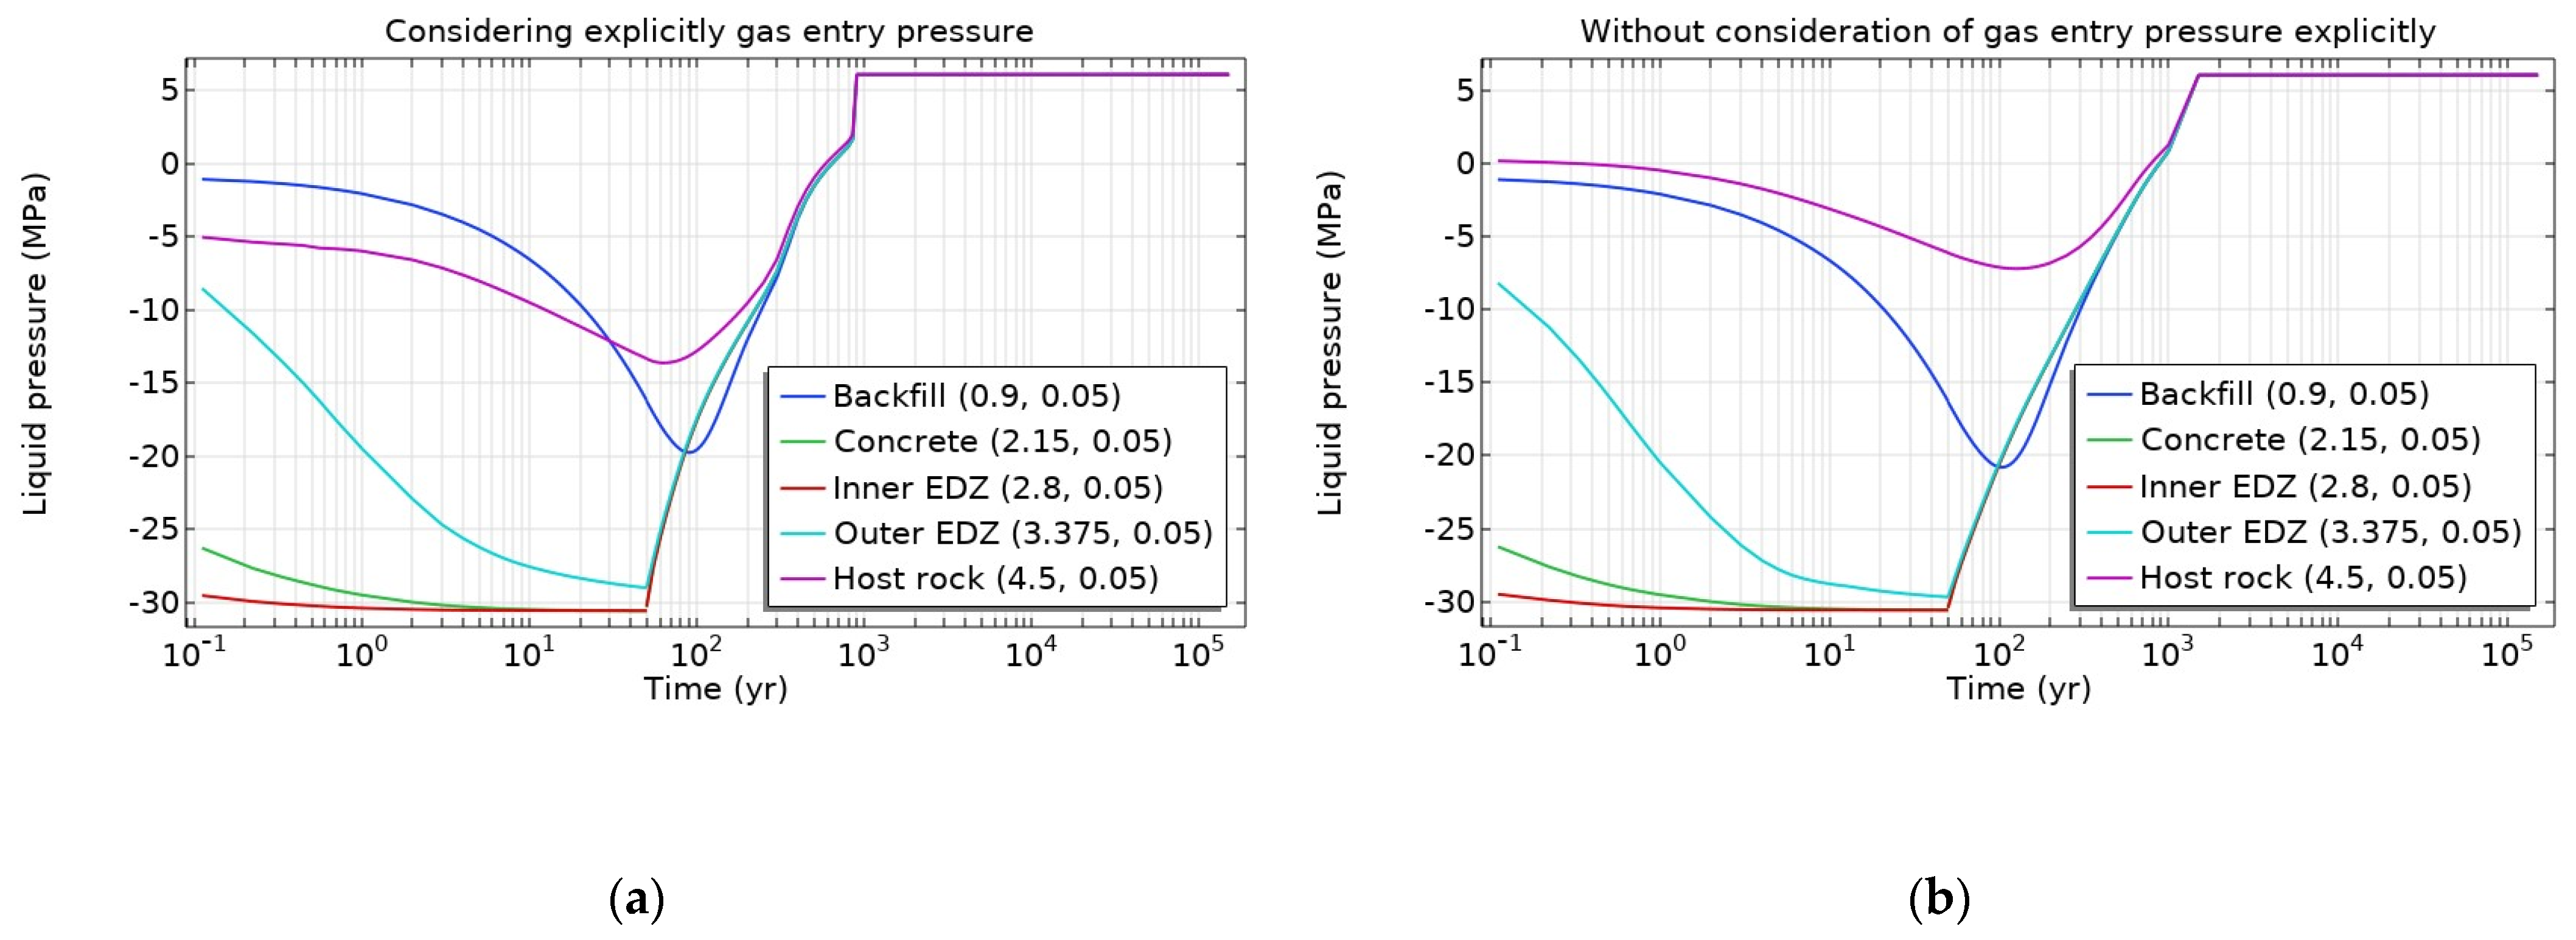
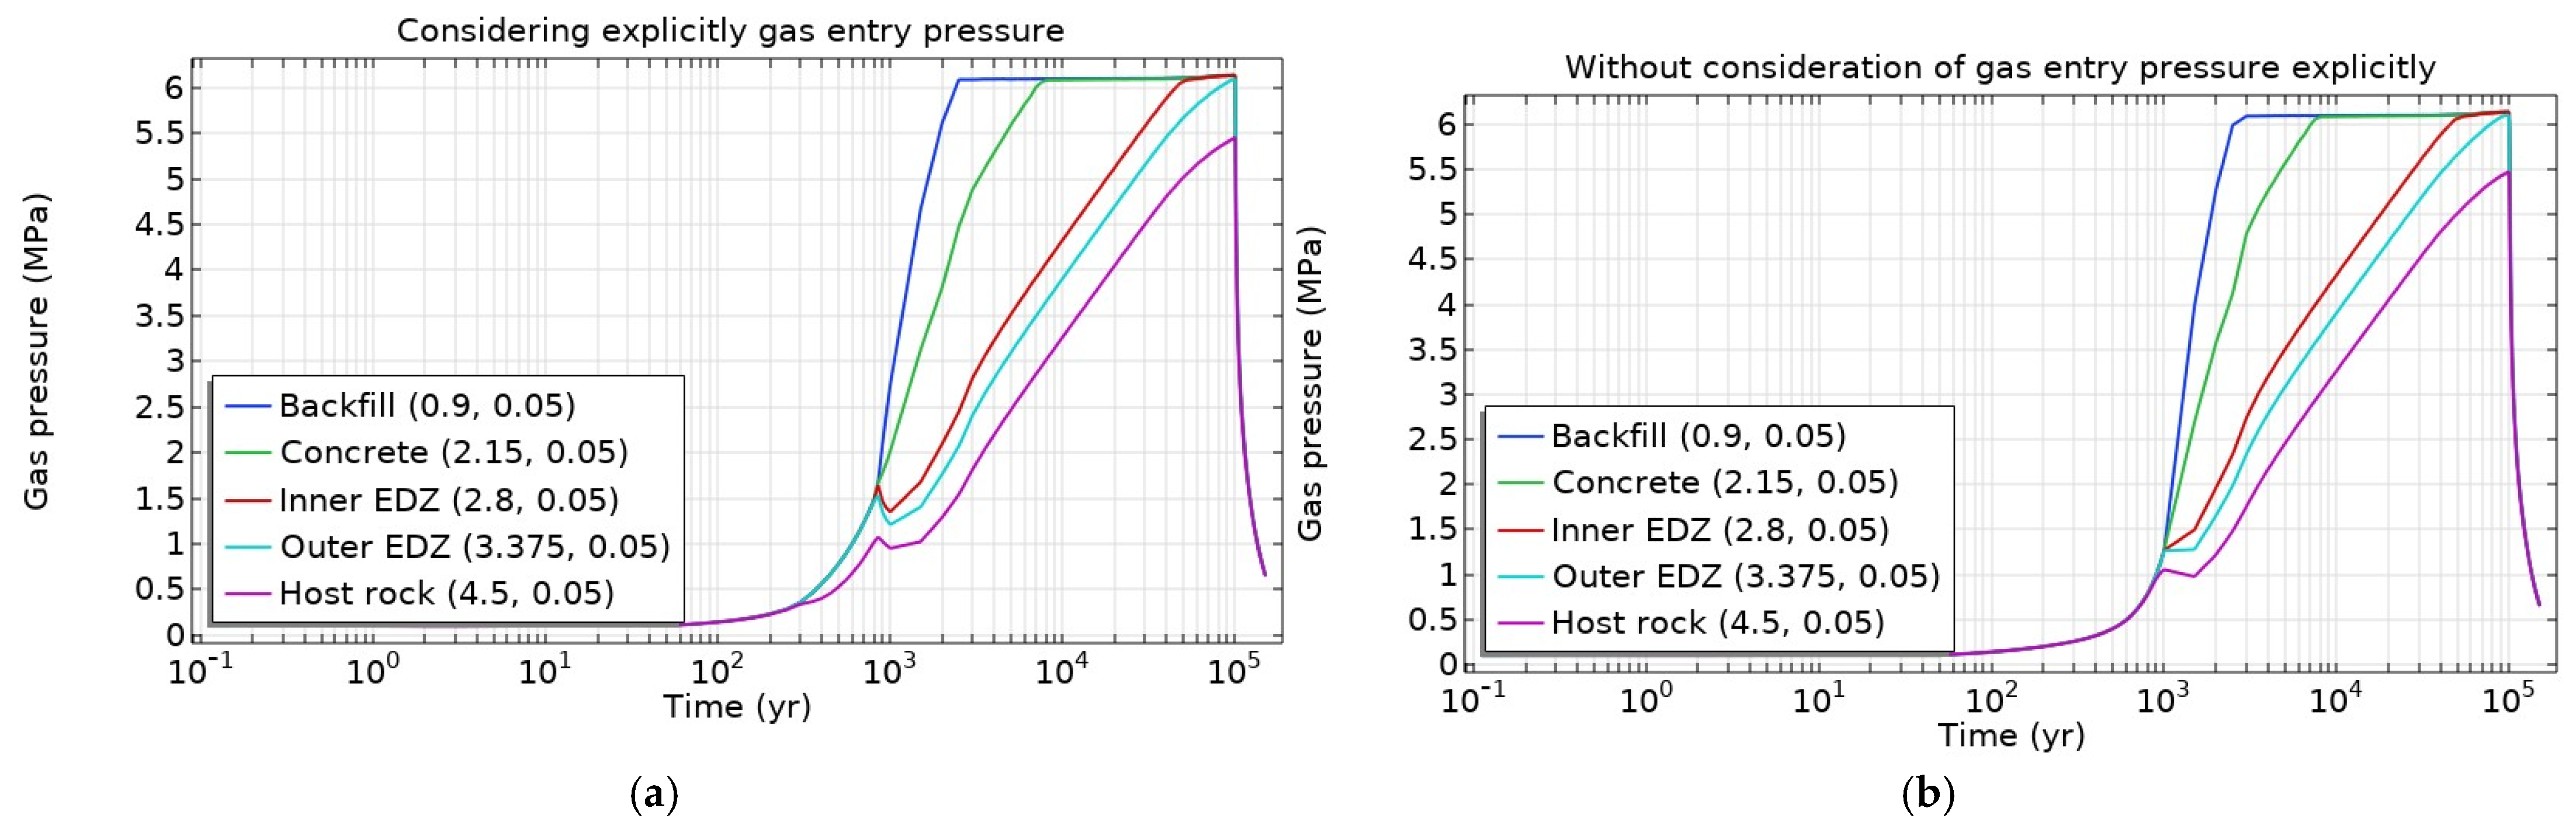
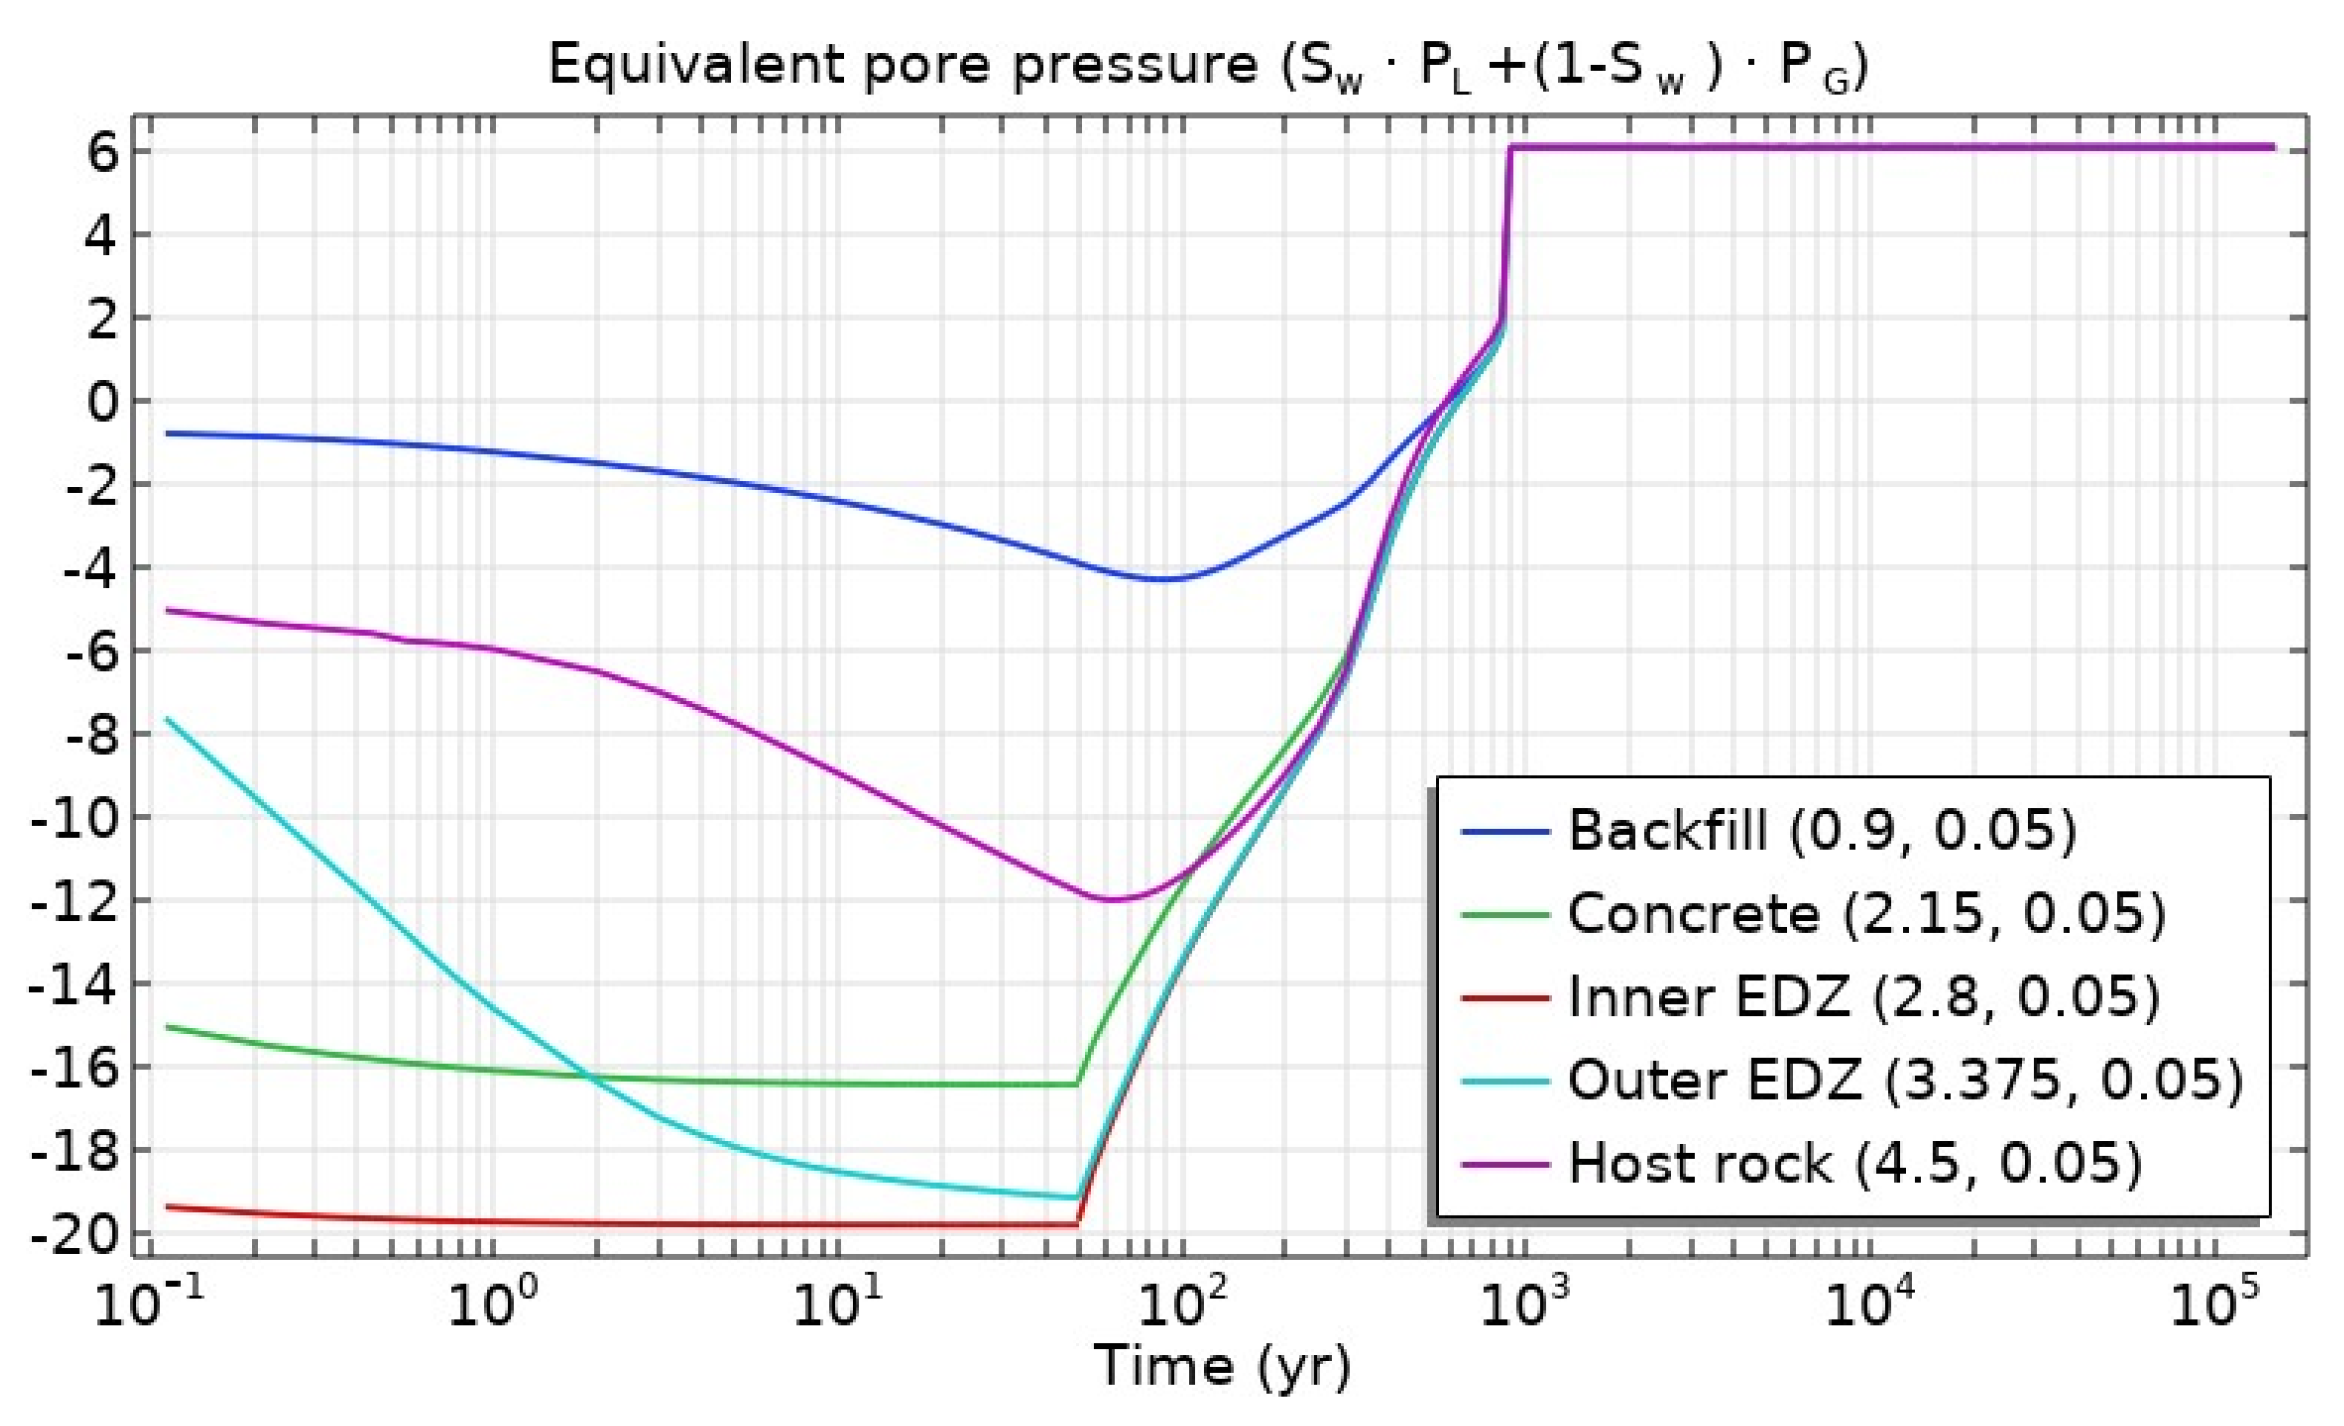
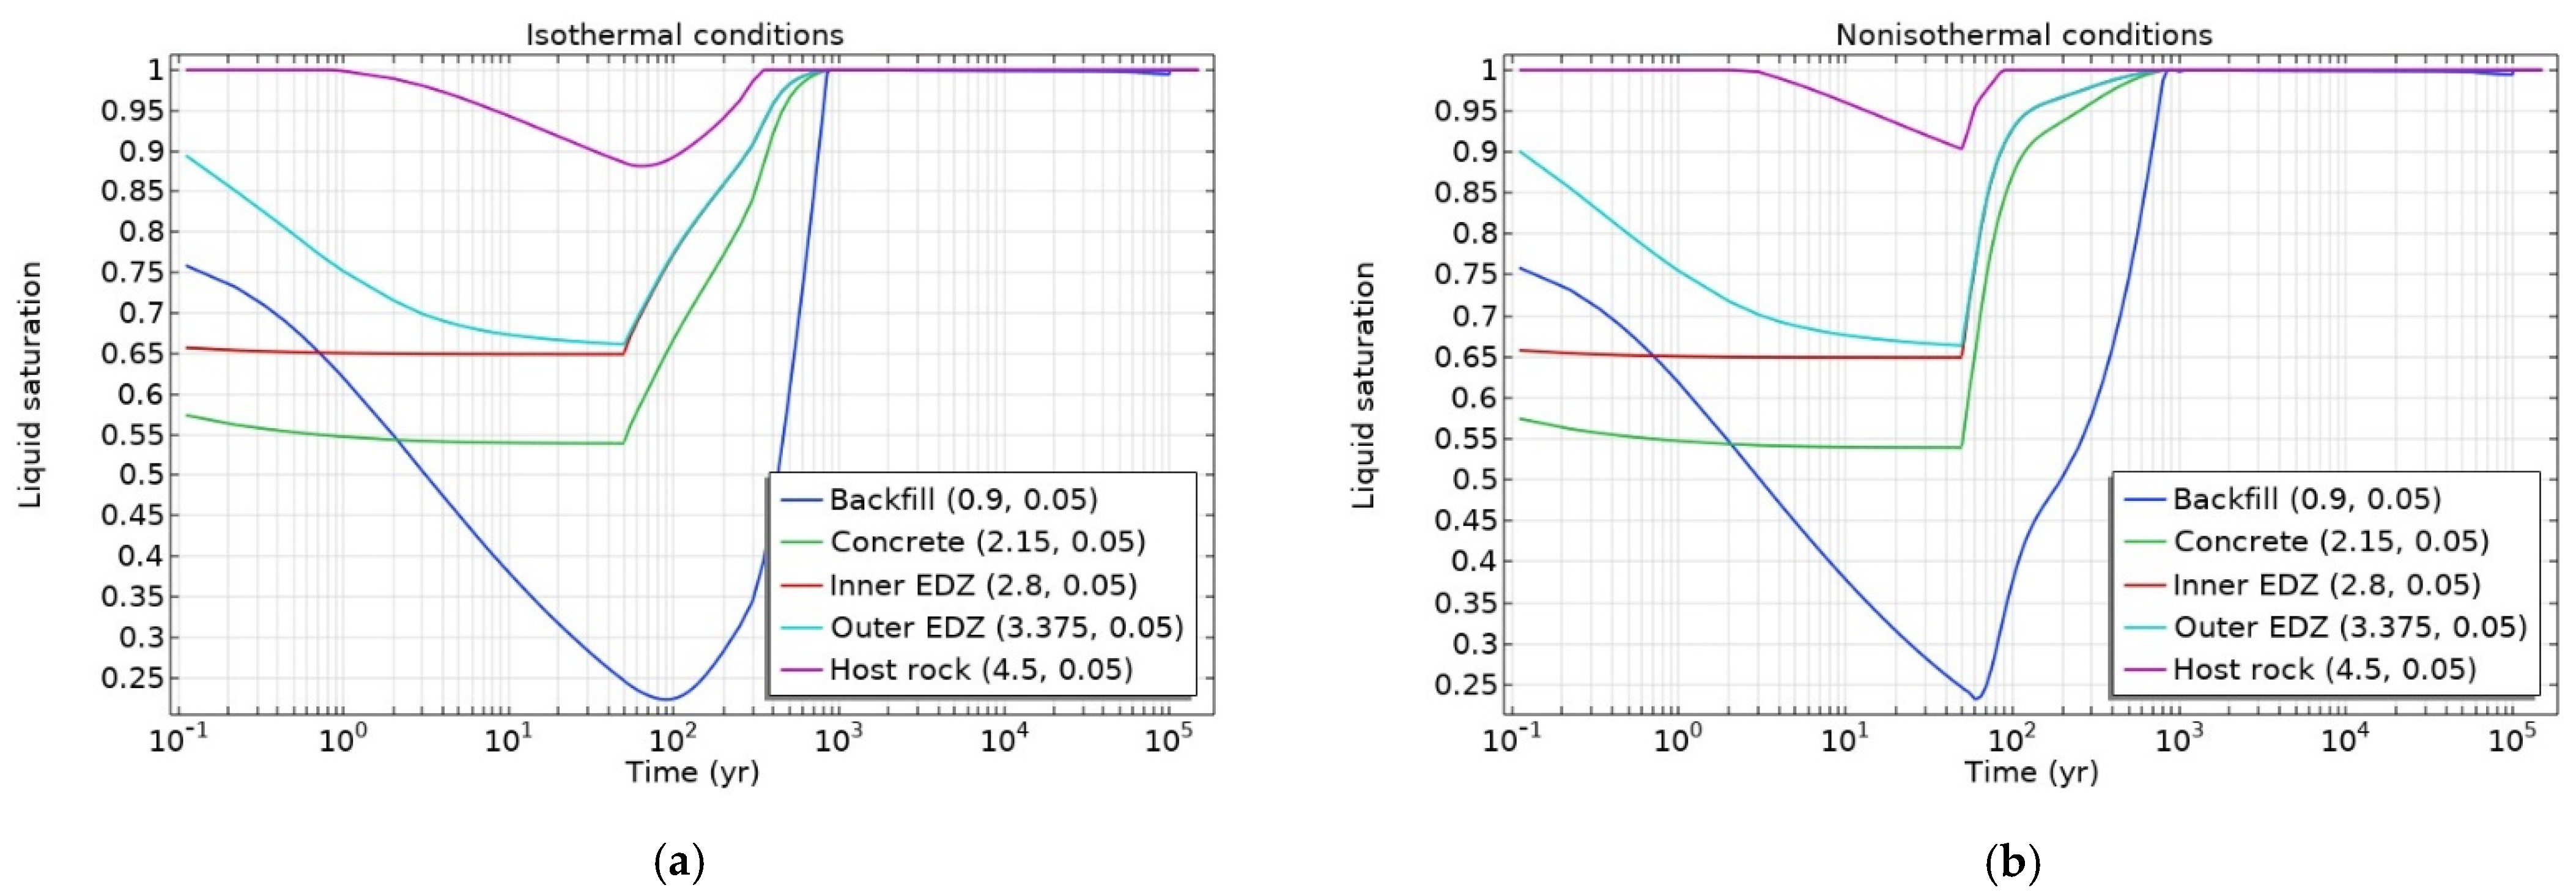
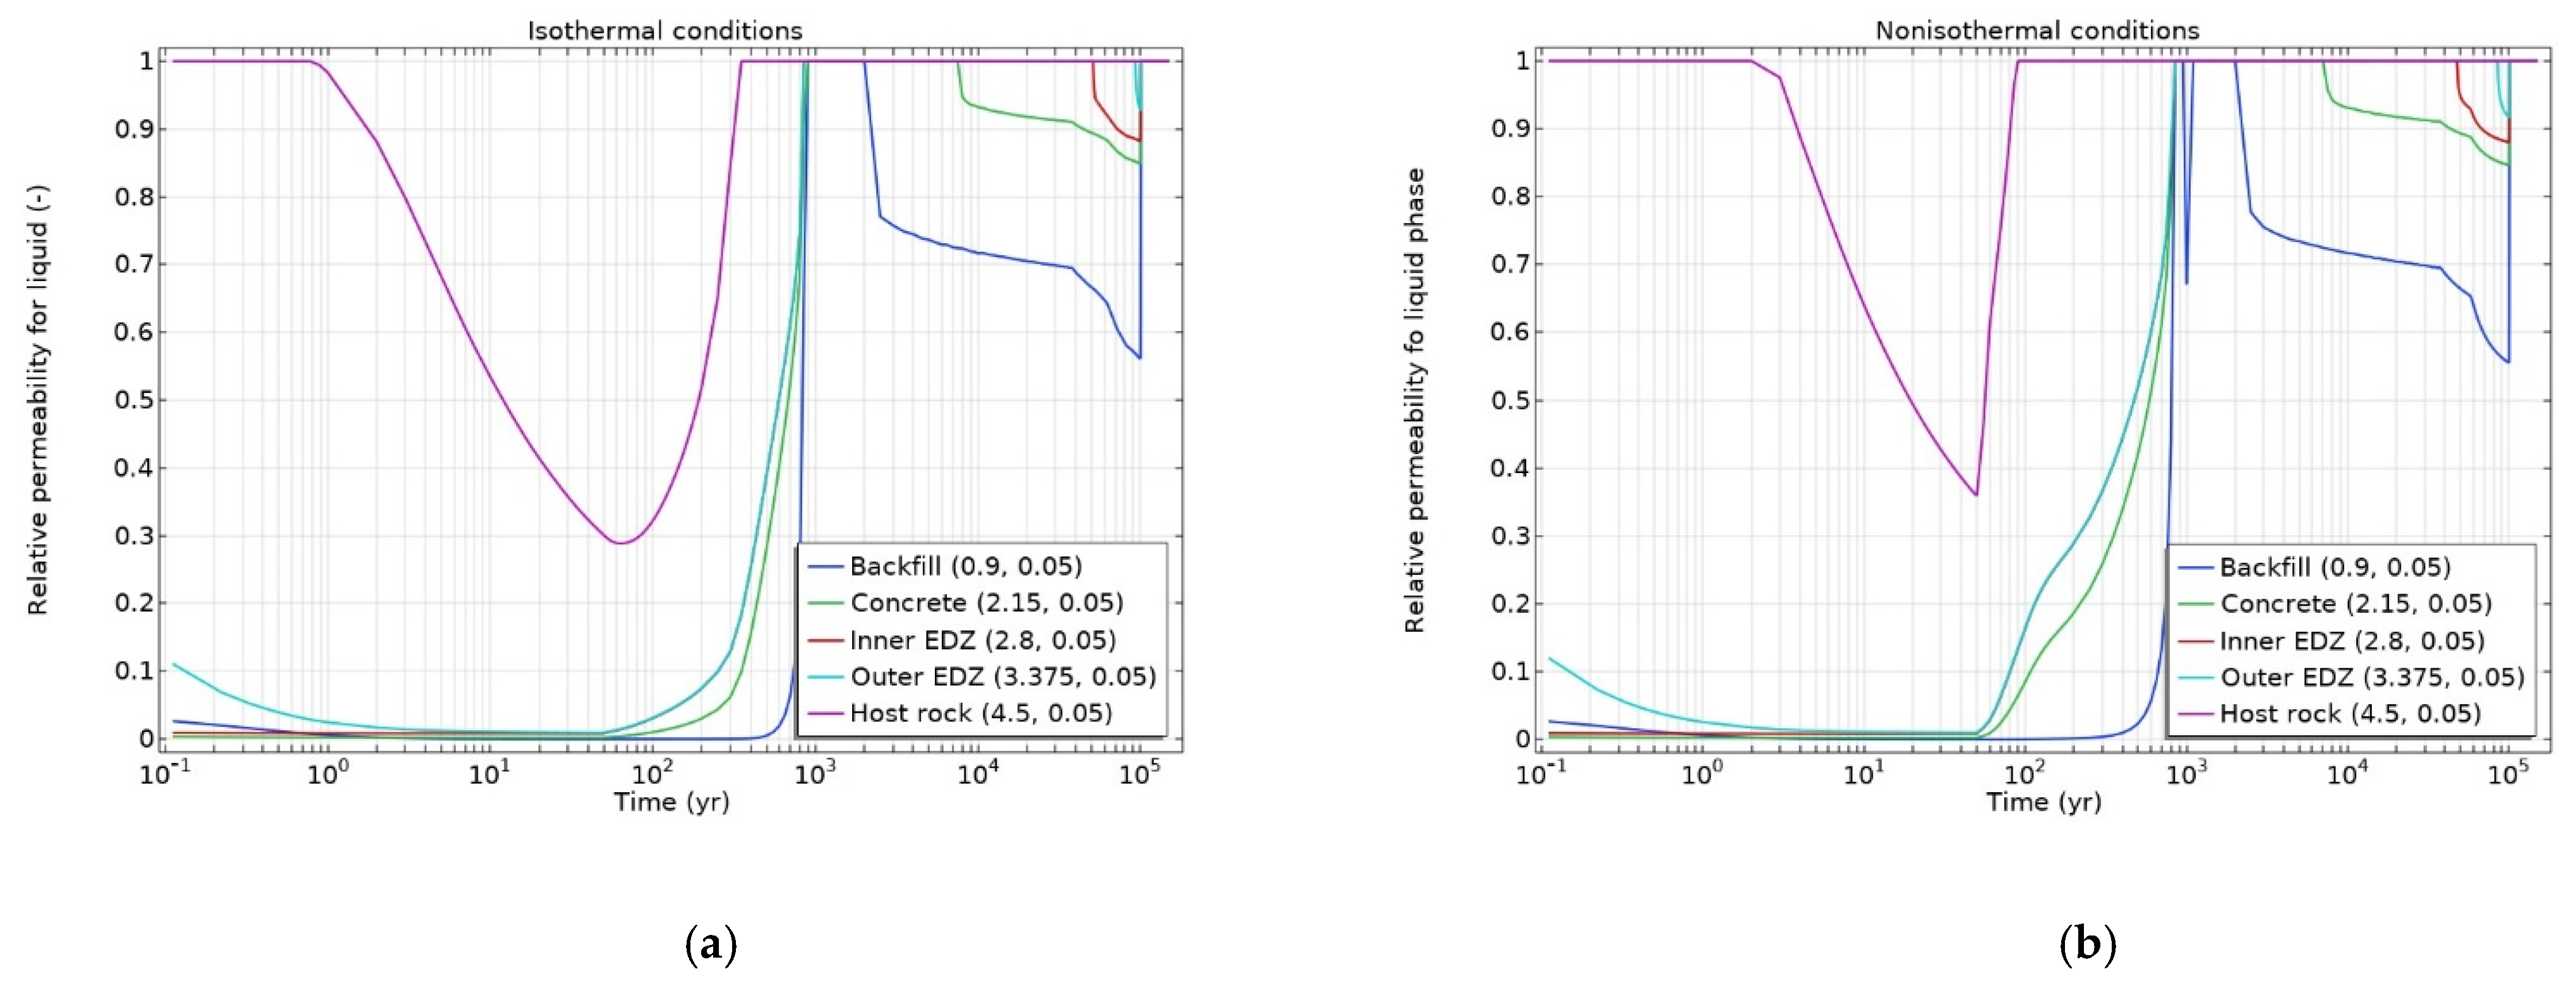
3.1. Isothermal Conditions

Modelling of transient hydraulic conditions around the deposition tunnel was performed considering H2 generation and without it. The simulation of liquid and gas pressure evolution around the deposition tunnel showed that 50 years of ventilation led to desaturation of the inner and the outer EDZs and a part of the host rock. It also led to a decrease in the initial saturation of the backfill and concrete. When the ventilation phase finished, the system resaturation started by the groundwater coming from the surrounding clayey host rock. Thus, the host rock undergoes resaturation first. The system transition from desaturated to resaturated is represented in Figure 6.
As can be seen in Figure 6, ventilation caused desaturation of the inner and the outer EDZs and a part of the host rock; the engineered barriers (backfill, concrete) become more unsaturated than initially. Despite the beginning of H2 gas generation at 50 years, the system continued to resaturate. Similar resaturation trends and time for full saturation were obtained with the H model (no gas generation) and the HG model (with gas generation). The host rock at the observation point (2 m away from the tunnel wall) was resaturated after ~350 years, and full water saturation at middle points of all other materials was achieved after ~800 years (H model) and 850–900 years (HG model). The evolution of the relative permeability presented in Figure 6 clearly indicates that with continued H2 gas generation, the time to build up gas pressure was needed to desaturate the materials again. The materials closer to the gas generation point were desaturated sooner and to a larger extent (backfill, concrete, inner and outer EDZs). However, the host rock 2 m away from the tunnel wall was not desaturated despite H2 gas generation. Once the gas generation was finished, the disposal system quickly became fully water-saturated.
Figure 7a presents the simulation results of liquid saturation distribution around the deposition tunnel after 50 years of ventilation. It indicates the maximal extent of the desaturated region around the deposition tunnel during the simulation. As can be seen from Figure 7a, considering explicitly the WRC and the relative permeability model as specified in specification [11], the host rock is desaturated up to 7.5 m in the host rock by the end of ventilation.
For comparison purposes, the saturation distribution was evaluated without explicit consideration of gas entry pressure (setting gas entry pressure to zero) (Figure 7b). Modelling without considering explicitly the gas entry pressure revealed that the host rock would be desaturated to a higher extent (up to 8 m) by the end of ventilation.
The impact of the WRC and the relative permeability model on the state of the analyzed materials (saturated/unsaturated) can be perceived from the relative permeability evolution presented in Figure 8. The extent of the desaturated zone was larger without the explicit consideration of gas entry pressure, the lower permeability zone was also extended and this prolonged the time of full first resaturation after the ventilation end (Figure 8b). The host rock at the observation point (2 m away from the tunnel wall) was resaturated after ~350 years, and full water saturation at middle points of all other materials was achieved after ~850–900 years (Figure 8a). Meanwhile, without consideration of gas entry pressure explicitly, the observation point in the host rock (2 m away from the tunnel wall) was resaturated before ~950 years, and full water saturation at middle points of all other materials was achieved by ~1500 years (Figure 8a).
The start of the second desaturation due to H2 gas generation was predicted later for the backfill with the classical van Genuchten–Mualem model, while there was no significant impact on gas-induced desaturation start for other materials. Thus, the selected/assumed water retention and relative permeability model would be important while deriving conclusion on resaturation/gas-induced desaturation time.
Relevant indicators such as liquid and gas pressures are presented in Figure 9 and Figure 10. As expected, the liquid pressure was decreasing due to ventilation resulting in more desaturated engineered materials and induced unsaturated conditions in the EDZ and a part of the host rock. The gas pressure increased gradually due to the H2 gas generation and the subsequent dissolution and diffusion around the deposition tunnel. Depending on the magnitude, the second desaturation was caused only in the regions where gas pressure exceeded the liquid pressure, and that difference was higher than the explicit gas entry pressure for a particular material.
It should be noted that under saturated conditions, the presented gas pressure (Figure 10) represents a partial pressure of dissolved H2.
As can be seen from the plots above, the selected water retention model had a more significant effect on the liquid pressure evolution than on gas pressure evolution trends. The gas pressure achieved its maximal value almost by the same time and the same magnitude (PG~6.14 MPa) in engineered barriers and the EDZ. During the gas generation phase (50–100,000 years), the dissolved gas concentration in the host rock (at 2 m away from the tunnel) was lower, resulting in a lower partial pressure (<5.5 MPa).
The gas pressure development is governed by a combination of a number of processes, instant gas generation does not lead to instant pressure build-up. Gas dissolves in water by Henry’s law, then it is transported away from the source. Diffusive flux of dissolved gas is governed by concentration gradient, which is higher in the beginning, and thus dissolved gas is transported away more quickly in the beginning. Dissolved gas is also transported by advective water flow. Hydrogen in gas phase is transported by advective gas flow and by binary diffusion. These transport mechanisms do not act separately, but they are interdependent. The conditions (unsaturated/saturated) will determine the hydraulic properties (permeabilities) and the fluxes subsequently. In the longer term, the equilibrium appears between constant gas generation and transport way from the source. This equilibrium was reached sooner in the observation points closer to the gas generation point, while it was not achieved in the point in the host rock.
The equivalent pore pressure estimated from the simulated gas and liquid pressures is presented in Figure 11.
Such equivalent pore pressure would lead to increased compressive effective stress up to 50 years, as it is expected in unsaturated soil. Later, the equivalent pore pressure changed from a negative to positive value. Thus, in the long-term perspective, the effective stress was lower than the total stress. For the analyzed host rock with isotropic compressive stress (σv = σH = σh = 15 MPa), this would lead to compressive effective stress of the 9 MPa magnitude (Equation (21)). Therefore, for such conditions, gas-induced fractures would not be expected, and the barrier integrity would not be affected. If particular zones in the repository would experience significantly lower compressive stresses or minor compressive stress is close to equivalent pore pressure, it should be investigated in more details as the material could appear in tensile stress state, and fracture development and propagation might be initiated. Under the conditions within the analyzed generic disposal system, the gas transport in engineered barriers and parts of the host rock (EDZ) would be governed by a capillary-controlled two-phase flow, while in the major part of the host rock the gas transport would be governed by diffusion in the dissolved form. This would also mean that a preferential flow pathway for gas and radionuclide transport would not be developed, and barrier transport properties would not be affected.

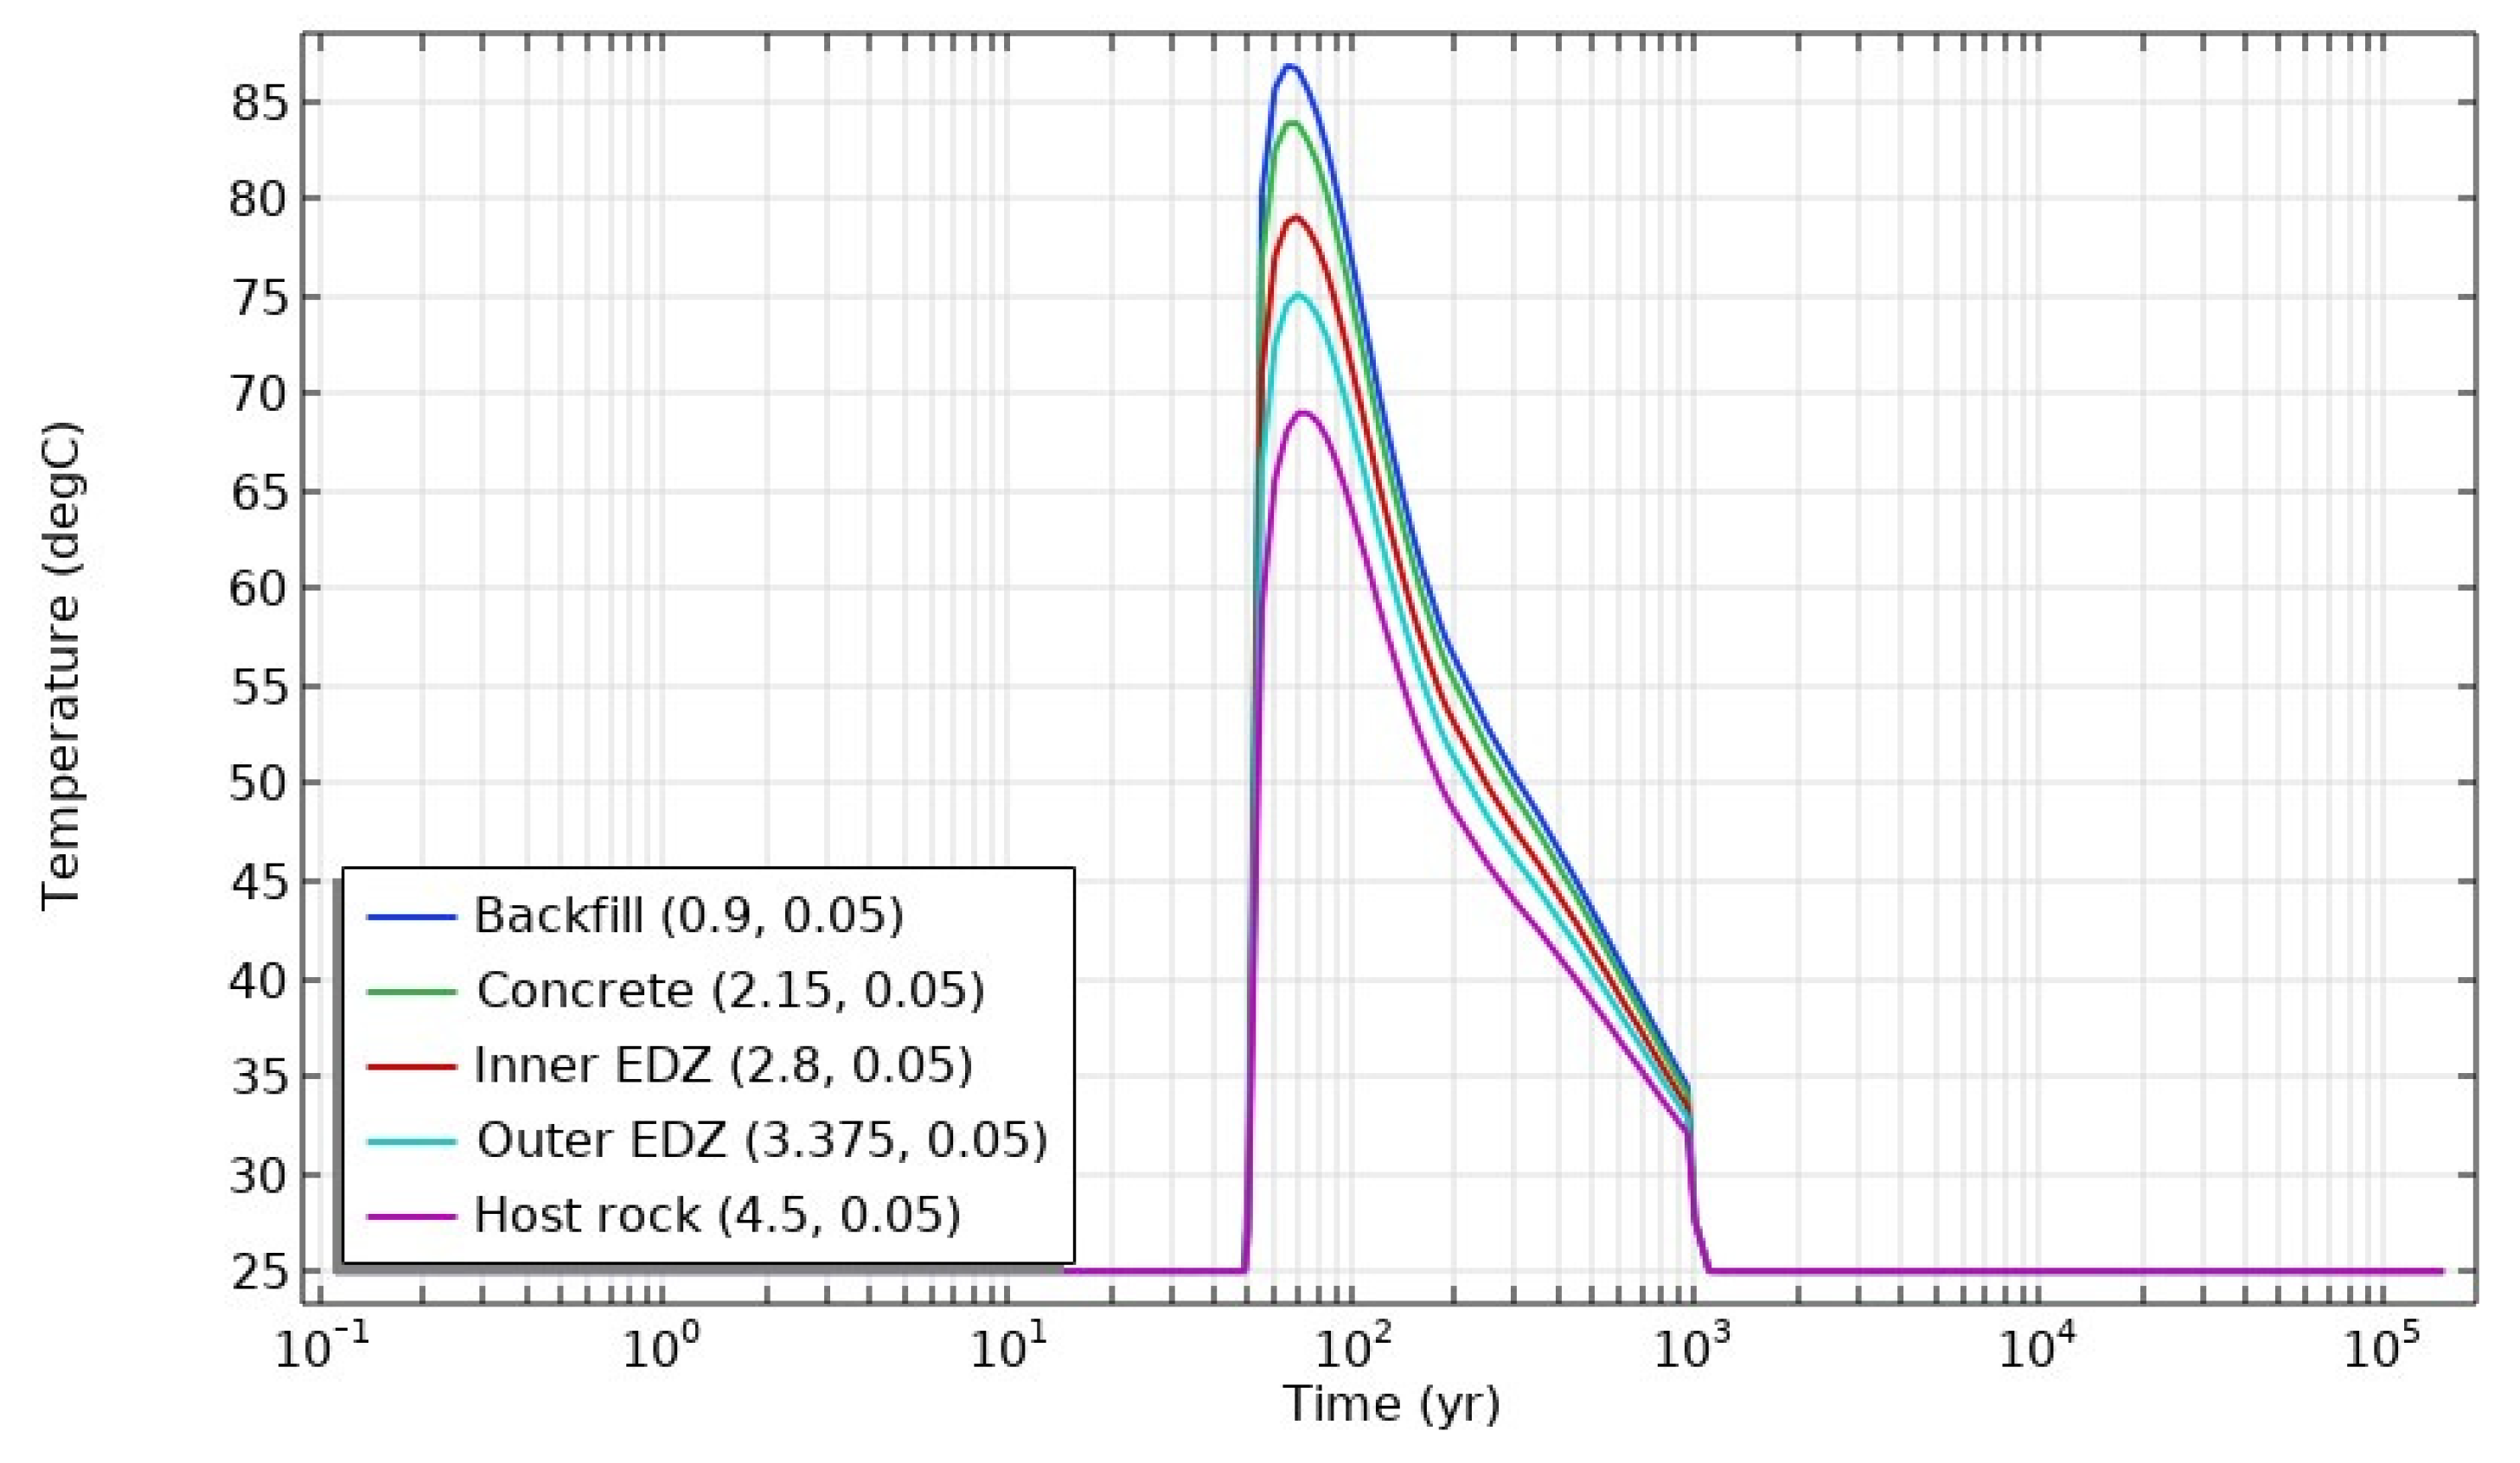
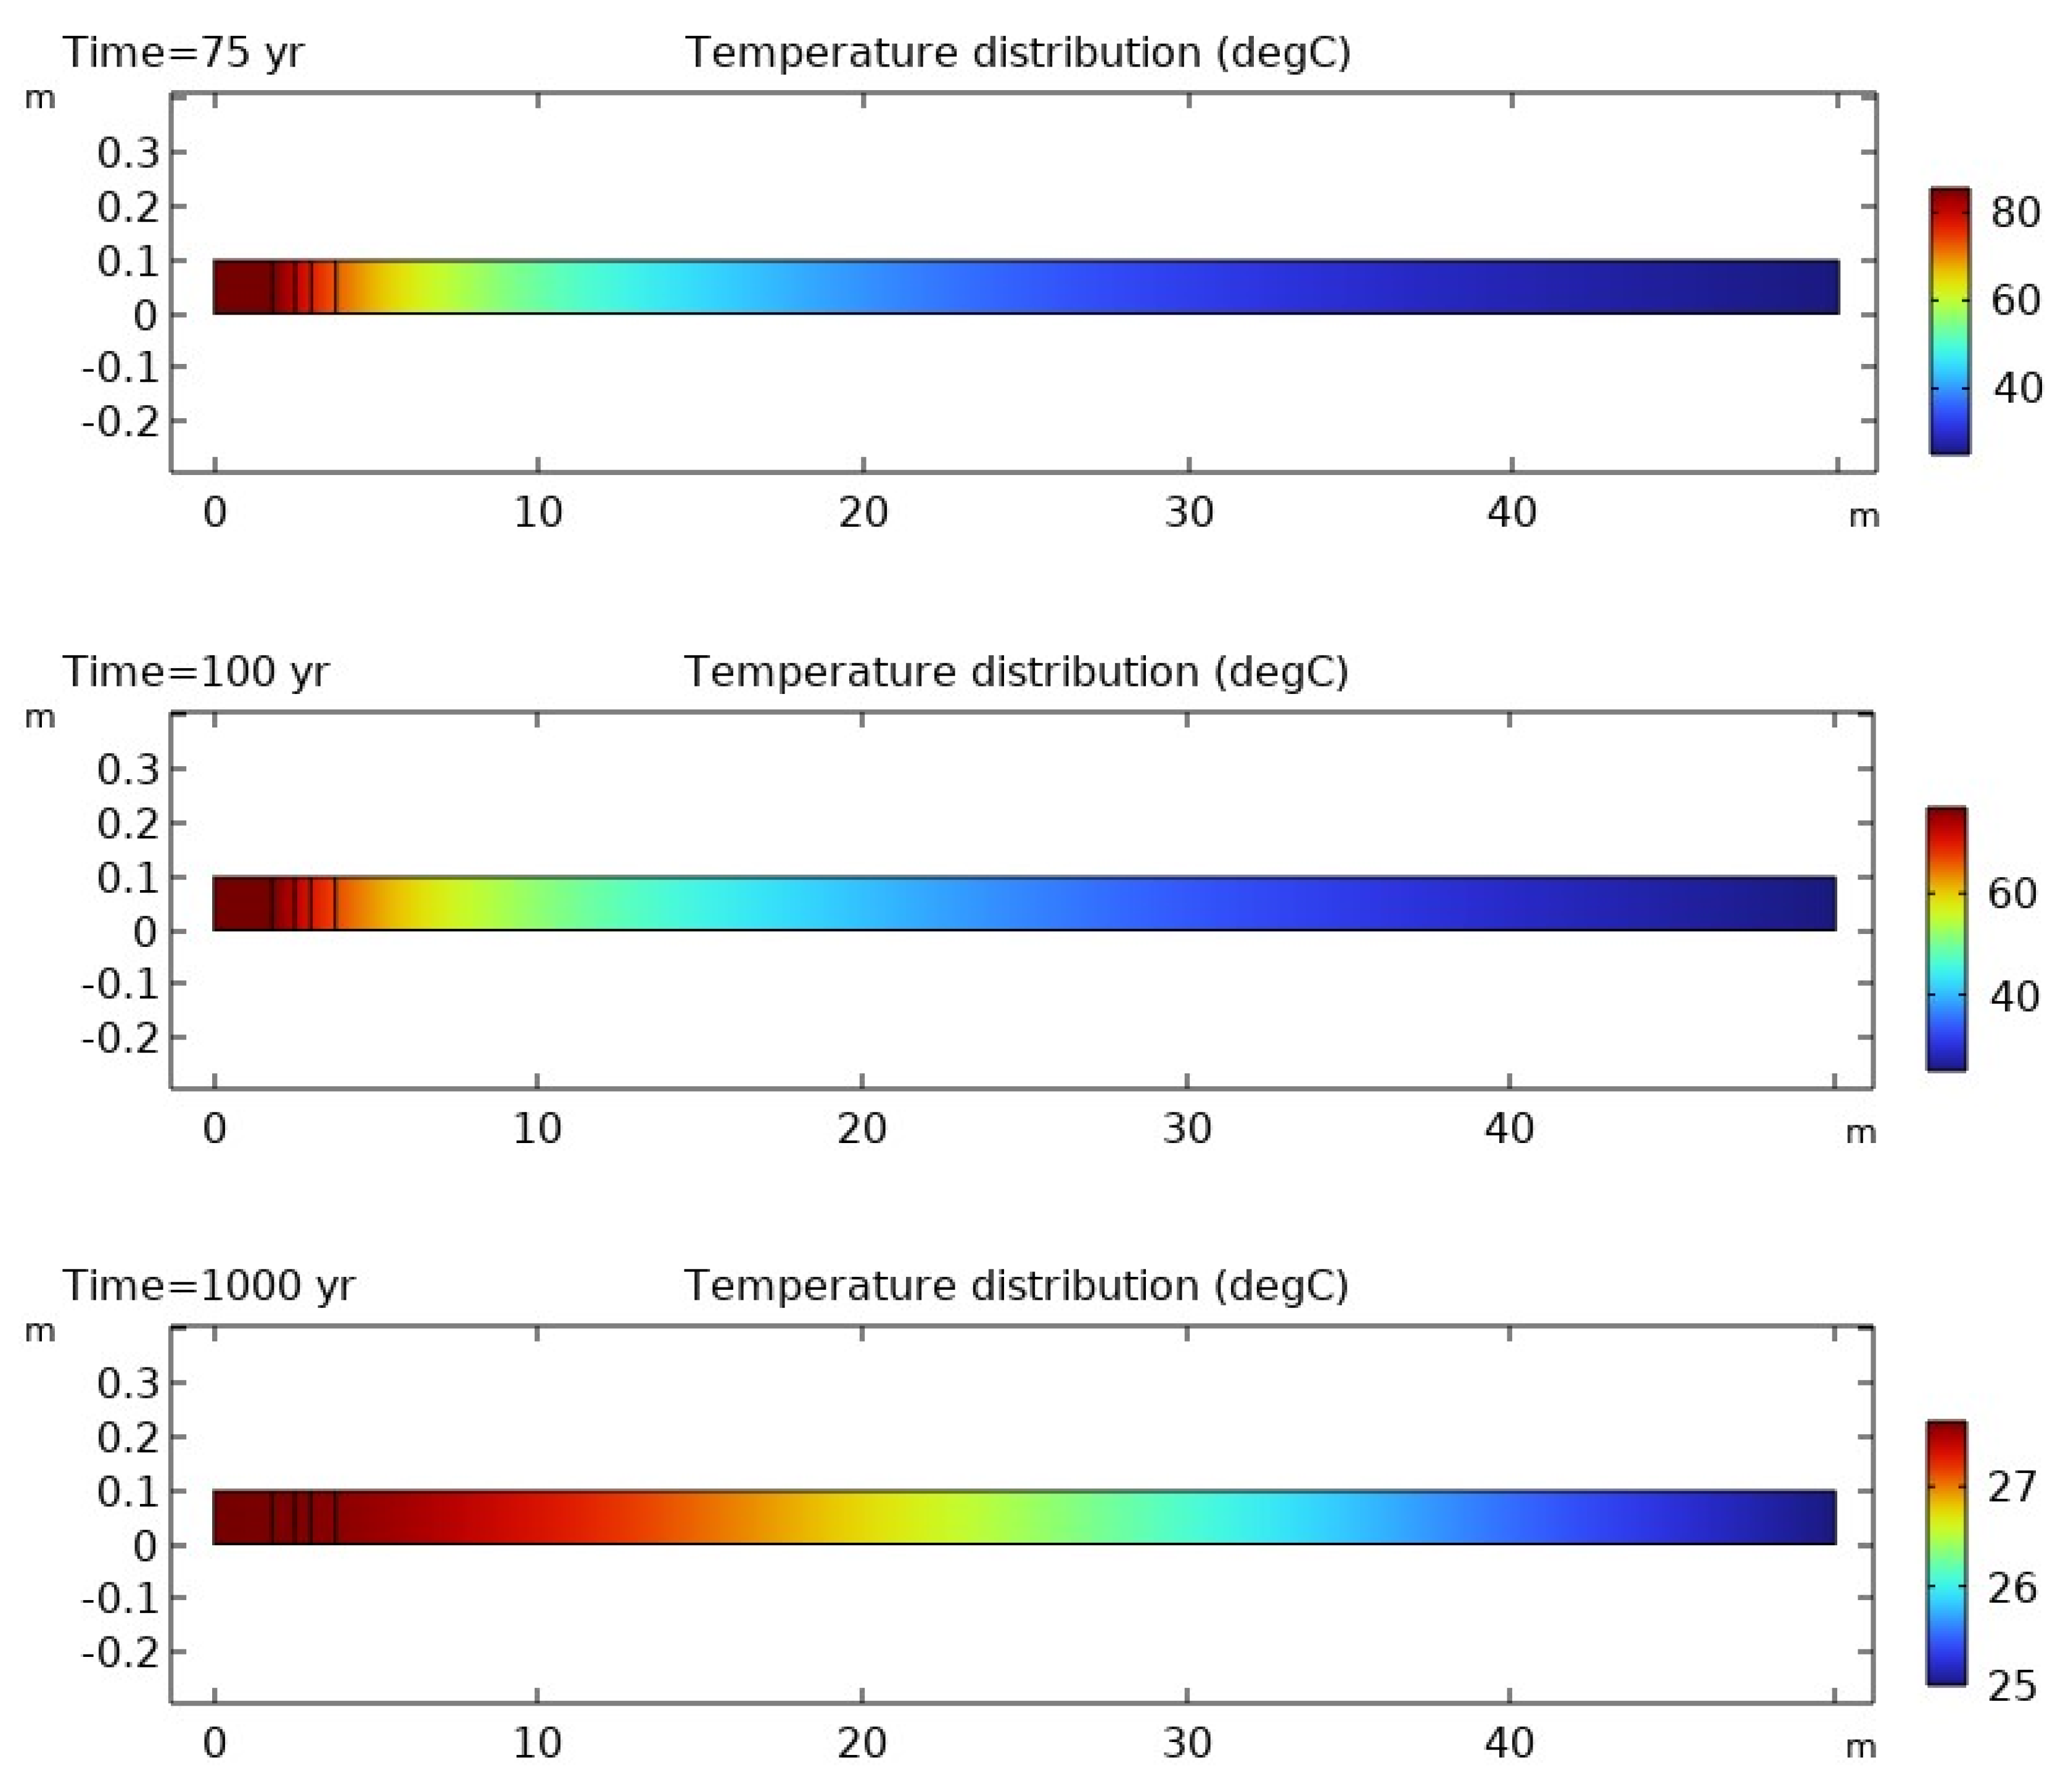
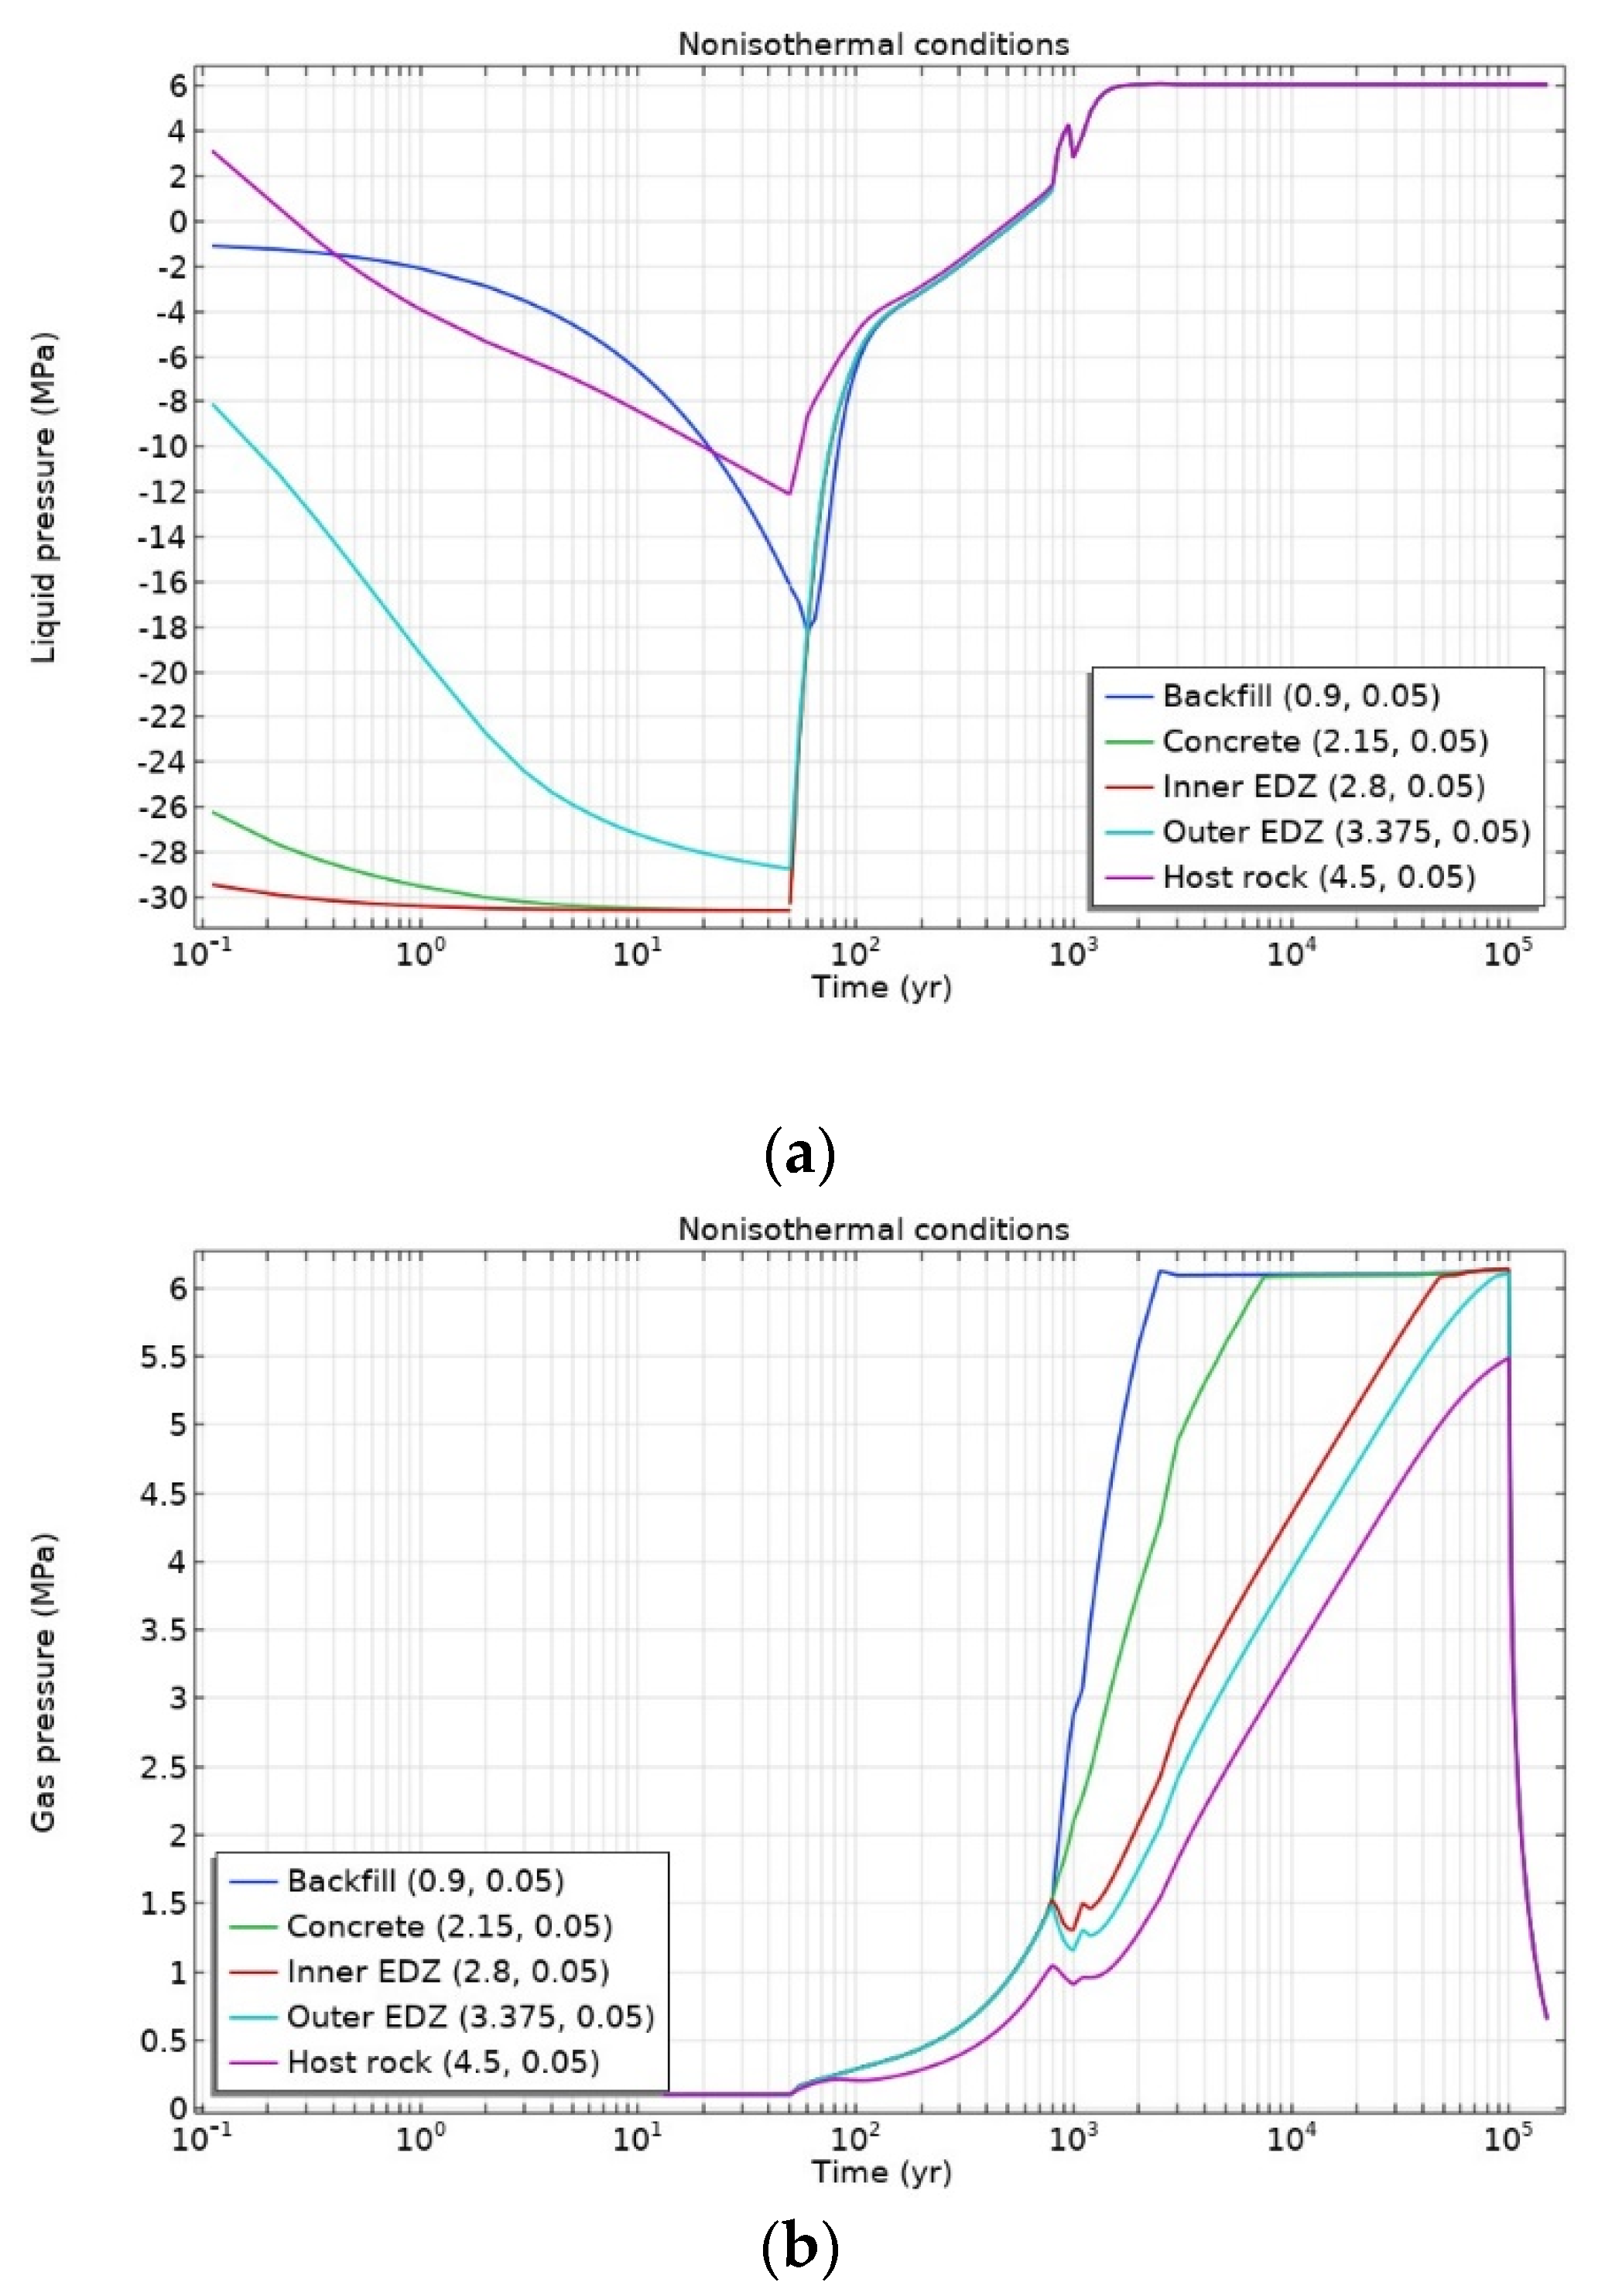
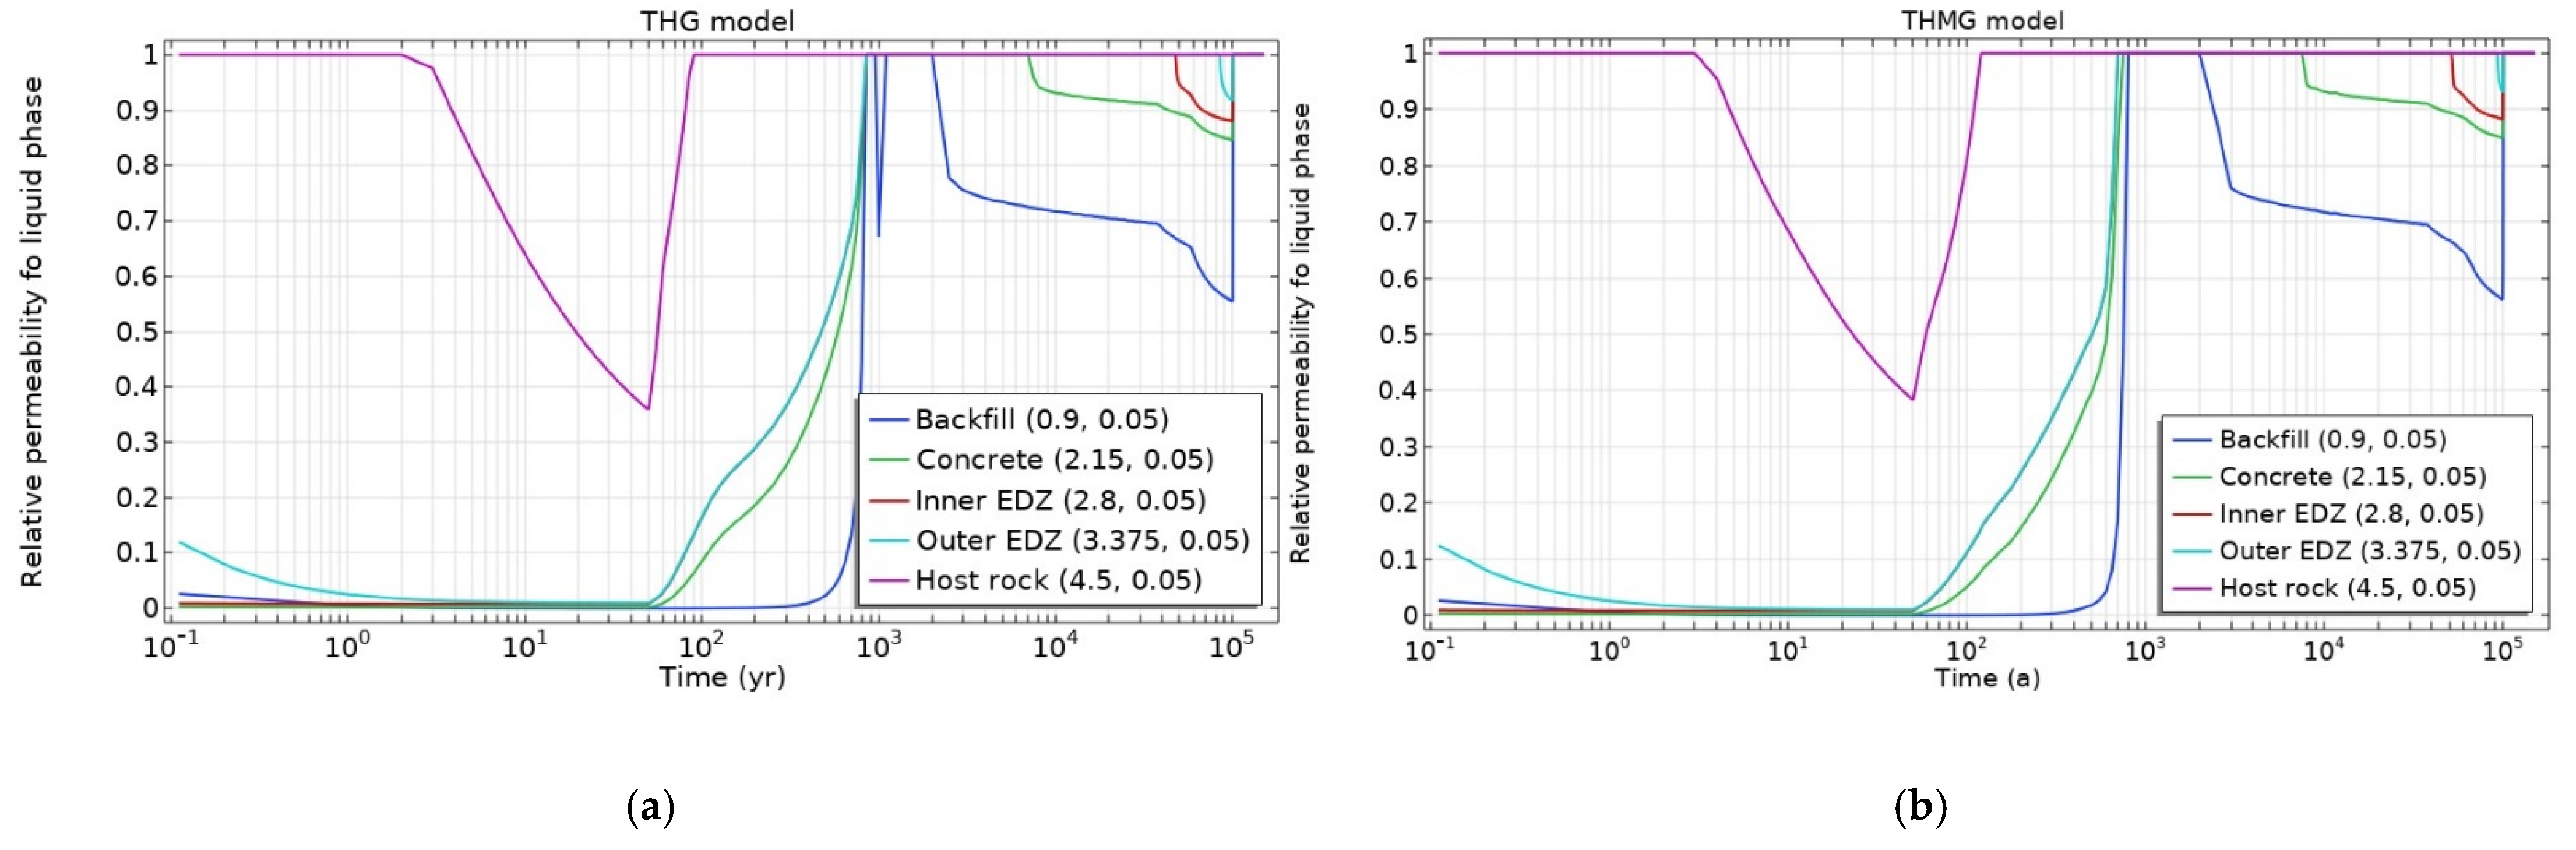
3.2. Non-Isothermal Conditions

HLW emplacement in the repository will impose a decay heat load on the engineered and natural barriers to some extent. With consideration of non-isothermal conditions, the heat load from an HLW canister and its induced/dependent phenomena need to be taken into account. Different thermal expansion of water and the porous low-permeable medium could lead to thermal overpressurization, redistribution of stresses, and porosity change. Additional thermal properties of the fluids are summarized in Table 4.
Figure 12 presents the temperature evolution in the observation points. As was expected, the largest temperature was achieved in the waste-representing domain (backfill). The maximum temperature (~87 °C) was reached soon after waste emplacement (approximately after 20 years of heating (at 70 years from excavation)) and subsequently decreased. During 1000 years, the temperature in all points remained below 100 °C.
Figure 13 presents the temperature distribution around the deposition tunnel (geometry not to scale) at different times.
By the end of the heat-emitting phase, the temperature was approaching the initial temperature in the host rock (25 °C).
The evolution of the system saturation under non-isothermal conditions is presented in Figure 14. For comparison purposes, the saturation evolution is presented also for the isothermal case.
As can be seen from Figure 15, the heat induced more phenomena (vaporization/condensation, advective gas flow, heat-induced effective stress redistribution, etc.), which had an influence on the resaturation trend in all the materials. All materials (except the host rock) were resaturated later than under isothermal conditions. Meanwhile, full resaturation at the observation point in the host rock (2 m from the tunnel wall) occurred earlier than in the isothermal case (at ~90 years vs. ~350 years). Considering the heat load and water thermodynamic properties as a function of temperature, the second desaturation phase due to hydrogen gas started slightly earlier compared to the isothermal case, as can be seen from Figure 15.
Relevant indicators such as liquid and gas pressures are presented in Figure 16.
Compared to liquid pressure evolution under isothermal conditions (Figure 9a), the liquid pressure build-up to maximal (pressure prevailing in situ) was smoother under non-isothermal conditions. The evolution over time also showed some increase/decrease with a peak value less than in situ pore water pressure. Meanwhile, there were no significant influences on gas pressure evolution and on its maximum compared to isothermal conditions (Figure 10a). This also means that even with heat load from the waste, the simulated equivalent pore pressure was lower than the total compressive stress at the repository level (15 MPa), and material would remain in compressive stress state and barrier integrity would not be affected.

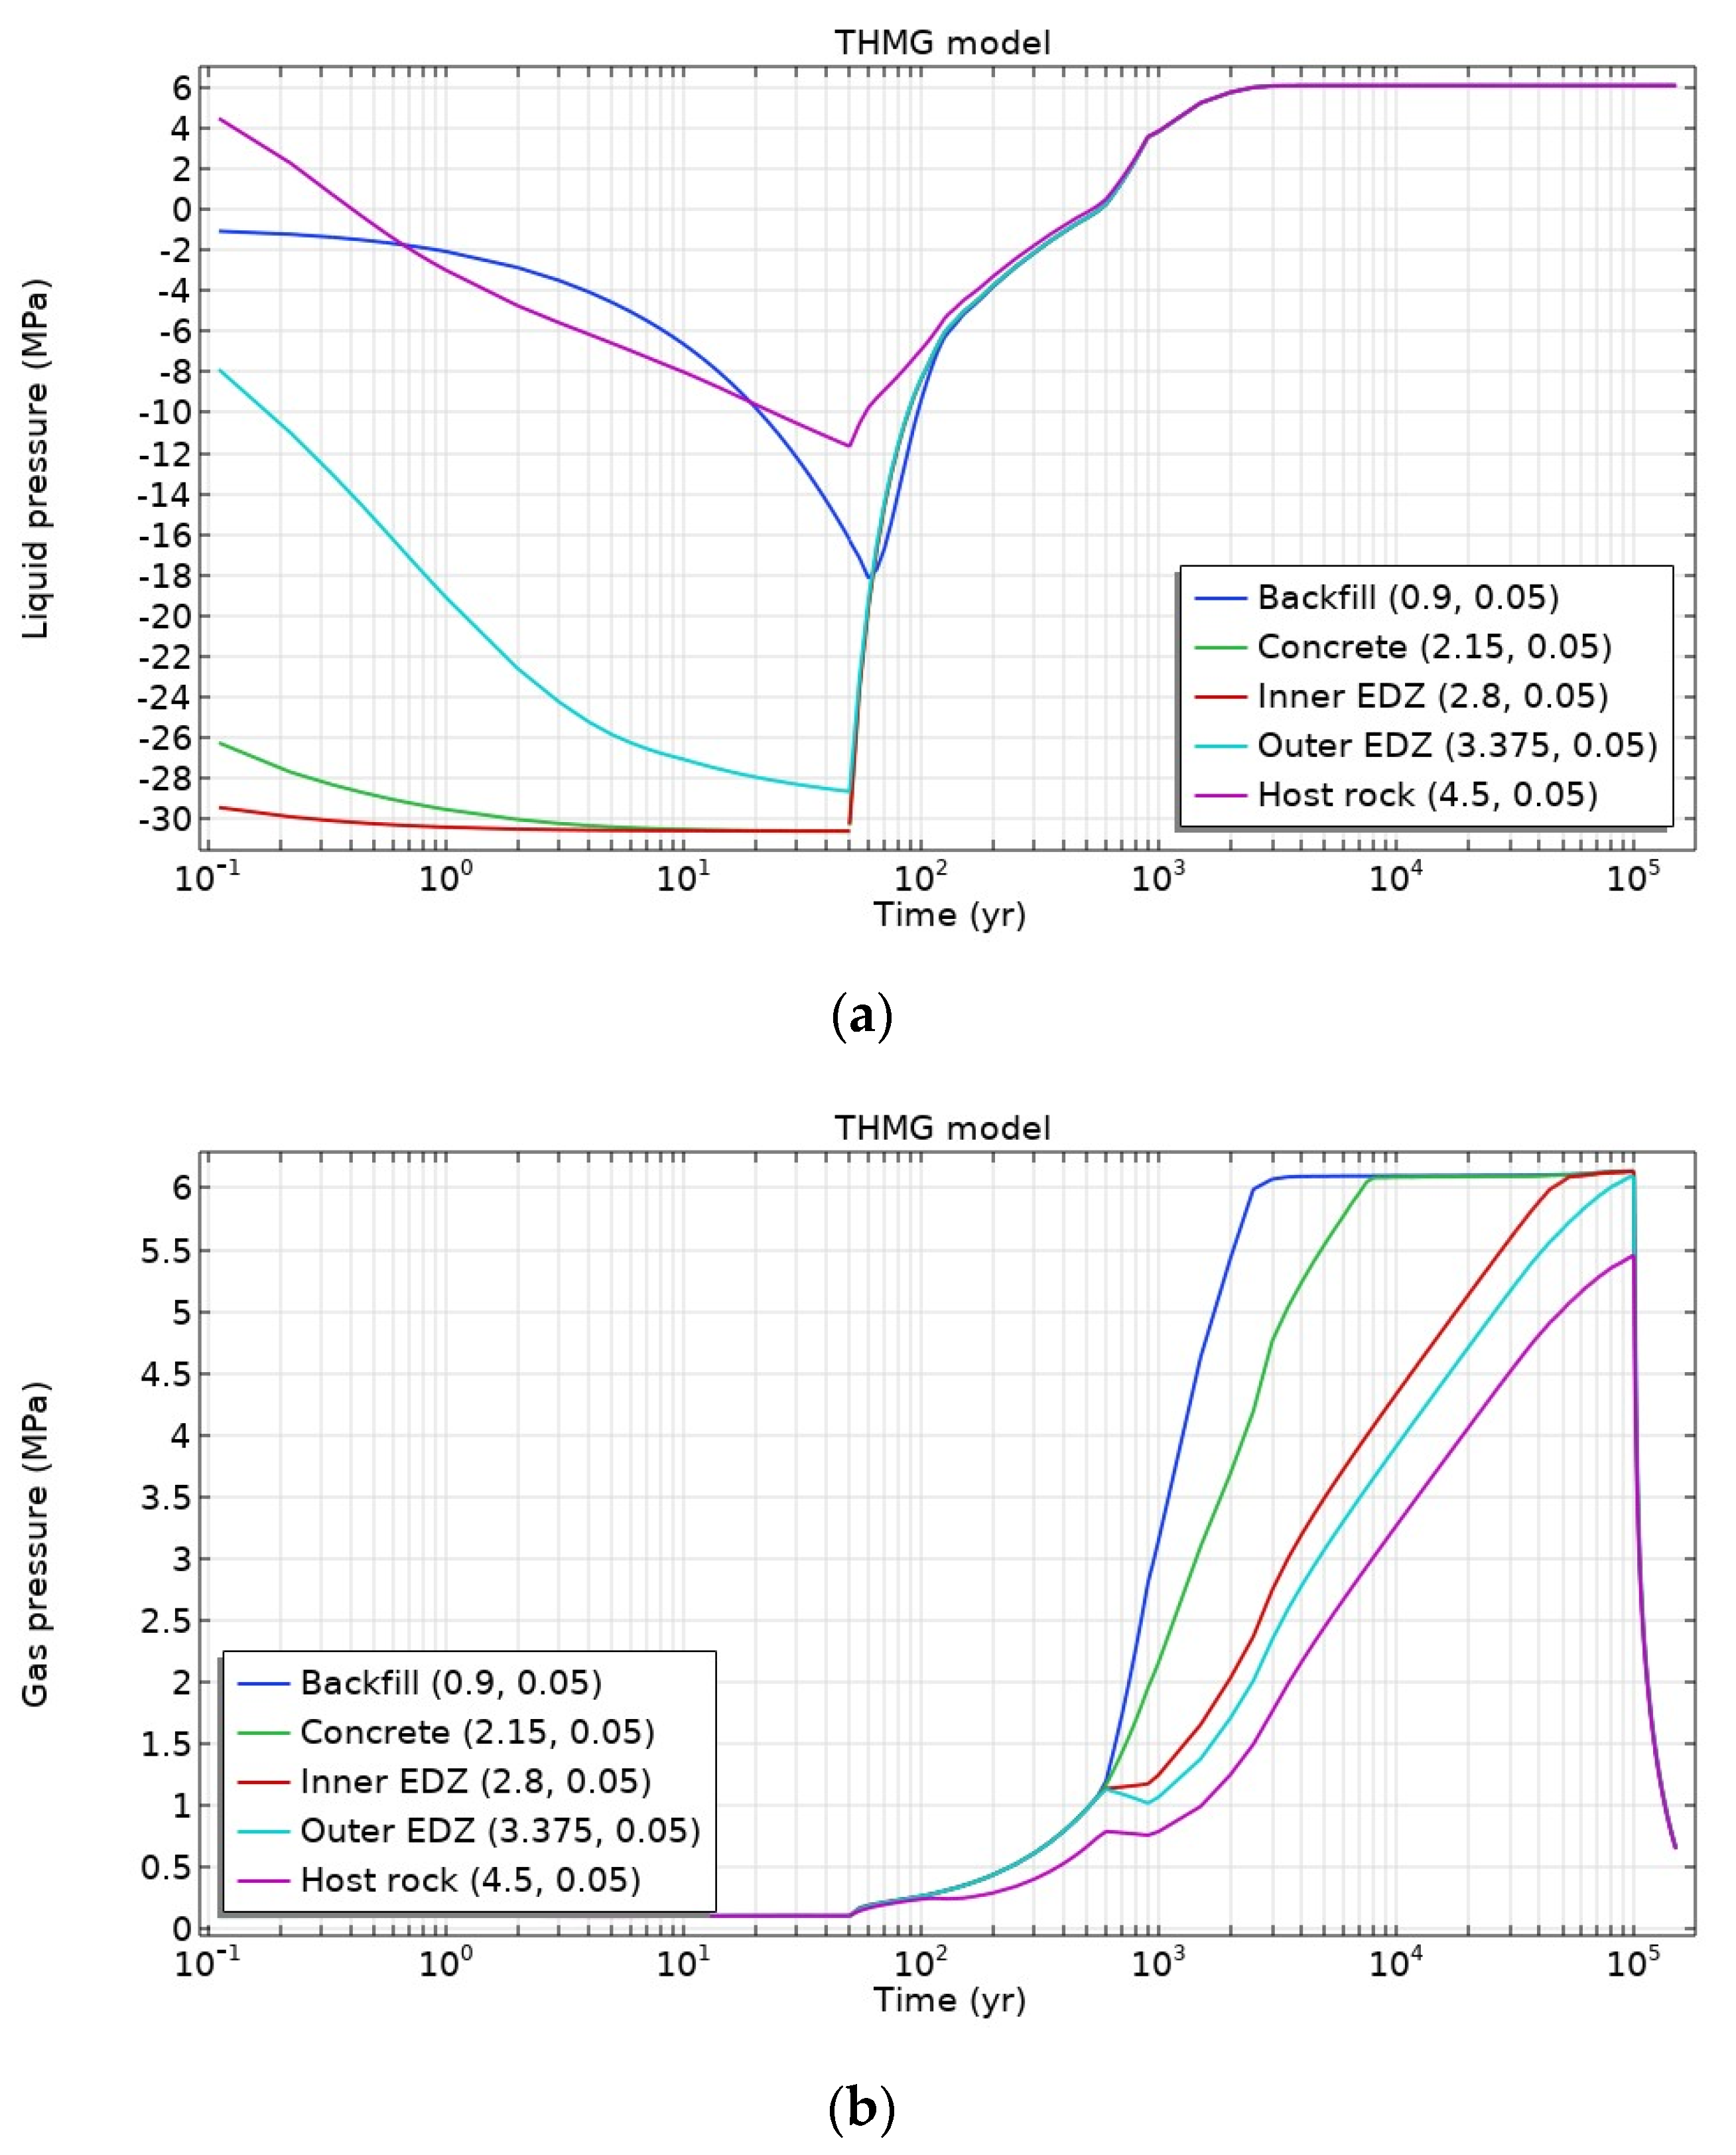
3.3. Impact of Mechanical Deformations

Considering hydro–mechanical, thermo–mechanical couplings allowed to assess the porosity change and, subsequently, the impact on the mass balance of components (water, hydrogen) (Equation (20)). Considering the porosity change due to mechanical processes, the host rock resaturation time after the ventilation phase was slightly delayed, as can be observed from the relative permeability evolution (Figure 17).
Modelling results show that the second desaturation due to hydrogen gas generation started later for the outer EDZ, while for other materials there was no significant influence.
Modelling results of liquid and gas pressures derived with THG (Figure 16) and THMG models are presented in Figure 18.
Based on the results presented in Figure 18, some influence on liquid and gas pressure evolution within the period of 800–1500 years could be seen considering porosity change due to mechanical processes. However, no significant impact on maximal gas pressure (~6.14 MPa) was observed. This is mainly related to the high compressibility of the gas.
Nevertheless, besides the pore pressure evolution at the observation points, its distribution in all modelled domains was analyzed too. Figure 19 presents pore water pressure distribution in the modelled domain when the PL reached its maximum value in the system.
Based on THG model results, the maximum pore water pressure in the modelled system was ~12.6 MPa, and it was achieved at ~70 years after excavation. Meanwhile, considering mechanical couplings, the simulated maximum pore water pressure in the modelled system was lower (~7.8 MPa), and it was achieved later (at ~85 years after excavation). It clearly indicates that omitting porosity change due to mechanical processes (thermal expansion of the material and changes in the effective stress) led to the overestimation of the heat-induced pore pressure increase in the modelled system. The modelled heat-induced pore pressure increase is still overestimated to some extent due to the assumed model geometry (2D axisymmetric), as the heat transfer process takes place in three directions in reality. A proper evaluation of pore water pressure in the system is important for the assessment of the system’s state from the mechanical point of view, i.e., whether the system remains in the compressive state or tensile stress conditions would develop.

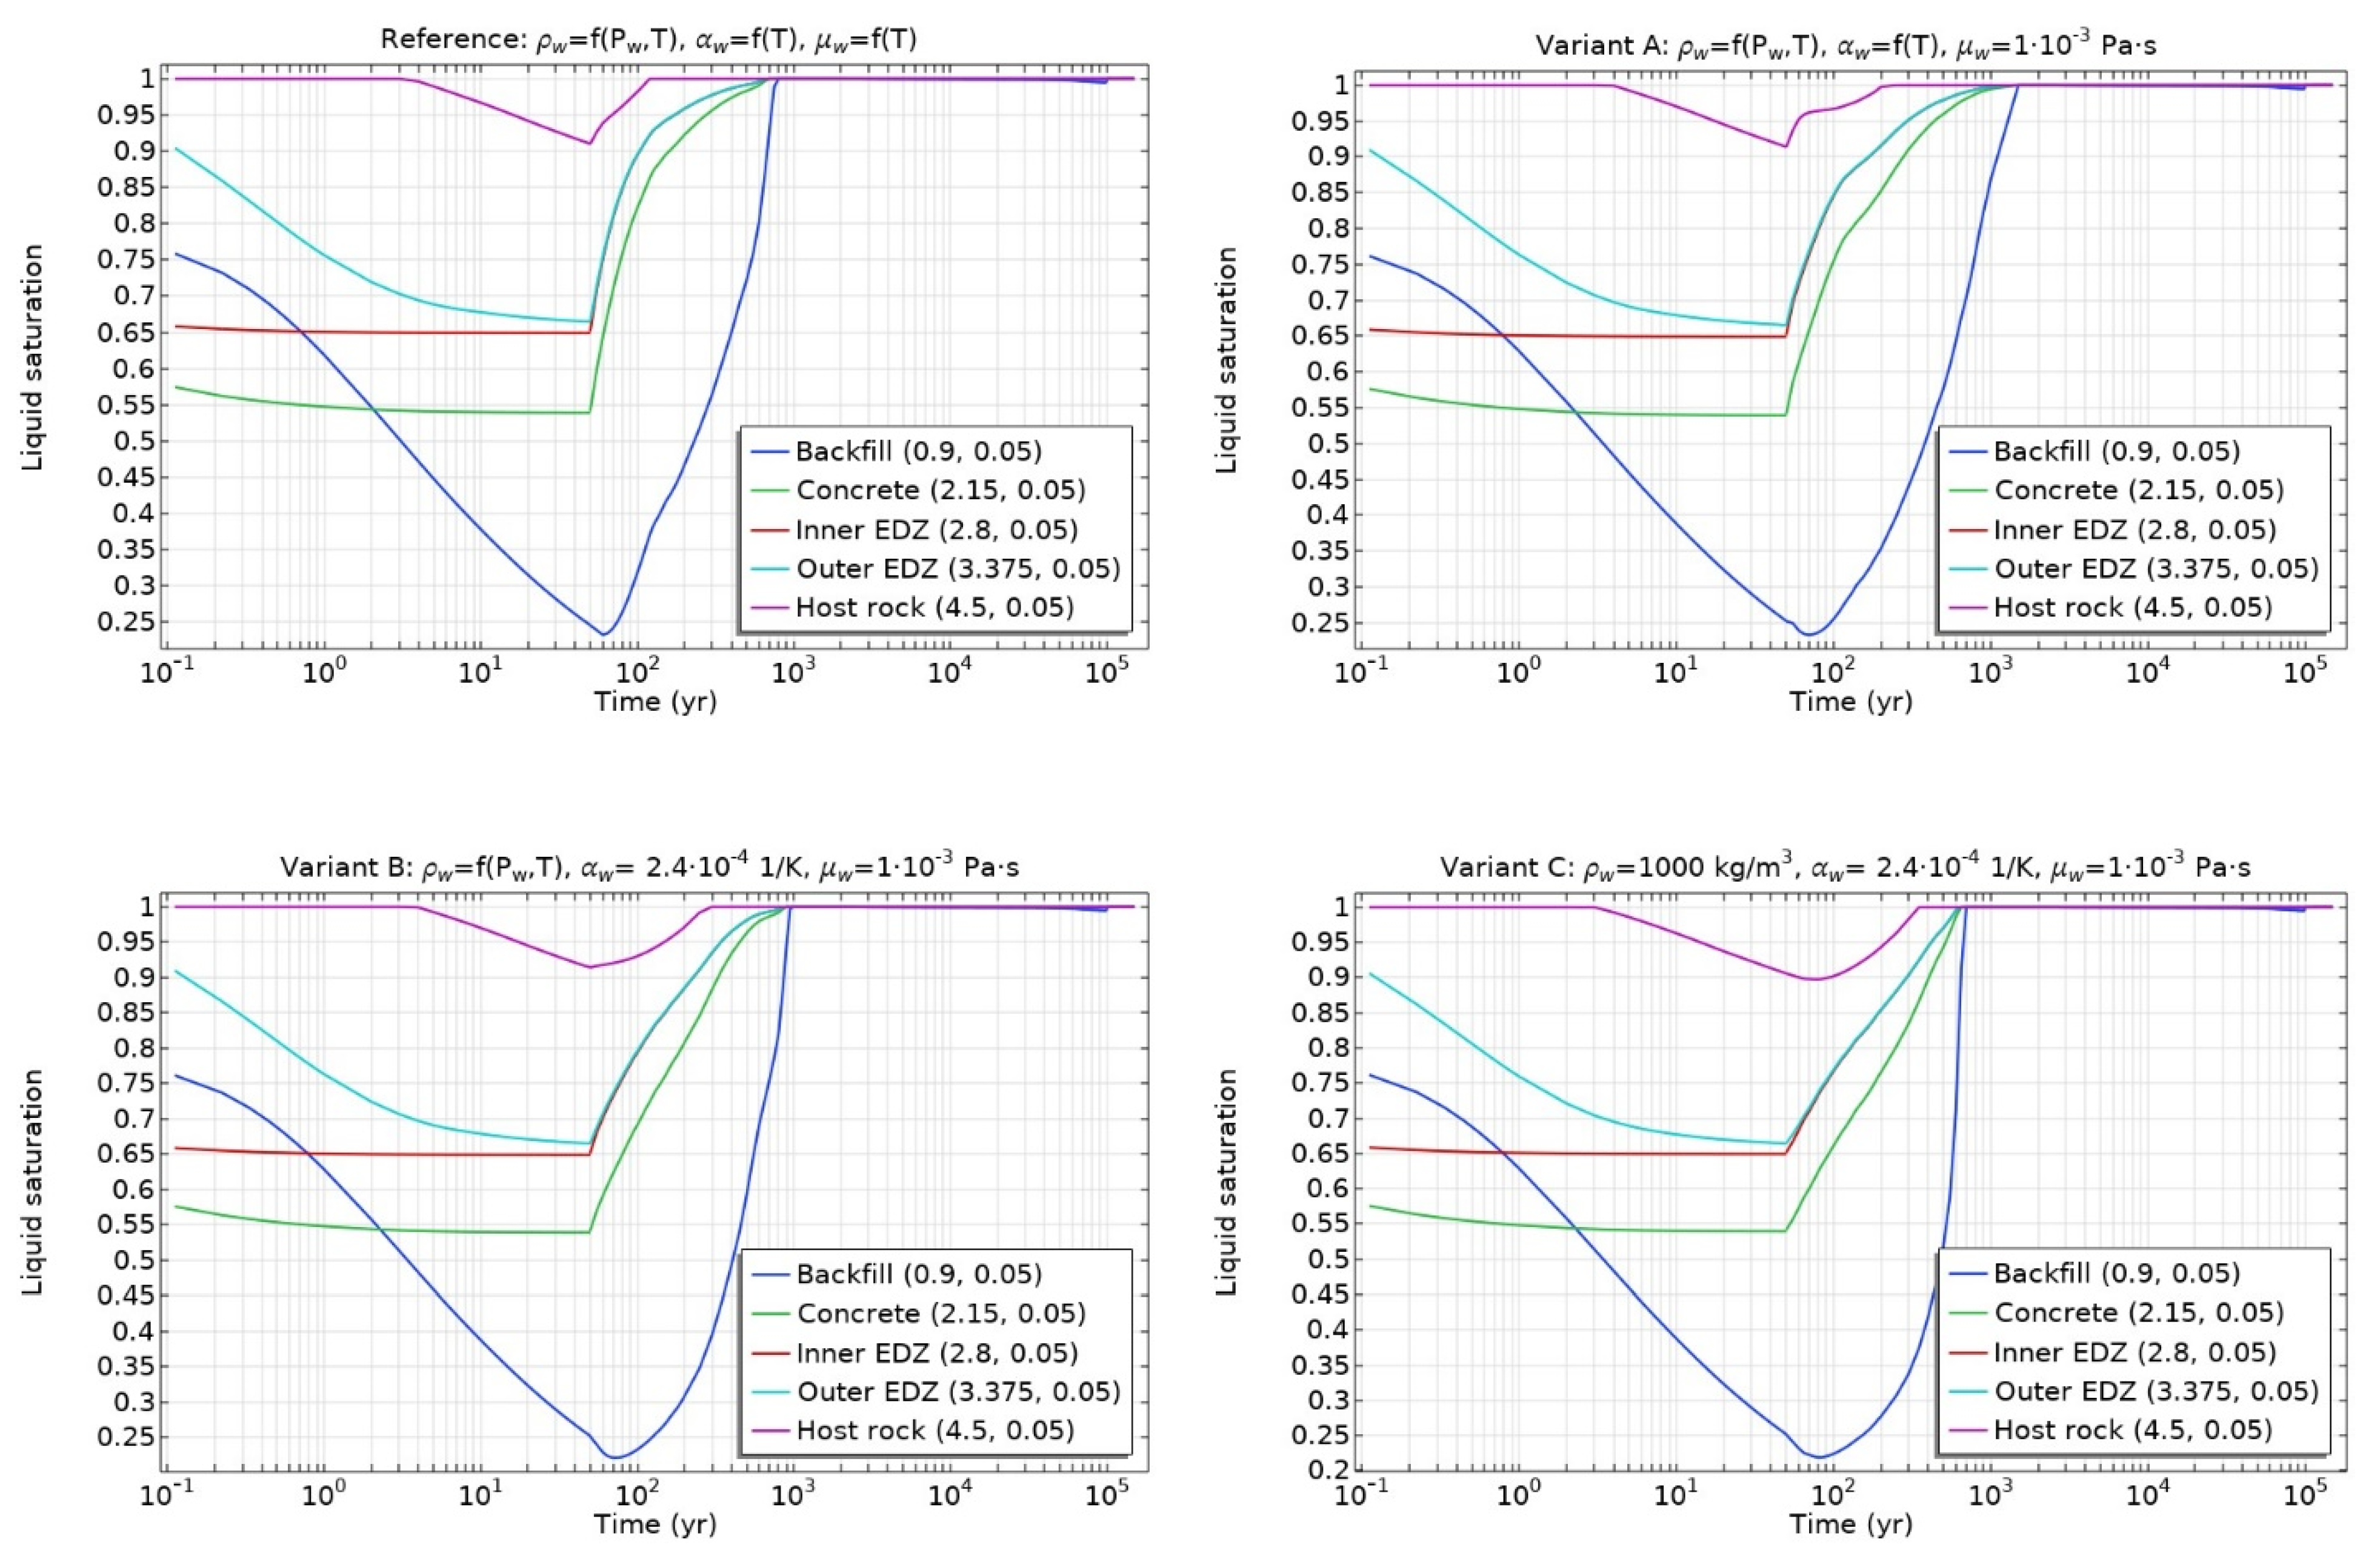
3.4. Impact of Water Thermal Properties

Using COMSOL Multiphysics as a platform for numerical simulation, a number of material and fluid properties and their dependencies on water pressure and temperature were implemented. While the modelling coupled THMG processes with other numerical codes (often developed in house), the modellers cannot always modify these properties, and embedded relationships or constant values are to be used. Several additional runs of the model have been performed assuming a constant thermal expansion coefficient, viscosity and density of water to see the impact of water thermodynamic properties on the overall model output:
  • Reference (THMG model): ρw = f(Pw,T), αw = f(T) μw = f(T)
  • Variant A: ρw = f(Pw,T), αw = f(T), μw = 1 × 10⁻³ Pa∙s
  • Variant B: ρw = f(Pw,T), αw = 2.4 × 10⁻⁴ 1/K, μw = 1 × 10⁻³ Pa∙s
  • Variant C: ρw = 1000 kg/m3, αw = 2.4 × 10⁻⁴ 1/K, μw = 1 × 10⁻³ Pa∙s
Modelling results of liquid saturation evolution at observation points for identified variants are presented in Figure 20. The first 50 years of ventilation took place under isothermal conditions, and thus there was no difference in the saturation evolution within the 0–50-year period. When the heat load started, different assumptions on water thermodynamic properties and their dependence on temperature led to different evolution up to ~2000 years. For variants B and C, resaturation (increase in liquid saturation) proceeded in a more even way, while for variant A (with T-dependent density and thermal expansion coefficients) the saturation over time changed at different rates, especially at the point located in the host rock.
Consideration of water thermodynamic properties’ dependence on T had a different influence on full resaturation time of barriers. Assuming constant water viscosity (variant A), the resaturation time takes almost twice as long (for backfill ~1500 years vs. ~800 years in reference case, for the host rock ~250 years vs. ~120 years). If, additionally, the water thermal expansion coefficient had been assumed constant, then the resaturation time would have been more prolonged for the host rock (~300 years vs. ~120 years in reference case) than for the backfill (~1000 years vs. ~800 years). Assuming constant water density, viscosity and thermal expansion (variant C), the full resaturation was reached earlier in all barriers except for the host rock. Resaturation at the observation point located in the host rock (2 m from the tunnel wall) occurred earlier in the reference case than in variant C (~120 years vs. ~350 years). Therefore, the impact of temperature dependencies of water density, viscosity and thermal expansion was not unambiguous and straightforward. In summary, the omission of the temperature dependence of some water properties such as density, viscosity or the thermal expansion coefficient had an impact on the resaturation time in the order of several hundred years but did not impact the maximal liquid and gas pressures.

3.5. Impact on Radionuclide Transport

Once the scope and time evolution of prevailing hydraulic conditions (saturated vs. unsaturated) is evaluated, the impact on radionuclide transport properties could be assessed. Following the specification [11], the hydrogen generation started after 50 years and has stopped by the time radionuclide I-129 release started (100,000 years). According to the specified evolution scenario of zone B of the generic repository, the long-lived almost non-sorbing I-129 is a radionuclide of interest from the repository performance perspective. Its release potentially starts from T = 100,000 years (loss of tightness of the canister) and lasts 10,000 years (rapid degradation of the nuclear glass) (till T = 110,000 years).
I-129 is a soluble nuclide and is transported in the dissolved form only. As has been already mentioned, radionuclide transport in a low-permeable environment mainly takes place via diffusion, and the key parameter for diffusive radionuclide transport is effective diffusivity. The effective diffusivity is a function of porosity and liquid saturation (Equations (27) or (28)). Therefore, the evolution of porosity and saturation needs to be evaluated. As has been already presented, the ventilation of 50 years led to desaturation of engineered barriers, the EDZ and a part of the host rock. Subsequent resaturation and the hydrogen-gas-induced second desaturation influenced the diffusivity. The evolution of effective diffusivity is shown in Figure 21.
As the largest variation of liquid saturation was during ventilation and soon after it, the most influence on diffusivity was observed in this period too. Hydrogen gas generation does not lead to liquid saturation less than 0.994, and thus the impact on diffusivity was not significant. By the time the I-129 release from the waste started, all the barriers would be fully water-saturated. Thus, under such conditions and radionuclide release start time, there would be no impact of corrosion-induced gas on radionuclide migration.

4. Conclusions

A numerical model for THGM processes was implemented in COMSOL Multiphysics (Burlington, VT, USA), in the framework of the European joint program EURAD. The model formulation is based on a two-phase flow of miscible fluid (water and H2) considering important phenomena such as gas dissolution and diffusion, advective–diffusive transport in gaseous phase, mechanical deformations due to thermal expansion of water and porous media and temperature-dependent thermodynamic properties of water. This model’s formulation was applied to analyze the behavior of corrosion-induced gas transport in generic repository conditions and its impact on barrier hydraulic and transport properties. After the analysis of the modelling results, the following conclusions can be drawn:
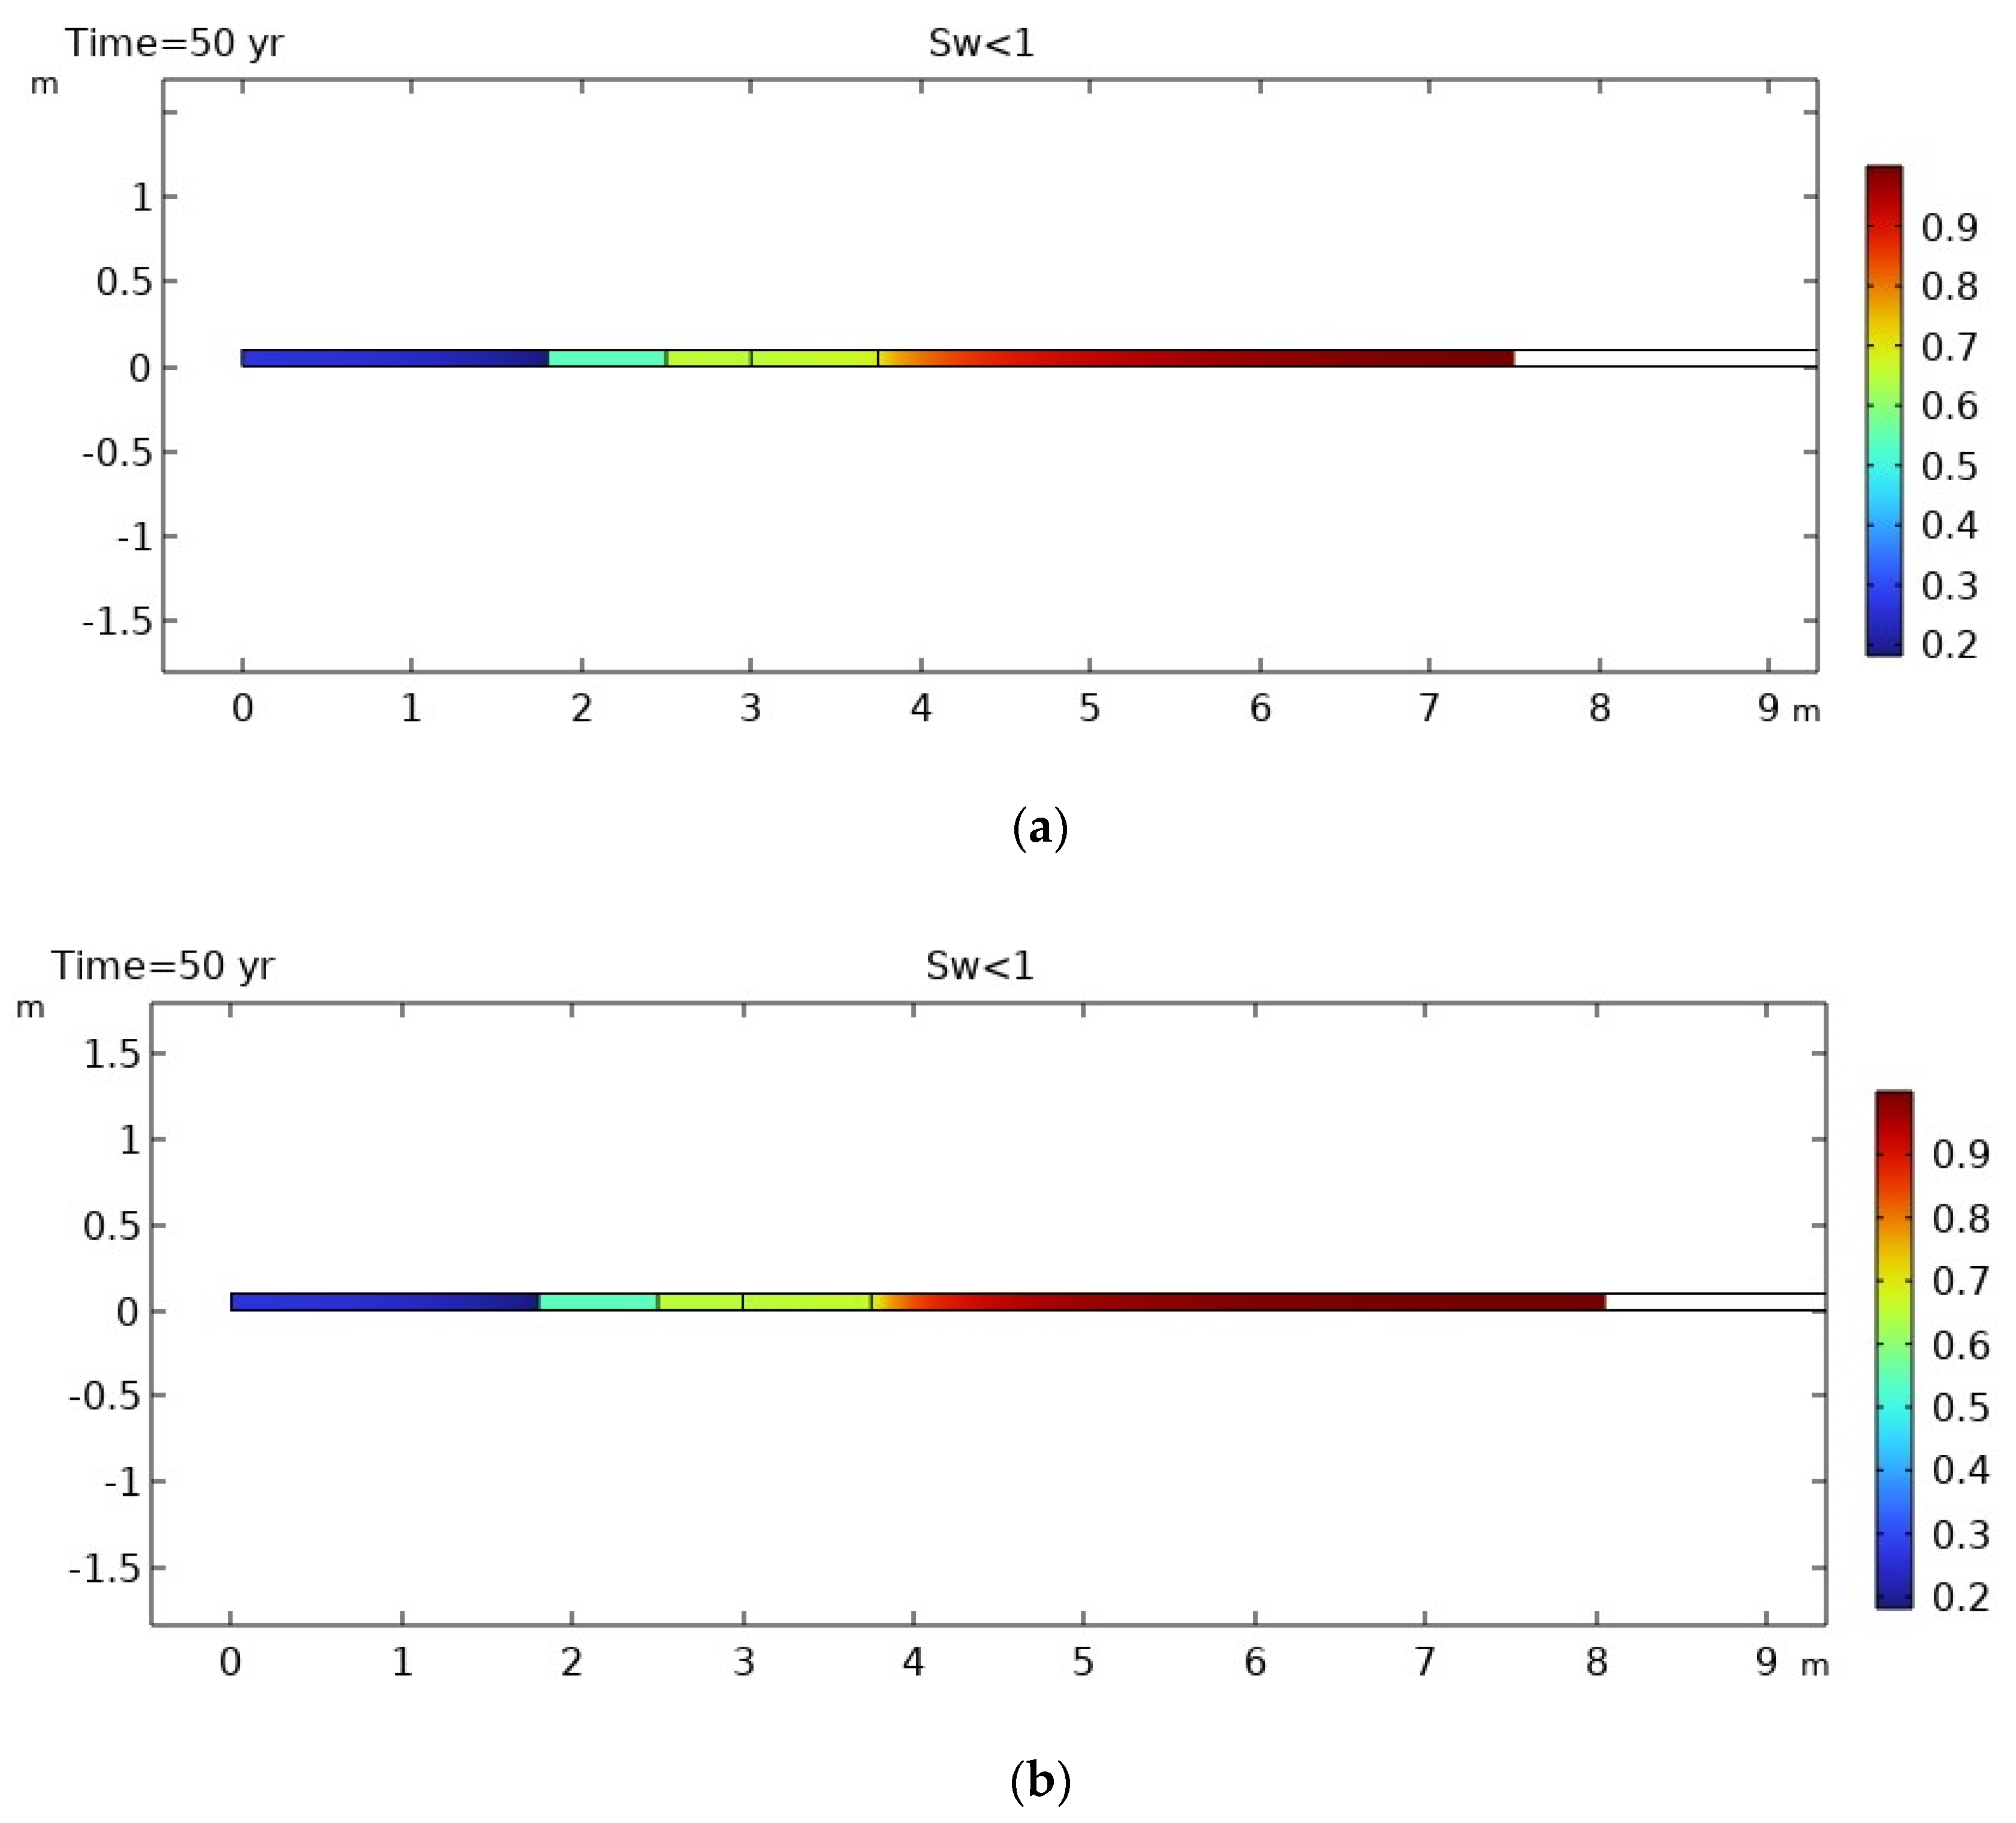
  • Desaturation of the excavation disturbed zone (EDZ) and the host rock to some extent was observed due to potential ventilation of 50 years.
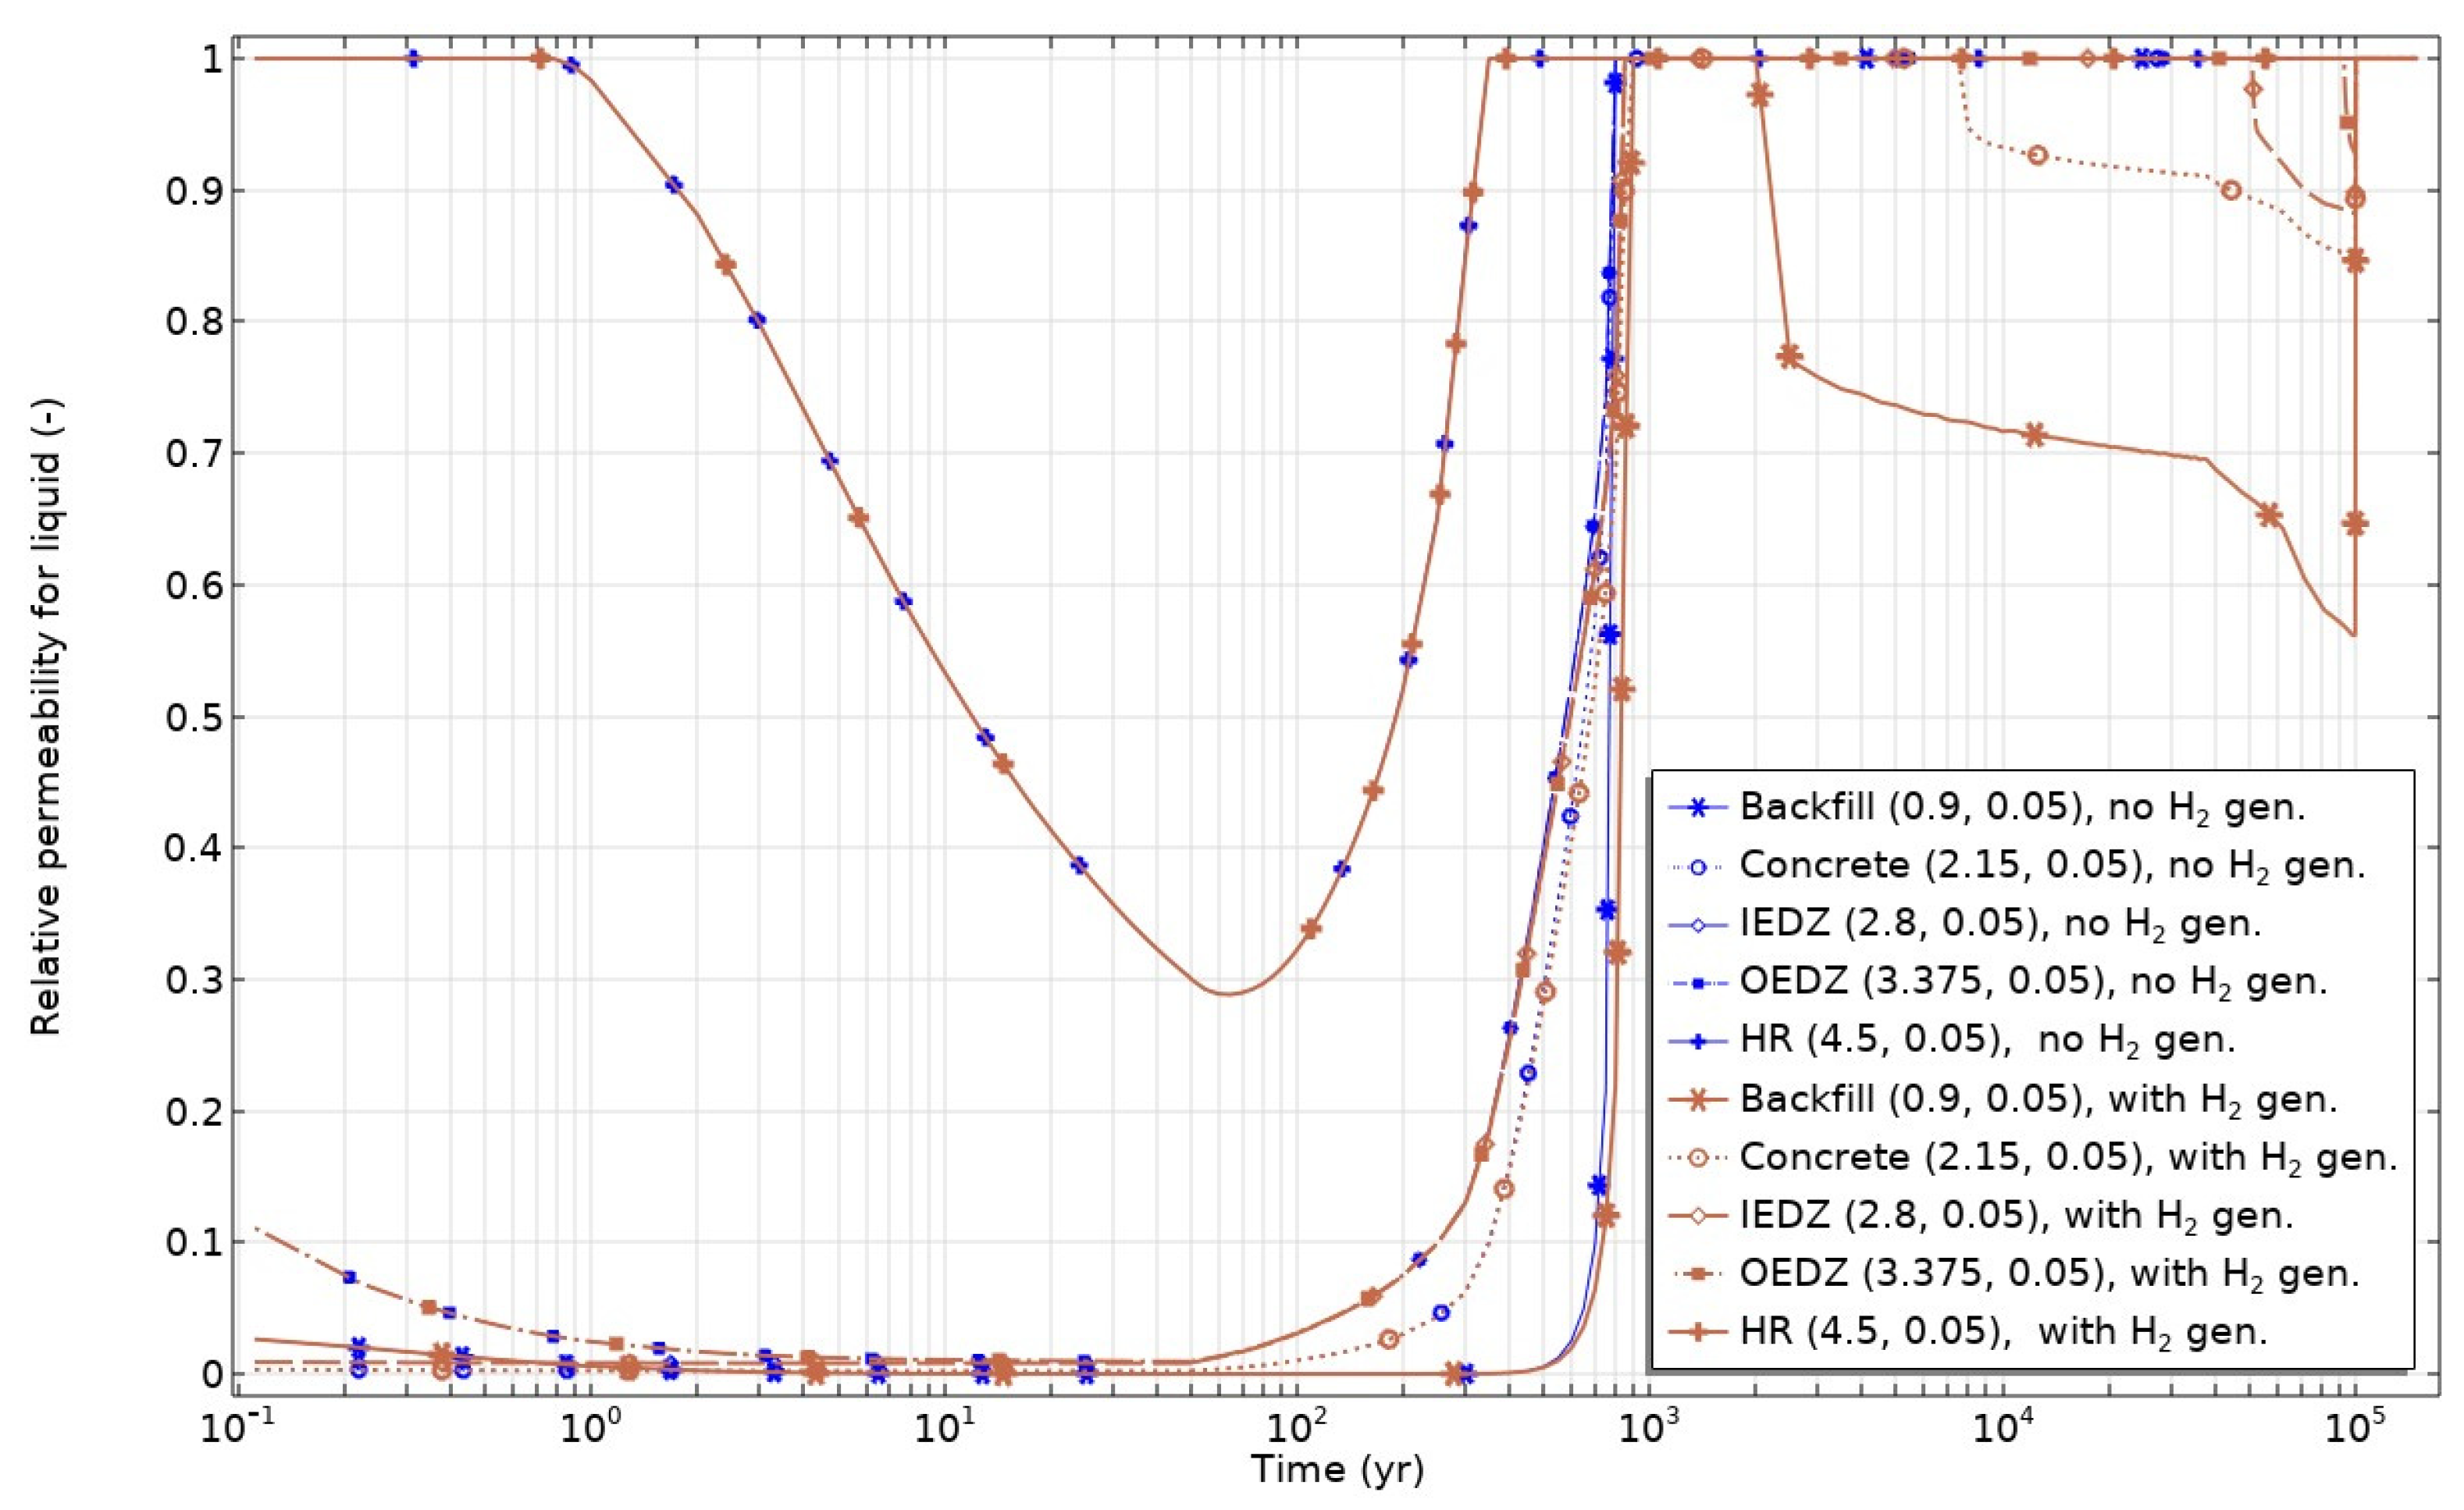
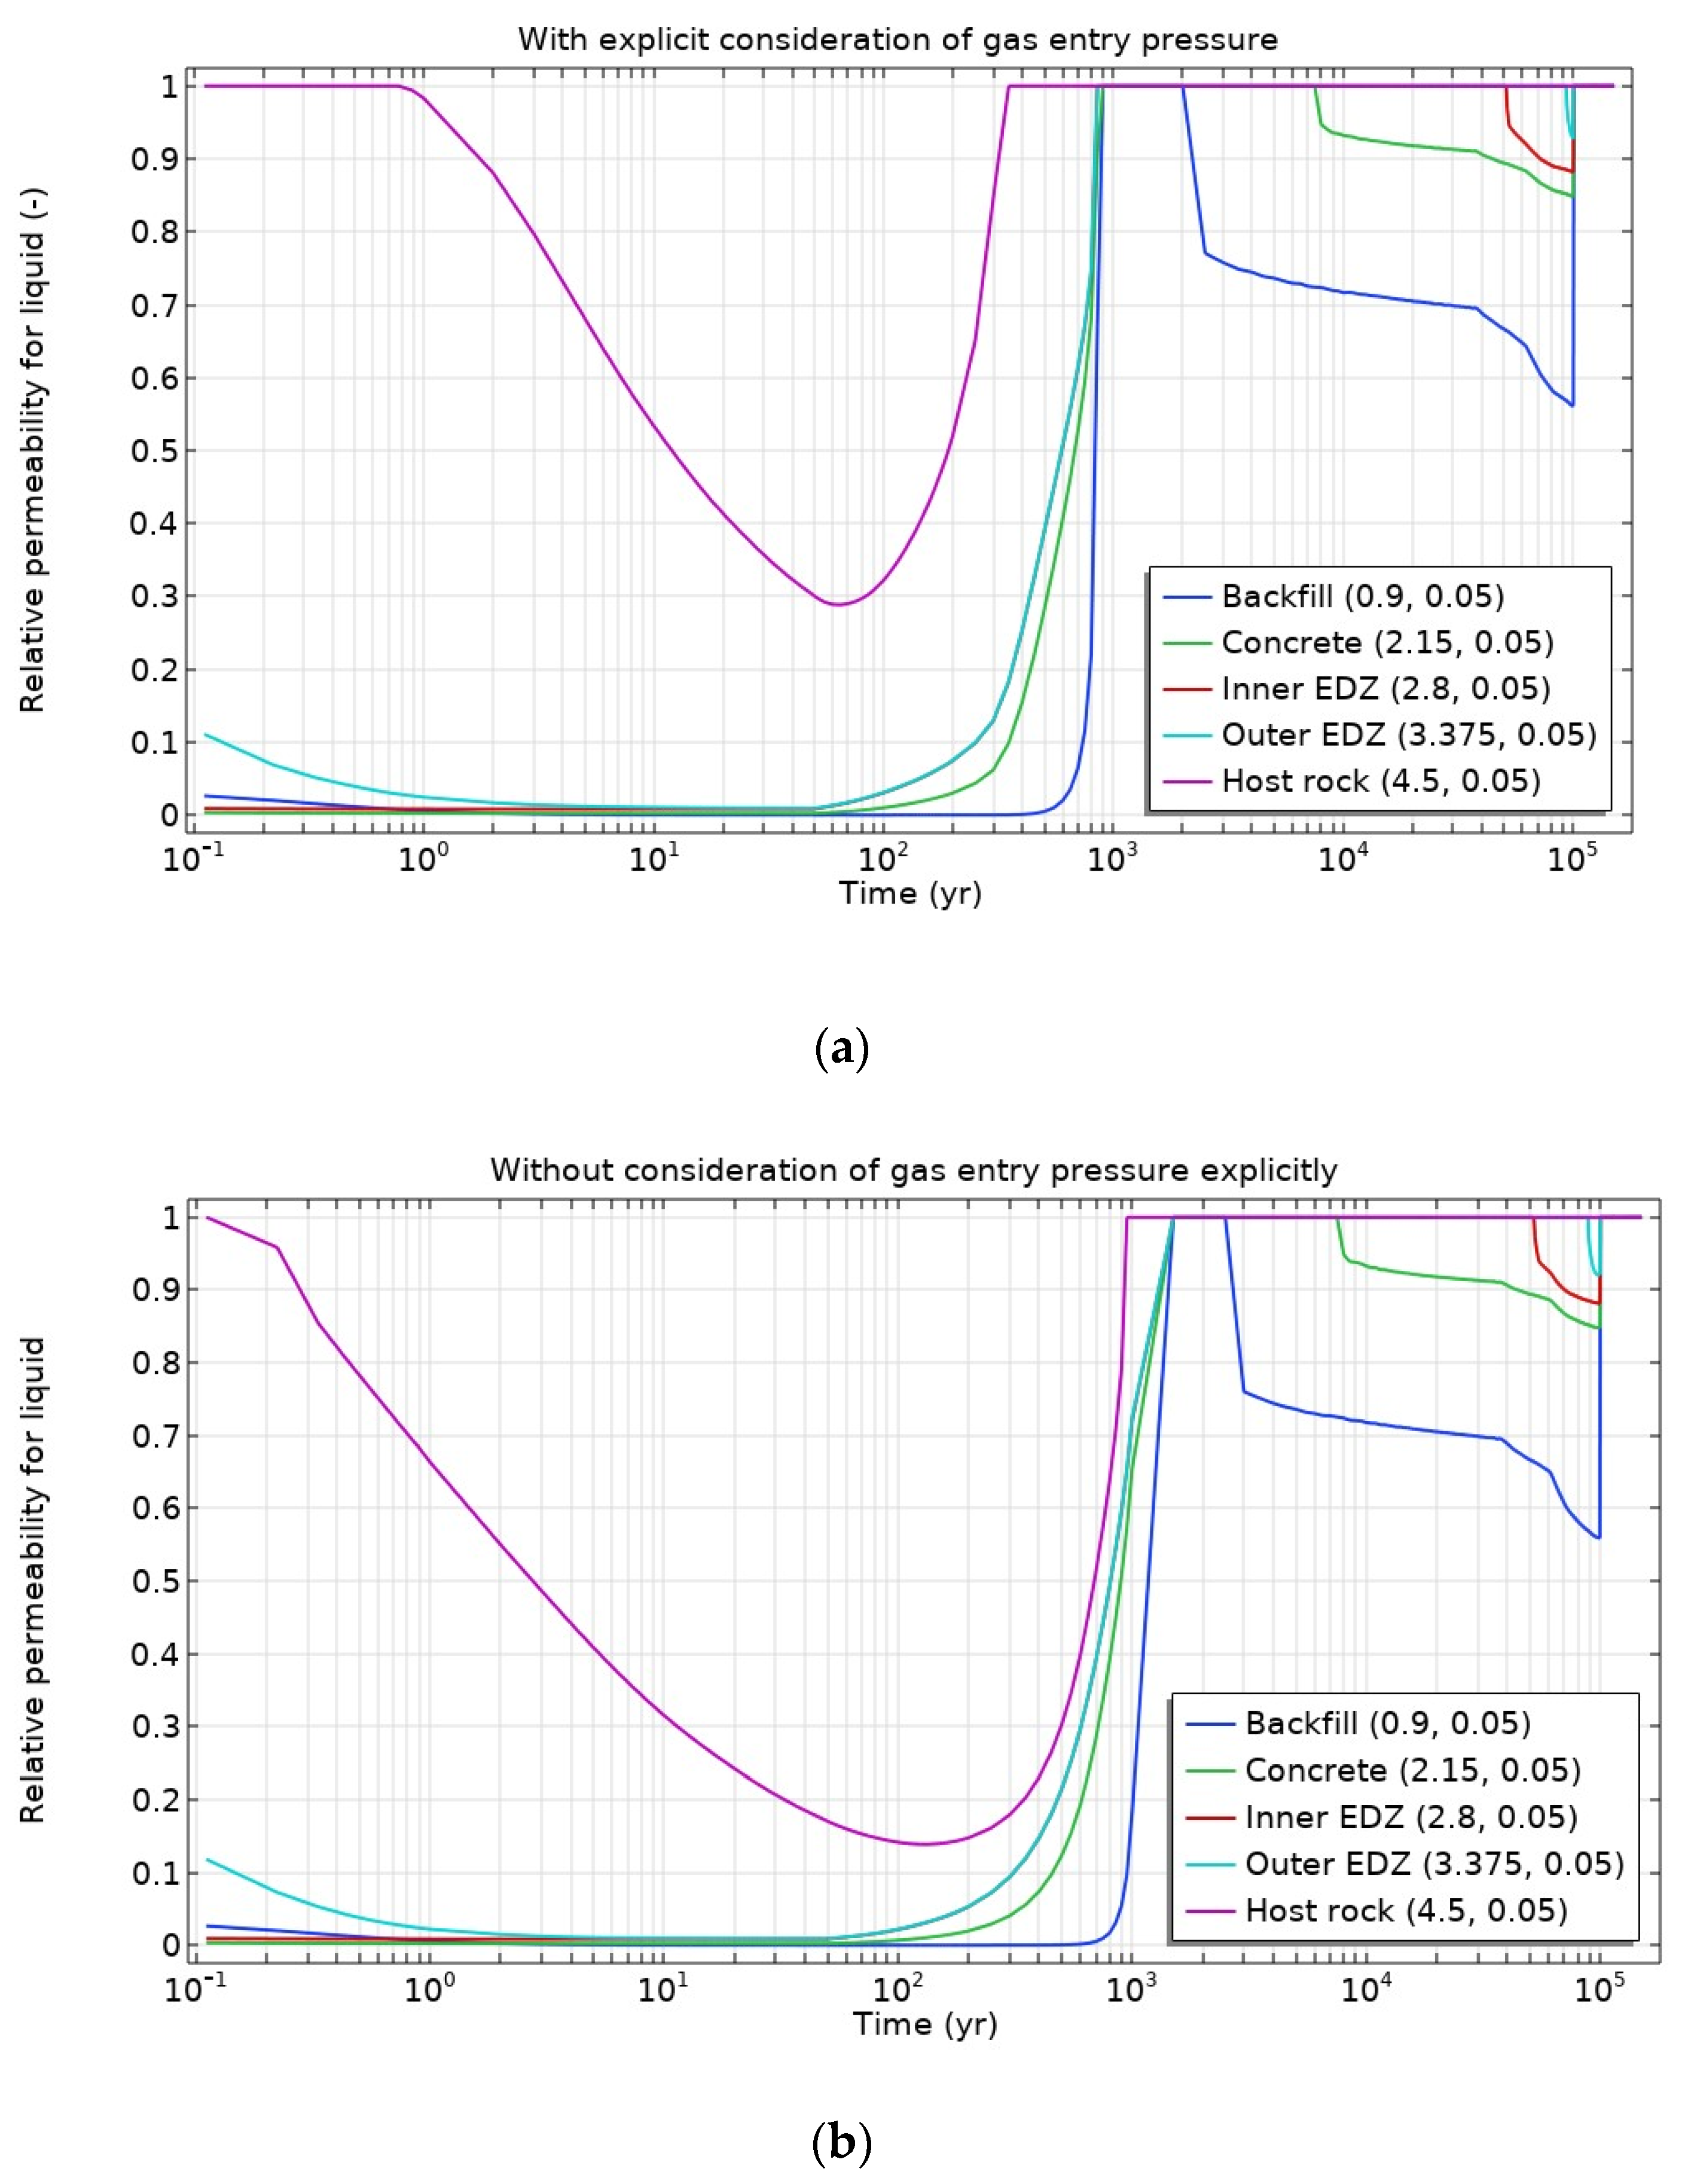
  • Despite the hydrogen gas generation, all materials became water-resaturated with groundwater coming from the host rock before ~1500 years in all cases.
  • Continuing hydrogen gas generation in the deposition tunnel led to the second desaturation of the engineered barriers and the EDZ close to the gas generation place vanishing soon after the end of gas generation, while the host rock remained saturated during the gas generation phase (50–100,000 years).
  • Under the analyzed conditions, the gas transport in the engineered barriers and parts of the host rock (EDZ) would be governed by a capillary-controlled two-phase flow, while in the major part of the host rock, the gas transport would be governed by diffusion in the dissolved form.
  • Simulated gas and liquid pressure would lead to equivalent pore pressure of ~6 MPa magnitude, and materials under isotropic total compressive stress of 15 MPa would remain in compressive effective stress state, and thus gas-induced fractures would not be expected and the barrier integrity would not be affected. Therefore, a preferential flow pathway for gas and radionuclide transport would not be developed and barrier transport properties would not be affected.
  • Hydrogen gas generation does not lead to liquid saturation less than 0.994, and thus the impact on radionuclide diffusivity would not be significant.
  • For the soluble nuclide I-129 transport from the generic repository under the analyzed conditions (start of release after hydrogen gas generation), there would be no impact of corrosion-induced gas on radionuclide migration.
  • For any other geometric dimensions, gas generation rates and its time evolution, other boundary conditions and/or material properties, THMG analysis needs to be re-run for the conclusion on the impact on repository barrier integrity and radionuclide transport properties.
  • The modelling results will serve for further investigation of gas transport and its impact on repository barrier integrity under elevated temperature conditions considering additional gas sources in other repository structures.

Author Contributions

Investigation, A.N. and G.P.; writing—original draft preparation, A.N.; visualization, A.N.; writing—review and editing, G.P. and G.B. All authors have read and agreed to the published version of the manuscript.

Funding

The EURAD program has received funding from the European Union’s Horizon 2020 research and innovation program under grant agreement No. 847593), as well as the Lithuanian State budget.

Data Availability Statement

Data are contained within the article.

Conflicts of Interest

The authors declare no conflict of interest. The funders had no role in the design of the study; in the collection, analyses, or interpretation of data; in the writing of the manuscript, or in the decision to publish the results.

References

  1. World Nuclear Association. How Can Nuclear Combat Climate Change? Available online: https://world-nuclear.org/nuclear-essentials/how-can-nuclear-combat-climate-change.aspx (accessed on 20 October 2023).
  2. World Nuclear Association. Storage and Disposal of Radioactive Waste. Available online: https://world-nuclear.org/information-library/nuclear-fuel-cycle/nuclear-waste/storage-and-disposal-of-radioactive-waste.aspx (accessed on 20 October 2023).
  3. Council Directive 2011/70/Euratom of 19 July 2011 Establishing a Community Framework for the Responsible and Safe Management of Spent Fuel and Radioactive Waste. Available online: https://eur-lex.europa.eu/legal-content/EN/TXT/?uri=celex%3A32011L0070 (accessed on 20 October 2023).
  4. Jacops, E.; Yu, L.; Chen, G.; Levasseur, S. Gas Transport in Boom Clay: The Role of the HADES URL in Process Understanding; Geological Society, London, Special Publications: London, UK, 2023; Volume 536, pp. 75–92. [Google Scholar] [CrossRef]
  5. Yang, J.; Fall, M.; Guo, G. A Three-Dimensional Hydro-mechanical Model for Simulation of Dilatancy Controlled Gas Flow in Anisotropic Claystone. Rock Mech. Rock Eng. 2020, 53, 4091–4116. [Google Scholar] [CrossRef]
  6. Levasseur, S.; Collin, F.; Daniels, K.; Dymitrowska, M.; Harrington, J.; Jacops, E.; Kolditz, O.; Marschall, P.; Norris, S.; Sillen, X.; et al. Initial State of the Art on Gas Transport in Clayey Materials. Deliverable D6.1 of the HORIZON 2020 project EURAD, Work Package Gas. 2021. EC Grant agreement no: 847593. Available online: https://www.ejp-eurad.eu/publications/eurad-d61-initial-state-art-gas-transport-clayey-materials (accessed on 20 October 2023).
  7. Marschall, P.; Horseman, S.; Gimmi, T. Characterisation of gas transport properties of the Opalinus clay, a potential host rock formation for radioactive waste disposal. Oil Gas Sci. Technol. 2005, 60, 121–139. [Google Scholar] [CrossRef]
  8. Liaudat, J.; Dieudonne, A.-C.; Vardon, P.J. Modelling gas fracturing in saturated clay samples using triple-node zero-thickness interface elements. Comput. Geotech. 2023, 154, 105128. [Google Scholar] [CrossRef]
  9. Vu, M.N.; Armand, G.; Plua, C. Thermal Pressurization Coefficient of Anisotropic Elastic Porous Media. Rock Mech. Rock Eng. 2020, 53, 2027–2031. [Google Scholar] [CrossRef]
  10. Guo, R.; Thatcher, K.; Seyedi, D.; Plúa, C. Calibration of the thermo-hydro-mechanical parameters of the Callovo-Oxfordian claystone and the modelling of the ALC experiment. Int. J. Rock Mech. Min. Sci. 2020, 132, 104351. [Google Scholar] [CrossRef]
  11. ANDRA. Task 4 Technical Note Defining a Generic Repository Configuration, Sets of Parameters, Conditions and Relevant Indicators. EURAD WP GAS Milestone 61, 2021. (to be released, will be available online: https://www.ejp-eurad.eu/publications).
  12. Subsurface Flow Module. User’s Guide. Comsol Multiphysics. 2021. Available online: https://doc.comsol.com/6.0/doc/com.comsol.help.ssf/SubsurfaceFlowModuleUsersGuide.pdf (accessed on 20 October 2023).
  13. Navarro, V.; Asensio, L.; Gharbieh, H.; De la Morena, G.; Pulkkanen, V. Development of a multiphysics numerical solver for modeling the behavior of clay-based engineered barriers. Nucl. Eng. Technol. 2019, 51, 1047–1059. [Google Scholar] [CrossRef]
  14. Pollock, D.W. Simulation of fluid flow and energy transport processes associated with high-level radioactive waste disposal in unsaturated alluvium. Water Resour. Res. 1986, 22, 765–775. [Google Scholar] [CrossRef]
  15. Rutqvist, J.; Borgesson, L.; Chijimatsu, M.; Kobayashi, A.; Jing, L.; Nguyen, T.S.; Noorishad, J.; Tsang, C.-F. Thermohydromechanics of partially saturated geological media: Governing equations and formulation of four finite element models. Int. J. Rock Mech. Min. Sci. 2001, 38, 105–127. [Google Scholar] [CrossRef]
  16. Amri, A.; Saâdi, Z.; Ababou, R. Parametric Sensitivity to Capillary Entry Pressure in Two-Phase Water–Gas Flow Models: Deep Geologic Disposal of Radioactive Waste. Transp. Porous Media 2022, 145, 13–43. [Google Scholar] [CrossRef]
Figure 1. Schematic view of the generic repository concept [11].
Minerals 14 00004 g001
Figure 2. Schematic representation of a deposition tunnel in storage zone B (inspired by ONDRAF/NIRAS C Waste deposition concept) [11].
Minerals 14 00004 g002
Figure 3. Schematic representation of the deposition tunnel in Zone B specified in [11] and in the COMSOL Multiphysics model.
Minerals 14 00004 g003
Figure 4. Boundary conditions for the TH model.
Minerals 14 00004 g004
Figure 5. Boundary conditions for the M model.
Minerals 14 00004 g005
Figure 6. The simulated evolution of relative permeability for the liquid phase with and without H2 gas generation in the tunnel.
Minerals 14 00004 g006
Figure 7. Liquid saturation distribution around the deposition tunnel: (a) considering the modified van Genuchten–Mualem model with explicit gas entry pressure, (b) the unmodified van Genuchten–Mualem model (zero gas entry pressure).
Minerals 14 00004 g007
Figure 8. Modelled evolution of relative permeability for liquid: (a) considering the modified van Genuchten–Mualem model with explicit gas entry pressure, (b) the unmodified van Genuchten–Mualem model (zero gas entry pressure).
Minerals 14 00004 g008
Figure 9. Modelled evolution of liquid pressure at observation points: (a) considering the modified van Genuchten–Mualem model with explicit gas entry pressure, (b) the unmodified van Genuchten–Mualem model (zero gas entry pressure).
Minerals 14 00004 g009
Figure 10. Modelled evolution of gas pressure at observation points: (a) considering the modified van Genuchten–Mualem model with explicit gas entry pressure, (b) the unmodified van Genuchten–Mualem model (zero gas entry pressure).
Minerals 14 00004 g010
Figure 11. Modelled evolution of equivalent pore pressure at observation points considering the modified van Genuchten–Mualem model with explicit gas entry pressure.
Minerals 14 00004 g011
Figure 12. Modelled temperature evolution at the observation points.
Minerals 14 00004 g012
Figure 13. Temperature distribution at different times (including time for ventilation).
Minerals 14 00004 g013
Figure 14. Modelled evolution of liquid saturation evolution at observation points under: (a) isothermal conditions, (b) non-isothermal conditions.
Minerals 14 00004 g014
Figure 15. Modelled evolution of relative permeability at observation points under: (a) isothermal conditions, (b) non-isothermal conditions.
Minerals 14 00004 g015
Figure 16. Modelled evolution of (a) liquid and (b) gas pressures at observation points (nonisothermal conditions).
Minerals 14 00004 g016
Figure 17. Modelled evolution of relative permeability at observation points: (a) without mechanical couplings, (b) with mechanical couplings.
Minerals 14 00004 g017
Figure 18. Modelled evolution of (a) liquid and (b) gas pressures at observation points (THMG models).
Minerals 14 00004 g018
Figure 19. Simulated distribution of liquid pressure (a) without consideration of mechanical processes (THG model) and (b) considering mechanical-related couplings (THMG model) (geometry not to scale).
Minerals 14 00004 g019
Figure 20. Liquid saturation evolution with different assumptions on water thermodynamic properties.
Minerals 14 00004 g020
Figure 21. Evolution of effective diffusivity of I-129 in different barriers.
Minerals 14 00004 g021
Table 1. Time-dependent heat flux specified in the deposition tunnel model adapted from [11].
Time from Waste
Emplacement (Years)
Heat Flux (W/m2)Time from
Emplacement (Years)
Heat Flux (W/m2)
02.65 × 1011409.11
52.46 × 1011508.93
102.29 × 1011608.66
152.13 × 1011708.48
202.00 × 1011808.29
251.87 × 1011908.12
301.78 × 1012007.93
401.59 × 1012107.82
501.45 × 1012207.69
601.34 × 1012307.51
701.24 × 1013306.42
801.17 × 1014305.50
901.11 × 1015304.72
1001.05 × 1016304.06
1101.01 × 1017303.50
1209.738303.02
1309.379302.61
Table 2. Observation points for the analysis.
MaterialCoordinates (R, Z)Notes
Backfill (0.9 m, 0.05m)Middle point
Concrete (2.15 m, 0.05 m)Middle point
Inner EDZ (2.8 m, 0.05 m)Middle point
Outer EDZ (3.375 m, 0.05 m)Middle point
Host rock(4.5 m, 0.05 m)2 m from tunnel wall
Table 3. THM properties of barrier materials.
PropertiesBackfillConcreteInner EDZOuter EDZRock
Porosity0.40.150.20.20.2
Thermal properties
Thermal conductivity λs (W/m/K) 1.32.31.71.71.7
Solid specific heat Cp,s (J/kg/K)500900720720720
Thermal expansions of solids βTg (1/°C)2 × 10−52 × 10−54 × 10−54 × 10−54 × 10−5
Hydraulic properties
Intrinsic permeability kL (m2)1 × 10−161 × 10−161 × 10−161 × 10−181 × 10−20
Intrinsic permeability kG (m2)1 × 10−161 × 10−161 × 10-16 1 × 10⁻¹⁷ 1 × 10⁻¹⁸
van Genuchten parameter n1.51.51.51.51.5
van Genuchten Pr (MPa)110161616
Gas entry pressure Pe (MPa)00026
Residual water saturation Slr (-) 00000
Dissolved H2 parameters a and b for Millington–Quirk (-)a = 1
b = 15
a = 2
b = 4
a = 1.5
b = 10
a = 1.5
b = 10
a = 1.5
b = 10
Gaseous H2 parameters a and b for Millington–Quirk (-)a = 3
b = 3
a = 0
b = 5
a = 2.5
b = 2.5
a = 2.5
b = 2.5
a = 2.5
b = 2.5
Dissolved I-129 parameters a and b for Millington–Quirk (-)a = 1
b = 20
a = 2
b = 4
a = 2.5
b = 15
a = 2.5
b = 15
a = 2.5
b = 15
Gaseous I-129 parameters a and b for Millington–Quirk (-)No gas phase for I-129
Dissolved H2 D0 (m2/s)5 × 10−9
Gaseous H2 D0 (m2/s)9 × 10−5
Dissolved 129I D0 (m2/s)2 × 10−9
Henry’s coefficient for H2 (1/Pa)1.4 × 10−10
Mechanical properties
Isotropic Young’s modulus E (MPa)40,000 *40,00050050005000
Poisson’s ratio ν0.250.250.30.30.3
* For backfill, the mechanical properties were assumed to be the same as for concrete.
Table 4. Additional parameters considered in the non-isothermal analysis.
PropertiesExpressionUnits
Density of water ρw998.2 × exp(5 × 10⁻⁷ (PL − 100) − αw∙(T − 12))PL in kPa, T in °C
Volumetric thermal expansion coefficient αw∙10−4 (1/°C)4 × 10−6 × T3 − 0.001 × T2 + 0.1404 × T − 0.3795T in °C
Kinematic viscosity η (m2/s) (dynamic viscosity μw = ρw∙η)1.384 × 10⁻³ × (T + 50)(−C1)
C1(T) = 1.7 − 0.0156 × (0.01 × T)1.8
T in °C
Specific heat of water Cp,w (J/kg/K)4190 × (1 + 0.0025 × (0.01 × T))4.6)T in °C
Density of saturated vapor ρv0 (kg/m3)exp(0.06374 × T − 0.1634 × 10⁻³ × T2)/194.4T in °C
Diffusivity of vapor Dv (m2/s)5.9 × 10−6 × T2.3/PGT in K
Dynamic viscosity of vapor μv (Pa∙s)273.15–373.15 K3 × 10−8 × T + 9 × 10⁻⁶T in °C
373.15–473.15 K4 × 10−8 × T + 8 × 10⁻⁶T in °C
Specific enthalpy of vapor at T0 hv0 (J/kg)2.45 × 10−6
Specific heat of vapor Cp,v (J/kg/K)0–50 °CC1 + C2 × T + C3 × T2 + (p − ptr)/(C4 + C5 × T + C6 × T2)C1 = 1877.2, C2 = −0.49545, C3 = 8.1818 × 10⁻³, C4 = 22.537, C5 = 0.49321, C6 = 0.048927, ptr = 611.657 Pa, T in °C
Above 50 °CC7 + C8 × T + C9 × T2 + (p − ptr)/(C4 + C5 × T + C6 × T2)C7 = 1856.1, C8 = 0.28056, C9 = 6.9444 × 10⁻⁴, C4 = 22.537, C5 = 0.49321, C6 = 0.048927, T in °C
Specific heat of H2 (J/(g∙K))14.304
Dynamic viscosity of H2 gas μH2 (Pa·s)1 × 10⁻⁵
Dynamic viscosity of gas mixture (H2 and vapor) μG (Pa·s) 1 X v μ v + X H 2 μ H 2 X v , X H 2 —mass fraction of vapor and H2 gas
Disclaimer/Publisher’s Note: The statements, opinions and data contained in all publications are solely those of the individual author(s) and contributor(s) and not of MDPI and/or the editor(s). MDPI and/or the editor(s) disclaim responsibility for any injury to people or property resulting from any ideas, methods, instructions or products referred to in the content.

