

General Properties of Commingled Materials for Mix Designs


Department of Civil & Environmental Engineering, University of Alberta, Edmonton, AB T6G 2W2, Canada
*
Author to whom correspondence should be addressed.
Minerals 2024, 14(1), 30; https://doi.org/10.3390/min14010030
Submission received: 30 October 2023
/
Revised: 6 December 2023
/
Accepted: 21 December 2023
/
Published: 28 December 2023
(This article belongs to the Special Issue Transforming Tailings into Dryland: Analyses, Technologies, and Strategies)
Abstract
:Tailings volumes continue to collectively increase worldwide, leading to larger dams and tailings management facilities. With numerous high-profile dam failures in the past decade, the risks of these management practices are also growing. A potential shift to waste management practices at mineral mines is to commingle waste rock and dewatered tailings. This blended material should have superior physical strength properties provided by the waste rock together with improved chemical stability characteristics associated with the low permeability of the tailings. Ideally, commingled tailings and waste rock can be used to construct various mined earth landforms that are both physically and chemically stable, which will enhance operational performance and ultimately provide for the sustainable decommissioning and closure of the mining facility. To study these materials, the University of Alberta Geotechnical Centre is working with global industry partners to test commingled materials from several mine sites with varying ore and host rock types and climate regimes. The first stage of this study is described here and is focused on the optimum density, saturated hydraulic conductivity, and soil–water characteristic curves of various blend ratios, performed at laboratory scale.
1. Introduction
The mineral mining process typically creates two main waste streams that must be managed. The first is a coarse-grained waste rock material created from blasting. The second comprises fine-grained tailings that are generated from crushing and extracting the desired minerals. Waste rock materials are typically stored in large stockpiles and contain particles ranging in size from fines through sand and gravel up to boulders [1]. Tailings are traditionally deposited as a high water content slurry and consist of fine-grained particles.
Management of these two waste streams requires considerable effort and large areas of land. Both materials have the potential to generate acid rock drainage (ARD) if sulfide minerals are present [2]. The ARD potential in waste rock arises from the high permeability for both oxygen and water that exists in such a coarse material. However, the coarse nature of waste rock generally provides high strength and stability [3]. Tailings are often nonplastic, sandy silts that are deposited in a saturated state, making them vulnerable to liquefaction [4]. They generally have low permeability, causing slow consolidation and low shear strength [5]. While waste rock piles are typically freestanding, tailings impoundments require dams to contain the highly compressible and low-strength material. Failures of waste rock or tailings storage facilities can pose a significant risk to human life and the environment [5]. Recent failures at Mt. Polley [6], Fundão [7], and others clearly illustrate the need to improve these waste management practices.
As far back as 1978, Brawner [8] proposed the concept of comixing tailings and waste rock prior to deposition. The concept has since been studied academically but has not seen widespread adoption by the mining industry. Much early research focused on the coal industry through the 1990s. Mixing and pumping coarse and fine waste streams led to rapid and enhanced dewatering, improved stability, and the ability to limit or eliminate dams and reshape uneven landforms [9,10,11,12,13]. In 2001, Wilson [14] reviewed the idea of co-disposal, illustrating successes in the coal industry, exploring early research in the hard rock mining industry, and attempting to define the key issues in developing this technology. The following decade saw numerous studies of blended mine waste materials, including computer modeling, laboratory analysis, and field trials. Fines et al. [15] investigated mixtures that could be used as covers and found that they could be compacted effectively and had hydraulic conductivity properties similar to those of tailings alone. Wilson et al. [16] attempted to create a mixture analogous to glacial till, producing a dense, high-strength material with low compressibility, low hydraulic conductivity, and a high air-entry value. Wickland [17] conducted laboratory experiments and meso-scale column tests of mixtures, finding that mixtures retain strength behavior like waste rock and retain saturation properties like tailings. Bussiere [1] explored the most prominent deposition techniques, including co-mixing, layered co-disposal, and the addition of waste rock into tailings impoundments. Antonaki et al. [18] used centrifuge testing of different mixtures to explore failure modes, finding that liquefaction potential exists even in some mixtures, with both materials influencing the results. Jehring and Bareither [2] conducted triaxial compression tests of mixtures, finding that mixtures below optimum (the optimum mixture ratio “is defined as the ratio where tailings “just fill” void space of the waste rock skeleton”) behave more like tailings and that mixtures above optimum behave more like waste rock. Wickland and Longo [19] reviewed co-disposal and dewatered tailings projects as well as the Mt. Polley failure, concluding that filtered tailings and co-disposal methods have many advantages for both geotechnical and geochemical stability. They also reiterated that “dry facilities still carry a risk of catastrophic failure”, with numerous cases in the past. Burden et al. [20] presented early research into the use of filtered tailings and waste rock mixtures, finding that mixtures with floating clasts can be viable. Habte and Bocking [21] explored inconsistencies in the terminology used for waste rock and tailings mixtures.
There has been early research in the literature on the use of commingled mine wastes as construction materials outside of the mining industry. Andalicio et al. [22] experimented with commingled mine waste in base and sub-base layers of experimental roadways. They found that the material behaved differently between laboratory and field settings. Their results suggest that the mixture ratio is very important to the overall performance of the different layers.
Key items that have been identified for the use of waste rock and tailings mixtures for mine waste management are the overall need to eliminate tailings dams as a mine waste practice, to improve mine waste physical stability, chemical stability, and required storage area, and to eliminate the potential for the liquefaction of mine waste materials. A potential way to solve these issues is to commingle waste rock and tailings. This is a process of blending waste rock and dewatered tailings. The resulting material has the potential to be physically stable, similar to or more than waste rock alone. It has the potential to be chemically stable and reduce the generation of ARD. It may also be resistant to liquefaction. This new material should be able to be utilized for the construction of varied landforms that are both physically and chemically stable, resistant to liquefaction, and formable with available construction techniques, much like natural glacial till. These claims require validation through modelling, laboratory testing, and field scale trials.
This paper explores the basic properties of various waste rock and tailings mixtures derived from five different mineral mines in North America, using readily available testing equipment and established testing methods. The study began with the simple goals of measuring the density and saturated hydraulic conductivity of various waste rock and tailings mixtures. Later, as theoretical determinations for optimum mixtures were made available in the literature, attempts were made to match lab results to theoretical values. Further investigations of the materials’ strength properties and liquefaction potential will follow in later works.
2. Materials and Methods
2.1. Sites and Materials
Beginning in 2019, the UAlberta Geotechnical Centre partnered with FLSmidth to acquire samples of waste rock and tailings from five North American mineral mines to create and test commingled materials. Each of these sites utilizes some form of filtered tailings production, from pilot plants to large-scale operations. The individual sites were able to provide target moisture contents or the operating moisture contents of the filter cake based on the stage of their operation. Laboratory testing used these moisture contents to mimic site conditions when creating each mixture. The deliverables of interest were data on mixture density and hydraulic conductivity. Additional data, such as particle size distribution and other material characteristics, were not measured by the UAlberta team and are not presented here.
2.1.1. Site A
Site A is a palladium–nickel–copper mine. Waste rock material was provided as 2″ minus and was well graded. The tailings material was fine-grained with a target gravimetric water content of 24%.
2.1.2. Site B
Site B is a gold mine. The waste rock material was provided as 2″ minus, though in reality, few particles were greater than 1″. The waste rock was well graded with a high fines content. The tailings material was fine-grained with a target gravimetric water content of 19%.
2.1.3. Site C
Site C is a copper–gold–silver mine. The provided waste rock was 3″ minus, with a poorly graded fabric and majority of larger particles. The tailings material was fine-grained with a target gravimetric water content of 16%.
2.1.4. Site D
Site D is a gold mine. The waste rock was 3″ minus and was fairly well graded between larger clasts. There were few fines included. The tailings material was fine-grained with a target gravimetric water content of 18%.
2.1.5. Site E
Site E is an iron ore mine. The waste rock material from this site was a poorly graded medium sand. The tailings material was fine-grained with a target gravimetric water content of 19%.
2.2. Methodology
The original purpose of this study was to study the effects of mixture ratios and their resulting properties on numerous types of waste rock and tailings. Properties, including optimum moisture content, optimum density or dry unit weight, and saturated hydraulic conductivity, were determined using readily available laboratory measurement equipment. Burden and Wilson [23] suggest the use of Proctor tests as an experimental method “to evaluate the density of commingled materials at a range of mix ratios”. The primary tests in this study were a type of standard Proctor compaction test and a falling head conductivity test utilizing a compaction permeameter. The compaction permeameter consists of a traditional 6″ Proctor mold and the addition of upper and lower pore stones, as well as input and output plumbing ports allowing for hydraulic conductivity testing. Additionally, specialized testing was performed to determine the soil–water characteristic curve (SWCC) of the tailings materials.
Waste rock and tailings were blended at various mixture ratios based on dry mass, expressed as rock:tailings (R:T) ratios. Where available, material blending values were based on parameters from the parent site, such as the moisture content of the filtered tailings, and target mixture ratios based on material volumes. Material particle size, available quantities, and experience were also used to develop the mixtures. All materials were oven-dried prior to mixing to achieve a common starting point.
Waste rock materials were scalped to 1″ minus prior to mixing. This cutoff value was a compromise between the coarse nature of waste rocks and the ¾″ maximum size suggested in ASTM D698 [24]. Tailings were wetted to their field filtered moisture content using deionized (DI) water. Waste rock was wetted with varying amounts of DI water to reach the target moisture content of the target mixture. The mixing of the materials was performed by hand until visually homogeneous. The material was compacted in three lifts with fifty-six blows per lift. Mass and volume values were recorded; then, dry unit weight and dry density values were calculated. Special compaction permeameter molds allowed for hydraulic conductivity testing following the density test. The cell was sealed and filled with DI water, and the sample was allowed to saturate. Once saturated, falling head conductivity tests were performed to determine the saturated hydraulic conductivity of the mixture. For each site, the waste rock and tailings materials were also tested separately (when possible). Some of the waste rock materials were too coarse to be compacted in a Proctor mold.
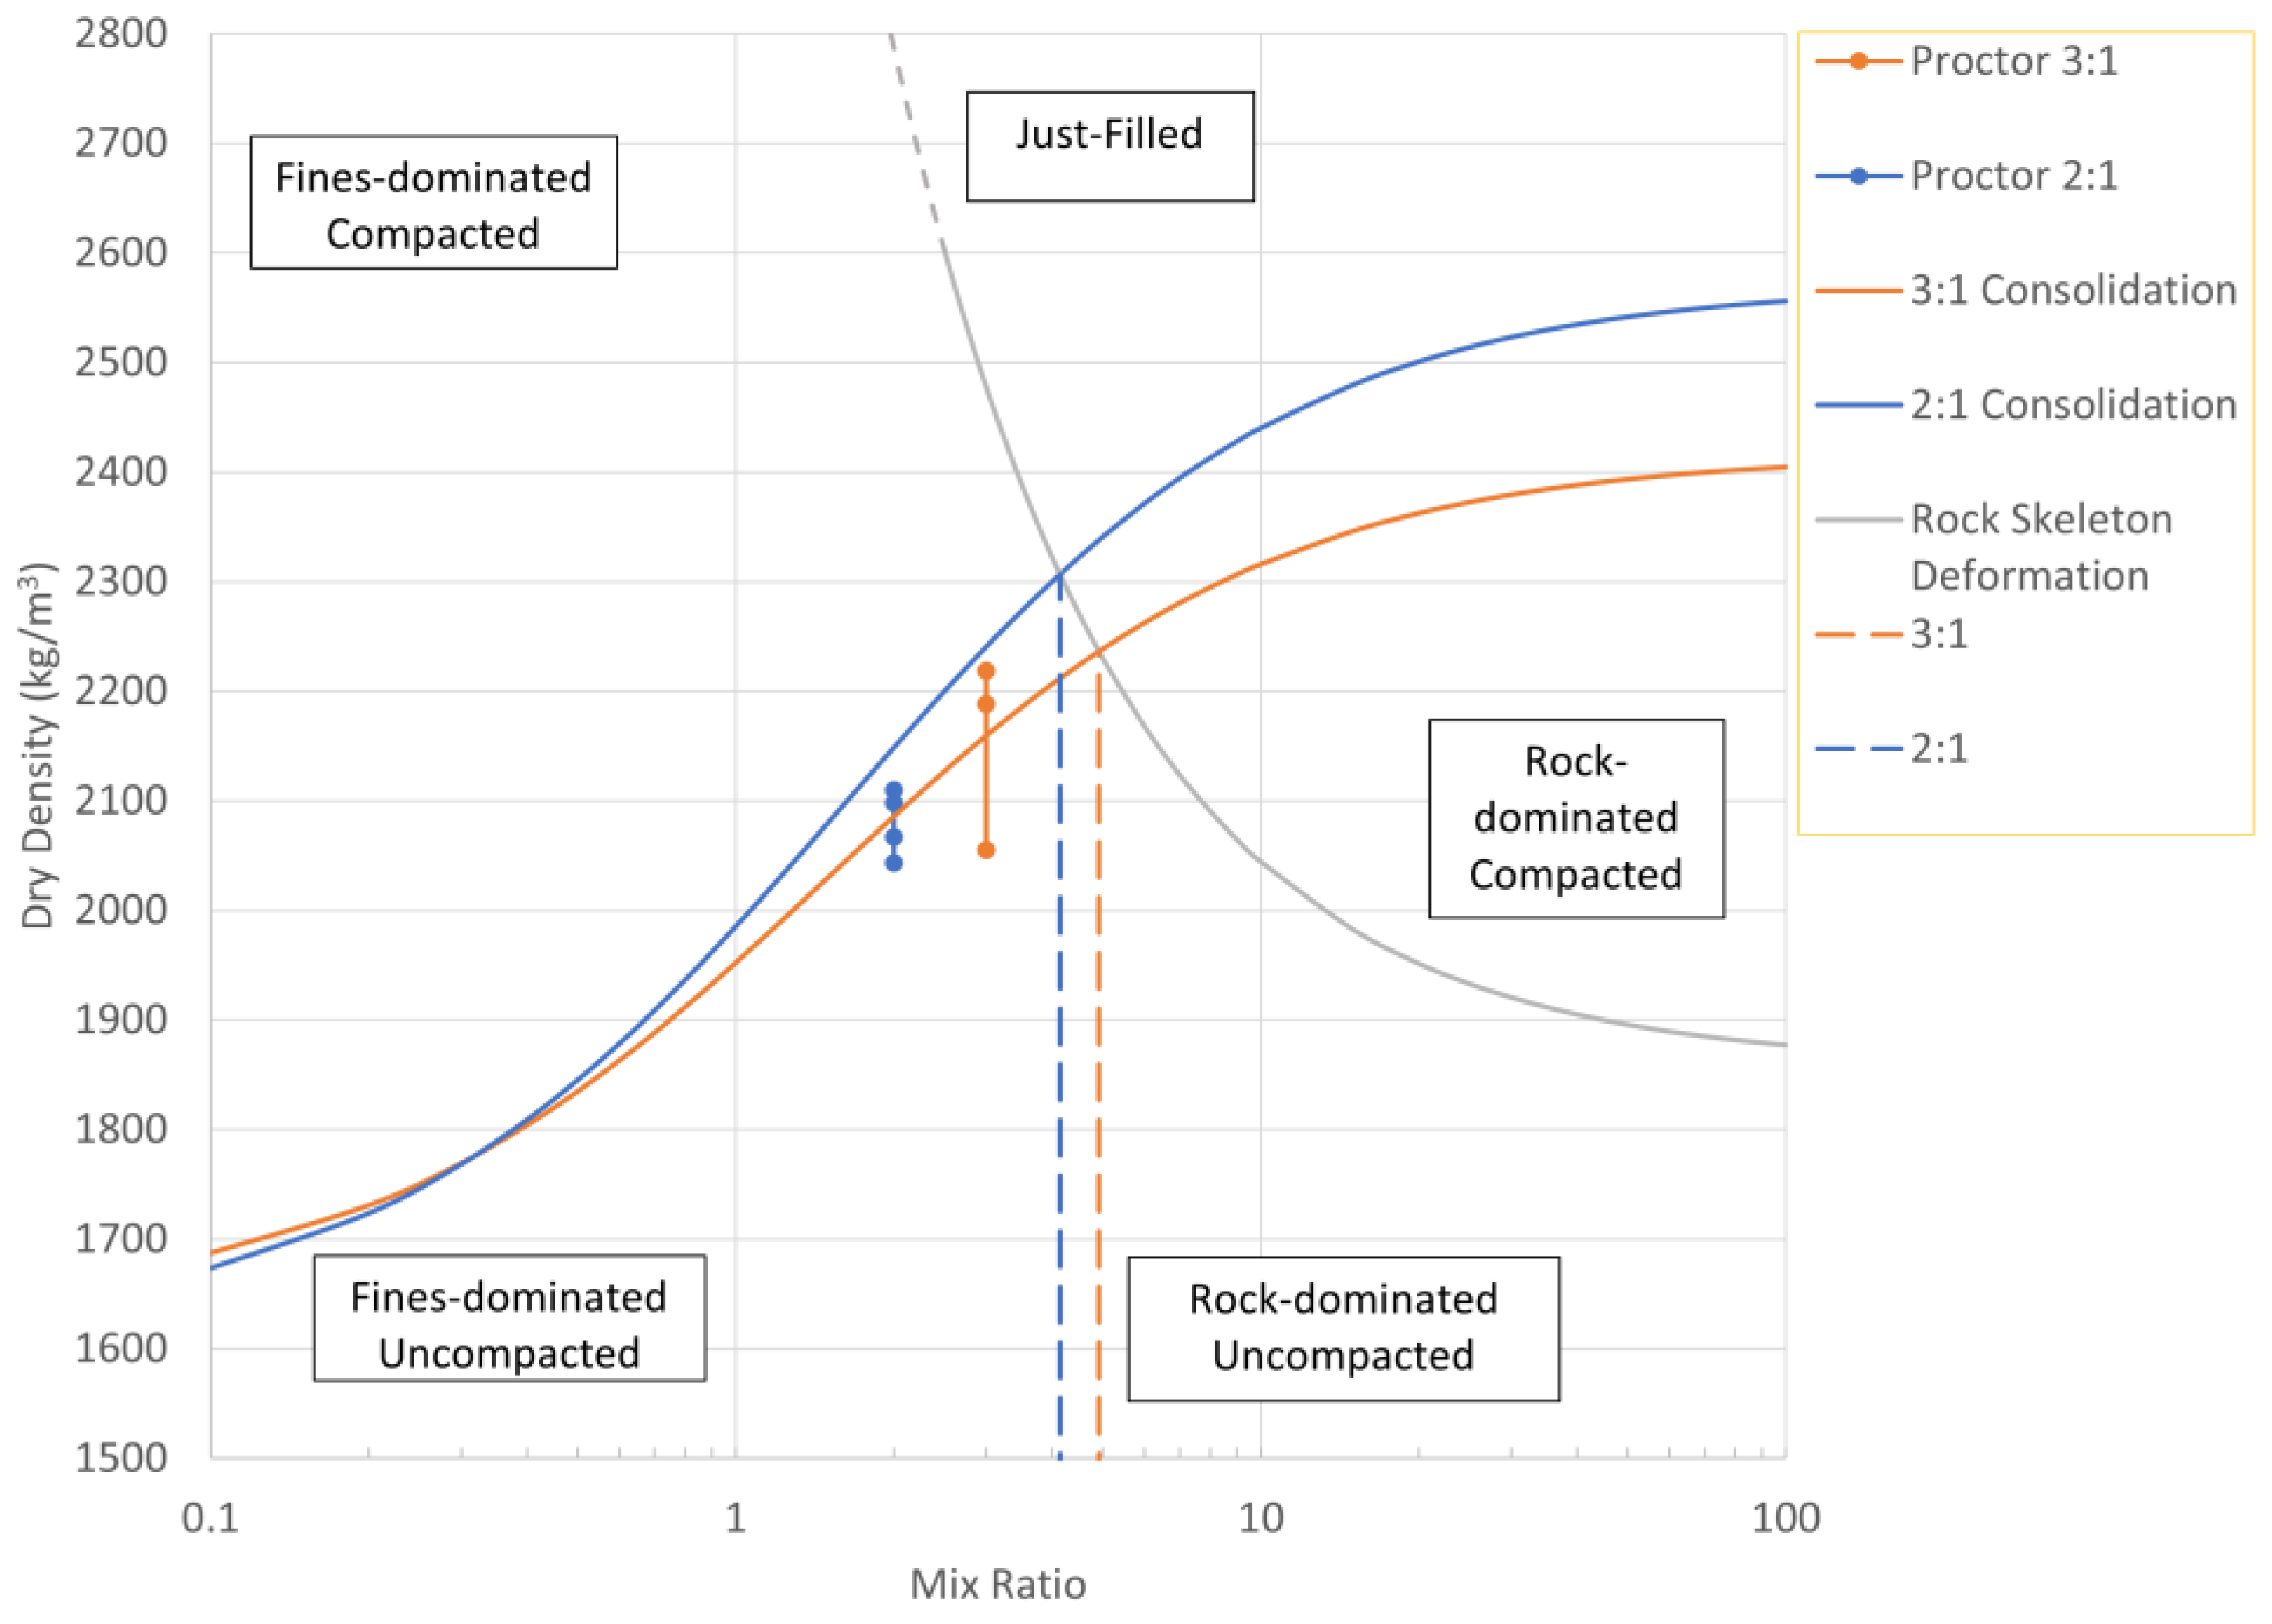
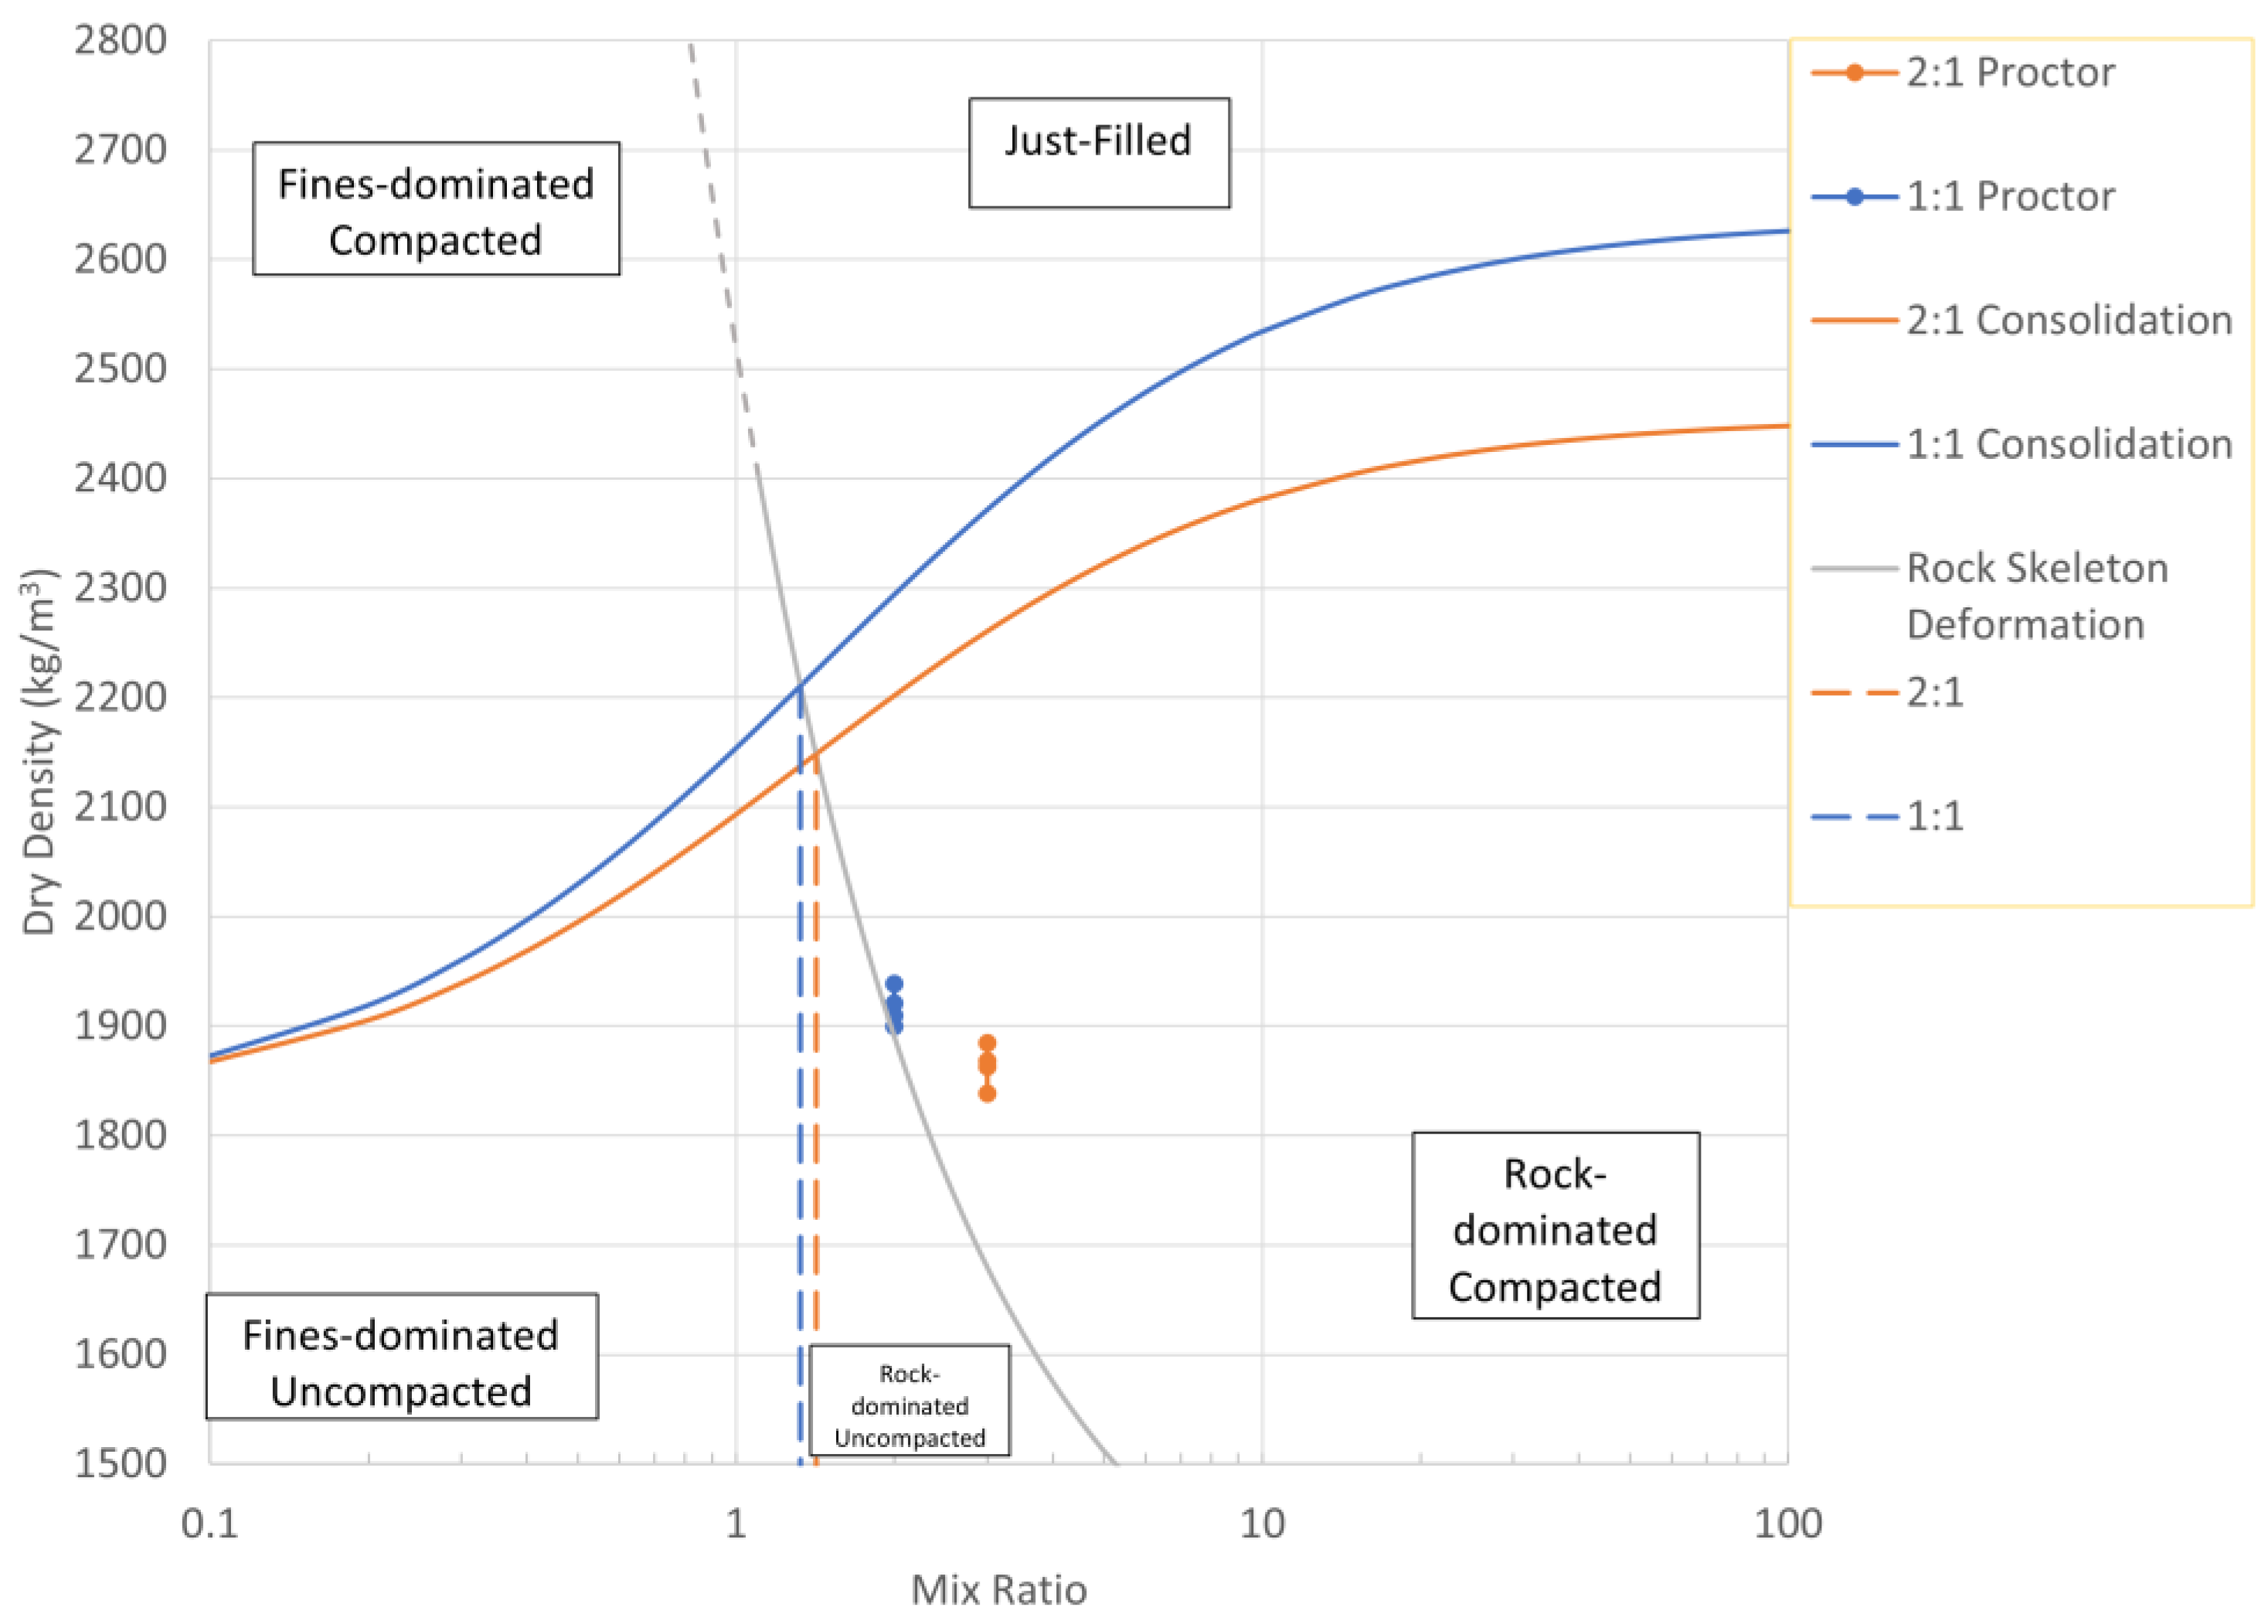
In 2021, Burden [25] published formulas to calculate the optimal mixture ratio based on specific gravities, moisture contents, and porosities and defined the volume change mechanisms of mixtures under compression. These mechanisms include compaction, a reduction in the volume of air-filled voids; waste rock deformation, the “deformation of the load-bearing waste rock skeleton”; tailings consolidation, a “reduction of the volume of the tailings fraction of the blend, due to drainage of pore water”; and coupled consolidation and skeleton deformation—beyond the “just-filled” point, “the compression behaviour is governed by both consolidation and skeleton deformation”. Using this methodology, design plots can be developed, as shown in Figure 1, utilizing only a few material properties (specific gravity, moisture content, and porosity). This paper attempts to match measured Proctor density data to the theoretical design plots.
The design chart in Figure 1 has three main components: a tailings consolidation line, a rock skeleton deformation line, and a “just-filled” line. The tailings consolidation line is the boundary between unsaturated and saturated material behavior. This line is dependent on material moisture contents and will drop and flatten as moisture contents increase. The rock skeleton deformation line is the boundary between a matrix-supported material and a clast-supported material. The rock deformation line is driven by the maximum rock porosity value and will shift to the left (towards a more tailings-rich mixture) as the porosity increases. The “just-filled” line falls at the intersection of the consolidation and deformation lines. It describes the boundary between rock- or fines-dominated material and also shows the optimum mixture ratio [25].
From the Proctor testing data, values for specific gravity and moisture content were known, and the maximum rock porosity was estimated. These values were used to plot design curves for the different mixtures at each site. The measured proctor data were plotted, and the mixtures’ theoretical behaviours were classified based on their region (seen in Figure 1).
Figure 1.
Design diagram for commingled waste rock and tailings.

The SWCCs for the tailings materials were measured using a HYPROP 2 automated measuring system (METER Group, Inc. Whitman county, southeastern Washington, DC, USA). Tailings samples were wetted to their field filtered/target filtered gravimetric moisture content and compacted using the method discussed earlier. Once compacted, samples were extracted for use in the HYPROP device. Extracted samples were saturated and mounted in the device, which has tensiometers at two different elevations within the sample. As the sample dries, internal tension and changes in mass are automatically recorded. Kabwe et al. [26] demonstrated that the device performs well in the wet range (up to 300 kPa) and can match data from Tempe Cell pressure plate measuring techniques. The tensiometer probes can measure up to 500 kPa. The early portion of the SWCC curve can be used to determine the air-entry value (AEV), the point at which a soil changes from saturated to unsaturated behavior.
3. Results
3.1. Compaction Curves
3.1.1. Site A
Compaction testing was completed for mixtures of waste rock and tailings at ratios of 3:1 and 2:1 (rock:tailings). Compaction tests were also completed for the tailings material alone and the waste rock alone as it was well graded. The tailings used a target gravimetric moisture content of 24%, and the moisture content of the waste rock was varied. Results are shown in Figure 2. The waste rock alone had the highest dry unit weight, around 23.0 kN/m3, and a fairly steep curve. The tailings alone had the lowest dry unit weight, with a shallow curve and a peak at 21.8 kN/m3. The mixtures had curves that plotted between these two extremes. Predictably, the mixture curves shift closer to the waste rock curve as the amount of rock increases and closer to the tailings curve as the amount of tailings in the mixture increases. The mixture ratio appears to affect the shape of the compaction curves as well. The 3:1 mixture has a steeper curve similar to the waste rock alone, and the 2:1 curve becomes somewhat shallower like the tailings alone curve. The rock and mixtures partially plot above the tailings saturation line.
3.1.2. Site B
Similar to Site A, the Site B waste rock was well graded, allowing for the compaction of this material for a baseline waste rock curve. Compaction tests were also completed for the tailings alone and for mixtures at 3:1 and 2:1 (rock:tailings). The gravimetric moisture content for the tailings was targeted at 19%, and the moisture in the waste rock was varied. Results are shown in Figure 3. The waste rock alone had the highest dry unit weight, with a steep curve and clear peak at 20.1 kN/m3. The tailings alone had a shallow curve and the lowest dry unit weight, around 16.4 kN/m3. Both of the mixtures retained the high dry unit weight of the waste rock but had shallow curves similar to the tailings. The 3:1 mixture had a peak dry unit weight of 19.4 kN/m3, and the 2:1 mixture had a peak dry unit weight of 19.0 kN/m3. The rock and mixtures partially plot above the tailings saturation line.
3.1.3. Site C
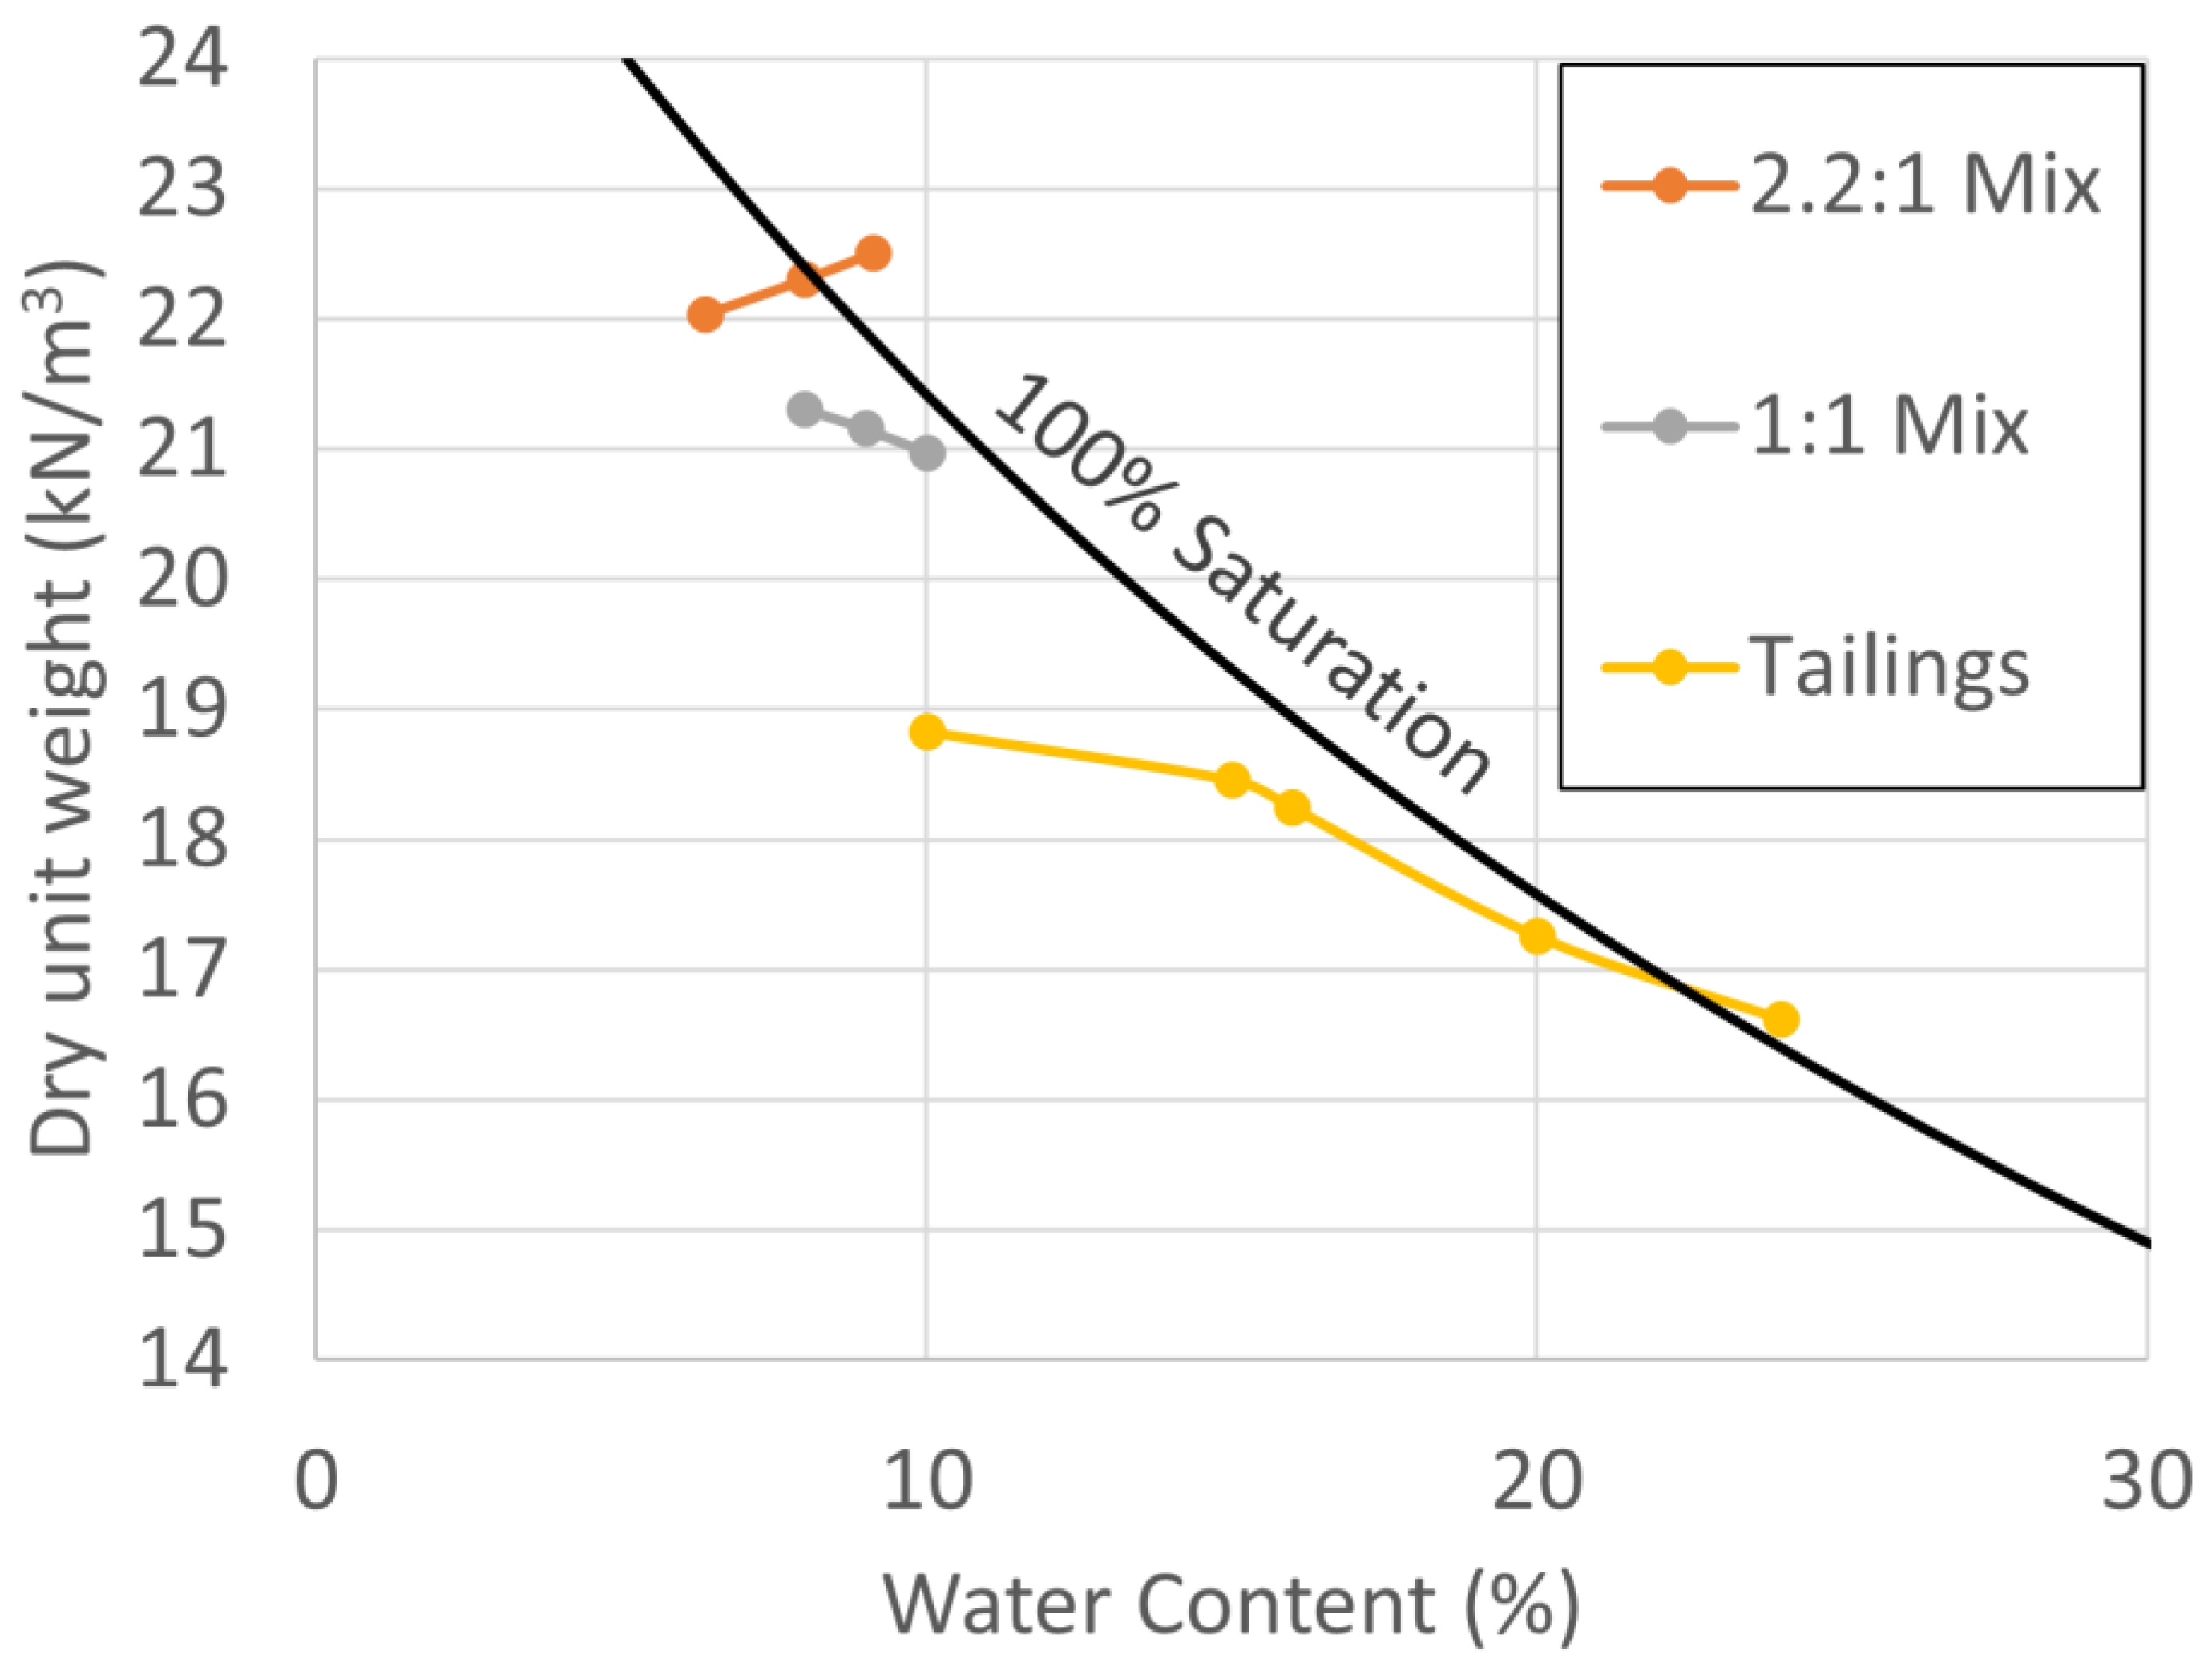
Compaction testing was completed for Site C tailings and mixtures at 2.2:1 and 1:1 (rock:tailings). The target moisture content for the tailings was 16%. Results are shown in Figure 4. The waste rock material was poorly graded and coarse, meaning it could not be compacted separately. It was very difficult to work with these mixtures at such a low moisture content and with such coarse particles; as such, the results for optimum moisture and density are inconclusive.
3.1.4. Site D
Compaction testing was completed for Site D tailings and mixtures at 1:1 and 1:2 (rock:tailings). The tailings material had a target gravimetric moisture content of 18%. Results are shown in Figure 5. In some cases, this target had to be reduced in order to dry the material enough to complete the curves. The waste rock was fairly well graded but coarse, meaning that it could not be compacted alone. Mixing these materials was challenging, similar to Site C, but the compaction curves appear as expected. The tailings material had the lowest dry unit weight, around 17.2 kN/m3. The mixtures had higher dry unit weights, at 20.0 kN/m3 for the 1:1 mixture and 19.0 kN/m3 for the 1:2 mixture. The mixtures partially plot above the tailings saturation line.
3.1.5. Site E
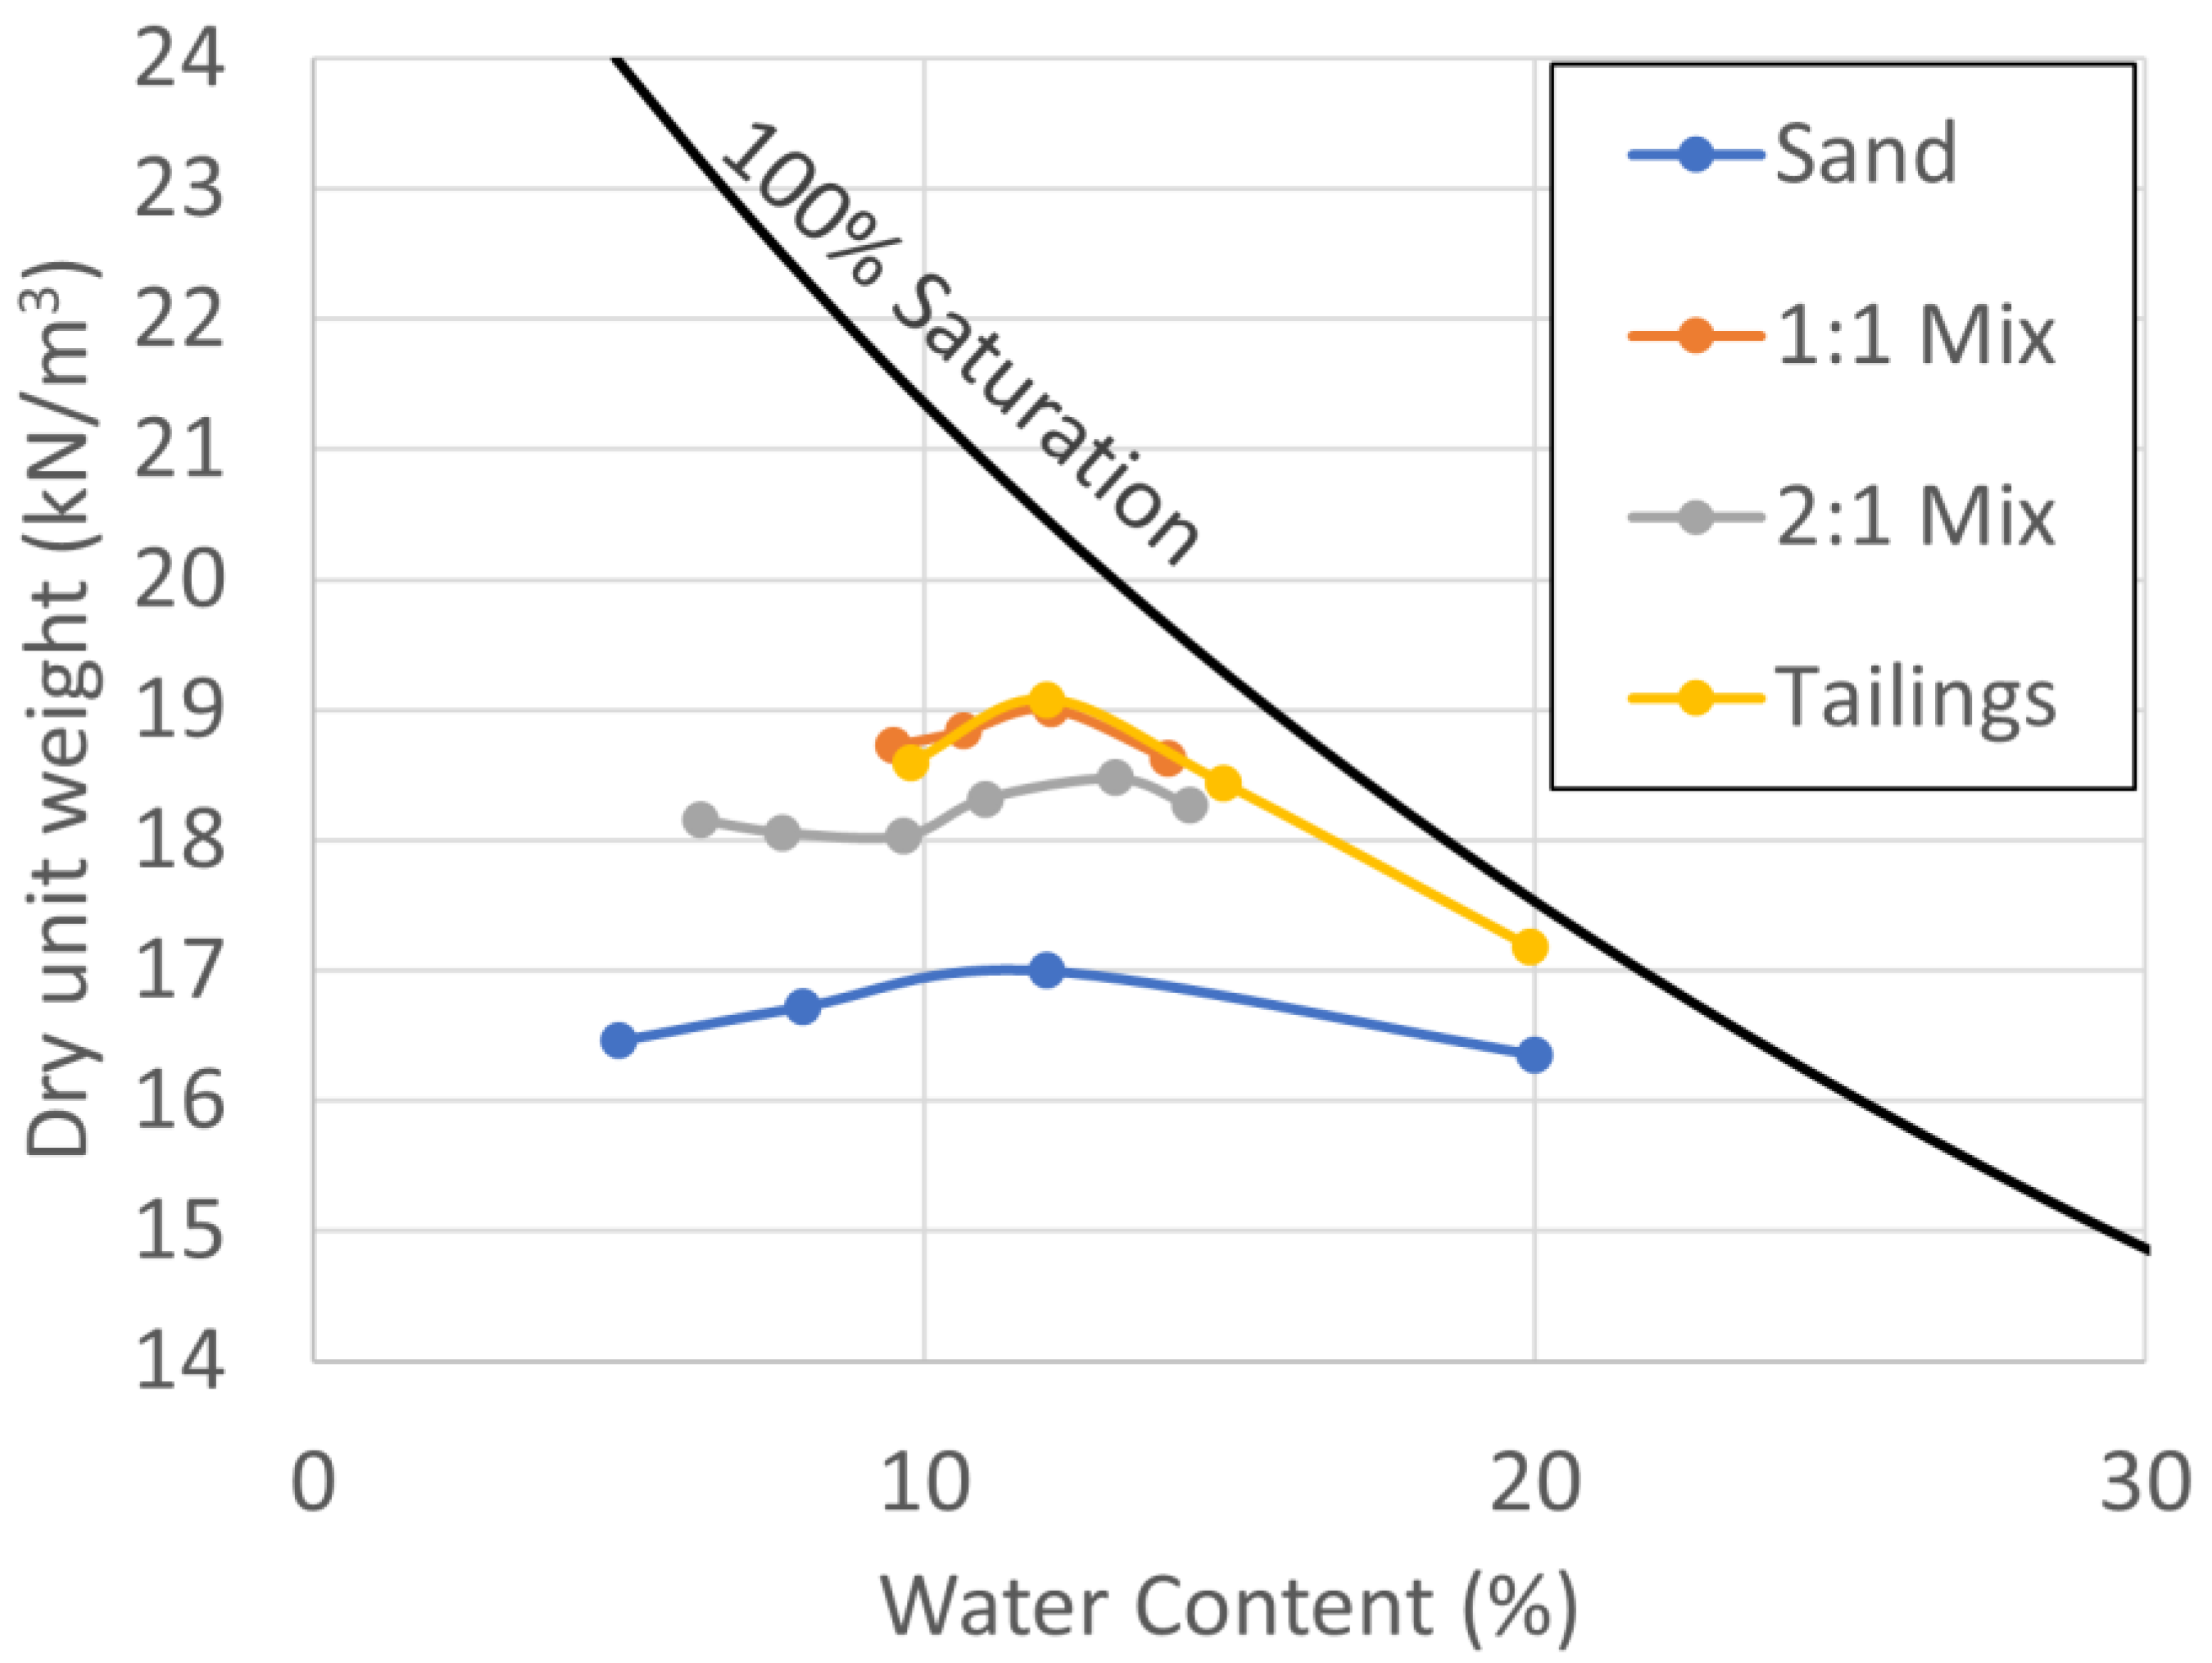
The Site E materials were unique in this study in that the “waste rock” was actually a poorly graded medium sand. Density testing was completed for the sand, tailings, and mixtures at 1:1 and 2:1 (sand:tailings). The target moisture content for the tailings was 19%, and the moisture in the sand was varied. Results are shown in Figure 6. In this case, the tailings had the highest dry unit weight, around 19.1 kN/m3, and the sand had the lowest dry unit weight, around 17.0 kN/m3. At 1:1, the mixture behaved almost identically to the tailings alone, with a similar curve and a dry unit weight of 19.0 kN/m3. At 2:1, the mixture tended to bulk up at low moisture contents and transitioned to a more typical compaction curve as the moisture content increased, giving a peak dry unit weight of 18.5 kN/m3. The rock and mixtures plot below the tailings saturation line.
3.2. Saturated Hydraulic Conductivity
Falling head hydraulic conductivity tests were performed on the mixtures from each site to determine the saturated hydraulic conductivity at each Proctor step. Ksat tests for the waste rock and tailings alone were not performed for each step as these materials were recycled during the Proctor tests, changing the moisture content at each step. Carrying out the testing program would have taken significantly longer if Ksat tests were performed at each Proctor step for the base materials. Generally, only a single Ksat value was measured for these materials at the final moisture step. From this point onward, the data are discussed in terms of dry density in order to match the theoretical approaches proposed by Burden [25].
3.2.1. Site A
Due to an equipment malfunction and material loss, only two Ksat points were recorded for the 3:1 mixture. For each data point, a series of three conductivity tests were completed, and the average value was plotted. A complete curve of Ksat points was recorded for the 2:1 mixture. For both materials, the lowest conductivity value corresponds to the optimum moisture point, with the ksat increasing on either side of the optimum. The values all remain within one order of magnitude, with moisture contents changing from 5 to 15%, shown in Figure 7.
3.2.2. Site B
Ksat tests for Site B mixtures were conducted alongside density testing. For each data point, a series of two to three tests were performed, and the average value was plotted. Both mixtures had their lowest conductivity value at the optimum moisture content, with higher values on either side of optimum. Overall, the conductivity curves were very similar for the 3:1 and 2:1 mixtures. The values cover just over one order of magnitude, with moisture contents ranging from 6 to 16%, as shown in Figure 8.
3.2.3. Site C
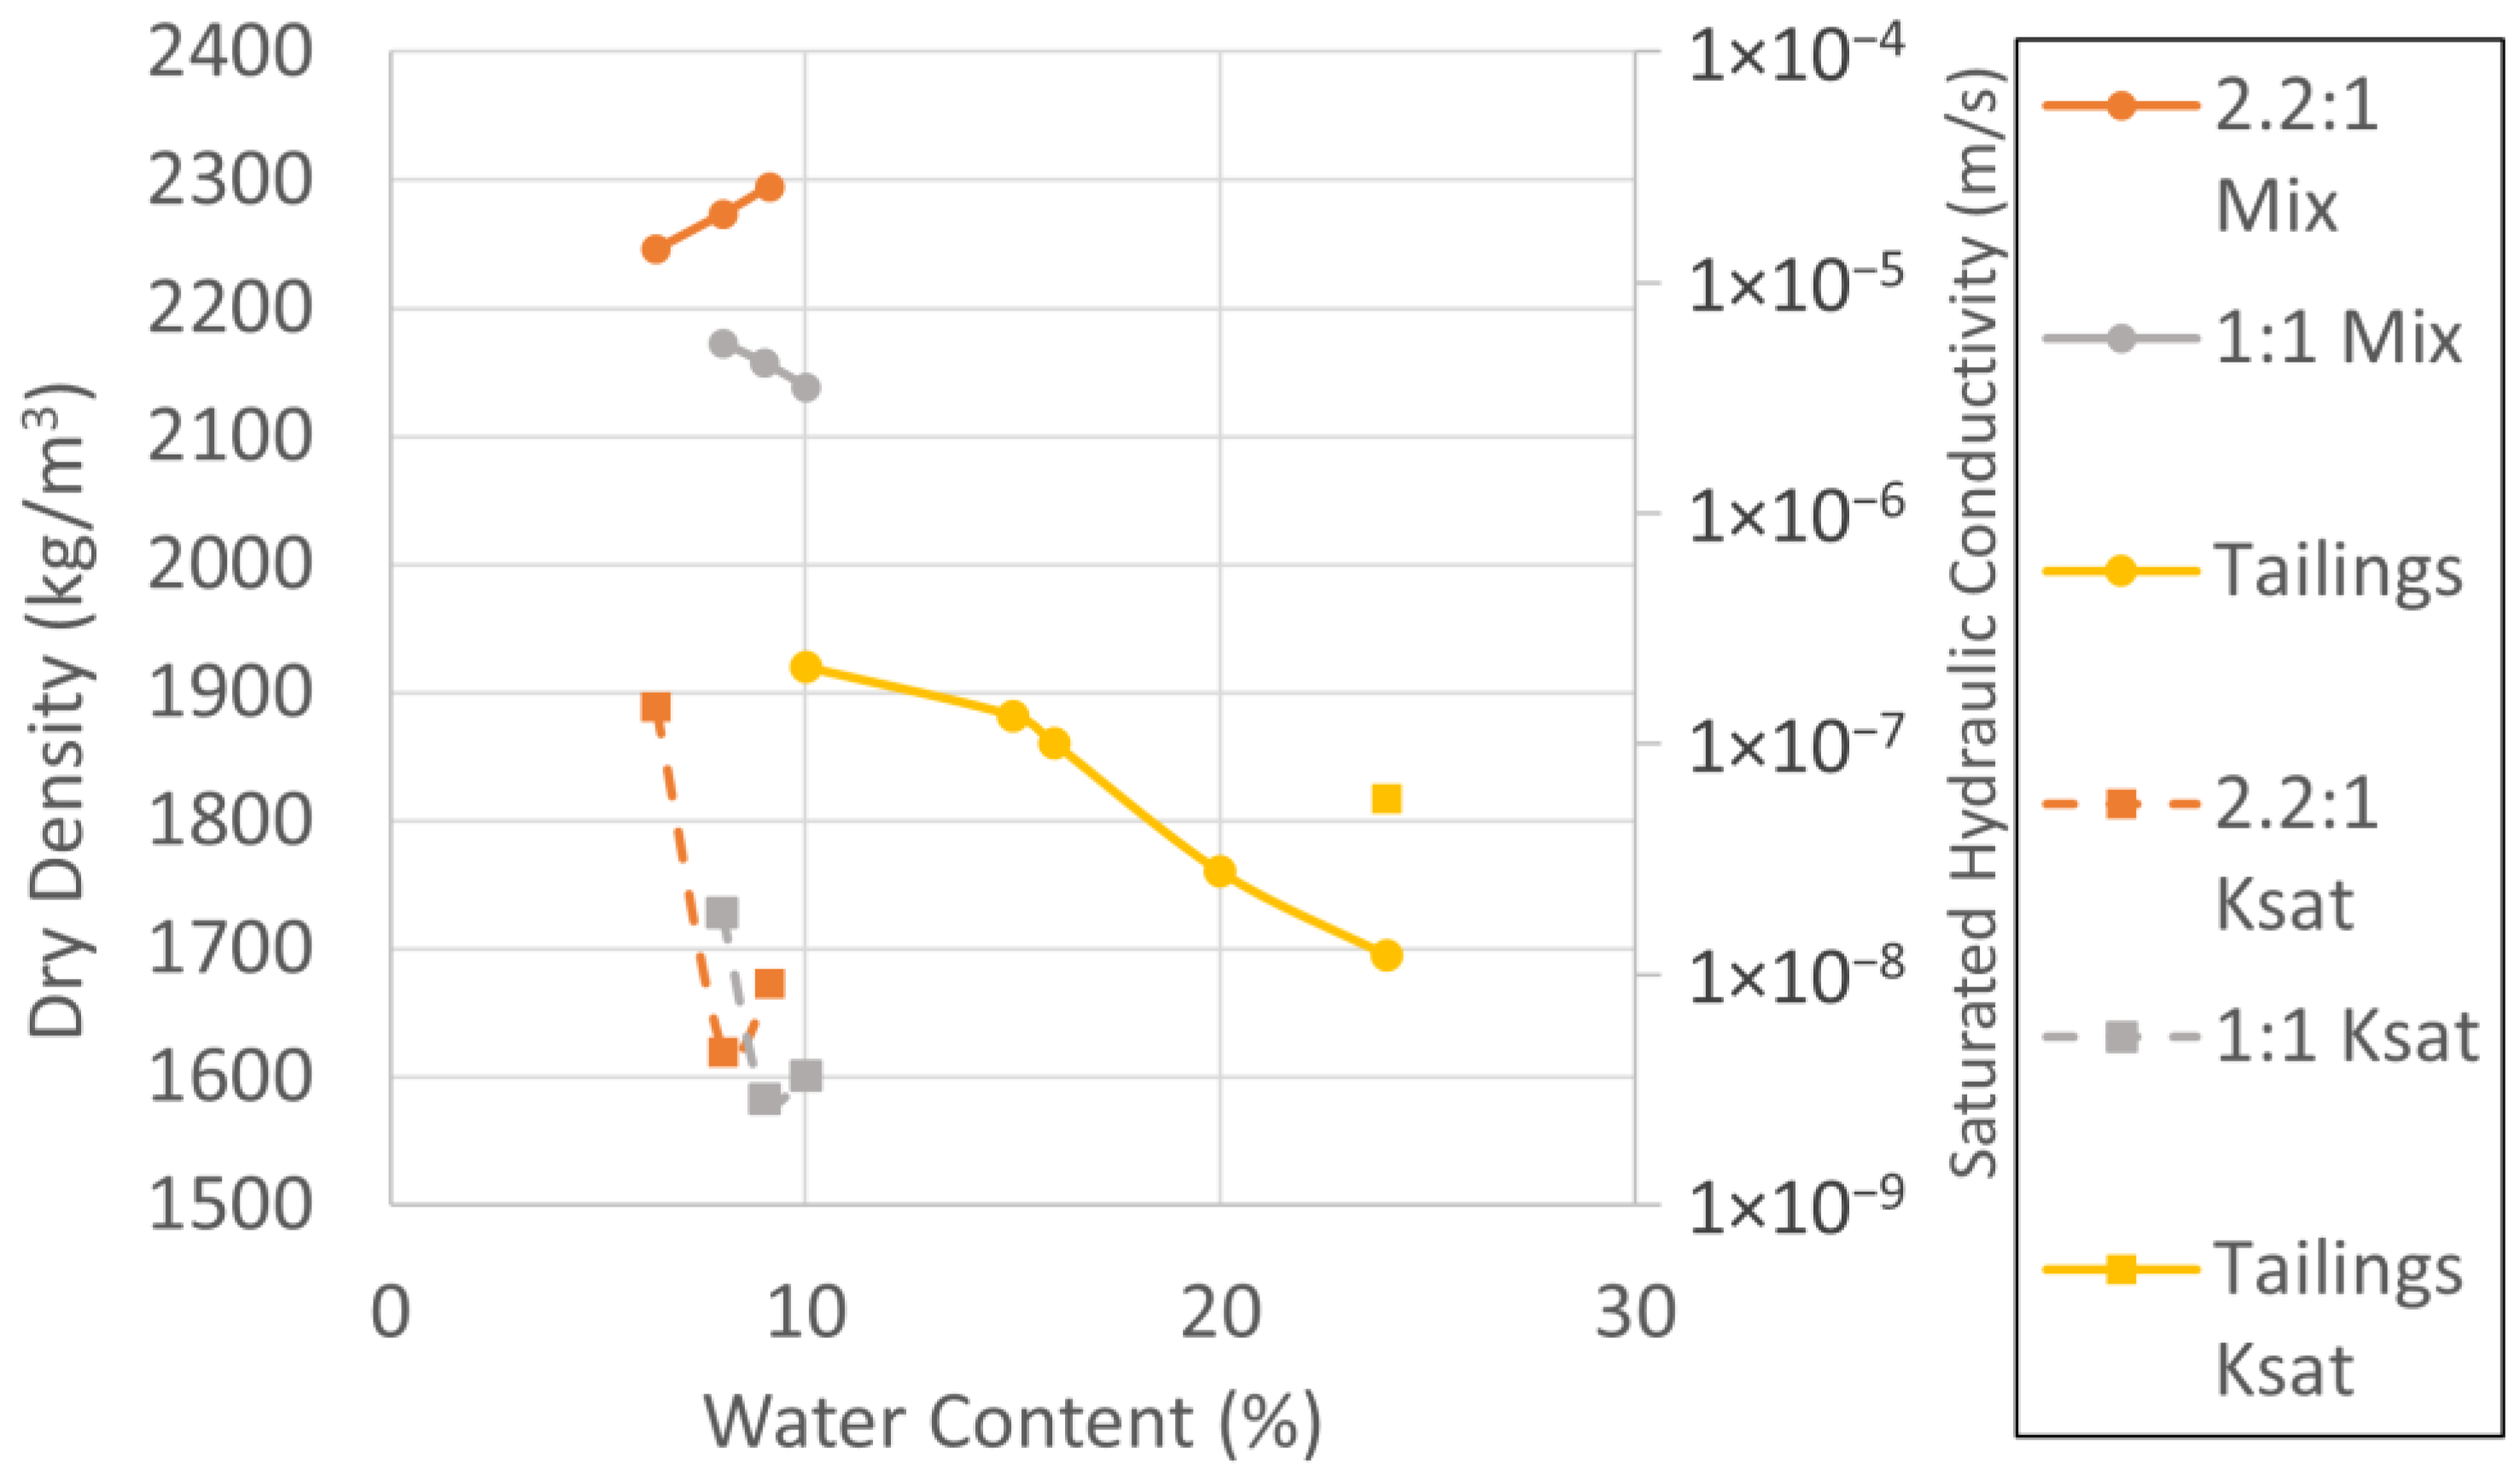
Ksat values were determined for the Site C 2.2:1 and 1:1 mixtures. Each data point is the average of two falling head tests. Optimum density values were not clearly identifiable due to difficulties working with the very coarse material. The Ksat values do have a clear inflection point for both mixtures. The ksat values stretch over a few orders of magnitude, with the moisture content in a tight range of 6 to 10%, as shown in Figure 9.
3.2.4. Site D
Site D mixtures were evaluated for Ksat values alongside density testing. Each data point is the average of three falling head tests. For both mixtures, the minimum ksat value corresponded to the optimum moisture content. The 1:1 and 2:1 mixtures had similar minimum ksat values, though the overall curves differed. The ksat values varied over one order of magnitude, with a range of moisture contents from 8 to 13%, as shown in Figure 10.
3.2.5. Site E
Ksat tests were conducted on Site E materials at 1:1 and 2:1 mixture ratios. Each plotted value is the average of three falling head tests. The 1:1 curve does not have a clear inflection point, while the 2:1 curve has a minimum Ksat that appears to correspond to the optimum moisture content. The ksat values range just over one order of magnitude, while the moisture content ranges from 6 to 14%, as shown in Figure 11.
3.3. Soil–Water Characteristics
Soil–water characteristic curves were measured for the tailings material of each site. For sites B through D, sample preparation included wetting the material to the field filtered moisture content and compacting it. For Site A, the available material was extremely limited, and there was not enough remaining for the compaction technique. In this case, the material was packed into the sample ring by hand and yielded a looser sample for measurement. This sample still had a comparable AEV to the compacted samples; it is expected that proper compaction would yield a higher AEV. The measured data were fit using Fredlund and Xing unimodal and bimodal techniques within the Labros Soilview-Analysis software, used by the Hyprop system. SWCCs for the five tailings materials are plotted in Figure 12, and AEVs are shown in Table 2.
4. Discussion
4.1. Compaction Curves
There are several common occurrences between each of the different waste rock and tailings mixtures from Sites A-D. Site E utilized waste sand and tailings and can be seen as a special case in this study. In all of the waste rock and tailings trials, the waste rock alone had the highest compaction curves, while the tailings alone corresponded to the lowest compaction curves. It must be noted that in cases in which waste rock could be compacted separately, the material was well graded with sand and finer particles. The waste rock curves tended to be steep with a distinct peak, while the tailings curves were shallow with a broader peak. The mixtures of waste rock and tailings at various ratios plotted in between the two extremes, with the location and shape of the curve shifting based on the mixture ratio. Mixtures with more rock plotted closer to the waste rock line and often had a steeper profile. Mixtures with less rock shifted towards the tailings line and became shallower. This relationship demonstrates that mixtures can combine positive attributes of each material at laboratory scale. The density of mixtures can be increased above that of tailings alone. As well, the addition of tailings to waste rock creates a fabric that can be compacted, whereas many waste rock materials cannot be compacted alone.
Site E was a special case, with the coarse material being a poorly graded, medium sand. This sand tended to bulk up under compaction, leading to the special case in which the coarse material had a lower and shallower compaction curve than the tailings. Even though it was possible to generate a compaction curve for the sand, it was readily deformable and did not retain its shape outside the mold. The addition of tailings helped create a material that could be readily compacted under field conditions. The 2:1 mixture still had a tendency to bulk up at very low moisture contents but became more rigid around the optimum point. The 1:1 mixture compacted almost identically to the tailings alone.
4.2. Theoretical Values
Theoretical consolidation lines were calculated and plotted for materials from each site, using data from Proctor testing. These lines rely on the specific gravity values and moisture content values of the tailings and rock material, as discussed in Section 2.2. The specific gravity values are constant for each material, and the moisture content of the tailings was set based on the field filtered values from the parent mine site. The moisture content of the rock was variable and was adjusted for each proctor point. Consolidation lines were plotted, using moisture values corresponding to the optimum point of each mixtures proctor test.
Optimum mixture ratio lines are synonymous with the “just-filled” line described in Section 2.2. Optimum lines were plotted against the consolidation lines, with intersection points defining the mixture ratio and dry density of a mixture at a specified rock porosity and material moisture content. Subsequently, the laboratory-measured Proctor density points were plotted and classified into zones. For design purposes, this approach allows for simple mix design planning with a few input parameters. The addition of Proctor testing provides a reality check, showing where the mixture actually plots, what deformation behaviour can be expected, and how to refine the mixture for a different result. Figure 13, Figure 14, Figure 15, Figure 16 and Figure 17 show measured and theoretical mixtures for sites A to E, respectively.
4.2.1. Site A
Site A had twenty individual Proctor points, including rock, tailings, and mixtures at ratios of 3:1 and 2:1. Consolidation lines were calculated using the values from the optimum points of the 3:1 and 2:1 mixtures (Figure 13). Optimum mixture lines are formed at the intersection of the deformation and consolidation curves. Site A mixtures plotted on the boundary between fines dominated compacted and uncompacted, with the 3:1 mixture just above this boundary and the 2:1 mixture just below. The measured Proctor values plot to the left of the theoretical optimum, suggesting that at these moisture contents, the mixtures could handle more rock to reach a “just-filled” or optimum state. Both of the measured mixtures are, therefore, matrix-supported. The 3:1 mixture lies in a region in which consolidation would be the primary volume-change mechanism. The 2:1 mixture is in a region in which compaction will initially be the dominant volume-change mechanism.
Figure 13.
Optimal mixture ratio for Site A.

4.2.2. Site B
Site B had 16 individual Proctor points from tests on rock, tailings, and the 3:1 and 2:1 mixtures. Optimum values for the 3:1 and 2:1 mixtures were used to calculate mixture consolidation lines. Optimum mixture lines lie at the intersection point of consolidation and deformation lines (Figure 14). Site B mixtures plotted in two different regions. The 3:1 material was rock-dominated compacted, plotting to the right of the optimum mixture line. This mixture is clast-supported and will undergo consolidation as its main volume-change mechanism. The 2:1 material was fines-dominated uncompacted, plotting to the left of its optimum line. This mixture is matrix-supported and will undergo further compaction.
Figure 14.
Optimal mixture ratio for Site B.

4.2.3. Site C
Site C had 11 Proctor points from tests on tailings and mixtures at ratios of 2.2:1 and 1:1. Consolidation lines were calculated from the optimum density values of the 2.2:1 and 1:1 mixtures, as seen in Figure 15. Site C had a 1:1 mixture that was rock-dominated compacted, plotting to the right of its optimum mixture ratio line. This material is clast-supported and will primarily undergo consolidation. The 2.2:1 mixture was in the “just-filled” region, suggesting that “deformation is governed by a coupled process involving both skeleton deformation and consolidation” [25].
Figure 15.
Optimal mixture ratio for Site C.

4.2.4. Site D
Site D had 11 unique Proctor points from tests of tailings and mixtures at 1:1 and 1:2. Consolidation lines from each mixture were calculated using values from the optimum density curves (Figure 16). The intersection of the deformation and consolidation lines shows the optimum mixture ratio or “just-filled” point. Site D had 1:1 and 1:2 mixtures that were both fines-dominated uncompacted, though they were right on the border with fines-dominated compacted. These mixtures could have utilized more rock to reach their optimum, and they lie on the transition line between compaction-dominated behaviour and consolidation-dominated behaviour.
Figure 16.
Optimal mixture ratio for Site D.

4.2.5. Site E
Site E had 18 individual Proctor points from tests on sand, tailings, and mixtures at 1:1 and 2:1. Figure 17 shows consolidation lines that were plotted using the values from the optimum density points of the 1:1 and 2:1 mixtures. Optimum mixture ratio lines are plotted at the intersection of the deformation and consolidation curves. Site E was a special case with a waste sand instead of a waste rock. The 1:1 and 2:1 mixtures were sand-dominated compacted. Both mixtures are clast-supported and could contain more tailings in order to reach an optimum mixture point. Consolidation will be the primary deformation mechanism for these mixtures.
Figure 17.
Optimal mixture ratio for Site E.

This methodology has shown different mixtures that are both clast-supported and matrix-supported. Burden et al. [20] discuss the ability for matrix-supported materials with “floating” rocks to increase their slope stability and shear strength. They cite the geotechnical literature as well as their own findings that the matrix material helps prevent particle breakage, thus increasing strength relative to the rock skeleton alone. Though material strength was not directly tested in the present study, the observations of a matrix-supported fabric in many samples suggest that the material will have beneficial physical properties.
4.3. Saturated Hydraulic Conductivity
The benefits of mixing the materials can also be seen in the Ksat data. Bussiere [1] states that the Ksat value is “one of the most important properties to establish a design basis for tailings impoundments” as it affects consolidation, seepage, and contaminant migration. The methodology in this paper allows for the direct measurement of this parameter at the laboratory scale. Sites A to D utilized waste rock and tailings, and Site E utilized waste sand and tailings. Where possible, the base materials were tested separately (the Site C and D rock was too coarse for use in the permeameter), and the coarse material (rock/sand) always had the highest Ksat value. The tailings material generally had Ksat values one to two orders of magnitude less than the coarse material. For sites A to D, which utilized waste rock and tailings, the mixtures at peak density had ksat values lower than even the tailings. Site E, which utilized waste sand and tailings, had mixtures with ksat values lower than the sand but not lower than the tailings alone. The addition of tailings into the rock clearly shows more favorable hydraulic conductivity, with ksat values in mixtures dropping from one to three orders of magnitude compared to the rock alone. The lowering of Ksat values in mixed materials compared to tailings alone could also be an indicator of scale effects as larger particles are added. It is estimated that at field scale, the inclusion of larger waste rock particles would likely reduce the ksat value, meaning that lab measurements would be conservative. Properly mixed and compacted material will have a low Ksat value, which will slow the movement of water and oxygen through the material. Theoretically, this will help reduce oxidation and metal leeching.
Another benefit of the compaction permeameter test is that it provides some redundancy in determining the optimum moisture content. Due to the nature of these materials, the test does not strictly follow the ASTM standards. Sometimes this leads to erroneous errors in compaction or Ksat testing (as seen with the Site C tests). Mixtures at various moisture contents plotted as curves similar to an inverted compaction curve. At the optimum point, the Ksat had the lowest value. It has been shown that the optimum point tends to match between density and ksat tests, so in cases in which one test is inconclusive, the other test can help determine the result. In this study, in all cases for which there was a valid result for both the compaction and Ksat curves, the optimum point matched. This redundancy in data also indicates that this test can be used effectively in field/site conditions in which high-precision equipment is not available.
4.4. Soil–Water Characteristics
The SWCC is useful for understanding how a material retains water. Herasymuik [27] demonstrated that fine material (less than 4.75 mm) in a waste rock will preferentially provide storage and pathways for liquid water, while open interparticle voids can provide pathways for water vapour. In commingled mixtures, the majority of fine material will be from the tailings and will fill the void spaces in the waste rock. The SWCC data show that the tailings can remain at or near saturation at low water contents once compacted. In this study, uncompacted SWCC samples had a much higher water content at saturation.
It can be beneficial to have a material that retains high saturation and low moisture content. High saturation will impede the flux of oxygen entering the system, reducing oxidation potential. If the material has a low moisture content, it means less water is stored in the material, meaning more water availability for use on site, less treatment of water discharged through the material, and potentially favorable material strength properties.
5. Conclusions
This paper describes the results from the first stage of a larger study exploring the material properties of commingled waste rock and filtered tailings. The results discussed here are a preliminary look at the physical properties of the mixtures generated using varying types of waste rocks and dewatered tailings from five mine sites. Samples were prepared at various mixture ratios and evaluated in a compaction permeameter. Measured data included compaction curves and saturated hydraulic conductivity curves, the AEVs of the tailings materials, and theoretical values for optimum mixture ratios.
Recent studies have provided theoretical means for developing optimum mixture ratios for commingled materials, as well as suggestions for laboratory tests for these materials. This study found that Proctor tests for material density are useful, especially if completed with a compaction permeameter through which the Ksat can be measured as well. Proctor density curves and Ksat curves tended to mirror each other, with similar optimum moisture values. The Proctor density data can also be matched to theoretical mixture charts for use in mix designing. This study utilized an existing data set for material densities and compared it to theoretical values. Future studies following this methodology could be more robust, combining these approaches from the beginning. Ideally, rock porosity values and the specific gravity of the materials could be measured first and then used to develop design charts at desired moisture contents. The design chart would provide a theoretical optimum mixture ratio that could then be evaluated with the compaction permeameter.
The overall goal of commingled tailings is to produce well-graded materials similar to glacial till which are made from existing mine waste streams. The new materials would be more physically and chemically stable, resistant to liquefaction, and formable using available techniques. These characteristics are expected to provide operational advantages and ultimately contribute to the environmentally sustainable and socially acceptable closure of a mining facility.
By mixing materials from coarse waste rock and dewatered fine tailings streams, new mixtures with high saturation, low moisture contents, and low conductivities were generated. This created a single waste stream of material that can be compacted. At optimum values, the density is increased relative to the tailings alone, and the saturated hydraulic conductivity is decreased relative to the waste rock alone. This is a valuable first step in generating a high-strength, low-permeability material from commingled mine waste. These early results warrant further study of such materials with more advanced measuring techniques.
Author Contributions
Experimental work, D.B.; data curation, D.B.; writing—original draft preparation, D.B.; writing—review and editing, G.W.W.; visualization, D.B.; project administration, G.W.W. All authors have read and agreed to the published version of the manuscript.
Funding
This research received no external funding.
Data Availability Statement
The data presented in this study are not publicly available due to confidentiality with the research partner, FLSmidth.
Acknowledgments
The authors would like to acknowledge FLSmidth for their assistance in providing sample materials and resources to complete the test work.
Conflicts of Interest
The authors declare no conflict of interest.
References
- Bussière, B. Colloquium 2004: Hydrogeotechnical Properties of Hard Rock Tailings from Metal Mines and Emerging Geoenvironmental Disposal Approaches. Can. Geotech. J. 2007, 44, 1019–1052. [Google Scholar] [CrossRef]
- Jehring, M.M.; Bareither, C.A. Tailings Composition Effects on Shear Strength Behavior of Co-Mixed Mine Waste Rock and Tailings. Acta Geotech. 2016, 11, 1147–1166. [Google Scholar] [CrossRef]
- Wijewickreme, D.; Khalili, A.; Wilson, G.W. Mechanical Response of Highly Gap-Graded Mixtures of Waste Rock and Tailings. Part II: Undrained Cyclic and Post-Cyclic Shear Response. Can. Geotech. J. 2010, 47, 566–582. [Google Scholar] [CrossRef]
- Vick, S.G. Planning, Design, and Analysis of Tailings Dams. Available online: https://open.library.ubc.ca/soa/cIRcle/collections/ubccommunityandpartnerspublicati/52387/items/1.0394902 (accessed on 23 October 2023).
- Antonaki, N.; Abdoun, T.; Sasanakul, I. Centrifuge Tests on Comixing of Mine Tailings and Waste Rock. J. Geotech. Geoenviron. Eng. 2018, 144, 04017099. [Google Scholar] [CrossRef]
- Morgenstern, N.R.; Vick, S.G.; Van Zyl, D. Report on Mount Polley Tailings Storage Facility Breach. 2023. Available online: https://www.mountpolleyreviewpanel.ca/sites/default/files/report/ReportonMountPolleyTailingsStorageFacilityBreach.pdf (accessed on 10 September 2023).
- Morgenstern, N.R.; Vick, S.G.; Viotti, C.B.; Watts, B.D. Fundao Tailings Dam Review Panel. Available online: https://pedlowski.files.wordpress.com/2016/08/fundao-finalreport.pdf (accessed on 10 September 2023).
- Brawner, C.O. Concepts and Experience for Subsurface Storage of Tailings. In Proceedings of the Second International Tailing Symposium, Tailings Disposal Today, Denver, CO, USA, May 1978; Volume 2, pp. 153–177. [Google Scholar]
- Williams, D.J.; Gowan, M.J. Operation of Co-Disposal of Coal Mine Washery Wastes. In Proceedings of the First International Conference on Tailings and Mine Waste’94, Fort Collins, CO, USA, 19–21 January 1994; pp. 225–233. [Google Scholar]
- Williams, D.J.; Kuganathan, V. Co-Disposal of Coal Mine Tailings and Coarse Reject. In Proceedings of the Third Large Open Pit Mining Conference, Mackay, Australia, 30 August–4 September 1992; pp. 429–432. [Google Scholar]
- Williams, D.J.; Kuganathan, V. Co-Disposal of Fine and Coarse Grained Coal Mine Washery Wastes by Combined Pumping. Int. J. Environ. Issues Miner. Energy Ind. 1992, 53–58. [Google Scholar]
- Williams, D.J. Broadening the Options—Innovative Tailings Disposal Concepts and Practices. In Proceedings of the 3rd International 21st Annual Minerals Council of Australia Environmental Workshop, Newcastle, Australia, 14–18 October 1996; pp. 264–278. [Google Scholar]
- Gosling, C.F.; Riley, S.J.; McQuade, C.V. Co-Disposal of Coarse Coal Reject with Sand Mining Reject for the Control of Metal Concentration in Runoff Water. In Proceedings of the Coal 1998: Coal Operators’ Conference, Wollongong, Australia, 18–20 February 1998; pp. 474–485. [Google Scholar]
- Wilson, G.W. Co-Disposal of Tailings and Waste Rock. Geotech. News 2001, 19, 44–49. [Google Scholar]
- Fines, P.; Wilson, G.W.; Landriault, D.; Langetine, L.; Hulett, L. Co-Mixing of Tailings, Waste Rock and Slag to Produce Barrier Cover Systems. In Proceedings of the 6th ICARD, Cairns, Australia, 14–17 July 2003; pp. 1019–1022. [Google Scholar]
- Wilson, G.W.; Plewes, H.D.; Williams, D.; Robertson, J. Concepts for Co-Mixing of Tailings and Waste Rock. In Proceedings of the 6th ICARD, Cairns, Australia, 14–17 July 2003; pp. 437–443. [Google Scholar]
- Wickland, B.E. Volume Change and Permeability of Mixtures of Waste Rock and Fine Tailings. Ph.D. Thesis, University of Saskatchewan, Saskatoon, SK, Canada, 2006. [Google Scholar]
- Antonaki, N.; Abdoun, T.; Sasanakul, I. Improvement of the Physical Stability of a Mine Waste Deposit by Co-Mixing Mine Tailings and Waste Rock: A Study of Dynamic Response in Centrifuge Tests. In Proceedings of the 1st International Conference on Natural Hazards & Infrastructure, Chania, Greece, 28–30 June 2016. [Google Scholar]
- Wickland, B.; Longo, S. Mine Waste Case Examples of Stacked Tailings and Co-Disposal. In Proceedings of the Twenty-first International Conference on Tailings and Mine Waste, Banff, AB, Canada, 5–8 November 2017. [Google Scholar]
- Burden, R. The Shear Strength of Filtered Tailings and Waste Rock Blends. In Proceedings of the Tailings and Mine Waste 2018, Keystone, CO, USA, 29 September–1 October 2018. [Google Scholar]
- Habte, K.; Bocking, K. Co-Disposal Practice in Mine Waste Management. In Proceedings of the Twenty-First International Conference on Tailings and Mine Waste, Banff, AB, Canada, 5–8 November 2017. [Google Scholar]
- Andalicio, A.F.; Pereira, E.L.; Oliveira, T.M.D. Flexible Pavement with Mining Waste Proposal—Execution and Analysis of an Experimental Section. REM Int. Eng. J. 2022, 75, 297–305. [Google Scholar] [CrossRef]
- Burden, R.; Wilson, G.W. Commingling of Waste Rock and Tailings to Improve “Dry Stack” Performance: Design and Evaluation of Mixtures. Minerals 2023, 13, 295. [Google Scholar] [CrossRef]
- ASTM International D698; Test Methods for Laboratory Compaction Characteristics of Soil Using Standard Effort (12 400 Ft-Lbf/Ft3 (600 kN-m/M3)). ASTM International: West Conshohocken, PA, USA, 2012.
- Burden, R. Using Co-Disposal Techniques to Achieve Stable “Dry-Stacked” Tailings: Geotechnical Properties of Blended Waste Rock and Tailings in Oil Sands and Metal Mining. Ph.D. Thesis, University of Alberta, Edmonton, AB, Canada, 2021. [Google Scholar]
- Kabwe, L.; Barsi, D.; Wilson, G.W.; Beier, N.; Umme, R. Application of the New HYPROP Device to Measure the Soil Water Characteristic Curve and Other Soil Drying Properties. In Proceedings of the 75th Canadian Geotechnical Conference, Calgary, AB, Canada, 2–5 October 2022. [Google Scholar]
- Herasymuik, G. Hydrogeology of a Sulphide Waste Rock Dump. Ph.D. Thesis, University of Saskatchewan, Saskatoon, SK, Canada, 1996. [Google Scholar]
Figure 2.
Compaction curves for Site A; 100% saturation line for tailings Gs = 2.7.

Figure 3.
Compaction curves for Site B; 100% saturation line for tailings Gs = 2.6.

Figure 4.
Compaction curves for Site C; 100% saturation line for tailings Gs = 2.8.

Figure 5.
Compaction curves for Site D; 100% saturation line for tailings Gs = 2.4.

Figure 6.
Compaction curves for Site E; 100% saturation line for tailings Gs = 2.8.

Figure 7.
Saturated hydraulic conductivity and density curves for Site A.

Figure 8.
Saturated hydraulic conductivity and density curves for Site B.

Figure 9.
Saturated hydraulic conductivity and density curves for Site C.

Figure 10.
Saturated hydraulic conductivity and density curves for Site D.

Figure 11.
Saturated hydraulic conductivity and density curves for Site E.

Figure 12.
Soil–water characteristic curves.


Table 1.
Saturated hydraulic conductivity values.
| Material | Site A | Site B | Site C | Site D | Site E | |||||
|---|---|---|---|---|---|---|---|---|---|---|
| Ksat (m/s) | w | Ksat (m/s) | w | Ksat (m/s) | w | Ksat (m/s) | w | Ksat (m/s) | w | |
| Rock | 8.6 × 10⁻⁶ | 0.10 | 1.9 × 10⁻⁵ | 0.12 | -- | -- | -- | -- | 5.1 × 10⁻⁶ | 0.10 |
| Rock-heavy mix | 3.0 × 10⁻⁸ | 0.10 | 2.0 × 10⁻⁸ | 0.13 | 4.7 × 10⁻⁹ | 0.08 | 7.1 × 10⁻⁹ | 0.10 | 2.6 × 10⁻⁷ | 0.11 |
| Tailings-heavy mix | 5.1 × 10⁻⁸ | 0.13 | 1.9 × 10⁻⁸ | 0.13 | 2.9 × 10⁻⁹ | 0.09 | 6.0 × 10⁻⁹ | 0.11 | 2.1 × 10⁻⁷ | 0.12 |
| Tailings | 7.3 × 10⁻⁸ | 0.25 | 3.0 × 10⁻⁷ | 0.23 | 5.8 × 10⁻⁸ | 0.24 | 2.1 × 10⁻⁸ | 0.20 | 9.5 × 10⁻⁸ | 0.20 |
Table 2.
Air entry values of tailings.
| Site A | Site B | Site C | Site D | Site E | |
|---|---|---|---|---|---|
| AEV (kPa) | 30 | 55 | 60 | 28 | 32 |
Disclaimer/Publisher’s Note: The statements, opinions and data contained in all publications are solely those of the individual author(s) and contributor(s) and not of MDPI and/or the editor(s). MDPI and/or the editor(s) disclaim responsibility for any injury to people or property resulting from any ideas, methods, instructions or products referred to in the content. |
© 2023 by the authors. Licensee MDPI, Basel, Switzerland. This article is an open access article distributed under the terms and conditions of the Creative Commons Attribution (CC BY) license (https://creativecommons.org/licenses/by/4.0/).
Share and Cite
MDPI and ACS Style
Barsi, D.; Wilson, G.W. General Properties of Commingled Materials for Mix Designs. Minerals 2024, 14, 30. https://doi.org/10.3390/min14010030
AMA Style
Barsi D, Wilson GW. General Properties of Commingled Materials for Mix Designs. Minerals. 2024; 14(1):30. https://doi.org/10.3390/min14010030
Chicago/Turabian StyleBarsi, David, and G. Ward Wilson. 2024. "General Properties of Commingled Materials for Mix Designs" Minerals 14, no. 1: 30. https://doi.org/10.3390/min14010030
Note that from the first issue of 2016, this journal uses article numbers instead of page numbers. See further details here.