
Exploring the High-Pressure Phases of Carbon through X-ray Diffraction of Dynamic Compression Experiments on Sandia’s Z Pulsed Power Facility
 ,
,
Abstract
:1. Introduction
2. Materials and Methods
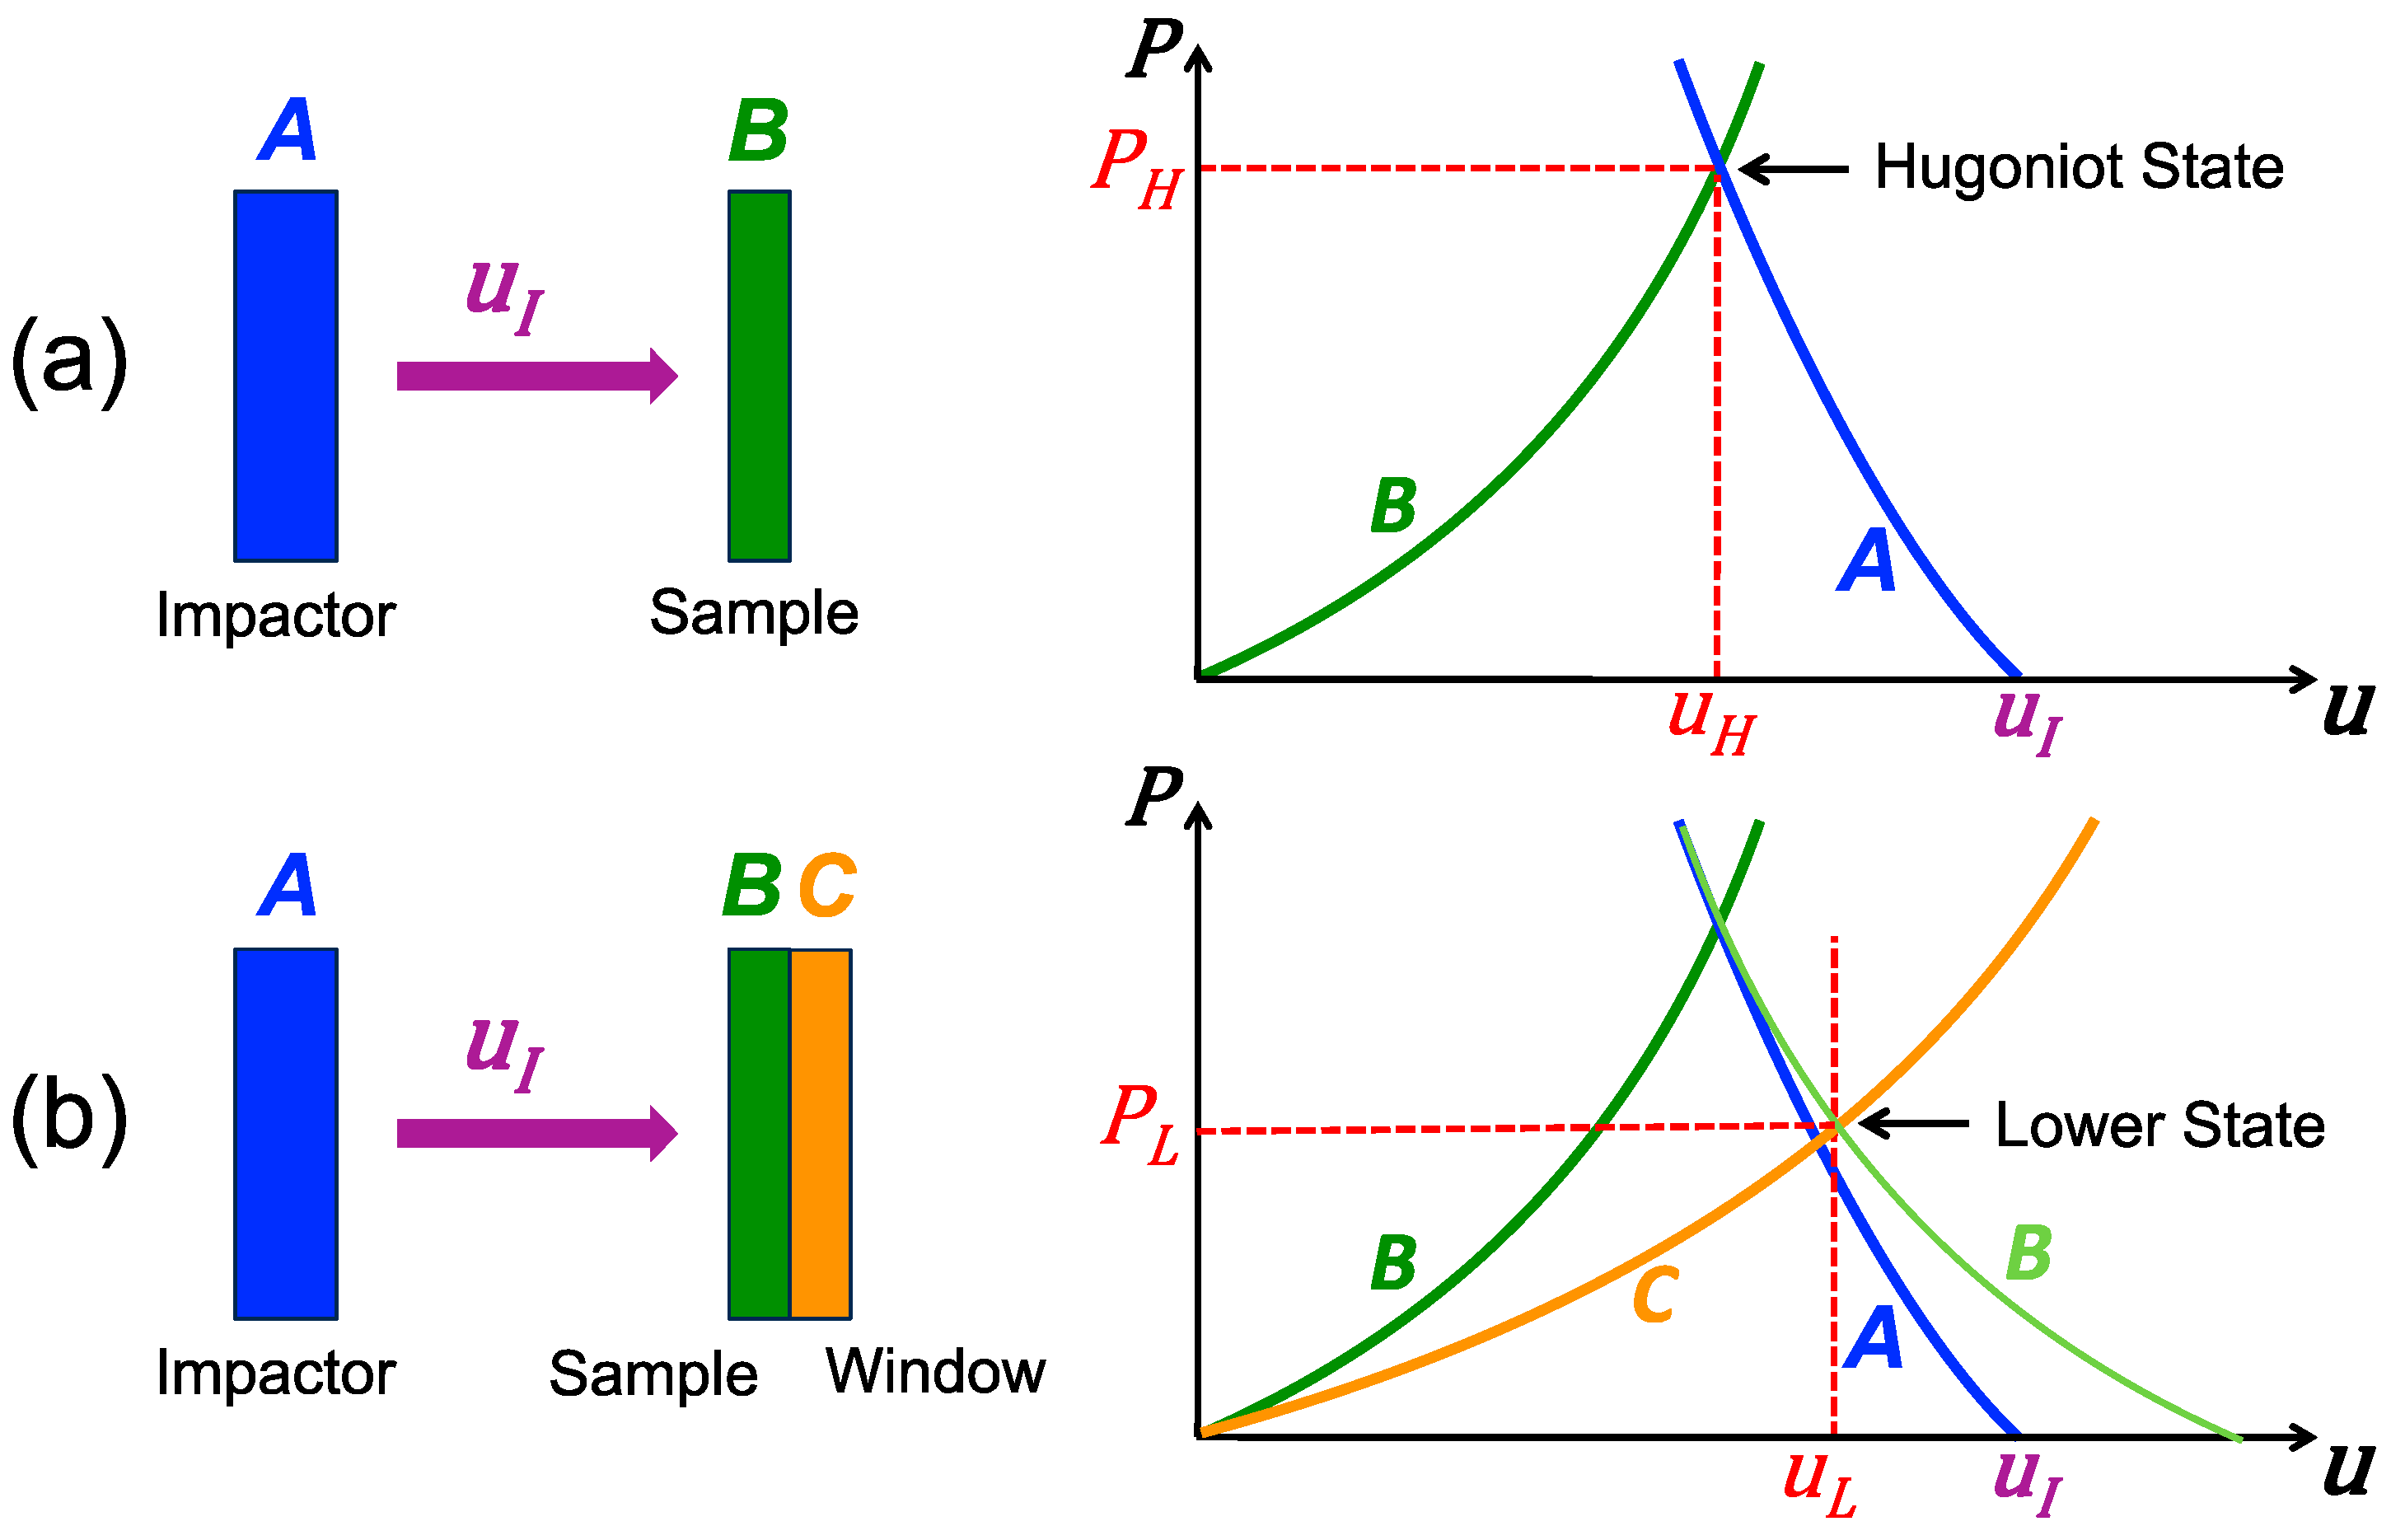
2.1. Dynamic Compression Concepts
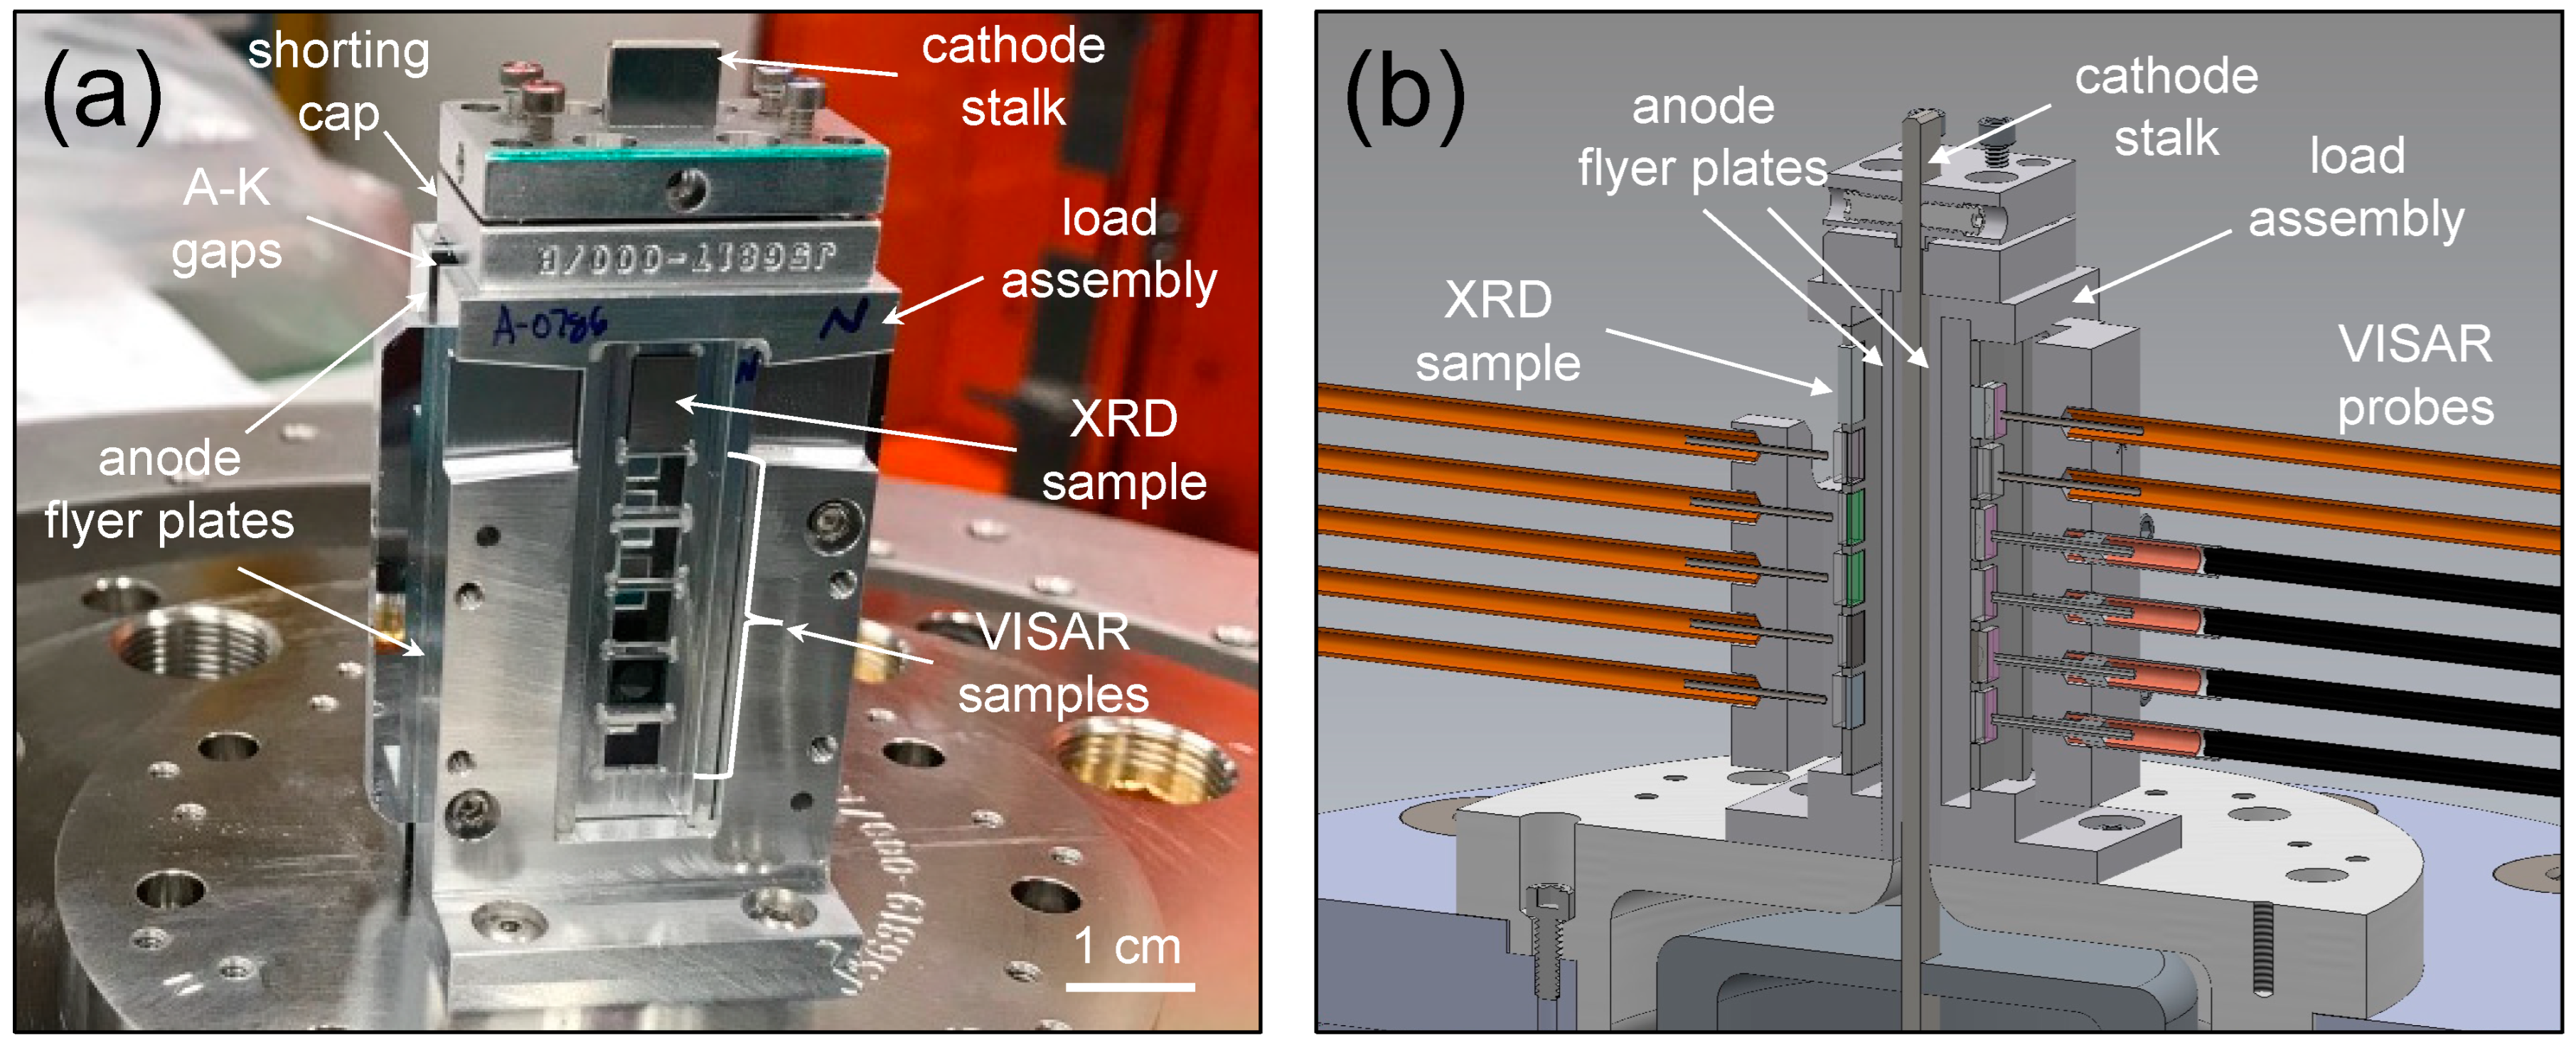
2.2. Pulsed Power Dynamic Compression
2.3. Z-XRD Diagnostics
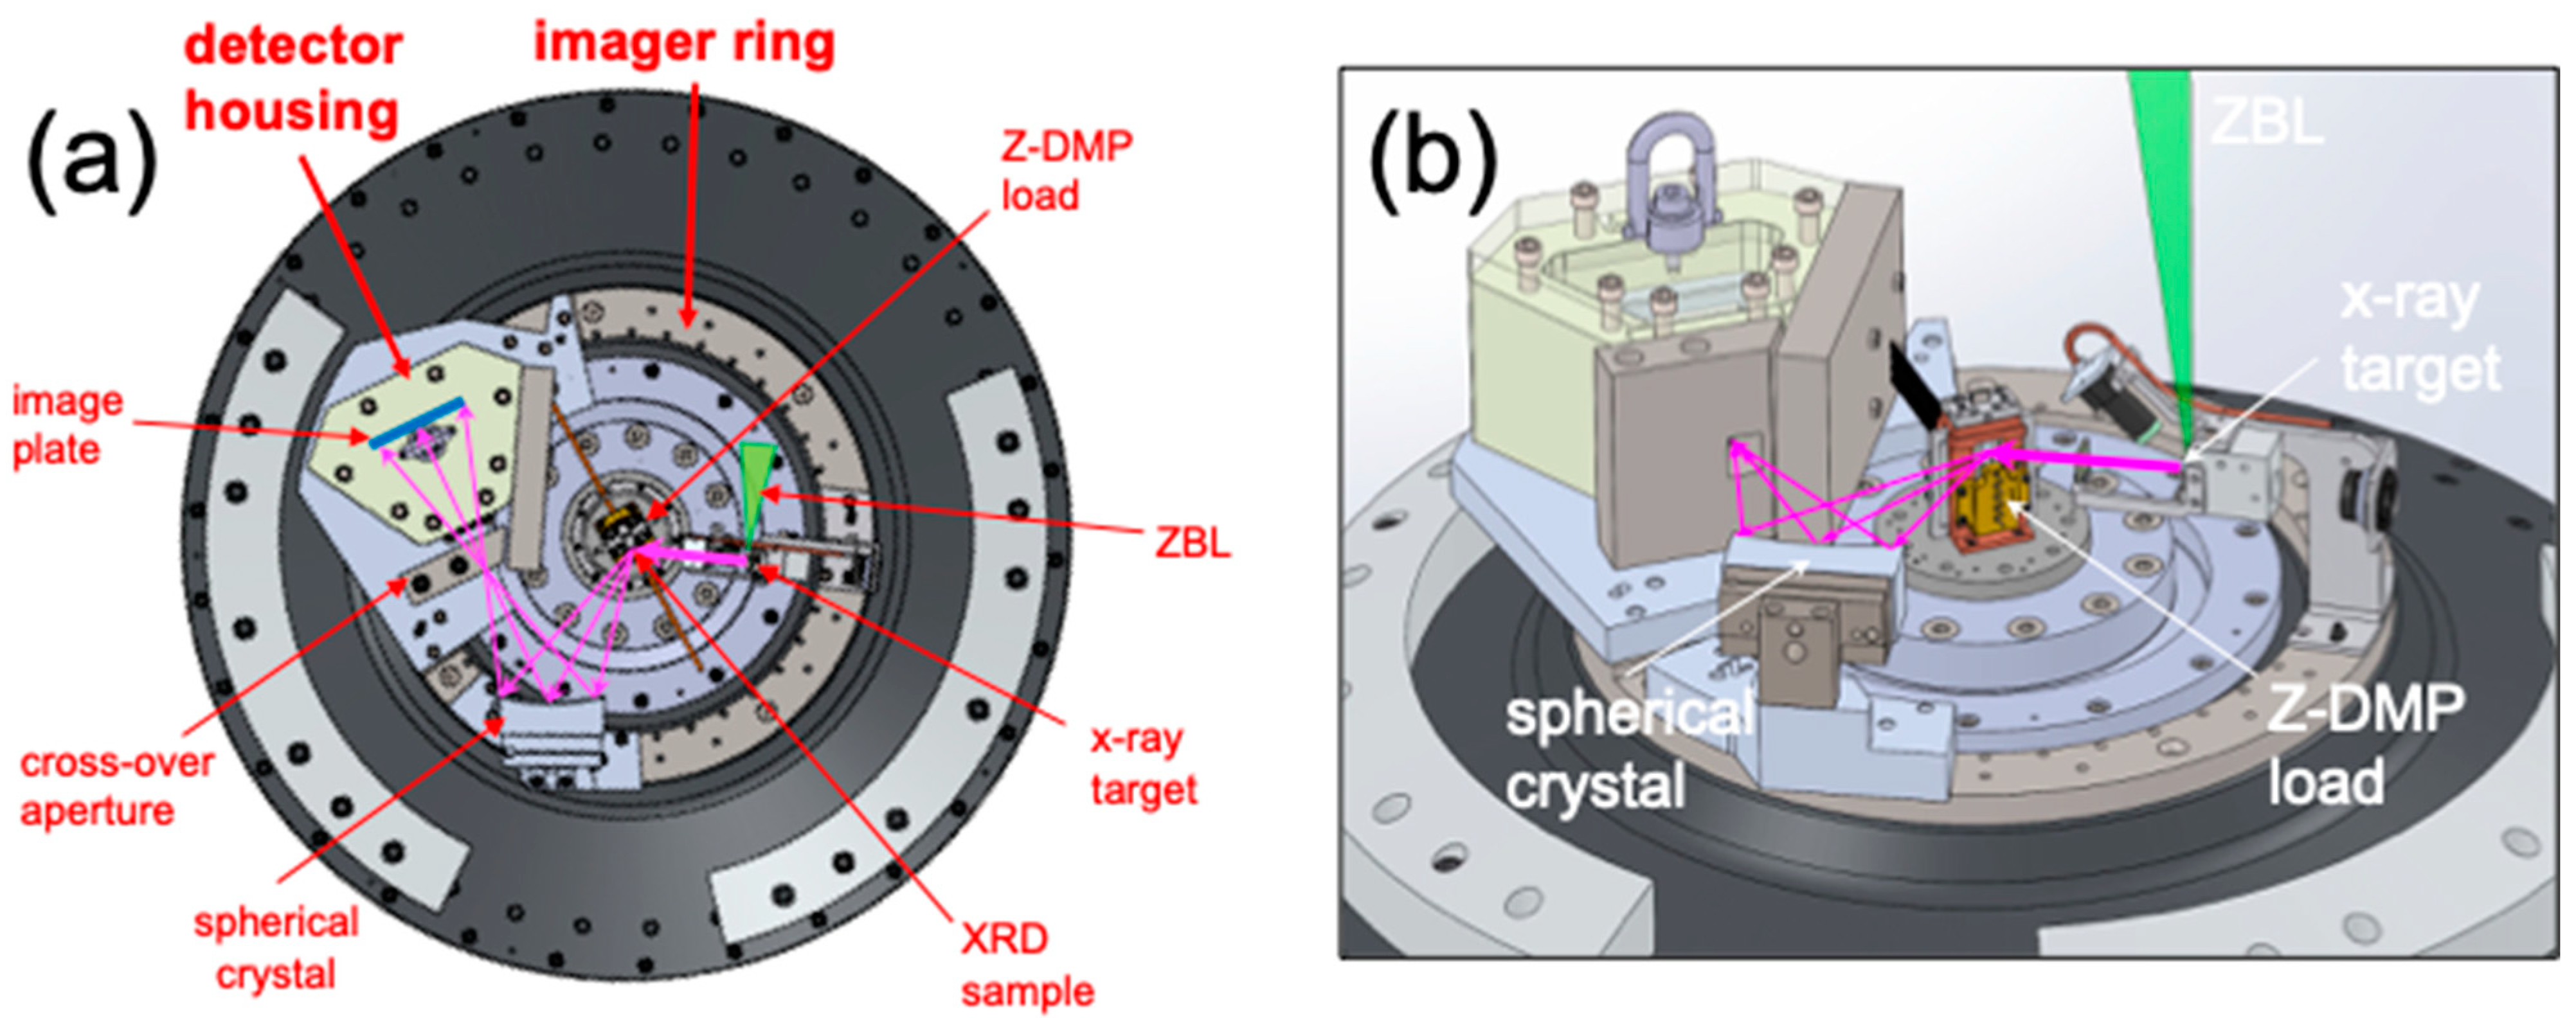
2.3.1. Spherical Crystal Diffraction Imager (SCDI)
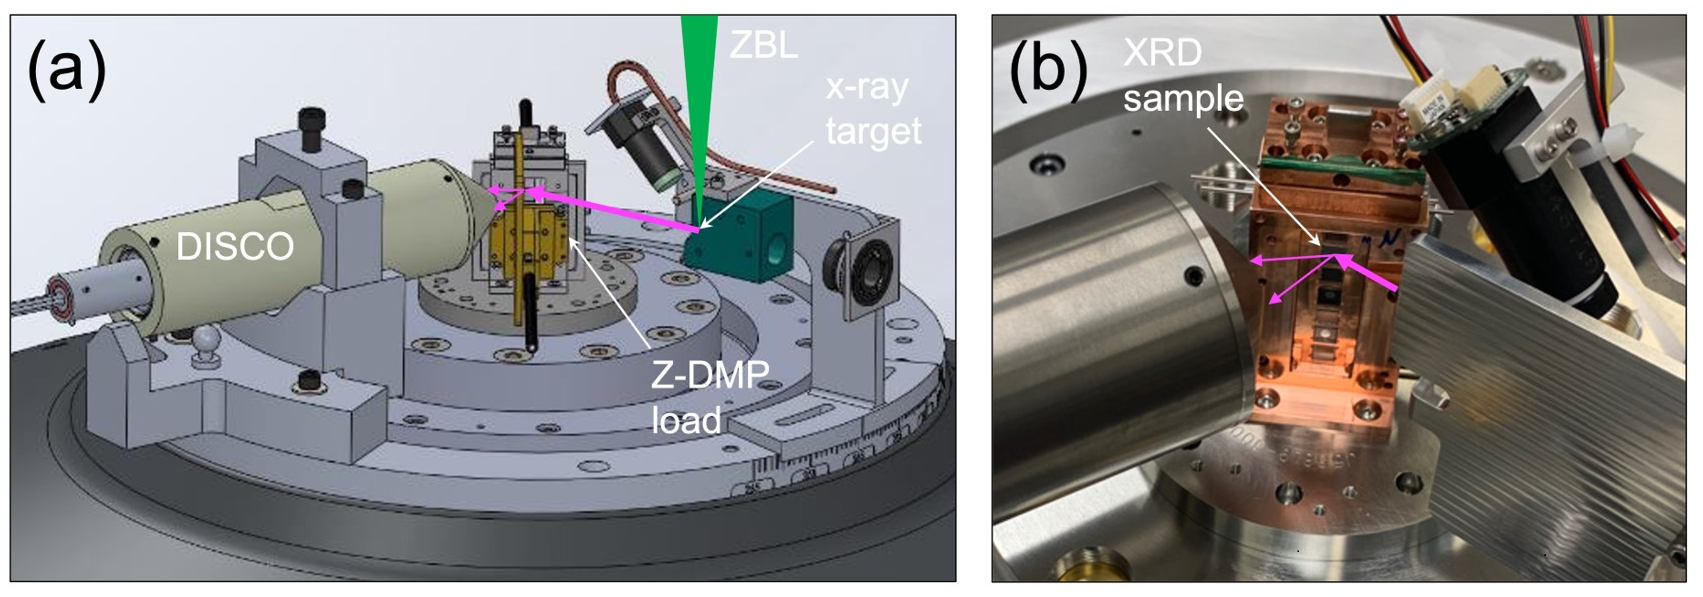
2.3.2. DIffraction SCintillator Optic (DISCO)
- “front-end”, passive X-ray-to-optical light converter (scintillator) and optical light collection optics (lenses);
- “imaging-fiber-cable”, passive imaging fiber bundle to transport the data out of the harsh environment;
- “back-end”, camera coupling optics (lenses) that can be attached to a commercial-off-the-shelf time-gated camera.
3. Results
3.1. Ambient Calibrations
3.2. Z-XRD Experiments
4. Discussion
Author Contributions
Funding
Data Availability Statement
Acknowledgments
Conflicts of Interest
References
- Wang, X.; Scandolo, S.; Car, R. Carbon phase diagram from ab initio molecular dynamics. Phys. Rev. Lett. 2005, 95, 185701. [Google Scholar] [CrossRef]
- Correa, A.A.; Bonev, S.A.; Galli, G. Carbon under extreme conditions: Phase boundaries and electronic properties from first-principles theory. Proc. Nat. Acad. Sci. USA 2006, 103, 1204–1208. [Google Scholar] [CrossRef]
- Benedict, L.X.; Driver, K.P.; Hamel, S.; Militzer, B.; Qi, T.; Correa, A.A.; Saul, A.; Schwegler, E. Multiphase equation of state for carbon addressing high pressures and temperatures. Phys. Rev. B 2014, 89, 224109. [Google Scholar] [CrossRef]
- Remington, B.A.; Drake, R.P.; Ryutov, D.D. Experimental astrophysics with high power lasers and Z pinches. Rev. Mod. Phys. 2006, 78, 755–807. [Google Scholar] [CrossRef]
- Lindl, J.D.; Amendt, P.; Berger, R.L.; Glendinning, S.G.; Glenzer, S.H.; Haan, S.W.; Kauffman, R.L.; Landen, O.L.; Suter, L.J. The physics basis for ignition using indirect-drive targets on the National Ignition Facility. Phys. Plasmas 2003, 11, 339–491. [Google Scholar] [CrossRef]
- Madhusudhan, N.; Lee, K.K.M.; Mousis, O. A possible carbon-rich interior in super-Earth 55 Cancri e. Astrophys. J. 2012, 759, L40. [Google Scholar] [CrossRef]
- Segretain, L.; Chabrier, G.; Hernanz, M.; Garica-Berro, E.; Isern, J.; Mochkovitch, R. Cooling theory of crystallized white dwarfs. Astrophys. J. 1994, 434, 641–651. [Google Scholar] [CrossRef]
- Metcalf, T.S.; Montgomery, M.H.; Kannan, A. Testing white dwarf crystallization theory with asteroseismology of the massive pulsating DA star BPM 37093. Astrophys. J. 2004, 605, L133–L136. [Google Scholar] [CrossRef]
- Ross, M. The ice layer in Uranus and Neptune—Diamonds in the sky? Nature 1981, 292, 435–436. [Google Scholar] [CrossRef]
- Hubbard, W.B. Interiors of gas giants. Science 1981, 214, 145–149. [Google Scholar] [CrossRef]
- Benedetti, L.R.; Nguyen, J.H.; Caldwell, W.A.; Liu, H.; Kruger, M.; Jeanloz, R. Dissociation of CH4 at high pressures and temperatures: Diamond formation in giant planet interiors? Science 1999, 286, 100–102. [Google Scholar] [CrossRef] [PubMed]
- Abu-Shawareb, H.; Acree, R.; Adams, P.; Adams, J.; Addis, B.; Aden, R.; Adrian, P.; Afeyan, B.B.; Aggleton, M.; Aghaian, L.; et al. Lawson criterion for ignition exceeded in an inertial fusion experiment. Phys. Rev. Lett. 2022, 129, 075001. [Google Scholar] [CrossRef] [PubMed]
- Zylstra, A.B.; Kritcher, A.L.; Hurricane, O.A.; Callahan, D.A.; Ralph, J.E.; Casey, D.T.; Pak, A.; Landen, O.L.; Bachmann, B.; Baker, K.L.; et al. Experimental achievement and signatures of ignition at the National Ignition Facility. Phys. Rev. E 2022, 106, 025202. [Google Scholar] [CrossRef] [PubMed]
- Kritcher, A.L.; Zylstra, A.B.; Callahan, D.A.; Hurricane, O.A.; Weber, C.R.; Clark, D.S.; Young, C.V.; Ralph, J.E.; Casey, D.T.; Pak, A.; et al. Design of an inertial fusion experiment exceeding the Lawson criterion for ignition. Phys. Rev. E 2022, 106, 025201. [Google Scholar] [CrossRef]
- Bernal, J.D. The structure of graphite. Proc. R. Soc. A 1924, 106, 749–773. [Google Scholar] [CrossRef]
- Smith, W.H.; Leeds, D.H. Pyrolytic graphite. In Modern Materials; Gonser, B.W., Ed.; Academic Press, Inc.: New York, NY, USA, 1970; pp. 139–221. [Google Scholar] [CrossRef]
- Guentert, O.J. X-ray study of pyrolytic graphites. J. Chem. Phys. 1962, 19, 884–891. [Google Scholar] [CrossRef]
- Moore, A.W. Highly oriented pyrolytic graphite. In Chemistry and Physics of Carbon; Walker, P.L., Jr., Thrower, P.A., Eds.; Dekker: New York, NY, USA, 1973; Volume 11, pp. 69–187. [Google Scholar]
- Fahy, S.; Louie, S.G. High-pressure structural and electronic properties of carbon. Phys. Rev. B 1987, 36, 3373–3385. [Google Scholar] [CrossRef]
- Stachel, T.; Harris, J.W. Formation of diamond in the Earth’s mantle. J. Phys. Condens. Matter 2009, 21, 364206. [Google Scholar] [CrossRef]
- Field, J.E. The mechanical and strength properties of diamond. Rep. Prog. Phys. 2012, 75, 126505. [Google Scholar] [CrossRef]
- Bundy, F.; Hall, T.; Strong, H.M.; Wentorf, R.H. Man-made diamonds. Nature 1955, 176, 51–55. [Google Scholar] [CrossRef]
- Hazen, R.M. The Diamond Makers; Cambridge University Press: Cambridge, UK, 1999. [Google Scholar]
- Hanneman, R.E.; Strong, H.M.; Bundy, F.F. Hexagonal diamonds in meteorites: Implications. Science 1967, 155, 995–997. [Google Scholar] [CrossRef]
- Frondel, C.; Marvin, U.B. Lonsdaleite, a hexagonal polymorph of diamond. Nature 1967, 214, 587–589. [Google Scholar] [CrossRef]
- Bundy, F.P.; Kasper, J.S. Hexagonal diamond—A new form of carbon. J. Chem. Phys. 1967, 46, 3437–3446. [Google Scholar] [CrossRef]
- Nemeth, P.; Garvie, L.A.J.; Aoki, T.; Dubrovinskaia, N.; Dubrovinsky, L.; Buseck, P.R. Lonsdaleite is faulted and twinned cubic diamond and does not exist as a discrete material. Nat. Commun. 2014, 5, 5447. [Google Scholar] [CrossRef]
- Salzmann, C.G.; Murray, B.J.; Shephard, J.J. Extent of stacking disorder in diamond. Diam. Relat. Mater. 2015, 59, 69–72. [Google Scholar] [CrossRef]
- Bundy, F.P. Direct conversion of graphite to diamond in static pressure apparatus. J. Chem. Phys. 1963, 38, 631–643. [Google Scholar] [CrossRef]
- Zhao, Y.X.; Spain, I.L. X-ray diffraction data for graphite to 20 GPa. Phys. Rev. B 1989, 40, 993–997. [Google Scholar] [CrossRef]
- Yagi, T.; Utsumi, W.; Yamakata, M.A.; Kikegawa, T.; Shimomura, O. High-pressure in situ X-ray-diffraction study of the phase transformation from graphite to hexagonal diamond at room temperature. Phys. Rev. B 1992, 46, 6031–6039. [Google Scholar] [CrossRef]
- DeCarli, P.S.; Jamieson, J.C. Formation of diamond by explosive shock. Science 1961, 133, 1821–1822. [Google Scholar] [CrossRef]
- Erskine, D.J.; Nellis, W.J. Shock-induced martensitic phase transformation of oriented graphite to diamond. Nature 1991, 349, 317–319. [Google Scholar] [CrossRef]
- Erskine, D.J.; Nellis, W.J. Shock-induced martensitic transformation of highly oriented graphite to diamond. J. Appl. Phys. 1992, 71, 4882–4886. [Google Scholar] [CrossRef]
- Rygg, J.R.; Eggert, J.H.; Lazicki, A.E.; Coppari, F.; Hawreliak, J.A.; Hicks, D.G.; Smith, R.F.; Sorce, C.M.; Uphaus, T.M.; Yaakobi, B.; et al. Powder diffraction from solids in the terapascal regime. Rev. Sci. Instrum. 2012, 83, 113904. [Google Scholar] [CrossRef] [PubMed]
- Rygg, J.R.; Smith, R.F.; Lazicki, A.E.; Braun, D.G.; Fratanduono, D.E.; Kraus, R.G.; McNaney, J.M.; Swift, D.C.; Wehrenberg, C.E.; Coppari, F.; et al. X-ray diffraction at the National Ignition Facility. Rev. Sci. Instrum. 2020, 91, 043902. [Google Scholar] [CrossRef]
- Gleason, A.E.; Bolme, C.A.; Galtier, E.; Lee, H.J.; Granados, E.; Dolan, D.H.; Seagle, C.T.; Ao, T.; Ali, S.; Lazicki, A.; et al. Compression freezing kinetics of water to ice VII. Phys. Rev. Lett. 2017, 119, 025701. [Google Scholar] [CrossRef]
- Turneaure, S.J.; Sinclair, N.; Gupta, Y.M. Real-time examination of atomistic mechanisms during shock-induced structural transformation in silicon. Phys. Rev. Lett. 2016, 117, 045502. [Google Scholar] [CrossRef]
- Turneaure, S.J.; Sharma, S.M.; Volz, T.J.; Winey, J.M.; Gupta, Y.M. Transformation of shock-compressed graphite to hexagonal diamond in nanoseconds. Sci. Adv. 2017, 3, eaao3561. [Google Scholar] [CrossRef] [PubMed]
- Volz, T.J.; Gupta, Y.M. Graphite to diamond transformation under shock compression: Role of orientational order. J. Appl. Phys. 2019, 125, 245902. [Google Scholar] [CrossRef]
- Volz, T.J.; Turneaure, S.J.; Sharma, S.M.; Gupta, Y.M. Role of graphite crystal structure on the shock-induced formation of cubic and hexagonal diamond. Phys. Rev. B 2020, 101, 224109. [Google Scholar] [CrossRef]
- Bradley, D.K.; Eggert, J.H.; Hicks, D.G.; Celliers, P.M.; Moon, S.J.; Cauble, R.C.; Collins, G.W. Shock compressing diamond to a conducting fluid. Phys. Rev. Lett. 2004, 93, 195506. [Google Scholar] [CrossRef]
- Nagao, H.; Nakamura, K.G.; Kondo, K.; Ozaki, N.; Takamatsu, K.; Ono, T.; Shiota, T.; Ichinose, D.; Tanaka, K.A.; Wakabayashi, K.; et al. Hugoniot measurements of diamond under laser shock compression up to 2 TPa. Phys. Plasmas 2006, 12, 052705. [Google Scholar] [CrossRef]
- Brygoo, S.; Henry, E.; Loubeyre, P.; Eggert, J.; Koenig, M.; Loupias, B.; Benuzzi-Mounaiz, A.; Rabec le Gloachec, M. Laser-shock compression of diamond and evidence of a negative-slope melting curve. Nat. Mater. 2007, 6, 274–277. [Google Scholar] [CrossRef]
- Kraus, D.; Ravasio, A.; Gauthier, M.; Gericke, D.O.; Vorberger, J.; Frydrych, S.; Helfrich, J.; Fletcher, L.B.; Schaumann, G.; Nagler, B.; et al. Nanosecond formation of diamond and lonsdaleite by shock compression of graphite. Nat. Commun. 2016, 7, 10970. [Google Scholar] [CrossRef]
- Knudson, M.D.; Desjarlais, M.P.; Dolan, D.H. Shock-wave exploration the high-pressure phases of carbon. Sci. Rep. 2008, 322, 1822–1825. [Google Scholar] [CrossRef]
- Murri, M.; Smith, R.L.; McColl, K.; Hart, M.; Alvaro, M.; Jones, A.P.; Németh, P.; Salzmann, C.G.; Corà, F.; Domeneghetti, M.C.; et al. Quantifying hexagonal stacking in diamond. Sci. Rep. 2019, 9, 10334. [Google Scholar] [CrossRef]
- Scandolo, S.; Bernasconi, M.; Chiarotti, G.L.; Focher, P.; Tosatti, E. Pressure-induced transformation path of graphite to diamond. Phys. Rev. Lett. 1995, 74, 4015–4018. [Google Scholar] [CrossRef]
- Mundy, C.J.; Curioni, A.; Goldman, N.; Kuo, I.-F.W.; Reed, E.J.; Fried, L.E.; Ianuzzi, M. Ultrafast transformation of graphite to diamond: An ab initio study of graphite under shock compression. J. Chem. Phys. 2008, 128, 184701. [Google Scholar] [CrossRef] [PubMed]
- Pineau, N. Molecular simulations of shock compressed graphite. J. Phys. Chem. C 2013, 117, 12778. [Google Scholar] [CrossRef]
- Kroonblawd, M.P.; Goldman, N. Mechanochemcial formation of heterogenous diamond structures during rapid uniaxial compression in graphite. Phys. Rev. B 2018, 97, 184106. [Google Scholar] [CrossRef]
- McQueen, R.G.; Marsh, S.P.; Taylor, J.W.; Fritz, J.N.; Carter, W.J. The equation of state of solids from shock wave studies. In High-Velocity Impact Phenomena; Kinslow, R., Ed.; Academic: New York, NY, USA, 1970; pp. 293–417. [Google Scholar] [CrossRef]
- Duvall, G.E.; Graham, R.A. Phase transitions under shock-wave loading. Rev. Mod. Phys. 1977, 49, 523–579. [Google Scholar] [CrossRef]
- Asay, J.R.; Mohsen, S. High Pressure Shock Compression of Solids; Springer: New York, NY, USA, 1993. [Google Scholar] [CrossRef]
- Forbes, J.W. The history of the APS topical group on shock compression of condensed matter. In Shock Compression of Condensed Matter—2001; Furnish, M.D., Thadhani, N.N., Horie, Y., Eds.; American Institute of Physics: Melville, NY, USA, 2002; pp. 11–19. [Google Scholar] [CrossRef]
- Forbes, J.W. Shock Wave Compression of Condensed Matter: A Primer; Springer: Berlin/Heidelberg, Germany, 2012. [Google Scholar] [CrossRef]
- Band, W.; Duvall, G.E. Physical nature of shock propagation. Am. J. Phys. 1961, 29, 780–785. [Google Scholar] [CrossRef]
- Mitchell, A.C.; Nellis, W.J. Shock compression of aluminum, copper and tantalum. J. Appl. Phys. 1981, 52, 3363–3374. [Google Scholar] [CrossRef]
- Knudson, M.D.; Asay, J.R.; Deeney, C. Adiabatic release measurements in aluminum form 240- to 500-GPa states on the principal Hugoniot. J. Appl. Phys. 2005, 97, 073514. [Google Scholar] [CrossRef]
- Celliers, P.M.; Collins, G.W.; Hicks, D.G.; Eggert, J.H. Systematic uncertainties in shock-wave impedance-match analysis and the high-pressure equation of state of Al. J. Appl. Phys. 2005, 98, 113529. [Google Scholar] [CrossRef]
- Matzen, M.K.; Sweeney, M.A.; Adams, R.G.; Asay, J.R.; Bailey, J.E.; Bennett, G.R.; Bliss, D.E.; Bloomquist, D.D.; Brunner, T.A.; Campbell, R.B.; et al. Pulsed-power-driven high energy density physics and inertial confinement fusion research. Phys. Plasmas 2005, 12, 055503. [Google Scholar] [CrossRef]
- Sinars, D.B.; Sweeney, M.A.; Alexander, C.S.; Ampleford, D.J.; Ao, T.; Apruzese, J.P.; Aragon, C.; Armstrong, D.J.; Austin, K.N.; Awe, T.J.; et al. Review of pulsed power-driven high energy density physics research on Z at Sandia. Phys. Plasmas 2020, 27, 070501. [Google Scholar] [CrossRef]
- Barker, L.M.; Hollenbach, R.E. Laser interferometer for measuring high velocities of any reflecting surface. J. Appl. Phys. 1972, 43, 4669–4675. [Google Scholar] [CrossRef]
- Sinars, D.B.; Bennett, G.R.; Wenger, D.F.; Cuneo, M.E.; Hanson, D.L.; Porter, J.L.; Adams, R.G.; Rambo, P.K.; Rovang, D.C.; Smith, I.C. Monochromatic X-ray imaging experiments on the Sandia National Laboratories Z facility (invited). Rev. Sci. Instrum. 2004, 75, 3672–3677. [Google Scholar] [CrossRef]
- Bennett, G.R.; Sinars, D.B.; Wenger, D.F.; Cuneo, M.E.; Adams, R.G.; Barnard, W.J.; Beutler, D.E.; Burr, R.A.; Campbell, D.V.; Claus, L.D.; et al. High-brightness, high-spatial-resolution, 6.151 keV X-ray imaging of inertial confinement fusion capsule implosion and complex hydrodynamics experiments on Sandia’s Z accelerator (invited). Rev. Sci. Instrum. 2006, 77, 10E322. [Google Scholar] [CrossRef]
- Schollmeier, M.S.; Geissel, M.; Shores, J.E.; Smith, I.C.; Porter, J.L. Performance of bent-crystal X-ray microscopes for high energy density physics research. Appl. Opt. 2015, 54, 5147–5161. [Google Scholar] [CrossRef]
- Ao, T.; Schollmeier, M.; Kalita, P.; Gard, P.D.; Smith, I.C.; Shores, J.E.; Speas, C.S.; Seagle, C.T. A spherical crystal diffraction imager for Sandia’s Z Pulsed Power Facility. Rev. Sci. Instrum. 2020, 91, 043106. [Google Scholar] [CrossRef]
- Rambo, P.; Schwarz, J.; Schollmeier, M.; Geissel, M.; Smith, I.; Kimmel, M.; Speas, C.; Shores, J.; Armstrong, D.; Bellum, J.; et al. Sandia’s Z-Backlighter Laser Facility. Proc. SPIE 2016, 10014, 100140Z. [Google Scholar] [CrossRef]
- Schollmeier, M.S.; Loisel, G.P. Systematic search for spherical crystal X-ray microscopes matching 1–25 keV spectral line sources. Rev. Sci. Instrum. 2015, 87, 123511. [Google Scholar] [CrossRef] [PubMed]
- Ao, T.; Harding, E.C.; Bailey, J.E.; Loisel, G.; Patel, S.; Sinars, D.B.; Mix, L.P.; Wenger, D.F. Relative X-ray collection efficiency, spatial resolution, and spectral resolution of spherically-bent quartz, mica, germanium, and pyrolytic graphite crystals. J. Quant. Spectrosc. Radiat. Transf. 2014, 144, 92–107. [Google Scholar] [CrossRef]
- Henke, B.L.; Gullikson, E.M.; Davis, J.C. X-Ray Interactions: Photoabsorption, Scattering, Transmission, and Reflection at E = 50–30,000 eV, Z = 1–92. At. Data Nucl. Data Tables 1993, 54, 181–342. [Google Scholar] [CrossRef]
- Amemiya, T.; Miyahara, J. Imaging plate illuminates many fields. Nature 1998, 336, 89. [Google Scholar] [CrossRef] [PubMed]
- Gales, S.G.; Bentley, C.D. Image plates as X-ray detectors in plasma physics experiments. Rev. Sci. Instrum. 2004, 75, 4001–4003. [Google Scholar] [CrossRef]
- Madden, T.J.; McGuigan, W.; Molitsky, M.; Naday, I.; McArthur, A.; Westbrook, E.M. Lens-coupled CCD detector for X-ray crystallography. IEEE Trans Nucl. Sci. 2006, 2, 729–734. [Google Scholar] [CrossRef]
- Naday, I.; Ross, S.; Westbrook, E.M.; Zental, G. Charge-coupled device/fiber optic taper array X-ray detector for protein crystallography. Opt. Eng. 1998, 37, 1235–1244. [Google Scholar] [CrossRef]
- Gruner, S.M.; Tate, M.W.; Eikenberry, E.F. Charge-coupled device area X-ray detector. Rev. Sci. Instrum. 2002, 73, 2815–2842. [Google Scholar] [CrossRef]
- Kerley, G.I. Theoretical equation of state for aluminum. Int. J. Impact Eng. 1987, 5, 441–449. [Google Scholar] [CrossRef]
- Rietveld, H.M. A profile refinement method for nuclear and magnetic structures. J. Appl. Cryst. 1969, 2, 65–71. [Google Scholar] [CrossRef]
- Gleason, A.E.; Bolme, C.A.; Lee, H.J.; Nagler, B.; Galtier, E.; Milathianaki, D.; Hawreliak, J.; Kraus, R.G.; Eggert, J.H.; Fratanduono, D.E.; et al. Ultrafast visualization of crystallization and grain growth in shock-compressed SiO2. Nat. Commun. 2015, 6, 8191. [Google Scholar] [CrossRef] [PubMed]
- Briggs, R.; Gorman, M.G.; Coleman, A.L.; McWilliams, R.S.; McBride, E.E.; McGonegle, D.; Wark, J.S.; Peacock, L.; Rothman, S.; Macleod, S.G.; et al. Ultrafast X-ray diffraction studies of the phase transitions and equation of state of scandium shock compressed to 82 GPa. Phys. Rev. Lett. 2017, 118, 025501. [Google Scholar] [CrossRef] [PubMed]
- Kalita, P.; Specht, P.; Root, S.; Sinclair, N.; Schuman, A.; White, M.; Cornelius, A.L.; Smith, J.; Sinogeikin, S. Direct observations of a dynamically driven phase transition with in situ X-ray diffraction in a simple ionic crystal. Phys. Rev. Lett. 2017, 119, 255701. [Google Scholar] [CrossRef] [PubMed]
- Eggert, J.H.; Hicks, D.G.; Celliers, P.M.; Bradley, D.K.; McWilliams, R.S.; Jeanloz, R.; Miller, J.E.; Boehly, T.R.; Collins, G.W. Melting temperature of diamond at ultrahigh pressure. Nat. Phys. 2009, 6, 40–43. [Google Scholar] [CrossRef]
- Hartsfield, T.M.; Dolan, D.H. Establishing temperature from radiance of dynamically compresses metals. J. Appl. Phys. 2022, 131, 185901. [Google Scholar] [CrossRef]


| Z Shot Number | Al Flyer Impact Velocity (km/s) | Impact Shock Pressure (GPa) | X-ray Window | Sample/X-ray Window Shock Pressure (GPa) | X-ray Diagnostic |
|---|---|---|---|---|---|
| Z3524 | 9.5 | 150 | carbon | 150 | SCDI |
| Z3717 | 10.6 | 180 | beryllium | 150 | DISCO |
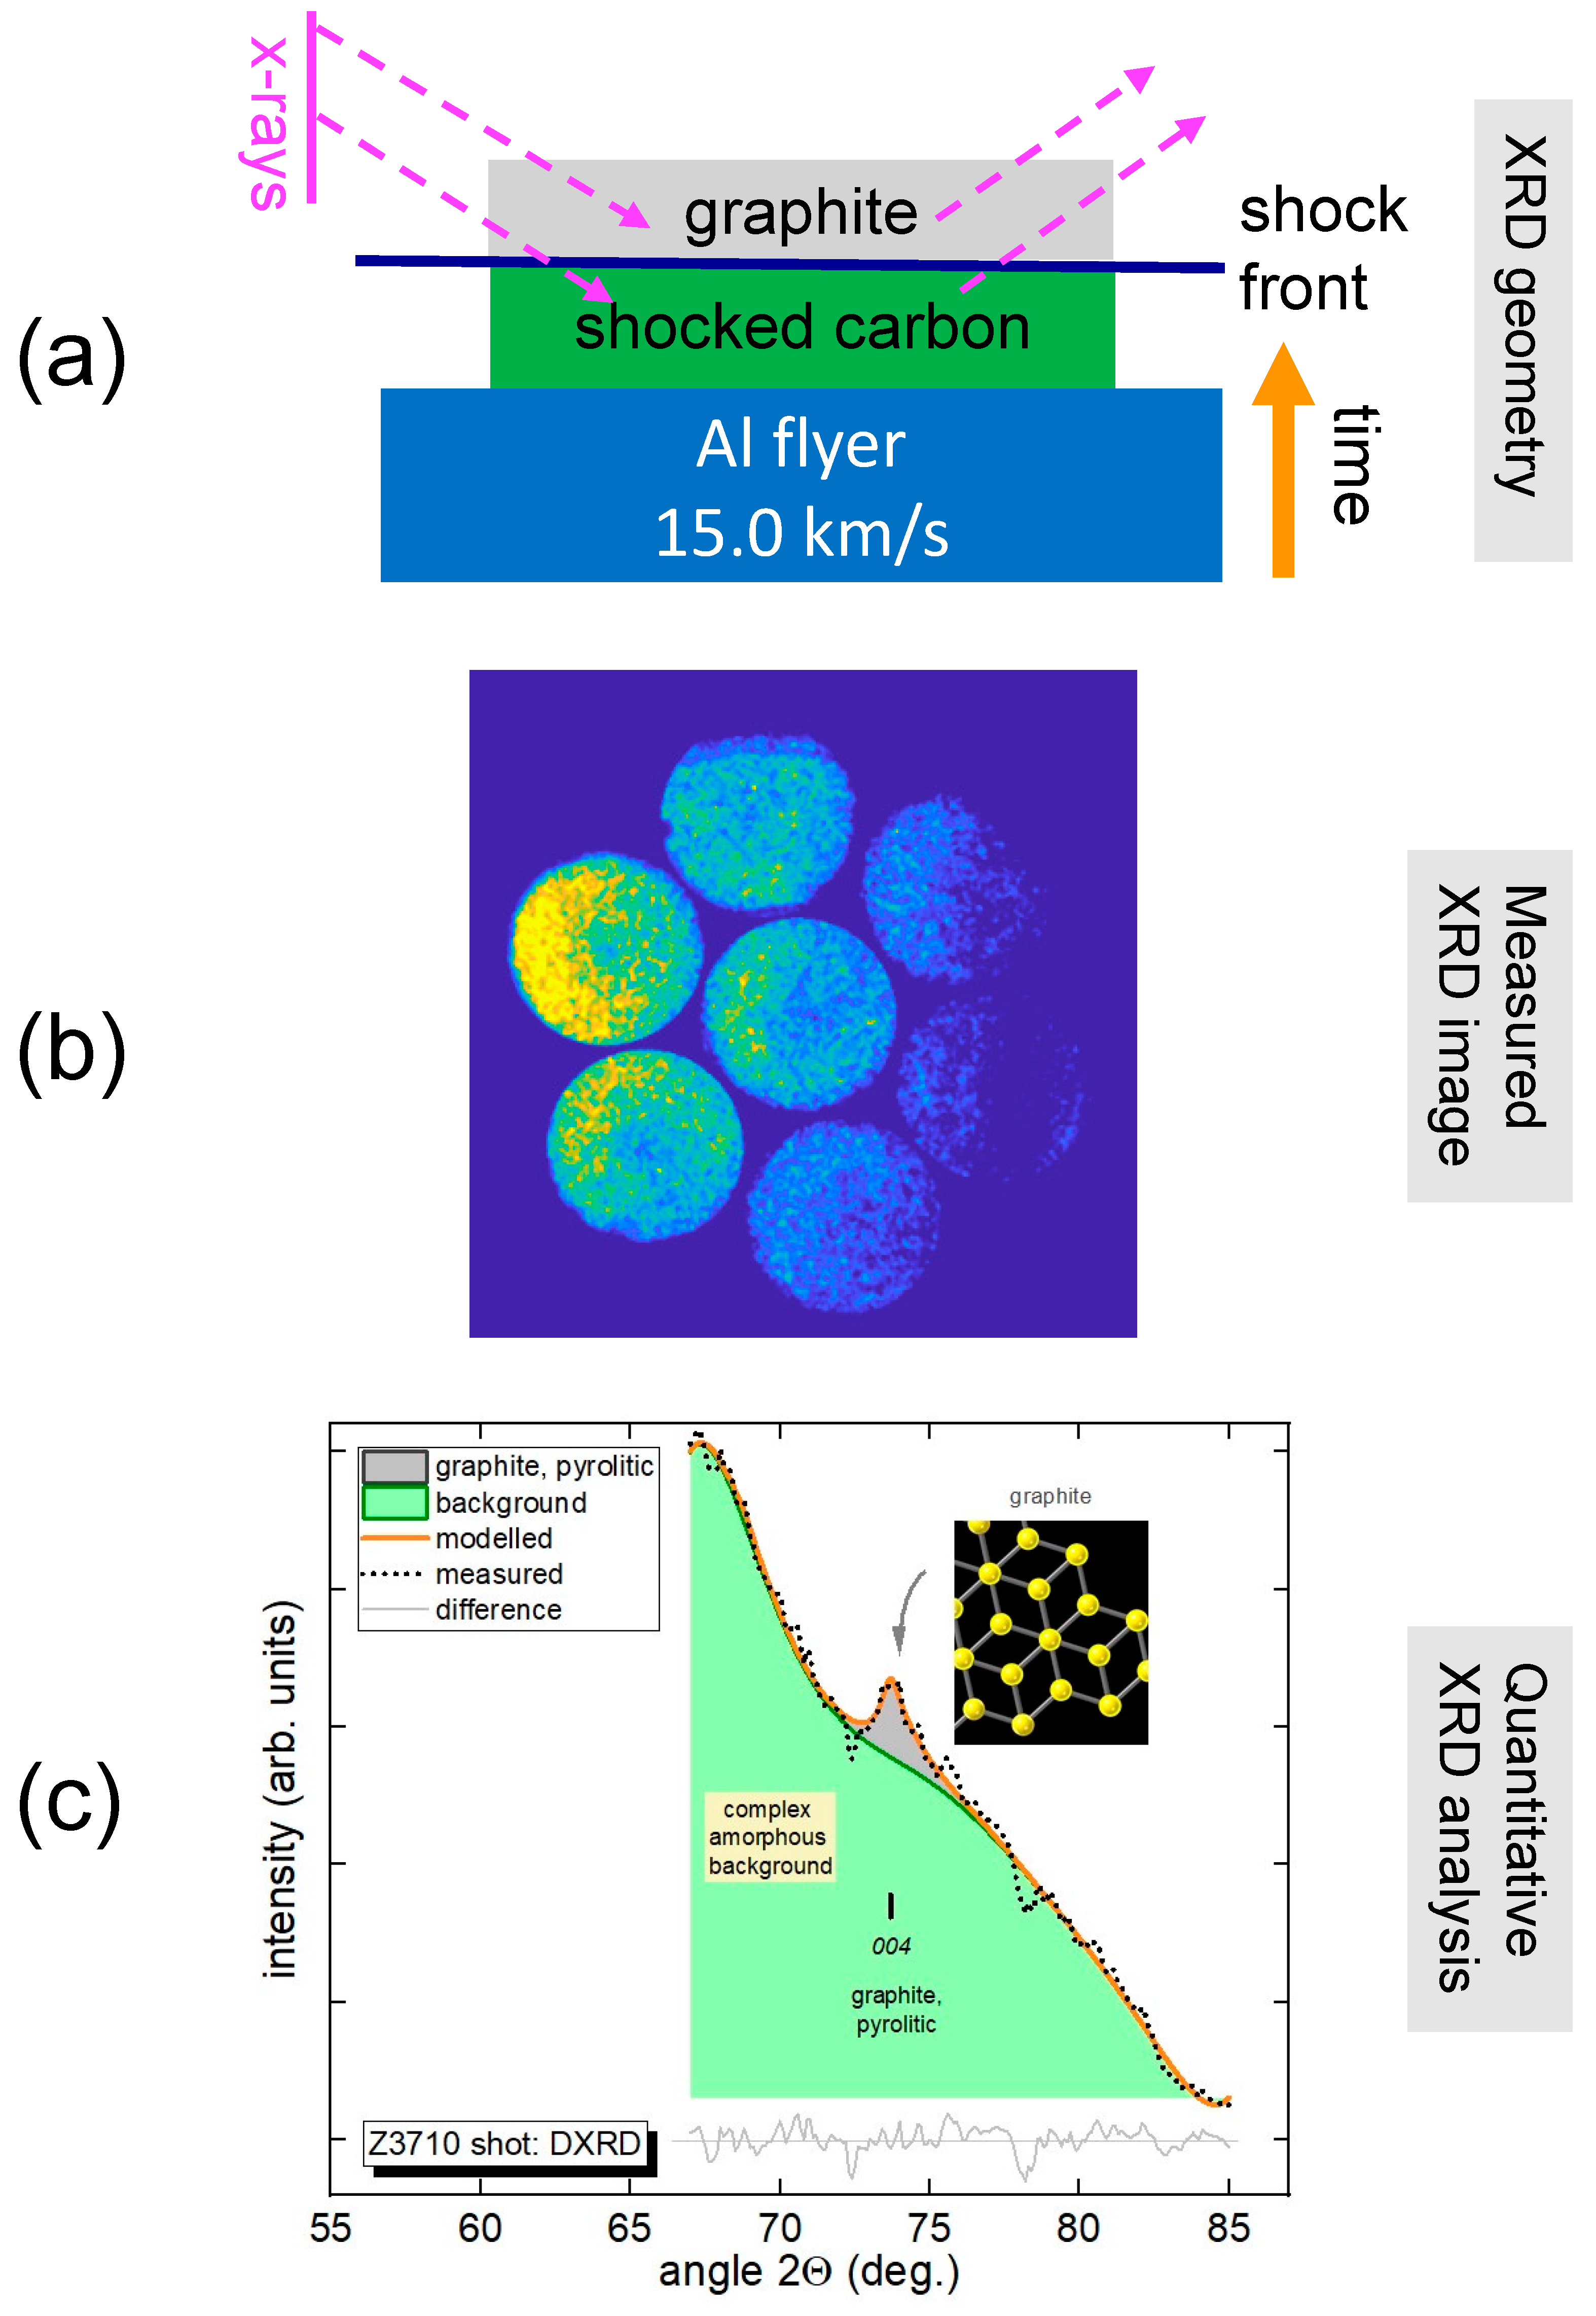
| Z3710 | 15.0 | 320 | carbon | 320 | DISCO |
| Material | C (km/s) | S |
|---|---|---|
| Aluminum | 5.288 | 1.376 |
| Carbon graphite | 4.260 | 2.170 |
| Carbon diamond | 18.33 | 2.070 |
| Beryllium | 7.998 | 1.124 |
Disclaimer/Publisher’s Note: The statements, opinions and data contained in all publications are solely those of the individual author(s) and contributor(s) and not of MDPI and/or the editor(s). MDPI and/or the editor(s) disclaim responsibility for any injury to people or property resulting from any ideas, methods, instructions or products referred to in the content. |
© 2023 by the authors. Licensee MDPI, Basel, Switzerland. This article is an open access article distributed under the terms and conditions of the Creative Commons Attribution (CC BY) license (https://creativecommons.org/licenses/by/4.0/).
Share and Cite
Ao, T.; Kalita, P.; Blada, C.; Brown, N.P.; Fulford, K.; Gard, P.; Geissel, M.; Hanshaw, H.; Montoya, M.; Payne, S.; et al. Exploring the High-Pressure Phases of Carbon through X-ray Diffraction of Dynamic Compression Experiments on Sandia’s Z Pulsed Power Facility. Minerals 2023, 13, 1203. https://doi.org/10.3390/min13091203
Ao T, Kalita P, Blada C, Brown NP, Fulford K, Gard P, Geissel M, Hanshaw H, Montoya M, Payne S, et al. Exploring the High-Pressure Phases of Carbon through X-ray Diffraction of Dynamic Compression Experiments on Sandia’s Z Pulsed Power Facility. Minerals. 2023; 13(9):1203. https://doi.org/10.3390/min13091203
Chicago/Turabian StyleAo, Tommy, Pat Kalita, Caroline Blada, Nathan P. Brown, Karin Fulford, Paul Gard, Matthias Geissel, Heath Hanshaw, Michael Montoya, Sheri Payne, and et al. 2023. "Exploring the High-Pressure Phases of Carbon through X-ray Diffraction of Dynamic Compression Experiments on Sandia’s Z Pulsed Power Facility" Minerals 13, no. 9: 1203. https://doi.org/10.3390/min13091203