Article

Mineralogical Characteristics of Hematitic Iron Ore: A Geometallurgical Study on Ore from Eastern India

1
Department of Applied Geology, Indian Institute of Technology (Indian School of Mines), Dhanbad 826004, India
2
Mineral Processing Division, CSIR-National Metallurgical Laboratory (Council of Scientific and Industrial Research), Jamshedpur 831007, India
3
Research and Development Division, Tata Steel Ltd., Jamshedpur 831007, India
4
Natural Resources Research Institute, University of Minnesota Duluth, Coleraine, MN 55722, USA
5
Department of Mines & Geology, District Geological Office Saraikela-Kharsawan, Saraikela 833219, India
*
Authors to whom correspondence should be addressed.
Minerals 2023, 13(9), 1194; https://doi.org/10.3390/min13091194
Submission received: 23 July 2023 / Revised: 30 August 2023 / Accepted: 8 September 2023 / Published: 12 September 2023
(This article belongs to the Section Mineral Processing and Extractive Metallurgy)

Abstract

:
After being subjected to geometallurgical evaluation, the iron ores from Singhbhum Bonai-Keonjhar region, eastern India, have been designated as dense martite microplaty hematite high-strength ore (dM-mH-hs ore), massive dense martite microplaty hematite high-strength ore (mdM-mH-hs ore), schistose microplaty hematite low-strength ore (smH-ls ore), microplaty hematite powdery ore (mH-p ore), vitreous goethitic ore (vG ore), and ochreous goethitic ore (oG ore) end members, with varied strengths attributed to the microporosity levels. The first four variants form typical high-grade run-of-mines (ROMs) (hard, soft and powdery iron ore variants, e.g., ROM-HIO, ROM-SSIO, and ROM-PBD, respectively) with better amenability to beneficiation. In contrast, oG and vG ore end members form ROM lateritic iron ore (ROM-LIO) with poor amenability to beneficiation, having relatively higher concentrates of alumina (~3–6 wt%) due to the complex mineral chemistry of goethite and altered hematite. Banded hematite jasper (BHJ) is a very low-grade siliceous end member. In a mining operation, the ROMs may have the attributes of several combinations of the above-stated end members and ROM variants. The designated end members present in the ROMs determine their liberation, mineralogical processes, geometallurgical characteristics, amenability to beneficiation, product grade and recovery.

1. Introduction

India is the fourth largest producer of iron ore (290 million metric tonnes in the year 2022), and the second largest producer of pig iron and crude steel. India aims to enhance the production of crude steel to 300 million tonnes per year by the year 2030 [1]. Hence, India will have to strategize ore production through sustainable resource management of raw material preparation and minimization of mine waste.
The iron-making process requires high-quality raw materials, with Fe ≥ 64% and <2% alumina and silica each, to enhance blast furnace productivity at a given energy consumption rate. There is a need for the upgradation of ore and removal of deleterious alumina, phosphorous, and sulfur through beneficiation [2,3,4,5] to develop mineral concentrates of lumps and fines with various size ranges. The fines are agglomerated to prepare high-quality raw materials such as sinter, pellet or briquette as per the metallurgical processing needs [6,7,8,9,10]. Iron is traded as an ore with 63.5%–64% Fe, as a mineral commodity of sea-borne lumps with 62%–62.5% Fe and 1.5% alumina, and as fines (−10 mm size) with (i) 62%–65% Fe and 1%–2.25% alumina, (ii) 65% Fe and 1% alumina, and (iii) iron ore concentrates with 66% Fe and 0.75% alumina [11].
Though iron ore is mined and used as a commercial mineral commodity, the diverse qualities of raw material in terms of grade, size, and tolerance limit on impurity specific to the metallurgical process is maintained through beneficiation. Process mineralogical studies and liberation of granular mass in various size classes are used as the basic tools to predict the response of the ore to beneficiation.
Globally, numerous efforts have been undertaken to understand the geological processes resulting in varied types of Banded Iron formation (BIF) hosted iron ore deposits and their complex mineralogy [12,13], and to explore the complex stoichiometric composition of minerals and their textural attributes [14,15]. Since every geologist, mineralogist or process engineer defines texture in a different way, the terminology related to texture appears to be conflicting [16]. The hematitic ore types from Noamundi [17,18], Jilling-Langalata [19,20], and Kiriburu-Meghahatuburu [21] in eastern India are reported as hard laminated ore (HLO), soft laminated ore (SLO), biscuity ore, blue dust, powdery ore, friable ore, lateritic ore, Banded Hematite Jasper (BHJ), Banded Hematite Quartzite (BHQ), and limonitic ore. Similar BIF-hosted iron ores are reported worldwide (South America and Australia) as hard ore, soft ore, powdery ore, dusty ore, schistose ore, martite-goethite ore, hard hematite ore, high-grade hematite ores, microplaty hematite ore, laminated hematitic ore, and goethite-hematite ore in high-grade hematitic deposits, with varied textural nomenclature for downstream processing [13,14,22,23,24,25,26,27]. Engineering textural nomenclature such as dense martite, martite-goethite, microplaty hematite, martite-ochreous goethite, microplaty hematite-goethite, dense martite-goethite, high-Al-goethite, low-Al-goethite, and porosity was also suggested in high-grade Australian iron ores with significance for downstream mineral processing [25,26,28,29]. The present work on iron ores from the Singhbhum-Bonai-Keonjhar iron ore belt of the eastern part of India is focused on linking mineralogical attributes, petrological textures, process mineralogical parameters, porosity and strength of ores with their geometallurgical attributes. A new designation for ore end members was suggested for hematitic iron ores, and a few possible run-of-mines (ROM) variants were subjected to a beneficiation study. The amenability of ROM hard iron ore (ROM-HIO), soft schistose iron ore (ROM-SSIO), lateritic iron ore (ROM-LIO), and powdery blue dust (ROM-PBD) to beneficiation was evaluated. Extensive research by mineral engineers has resulted in the development of liberation analysis and complex assessment of grade-recovery based on Automated Scanning Electron Microscopy. However, the present research attempts to find a more straightforward method to understand the ore in terms of mineralogy, complex mineral chemistry, texture and strength, and apply it to evaluate the bulk chemistry of ore types/ROM and their response to beneficiation. Such geometallurgical understanding may interest mining engineers, mineral processing engineers, process mineralogists, metallurgists and plant engineers.

2. Materials and Methods

2.1. Materials

Identification and sampling of iron ore variants were conducted through field observations in Kashia, Jajang, and adjacent areas of Chiria in the Singhbhum-Bonai-Keonjhar iron ore belt of eastern India. The typical run-of-mines (ROMs) sample of representative hard iron ore (ROM-HIO), soft schistose iron ore (ROM-SSIO), powdery blue dust (ROM-PBD), and lateritic iron ore (ROM-LIO) were collected from the same iron ore belt, and their composition was compared with the assay of typical ore variants designated in the present study, and their beneficiation amenability was compared as well.

2.2. Methods

Mineralogical and textural studies were conducted using a digital optical microscope, Model-DM 4500P, with the image analysis software LAS v4.13, Leica make. The petrographic images were converted to a grey scale. The percentage of area covered by void and impregnated resin in a pore space of specified grey scale 0–20 was reported as pore area percentage for an image. The average pore area data from several photomicrographs from each variant were computed as the pore area via an image analysis of pixel area calculation using a software. The relative strength of ore in terms of strength index (Is) was calculated from failure load ‘P’ and equivalent diameter ‘De’ as per Equation (1). Failure load in kN was measured using a point load tester with 100 kN capacity (two pillar model) Accrotech-make at Mineral Processing division in CSIR-NML. For this purpose, cubic-shaped specimens of length 10 mm were prepared using diamond saw (Lapro saw, Buehler make, and CS 10, Logitech make). The load through the conical platen was applied perpendicular to the foliation surfaces or compositional bands of the specimen. The minimum cross-sectional area (A) of a plane through platen contact points ‘A’ was measured to compute the parameter ‘De2’ (in mm2) as per Equation (2). The test was carried out for ten specimens from each ore variant following the standard test method ASTM D5731-07 [30]. The uncorrected point load strength index in MPa or N/mm2 was calculated as per Equation (1), as stated below.
U n c o r r e c t e d   p o i n t   l o a d   s t r e n g t h   I n d e x   ( i n   M P a ) = I s = P D e 2
where P = failure load in N and Parameter De2 = calculated parameter for block and lump tests in mm2.
F o r   l u m p   t e s t ,   P a r a m e t e r   D e 2 = 4 A π
where A = minimum cross-sectional area of a plane through the platen contact points.
Mineral phase identification, including clay minerals in ores, was carried out using X-ray diffraction (XRD) with Co Kα radiation in model X’pert Pro, Panalytical make, and with Cu Kα radiation in model Ultima IV Diffractometer, Rigaku make, scanning from 2ϴ of 6 degrees to 80 degrees at a scanning speed of 1 degree/min. Polished samples of 32 mm size mounted on resin stubs were studied under field emission scanning electron microscope (FE-SEM), model Supra-55, with energy dispersive spectrometer (EDS), Carl Zeiss make at IIT-ISM, Dhanbad, India. The EDAX scan was carried out with a working voltage ranging between 10 and 25 kV. The major element analysis was carried out via wavelength dispersive X-ray fluorescence spectrometer (WD-XRF), model ZETIUM 4.0 (Minerals Edition) Malvern Panalytical make at CSIR-IMMT, Bhubaneswar, India. Electron probe microanalysis (EPMA) of minerals in polished samples was carried out via electron probe micro analyzer model CAMECA (SX-5) at 15 kV excitation voltage of beam current 15 nA with beam size 1 µm.
To study the amenability of the ROM variants to beneficiation, each ROM sample was crushed in stages to −30 mm size, followed by scrubbing, washing, and classification. Out of the classification products, the −30 + 1 mm size fraction was subjected to jigging. The size fraction −1 + 0.15 mm was subjected to tabling based on the Wilfley table. The size fraction −0.15 mm was subjected to hydrocyclone followed by wet high-intensity magnetic separation (WHIMS) of hydrocyclone underflow. Magnetic field intensity was varied to produce the concentrate with the desired grade. The liberation study was carried out for size fractions −1 + 0.21 mm, −0.21 + 0.15 mm, −0.15 + 0.075 mm, and 0.075 + 0.045 mm of ROM samples via modal analysis of liberated and interlocked grains as observed under wild M8 Zoom stereo microscope, Leica make. The weight percent of particles of +10 mm size, retained from 20 kg of ROM sample of −40 + 10 mm size dropped four times from a height of 2 m, was measured with the Shatter Index of ROM as per the standard procedure of Bureau of Indian standard (IS: 9963-1981; Reaffirmed 2003) [31].

3. Results and Discussion

Based on the field observations (Figure 1a,b), attributes, relative strength, and microscopic observations, the iron ore variants in the study area are designated with a new terminology as dense martite-microplaty hematite high-strength ore (dM-mH-hs ore; Figure 1d), massive dense martite-microplaty hematite high-strength ore (mdM-mH-hs ore; Figure 1e), schistose microplaty hematite low-strength ore (smH-ls ore; Figure 1a), microplaty hematite powdery ore (mH-p ore; Figure 1b), vitreous goethitic ore (vG ore; Figure 1g), ochreous goethitic ore (oG ore; Figure 1h), and Banded hematite jasper (BHJ; Figure 1c). In Kasia-Jajang in the Singhbhum Bonai- Keonjhar region, the ore body is overlain by a lateritic cap which consists of vG ore and oG ore in the top, followed by high-strength mdM-mH-hs ore, dM-mH-hs ore in the middle, and ores of successively low strength such as smH-ls and mH-p, to absolutely powdery ore juxtaposed in the lateral flanks or deposited in the extreme depths.

3.1. Ore Mineralogy, Mineral Chemistry, and Texture of Iron Ore Variants

Based on observation under an optical microscope, scanning electron microscope, X-ray diffraction, and mineral chemistry by electron probe microanalysis (EPMA), mineralogical and textural characteristics of several iron ore variants were assessed as designated end members. All these ore variants consist of hematite, goethite, quartz, and kaolinite in varied proportions, as revealed with XRD (Figure 2). Banded hematite jasper contains a high amount of quartz (Figure 2a) in comparison to other variants, whereas vitreous goethitic ore and ochreous goethitic ores, occurring as cap rock in the field, contain a higher amount of goethite and kaolinite (Figure 2d,e). The geometallurgical characteristics of these designated variants were validated by studying the typical ROM variants and their amenability to beneficiation.

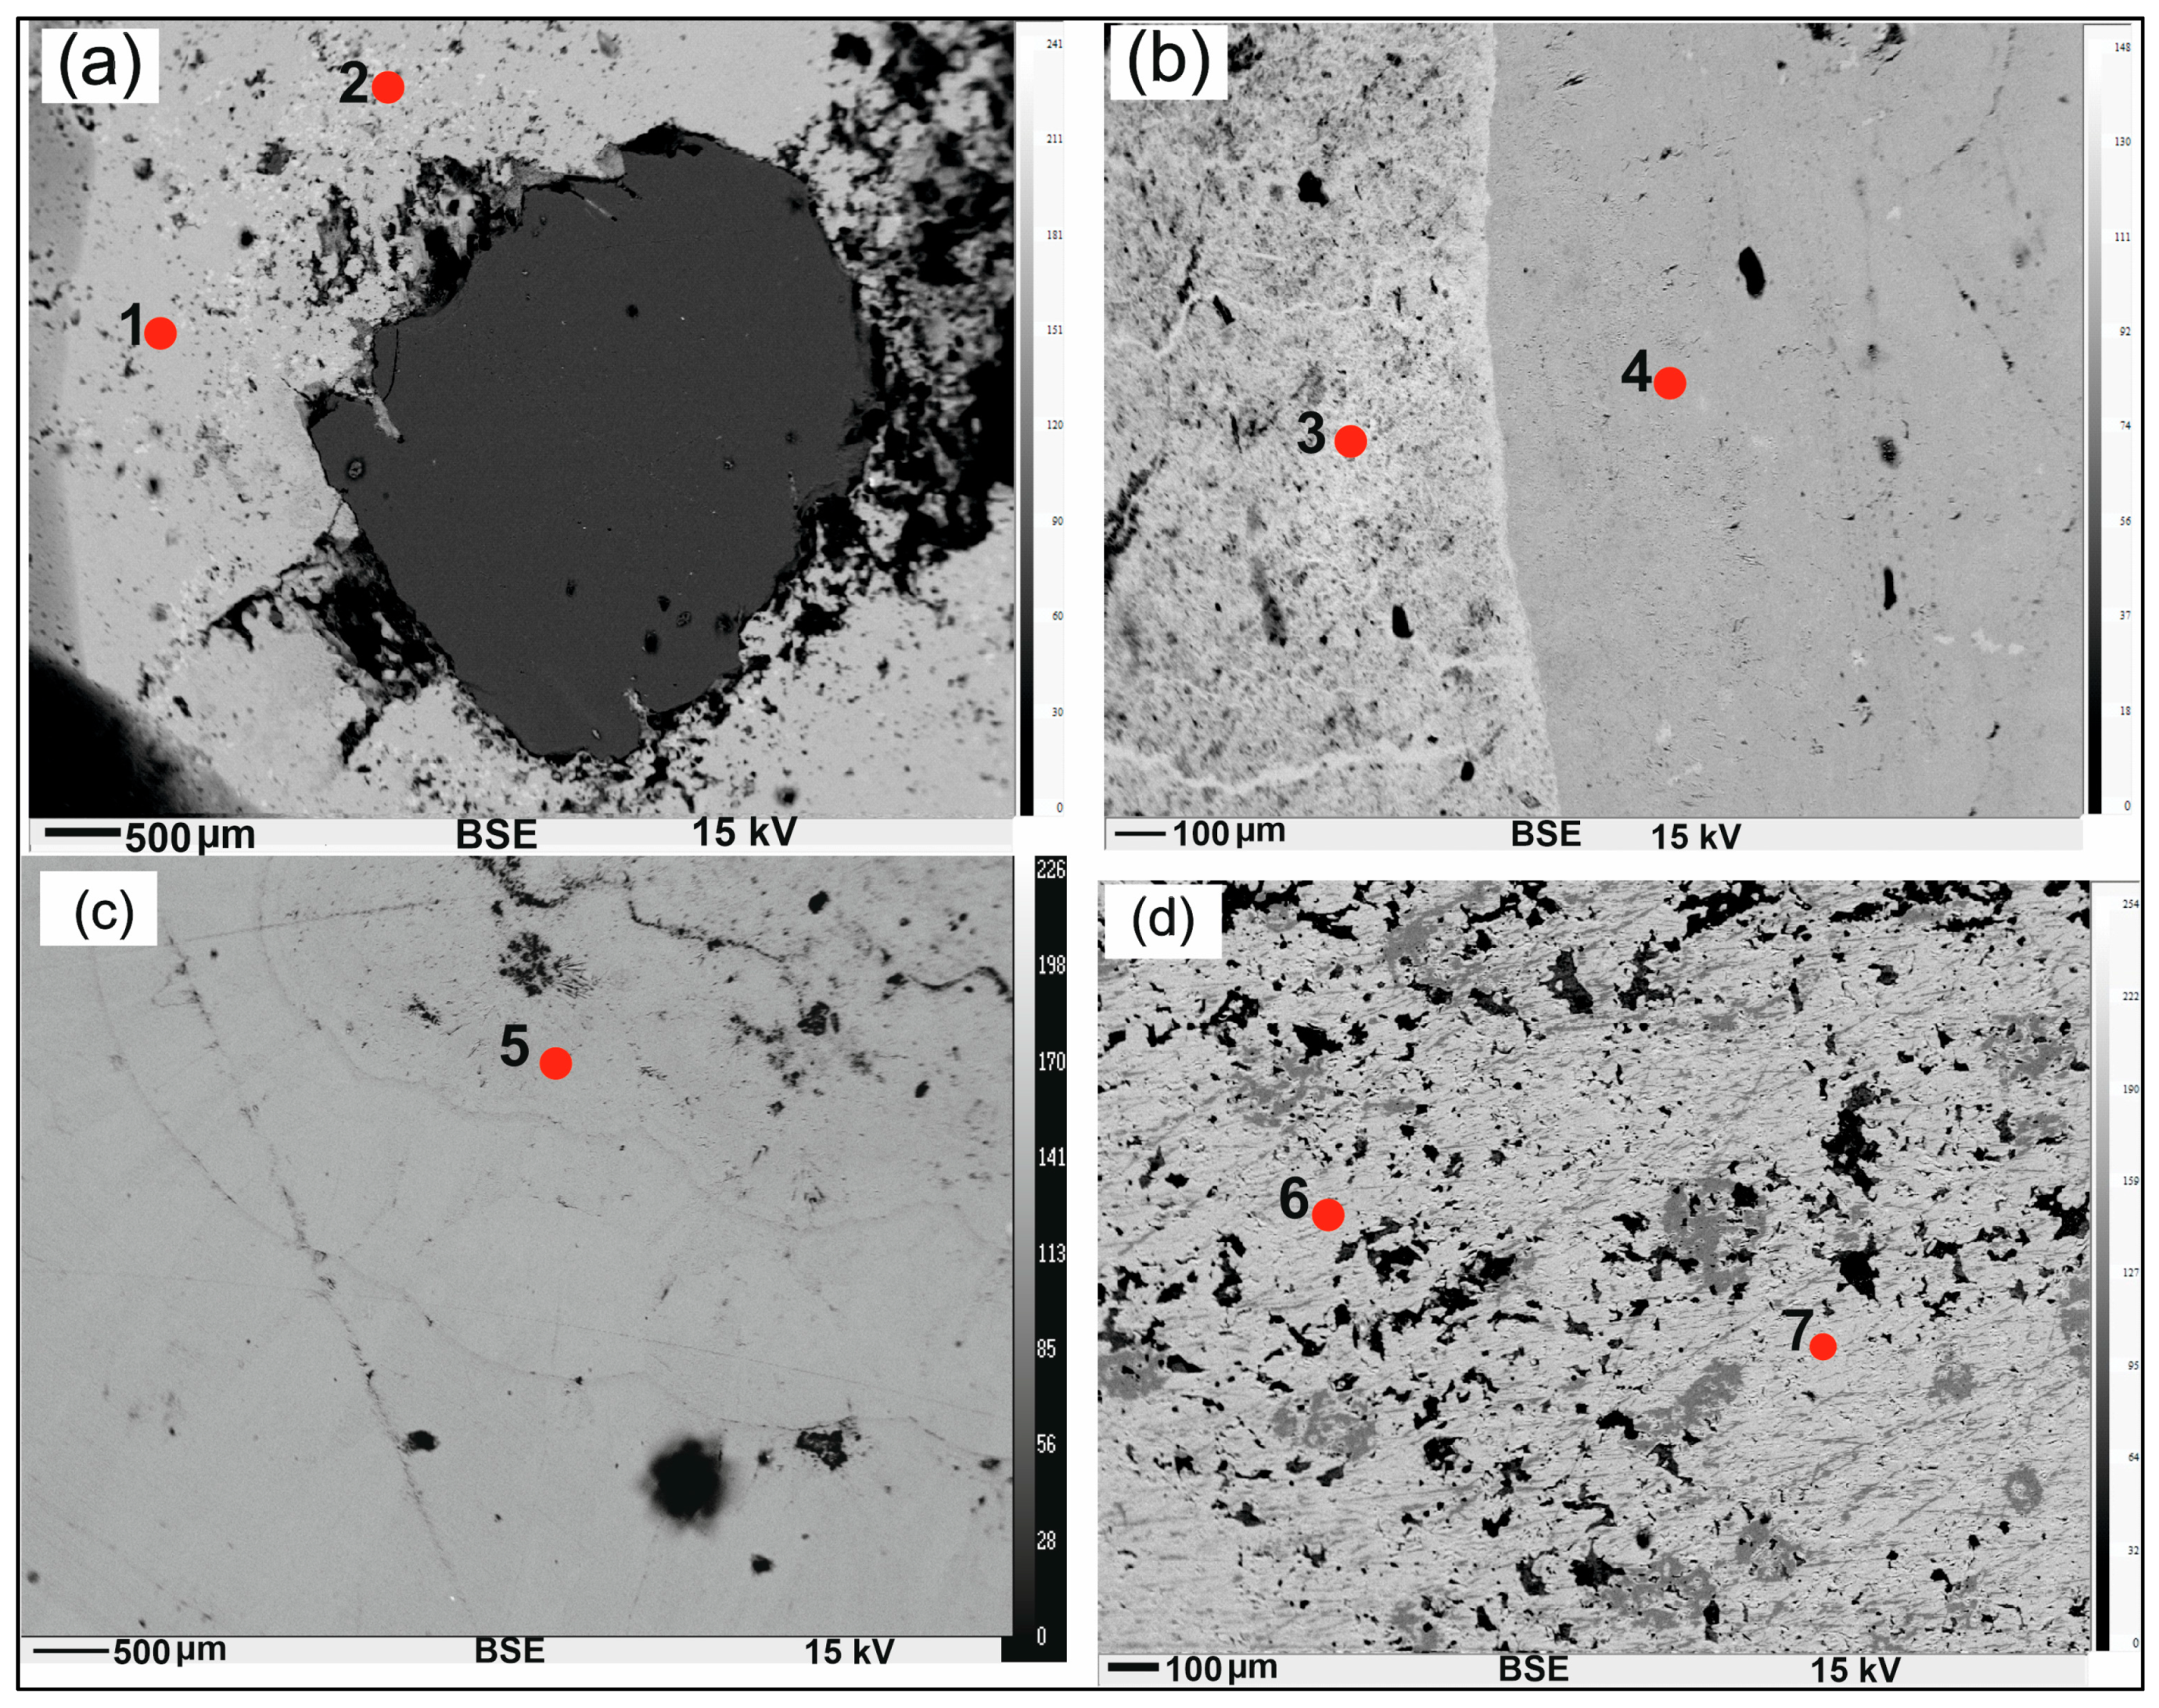
3.1.1. Mineral Chemistry

The mineral chemistry of various phases in a few specimens (Figure 3), as presented in Table 1, was compared with the limited available international database [27]. Fe2O3 content in hematite of dM-mH-hs ore ranges from 99.02% to 99.66%, corresponding to a total Fe content of 69.2% to 69.7%. The silica and alumina content vary in the range of 0.23%–0.56% and 0.23%–0.27%, respectively, and are comparable with the average data of hematite from Australian ore [27]. However, altered hematite occurring in colluvial hematitic conga enclaved in vitreous goethite contains 65.7% Fe (~94.1% Fe2O3), 0.8% SiO2 and 0.6% Al2O3, which is equivalent to the reported hydrohematite (Table 1) in Australian iron ore [25,26,27,28], and is interpreted as a dehydration product of goethite (FeOOH). Hydrohematite is an intermediate stage in which a significantly high amount of hydroxyl ion exists prior to dehydration transformation to hematite [26]. Vitreous goethite with 59% Fe (close to 60% Fe) in this area is comparable with vitreous goethite with 60.13% Fe from Australia. However, it has comparatively high silica- and alumina content, which is comparable with hydrohematite or vitreous goethite from Australian iron ore, except that the latter has 65% Fe [27] (Table 1). Ochreous goethite mineral occurring in an ochreous goethitic ore contains a varied amount of silica and alumina. One analysis shows ochreous goethite with 2.7% silica and 0.23% alumina, which is compositionally equivalent to vitreous goethite from Australia, except that its Fe content is about 53.5%. In general, ochreous goethite and colloform goethite contain Fe in the range of 32%–48%, SiO2 in the range of 7.5%–22.9%, and alumina in the range of 8.2%–20.1%, thus, it can be coined as a high Al-Si-goethite. They do not qualify as ore minerals, but are equivalent to gangue minerals. High Al-Si goethites are also reported in slime from Kiriburu mines [32].

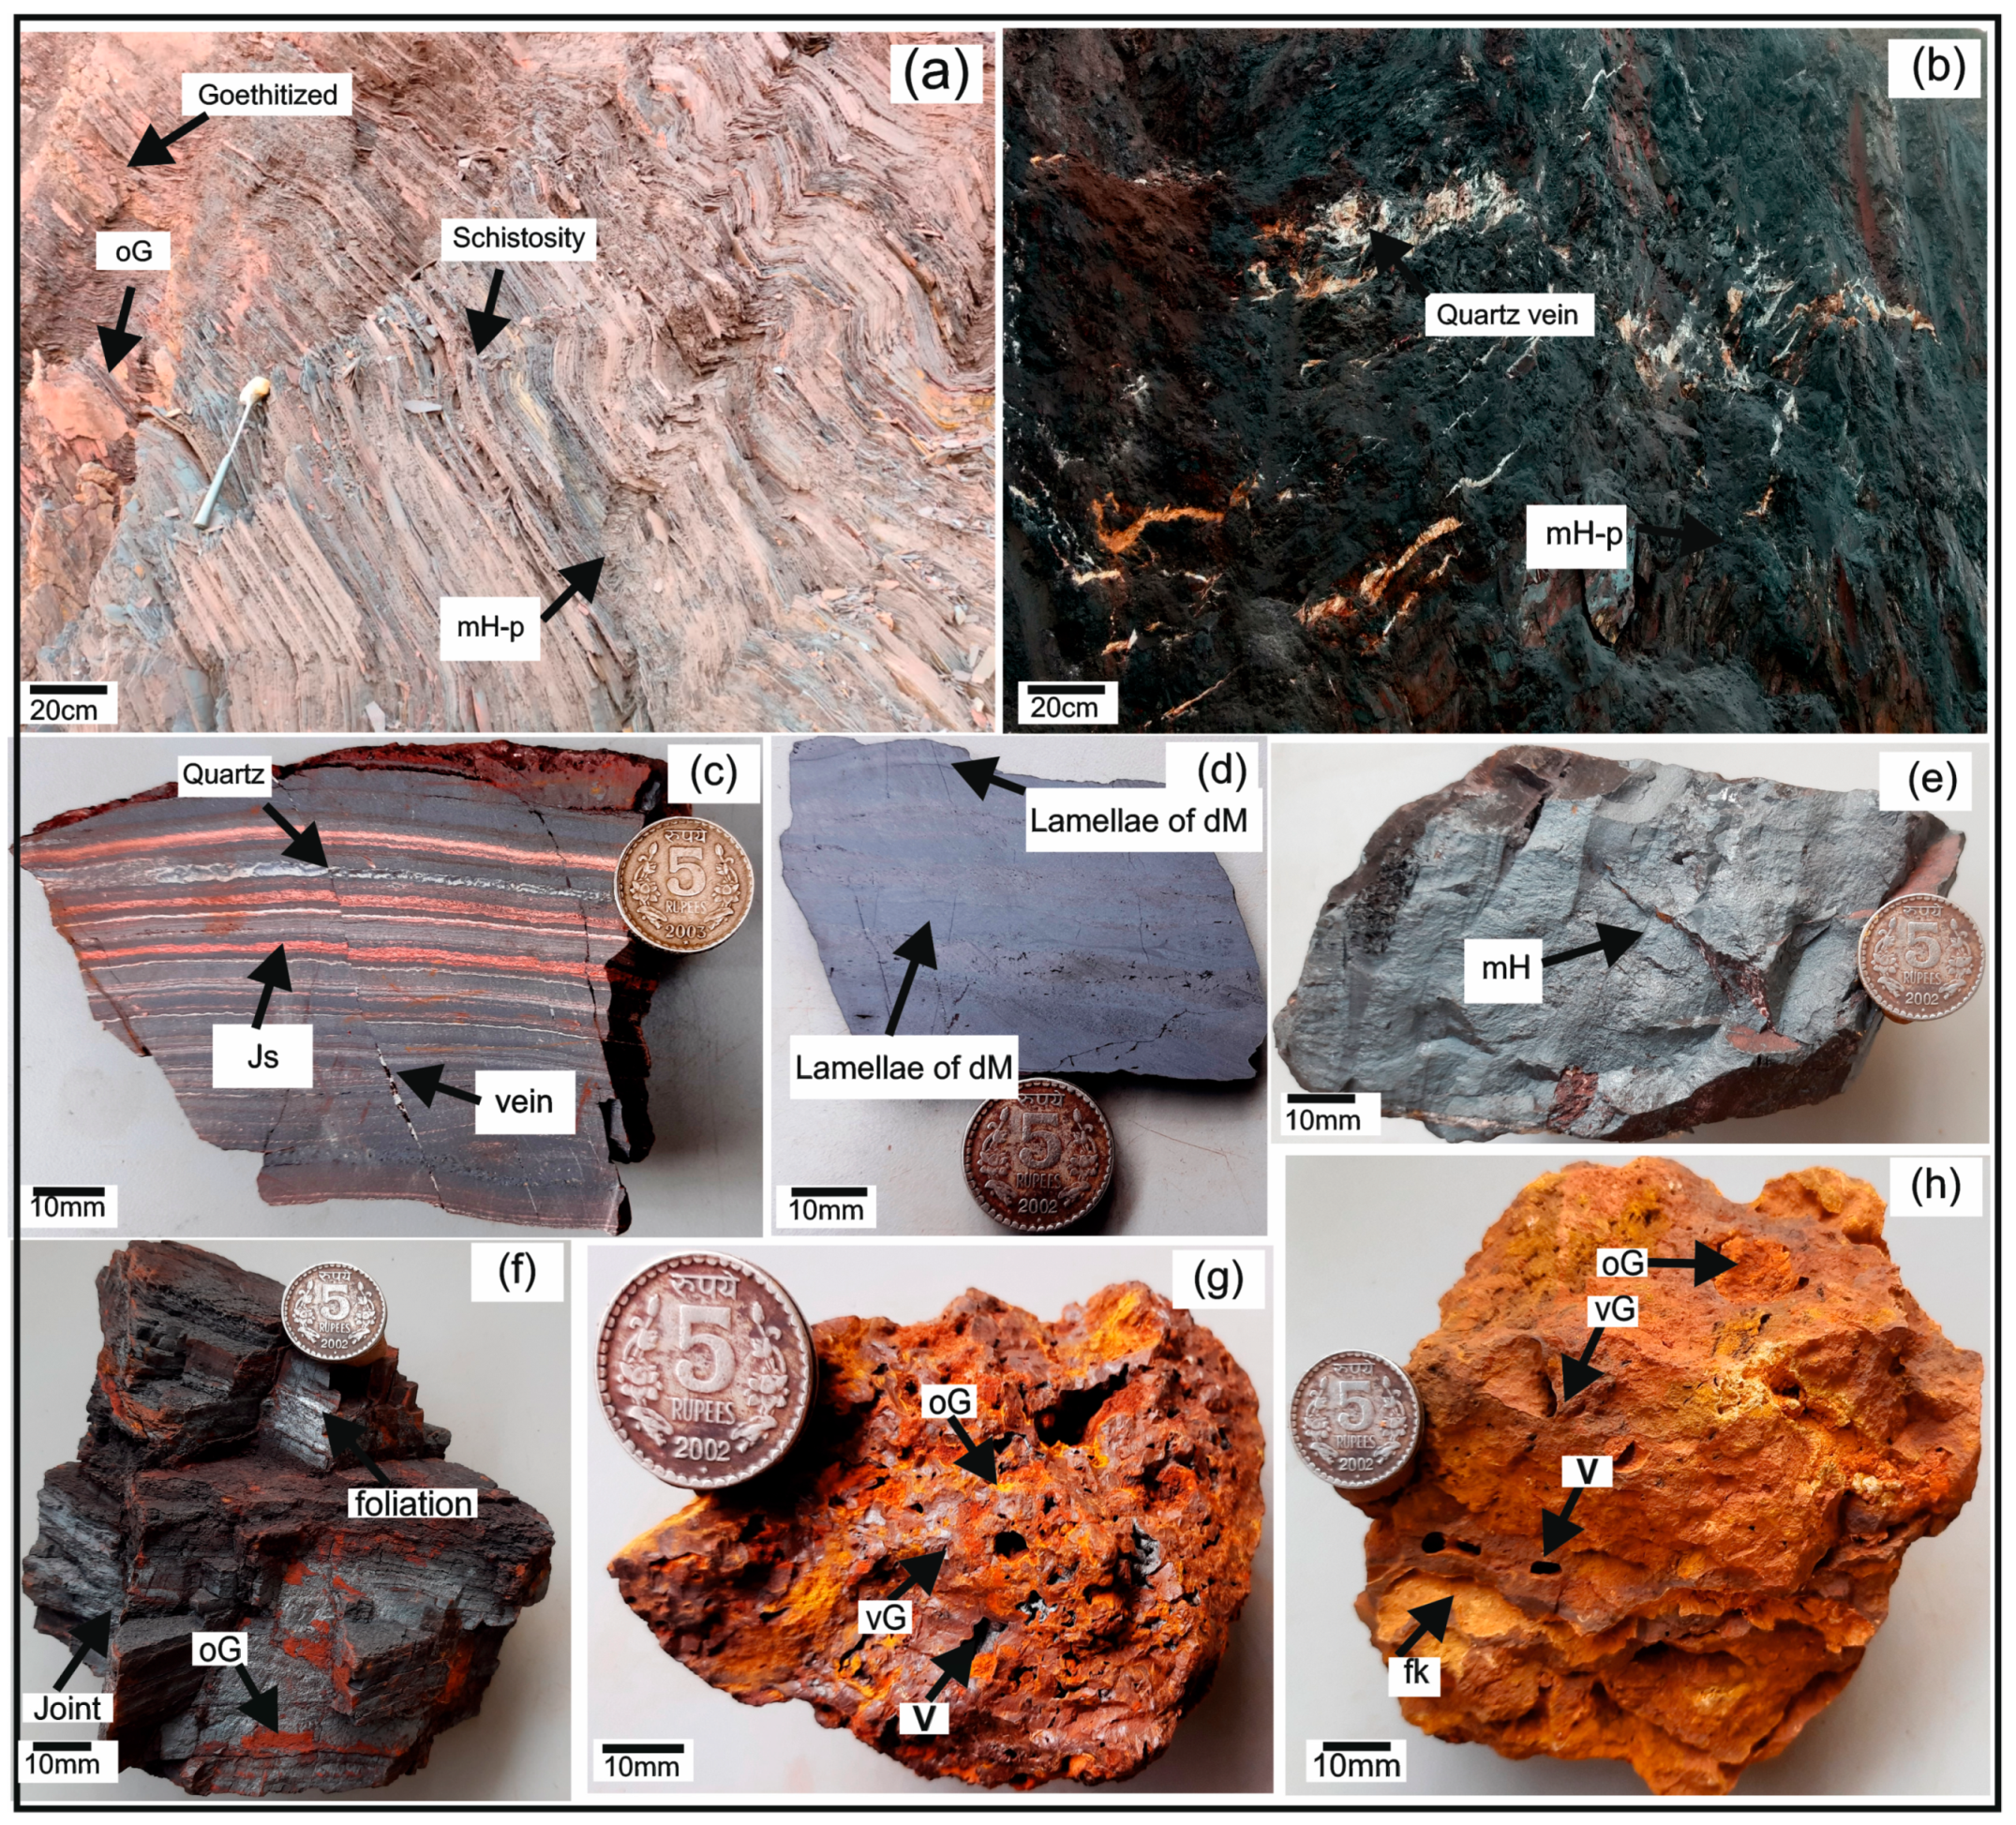
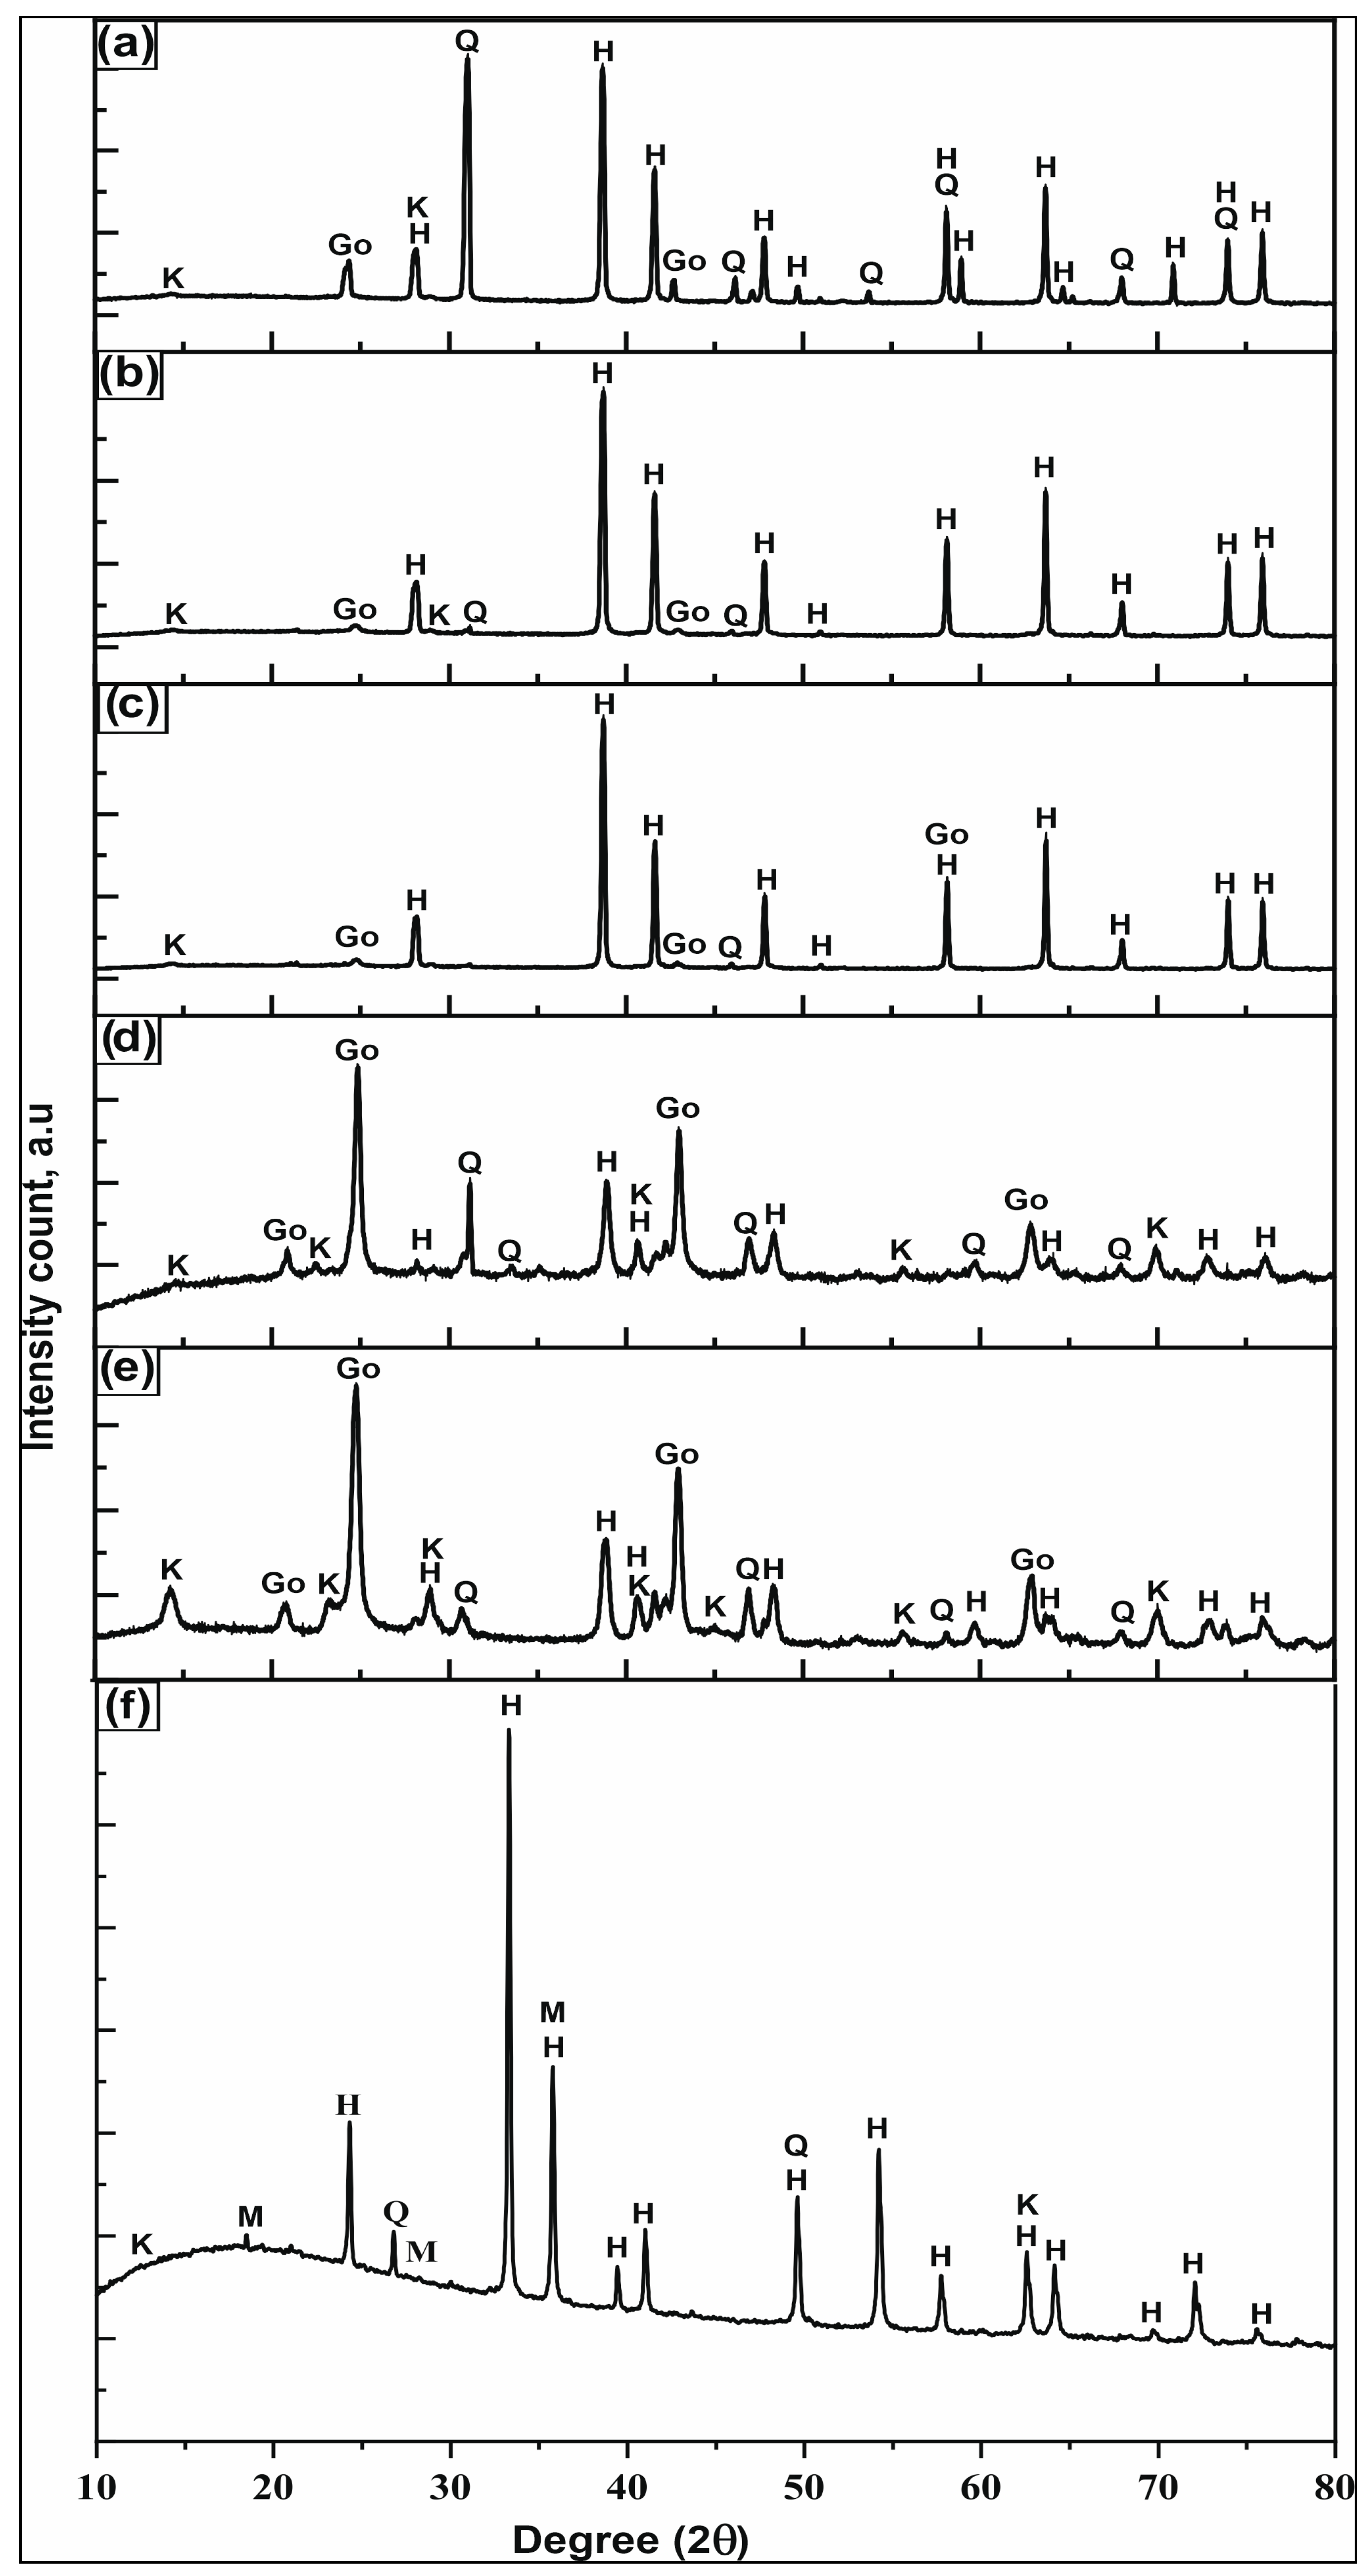
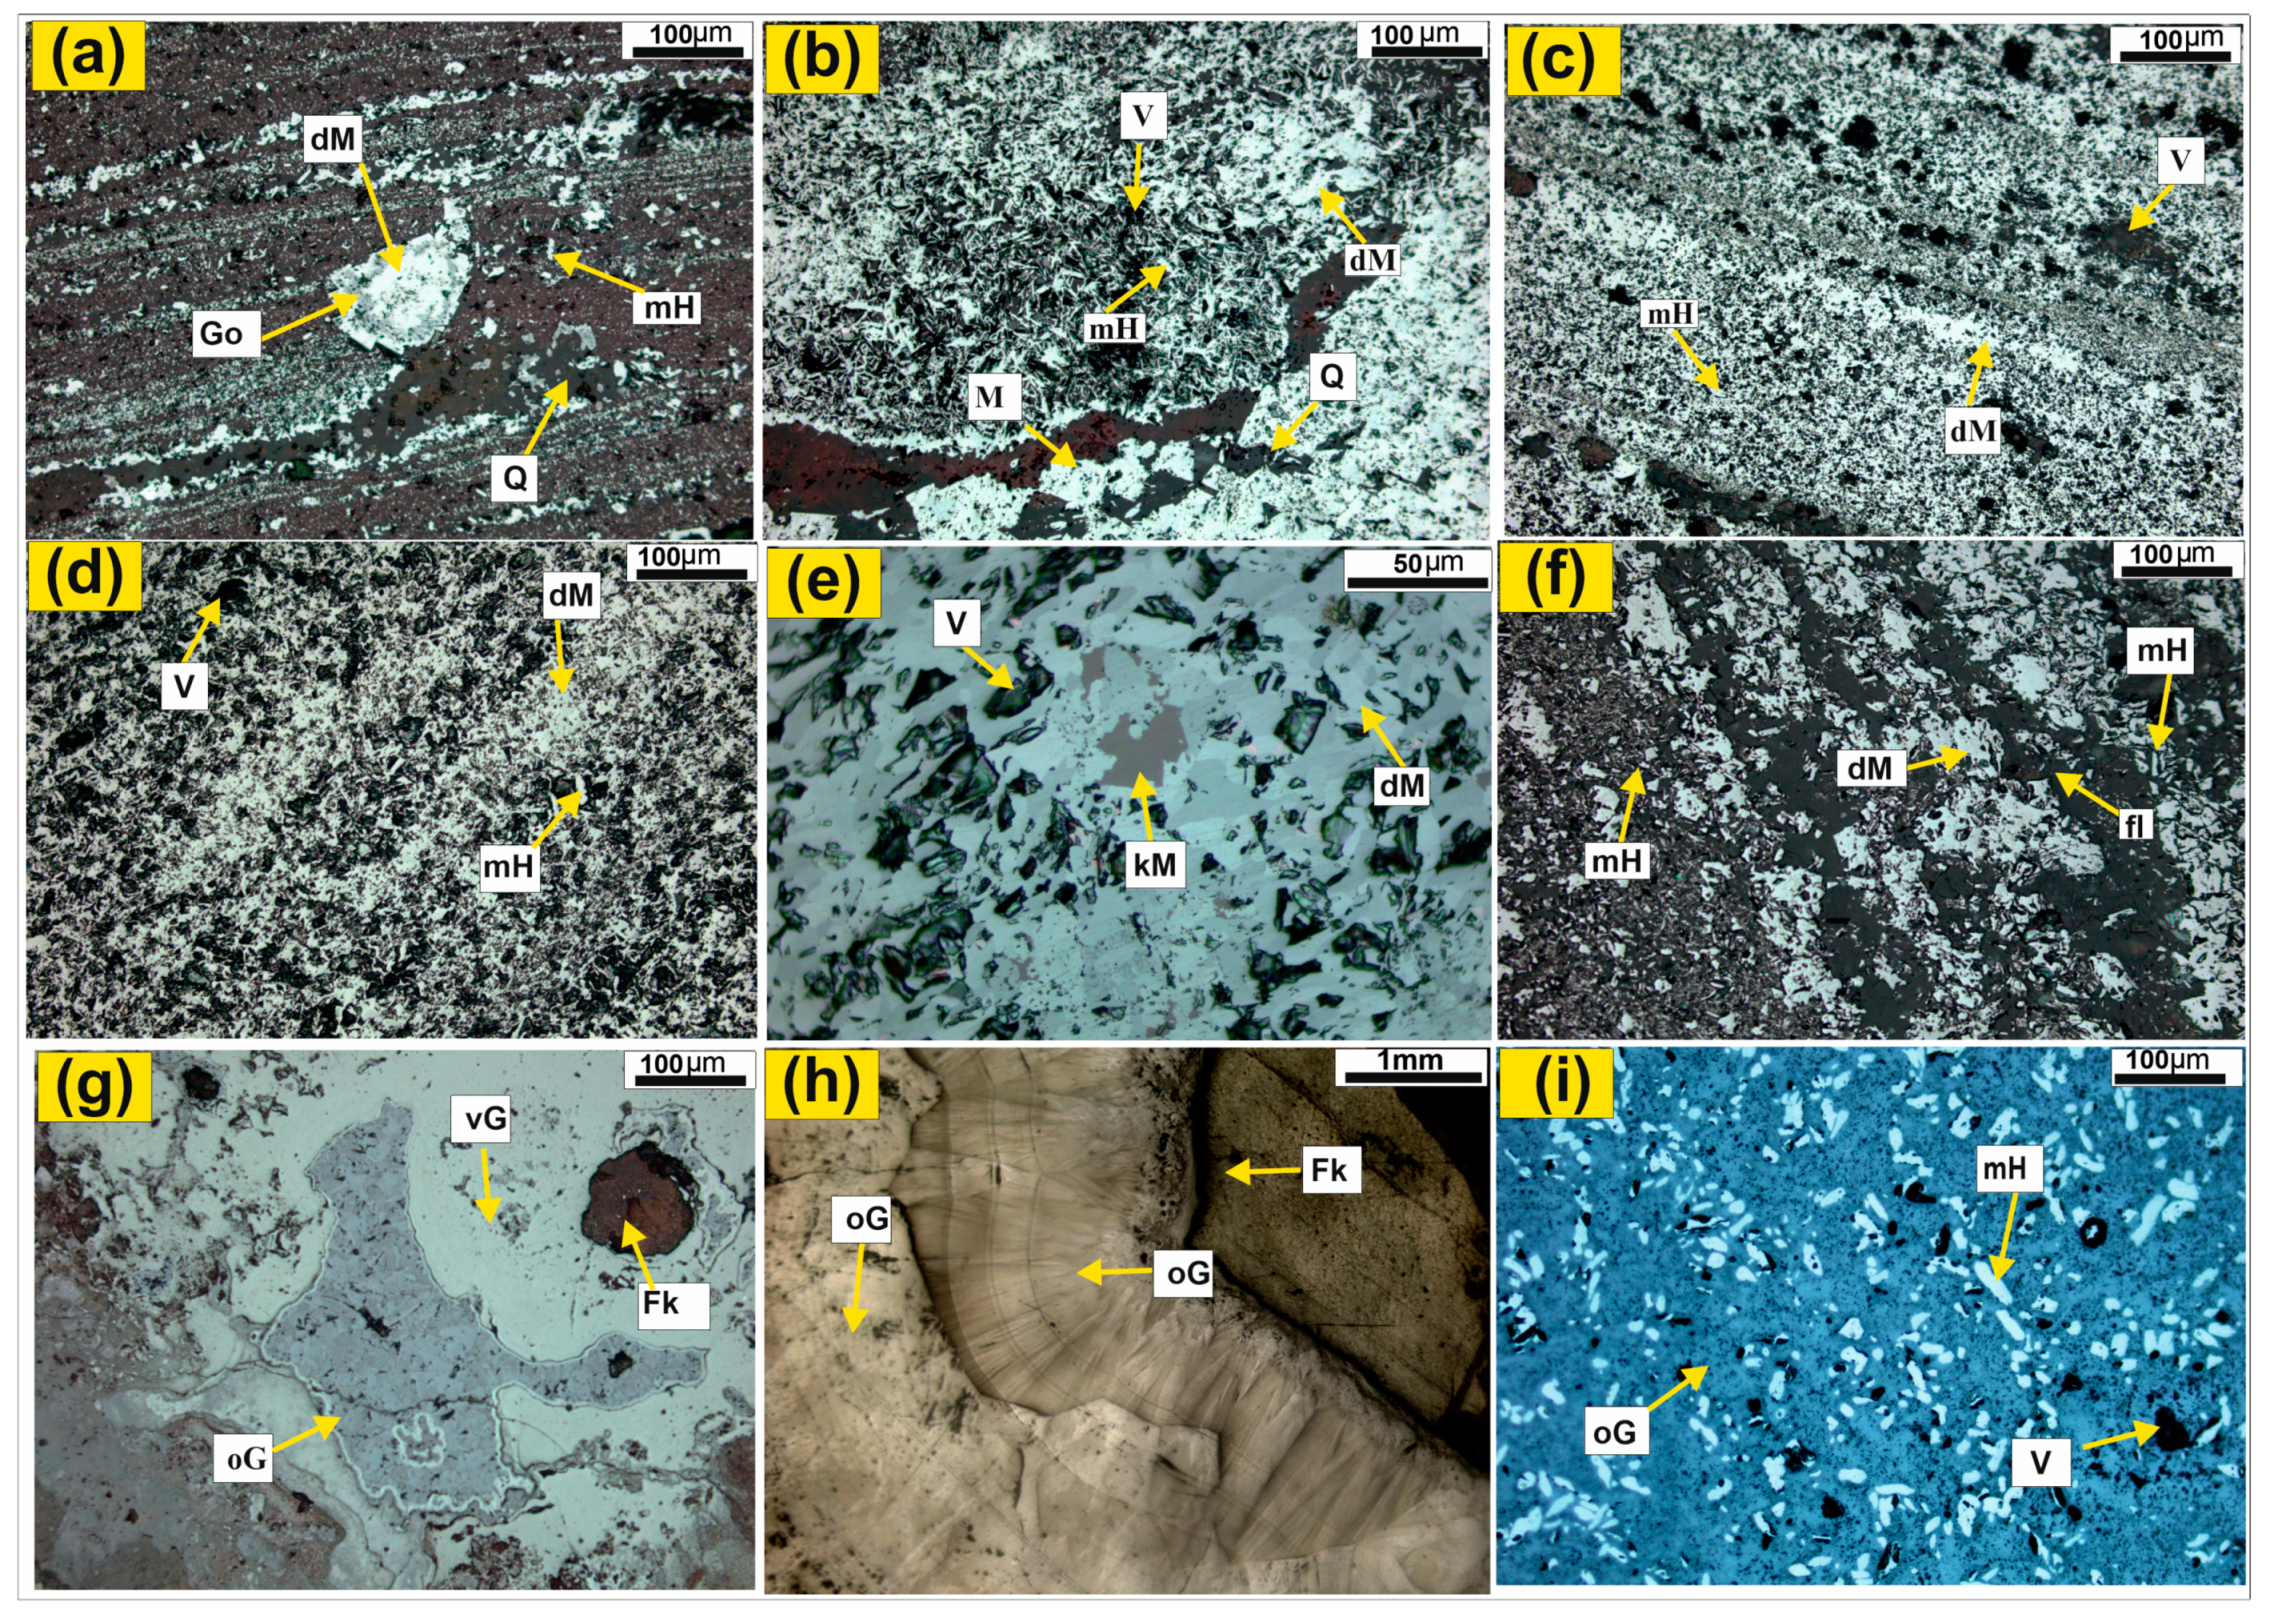
3.1.2. Mineralogy and Texture

The mineralogical association, mosaic of arrangement, and their interrelationship described as texture in geological literature is related to their genetic link in geological evolution history. On the other hand, process engineering literature expresses the ore texture in terms of their mineralogical assemblage, such as hematite-goethite texture, martite-goethite texture, etc. [16]. While geological textural terminology (viz. porous, sheared, and schistosity) may address specific physical parameters (e.g., strength, tumbler index, shatter index, Bond work index, etc.) of ore, process engineering textural terms may not. Hence, the new designated terminology adopted in the present work has combined the mineralogical-textural information with porosity and strength (relevant to engineering characteristics) on each designated variant end member ore as follows.
(i)
Banded Hematite Jasper (BHJ)
Banded hematite jasper is a rock consisting of alternating bands of hematite and jasper. These bands may exhibit small-scale sheath folds, boudinization, rootless hinges, minor fault surfaces, and they are often intruded by concordant quartz filling and discordant quartz veins of multiple sets (Figure 1c). They led to interlocking at micro and macro scales. Thicker hematite-rich bands and visibly thin jasper lamellae may qualify as high-grade BHJ. XRD data show that the rock contains hematite, quartz, goethite, and a minor amount of kaolinite (Figure 2a). The hematitic band consists of fine-grained microplaty hematite of size 21–50 µm and porous dense martite of size 28–42 µm, as detailed in Table 2, with intergranular space occupied by the cryptocrystalline quartz (Figure 4b). The jasper band/lamellae consist of a matrix of very fine-grained quartz (<10 µm) and disseminated microplaty hematite of size <1 µm to 5 µm thick and 2–15 µm in length (Figure 4a,b). These textural relationships lead to the interlocking of hematite within the matrix of jasper. Disseminated hematite of 10 µm size may not get liberated even at 25 µm size. However, some hematite-rich clusters with minimal interlocked quartz from hematitic bands may generate silica-poor grains of −50 + 25 µm on milling.
(ii)
Dense martite microplaty hematitic high-strength ore (dM-mH-hs ore and massive dM-mH-hs ore)
This ore is dark steel grey, which exhibits a lamellar structure (Figure 1d) with laminae or thin bands of dense martites, alternating with the porous laminae/bands of microplaty hematite (Figure 1d and Figure 4c), even in a microscopic scale. The ore is of high strength, and was previously reported by other authors as hard laminated ore (HLO). It is associated with schistose microplaty hematite and interleaving kaolinitic altered tuffaceous shale in the field. This ore consists of hematite and a minor amount of goethite, quartz, and kaolinite, as shown in XRD data (Figure 2b). Hematite occurs as microplaty hematite and dense martite, the latter often carrying relict kenomagnetite. They occur with the intense development of intergranular pore space, often with schistosity foliation/shear foliation surfaces (Figure 4c), along which microplaty hematite is occasionally observed to be altered to microplaty goethite. Microplaty hematite is smaller than dense martite, and the pore size varies in the range of 14–67 µm, as detailed in Table 2.
There is a massive variant designated as massive dense martite microplaty hematite high-strength ore/mdM-mH-hs ore, wherein no schistosity, laminae, or band exists (Figure 1e). This ore variant mainly consists of microplaty hematite and a minor amount of disseminated dense martite, goethite, quartz, kaolinite, and occasionally kenomagnetite (Figure 4d,e). The dimensions of microplaty hematite and dense martite have a length-to-height ratio of 2:1 and 1:1, respectively, and pore size varies from 15 µm to 38 µm, as given in Table 2. Despite hematite being paramagnetic, the presence of kenomagnetite in some of the thicker grains may cause them to become magnetic. Dense martite clustered with microplaty hematite may work as liberated ore grain of high grade at larger size fractions above 1 mm.
(iii)
Schistose microplaty hematitic low-strength ore (smH-ls ore)
This ore has a well-developed schistosity or shear-related foliation (Figure 1a), exhibiting microplaty hematite as the exclusive ore mineral. It is partly altered to ochreous red goethite in the vicinity of foliation or shear surfaces (Figure 1f). The 3–7 µm thick powdery microplaty hematite develops along the schistosity surface, interleaved with 5–10 mm thick platy microporous hematitic laminae, resulting in a variant of smH-ls ore, and is termed as biscuity ore by mining personnel. Extensive schistosity associated with smH-ls ore and enhanced porosity make it fragile in the schistose microplaty hematite-porous variant (smH-p ore) and powdery in the mH-p ore (Figure 1b). The microplaty hematite of fine size (5–37 µm) and of very fine size (2–6 µm) occur with an intense intergranular pore space of size 14–66 µm, as detailed in Table 2, and a well-developed foliation surface (Figure 4f). Occasionally, quartz and kaolinite are present in the pore space, especially near quartz-kaolinite veins or juxtaposed altered shale in the mines. Although the individual grain size of hematite is only a few microns, they cluster together to form liberated porous grains of hematite over 1 mm in size. Microcrystalline hematites of <3 µm are disseminated in smH-ls/smH-p ore as the fine-grained hematite population increases. Therefore, if the ore is crushed, it may produce reasonably liberated hematitic grains, even at larger sizes (>10 mm).
(iv)
Microplaty hematitic powdery ore (mH-p ore)
The ore is dark-colored, highly porous, and powdery, containing microplaty hematite, and occasionally altered quartz veins along the schistosity surface (Figure 1b) in the field. It is referred to as blue dust in India, analogous to dusty or powdery iron ore in South America, Brazil, and Australia. The mH-p ore consists of hematite, a minor amount of quartz, magnetite, and a minor trace amount of goethite kaolinite, as observed from XRD data (Figure 2f). On a microscopic scale, this ore variant consists of weakly networking microplaty hematite in close clusters with weak contact areas and intense intergranular pore space (Figure 5b). The dimension of microplaty hematite varies from 1 µm to 48 µm, dense martite from 25 µm to 61 µm, and pore size of about 26–73 µm or larger in coarse fractions, as detailed in Table 2. Due to porosity, the clusters of hematitic grains collapse to a powdery form. A typically designated mH-p ore variant with 70% of grains being statistically smaller than 25 µm, as observed via size analysis, is supported by the textural data. The dimension of microplaty hematite, dense martite, and pore space in coarse fractions is given in Table 2.
(v)
Vitreous goethitic ore (vG ore)
The designated ore is dominated with vitreous goethite, with a minor amount of ochreous goethite mineral, goethitic pisoliths (Figure 1g), and ferricrete with occasional colluvial hematite. Goethite is associated with quartz and kaolinitic clay (Figure 2d). It is deep brown in color with vitreous luster, with a tinge of yellow to ochreous red, and consists of voids and vugs. The colloform structure of goethite around voids and on pisolith is observed even in hand specimens (Figure 1g). It is a part of laterite capping, and is often categorized as soft ore by mining personnel due to its low strength. Vitreous goethite shows higher reflectance than ochreous goethite under reflected light in optical microscopy. Hematite is observed to be occasionally altered to a relict phase (Figure 3a), equivalent to hydrohematite in terms of mineral chemistry and goethite (Table 1). Altered hematite and vitreous goethite contain Fe 65.7% and 59.2%, respectively, whereas alumina and silica contents are below 1% (Table 1). Thus, vitreous goethite is equivalent to low-Al-goethite. The 15–20 µm thick colloform bands of goethite exhibit an association with clay on a micron scale, suggesting interlocking at a size below 25 µm (Figure 4g).
(vi)
Ochreous goethitic ore (oG ore)
The designated oG ore is ochreous red and ochreous yellow in color. It consists of pisolithic goethite, kaolinite, and interleaving thin layers of ferruginous clay, ochreous goethite, or occasional vitreous goethite (Figure 1h). Kaolinite is present as ferruginous kaolinite, and is often categorized as soft ore due to its low strength. It is a part of laterite capping, and is frequently associated with colluvial hematite fragments in the field. The XRD data suggest that the oG ore has a dominant quantity of goethite and a minor amount of hematite, kaolinite clay, and quartz (Figure 2e). Under the microscope, colloform goethite exhibits clay-rich zones (Figure 4h), and its compositional variation is corroborated with backscattered electron image (Figure 3b,c) and EPMA data (Table 1). The typical composition of ochreous goethite shows Fe content varying from 32% to 53%, with silica in the range of 2.7%–23% and alumina of 0.23%–20%. Silica and alumina increase with the decrease in Fe-content in the mineral and some high-Al-goethite can be coined as high Al-Si-goethite with alumina-silica assays of about 20% each, which disqualify them as ore minerals. As colloform goethite has compositional complexity with variations in alumina and silica, the interlocking is too intimate.

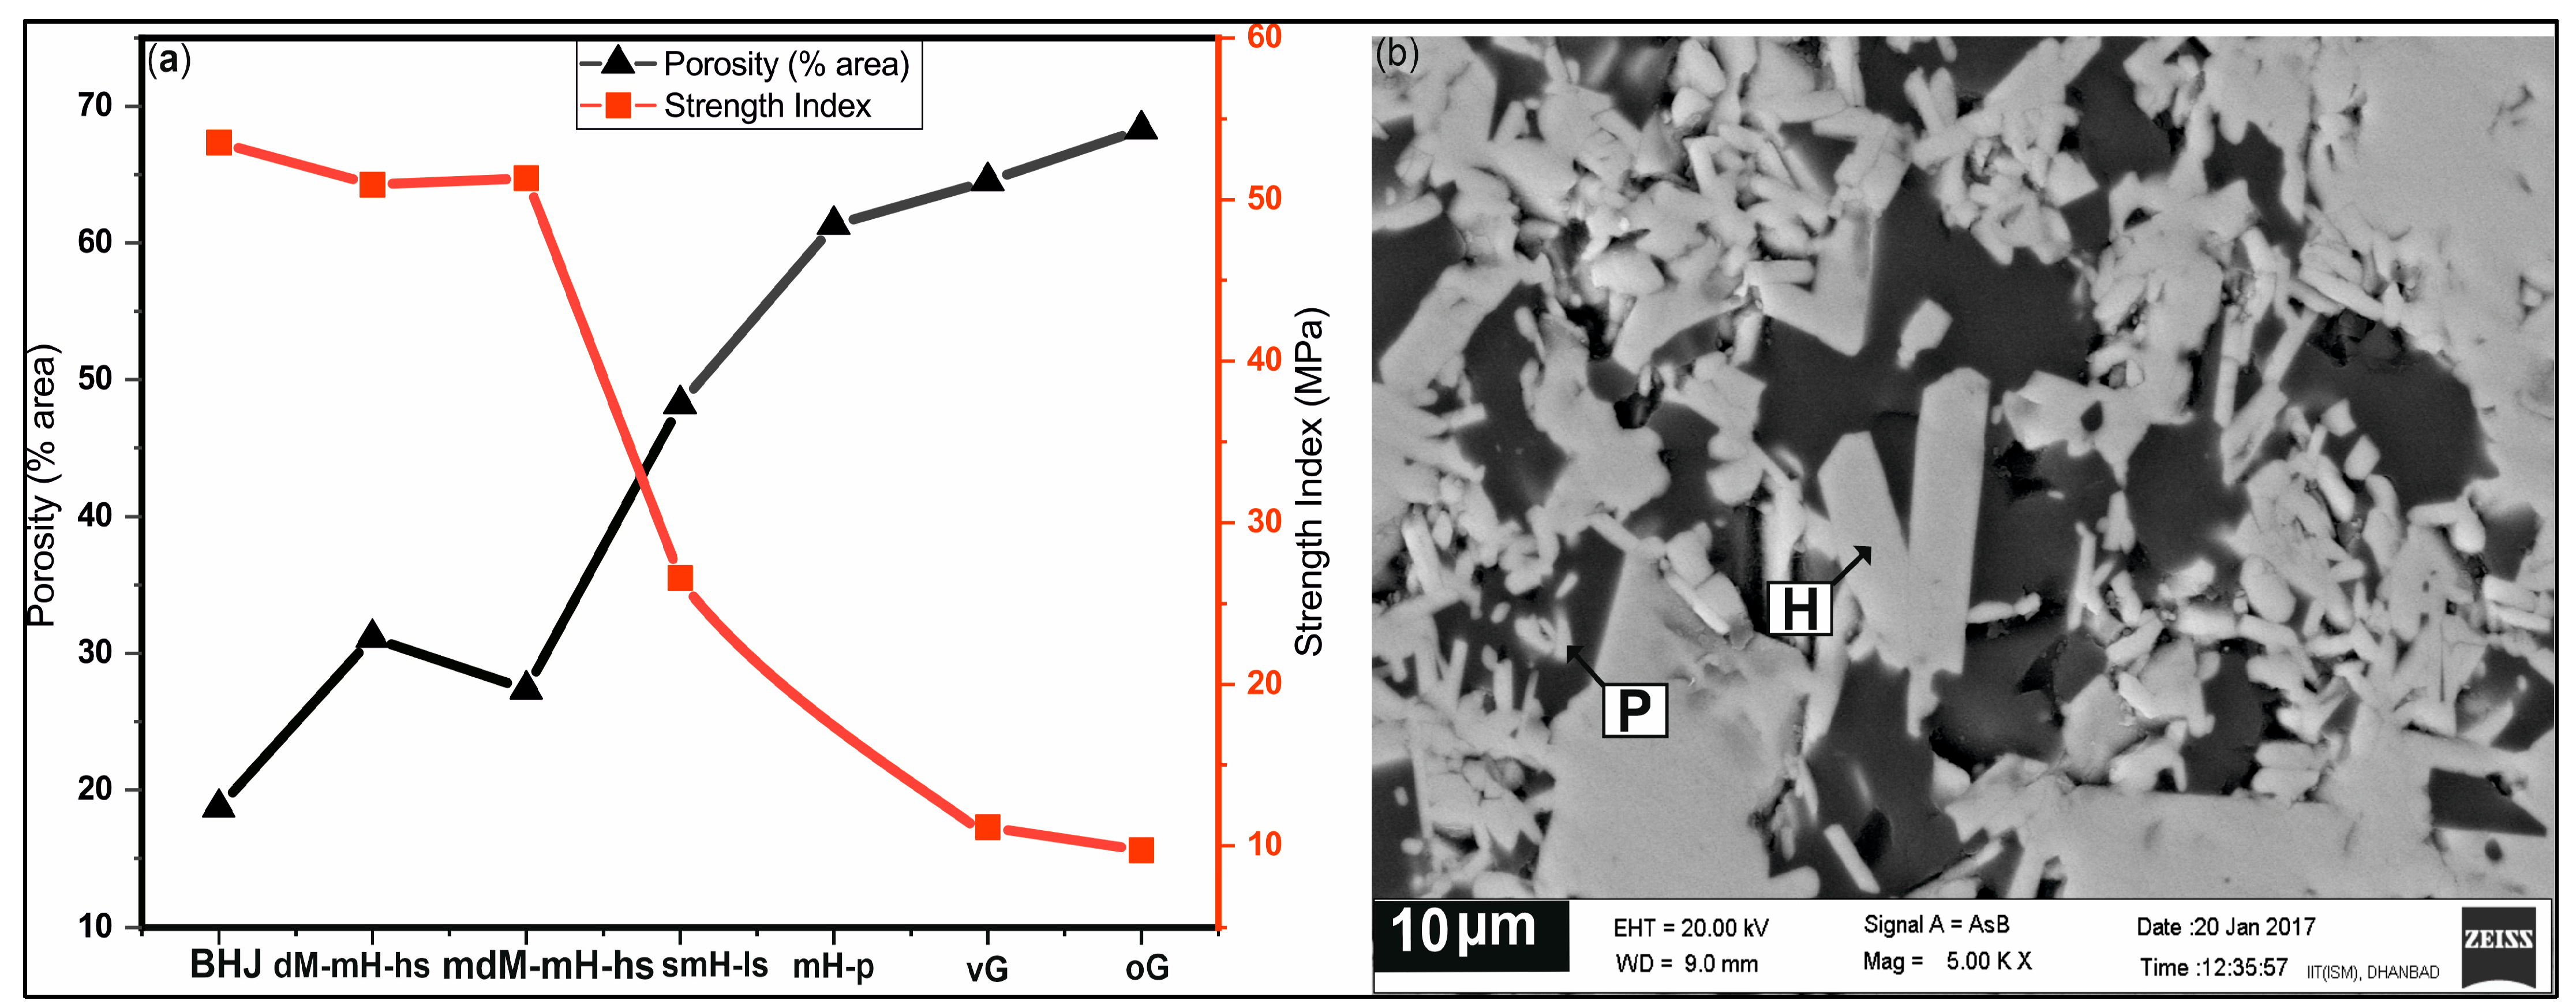
3.1.3. Strength and Porosity of Ore Variants

The uncorrected point load strength index (Is) of representative cubic specimens of size close to 10 mm (corresponding to De2 of 127–170 mm2) was measured for the designated ore variants. Is-value of BHJ, dM-mH-hs ore, and mdM-mH-hs ore is the highest in the range of 50–54 MPa, while that of smH-ls ore is 27 MPa and that of oG and vG is 10–11 MPa (Table 2, Figure 5a). Due to limitations in preparing a compact specimen of 10 mm size from mH-p, the strength index data were generated for a specimen of 5 mm size, which was found to be very low (7.8 MPa). The strength index decreases as pore area (porosity) measured with image analysis increases in the designated ore variants. For mineralogically similar ore types, dM-mH-hs ore has higher strength than smH-ls ore, which correlates with lower porosity (Figure 5a). The shatter index [SI (+10 mm)] for typical run-of-mines variants (ROM variants) ROM-HIO, ROM-SSIO, ROM-LIO, and ROM-PBD are 91.8, 88.8, 91.3, and 77.4%, respectively. Though the trend is supportive in terms of porosity in ROM-HIO, ROM-SSIO, and ROM-PBD, except for ROM-LIO, which shows an anomalous response, this may be due to mineralogical heterogeneity.

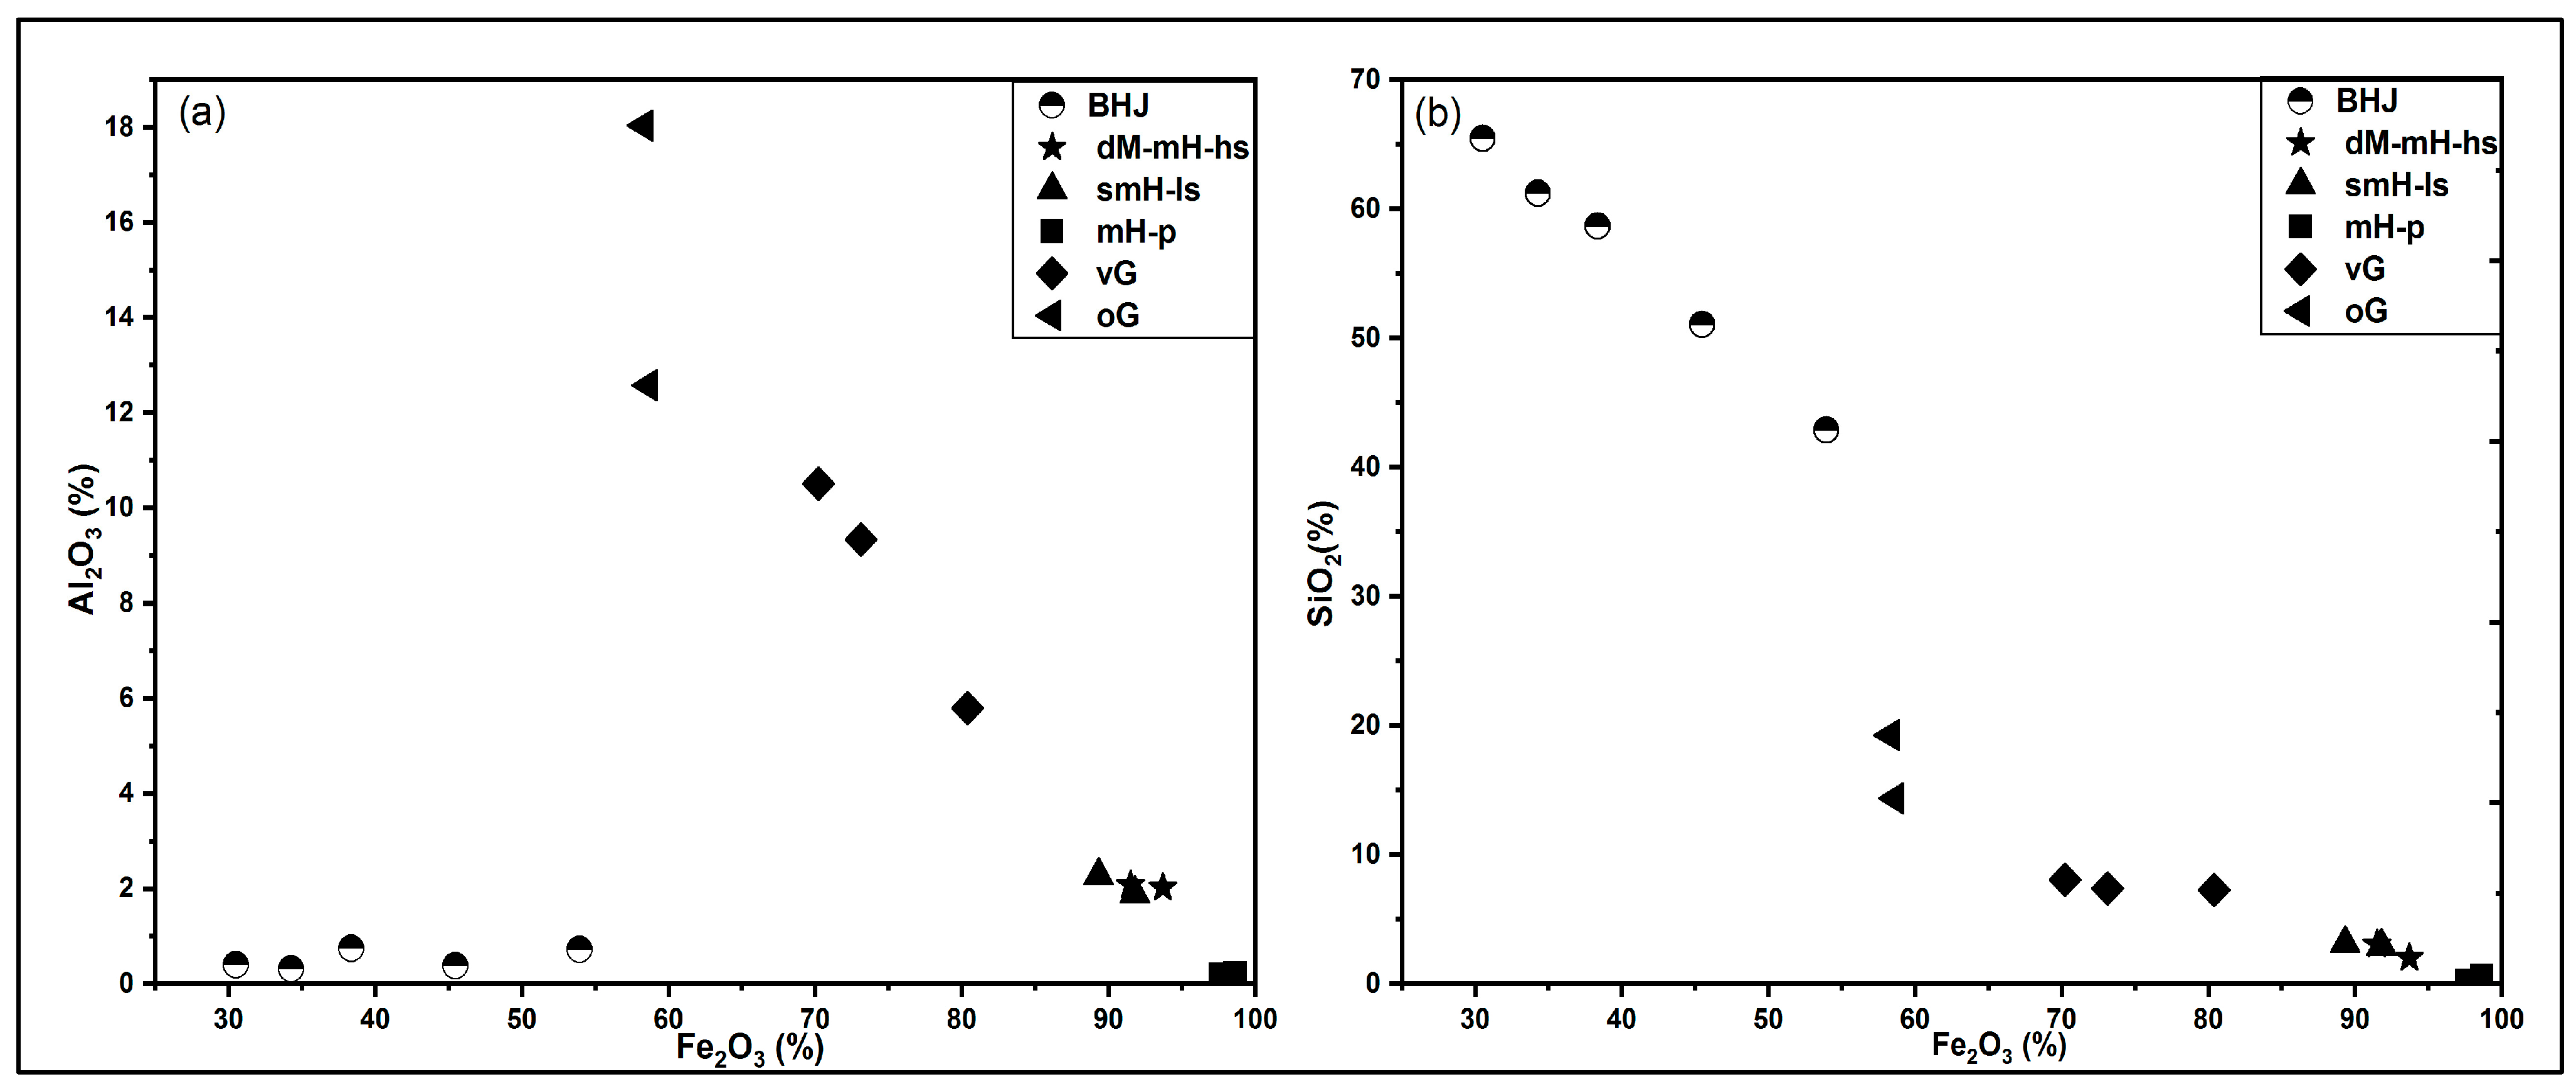
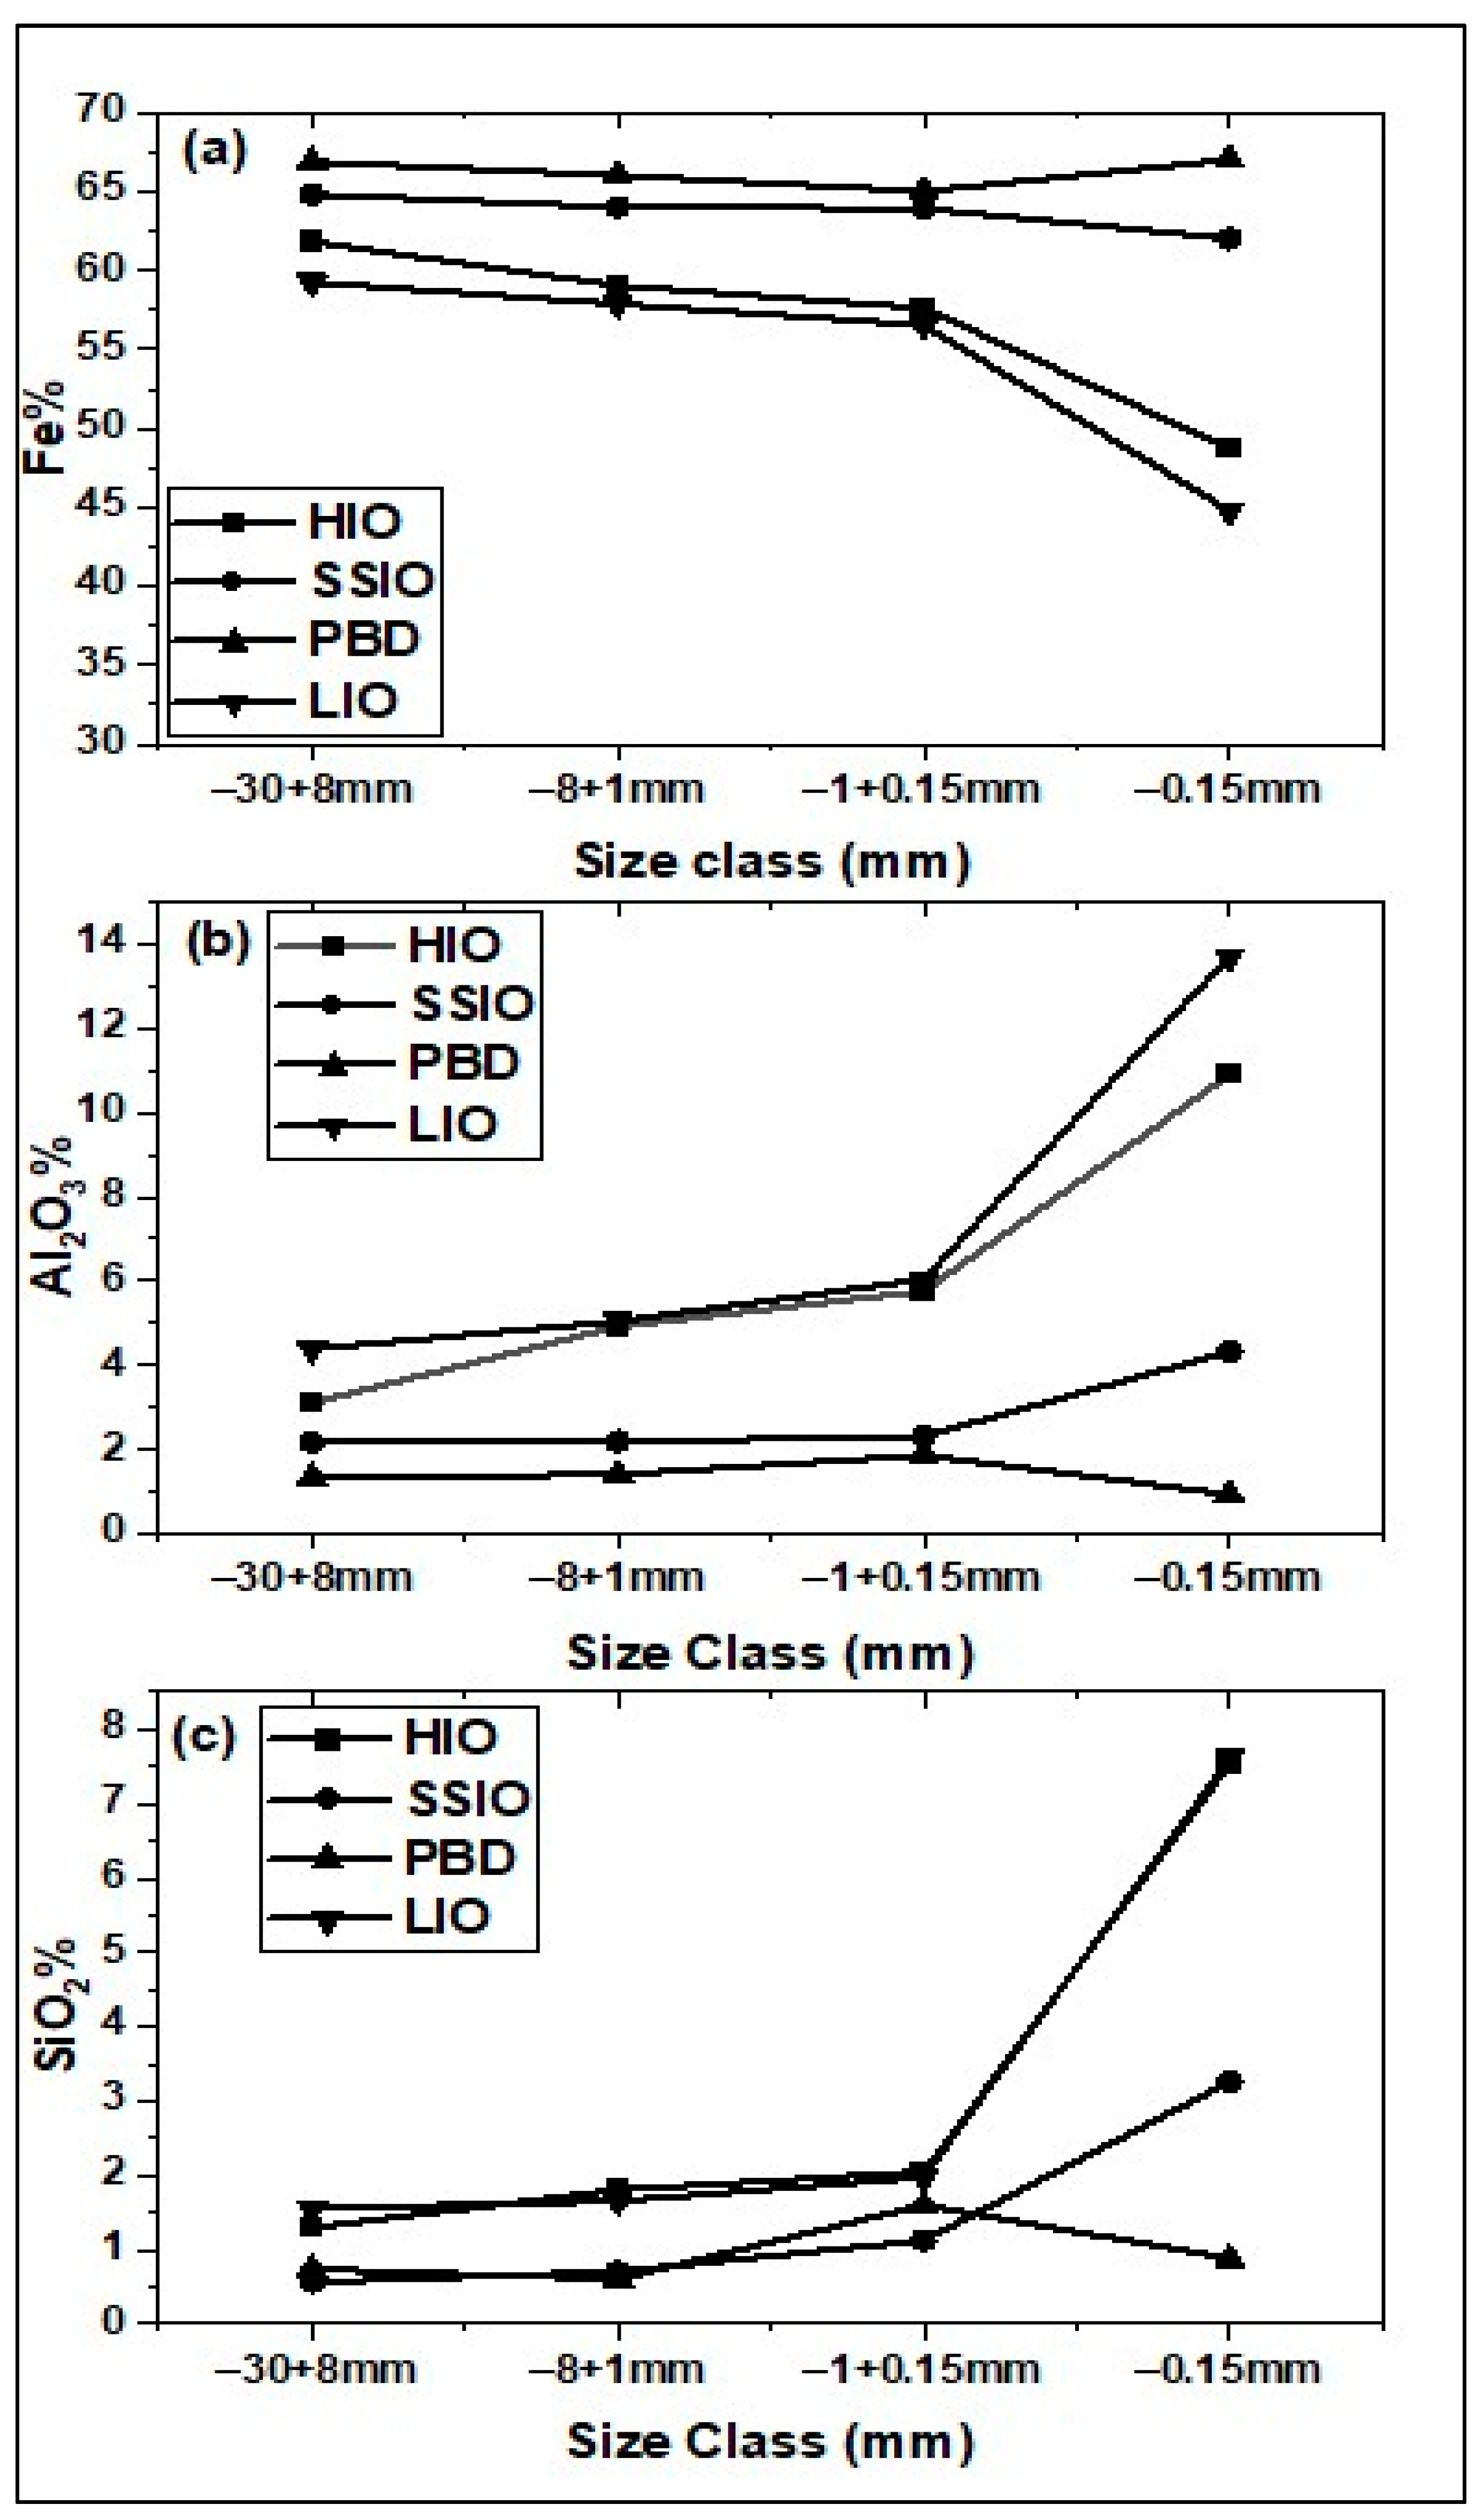
3.2. Geochemical Variations in Different Designated Iron Ore Variants

EPMA data suggest that irrespective of ore variants, hematite contains about 99% of Fe2O3 (about 69.5% Fe), with a variation in SiO2 and Al2O3 contents in the range of 0.2%–0.6% and 0.2%–0.3%, respectively (Table 3). Hematite is occasionally altered to a mineral variant equivalent to hydrohematite and low alumina goethite with 84%–94% Fe2O3 (about 59%–65.6% Fe), 0.6%–0.9% Al2O3, and 0.8%–1.1% SiO2. This suggests that ore minerals with hematite and their altered variants may contain silica and alumina, each below 2%. It is reflected in the major element data of designated ore end members/variants dM-mH-hs ore, smH-ls ore, and mH-p ore, suggesting them to be of high grade (Table 3 and Figure 6), wherein hematite and martite are the dominant phases. In contrast, the mineral chemistry of ochreous goethite is complex, as the alumina content is in the range of 0.2% to 20% and silica is in the range of 2.7% to 23% (Table 1). It may be categorized as low-Al-goethite with 53% Fe, high Al-goethite with about 8% alumina and 9% silica, whereas the high Al-Si-goethite with >15% silica and alumina each is of gangue category. Thus, designated vG ore and oG ore with significant ochreous goethite minerals will be low-grade ores. The bulk chemistry of designated vitreous goethitic ore contains 80% Fe2O3 with 6%–10% Al2O3 and 7%–8% SiO2 (Table 3), and is of low grade. Though it includes altered hematite and less content of alumina goethite, the high contents of alumina and silica in bulk ore may be contributed by quartz, kaolinite, and high alumina goethite (e.g., ochreous goethite, and colloform goethite), which is found in ochreous goethitic portions of the ore. The designated ochreous goethitic ore (oG ore) contains 58% Fe2O3, 12%–18% Al2O3, 14%–19% SiO2, and high content of P2O5 in the range of 0.16%–0.24% (Table 3, Figure 6), and is of low grade. The very high content of silica and alumina, each above 12%, makes it unsuitable for iron-making in present-day technology. BHJ, composed of hematite and jasper, has a high amount of silica in the range of 51%–65%, Fe2O3 in the range of 38%–54%, and very low alumina content in the range of 0.3%–0.8%, as represented by the data of sample BHJ3 in Table 3 and Figure 6. Hematite and martite are the major iron-bearing minerals, with a minor amount of goethite and kaolinite, and with quartz being the major gangue mineral; their mineralogical abundance and mineral chemistry have a control on the bulk chemistry of the iron ore variants. The positive correlation of Al2O3 with SiO2 and their inverse proportionality to Fe2O3 (Figure 6) suggests that kaolinite and high-Al-goethite/low-Al-goethite may be responsible for the Al content in the ore, except in BHJ. Silica varies inversely with Fe2O3 in all iron ore variants pertaining to the association of kaolinite and quartz, whereas that in BHJ is related to the hematite/quartz ratio.

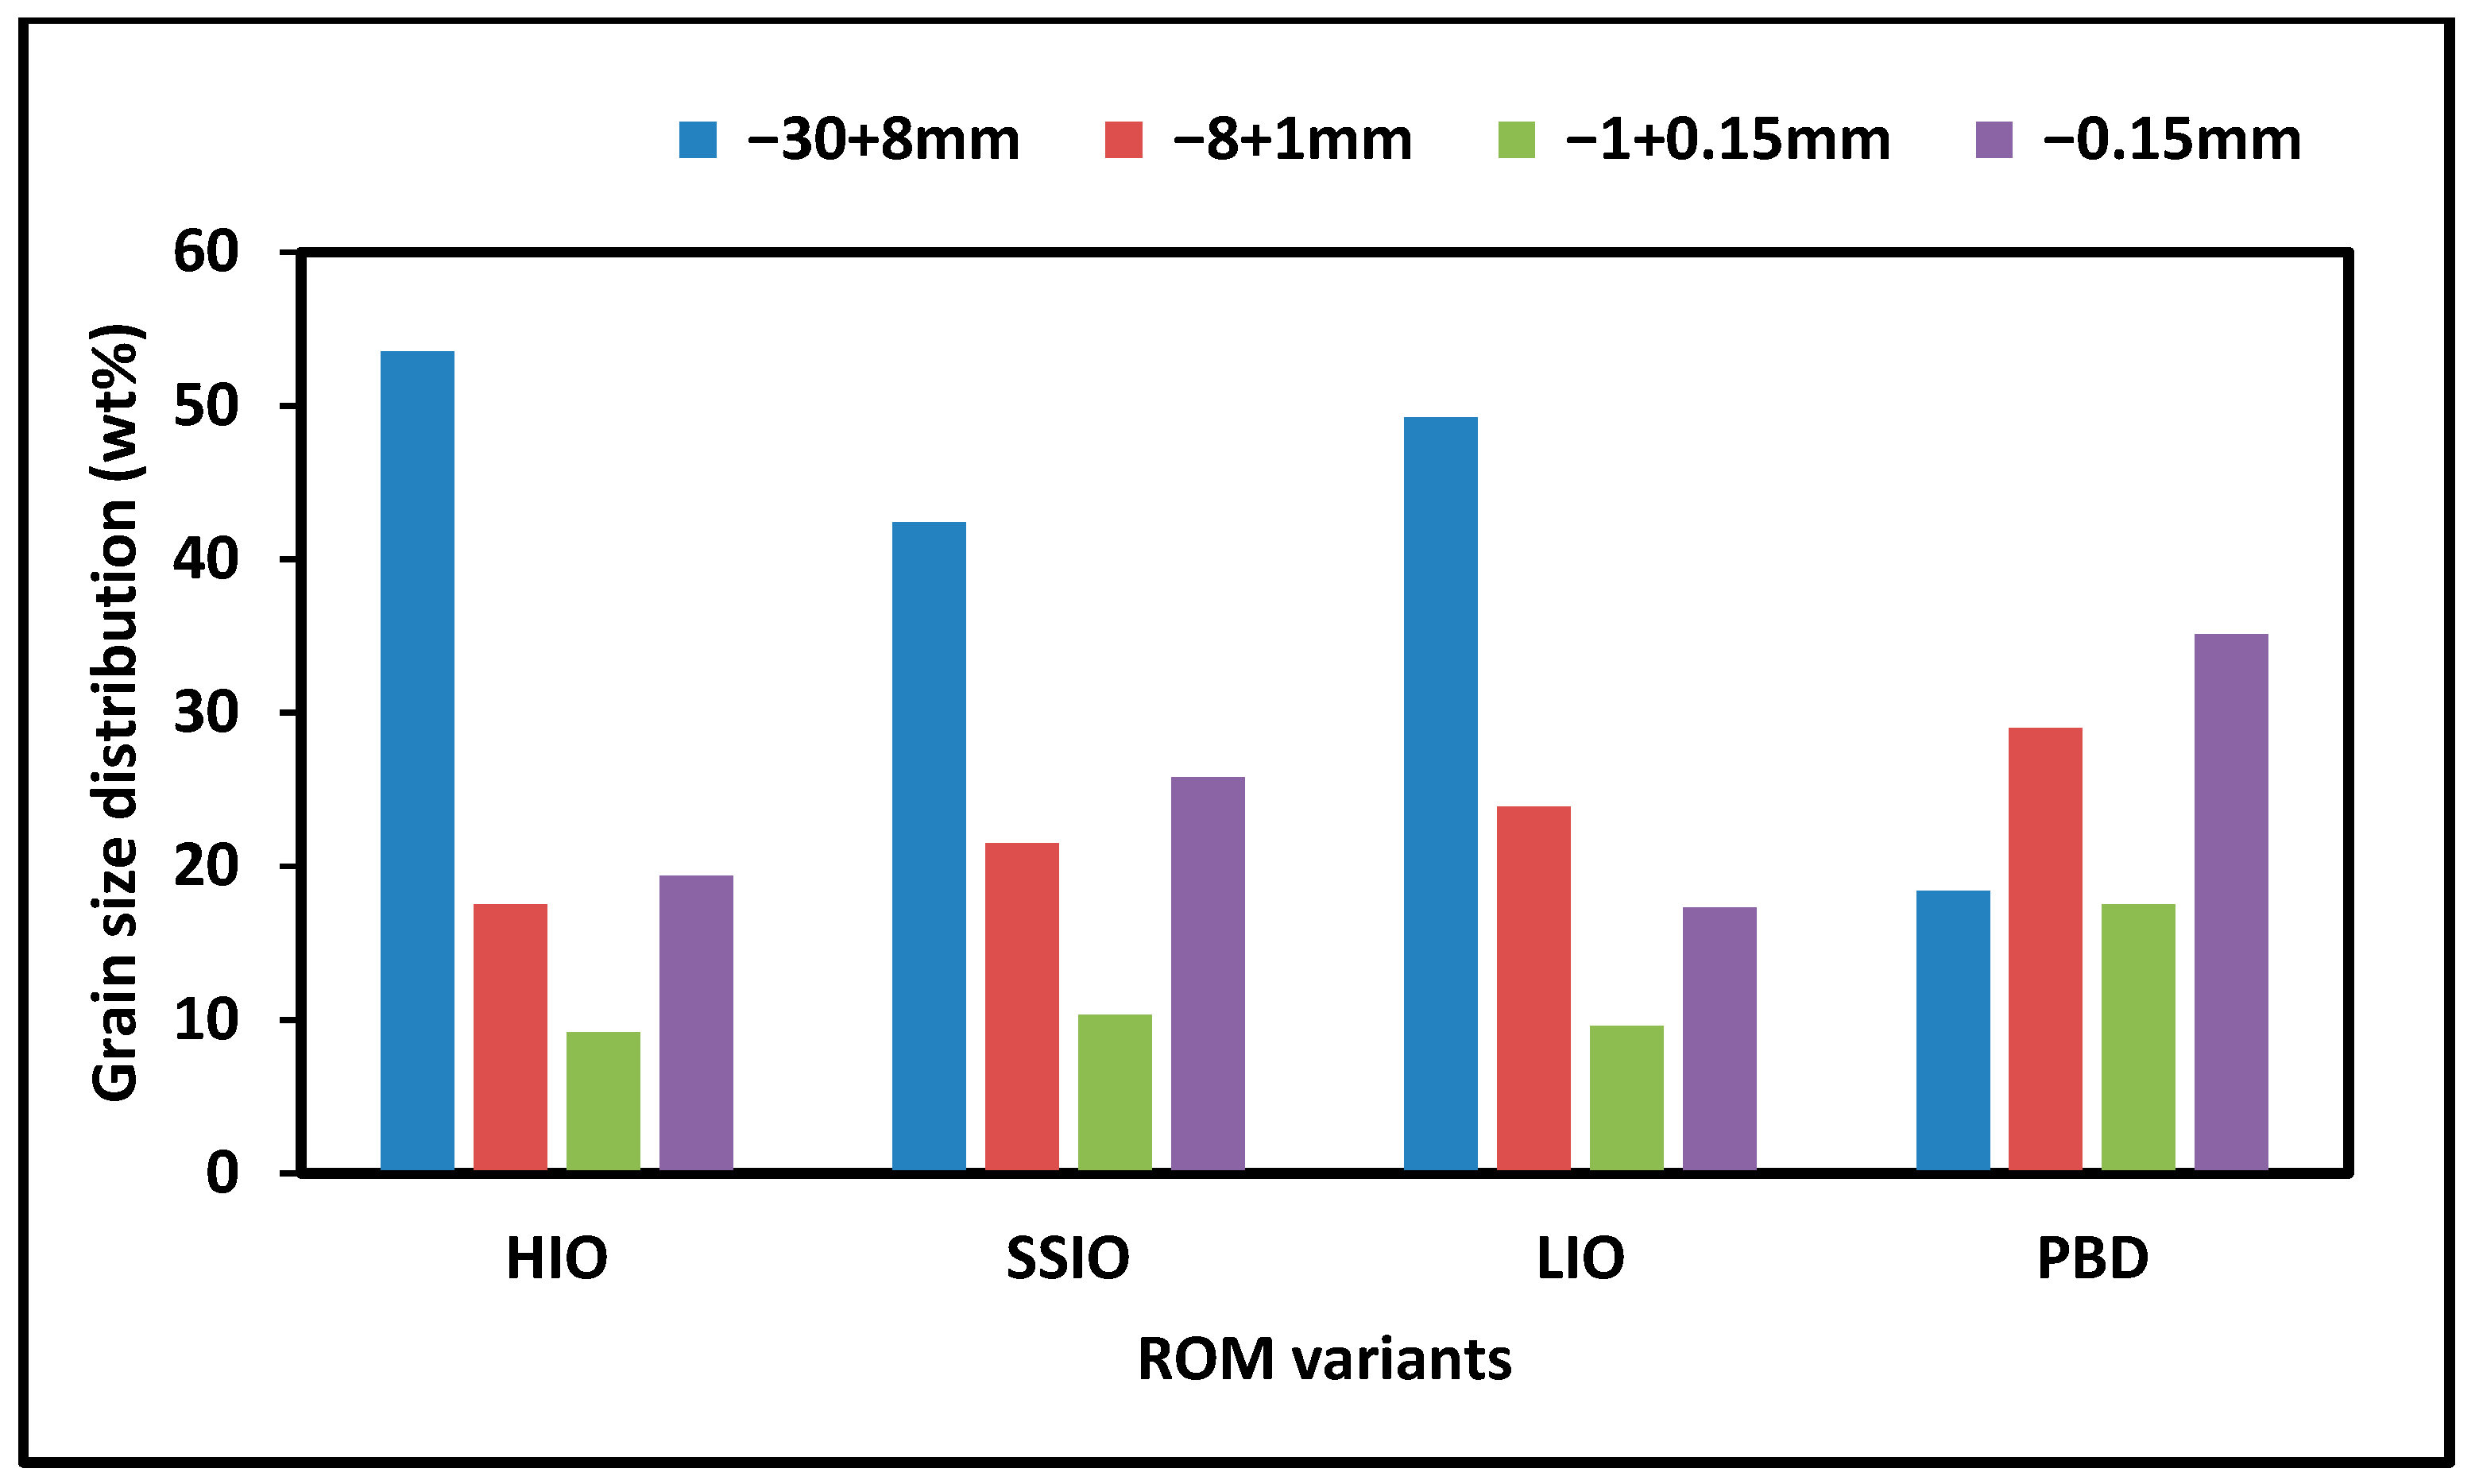
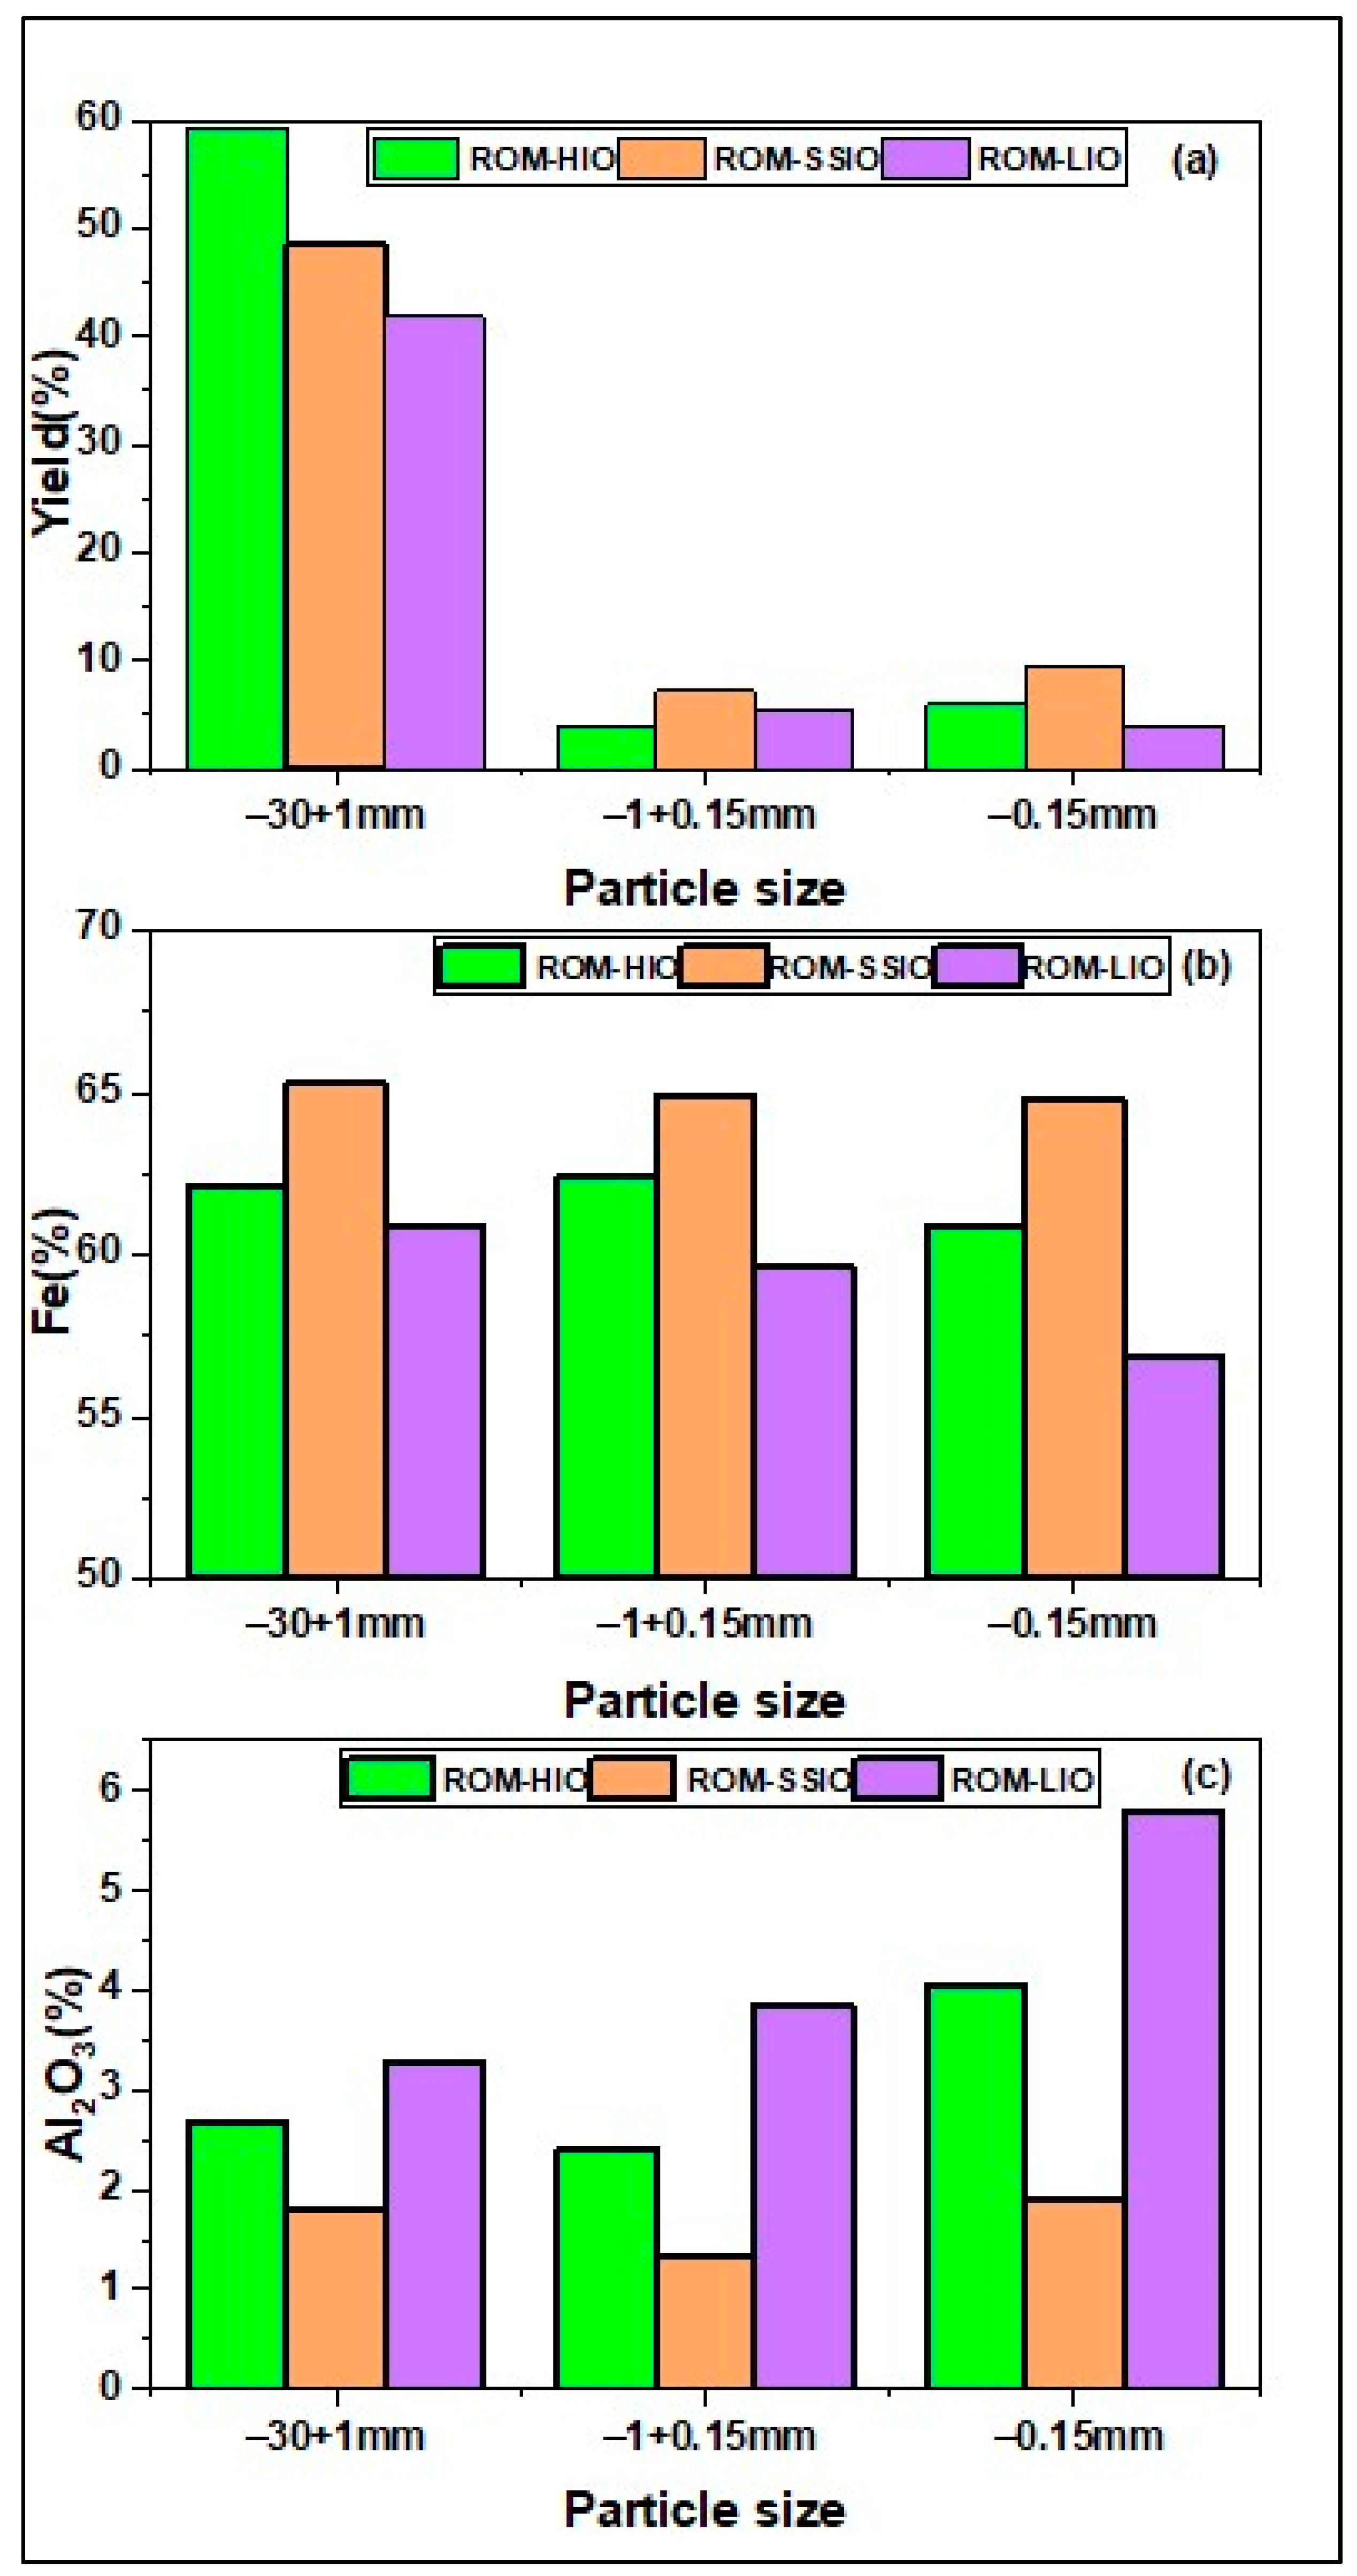
3.3. Run-of-Mines (ROM) Variants and the Ore Quality

dM-mH-hs ore and mdM-mH-hs ore are hard ores of high grade (Fe > 64%). The smH-ls is a low-strength ore of high grade (Fe = 62%–64%), and mH-p ore is a powdery ore of high quality (Fe >68%). Ochreous goethitic ore and vitreous goethitic ores are low-strength ores of low quality (Fe = 41%–56%). However, in a mining operation, various degrees of combination result in ROM of various grades and chemical characteristics. Typical ROM hard iron ore (ROM-HIO) is expected to be an ore of high-strength designated variants such as dM-mH-hs ore and mdM-mH-hs ore with minor smH-ls ore, but may contain a minor amount of oG and vG ore belonging to laterite cap rock; ROM schistose soft iron ore (ROM-SSIO) is expected to be a dominant smH-ls ore with a minor amount of dM-mH-hs- and mH-p ore; ROM powdery blue dust (ROM-PBD) is expected to be major mH-p ore with a minor amount of smH-ls and dM-mH-hs end members; ROM lateritic iron ore (ROM-LIO) is expected to be dominant with oG and vG ore end members with a minor amount of dM-mH-hs and smH-ls end members. Typical ROM hard iron ore (ROM-HIO), ROM schistose soft iron ore (ROM-SSIO), ROM powdery blue dust (ROM-PBD) and ROM lateritic iron ore (ROM-LIO) generated in these mines of Singhbhum-Keonjhar-Bonai region are found to contain Fe 58.31, 63.82, 66.6, and 56.15%, respectively (Table 3) with corresponding alumina content of 5.28, 2.74, 1.14, and 6.31%, respectively (Table 3). The Fe assay in ROM-HIO and ROM-LIO is very close, though the former is expected to contain high-strength iron ore variants occurring in the upper part of the profile in the mines. However, oG ore and vG ore that form the laterite capping in the uppermost part of the profile has a greater possibility to get admixed with dM-mH-hs ore, mdM-mH-hs ore and smH-ls ore occurring just below it. Any combination of these variants may lead to complex ore quality of ROMs. So, there is a possibility of dilution in Fe content and enhancement in Al2O3 content by admixture of closely associated or juxtaposed low grade ores in the mines. In the present context, ROM-PBD, with 66.66% Fe and 1.14% Al2O3, is a high-grade ore that meets the feed grade for blast furnace application, sintering, or pelletization.
The shatter index [SI (+10 mm)] for typical run-of-mines variants (ROM variants) ROM-HIO, ROM-SSIO, ROM-LIO, and ROM-PBD are 91.8, 88.8, 91.3, and 77.4%, respectively. The trend of shatter index in relationship to ‘uncorrected point load strength index (Is)’ corroborates in terms of porosity in ROM-HIO, ROM-SSIO, and ROM-PBD, all hematite-dominated ore-variants, except ROM-LIO, which shows an anomalous response. The shatter index of ROM-LIO, very close to that of ROM-HIO, is indicative of the admixture of some high-strength variants of high grade (e.g., dM-mH-hs ore and mdM-mH-hs end members) in the former. The shatter index is interpreted as shatter resistance, which is largely a function of the physical hardness or strength of bulk ore. Since ROM-HIO is a high-grade hematitic ore with a higher population of dM-mH-hs ore, mdM-mH-hs ore end members, it has higher shatter resistance than ROM-SSIO and ROM-PBD.

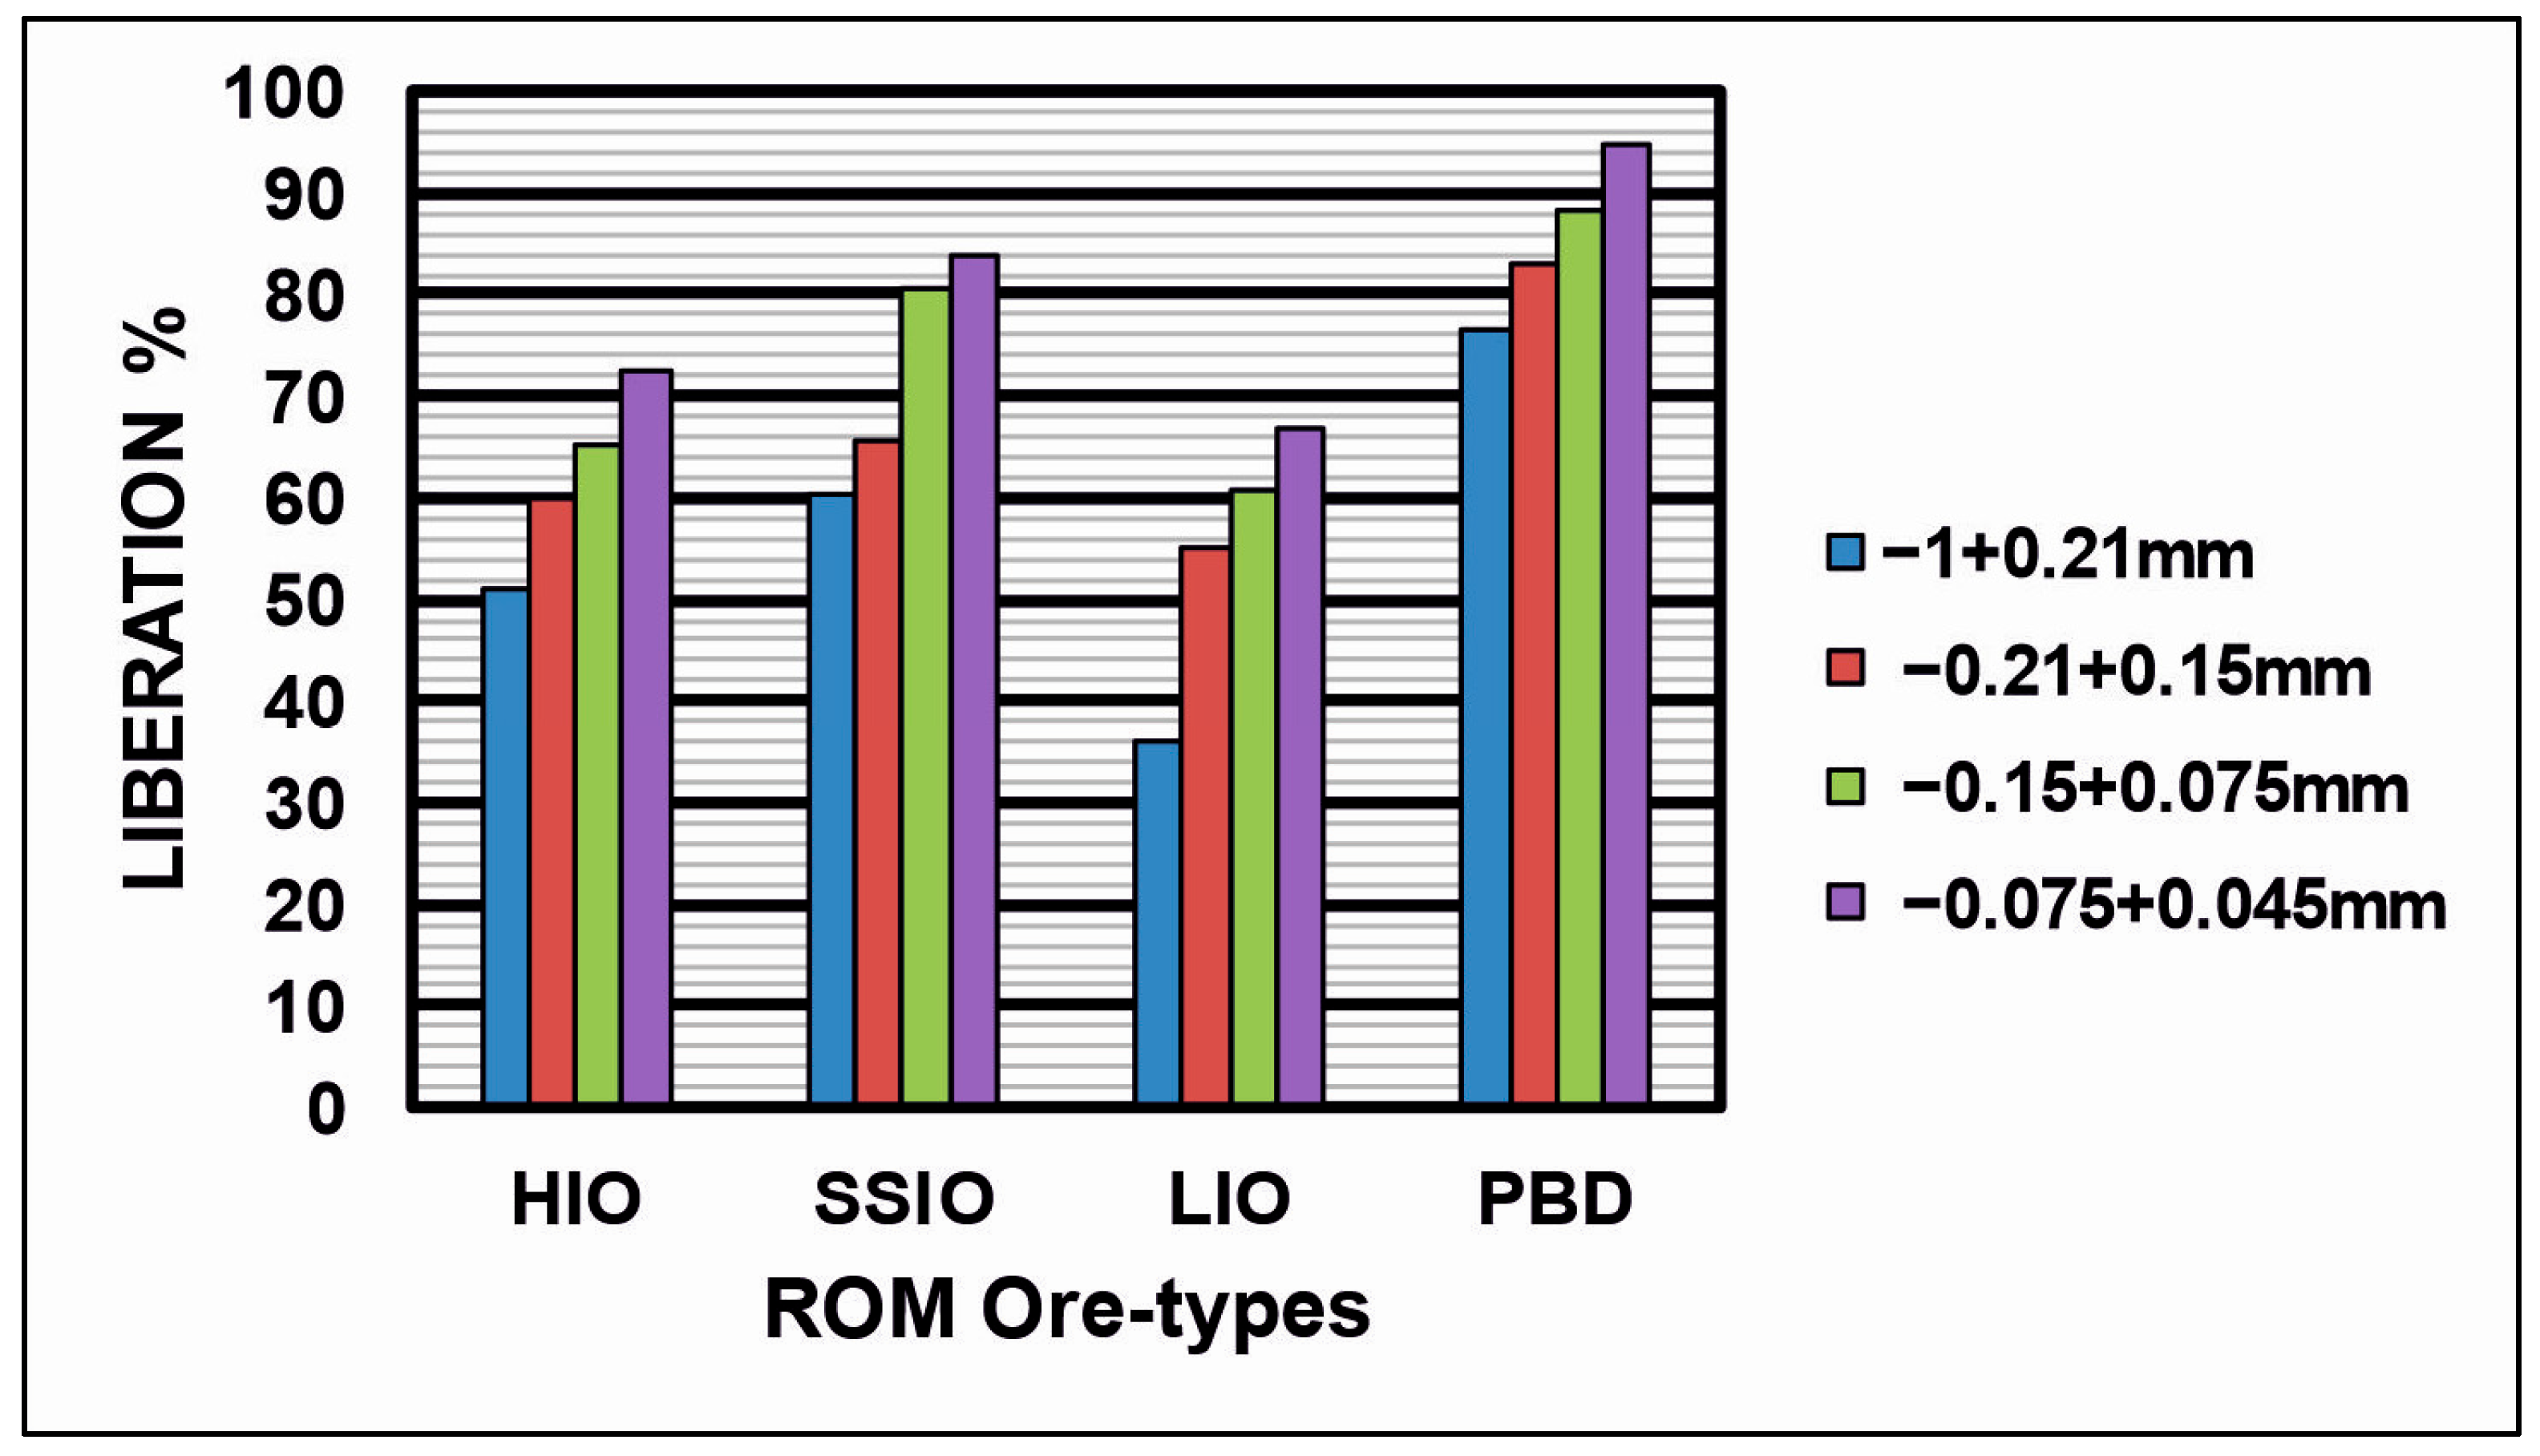
3.4. Ore Types and Their Geometallurgical Characteristics

In mineralogical terms, the designated ore-types dM-mH-hs ore, mdM-mH-hs ore, smH-ls ore, and mH-p ore are rich in hematite, and are of high grade with Fe content higher than 62% and a minor variation in silica and alumina content. The mH-p ore contains more than 68% Fe, <0.7% silica, and <0.2% alumina, but 70% of its grain has sizes smaller than 25 µm. Due to its fine grain size and high Fe content, mH-p ore requires selective mining for direct use as pellet feed. smH-ls ore containing 62%–64% Fe, 2.9%–3.1% silica and 1.8%–2.28% alumina may require beneficiation.
dM-mH-hs ore contains 64%–65% of Fe, 2%–3% of SiO2, and 2.02%–2.08% of Al2O3. As it has marginally high SiO2 but Al2O3 content close to 2%, it may contribute to coarse-grained lumps. In the similar context, coarse fraction of smH-ls end members may meet quality requirement of lump ore.The hematitic fines from these ores and mH-p may contribute to pellet and sinter making.
Designated ochreous goethitic ore with about 41% Fe, 14.3%–19.3% SiO2, 12.6%–14.4% Al2O3 is an extremely low-grade ore. As it is exclusively a goethite mineral, specifically high Al-goethite type or high Al-Si-goethite type associated with kaolinite and quartz, there is no possibility of generating a high-grade concentrate through beneficiation. It can be considered as a reject as per the threshold value (<Fe 45%) of iron ore as recommended by Indian Bureau of Mines (IBM), unless a new beneficiation technology is evolved.
Designated vitreous goethitic ore (vG ore end member) with about 51%–56% Fe and 7.3%–8% SiO2, 5.8%–10.5% Al2O3 is a low-grade iron ore with high alumina content. The associated altered hematite/hydrohematite and low-Al-goethite, if liberated, will be potential minerals for a moderate-grade concentrate. Colloform clay band/lamellae with 5 to 6 µm thick and 15–20 µm thick goethite in ochreous goethites indicates intimate goethite-clay association for which the liberation is possibly below 25 µm. A further investigation may be required for developing a beneficiation strategy to recover a concentrate of colluvial hematite or altered hematite/hydrohematite from such goethite ore [33]. BHJ is a very low-grade ore (overall Fe < 35%) of high strength and is a reject at present, and it may require evaluation with futuristic technology for beneficiation and upgradation.

Liberation

Typical high-grade hematitic ROM such as ROM-HIO, ROM-SSIO, ROM-PBD, and goethite-rich ROM-LIO generated via mining were subjected to liberation study and beneficiation study for the validation of observations made on ‘designated ore end members’. The liberation study on ROM variants of size −1 mm reveals that in a given ROM, poorer liberation is observed in the coarser fractions compared to the finer fractions (Figure 7). The extent of liberation in a given size is the lowest in ROM-LIO and is successively higher in ROM-HIO, ROM-SSIO, and is the highest in ROM-PBD. Liberation in the size fraction −0.075 + 0.045 mm was found to be 64% in ROM-LIO, whereas it was about 72% in ROM-HIO and 84% in ROM-SSIO. It suggests that the ores must be sized below 0.075 mm for effective liberation and recovery. Optical microscopic observation on oG ore shows the close association of ochreous goethite and kaolinitic clay in 0.025 thick microns lamellar colloform structure, indicating liberation below 25 microns in ROM-LIO. In contrast, effective liberation above 80% is observed in the size class of −0.15 + 0.075 mm in ROM-SSIO and the size class of −0.075 + 0.045 mm in ROM-PBD. These liberation findings may aid in optimizing the processing techniques for better mineral recovery and beneficiation outcomes.

3.5. Amenability to Beneficiation

3.5.1. Scrubbing and Classification

The scrubbing and classification of ROM variants lead to differential grain size and element deportment. The preferential deportment of coarser particulates or lumps (−30 + 8 mm and −8 + 1 mm) is observed in HIO and LIO. In contrast, there is a significantly high population of finer size particles in the case of ROM-SSIO and ROM-PBD (Figure 8). The ratio of the distribution of particles of −30 + 1 mm to that of −1 mm is close to 60:40 and 50:50 (Figure 9) in ROM-SSIO and ROM-PBD, respectively. It also results in (Figure 9) the preferential deportment of Al2O3 and SiO2 to finer size, more specifically to −0.15 mm fraction in the case of all ROM variants, except ROM-PBD, wherein there is a preferential deportment of Fe. Scrubbing and washing improves the grade of SSIO and PBD to Fe ≥ 65%, whereas for size class −30 + 1 mm in HIO and LIO, it may improve to Fe ≥ 60%. This suggests that desliming enhances the grade of ROM in general. The anomalous response of ROM-PBD showing lower deportment of alumina and silica but Fe > 65% in −0.15 mm fraction is due to the presence of mH-p, a high-grade iron ore variant with 75% of particle size below −0.025 mm.

3.5.2. Response of ROM Variants to Beneficiation

The classified ROM-HIO, ROM-SSIO, and ROM-LIO of coarse size (−30 + 1 mm), fine size (−1 + 0.15 mm), and very fine size (−0.15 mm) were subjected to jigging, tabling and wet–high-intensity magnetic separator (WHIMS), respectively, to evaluate their amenability to beneficiation. Jigging of −30 + 1 mm size improves the grade to >Fe 62% in HIO and SSIO, but it is about 60% Fe in the case of LIO jig concentrate with a yield of about 40% (Figure 10b). While Al2O3 content is <2.5% in the jig concentrate of HIO and SSIO, it is about 3% in the concentrate of LIO. Gravity separation of −1 + 0.15 mm fraction via tabling (Figure 10a) shows concentrate containing >Fe 62% for HIO and SSIO fines and about 60% Fe for LIO fines (Figure 10b).
The fines of −0.15 mm size respond to WHIMS when a hydrocyclone underflow is used. A concentrate with >60% Fe is achieved from HIO and SSIO-type ROM variants. However, concentrate from the same size class of ROM-LIO can be upgraded to only about 57% Fe (Figure 10b). The ROM-LIO concentrate contains about 6% Al2O3, which is approximately two times higher than the magnetic concentrate from ROM-HIO and ROM-SSIO (Figure 10c). The overall yield of −30 + 1 mm size is the highest (about 60%) in ROM-HIO compared to others, whereas that of −1 + 0.15 mm and −0.15 mm is higher in ROM-SSIO (Figure 10a). The grade of concentrate from all sizes is close to 65% in ROM-SSIO.
Liberation in size fractions below 1 mm successively enhances from ROM-LIO, ROM-HIO, ROM-SSIO, to ROM-PBD (Figure 7). In ROM-LIO, liberation is poor, which is about 36% in size class −1 + 0.21 mm, improving only to 60% in size class −0.15 + 0.075 mm and to ~65% in size class −0.075 + 0.045 mm. It suggests a lower yield of −0.15 mm for LIO, but the grade Fe < 60% (Figure 10a) indicates the deportment of a significant amount of complex goethite mineral in the concentrate. It suggests that if other ROMs are partly admixed with the ROM-LIO variant, their amenability to beneficiation may deteriorate.

4. Conclusions

In banded iron formation (BIF)-hosted iron ore in eastern India, this study could identify six justifiable designated iron ore end members named as dM-mH-hs ore, mdM-mH-hs ore, smH-ls ore, mH-p ore, oG ore, and vG ore, which are rather distinct in mineralogy, porosity, strength, and mineral chemistry. The data reveal the complex mineral chemistry of goethite and associated altered hematite, which is rarely published and documented in a geometallurgical approach. High-grade hematitic ROM of hard (ROM-HIO), soft (ROM-SSIO), powdery (ROM-PBD), and goethite-dominated ROM-LIO were observed to have different bulk chemistry, mineralogy, liberation characteristics and amenability to beneficiation.
The designated end members dM-mH-hs, mdM-mH-hs, smH-ls, and mH-p are distinct mineral hematite-martite and microplaty hematite with varied extents of microporosity. Enhanced microporosity is associated with microplaty hematite with length to height ratio of 2:1. Microporosity lowers the strength of ‘ore end members’, and upon further enhancement in microporosity, the ore becomes fragile and turns powdery as in a mH-p end member. Thus, microstructure and microtexture affect ore’s physical strength and are supported by the shatter index of ROM types ROM-HIO, ROM-SSIO, and ROM-PBD.
The dominance of high-grade end members dM-mH-hs, mdM-mH-hs, and smH-ls lead to high-grade ROM like ROM-HIO, ROM-SSIO, and ROM-PBD with high liberation characteristics and better amenability to beneficiation. However, considering the bulk chemistry of ROM-PBD, its scrubbed products can be directly used as blast furnace feed (lump), and its fines can be used as sinter feed and pellet feed.
The designated end members oG ore and vG ore are closely associated with goethitic ores forming lateritic capping, wherein occasional conga or colluvial partly altered hematite occurs in the mines. These ore end members are high porosity, low strength, low iron assay, and chemically complex goethite minerals, associated with kaolinitic clay. The ROM-LIO has an anomalously higher shatter index comparable to ROM-HIO, which may be related to high-strength hematite end members admixed during mining. The ROM-LIO exhibits relatively poor liberation, and generates concentrates of lumps and fines assaying 60% Fe and above 3% alumina, sometimes even 6% in case of fines with 0.15 mm size and low yield. Such high alumina is due to the presence of chemically complex high-Al ochreous goethite and high Al-Si ochreous goethite in the ore. So, any ore admixed with ROM-LIO will have poor amenability to beneficiation. The ROM fines of 0.15 mm subjected to desliming and wet magnetic separation generate a concentrate of desired quality in the case of ROM-SSIO, but the generation of a concentrate with higher alumina (about 4% alumina) in the case of ROM-HIO admixed with goethite component and a concentrate with very high alumina (alumina > 5.5%) in ROM-LIO indicate the role of complex goethite.
Though iron ore is mined and used as a commercial mineral commodity, there is a diverse range of raw materials and size characteristics which are a result of the geochemical, mineralogical, and textural characteristics of the designated end members in the ROM type generated during mining. The designated end members present in the ROMs control liberation, process mineralogical and geometallurgical characteristics. Thus, the beneficiation strategy that is to be adopted for mineral product and quality (lumps, sinter feed, pellet feed, etc.) can be assessed by evaluating the ROM types and the designated ore variants present.

Author Contributions

C.R.M.: Conceptualization, Data curation, Sample collection, Methodology, Data generation, Software, visualization, Writing—original draft. P.R.S.: Data curation, supervision, Resources, Visualization, writing—review and editing. M.K.M.: Conceptualization, Formal analysis, Data curation, Funding acquisition, Investigation, Methodology, Visualization, Resources, Writing—review and editing, Co-supervision for image analysis, point load test, ore designation. R.K.R.: data curation on beneficiation, formal analysis, visualization, review, and editing. S.D.: Data curation on beneficiation, resources, visualization, review and editing. S.K.T.: review and editing, visualization, Funding acquisition. J.P.: Investigation, Sample collection, software, A.S.V.: investigation, review and editing, Co-supervision. All authors have read and agreed to the published version of the manuscript.

Funding

The part of the research work funded by IIT(ISM)-Junior Research Fellowship and CSIR-NML project HCP28WP1.

Data Availability Statement

Not applicable.

Acknowledgments

The authors are thankful to the Director, CSIR-NML, Jamshedpur, and Director, IIT (ISM) Dhanbad for the permission to publish the work. Permission and logistic support from Rungta Mines Limited to collect ore samples from Jajang and Kashia Mines is thankfully acknowledged. The authors are thankful to anonymous reviewers. The work was supported by IIT (ISM)-JRF fellowship to C.R Mahanta. Experimental works on XRD, XRF was carried out at CSIR-IMMT, that on EPMA, FESEM at CRF, IIT (ISM), and that on optical image analysis, point load test was carried out at CSIR-NML supported by project fund HCP28WP1.

Conflicts of Interest

The authors declare that they have no known competing financial interest or personal relationship that could have appeared to influence the work reported in this paper.

References

  1. National Steel Policy. Available online: https://steel.gov.in/sites/default/files/policy1_0.pdf (accessed on 8 September 2022).
  2. Goldring, D.C. Iron Ore Categorisation for the Iron and Steel Industry. Appl. Earth Sci. 2003, 112, 5–17. [Google Scholar] [CrossRef]
  3. Pownceby, M.I.; Hapugoda, S.; Manuel, J.; Webster, N.A.; MacRae, C.M. Characterisation of Phosphorus and other Impurities in Goethite-Rich Iron Ores–Possible P Incorporation Mechanisms. Miner. Eng. 2019, 143, 106022. [Google Scholar] [CrossRef]
  4. Nunna, V.; Suthers, S.P.; Pownceby, M.I.; Sparrow, G.J. Beneficiation Strategies for Removal of Silica and Alumina from Low-Grade Hematite-Goethite Iron Ores. Miner. Process. Extr. Metall. Rev. 2022, 43, 1049–1067. [Google Scholar] [CrossRef]
  5. Rao, N.D.; Chakraborty, D.P.; Shukla, V.; Kumar, N. Iron Ore Beneficiation: An Overview. Miner. Process. 2023, 55–77. [Google Scholar] [CrossRef]
  6. Denzel, M.; Prenner, M.; Sifferlinger, N.A. Development of an Automated Single Particle Impact Tester for Iron Ore Sinter. Miner. Eng. 2022, 175, 107291. [Google Scholar] [CrossRef]
  7. Barik, K.; Prusti, P.; Soren, S.; Meikap, B.C.; Biswal, S.K. Analysis of Iron Ore Pellets Properties Concerning Raw Material Mineralogy for Effective Utilization of Mining Waste. Powder Technol. 2022, 400, 117259. [Google Scholar] [CrossRef]
  8. Fernández-González, D.; Ruiz-Bustinza, I.; Mochón, J.; González-Gasca, C.; Verdeja, L.F. Iron Ore Sintering: Raw Materials and Granulation. Miner. Process. Extr. Metall. Rev. 2017, 38, 36–46. [Google Scholar] [CrossRef]
  9. Iljana, M.; Abdelrahim, A.; Bartusch, H.; Fabritius, T. Reduction of Acid Iron Ore Pellets under Simulated Wall and Center Conditions in a Blast Furnace Shaft. Minerals 2022, 12, 741. [Google Scholar] [CrossRef]
  10. Swamy, A.K.; Nikkam, S.; Palthur, S.K. Recovery of Hematite from Banded Hematite Quartzite of Southern India by Magnetic Separation and Reverse Flotation. Minerals 2022, 12, 1095. [Google Scholar] [CrossRef]
  11. Platts|S&P Global Commodity Insight. Specifications Guide Global Iron Ore. 2020. Available online: https://shorturl.at/bhpr3 (accessed on 7 September 2023).
  12. Morris, R.C. A Textural and Mineralogical Study of the Relationship of Iron Ore to Banded Iron-Formation in the Hamersley Iron Province of Western Australia. Econ. Geol. 1980, 75, 184–209. [Google Scholar] [CrossRef]
  13. Cruz, V.A.; Cruz, S.C.; Lobato, L.M.; Rios, F.J.; Santos, J.S.; Lima, G.M.P. Structural Control and Hydrothermal Evolution Model of Unusual, High-Grade Metasandstone-Hosted Iron Deposits, Mesoproterozoic Eastern Chapada Diamantina, Brazil. Ore Geol. Rev. 2018, 101, 221–272. [Google Scholar] [CrossRef]
  14. Rosière, C.A.; Spier, C.A.; Rios, F.J.; Suckau, V.E. The Itabirites of the Quadrilátero Ferrífero and Related High-Grade Iron Ore Deposits: An Overview. Soc. Econ. Geol. 2008, 15, 223–254. [Google Scholar]
  15. Donskoi, E.; Poliakov, A.; Holmes, R.; Suthers, S.; Ware, N.; Manuel, J.; Clout, J. Iron Ore Textural Information Is the Key for Prediction of Downstream Process Performance. Miner. Eng. 2016, 86, 10–23. [Google Scholar] [CrossRef]
  16. Ramdohr, P. The Ore Minerals and Their Intergrowths. Oxf. Pergamon Press. Ger. 1969, 1–2, 1174. [Google Scholar]
  17. Mukhopadhyay, J.; Gutzmer, J.; Beukes, N.J.; Bhattacharya, H.N. Geology and Genesis of the Major Banded Iron Formation-Hosted High-Grade Iron Ore Deposits of India. Soc. Econ. Geol. Rev. 2008, 15, 291–316. [Google Scholar]
  18. Beukes, N.J.; Mukhopadhyay, J.; Gutzmer, J. Genesis of High-Grade Iron Ores of the Archean Iron Ore Group around Noamundi, India. Econ. Geol. 2008, 103, 365–386. [Google Scholar] [CrossRef]
  19. Roy, S.; Venkatesh, A.S. Mineralogy and Geochemistry of Banded Iron Formation and Iron Ores from Eastern India with Implications on Their Genesis. J. Earth Syst. Sci. 2009, 118, 619–641. [Google Scholar] [CrossRef]
  20. Roy, S. Recovery Improvement of Fine Iron Ore Particles by Multi Gravity Separation. Open Miner. Process. J. 2009, 2, 17–30. [Google Scholar] [CrossRef]
  21. Prasad, J.; Venkatesh, A.S.; Sahoo, P.R.; Singh, S.; Sylvestre Kanouo, N. Geological Controls on High-Grade Iron Ores from Kiriburu-Meghahatuburu Iron Ore Deposit, Singhbhum-Orissa Craton, Eastern India. Minerals 2017, 7, 197. [Google Scholar] [CrossRef]
  22. Mendes, M.; Lobato, L.M.; Kunzmann, M.; Halverson, G.P.; Rosière, C.A. Iron Isotope and REE+ Y Composition of the Cauê Banded Iron Formation and Related Iron Ores of the Quadrilátero Ferrífero, Brazil. Miner. Depos. 2017, 52, 159–180. [Google Scholar] [CrossRef]
  23. Angerer, T.; Hagemann, S.G.; Walde, D.H.; Halverson, G.P.; Boyce, A.J. Multiple Metal Sources in the Glaciomarine Facies of the Neoproterozoic Jacadigo Iron Formation in the “Santa Cruz Deposit”, Corumbá, Brazil. Precambrian Res. 2016, 275, 369–393. [Google Scholar] [CrossRef]
  24. Angerer, T.; Hagemann, S.G.; Walde, D.H. Diagenetic and Supergene Ore Forming Processes in the Iron Formation of the Neoproterozoic Jacadigo Group, Corumbá, Brazil. J. S. Am. Earth Sci. 2021, 105, 102902. [Google Scholar] [CrossRef]
  25. Clout, J.M.F. Upgrading Processes in BIF-Derived Iron Ore Deposits: Implications for Ore Genesis and Downstream Mineral Processing. Appl. Earth Sci. 2003, 112, 89–95. [Google Scholar] [CrossRef]
  26. Clout, J.M.F. Iron Formation-Hosted Iron Ores in the Hamersley Province of Western Australia. Appl. Earth Sci. 2006, 115, 115–125. [Google Scholar] [CrossRef]
  27. Donskoi, E.; Suthers, S.P.; Fradd, S.B.; Young, J.M.; Campbell, J.J.; Raynlyn, T.D.; Clout, J.M.F. Utilization of Optical Image Analysis and Automatic Texture Classification for Iron Ore Particle Characterisation. Miner. Eng. 2007, 20, 461–471. [Google Scholar] [CrossRef]
  28. Lu, L. Iron Ore: Mineralogy, Processing and Environmental Sustainability, 2nd ed.; Elsevier: Amsterdam, The Netherlands, 2015; pp. 59–108. ISBN 978-0-12-820226-5. [Google Scholar]
  29. Chen, K.; Yin, W. Differences in Early Rejection of Gangue for Low-Grade Iron Ores with Different Textures from HPGR. Miner. Process. Extr. Metall. Rev. 2022, 1–7. [Google Scholar] [CrossRef]
  30. ASTM D5731-07; Standard Test Method for Determination of the Point Load Strength Index of Rock and Application to Rock Strength Classification. ASTM: West Conshohocken, PA, USA, 2007.
  31. IS 9963-1981; Determination of Shatter Index of Iron Ore Lumps, Sinters and Pellets. Bureau of Indian Standard: New Delhi, India, December 1981.
  32. Mohanta, M.K.; Rath, R.K.; Sharma, M.; Soreng, D.R.; Mohanty, S.; Singh, R.K.; Singh, R. Characteristics of Iron Ore Minerals from Tailing Pond of Kiriburu Iron Ore Mines. Proc. XIII Int. Semin. Min. Process. Technol. 2013, III, 978–981. [Google Scholar]
  33. Dey, S.; Mohanta, M.K.; Singh, R. Mineralogy and Textural Impact on Beneficiation of Goethitic Ore. Int. J. Min. Sci. Technol. 2017, 27, 445–450. [Google Scholar] [CrossRef]
Figure 1. Photographs showing their field relationship and megascopic features in iron ore variants: (a) schistose microplaty hematite low-strength ore (smH-ls) showing schistosity with enhanced porosity and occurrence of microplaty hematite powdery ore (mH-p ore) along schistosity surface making it highly fragile; (b) microplaty hematite powdery ore (mH-p ore) associated with numerous quartz veins leading to interlocking, downgrading of ore quality; (c) banded hematite jasper showing lamellae/bands of hematite and jasper, intruded by concordant quartz filling and discordant quartz vein; (d) dense martite microplaty hematite high-strength ore (dM-mH-hs ore) showing lamellae of dense martite interleaved with bands of microporous microplaty hematite; (e) massive dM-mH-hs ore showing its massive characteristics and no lamellar feature; (f) schistose microplaty hematite low-strength ore (smH-ls ore) exhibiting foliation and joints pertaining to its low strength; (g) vitreous goethitic ore (vG ore) showing vitreous grey colored vitreous goethite, ochreous red colored ochreous goethite, and voids; (h) ochreous goethitic ore showing ochreous red colored ochreous goethite, pale white colored ferruginous kaolinite, and voids/pores partly filled by clay. (oG: ochreous goethite; Js: Jasper band, dM: dense martite; mH: microplaty hematite; vG: vitreous goethite, V: Void; Fk: ferruginous kaolinite).
Minerals 13 01194 g001
Figure 2. X-ray diffraction (XRD) pattern of (a) banded hematite jasper; (b) dense martite microplaty hematite high-strength ore (dM-mH-hs ore); (c) schistose microplaty hematite low-strength ore (smH-ls ore); (d) vitreous goethitic ore (vG ore); (e) ochreous goethitic ore (oG ore); (f) microplaty hematite powdery ore (mH-p ore); X-ray source: Co Kα for a-e; Cu Kα for (f). M: magnetite, H: hematite, Go: goethite, K: kaolinite, Q: quartz.
Minerals 13 01194 g002
Figure 3. BSE images of iron ore variants. The location marked with numbers are points of EPMA analysis, as detailed in Table 1. (a) Vitreous goethitic ore, (b) ochreous goethitic ore, and (c) coliform goethite structure showing compositional variation in goethite in alternation with clay; (d) dense martite microplaty hematite high-strength ore (dM-mH-hs ore) showing hematite, goethite and pore space with compositional contrast.
Minerals 13 01194 g003
Figure 4. Mineralogy and texture of ore variants in Kashia-Jajang area, as observed under polarized reflected light in the optical microscope: (a) jasper band of BHJ showing finely disseminated microplaty hematite in jasper matrix; (b) hematite band of BHJ showing quartz, microplaty hematite with intergranular quartz/quartz vein and porous martite; (c) dM-mH-hs ore showing microplaty hematite with intergranular pore space and a thin zone of dense martite; (d) massive dM-mH-hs ore showing the presence of dense martite and microplaty hematite; (e) kenomagnetite as a relict in mdM-mH-hs ore (under oil immersion); (f) the laminae of microplaty hematite with intergranular pore space and foliation surfaces in smH-ls ore; (g,h) ferruginous kaolinite surrounded by concentric layer of vitreous goethite (vG) in vitreous goethitic ore and ocherous goethite (oG) forming colloform band in ochreous goethitic ore (oG); (i) vG ore showing hematite altered to goethite with relict/residual hematite and void. (Go: goethite, dM: dense martite, mH: microplaty hematite, M: Martite, V: Void/intergranular pore space, Q: quartz, kM: kenomagnetite, oG: ochreous goethite, vG: vitreous goethite, fl: foliation, Fk: Ferruginous kaolinite.
Minerals 13 01194 g004
Figure 5. (a) The plot of uncorrected point load strength index (Is) measured by ASTM procedure) and corresponding porosity (pore area% measured by Image analysis) in ore variants indicating a correlation. (b) Secondary electron image of a coarse grain of mH-p ore showing extensive pore space of various dimension (<1 µm to ~10 µm). P: pore; H: hematite.
Minerals 13 01194 g005
Figure 6. Geochemical variations in different iron ore variants in eastern Indian deposits. (a) Al2O3 versus Fe2O3 and (b) SiO2 versus Fe2O3.
Minerals 13 01194 g006
Figure 7. Liberation of ROM ore types at varied size classes below 1 mm.
Minerals 13 01194 g007
Figure 8. Grain size distribution (in wt%) of classified products of −30 + 8 mm, −8 + 1 mm, −1 + 0.15 mm, and −0.15 mm in ROM variants ROM-HIO, ROM-SSIO, ROM-PBD, and ROM-LIO.
Minerals 13 01194 g008
Figure 9. Major element distribution in different size fractions generated via scrubbing and classification of ROM variants in HIO, SSIO, PBD, and LIO. (a) Percentage of Fe(T); (b) percentage of alumina; and (c) percentage of silica in various size fractions shows preferential deportment of elements and the significance of desliming in upgradation.
Minerals 13 01194 g009
Figure 10. Response of ROM size fractions of different variants (ROM-HIO, ROM-SSIO and ROM-LIO) to beneficiation. (a) Product yield (in%); (b) Fe grade (in%) and (c) Al2O3 (in%).
Minerals 13 01194 g010
Table 1. Electron probe microanalyses of mineral phases in iron ore variants: vitreous goethitic ore (vG ore), ochreous goethitic ore (oG ore), dense martite microplaty hematite high-strength ore (dM-mH-hs ore). The data are compared with the average EPMA data on vG, oG, H, and HH reported from Australia [27]. As mentioned, the analysis spot for EPMA is marked in Figure 3.
SamplevG OreoG OredM-mH-hs OreAv. EPMA Data of Minerals [27].
MineralvGAlt-HoGoGoGHHHHHvGoG
Spot1234567
Fe(T)59.2465.753.548.0432.7269.2169.6668.5465.6260.1347.54
Fe2O384.7694.1179.4168.6446.8199.0299.6698.0793.8285.9967.99
SiO21.090.812.709.2222.950.230.560.671.652.282.88
Al2O30.930.610.238.2420.170.270.230.071.002.575.68
MgO0.040.060.000.170.100.020.040.000.000.000.00
TiO20.000.070.020.110.040.100.010.010.100.040.14
MnO0.090.050.110.020.000.040.100.000.230.050.05
CaO0.040.040.010.290.060.020.020.010.030.040.11
Na2O0.120.000.040.120.060.270.040.030.010.060.08
K2O0.000.010.000.050.010.000.020.010.180.010.02
Cr2O30.000.060.000.030.030.000.01NDNDNDND
P2O50.020.011.040.240.180.000.000.030.000.350.46
Total87.1395.9683.5787.4290.4799.99100.6798.997.0291.477.41
vG: vitreous goethite; oG: ochreous goethite; HH: hydrohematite; Alt-H: altered hematite; H: hematite; ND: not detectable.
Table 2. Textural parameters (dimension of hematite types, dimension of pore space, and porosity) and Uncorrected point load strength index (Is) strength index of iron ore variants from Kashia-Jajang.
Designated Iron
Ore End Members
Point Load Test DataTextural Parameters
Parameter De2
(in mm2)
Av. Uncorrected Strength Index (Is) in N/mm2 or MPaMineral Grain Size in MicronsIntergranular Pore Size in MicronsPorosity
(area%)
Microplaty Hematite
(Length × Thickness)
Dense Martite
(Length × Breadth)
Pore Dimension
BHJ
Hematite band
Jasper band
162.3453.5442 × 21–50 × 25 µm
Hematite in jasper: 3 × 1–10 × 6 µm
31 × 28–42 × 32 µm
Not present
28 × 21–48 × 39 µm18.7
dM-mH-hs ore161.0250.9310 × 5–37 × 13 µm25 × 12–40 × 20 µm21 × 14–67 × 41 µm31
mdM-mH-hs ore161.5251.3218 × 15–38 × 17 µm19 × 15–
58 × 49 µm
25 × 15–61 × 38 µm26
smH-ls ore
microcrystalline
171.0126.5810 × 5–37 × 13 µm
4 × 2–6 × 3 µm
11 × 9–
37 × 31 µm
Not present
23 × 14–66 × 32 µm51
smH-p ore
microcrystalline
171.2110.2312 × 6–32 × 14 µm
3 × 1.5–7 × 4.5 µm
15 × 11–
26 × 21 µm
31 × 18–71 × 48 µm54
mH-p ore
coarse lump (5 mm)
microcrystalline/powdery
ND#ND#14 × 4–48 × 4 µm
Microcrystalline:
2 × 1–6 × 3 µm
35 × 25–
61 × 46 µm
Not Present.
35 × 26–73 × 51 µm
ND#
64.8
vG ore147.5411.1514 × 4–18 × 8 µmNot Present41 × 38–79 × 56 µm67
oG ore127.309.73Not PresentNot Present51 × 44–84 × 58 µm67.9
ND# = not determined; mH = microplaty hematite; dM = dense martite; mdM-mH-hs ore = massive dM-mH-hs ore.
Table 3. Major element chemistry (in wt%) of BHJ and representative designated iron ore variants and run-of-mines (ROM) from eastern India. ROM sample analyzed using wet chemical analysis. ND: Not Detectable.
SampleFe (T)Fe2O3(T)SiO2Al2O3CaOMgOP2O5Na2OK2OTiO2MnO2LOITotal
oG140.858.3119.2618.040.010.000.160.000.020.300.019.0799.17
oG241.058.6414.3612.580.040.050.240.000.070.690.2912.4099.36
vG151.173.127.419.340.120.050.040.630.120.130.238.7099.89
vG256.280.387.295.800.160.040.070.000.070.240.095.5299.66
vG349.170.248.0610.510.050.030.190.000.070.460.219.6099.41
dm-mH-hs165.593.702.012.020.040.060.070.050.060.070.061.6099.74
dm-mH-hs264.091.483.052.080.020.000.050.000.020.040.132.4099.27
smH-ls164.291.802.911.890.030.010.050.000.010.040.103.21100.03
smH-ls262.589.313.142.280.130.090.040.050.070.060.044.6299.83
mH-p169.098.640.600.210.020.000.010.000.000.000.010.80100.29
mH-p268.397.650.650.190.010.000.020.000.000.000.030.7499.29
BHJ326.838.3558.690.750.160.000.070.000.070.190.011.1299.42
ROM-HIO58.3183.412.725.280.140.120.11NDNDND0.088.1399.91
ROM-SSIO63.8291.301.342.740.120.100.11NDNDND0.104.1899.99
ROM-LIO56.1580.322.666.310.10.090.15NDNDND0.0910.2699.98
ROM-PBD66.695.270.911.140.080.060.09NDNDND0.072.3799.99
Disclaimer/Publisher’s Note: The statements, opinions and data contained in all publications are solely those of the individual author(s) and contributor(s) and not of MDPI and/or the editor(s). MDPI and/or the editor(s) disclaim responsibility for any injury to people or property resulting from any ideas, methods, instructions or products referred to in the content.

