
Influences of Water Content on Acousto-Mechanical Properties and Failure Behaviors of Triaxially Compressed Shale


Abstract
:1. Introduction
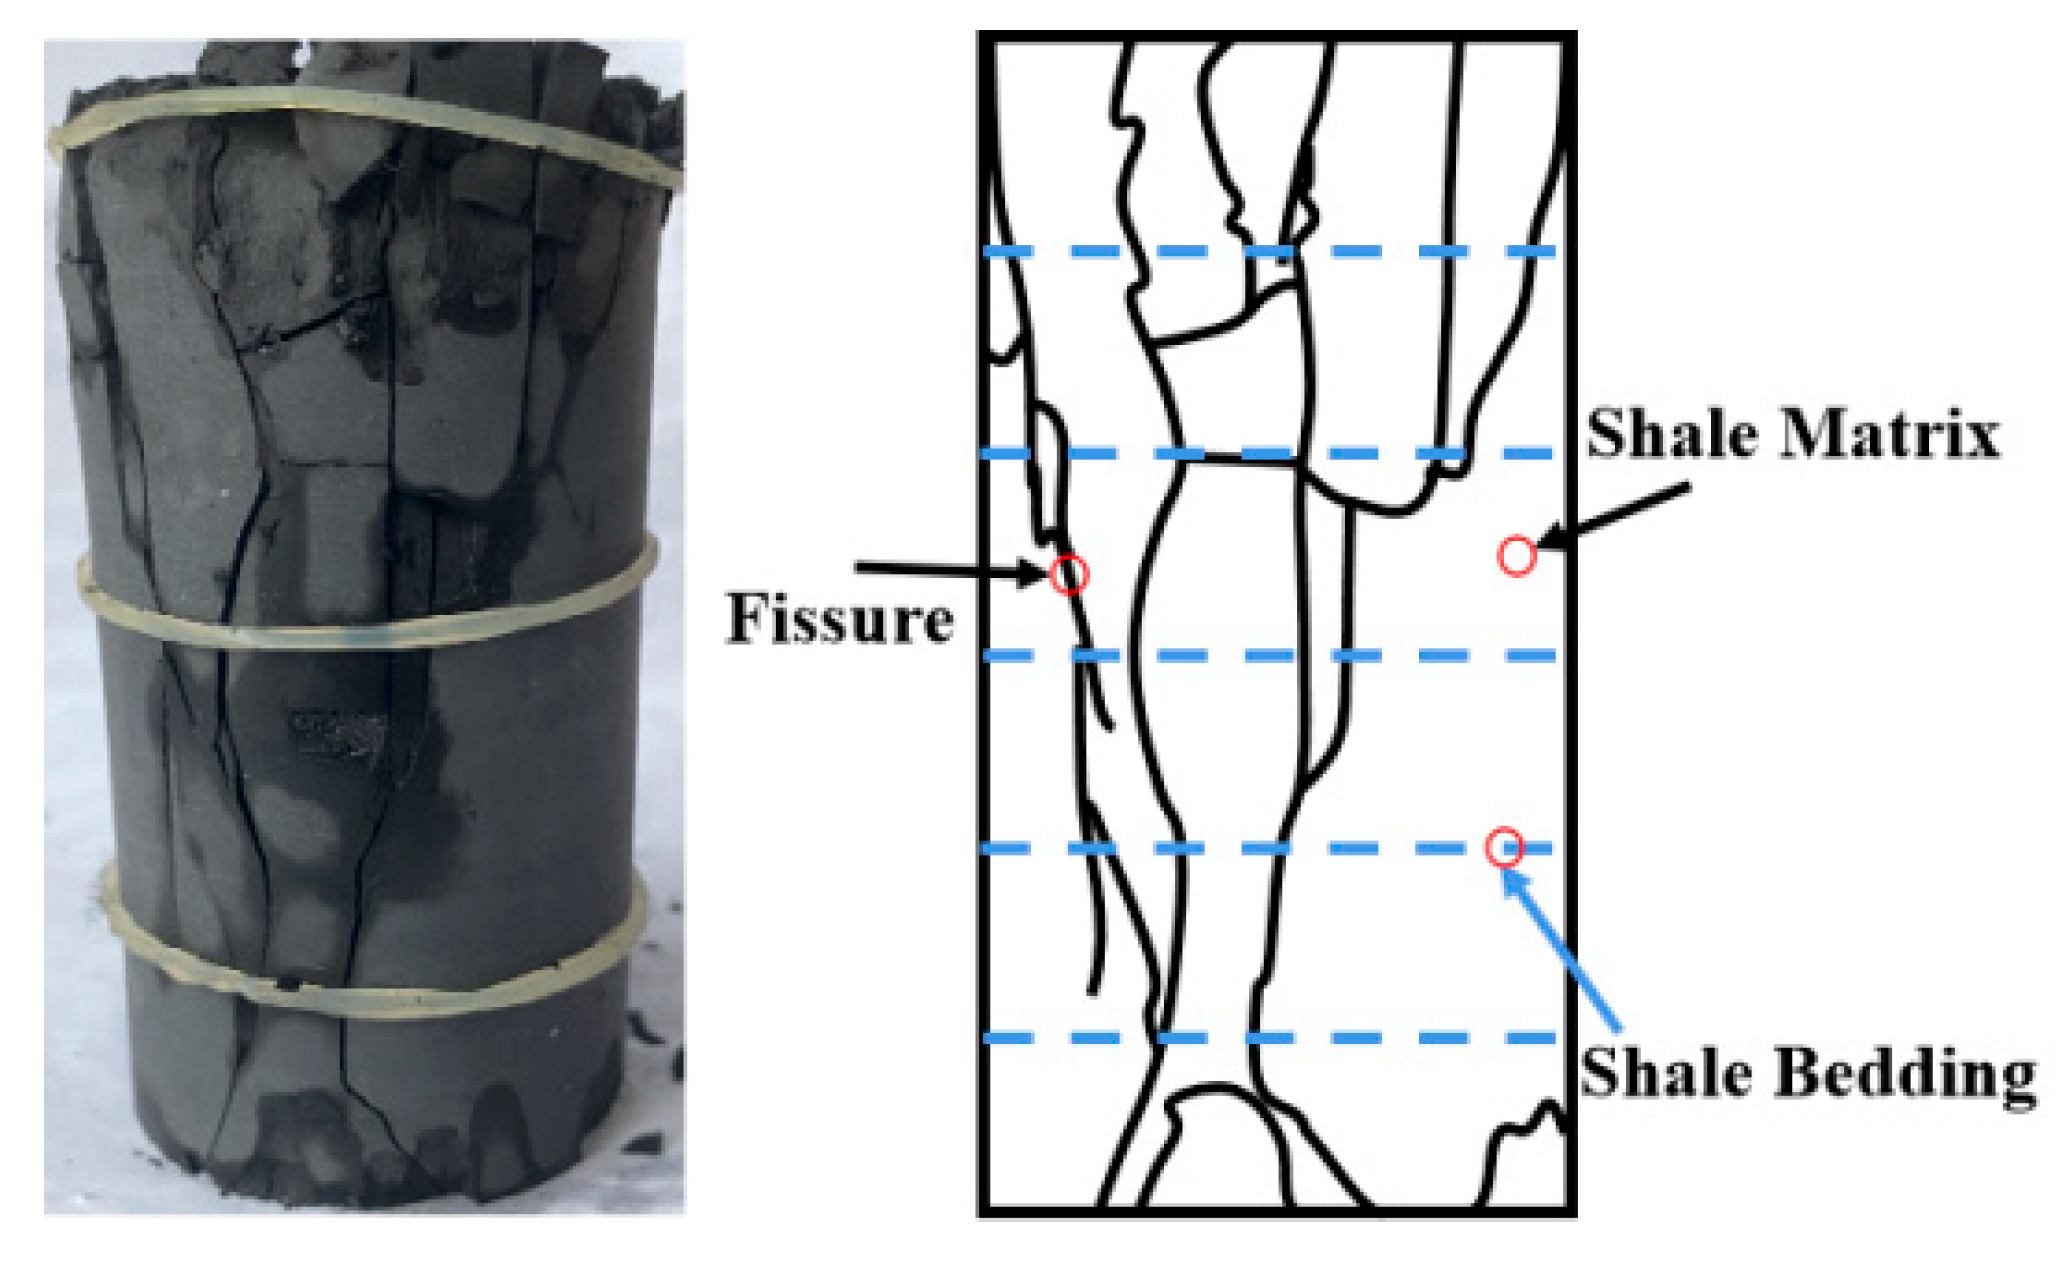
2. Experiments
3. Experimental Results
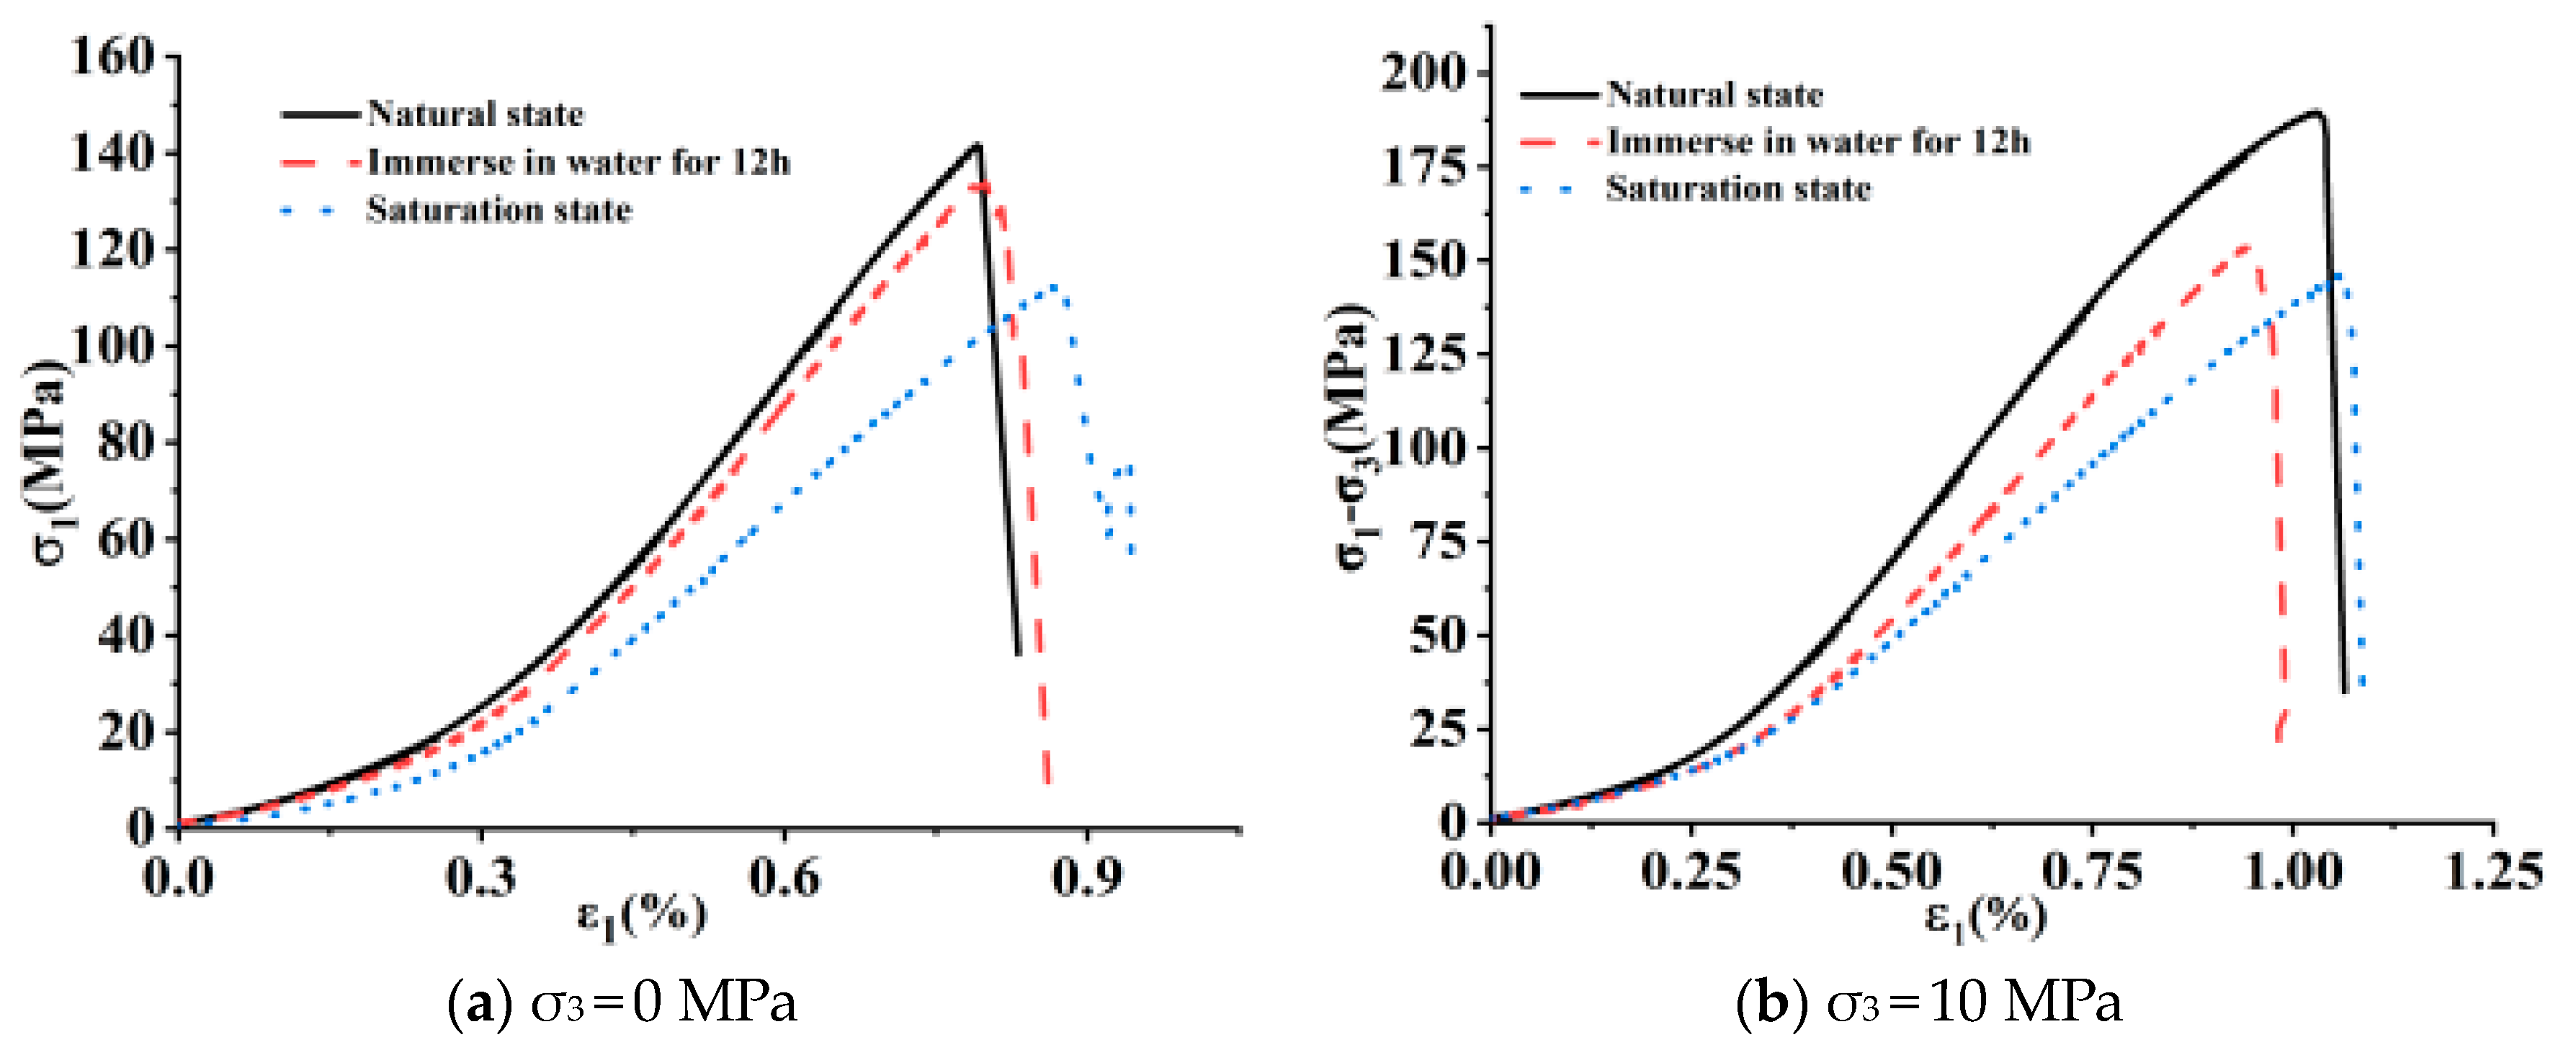
3.1. Stress–Strain Responses
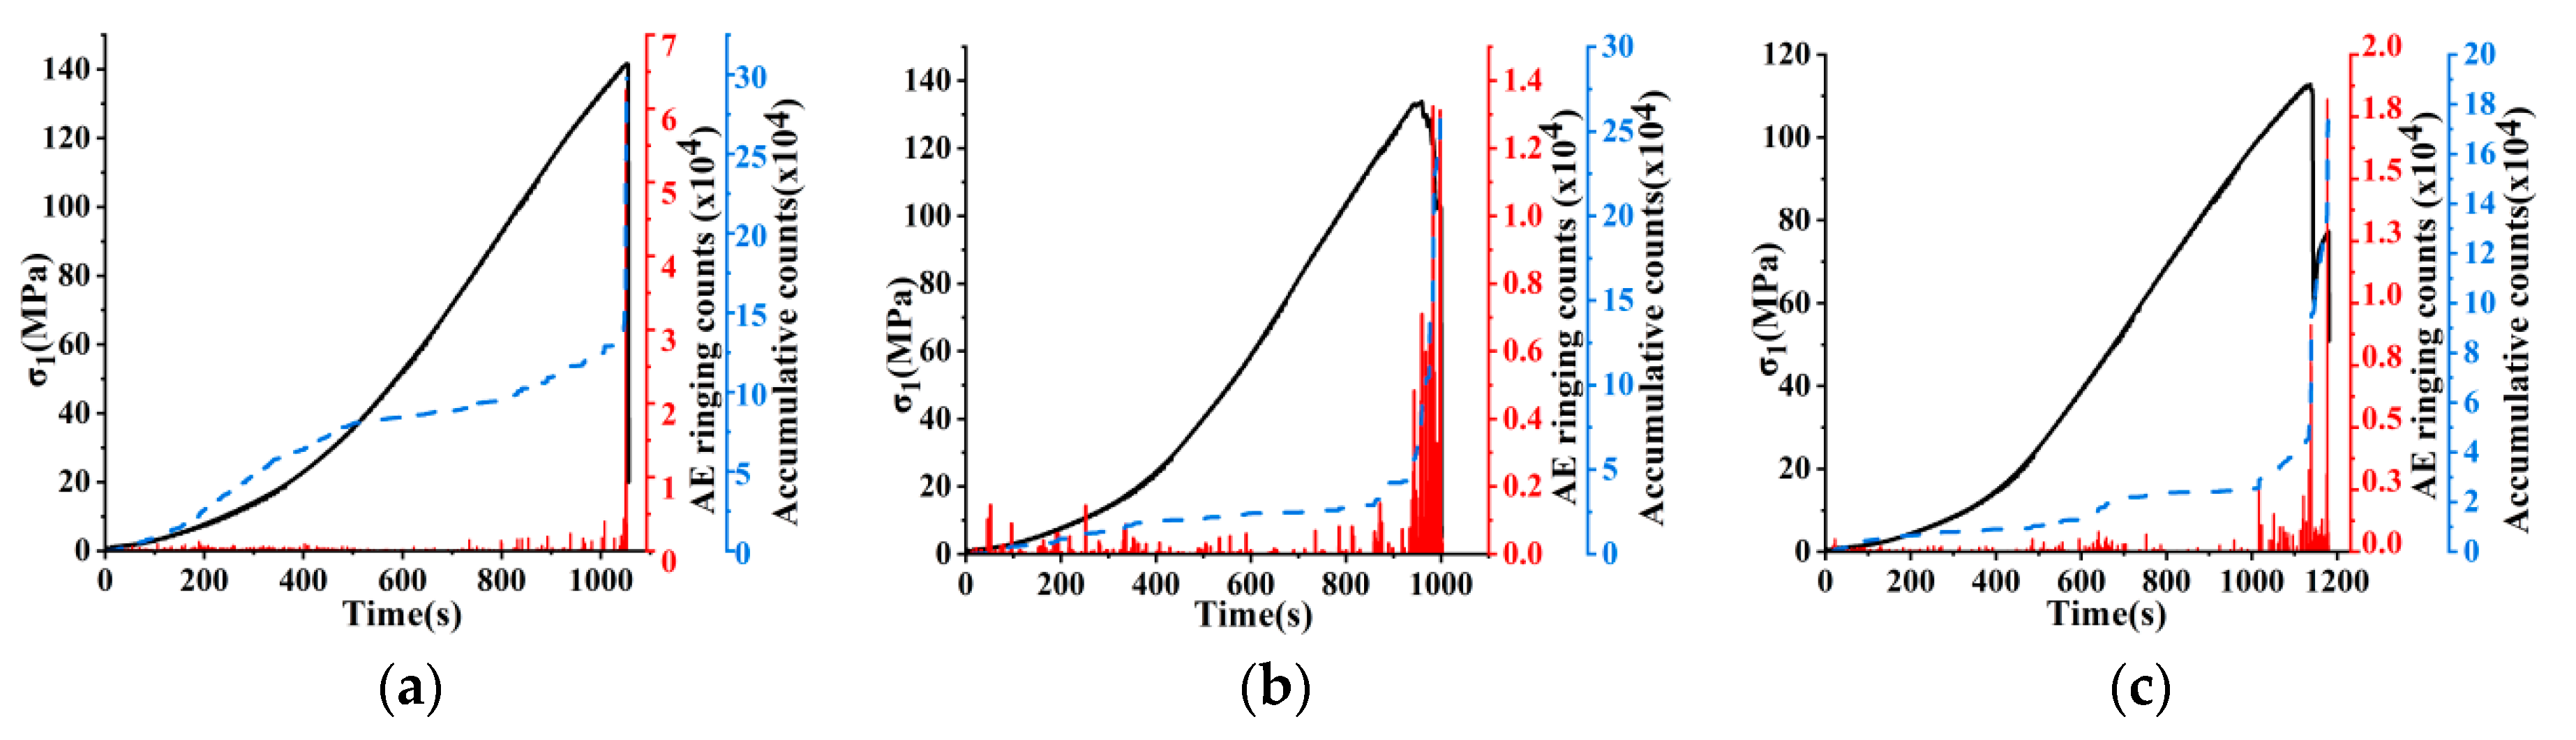
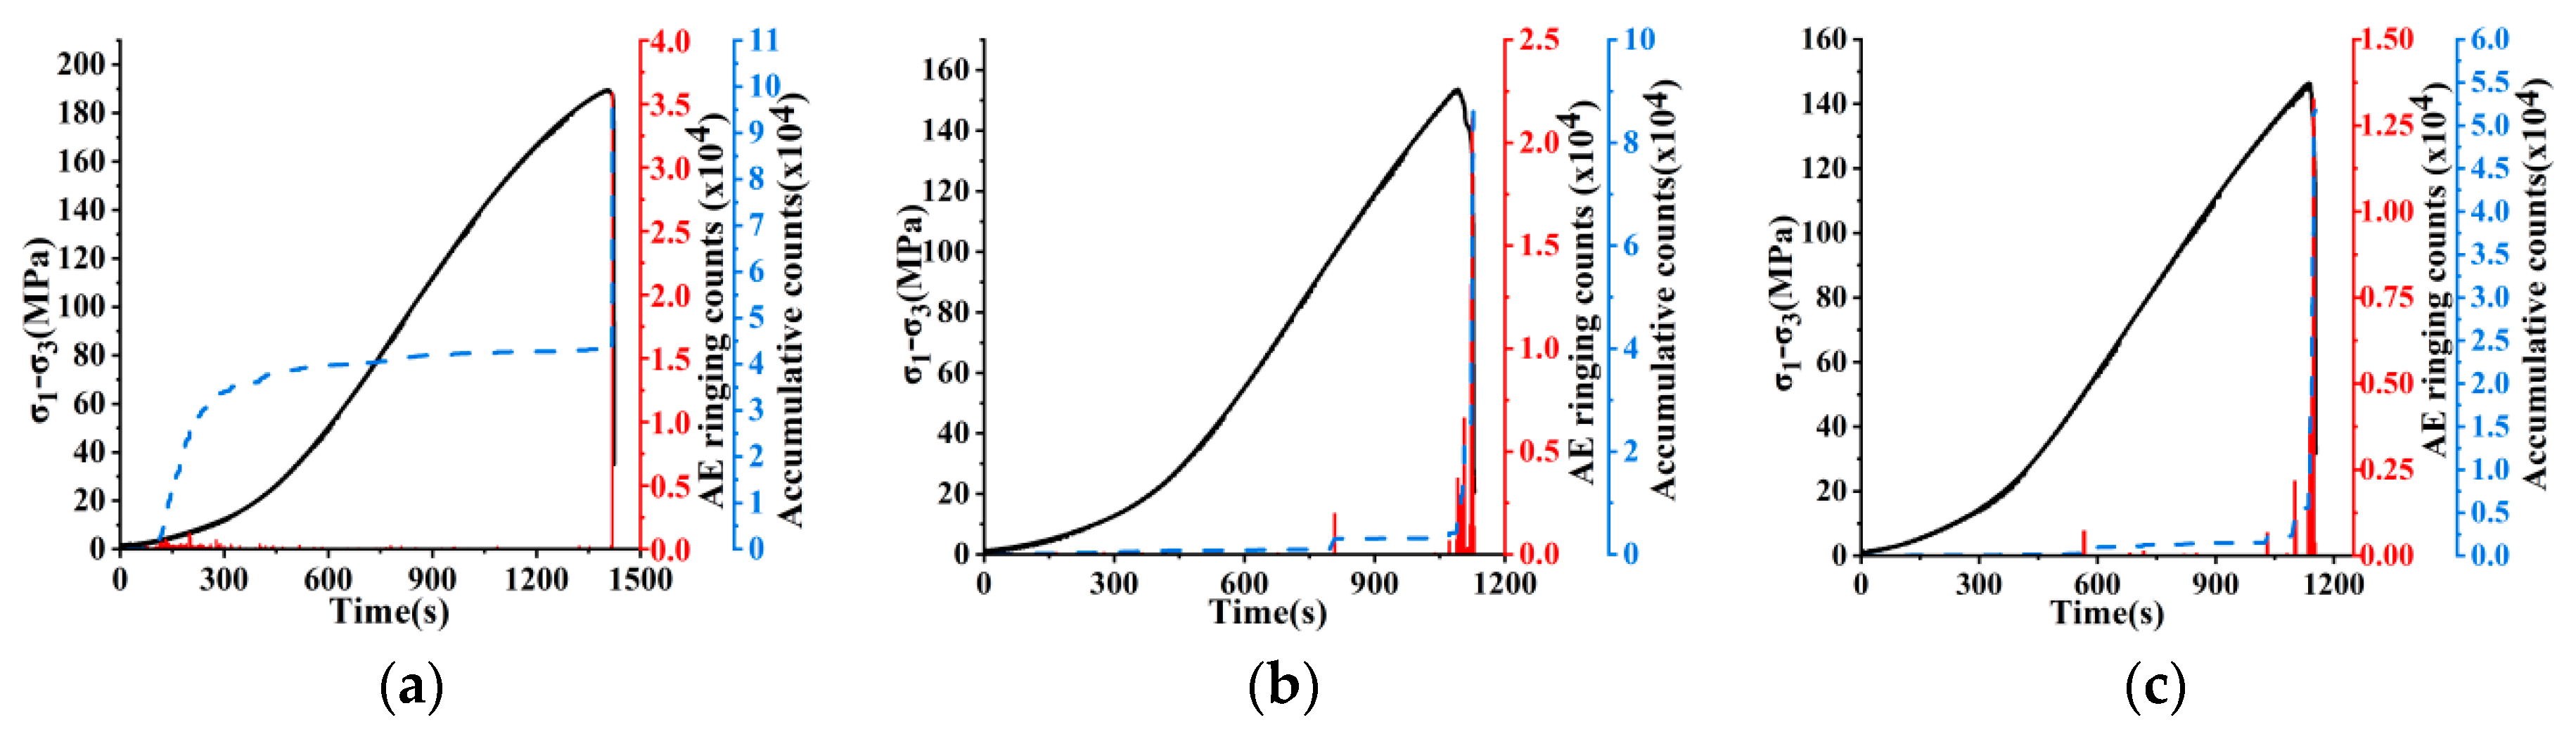
3.2. Acousto-Mechanical Characteristics and Failure Modes
4. Discussions
4.1. Water Content Influencing Mechanism
4.2. Confining Pressure-Influencing Mechanism
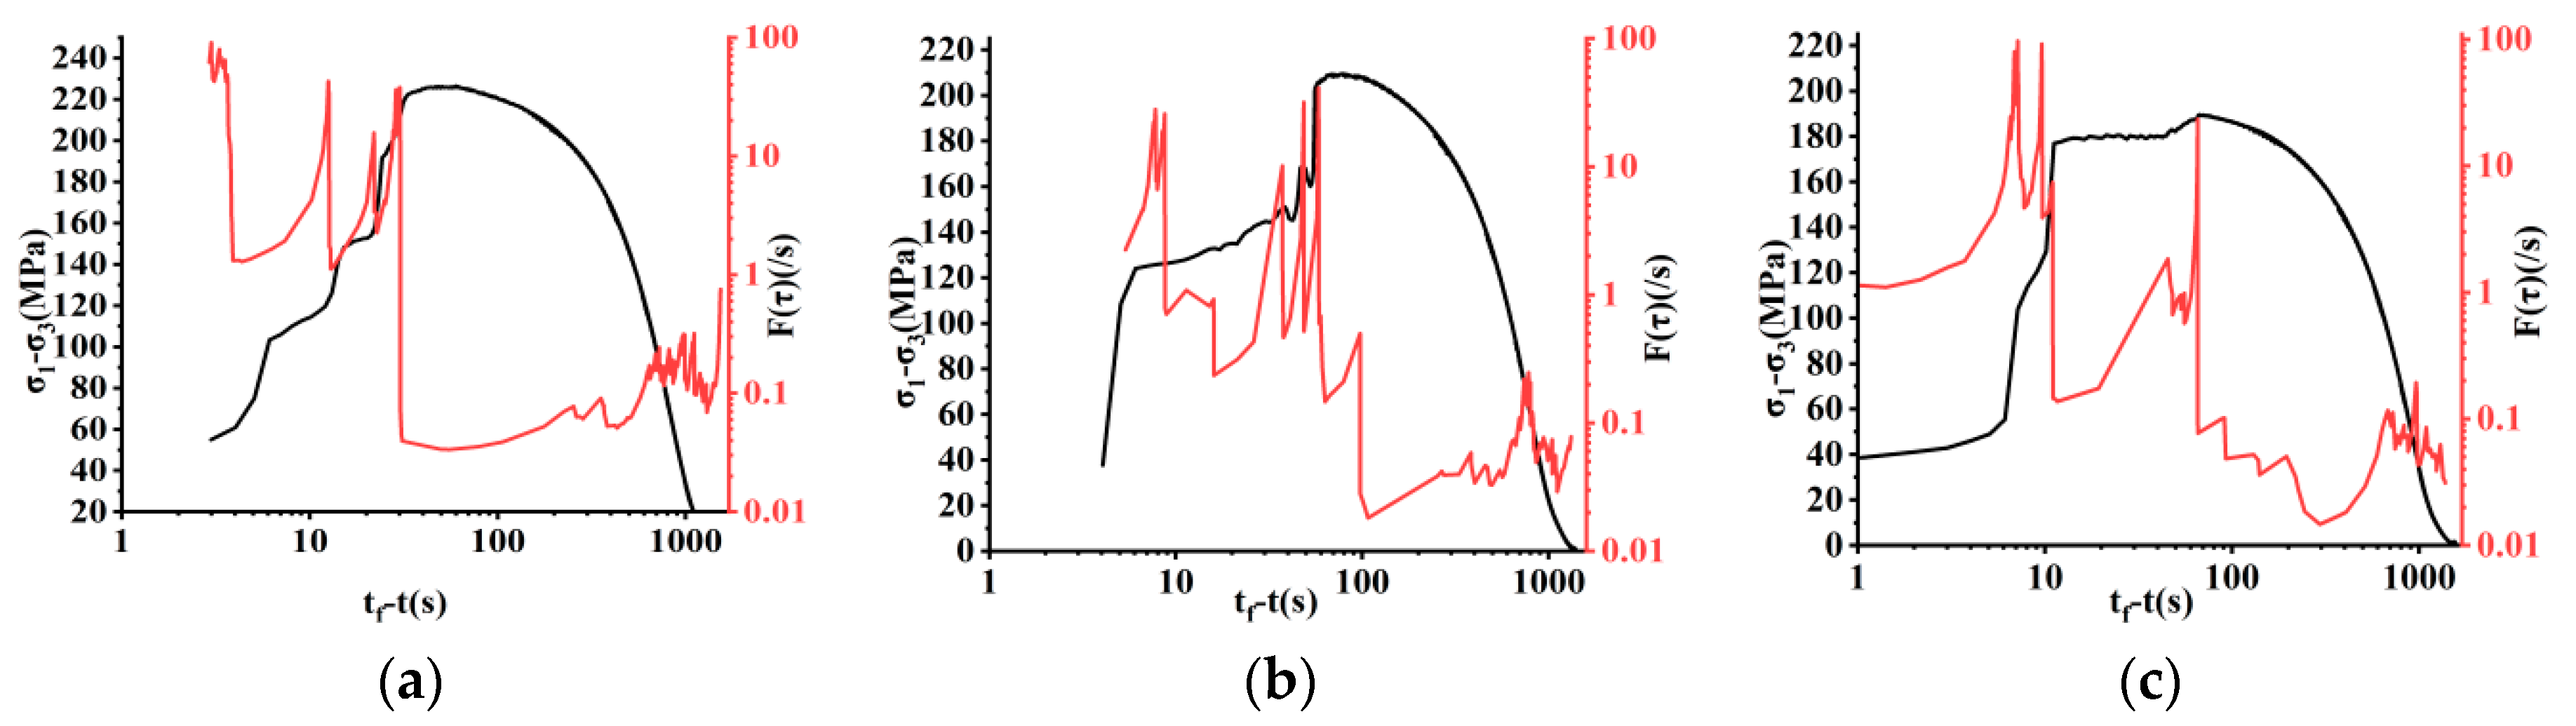
4.3. AE-Rate Process Analysis
5. Conclusions
Author Contributions
Funding
Data Availability Statement
Conflicts of Interest
References
- Martin, C.D.; Giger, S.; Lanyon, G.W. Behaviour of weak shales in underground environments. Rock Mech. Rock Eng. 2016, 49, 673–687. [Google Scholar] [CrossRef]
- Wong, L.N.Y.; Maruvanchery, V.; Liu, G. Water effects on rock strength an-d stiffness degradation. Acta Geotech. 2016, 11, 713–737. [Google Scholar] [CrossRef]
- Li, D.Y.; Wang, W.J. Quantitative analysis of the influence of saturation on rock strength reduction considering the distribution of water. Geomech. Geophys. Geo-Energy Geo-Resour. 2019, 5, 197–207. [Google Scholar] [CrossRef]
- Roy, G.D.; Singh, T.N.; Kodikara, J.; Das, R. Effect of water saturation on the fracture and mechanical properties of sedimentary rocks. Rock Mech. Rock Eng. 2017, 50, 2585–2600. [Google Scholar] [CrossRef]
- Li, D.Y.; Sun, Z.; Zhu, Q.Q.; Peng, K. Triaxial loading and unloading testson dry and saturated sandstone specimens. Appl. Sci. 2019, 9, 1689. [Google Scholar] [CrossRef] [Green Version]
- Luo, Z.S.; Zhu, Z.X.; Bai, H.; Liu, D.X.; Sun, Q.C. Research on the influence of moisture condition on the mechanical properties and microstructure of sandstone. Shock Vib. 2021, 2021, 4850650. [Google Scholar] [CrossRef]
- Zhang, C.; Wang, Y.; Ruan, H.; Ke, B.; Lin, H. The strain characteristics and corresponding model of rock materials under uniaxial cyclic load/unload compression and their deformation and fatigue damage analysis. Arch. Appl. Mech. 2021, 91, 2481–2496. [Google Scholar] [CrossRef]
- Wang, F.; Wu, C.; Yao, Q.; Li, X.; Chen, S.; Li, Y.; Li, H.; Zhu, G. Instability mechanism and control method of surrounding rock of water-rich roadway roof. Minerals 2022, 12, 1587. [Google Scholar] [CrossRef]
- Man, K.; Liu, X.L.; Song, Z.F.; Liu, Z.X.; Liu, R.L.; Wu, L.W.; Cao, Z.X. Dynamic compression characteristics and failure mechanism of water-saturated granite. Water 2022, 14, 216. [Google Scholar] [CrossRef]
- Zhang, Y.H.; Ma, J.; Sun, D.Y.; Zhang, L.Y.; Chen, Y.C. AE characteristics of rockburst tendency for granite influenced by water under uniaxial loading. Front. Earth Sci. 2020, 8, 55. [Google Scholar] [CrossRef] [Green Version]
- Zhou, H.W.; Wang, Z.H.; Ren, W.G.; Liu, Z.L.; Liu, J.F. Acoustic emission based mechanical behaviors of Beishan granite under conventional triaxial compression and hydromechanical coupling tests. Int. J. Rock Mech. Min. Sci. 2019, 123, 104125. [Google Scholar] [CrossRef]
- Zheng, L.J.; Xie, H.; Xu, Z.X.; Deng, J.H.; Wang, D.; Zhang, G.Z.; Li, C.B.; Zhang, R.; Feng, G. A Comparison of Mechanical Properties and Failure Processes of Saturated and Unsaturated Slate from Sichuan-Tibet Plateau Area, China. Lithosphere 2022, 2022, 4503366. [Google Scholar] [CrossRef]
- Lv, X.J. Exploring the deformation features and control techniques for surrounding rock of slate section tunnel. Arab. J. Geosci. 2020, 13, 849. [Google Scholar] [CrossRef]
- Chen, Z.Q.; He, C.; Wu, D.; Xu, G.W.; Yang, W.B. Fracture evolution and energy mechanism of deep-buried carbonaceous slate. Acta Geotech. 2017, 12, 1243–1260. [Google Scholar] [CrossRef]
- Cai, X.; Zhou, Z.L.; Tan, L.H.; Zang, H.Z.; Song, Z.Y. Fracture behavior and damage mechanisms of sandstone subjected to wetting-drying cycles. Eng. Fract. Mech. 2020, 234, 107109. [Google Scholar] [CrossRef]
- Chen, Y.; Cao, P.; Mao, D.W.; Pu, C.Z.; Fan, X. Morphological analysis of sheared rock with water-rock interaction effect. Int. J. Rock Mech. Min. Sci. 2014, 70, 264–272. [Google Scholar] [CrossRef]
- Li, X.Z.; Jia, Y.X.; Zhang, Q.S.; Qi, C.Z. A micro–macro model of pore pressure effect on shear fracture in brittle rocks under compression. Arch. Appl. Mech. 2022, 92, 1157–1165. [Google Scholar] [CrossRef]
- Du, K.; Li, X.F.; Tao, M.; Wang, S.F. Experimental study on acoustic emission (AE) characteristics and crack classiture in several basic lab tests. Int. J. Rock Mech. Min. Sci. 2020, 133, 104411. [Google Scholar] [CrossRef]
- Zhang, J.Z.; Zhou, X.P. AE event rate characteristics of flawed granite: From damage stress to ultimate failure. Geophys. J. Int. 2020, 222, 795–814. [Google Scholar] [CrossRef]
- Zhang, J.Z.; Zhou, X.P. Forecasting catastrophic rupture in brittle rocks using precursory ae time series. J. Geophys. Res. Sol. Earth 2020, 125, e2019J–e19276J. [Google Scholar] [CrossRef]
- Niandou, H.; Shao, J.F.; Henry, J.P.; Fourmaintraux, D. Laboratory investigation of the mechanical behaviour of Tournemire shale. Int. J. Rock Mech. Min. Sci. 1997, 34, 3–16. [Google Scholar] [CrossRef]
- Kuila, U.; Dewhurst, D.N.; Siggins, A.F.; Raven, M.D. Stress anisotropy and velocity anisotropy in low porosity shale. Tectonophysics 2011, 503, 34–44. [Google Scholar] [CrossRef]
- Xu, F.; Yang, C.H.; Guo, Y.T.; Wang, L.; Hou, Z.K.; Li, H.R.; Hu, X.M.; Wang, T.T. Effect of bedding planes on wave velocity and AE characteristics of the Longmaxi shale in China. Arab. J. Geosci. 2017, 10, 141. [Google Scholar] [CrossRef]
- Yang, S.Q.; Yin, P.F.; Li, B.; Yang, D.S. Behavior of transversely isotropic shale observed in triaxial tests and Brazilian disc tests. Int. J. Rock Mech. Min. Sci. 2020, 133, 104435. [Google Scholar] [CrossRef]
- AL-Bazali, T. The impact of water content and ionic diffusion on the uniaxial compressive strength of shale. Egypt. J. Pet. 2013, 22, 249–260. [Google Scholar] [CrossRef] [Green Version]
- Sone, H.; Zoback, M.D. Time-dependent deformation of shale gas reservoir rocks and its long-term effect on the in situ state of stress. Int. J. Rock Mech. Min. Sci. 2014, 69, 120–132. [Google Scholar] [CrossRef]
- Rybacki, E.; Reinicke, A.; Meier, T.; Makasi, M.; Dresen, G. What controls the mechanical properties of shale rocks?—Part I: Strength and Young′s modulus. J. Petrol. Sci. Eng. 2015, 135, 702–722. [Google Scholar] [CrossRef]
- Lyu, Q.; Ranjith, P.G.; Long, X.; Kang, Y.; Huang, M. A review of shale swelling by water adsorption. J. Nat. Gas Sci. Eng. 2015, 27, 1421–1431. [Google Scholar] [CrossRef]
- Ban, Y.X.; Xie, Q.; Duan, J.; Fu, X. Influences of inclined pre-existing flaw on shale failure modes in uniaxial compression tests. Minerals 2022, 12, 1330. [Google Scholar] [CrossRef]
- Yang, C.H.; Mao, H.J.; Wang, X.C.; Li, X.H.; Chen, J.W. Study on variation of microstructure and mechanical properties of water-weakening slates. Chin. Rock Soil Mech. 2006, 2090–2098. [Google Scholar] [CrossRef]
- Zhu, B.L.; Li, X.N.; Wu, X.Y.; Wang, Y.J. Experimental study of micro-characteristics of swelling for black shale under influence of water. Chin. J. Rock Mech. Eng. 2015, 34, 3896–3905. [Google Scholar] [CrossRef]
- Zhang, J.Z.; Zhou, X.P.; Zhou, L.S.; Berto, F. Progressive failure of brittle rocks with non-isometric flaws: Insights from acousto-optic-mechanical (AOM) data. Fatigue Fract. Eng. Mater. Struct. 2019, 42, 1787–1802. [Google Scholar] [CrossRef]
- Triantis, D.; Kourkoulis, S.K. An alternative approach for representing the data provided by the acoustic emission technique. Rock Mech. Rock Eng. 2018, 51, 2433–2438. [Google Scholar] [CrossRef]
- Lennartz-Sassinek, S.; Main, I.G.; Zaiser, M.; Graham, C.G. Acceleration and localization of subcritical crack growth in a natural composite material. Phys. Rev. E 2014, 90, 052401. [Google Scholar] [CrossRef] [Green Version]


| Specimen | Diameter /mm | Height /mm | Confining Pressure /MPa | Water Content/% | Average Water Content/% | P-Wave Velocity/m/s |
|---|---|---|---|---|---|---|
| Natural | 50.2 | 100.1 | 0 | 0.47 | 0.46 | 3792 |
| 50.2 | 100.2 | 10 | 0.44 | 3795 | ||
| 50.4 | 100.3 | 20 | 0.46 | 3980 | ||
| 50.2 | 100.9 | 30 | 0.48 | 3793 | ||
| Immersion for 12 h | 50.2 | 100.1 | 0 | 0.85 | 0.88 | 3910 |
| 50.2 | 100 | 10 | 0.86 | 3906 | ||
| 50.2 | 100.1 | 20 | 0.88 | 3880 | ||
| 50.2 | 100.1 | 30 | 0.91 | 3821 | ||
| Saturation | 50.2 | 100.2 | 0 | 1.55 | 1.55 | 3795 |
| 50.3 | 100.2 | 10 | 1.52 | 3883 | ||
| 50.2 | 100.1 | 20 | 1.54 | 3850 | ||
| 50.2 | 100.5 | 30 | 1.58 | 3957 |
| Specimen State | Confining Pressure /MPa | Peak Strength /MPa | Peak Strain /% | Elastic Modulus /GPa |
|---|---|---|---|---|
| Natural | 0 | 141.64 | 0.791 | 25.924 |
| 10 | 199.57 | 1.034 | 28.382 | |
| 20 | 231.47 | 1.059 | 29.808 | |
| 30 | 256.92 | 1.071 | 30.406 | |
| Immersion for 12 h | 0 | 133.85 | 0.799 | 23.391 |
| 10 | 163.64 | 0.945 | 24.035 | |
| 20 | 210.81 | 1.069 | 24.955 | |
| 30 | 236.72 | 1.147 | 26.45 | |
| Saturation | 0 | 111.88 | 0.864 | 18.354 |
| 10 | 156.44 | 1.060 | 19.182 | |
| 20 | 196.01 | 1.159 | 21.551 | |
| 30 | 222.23 | 1.200 | 22.839 |
Disclaimer/Publisher’s Note: The statements, opinions and data contained in all publications are solely those of the individual author(s) and contributor(s) and not of MDPI and/or the editor(s). MDPI and/or the editor(s) disclaim responsibility for any injury to people or property resulting from any ideas, methods, instructions or products referred to in the content. |
© 2023 by the authors. Licensee MDPI, Basel, Switzerland. This article is an open access article distributed under the terms and conditions of the Creative Commons Attribution (CC BY) license (https://creativecommons.org/licenses/by/4.0/).
Share and Cite
Zhang, S.; Cai, F.; Cao, Y.; Yan, Q. Influences of Water Content on Acousto-Mechanical Properties and Failure Behaviors of Triaxially Compressed Shale. Minerals 2023, 13, 1087. https://doi.org/10.3390/min13081087
Zhang S, Cai F, Cao Y, Yan Q. Influences of Water Content on Acousto-Mechanical Properties and Failure Behaviors of Triaxially Compressed Shale. Minerals. 2023; 13(8):1087. https://doi.org/10.3390/min13081087
Chicago/Turabian StyleZhang, Sui, Fuming Cai, Yangbing Cao, and Qiang Yan. 2023. "Influences of Water Content on Acousto-Mechanical Properties and Failure Behaviors of Triaxially Compressed Shale" Minerals 13, no. 8: 1087. https://doi.org/10.3390/min13081087