Article

The Influence of Liquid/Solid Ratio and Pressure on the Natural and Accelerated Carbonation of Alkaline Wastes

by
Giampiero Pasquale Sorrentino
1,
Renato Guimarães
2,
Bruno Valentim
2 and
Elza Bontempi
1,*
1
INSTM and Chemistry for Technologies Laboratory, Department of Mechanical and Industrial Engineering, University of Brescia, Via Branze, 38, 25123 Brescia, Italy
2
Earth Science Institute–Porto Pole, Department of Geosciences, Environment and Spatial Plannings, Faculty of Sciences, University of Porto, Rua do Campo Alegre s/n, 4169-007 Porto, Portugal
*
Author to whom correspondence should be addressed.
Minerals 2023, 13(8), 1060; https://doi.org/10.3390/min13081060
Submission received: 29 June 2023 / Revised: 5 August 2023 / Accepted: 9 August 2023 / Published: 11 August 2023
(This article belongs to the Special Issue Advances in Mineral Carbonation)

Abstract

:
The purpose of this research is to assess the yield and reaction rate potential of carbon dioxide (CO2) sequestration through mineralisation using readily available and inexpensive resources by exploiting waste materials. In this case, a blend of four different kinds of ashes and combustion by-products were used, namely, coal fly ash (CFA), flue gas desulphurization (FGD) residues, municipal solid waste incineration fly ashes (MSWI FA) and bottom ash (MSWI BA), produced at the same location. To highlight the impact of these materials on the carbonation process, various factors were analysed, including particle size distribution, immediately soluble contents, mineralogy, particles’ detailed structure, and chemical composition. After preparing the samples, two carbonation processes were tested: natural carbonation and accelerated carbonation. To evaluate the impact of the water content on the reaction rate and yield of the mineral carbonation, various liquid-to-solid (L/S) ratios were used. The results demonstrate that the water content and pressure play a significant role in the CO2 sequestration during the accelerated carbonation, the higher the L/S, the greater the yields, which can reach up to 152 g CO2/kg with MSWI FA, while no substantial difference seems to emerge in the case of the natural carbonation.

Graphical Abstract

1. Introduction

According to the Intergovernmental Panel on Climate Change, the global average temperature of the Earth has risen by approximately 1.1 °C since pre-industrial time and is foreseen to keep rising. Most human activities contribute to global warming, including fossil fuel combustion, deforestation, and industrial processes that emit carbon dioxide (CO2), leading to an increased greenhouse gas (GHG) effect with detrimental impacts on ecosystems, agriculture, society, and the economy [1,2,3,4,5].
To lower CO2 emissions and their impact on the GHG effect, numerous solutions are being used or studied, such as transitioning to renewable energy sources, decreasing energy consumption in buildings, transportation, and industry fields, implementing measures before or during combustion, or capturing CO2 from the atmosphere after the combustion process, among others [6,7,8,9]. Carbon capture utilisation and storage (CCUS) technologies are employed downstream of the combustion process and involve long-term underground storage of CO2 in geological formations, such as exhausted oil and gas reservoirs, salt formations, or unmineable coal seams, commonly referred to as carbon capture and storage. The CO2 is trapped by impermeable rock layers and held under pressure, preventing its release into the atmosphere, and promoting mineralisation through reactions with alkaline minerals [10,11].
Mineral carbonation stands out as one of the more promising CCUS technologies. Naturally occurring alkaline minerals, serving as Ca and Mg sources, react with CO2, generating stable carbonates [12,13]. An alternative source of Ca and Mg for CO2 sequestration can be found in alkaline waste, especially in ashes and by-products from combustion processes [14,15], which could also aid in stabilising heavy metals, making the process more economically and environmentally attractive [16]. However, the heterogeneity of ashes and other combustion by-products arising from diverse feed fuels, combustion technologies, conditions, and air pollution control (APC) equipment influences the Ca and Mg concentrations of the materials and inevitably impacts the efficiency of carbonation. Thus, to ensure reliable and effective carbonation, it is crucial to optimise the process variables and characterise the different materials used, e.g., lignite fly ash, oil shale ash, bituminous coal fly ash (CFA), flue gas desulphurisation (FGD) residues, and municipal solid waste incineration fly ash (MSWI FA) and bottom ash (MSWI BA) [17,18,19,20,21,22,23,24].
Assi et al. [25] established the possibility of using different types of ashes and by-products, namely CFA, FGD residues and MSWI BA, not only to stabilise the heavy metals in MSWI FA through pozzolanic reactions but also to simultaneously sequester CO2 through natural carbonation. However, this is a time-consuming process, taking several months to complete the reactions because of their slow kinetics. Moreover, several different reactions, with a unique rate-limiting phase, take place during the formation of carbonates when CO2 and metal oxides are combined, and factors such as temperature, pressure, and reactants concentration, among others, affect the reaction kinetics [26,27]. The efficiency of sequestration also raises the cost of CO2 capture and storage, prompting research into different process conditions and new reactor designs to improve reaction kinetics. For example, Sorrentino et al. [28] successfully modified the methodology initially proposed by Assi et al. [25] using the same blend of ashes for the sequestration of CO2 through accelerated carbonation in a pressurised atmosphere, capturing 93 wt.% of CO2 in just 72 h.
Nevertheless, the optimisation of the methodology still requires assessment in terms of yield and reaction velocity. This study aims to provide a broader analysis of the potential of accelerated carbonation by evaluating the influence of the materials’ properties, water content, and environmental conditions on carbonation. The key idea revolves around utilising by-products and waste materials generated within the same geographical area, not only eliminating the need for natural resources or commercial chemicals usage but also minimising transportation requirements. For this purpose, the tests were conducted in different liquid-to-solid (L/S) ratios to assess how this parameter affects yield and reaction rate. Eventually, the effect of the CO2 pressure over time was also assessed.

2. Materials and Methods

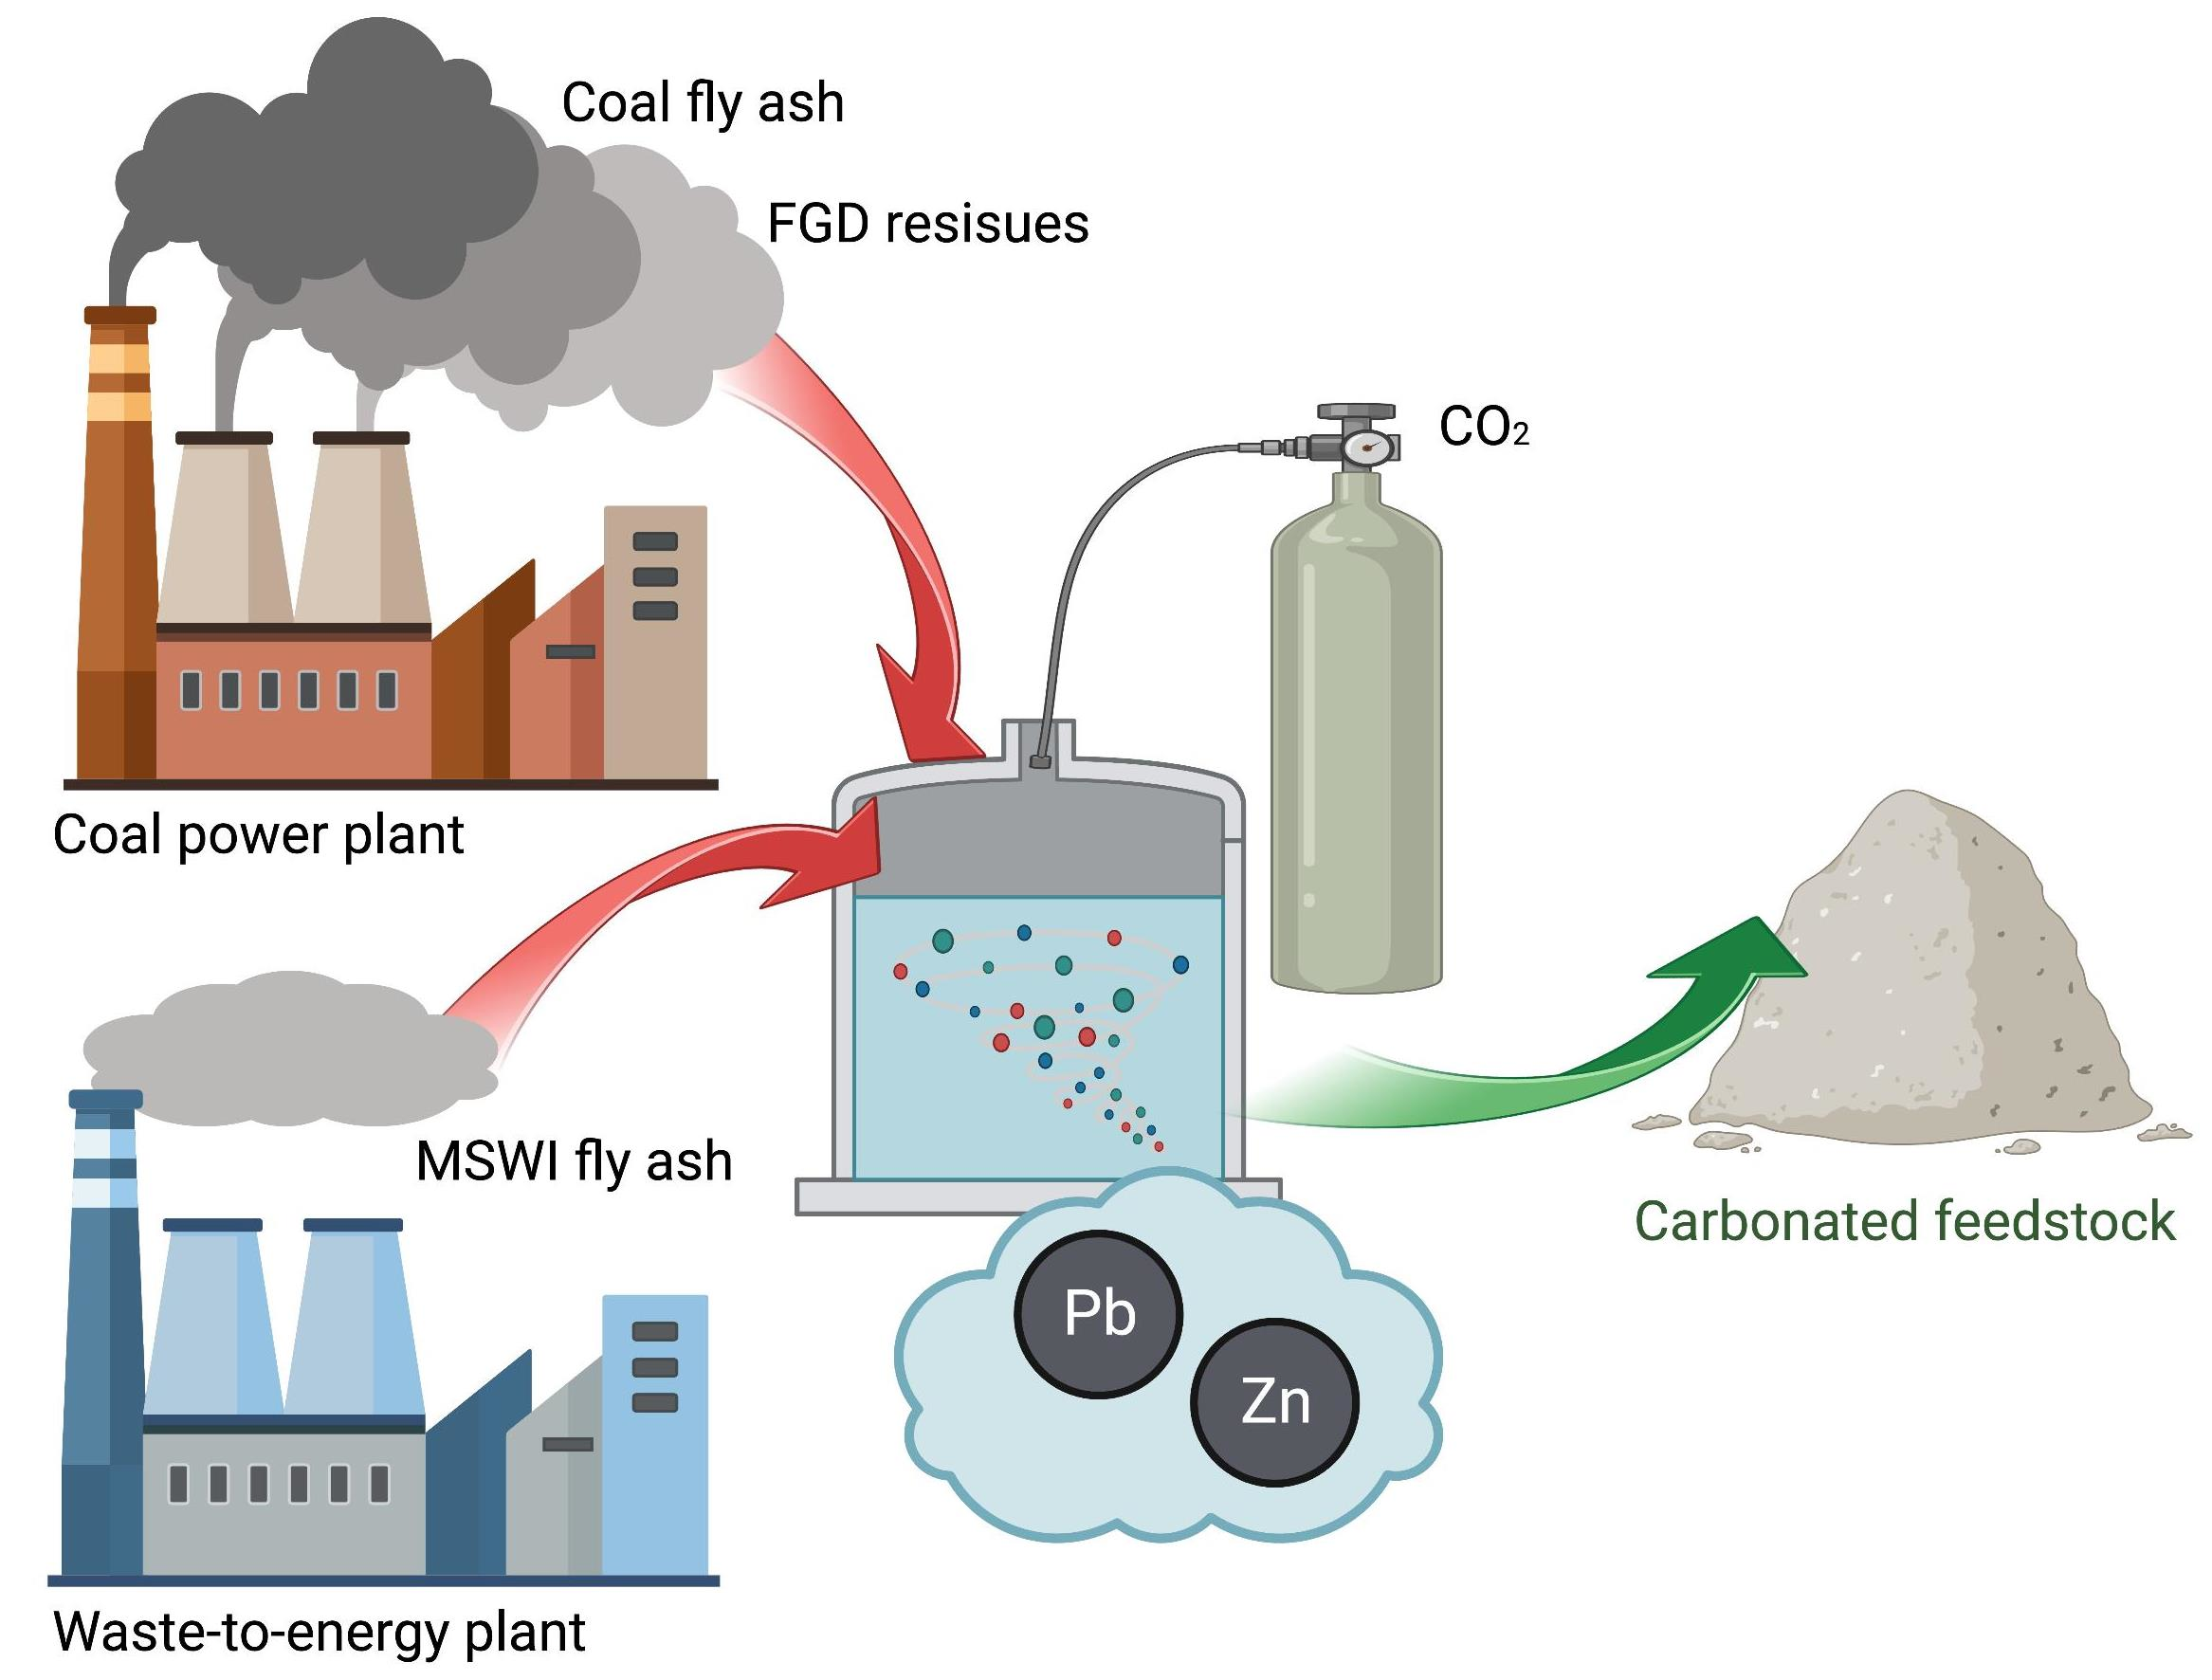
2.1. Raw Materials and Samples Preparation

The samples of MSWI FA and BA, CFA and FGD residues were provided by the A2A company (Brescia, Italy). The CFA results from pulverised coal combustion and is captured by APC equipment [29]. Previous studies have shown that this material can improve mechanical properties [30]. The FGD residues are generated during a scrubbing phase with CaO/Ca(OH)2, occuring after the dust-collection system, to remove sulphur oxides from the flue gas [31]. Because of its nature, it provides calcium ions. The MSWI FA and BA come from a co-combustion process involving municipal and industrial solid waste, as well as sewage sludge from wastewater treatment plants [32,33]. The MSWI FA is collected through a bag filter system. However, before collection in the bag filters, the gas stream undergoes NOx removal treatment and scrubbing with CaO/Ca(OH)2, which affects the fly ashes composition. The MSWI BA is collected in wet hoppers placed under the grates and provides amorphous compounds that are useful for the stabilisation process. Assi et al. [34] conducted TXRF analysis to obtain the chemical composition of the bulk samples, as shown in Table 1 [34]. Briefly, the CFA was mostly composed of S, K, Ca, and a sizeable amount of Fe; the FGD residues primarily comprised Ca and S; the MSWI BA contained S, K, Cl, and a significant amount of Ca and Fe. This ash also contained heavy metals such as Zn, Cu, and Pb; the MSWI FA had greater levels of S, K, Ca and Zn than the MSWI BA, but lower levels of Fe and Pb. The authors also leached these materials, using ultrapure water, with a solid-to-liquid ratio of 1:10 stirred for 2 h. The pH of each leached product was greater than 12, making them alkaline waste.
These samples were further characterised at the Faculty of Sciences-DGAOT (University of Porto, Porto, Portugal). First, the samples were quartered using the cone method. Subsequently, the fly ashes (FA) and FGD were then divided into smaller subsamples of approx. 10 g each, employing a rotary sample divisor coupled with a vibratory feeder (Retsch PT 100 + DR 100, Hann, Germany). The MSWI BA subsample was cut off at 2 mm and the fraction <2 mm was successively ground using a mechanic mill (Retsch RM 200, Hann, Germany) until the entire sample passed the 100 mesh (150 μm) sieve and was split using the rotary sample divisor. For SEM-EDS analysis, polished blocks of all the samples studied were prepared according to ISO-7404-2 [35]. Eventually, the blocks were divided into two pieces perpendicular to their top and bottom faces to avoid any bias caused by particles sinking or floating on the epoxy.

2.2. Analytical Techniques

Dry and wet sieving trials were carried out to determine the particle size distribution of the bulk samples studied. Previously, the samples were dried at 50 °C until constant weight. The dry sieving (DS) was performed by using a sieve agitator (Retsch AS200, Hann, Germany) for 20 min at 60% vibration amplitude (adapted from DS/EN 15,149–2 [36]). The FA and FGD residues were sieved using a set of Retsch sieves of 150, 75, 45, and 25 μm, while the MSWI BA was sieved using a set of Retsch sieves of 4 mm, 2 mm, 1 mm, 0.5 mm, 250 μm, and 150 μm. To check the efficiency of the method and assess the effect of the agglomeration on the particle size distribution, wet sieving trials (WS) were performed for the FA and FGD samples, using the same set of sieves with a sieve agitator Fritsch Analysette 3 Spartan equipped with a water jet on the sieve’s column top. The process was stopped once the water flow exiting at the bottom was clear. After, the fractions were filtered and dried at 50 °C until a constant weight was reached.
The amount of immediately soluble compounds was determined via simple washing of the <150 μm fraction of the bulk samples studied. The samples (10 g of each) were added to a beaker with deionized water resulting in a liquid-to-solid ratio of 30 and stirred for 15 min using an IKA Microstar 7.5 control operating at 900 rpm, and then filtered and weighed. After passing through the filters, the water solutions were left to evaporate at 50 °C and the soluble fraction precipitates weighed. The Loss on Ignition (LOI) was determined by heating the samples at 1000 °C for 2 h in a 47,900-Thermolyne muffle and then cooling them in a desiccator and re-weighing according to ASTM C25-19 [37].
To identify the mineral species and the amount of crystalline and amorphous phases of the bulk samples studied, X-ray diffraction (XRD) analysis was carried out at the Chemistry for Technologies Lab of the University of Brescia (Italy) using a PANalytical X’Pert PRO diffractometer (Netherlands) operating at 40 kV and 40 mA with a Cu K anode. The step interval used for the scans (2θ) was 0.017°, and the range of angles covered was 10°–80°. The diffractogram was analysed using PANalytical X’Pert HighScore Plus version 2.1.0 in conjunction with the ICDD PDF2 database, 1998. The PROFEX open-source software (version 4.3.6, released 17 December 2021) was used to perform the Rietveld method quantification of the amounts of the various crystalline species and amorphous content [38]. Since the samples did not include the aluminium oxide phase, corundum was added to the dried bulk samples as an internal standard in the amount of 25 wt.% for the Rietveld method. The software supplied the BGNM Database and the Crystallography Open Database (COD) with all the structural files needed to complete the Rietveld refinement.
Detailing the imaging and chemical composition of the samples was conducted using an FEI Quanta 400 FEG ESEM/EDAX Genesis X4M operated in high vacuum mode at 15 kV, the SEM-EDS analysis was carried out at the Centro de Materiais da Universidade do Porto (CEMUP). Each bulk sample, including the powder and polish blocks, was sputtered with carbon before analysis. Backscattered electron detection mode (BSE) was used for the studies to identify the various phases and acquire a thorough representation of the particles’ structure.

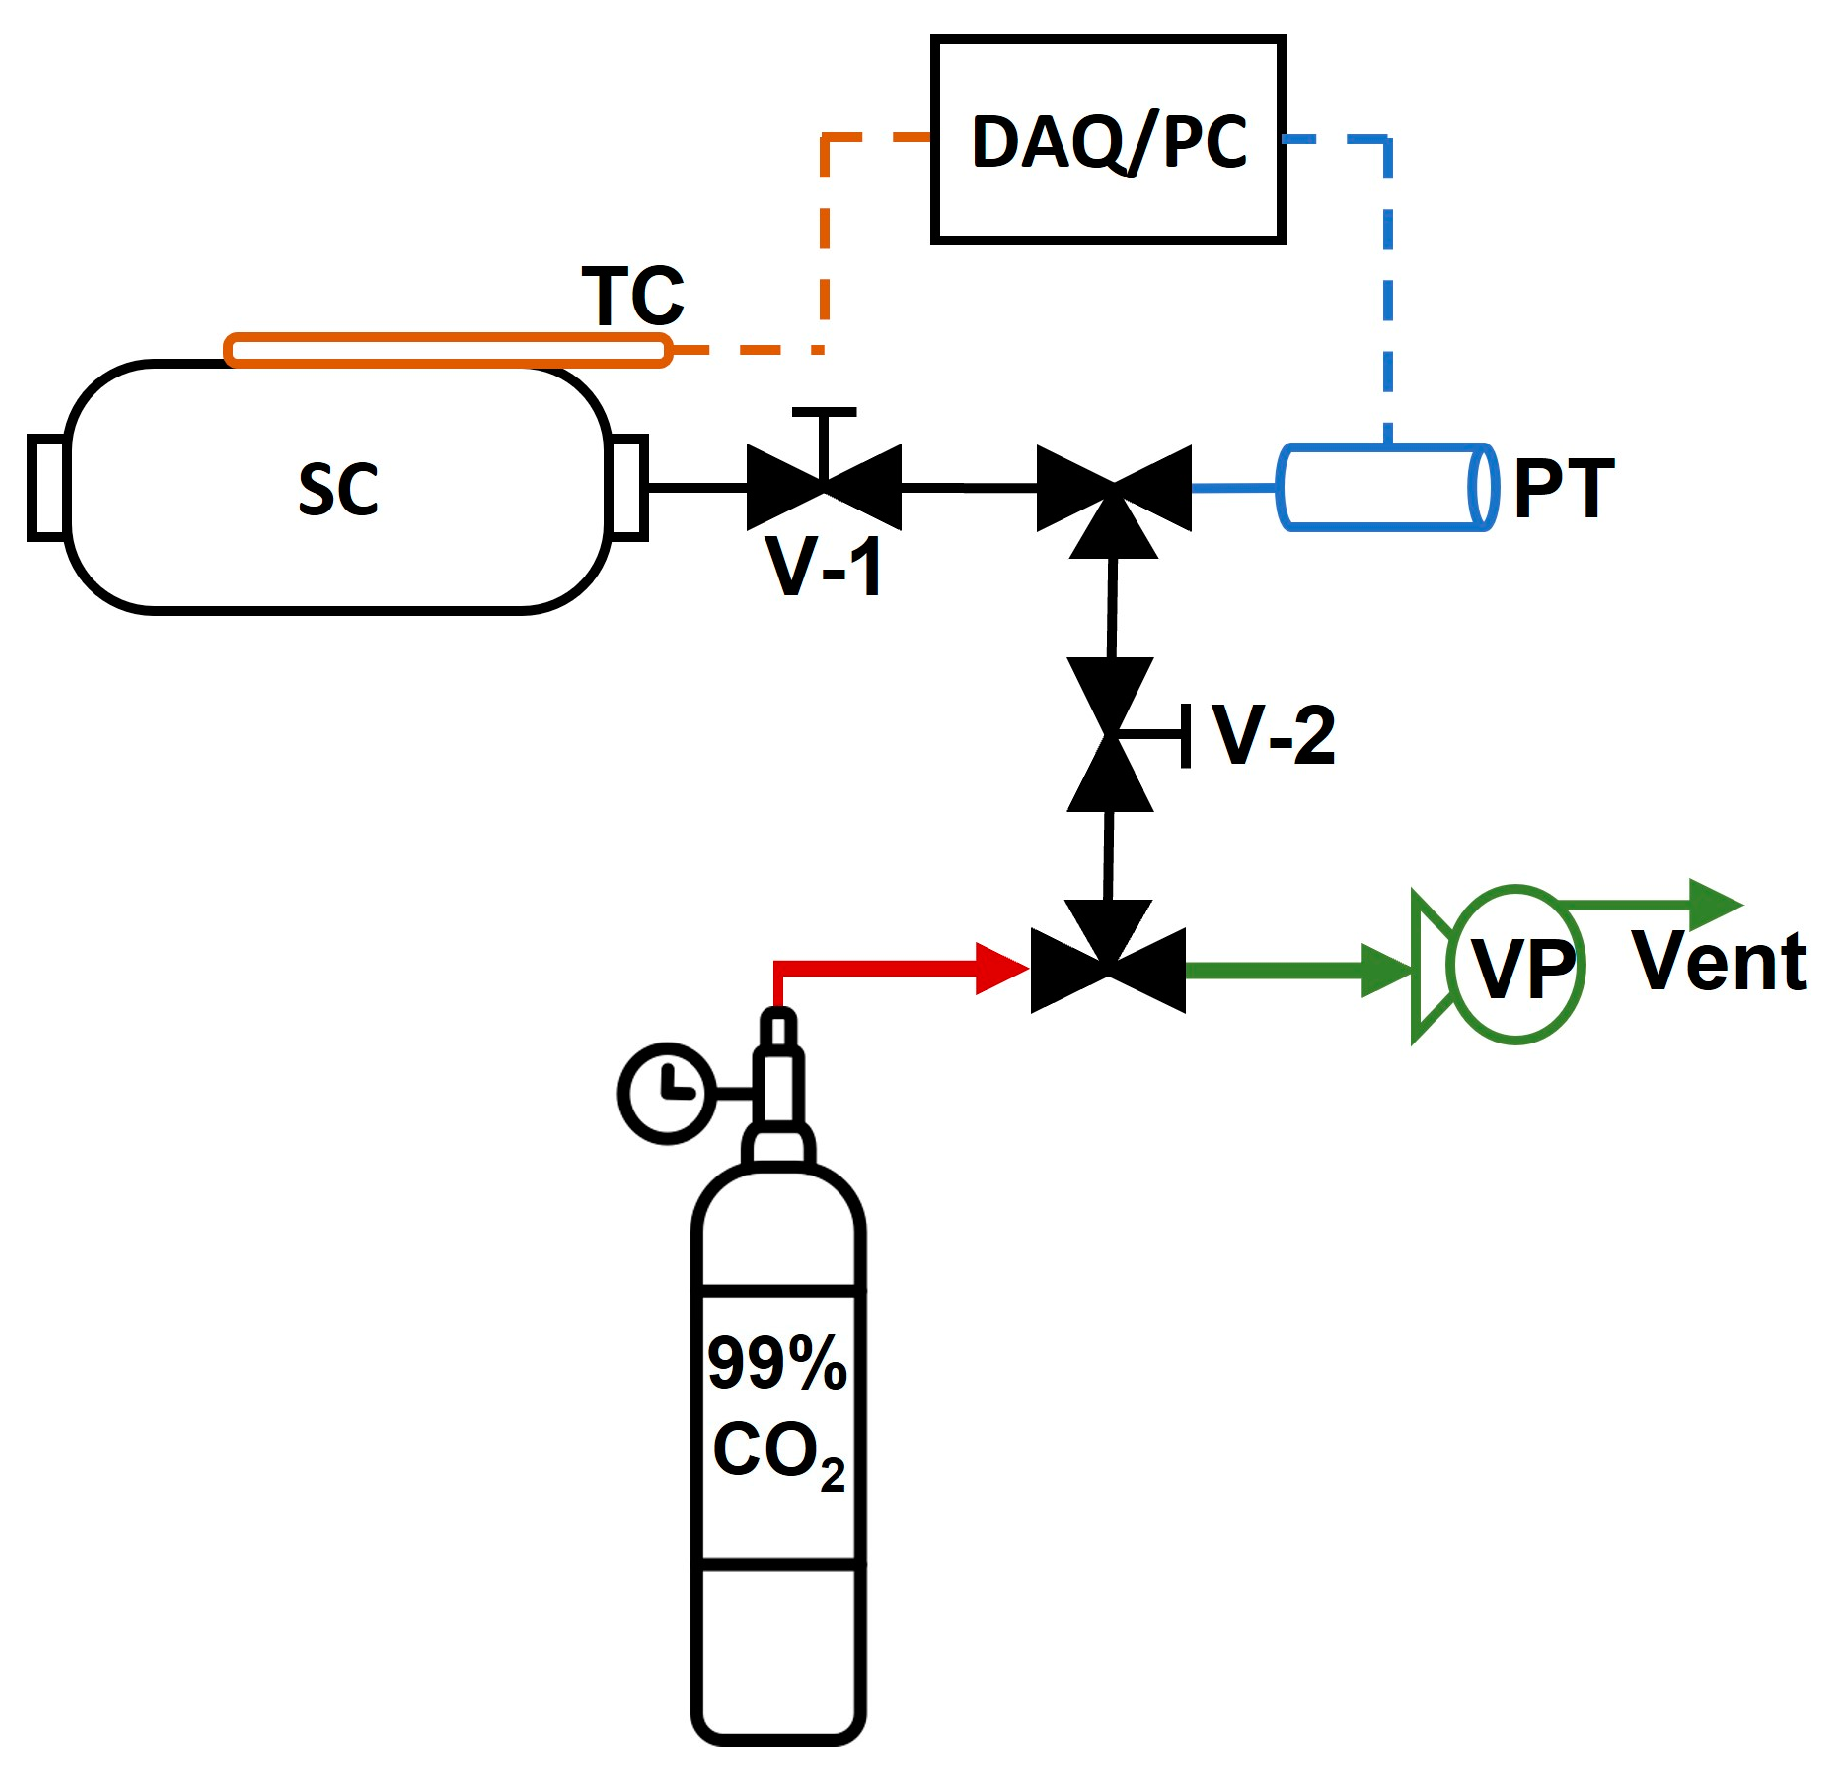
2.3. Carbonation Tests

Carbonation tests were conducted at the Chemistry for Technologies Lab of the University of Brescia (Italy) following the patented recipe proposed by Assi, A. et al. [34] to stabilise the leachable heavy metals contained in the MSWI FA through pozzolanic reactions. As the first step, the technology required cutting off the MSWI BA at 2 mm, while the diameter <2 mm was dried at 105 °C until constant weight, and then the magnetic materials were recovered for recycling purposes. In order to ensure that the MSWI BA would be equivalent to other ashes used as pozzolanic substitutes [39], the sample was crushed and sieved to a particle size <106 µm. Subsequently, the MSWI FA, FGD, CFA, and MSWI BA were mixed to make a composite sample with the following composition: 59 wt.%, 18 wt.%, 14 wt.%, and 9 wt.%, respectively (labelled from now on as BLEND). The mixture was homogenised by adding Milli-Q water (Millipore DirectQ-5 TM, Millipore S.A. S., 67,120, Molsheim, France) and stirring for 10 min.
To evaluate the impact of the water content on the original patented recipe, different L/S ratios were used: 0.7, 0.9, and 1.2 L/kg. After, two carbonation trials were conducted: natural carbonation (NC) and accelerated carbonation (AC). In the NC experiments, samples with various L/S ratios (labelled NC1_0.7, NC1_0.9, and NC1_1.2) were stored at ambient conditions for a month and mildly remixed once a week after solidification. The study was extended for an additional two months only for the sample with an L/S ratio of 0.9 (NC2_0.9). In the case of the AC experiments, samples with the same L/S ratios (labelled AC_0.7, AC_0.9, and AC_1.2) were placed in a closed environment filled with 99% pure CO2 at 15 bars. Additionally, the sample with an L/S ratio of 0.9 was likewise subjected to a continuous stream of CO2 at constant pressure (15 bars) (renamed as AC_0.9_bis), to assess the influence of the pressure over time. The resulting NC and AC samples were then dried at 105 °C until constant weight and ground XRD analyses and Rietveld refinement. The samples NC2_0.9 and AC_0.9_bis were selected to be studied by the SEM-EDS instrument because of their expected higher carbonation content. Table 2 provides a summary of the NC and AC tests.
The experimental setup for the AC process is depicted in Figure 1, and the methodology is described by Sorrentino et al. [28]. Briefly, it consisted of a sample cylinder (SC), a pressure transmitter (PT), and a data acquisition system (DAQ) regarding pressure and temperature connected to a computer (PC) equipped with the software LabVIEW for data reading.

3. Results and Discussion

3.1. Particle Size Distribution and Immediate Soluble Content
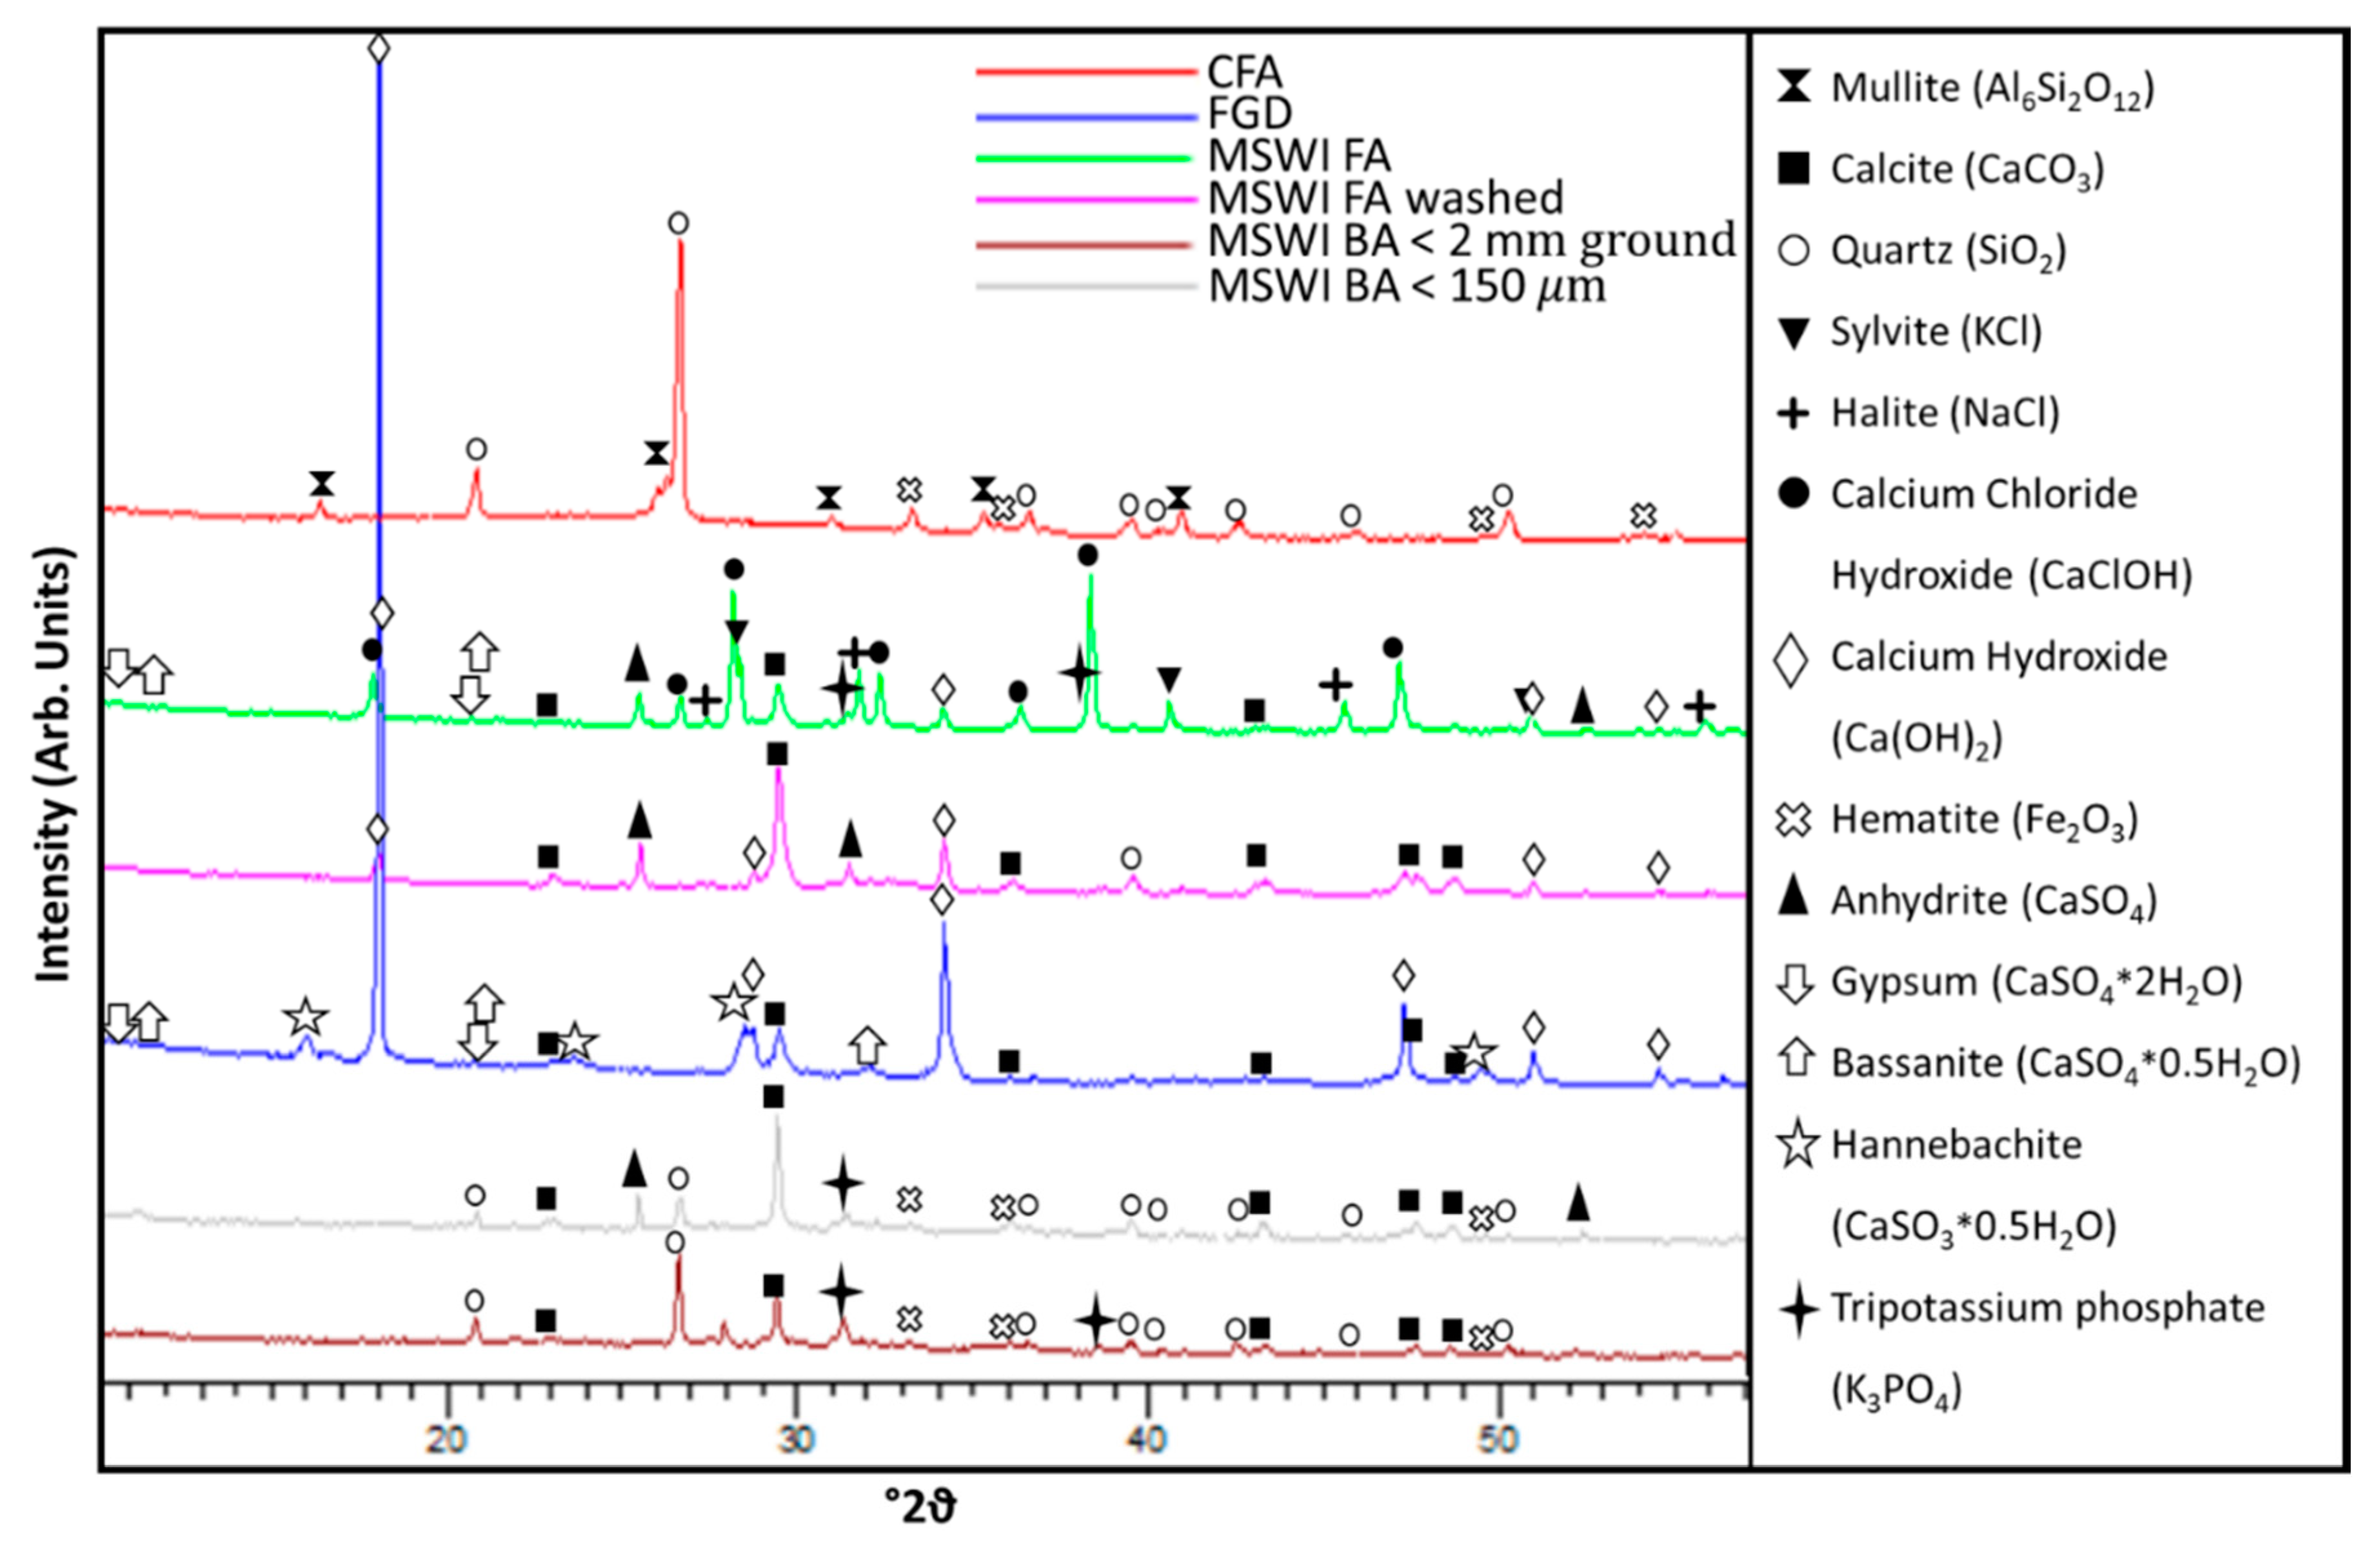
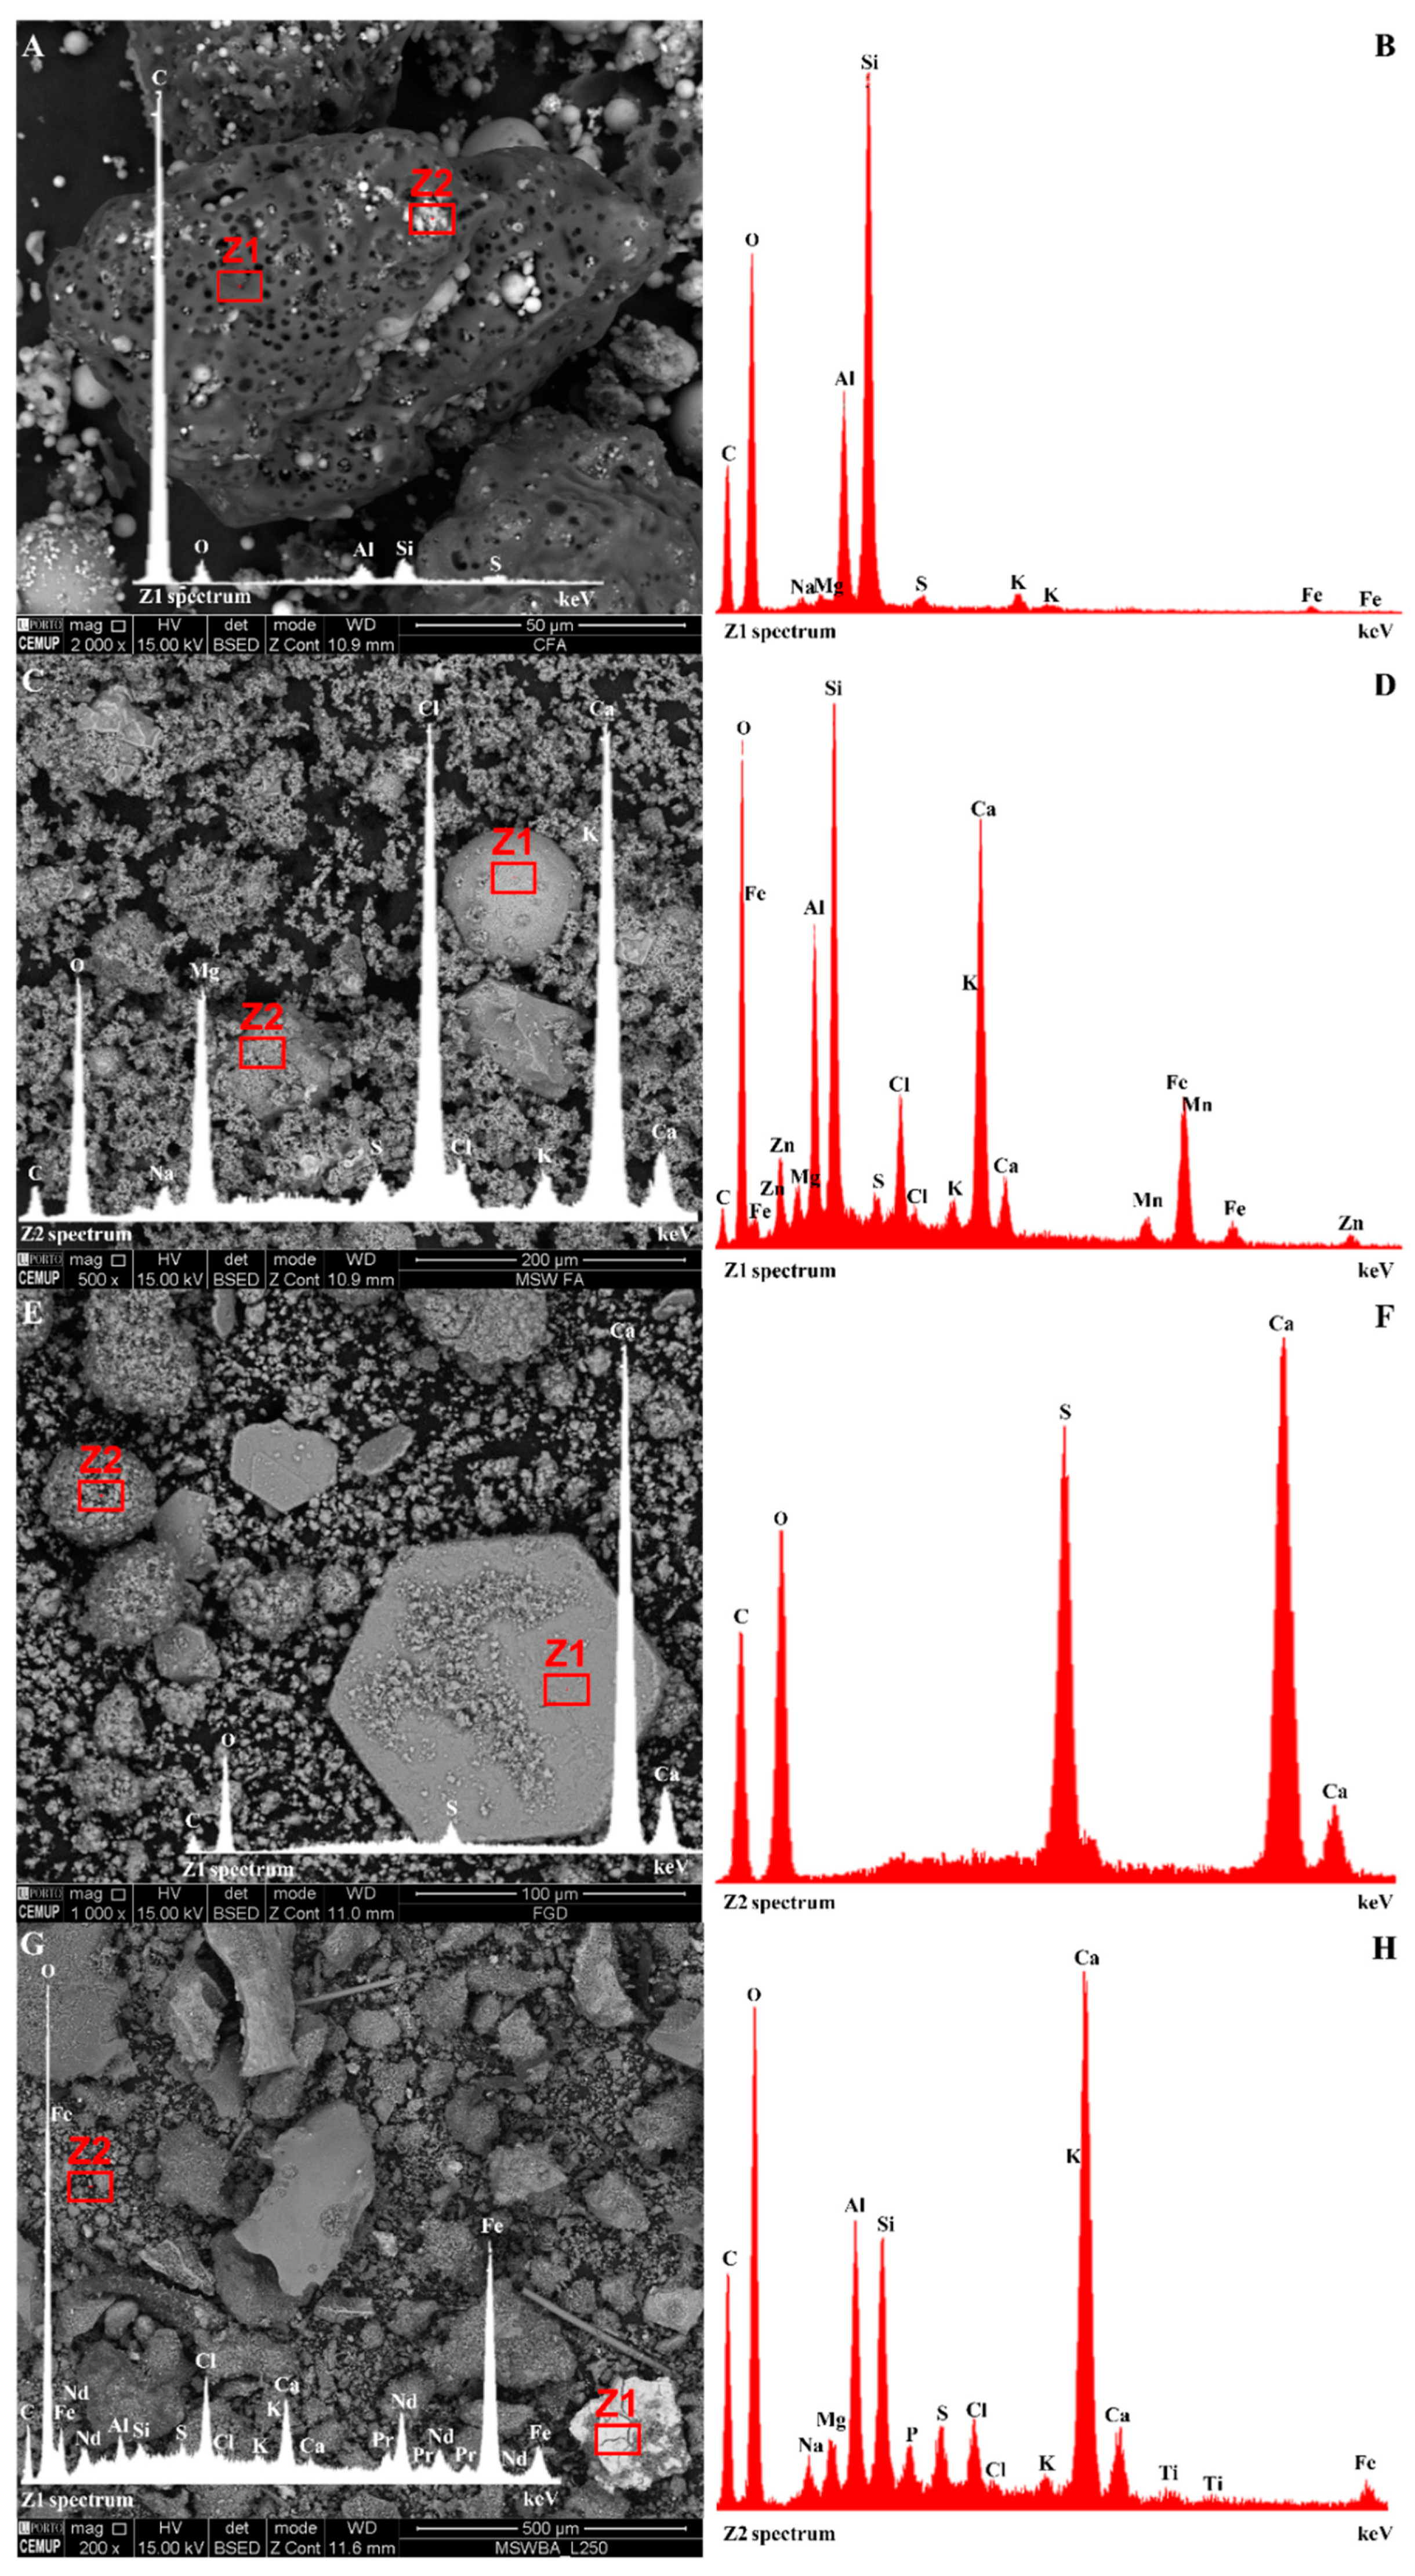
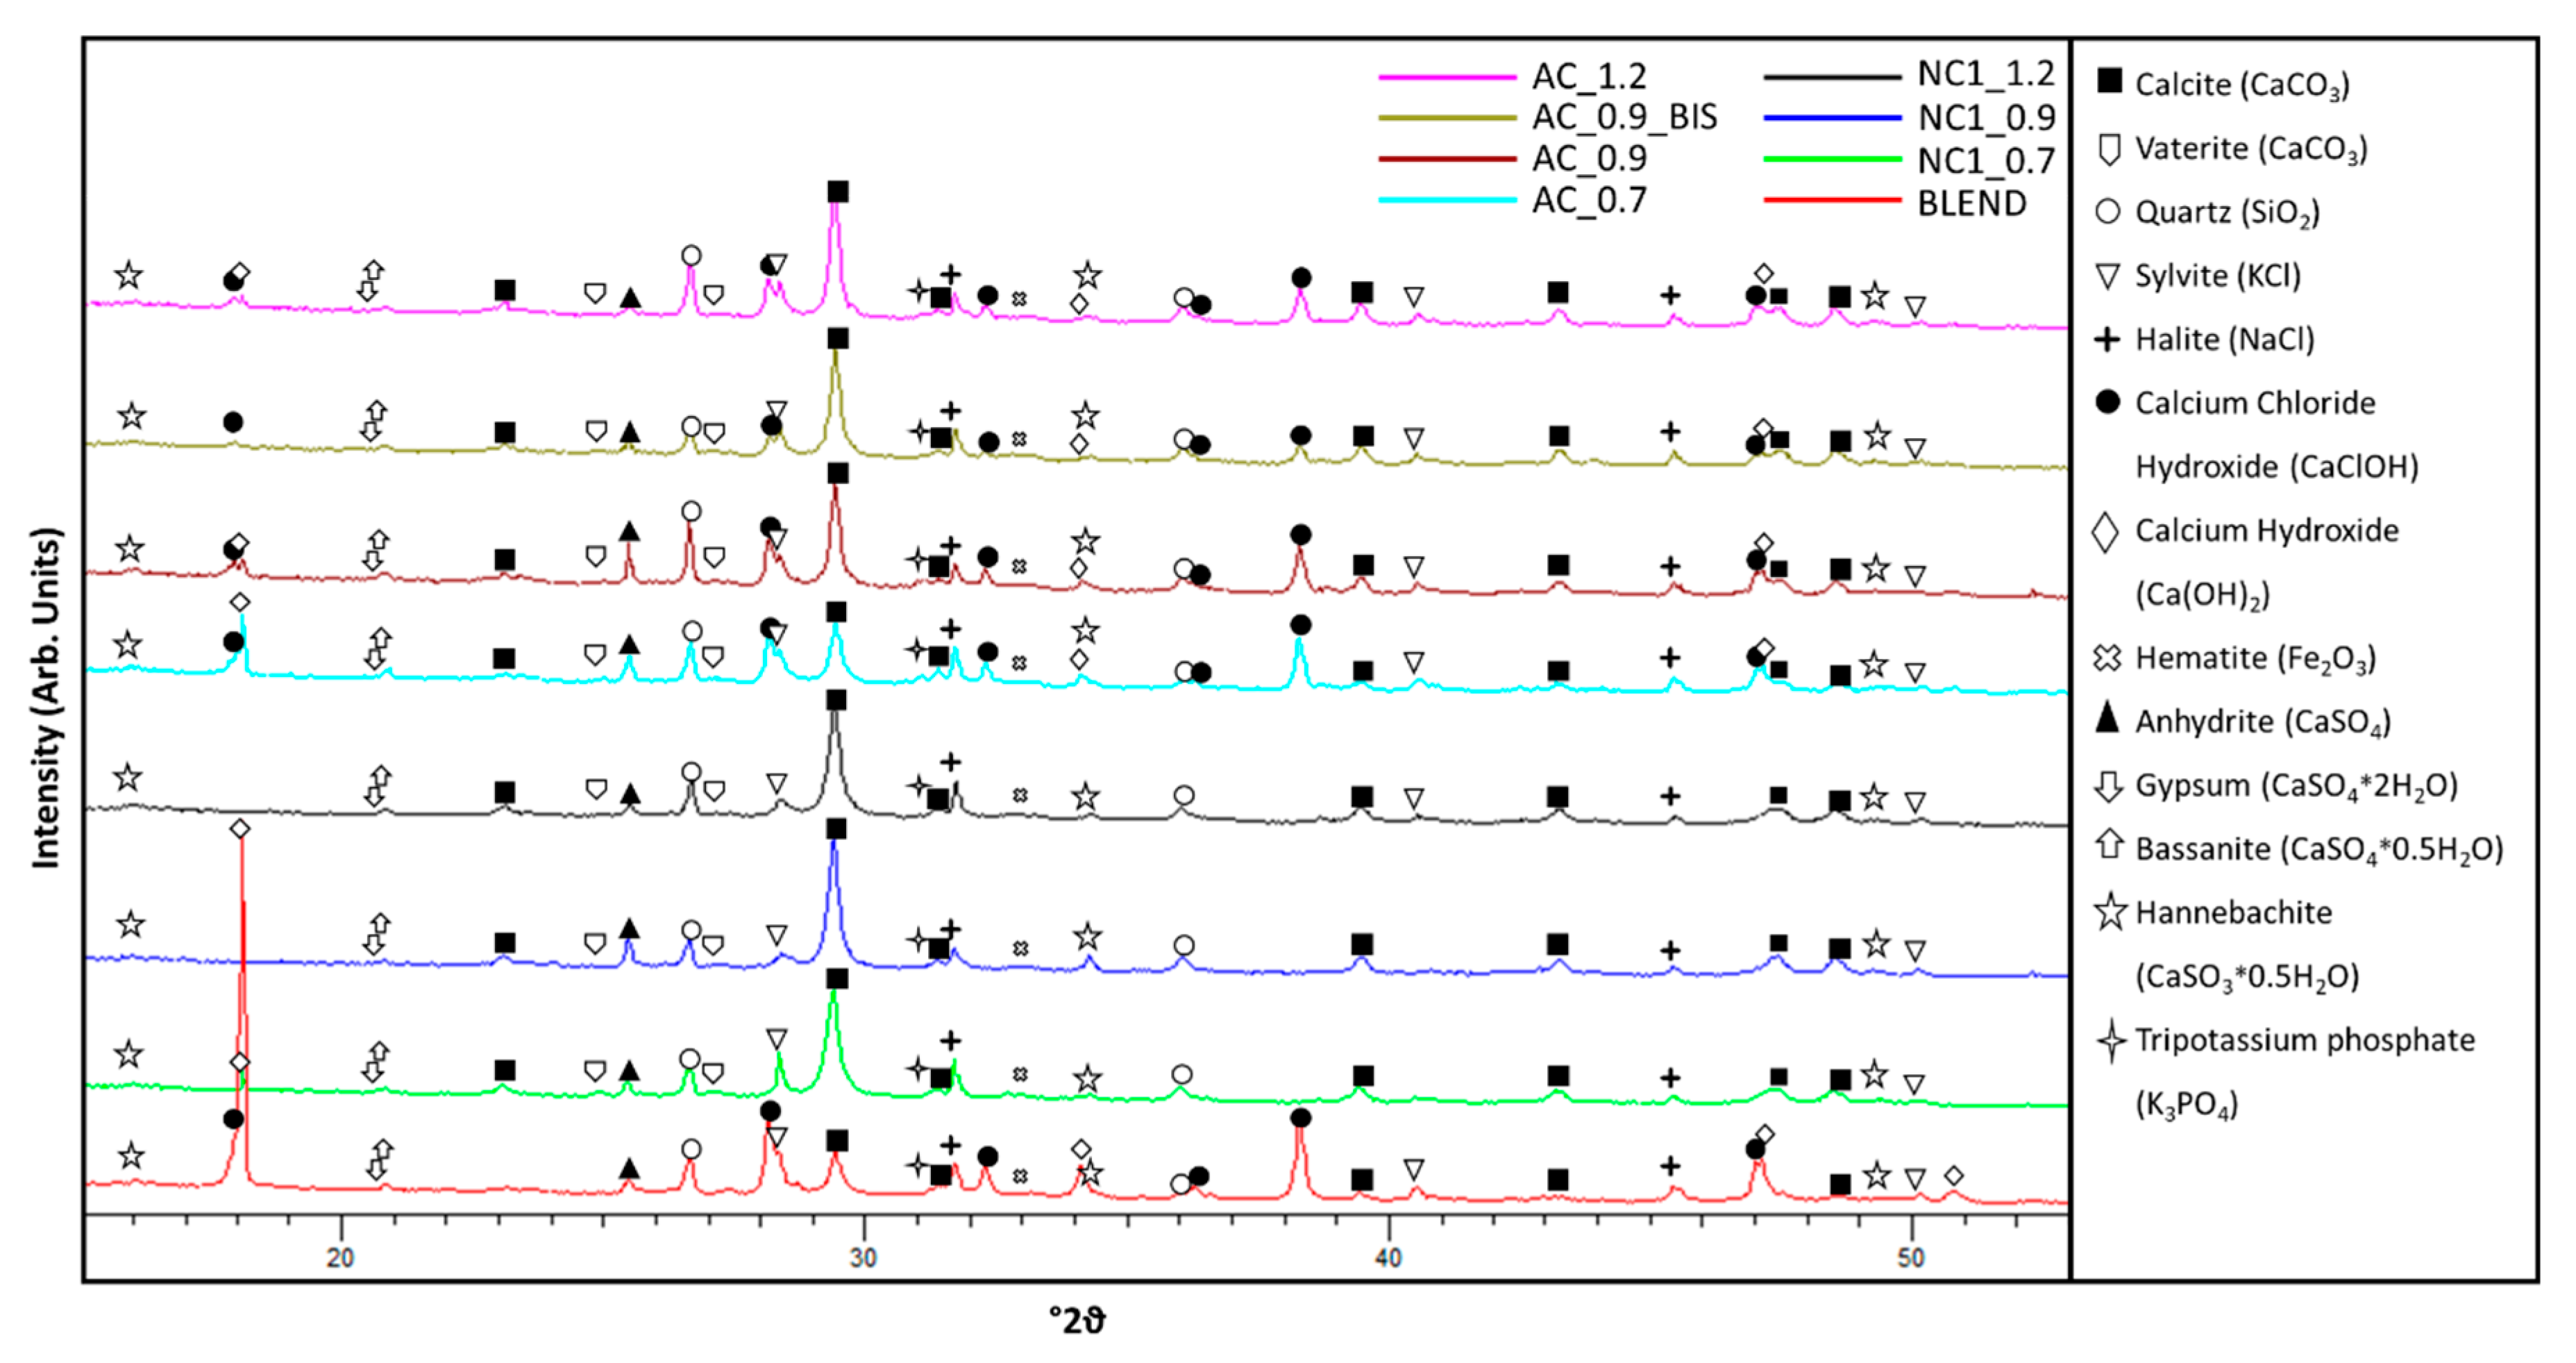
The results of the size-particle distribution for the studied samples are listed in Table 3. The DS trials indicated that the FA samples were mainly composed of fine particles with more than 70 wt.% passing the 45 µm sieve, the FGD sample was slightly coarser, and most particles fell within the 25–75 μm size range, while the MSWI BA was mainly composed of particles coarser than 1 mm (>75 wt.%). After the WS trials, significant mass losses were found (e.g., up to 47 wt.% of the MWSI FA) and <25 μm particles became dominant for the FA and FGD sample components owing to the dissolution of salts and sulphates that were acting as binding agents. This effect was most pronounced in the FGD sample where the size fraction <25 μm increased to 57 wt.%, while the size fraction >150 μm became residual. The fineness of the particles is essential for pozzolanic activities. The lower the particle sizes, the higher the specific surface, enhancing reactivity and mechanical strength and regulating the water demand needed for the reactions [40]. However, fine particles also contribute to a decrease in the slurries’ viscosity and permeability, which may hinder the mobility of CO2-rich water.
The immediate soluble content determination of the CFA resulted in 10.4 wt.%, which closely aligned with the mass loss recorded from the WS (8 wt.%), while the soluble concentration of the FGD was 14.9 wt.% with a WS mass loss of 28 wt.%, which was probably because of the harsher conditions of the WS sieving trials over the FGD materials. The value for the MSWI FA was the highest (44.7 wt.%) and represented nearly half of the sample. This result was also comparable to the WS mass loss (47 wt.%). Comparing the outcome of the washing process for the particle size fraction <150 µm from the sieving process and the fraction <2 mm ground in the case of MSWI BA revealed distinct behaviour. There were 11.5 wt.% of soluble substances in the first, while only 6.4 wt.% were present in the second.
The LOI analyses conducted on the bulk samples showed that the CFA sample had the lowest LOI value (12.08 wt.%) in comparison to the other samples studied, possibly owing to the presence of unburned carbon. The MSWI FA and the FGD samples showed higher LOI results (respectively, 20.05 wt.% and 16.16 wt.%), which were mainly due to the decomposition of carbonates. The MSWI BA <2 mm ground fraction studied had a low LOI value (10.02 wt.%) owing to low carbonaceous matter and carbonates in its composition. Conversely, the MSWI BA <150 µm size fraction sample had an LOI value (20.76 wt.%) similar to the MSWI FA.

3.2. Ash Mineralogy

The XRD and Rietveld results are listed in Table 4 and shown in Figure 2. The CFA was mainly composed of an aluminosilicate amorphous fraction, quartz, mullite (Table 4; Figure 2), and unburned carbon (Figure 3A,B).
The MSWI FA contained a great variety of Ca-bearing phases, including hydroxy chloride, hydroxyl, carbonate, and sulphate in the form of calcium hydroxy chloride (in major amounts), portlandite, calcite, gypsum and bassanite, as well as minor amounts of salts such as sylvite and halite. The presence of tripotassium phosphate is related to combustion condensates from biomass and sewage sludge. The amorphous fraction of the MSWI FA was composed of discrete particles of partially decomposed calcite, amorphous counterparts of the minerals identified either as discrete particles or condensed on the particles’ surface, and unburned carbon (Table 4; Figure 2 and Figure 3C,D). Because of the high content of immediately soluble compounds present in this ash, only the diffractogram of the washed MSWI FA was reported (Figure 2). This pattern, when compared to the as-received ash, indicated that the soluble crystalline phases were calcium hydroxide chloride, tripotassium phosphate, sylvite, and halite; the quantities calculated with the Rietveld were in line with the determination of the immediate soluble content. The presence of salts and chlorides can lead to challenges in the reuse of this material, especially in the construction field, as they can be responsible for the accelerated corrosion of reinforced concrete [41].
The FGD residues were also mostly composed of Ca-bearing phases such as portlandite, bassanite, hannebachite, calcite, and gypsum (Table 4; Figure 2 and Figure 3E,F). The high amounts of S-bearing phases (anhydrite, bassanite, hannebachite, and gypsum) in the MSWI FA and FGD are related to the use of lime as a scrubbing agent to remove sulphur from the gas stream. The calcite’s presence might be related to the natural carbonation reaction of CaO with CO2 during storage [25].
The MSWI BA <2 mm sample was mainly composed of a highly heterogeneous amorphous fraction, which included aluminosilicate slag, amorphous metallic grains of Fe, Zn, condensed chlorides, phosphates, and sulphates, among others (Table 4; Figure 2 and Figure 3G,H). Minor amounts of quartz and calcite relics and tripotassium phosphate (from sewage sludge combustion) comprised the crystalline phases of the MSWI BA sample along with residual amounts of other minerals. From the XRD analysis, it was clear that the MSWI BA <150 μm and the <2 mm ground samples differed in composition. Indeed, the first one doubled the content of calcite, and it had a minor content of quartz, tripotassium phosphate, and amorphous phases. These differences in the MSWI BA resulted from the co-incineration of different wastes, which generated distinct particles in terms of size and composition.

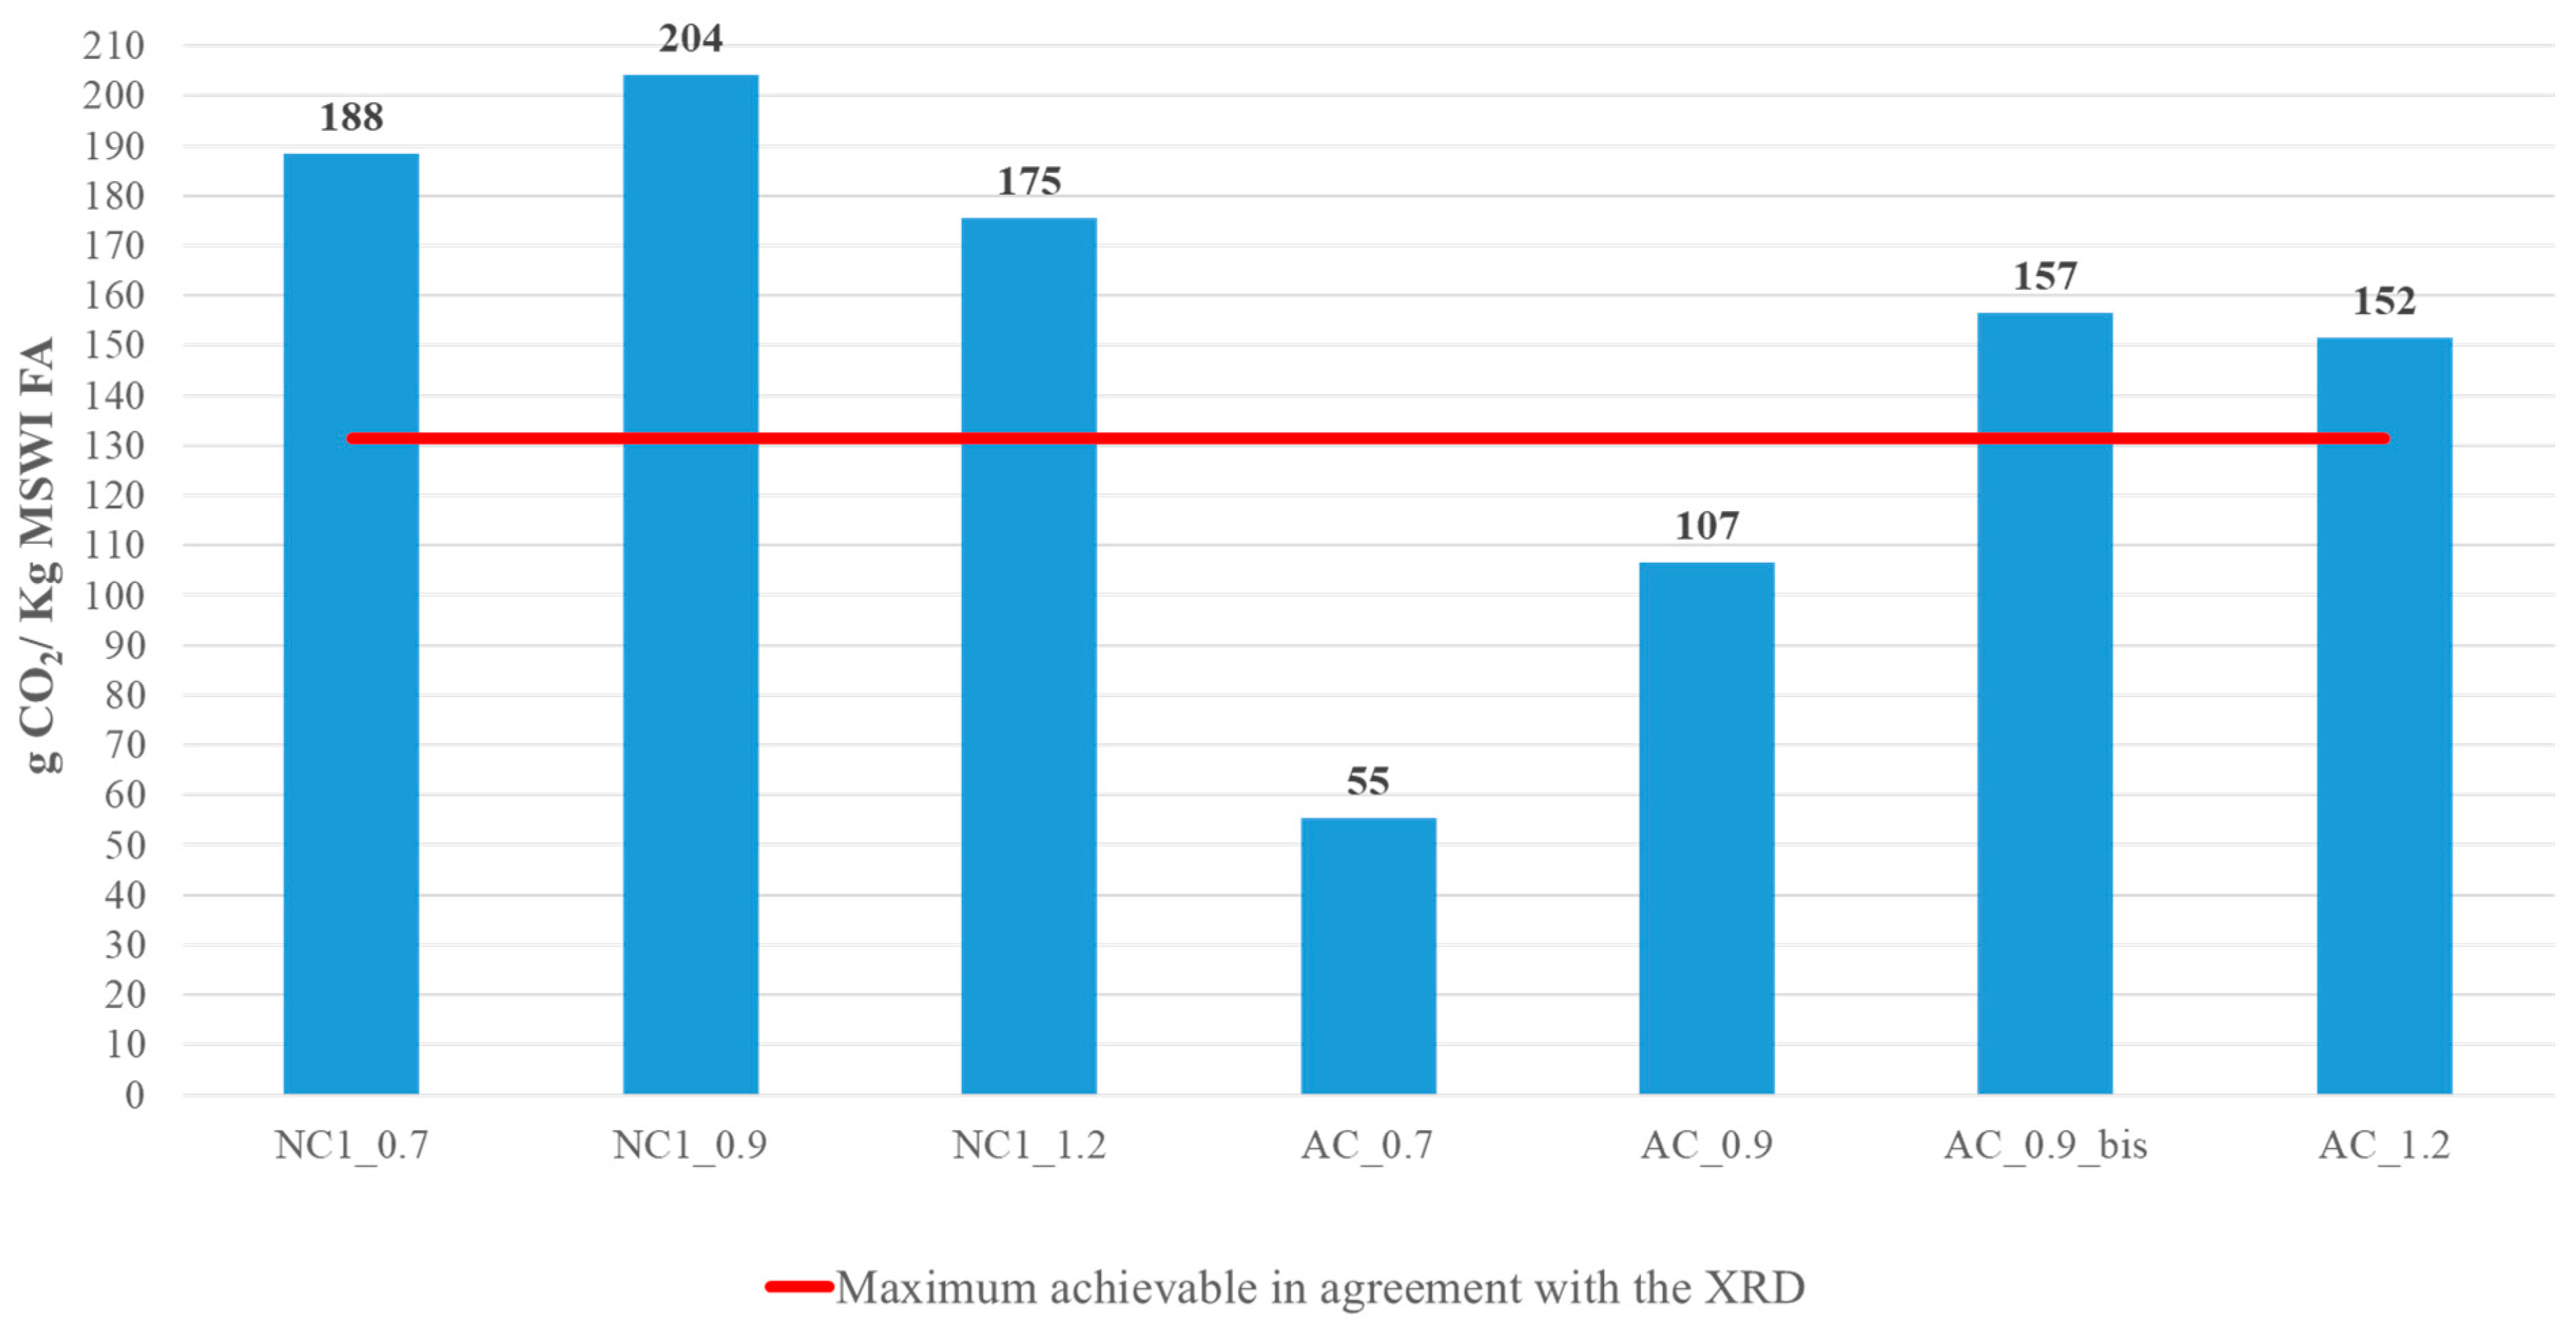
3.3. Natural and Accelerated Carbonation Experiments

3.3.1. Natural Carbonation Experiments

The sample labelled as BLEND (which, for ease of reference, was composed of 59 wt.% MSWI FA, 18 wt.% FGD, 14 wt.% CFA, and 9 wt.% MSWI BA) represented the initial material before the addition of water and therefore the start of the carbonation tests. With the aim of assessing the impact of the carbonation trials on the BLEND sample, the LOI was conducted as an indicator of the possible reaction response of all the samples (Table 5). Taking into consideration the NC samples, which reached the highest value of LOI, it was possible to observe an increase from 24.21 wt.% (BLEND) to 31.31 wt.% (NC1_0.9). This could be an indicator that sequestration of CO2 corresponds to an increase in carbonates such as calcite, vaterite, or amorphous carbonates, which have different decomposition temperatures, all falling into a wide range of 415 °C to 990 °C [42].
Based on the XRD analyses, the carbonation reaction was only supported by portlandite (Ca(OH)2) and calcium hydroxy chloride (CaClOH), which are crystalline compounds able to react with the CO2 to form calcium carbonate (CaCO3), according to the following equations, which are a summary of the reactions that occur with carbon acids:
Ca(OH)2(s) + CO2(g) → CaCO3(s) + H2O(l)
2CaClOH(s) + CO2(g) → CaCO3(s) + CaCl2(s) + H2O(l)
In particular, Ca(OH)2 was mostly present in the FGD residues and MSWI FA, whereas CaClOH was only identified in the latter. Meanwhile, the presence of anhydrite, bassanite, hannebachite, and gypsum was related to the scrubbing mechanism at both plants, which removes sulphur from the gas stream, whereas the Na, K, and P-bearing phases were related to combustion condensates from biomass and sewage sludge. The presence of calcite in the BLEND, on the other hand, was most likely the result of natural carbonation that occurred when the ashes were stored for future use or disposal [25]. The presence of salts, such as NaCl and KCl in the BLEND, was also due to the MSWI FA. In the final ashes, the quartz largely came from the CFA and MSWI BA. The qualitative patterns obtained by the XRD analyses and the semi-quantitative results obtained by the Rietveld method are shown in Figure 4 and Table 6, respectively. In all the trials, the CaCl2, a reaction product in Equation (2), was not detected by the XRD. This could be explained by its high solubility and the consequent possibility of ionic recombination with various chemicals as crystalline and/or amorphous forms [43,44].
In all the carbonated samples tested under NC conditions, which were NC1_0.7, NC1_0.9, and NC1_1.2 (numbers indicating L/S ratio), the XRD analyses revealed an overall decrease in the Ca(OH)2 and CaClOH content (from 16 wt.% and 7 wt.%, respectively, to less than 1 wt.%) due to the reaction with the CO2. Conversely, there was a clear increase in the total CaCO3 amount (the sum of the calcite and vaterite content). Considering the amounts of calcite and vaterite alone, the L/S ratio did not seem to substantially influence the NC reaction since the three trials showed similar values of total CaCO3 passing from 10 wt.% (BLEND) to a maximum of 34 wt.% (NC1_0.9). However, the amorphous materials composition is unknown and may provide a different conclusion. A difference between the three samples was noted regarding hardness, as the liquid-to-solid ratio decreased the more difficult it was to grind the sample to perform the analyses. Given the presence of pozzolanic and cementitious reactions, this would agree with the liquid-to-solid ratio for cement, as it is known to be a paramount parameter that influences the structure; indeed, the higher the ratio, the weaker the strength [45].

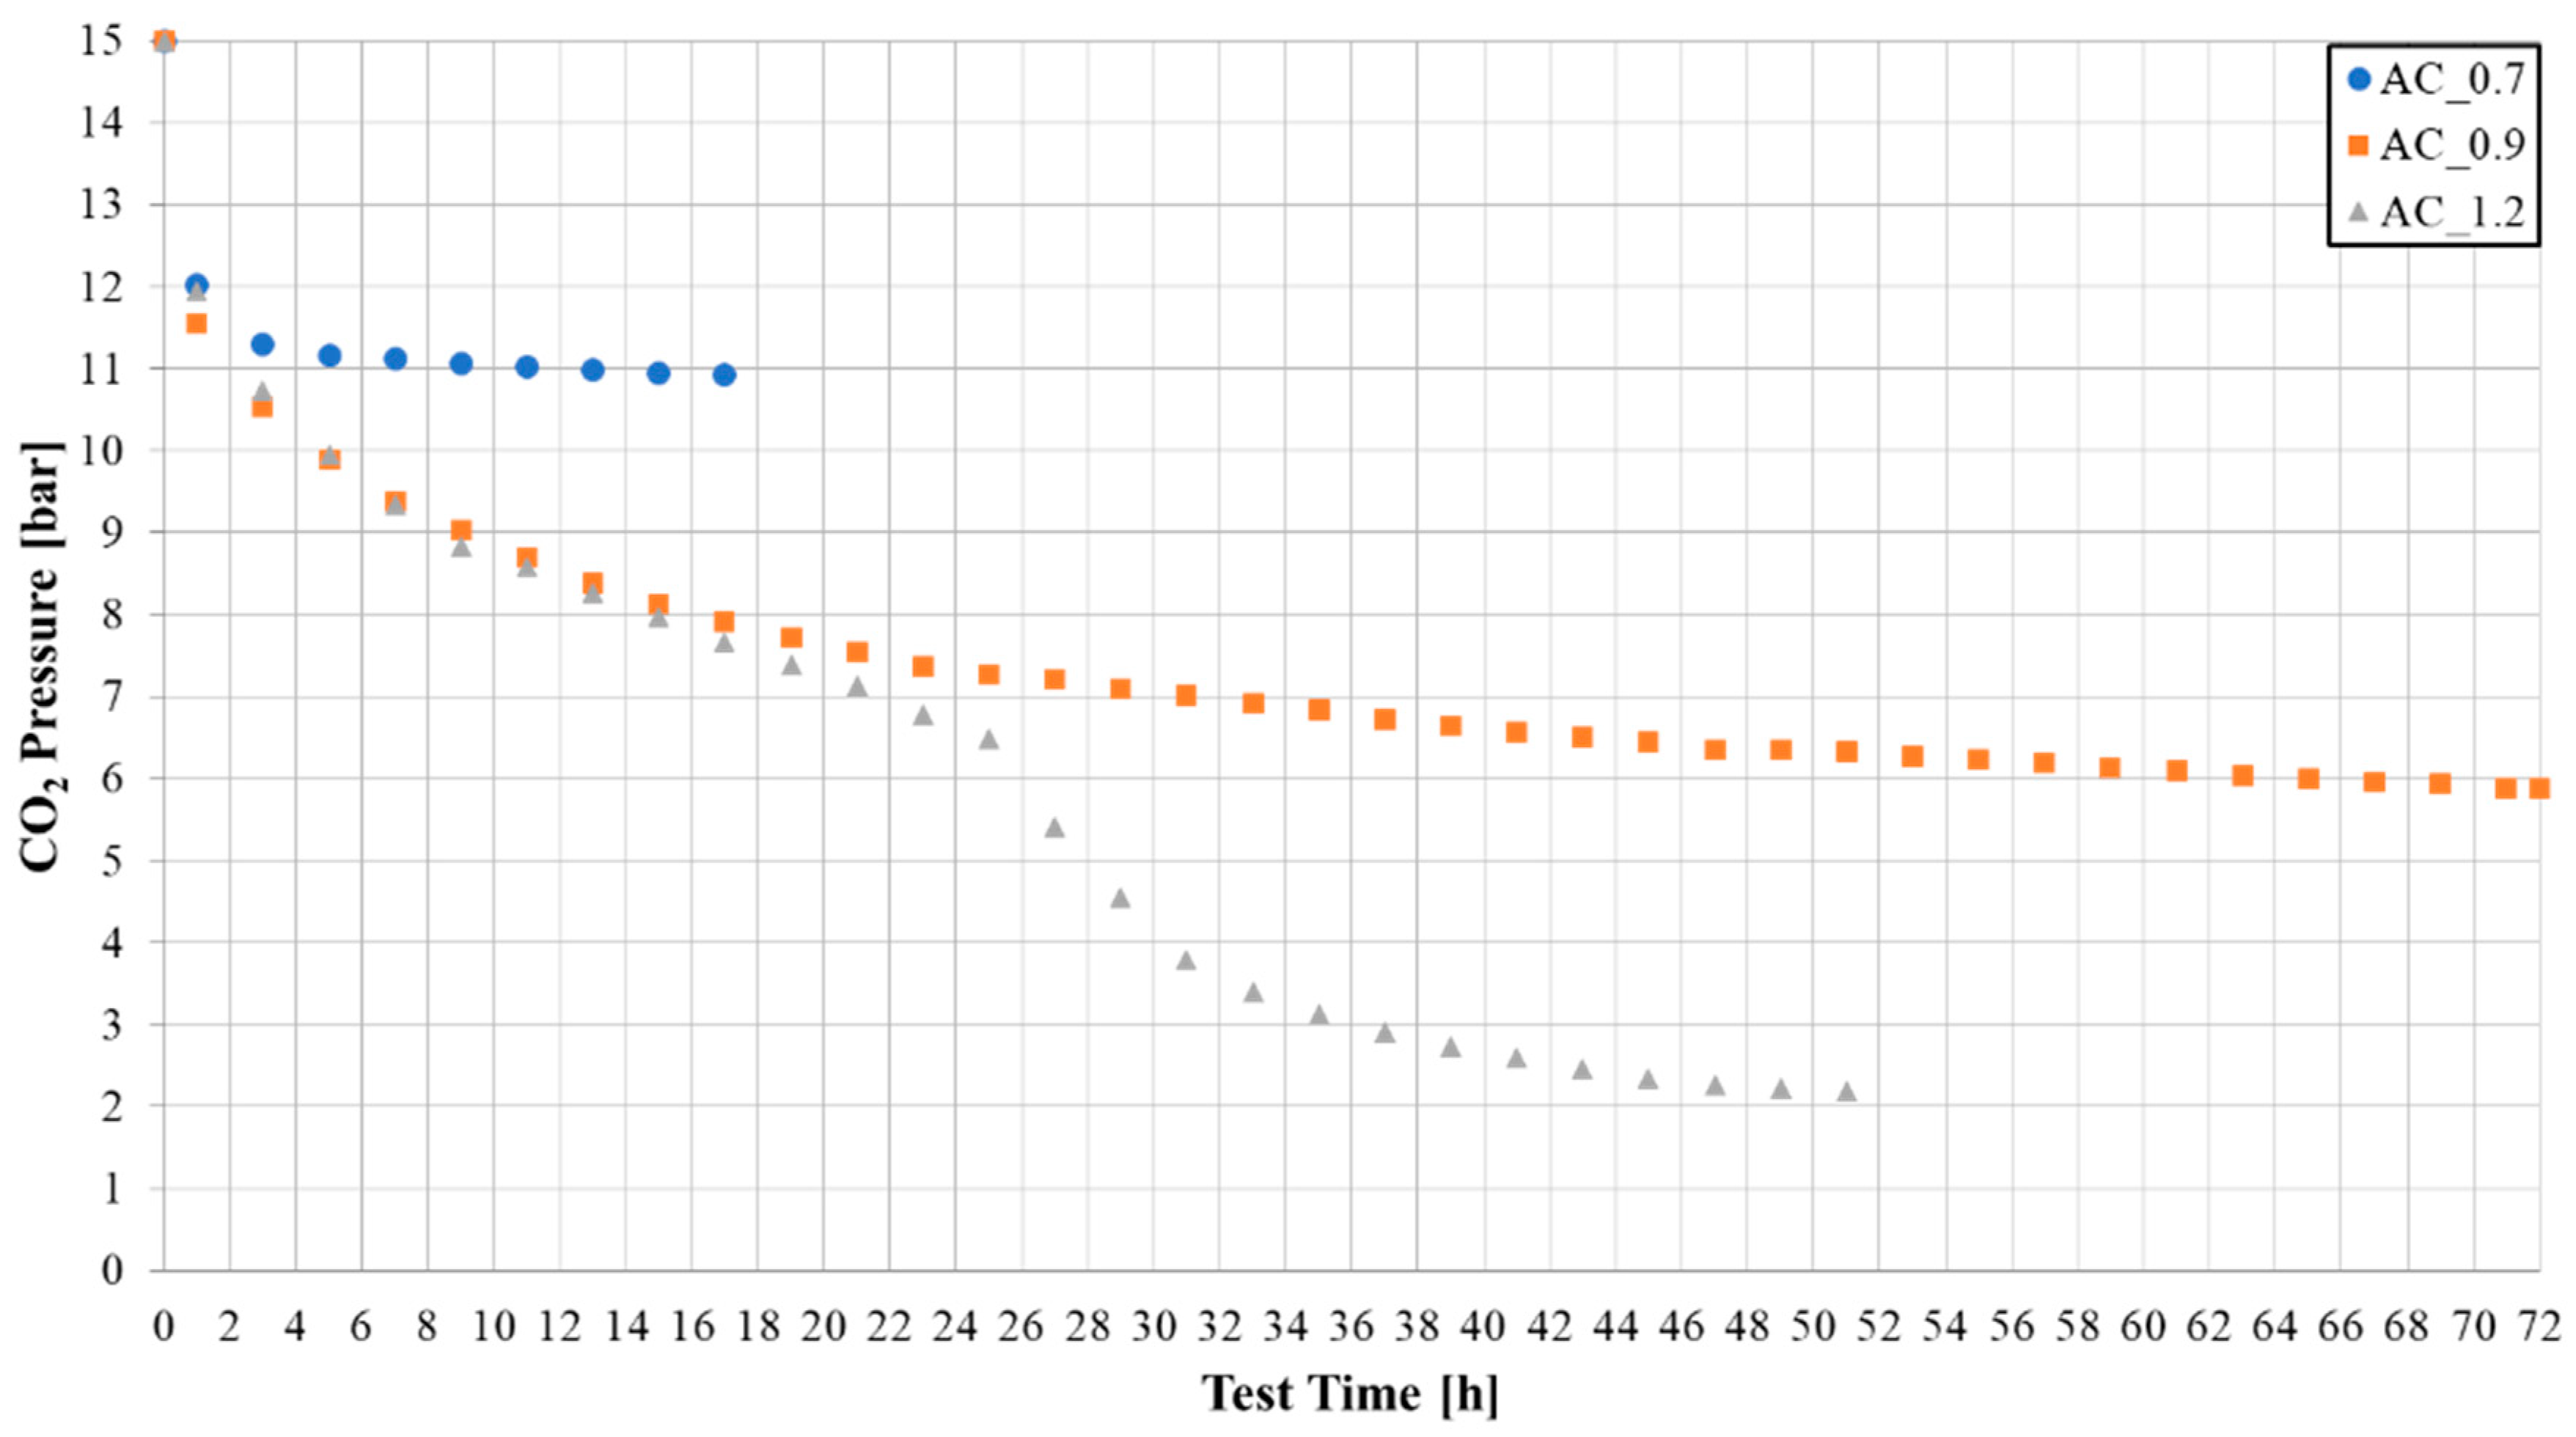
3.3.2. Accelerated Carbonation Experiments

The setup mentioned in Figure 1 was used to carry out the AC testing. The chamber was filled with CO2 at 15 bars following the slurry insertion. The experiments were considered completed for the samples AC_0.7, AC_0.9, and AC_1.2 (numbers indicating L/S ratio) as soon as their CO2 pressure trends achieved a plateau at 17, 72, and 51 h, respectively, indicating that the decreasing rate of pressure caused by the carbonation reaction stopped (Figure 5). Except in the first 5 h period, where CO2 pressure sharply decreased, indicating an intense carbonation reaction, it can be seen in Figure 4 that each trial had a different CO2 pressure path: for the AC_0.7 trial the CO2 pressure decreased between 5 and 10 h until it reached a plateau within 17 h; while, after the first 5 h, the trial with sample AC_0.9 showed a continuous and smooth decrease in the CO2 pressure, and no intermediate plateau was observed, reaching it directly in 72 h; as in the AC_0.9 trial, trial AC_1.2 showed a smooth CO2 pressure decrease in the period between 5 and 24 h. The pressure drop’s asymptotic behaviour hinted at the carbonation reaction’s potential end. However, after this time, the slurry/CO2 system was stirred up by simply rotating the stainless-steel chamber, reactivating the pressure drop. The AC_1.2 behaviour suggested that, in addition to the L/S ratio, the slurry permeability might be likely what restricts the carbonation reaction. In fact, the fineness of the solid particle can enhance the reaction by increasing the specific surface. On the other hand, it can also reduce permeability, making it less easy for CO2 to penetrate. For this reason, the process appeared to be reactivated by exposing the slurry’s new surface through agitation.
The pressure trend can be translated into the LOI and total CaCO3 quantification (Table 5 and Table 6, respectively). Indeed, by observing the LOI values, it was possible to notice an increasing trend over the trials, directly proportional to the L/S ratio, passing from 24.21 wt.% (BLEND) to 29.54 wt.% (AC_1.2). These values indicated a possible formation of carbonaceous compounds. Moreover, by comparing the LOI values with the XRD-Rietveld ones, a total CaCO3 content increasing trend over the trials was observed, passing from the 10 wt.% (BLEND) sample to 29 wt.% (AC_1.2). For these values, a direct proportion with the L/S ratio was found as well. This behaviour highlighted the critical role that the various liquid-to-solid ratios play in the carbonation process. In particular, a higher L/S ratio can increase the quantity of dissolved CO2 and at the same time influence the permeability of the slurry. This can be explained by the fact that as the L/S ratio decreased, there was a more viscous slurry behaviour. As a result, a low L/S ratio could both decrease the solubility of CO2 and increase the viscosity of the material, making the mobility of CO2 within the slurry more difficult.
The pressure is also an essential parameter, as there was a yield difference between the AC_0.9 and AC_0.9_bis, since the latter, despite the same liquid-to-solid ratio, had a higher LOI value (27.83 wt.%) and total CaCO3 content (30 wt.%). A constant pushing force (in this case pressure) increased the efficiency of the reaction, through a better solubilisation of CO2. Unlike the NC experiments where all the reactant crystalline compounds were consumed, it is plausible to assume that the carbonation reaction was not yet complete and that the crystalline reagent species did not entirely react, given the existence of residuals of CaClOH in all the AC trials. In fact, the Rietveld refinement revealed that Ca(OH)2 was nearly completely consumed, demonstrating that this crystalline product predominated in the initial hours of the reaction, which may explain the reactivation in AC_1.2 together with the other factors. In particular, the CaClOH amount decreased with the increasing L/S ratio, showing an increase in the total CaCO3 content. This was evident in the trial’s outcome with continuous CO2 injection (AC_0.9_bis), which, despite the highest pushing force made possible by constant pressure, still contained CaClOH (3 wt.%). If a different CO2 supply method had been utilised during the test the reaction could continue. Indeed, a mixing system such as an insufflation system or a sample mixing system (e.g., rotating drum) could improve the efficiency of the mass transfer from gas to solid and increase the yield of CO2 sequestration [46]. This became even more clear when the difference in the performance of the AC_1.2 test was attained by merely shifting the setup’s location was considered.
Other parameters, such as pH, the ratio of calcium ions, and calcite concentrations, were ascribed to the production of the CaCO3 polymorphs (calcite, aragonite, and vaterite), which were extensively explored in the literature [47]. All CaCO3 polymorphs, such as vaterite and calcite, were present in all the samples; however, the first one is metastable and typically crystallises when the Ca/Si ratio is higher than 0.75. In particular, its production is frequently credited to the carbonation of C-S-H gels [48], and it is anticipated to change into calcite in cured samples. The vaterite conditions affect the reaction’s kinetics. According to Sarkar et al. [49], vaterite can exist in the solid state for several months without changing into aragonite or calcite, but when it is suspended in an aqueous solution the change can happen much more quickly, between minutes and hours, depending on the conditions at hand.
The determination by the Rietveld refining process of the total amount of crystallised CaCO3 allowed us to estimate the amount of the sequestered CO2 (Figure 6). The decrease in the two primary reactive species, CaClOH and Ca(OH)2 phases, and the increase in CaCO3 confirmed that the carbonation process occurred in both NC and AC trials, with the difference being that the amount of CO2 sequestered for each kg of MSWI FA was higher in the NC reactions (Figure 6).
As aforementioned, no significant difference was found in the NC trials, which was reflected in the amount of CO2 captured reaching up to 204 g CO2/kg MSWI FA for NC1_0.9. Thus, the different liquid-to-solid ratios had no appreciable influence on the total amount of CO2 seized, but it might affect the rate of seizure within the test month. Conversely, the increasing CO2 uptake trend for the AC trials highlighted the crucial role of the various liquid-to-solid ratios. Indeed, as the L/S ratio increased, the CO2 uptake also increased, reaching up to 152 g CO2/kg MSWI FA for AC_1.2. Moreover, similar values to those of NC were reached, reducing the time from 1 month to less than 3 days. In the case of AC_0.9_bis, where the pressure was kept constant over time, a favourable result of 157 g CO2/kg MSWI FA was achieved. Overall, the NC trials demonstrated a better uptake capacity compared to the AC trials. However, despite the lower efficiency, the AC method might still be economically attractive.
In Figure 6, the red line corresponds to the theoretical amount of sequestrated CO2 if the reaction occurred solely, thanks to the crystalline reagents, which were Ca(OH)2 and CaClOH, as described by Equations (1) and (2). Theoretically, the maximum achievable would be 132 g CO2/kg MSWI FA, which was clearly exceeded by all NC tests and AC_1.2 and AC_0.9_bis tests. This is because amorphous material, which in this case primarily came from the CFA and MSWI BA, can contribute to pozzolanic processes when calcium ions are present [25,50,51]. Additionally, it can participate in carbonation reactions, as demonstrated through experiments made in a recent work [28]. Indeed, CO2 can combine with compounds present in the amorphous matter, such as calcium silicate hydrates (C-S-H) or calcium aluminate hydrate phases (C-A (-S)—H), to form calcium carbonate phases [52]. Therefore, considering the potential for extra free-CaO in the amorphous component to react with CO2, the projected value of 132 g CO2/kg MSWI FA was underestimated.
Figure 7 shows the internal section of particles from NC2_0.9 and AC_0.9_bis. In both cases, one can observe newly formed particles consisting of agglomerations of aluminosilicate glassy spheres, fragments, and other relics, which are cemented by the newly formed crystalline and amorphous Ca-carbonates. Additionally, Fe-rich particles (Figure 7A, Z2) are also enclosed by Ca-carbonates as a result of the carbonation reaction. This finding offers further research opportunities for determining the role of carbonation in the stabilisation of heavy metals using fine ashes.

4. Conclusions

The utilisation of alkaline ashes for CO2 sequestration through mineral carbonation is a promising technology that exploits metal oxides containing Ca as reactive compounds. On this basis, owing to their composition, CFA, FGD residues, MSWI FA, and MSWI BA were considered alternative secondary raw materials and tested for both natural and accelerated carbonation reactions. The aim was to propose not only the use of waste materials for carbonation but also to develop technologies based on locally available by-products.
The characterisation showed that the FA and FGD primarily consisted of very fine particles, with more than 70 wt.% FA passing through the 45 µm sieve, while FGD particles were mainly within the 25–75 μm size range. Conversely, the MSWI BA was mainly considered a coarse material; therefore, it needed to be ground before using it in the mineral carbonation. Both natural carbonation and accelerated carbonation tests were conducted, varying the liquid-to-solid ratio at 0.7, 0.9, and 1.2. The results indicated that the water content and the pressure influenced the CO2 sequestration in the case of the AC. Indeed, the higher the ratio, the higher the yields, reaching up to 152 g CO2/kg of MSWI FA for AC_1.2. The same was not observed for the NC, where it reached 188, 204, and 175 g CO2/kg of MSWI FA in the case of liquid-to-solid ratios equal to 0.7, 0.9, and 1.2, respectively. The pressure instead allowed it to increase the pushing force to solubilise the CO2 in the slurry. In fact, the test that reached a greater quantity of CO2 seized for the AC was the one with the pressure kept constant at 15 bars (157 g CO2/kg of MSWI FA). The SEM-EDS analyses made on the carbonated samples showed newly formed agglomerates of calcium carbonates and calcium aluminosilicate incorporating other particles. This suggests that carbonation may participate in the stabilisation of heavy metals. Further experiments will be conducted in the near future to better understand the role of carbonation in the stabilisation of MSWI FA.

Author Contributions

Conceptualisation, G.P.S., B.V. and E.B.; methodology, G.P.S., R.G. and B.V.; software, G.P.S.; validation, B.V. and E.B.; formal analysis, G.P.S.; investigation, G.P.S., B.V. and E.B.; resources, B.V. and E.B.; data curation, G.P.S., R.G. and B.V.; writing—original draft preparation, G.P.S. and B.V.; writing—review and editing, B.V. and E.B.; visualisation, B.V. and E.B.; supervision, B.V. and E.B.; project administration, E.B. All authors have read and agreed to the published version of the manuscript.

Funding

This research received no external funding.

Data Availability Statement

The data are available in the manuscript.

Acknowledgments

All authors thank Paolo Iora, Costante Mario Invernizzi, Gioele Di Marcoberardino, and Modestino Savoia for their support in the accelerated carbonation test. The graphical abstract was created with BioRender.com.

Conflicts of Interest

The authors declare no conflict of interest.

References

  1. IPCC Press Office Climate Change Widespread, Rapid, and Intensifying—IPCC. Available online: https://www.ipcc.ch/2021/08/09/ar6-wg1-20210809-pr/#:~:text=The%20report%20shows%20that%20emissions,1.5%C2%B0C%20of%20warming (accessed on 26 June 2023).
  2. Al-Ghussain, L. Global warming: Review on driving forces and mitigation. Environ. Prog. Sustain. Energy 2019, 38, 13–21. [Google Scholar] [CrossRef] [Green Version]
  3. Carleton, T.A.; Hsiang, S.M. Social and economic impacts of climate. Science 2016, 353, aad9837. [Google Scholar] [CrossRef] [PubMed] [Green Version]
  4. Shayanmehr, S.; Rastegari Henneberry, S.; Sabouhi Sabouni, M.; Shahnoushi Foroushani, N. Climate Change and Sustainability of Crop Yield in Dry Regions Food Insecurity. Sustainability 2020, 12, 9890. [Google Scholar] [CrossRef]
  5. Berchin, I.I.; Valduga, I.B.; Garcia, J.; de Andrade Guerra, J.B.S.O. Climate change and forced migrations: An effort towards recognizing climate refugees. Geoforum 2017, 84, 147–150. [Google Scholar] [CrossRef]
  6. Otto, A.; Robinius, M.; Grube, T.; Schiebahn, S.; Praktiknjo, A.; Stolten, D. Power-to-Steel: Reducing CO2 through the Integration of Renewable Energy and Hydrogen into the German Steel Industry. Energies 2017, 10, 451. [Google Scholar] [CrossRef] [Green Version]
  7. Elavarasan, R.M.; Afridhis, S.; Vijayaraghavan, R.R.; Subramaniam, U.; Nurunnabi, M. SWOT analysis: A framework for comprehensive evaluation of drivers and barriers for renewable energy development in significant countries. Energy Rep. 2020, 6, 1838–1864. [Google Scholar] [CrossRef]
  8. Socolow, R.; Hotinski, R.; Greenblatt, J.B.; Pacala, S. Solving the Climate Problem: Technologies Available to Curb CO2 Emissions. Environ. Sci. Policy Sustain. Dev. 2004, 46, 8–19. [Google Scholar] [CrossRef]
  9. Songolzadeh, M.; Soleimani, M.; Ravanchi, M.T.; Songolzadeh, R. Carbon Dioxide Separation from Flue Gases: A Technological Review Emphasizing Reduction in Greenhouse Gas Emissions. Sci. World J. 2014, 2014, 828131. [Google Scholar] [CrossRef] [Green Version]
  10. Haszeldine, R.S. Carbon Capture and Storage: How Green Can Black Be? Science 2009, 325, 1647–1652. [Google Scholar] [CrossRef]
  11. Otto, A.; Grube, T.; Schiebahn, S.; Stolten, D. Closing the loop: Captured CO2 as a feedstock in the chemical industry. Energy Environ. Sci. 2015, 8, 3283–3297. [Google Scholar] [CrossRef] [Green Version]
  12. Olajire, A.A. A review of mineral carbonation technology in sequestration of CO2. J. Pet. Sci. Eng. 2013, 109, 364–392. [Google Scholar] [CrossRef]
  13. Sanna, A.; Uibu, M.; Caramanna, G.; Kuusik, R.; Maroto-Valer, M.M. A review of mineral carbonation technologies to sequester CO2. Chem. Soc. Rev. 2014, 43, 8049–8080. [Google Scholar] [CrossRef] [PubMed] [Green Version]
  14. Schnabel, K.; Brück, F.; Pohl, S.; Mansfeldt, T.; Weigand, H. Technically exploitable mineral carbonation potential of four alkaline waste materials and effects on contaminant mobility. Greenh. Gases Sci. Technol. 2021, 11, 506–519. [Google Scholar] [CrossRef]
  15. Bobicki, E.R.; Liu, Q.; Xu, Z.; Zeng, H. Carbon capture and storage using alkaline industrial wastes. Prog. Energy Combust. Sci. 2012, 38, 302–320. [Google Scholar] [CrossRef]
  16. Wang, C.-Q.; Liu, K.; Huang, D.-M.; Chen, Q.; Tu, M.-J.; Wu, K.; Shui, Z.-H. Utilization of fly ash as building material admixture: Basic properties and heavy metal leaching. Case Stud. Constr. Mater. 2022, 17, e01422. [Google Scholar] [CrossRef]
  17. Bauer, M.; Gassen, N.; Stanjek, H.; Peiffer, S. Carbonation of lignite fly ash at ambient T and P in a semi-dry reaction system for CO2 sequestration. Appl. Geochem. 2011, 26, 1502–1512. [Google Scholar] [CrossRef]
  18. Ji, L.; Yu, H.; Yu, B.; Zhang, R.; French, D.; Grigore, M.; Wang, X.; Chen, Z.; Zhao, S. Insights into Carbonation Kinetics of Fly Ash from Victorian Lignite for CO2 Sequestration. Energy Fuels 2018, 32, 4569–4578. [Google Scholar] [CrossRef]
  19. Costa, G.; Baciocchi, R.; Polettini, A.; Pomi, R.; Hills, C.D.; Carey, P.J. Current status and perspectives of accelerated carbonation processes on municipal waste combustion residues. Environ. Monit. Assess. 2007, 135, 55–75. [Google Scholar] [CrossRef]
  20. Ji, L.; Yu, H.; Zhang, R.; French, D.; Grigore, M.; Yu, B.; Wang, X.; Yu, J.; Zhao, S. Effects of fly ash properties on carbonation efficiency in CO2 mineralisation. Fuel Process. Technol. 2019, 188, 79–88. [Google Scholar] [CrossRef]
  21. Wang, B.; Pan, Z.; Cheng, H.; Zhang, Z.; Cheng, F. A review of carbon dioxide sequestration by mineral carbonation of industrial byproduct gypsum. J. Clean. Prod. 2021, 302, 126930. [Google Scholar] [CrossRef]
  22. Montes-Hernandez, G.; Pérez-López, R.; Renard, F.; Nieto, J.M.; Charlet, L. Mineral sequestration of CO2 by aqueous carbonation of coal combustion fly-ash. J. Hazard. Mater. 2009, 161, 1347–1354. [Google Scholar] [CrossRef] [Green Version]
  23. Kuusik, R.; Uibu, M.; Kirsimäe, K.; Mõtlep, R.; Meriste, T. Open-air deposition of estonian oil shale ash: Formation, state of art, problems and prospects for the abatement of environmental impact. Oil Shale 2012, 29, 376. [Google Scholar] [CrossRef] [Green Version]
  24. Berber, H.; Tamm, K.; Leinus, M.-L.; Kuusik, R.; Tõnsuaadu, K.; Paaver, P.; Uibu, M. Accelerated Carbonation Technology Granulation of Industrial Waste: Effects of Mixture Composition on Product Properties. Waste Manag. Res. 2020, 38, 142–155. [Google Scholar] [CrossRef] [PubMed]
  25. Assi, A.; Federici, S.; Bilo, F.; Zacco, A.; Depero, L.E.; Bontempi, E. Increased Sustainability of Carbon Dioxide Mineral Sequestration by a Technology Involving Fly Ash Stabilization. Materials 2019, 12, 2714. [Google Scholar] [CrossRef] [Green Version]
  26. Wang, F.; Dreisinger, D.; Jarvis, M.; Hitchins, T. Kinetics and mechanism of mineral carbonation of olivine for CO2 sequestration. Miner. Eng. 2019, 131, 185–197. [Google Scholar] [CrossRef]
  27. Regnault, O.; Lagneau, V.; Schneider, H. Experimental measurement of portlandite carbonation kinetics with supercritical CO2. Chem. Geol. 2009, 265, 113–121. [Google Scholar] [CrossRef]
  28. Sorrentino, G.P.; Zanoletti, A.; Ducoli, S.; Zacco, A.; Iora, P.; Invernizzi, C.M.; Di Marcoberardino, G.; Depero, L.E.; Bontempi, E. Accelerated and natural carbonation of a municipal solid waste incineration (MSWI) fly ash mixture: Basic strategies for higher carbon dioxide sequestration and reliable mass quantification. Environ. Res. 2023, 217, 114805. [Google Scholar] [CrossRef]
  29. Ramezanianpour, A.A. Cement Replacement Materials; Springer: Berlin/Heidelberg, Germany, 2014; ISBN 978-3-642-36720-5. [Google Scholar]
  30. Bontempi, E.; Zacco, A.; Borgese, L.; Gianoncelli, A.; Ardesi, R.; Depero, L.E. A new method for municipal solid waste incinerator (MSWI) fly ash inertization, based on colloidal silica. J. Environ. Monit. 2010, 12, 2093–2099. [Google Scholar] [CrossRef]
  31. Pandey, R.A.; Biswas, R.; Chakrabarti, T.; Devotta, S. Flue Gas Desulfurization: Physicochemical and Biotechnological Approaches. Crit. Rev. Environ. Sci. Technol. 2005, 35, 571–622. [Google Scholar] [CrossRef]
  32. Assi, A.; Bilo, F.; Federici, S.; Zacco, A.; Depero, L.E.; Bontempi, E. Bottom ash derived from municipal solid waste and sewage sludge co-incineration: First results about characterization and reuse. Waste Manag. 2020, 116, 147–156. [Google Scholar] [CrossRef]
  33. Assi, A.; Bilo, F.; Zanoletti, A.; Borgese, L.; Depero, L.E.; Nenci, M.; Bontempi, E. Stabilization of Municipal Solid Waste Fly Ash, Obtained by Co-Combustion with Sewage Sludge, Mixed with Bottom Ash Derived by the Same Plant. Appl. Sci. 2020, 10, 6075. [Google Scholar] [CrossRef]
  34. Assi, A.; Bilo, F.; Zanoletti, A.; Ponti, J.; Valsesia, A.; La Spina, R.; Zacco, A.; Bontempi, E. Zero-waste approach in municipal solid waste incineration: Reuse of bottom ash to stabilize fly ash. J. Clean. Prod. 2019, 245, 118779. [Google Scholar] [CrossRef]
  35. ISO 7404–2; Methods for the Petrographic Analysis of Coals—Part 2: Methods of Preparing Coal Samples. International Organization for Standardization: Geneva, Switzerland, 2009.
  36. DS/EN 15149-2; Solid Biofuels—Determination of Particle Size Distribution—Part 2: Vibrating Screen Method Using Sieve Apertures of 3.15 mm and Below. Danish Standards Foundation: Copenhagen, Denmark, 2010.
  37. ASTM C25-19; Standard Test Methods for Chemical Analysis of Limestone, Quicklime, and Hydrated Lime. ASTM: West Conshohocken, PA, USA, 2019. [CrossRef]
  38. Doebelin, N.; Kleeberg, R. Profex: A graphical user interface for the Rietveld refinement program BGMN. J. Appl. Crystallogr. 2015, 48, 1573–1580. [Google Scholar] [CrossRef] [Green Version]
  39. Black, L. Low Clinker Cement as a Sustainable Construction Material. In Sustainability of Construction Materials; Elsevier: Amsterdam, The Netherlands, 2016; pp. 415–457. [Google Scholar] [CrossRef]
  40. Walker, R.; Pavía, S. Physical properties and reactivity of pozzolans, and their influence on the properties of lime–pozzolan pastes. Mater. Struct. 2010, 44, 1139–1150. [Google Scholar] [CrossRef] [Green Version]
  41. Shi, X.; Xie, N.; Fortune, K.; Gong, J. Durability of steel reinforced concrete in chloride environments: An overview. Constr. Build. Mater. 2012, 30, 125–138. [Google Scholar] [CrossRef]
  42. Pan, S.-Y.; Chang, E.-E.; Kim, H.; Chen, Y.-H.; Chiang, P.-C. Validating carbonation parameters of alkaline solid wastes via integrated thermal analyses: Principles and applications. J. Hazard. Mater. 2016, 307, 253–262. [Google Scholar] [CrossRef]
  43. Gu, Q.; Wang, T.; Wu, W.; Wang, D.; Jin, B. Influence of pretreatments on accelerated dry carbonation of MSWI fly ash under medium temperatures. Chem. Eng. J. 2021, 414, 128756. [Google Scholar] [CrossRef]
  44. Wang, L.; Jin, Y.; Nie, Y. Investigation of accelerated and natural carbonation of MSWI fly ash with a high content of Ca. J. Hazard. Mater. 2010, 174, 334–343. [Google Scholar] [CrossRef] [PubMed]
  45. Hover, K.C. The influence of water on the performance of concrete. Constr. Build. Mater. 2011, 25, 3003–3013. [Google Scholar] [CrossRef]
  46. Brück, F.; Schnabel, K.; Mansfeldt, T.; Weigand, H. Accelerated carbonation of waste incinerator bottom ash in a rotating drum batch reactor. J. Environ. Chem. Eng. 2018, 6, 5259–5268. [Google Scholar] [CrossRef]
  47. Oral, Ç.M.; Ercan, B. Influence of pH on morphology, size and polymorph of room temperature synthesized calcium carbonate particles. Powder Technol. 2018, 339, 781–788. [Google Scholar] [CrossRef]
  48. Black, L.; Breen, C.; Yarwood, J.; Garbev, K.; Stemmermann, P.; Gasharova, B. Structural Features of C–S–H(I) and Its Carbonation in Air? A Raman Spectroscopic Study. Part II: Carbonated Phases. J. Am. Ceram. Soc. 2007, 90, 908–917. [Google Scholar] [CrossRef]
  49. Sarkar, A.; Mahapatra, S. Synthesis of All Crystalline Phases of Anhydrous Calcium Carbonate. Cryst. Growth Des. 2010, 10, 2129–2135. [Google Scholar] [CrossRef]
  50. Ouhadi, V.; Yong, R.N.; Amiri, M.; Ouhadi, M. Pozzolanic consolidation of stabilized soft clays. Appl. Clay Sci. 2014, 95, 111–118. [Google Scholar] [CrossRef]
  51. Thomas, M.; Jewell, R.; Jones, R. Coal Fly Ash as a Pozzolan. In Coal Combustion Products (CCP’s); Elsevier: Amsterdam, The Netherlands, 2017; pp. 121–154. [Google Scholar]
  52. Slegers, P.A.; Rouxhet, P.G. Carbonation of the hydration products of tricalcium silicate. Cem. Concr. Res. 1976, 6, 381–388. [Google Scholar] [CrossRef]
Figure 1. Schematic representation of the experimental setup for the AC tests. Sample cylinder (SC); thermocouple (TC); data acquisition system (DAQ/PC); pressure transmitter with a 0.5% f.s. accuracy (PT); needle valves (V-1 and V-2); vacuum pump (VP); carbon dioxide 99% pure. [28].
Minerals 13 01060 g001
Figure 2. XRD patterns of CFA, FGD, MSWI FA, MSWI FA washed, and MSWI BA.
Minerals 13 01060 g002
Figure 3. Micrographs and EDS spectra of CFA (A,B), MSWI FA (C,D), FGD (E,F), and MSWI BA (G,H).
Minerals 13 01060 g003
Figure 4. XRD patterns of the initial BLEND, the NC, and the AC trials, with phases attribution.
Minerals 13 01060 g004
Figure 5. Pressure trend of the AC tests, as a function of the carbonation time.
Minerals 13 01060 g005
Figure 6. CO2 uptake per 1 kg of MSWI FA calculated for all the samples subjected to the carbonation tests. The maximum achievable corresponds to 132 g CO2/kg MSWI FA.
Minerals 13 01060 g006
Figure 7. Micrographs and EDS spectra (polish blocks) of AC_0.9_bis (A,B), and NC2_0.9 (C,D).
Minerals 13 01060 g007
Table 1. Chemical composition of the bulk samples obtained by the TXRF analysis reported by Assi et al. [34].
ElementsCFAMSWI FAFGDMSWI BA
mg/kgmg/kgmg/kgmg/kg
P *690 ± 2302000 ± 1001000 ± 4003960 ± 460
S *5180 ± 116013,100 ± 90054,400 ± 99001590 ± 200
Cl *900 ± 1871500 ± 40080 ± 103700 ± 660
K6360 ± 111824,610 ± 17002000 ± 2708520 ± 310
Ca4180 ± 91669,200 ± 310038,300 ± 338079,100 ± 7400
Fe21,500 ± 7003750 ± 170160 ± 3028,820 ± 9320
Cu710 ± 30710 ± 202050 ± 1202420 ± 80
Zn2440 ± 1308800 ± 2002920 ± 2504280 ± 120
Pb<LOD1030 ± 50<LOD3740 ± 200
* The amount of these elements is significantly underestimated.
Table 2. Natural carbonation (NC) and accelerated carbonation (AC) test descriptions.
SamplesBLENDNC1_0.7NC1_0.9NC2_0.9NC1_1.2AC_0.7AC_0.9AC_0.9_bisAC_1.2
Carbonation type NCNCNCNCACACACAC
L/S 0.70.90.91.20.70.90.91.2
Time test 1 month1 month2 months1 month17 h72 h12 days51 h
Table 3. Particle size distribution of the bulk samples.
SampleProcessSize Fractions (μm)
>15075–15045–7525–45<25
Dry sieving (DS)wt.%
CFA 4.38.912.634.739.6
MSWI FA 8.09.211.822.148.9
FGD 2.58.628.257.14.6
Wet sieving (WS)wt.%
CFA 3.27.311.016.354.4
MSWI FA 6.95.74.44.531.5
FGD 0.35.14.24.757.2
>40002000–40001000–2000500–1000250–500150–250<150
Dry sieving (DS)wt.%
MSWI BA 41.117.817.69.55.12.66.3
Table 4. Results of Rietveld analysis of the bulk samples.
SamplesCFAMSWI FAFGDMSWI BA
<150 μm
MSWI BA
<2 mm Ground
wt.%
Calcium hydroxy chloride (CaClOH)<126<1<1<1
Portlandite (Ca(OH)2)<1423<1<1
Calcite (CaCO3)<1911147
Anhydrite (CaSO4)<14<11<1
Hannebachite (CaSO3 *0.5 H2O)<1<121<1<1
Bassanite (CaSO4 *0.5 H2O)<147<1<1
Gypsum (CaSO4 *2 H2O)<124<1<1
Quartz (SiO2)21<1<159
Mullite (Al6Si2O13)17<1<1<1<1
Hematite (Fe2O3)1<1<11<1
Tripotassium phosphate (K3PO4)<13<158
Halite (NaCl)<15<1<1<1
Sylvite (KCl)<13<1<1<1
Amorphous6041337276
* The mineral composition of the materials refers to the dry samples.
Table 5. Results of proximate analysis and LOI for the initial BLEND, the NC, and the AC trials.
SamplesBLENDNC1_0.7NC1_0.9NC1_1.2AC_0.7AC_0.9AC_0.9_bisAC_1.2
wt.%
LOI (1000 °C) 24.2130.5631.3131.0426.9227.8328.99
Table 6. Results of Rietveld analysis of the BLEND, the NC, and the AC trials.
SamplesBLENDNC1_0.7NC1_0.9NC1_1.2AC_0.7AC_0.9AC_0.9_bisAC_1.2
wt.%
Calcium hydroxy chloride (CaClOH)16<1<1<19837
Portlandite (Ca(OH)2)7<1<1<1<1<1<1<1
Calcite (CaCO3)1028322812202427
Vaterite (CaCO3)<15235462
Anhydrite (CaSO4)32225212
Hannebachite (CaSO3 *0.5 H2O)43446464
Bassanite (CaSO4 *0.5 H2O)35353234
Gypsum (CaSO4 *2 H2O)3<111121< 1
Quartz (SiO2)54343534
Hematite (Fe2O3)1<1<1<111<1<1
Tripotassium phosphate (K3PO4)12213221
Halite (NaCl)33222223
Sylvite (KCl)2<121121< 1
Amorphous4245454847454742
* The mineral composition of the materials refers to the dry samples.
Disclaimer/Publisher’s Note: The statements, opinions and data contained in all publications are solely those of the individual author(s) and contributor(s) and not of MDPI and/or the editor(s). MDPI and/or the editor(s) disclaim responsibility for any injury to people or property resulting from any ideas, methods, instructions or products referred to in the content.

