Article

Color Origin of Greyish-Purple Tremolite Jade from Sanchahe in Qinghai Province, NW China

1
Jewelry Institute, Guangzhou Panyu Polytechnic, Guangzhou 511487, China
2
Gemmological Institute, China University of Geosciences, Wuhan 430074, China
3
School of Earth Sciences and Engineering, Sun Yat-sen University, Zhuhai 519080, China
*
Author to whom correspondence should be addressed.
Minerals 2023, 13(8), 1049; https://doi.org/10.3390/min13081049
Submission received: 20 June 2023 / Revised: 28 July 2023 / Accepted: 5 August 2023 / Published: 7 August 2023
(This article belongs to the Special Issue Gem Deposits: Mineralogical and Gemological Aspects)

Abstract

:
Greyish-purple tremolite jade has become well known in the past few years, and the origin of its color has attracted the attention of gemologists. In this study, FT-IR spectra, EPMA, EPR spectra, micro-XRF, UV–Vis–NIR spectra, and LA-ICP-MS in situ mapping were analyzed to investigate the chromophore elements. The study sample was chosen from the Sanchahe mine, Qinghai Province, NW China, which has the typical characteristics of a gradual color change. The FT-IR and EPMA results revealed that the mineral composition of the dark and light greyish-purple regions of the sample are primarily composed of tremolite. UV–Vis–NIR spectra demonstrated that the greyish-purple color is mainly due to strong absorptions at 560 nm and 700 nm and weak absorption at 745 nm in the visible range. The EPR spectra presented ~3400 G six hyperfine lines resulting from the hyperfine interactions of the unpaired electron with the Mn2+ nucleus in the octahedral site. The UV–Vis–NIR and EPR spectra analyses demonstrated that Mn2+ is the origin of the purple color. A comparison of the major elements in the light and dark regions indicated that the chromogenic elements have strong positive correlations with Mn, Cu, and Fe. LA-ICP-MS mapping used to analyze the first transition metals indicated possible positive correlations between the greyish-purple color and the trace chromogenic elements. This suggested that the Mn, Cu, and Fe contents are significantly high in the dark band region. Combining in situ LA-ICP-MS mapping of trace elements, UV–Vis spectra, and EPR analysis results, it was suggested that Mn, Cu, and Fe are the major contributors to the greyish-purple color. This study provides a reference for the specific experimental methods to determine chromophores and the origin of color in tremolite jades.

1. Introduction

Tremolite jade (nephrite) is a popular gem material in China which has been used for jewelry and ritual objects since ancient times [1]. Tremolite jade is valuable for its unique grease luster in China. In addition to its luster, the color is also an important factor for evaluating the quality and price. The highly reputed Hetian in the Xinjiang province is the area of origin of tremolite jade deposits and was exploited earlier, while the Qinghai tremolite jade deposit was mined much later after Hetian. Both the Qinghai tremolite jade deposit and the Hetian tremolite jade deposit are located in the same metallogenic belt of the Kunlun Mountains. The tremolite jade mine of Qinghai, also known as Kunlun jade, is 4000 m above sea level and was discovered around 1992. The Qinghai tremolite jade is mainly composed of tremolite, generally accounting for more than 95%, and has a mineral composition similar to Hetian. Tremolite jade has a fiber-interleaved structure, and its transparency is semi-transparent to opaque. Tremolite jade deposits have been found in Sanchahe, Nachitai, Tuolahai (Yeniugou), Yangpilin, Muocaogou, Dazaohuo, Xiaozaohuo, Bajiugou, etc. sections in the East Kunlun orogenic belt since 1992 [2,3,4,5,6,7,8,9,10,11,12,13,14,15]. Tremolite jade from the Qinghai mine is characterized by fine texture and high transparency, and their color is more abundant and diversified. The known tremolite jade types of different colors are white color jade, yellow color jade, Chinese ink color jade, blue-green color jade, emerald green color jade, dark green color jade, and greyish-purple color jade. The emerald green jade and the greyish-purple jade are unique varieties of jade in Qinghai, which are found to be different from other mines [5,10,16]. The greyish-purple jade is only found in the Sanchahe mine [17]. The distinctive color of greyish-purple tremolite jade is similar to the misty rain sky and is becoming increasingly popular among consumers. Moreover, the origin of its color has attracted the research interests of gemologists.
Based on a previous study, it can be proposed that Mn2+ was the major cause of the purple tone in greyish-purple tremolite jades. In this study, nephrite was analyzed by laser ablation inductively coupled plasma mass spectrometry (LA-ICP-MS) using a linear scanning method from light to dark, which indicated that the Mn content increased with color deepening [16]. However, there has been disagreement on the positive correlation between Mn and color. The electron paramagnetic resonance (EPR) spectra demonstrated that the absorption intensities of the characteristic spectra of Mn2+ were not consistent with the Mn content determined by micro-XRF and LA-ICP-MS. The ultraviolet–visible (UV–Vis) spectra indicated that the greyish-purple color faded gradually under oxidizing conditions and heating at 500–800 °C. The color fading was attributed to the oxidation of Fe2+ or Mn4+. Studies have revealed that the greyish-purple color was caused by Fe2+→Ti4+ intervalence charge transfer based on the UV–Vis spectrum and the electron transition of the Fe atom [18]. However, some studies have suggested that the greyish-purple color was related to Fe3+ and Mn2+ [12,19].
The conventional instrumentation techniques used to determine the elemental distributions in minerals include electron probe microanalysis (EPMA), X-ray fluorescence spectroscopy (micro-XRF)/XRD, and LA-ICP-MS. Each technique has its inherent strengths and limitations. The limitations are mainly related to the detection limits, analytical volumes, sample preparation, and accessibility. The samples were converted into powdered form for quantification of the major and trace elements, which cannot accurately indicate the element concentration distribution. Since the chromogenic elements are present in trace amounts (i.e., wt% or p.p.m), in situ analysis of elemental concentrations generally with LA-ICP-MS mapping analysis has emerged as a technique for 2D elemental mapping with excellent detection limits (p.p.m) over a wide isotopic range (7Li to 238U) in different minerals [20,21,22,23]. In this technique, the images are stitched together by the post-acquisition processing to form a quantified image of the trace-element distribution [24,25,26,27,28,29]. Thus, color variation indicating zoning in minerals obtained using in situ microanalytical methods can yield important results on the color changes with respect to the changes in color-induced mechanisms. Moreover, it is possible to reveal the composition of greyish-purple tremolite jades in much greater detail, thereby helping in the investigation of the chromogenic trace elements of greyish-purple tremolite jades and providing an especially effective and intuitive approach to determining the color origin of the gemstones.

2. Geological Setting

The Sanchahe mine (94°22.125 E, 35°54.627 N) is located 73.4 km north of Golmud City at an elevation of 4250 m (Figure 1a) [6]. It lies north of the fracture belt of the South Kunlun Mountains and south of the Central Kunlun Suture Zone (CKSZ). The CKSZ separates the Northern and the Southern Kunlun region and represents the collision between plates of the northern and southern sides in the late Precambrian and the late Paleozoic and the closure of the Paleo-Tethyan major oceanic basin [30,31]. Evidence indicated that there were episodes of magmatic activity from the Proterozoic to the late Cretaceous with active tectonic movement and well-developed faults, thereby creating favorable geological conditions conducive to the formation of tremolite jades.
The tectonic contact relationship of tremolite jade can be divided into gradual contact (hydrothermal metasomatic) and sharp contact (hydrothermal filling and metasomatism). The hydrothermal metasomatic type tremolite jade orebody occurs in the contact zone between carbonate rocks and igneous rocks. The metallogenic belt has undergone severe tectonic movements. The economic value of tremolite jade is always affected by the carbonate rocks. On the other hand, the orebody is crumbling towards the igneous rocks. The major type of tremolite jade in this type is greyish-purple tremolite jade. The hydrothermal filling and metasomatism-type tremolite jade orebody are primarily layered or veins and occur in the fractures in adjacent carbonate rocks. The sharp contact type lode is distributed along the surrounding carbonate rock strata. It is observed that this type of jade has weak tectonic reworking, and its quality is poor. Based on the relationship between the orebody and the surrounding rocks, it can be stated that the tremolite jade deposit is the contact metasomatic ore, formed when the intermediate basic volcanic rocks intrude into the carbonate rocks. The tremolite crystallizes and precipitates rapidly after a sudden drop in the hydrothermal temperature and pressure. Tremolite jade is subjected to repeated ore-forming fluid migration and precipitation. The major element Si in tremolite jade is provide by the intermediate basic volcanic rocks and the elements Mg and Ca that derive from carbonate rocks.

3. Sampling and Analytical Methods

The sample collected from the Sanchahe mine was greyish-purple tremolite jade (Figure 1b). The greyish-purple color tremolite is frequently associated with white and green-white jades, which are transitional to each other. A typical tremolite jade sample in which the color changes from light to dark was selected to investigate the origin of the greyish-purple color. This jade was the greyish-purple color tremolite jade with different color shades showing a clear demarcation between light and dark colors (Figure 1b).

3.1. FT-IR and EPMA

The in situ mineralogical composition of the experimental bulk samples was analyzed using Fourier transform infrared (FT-IR) spectrophotometer analysis and the EPMA method. The FT-IR spectra were recorded on a Tensor 27 FT-IR spectrometer (Bruker, Germany). FT-IR analysis was carried out over the range from 400 to 4000 cm−1 with 4 cm−1 resolution, with a runtime of 30 s per scan, room temperature of 25 °C, and 50 ± 5% relative humidity. This analysis was separately carried out for the light-color and dark-color regions, and the tested points are shown in Figure 2.
To confirm whether the color distribution in the FT-IR results is caused by the impurity minerals or chromogenic elements, EPMA was further performed to investigate the mineral composition around the color boundary. The major and trace elements were determined using JXA-iSP100 with EPMA (JEOL, Japan). The following conditions were adopted for analysis of both the major and trace elements of the sample as described in previous studies: 15 kV acceleration voltage, 2 nA beam current, and 5 μm beam spot size. Two different analysis conditions were applied in one analytical setting. WDS was set as one TAP for Mg (Kα), Al (Kα), Na (Kα), and Si (Kα); one LIFH for Ni (Kα), Cu (Kα), and Mn (Kα); one PETL for K (Kα), P (Kα), and Ca (Kα); one LIF for Fe (Kα); and one LIFL for Cr (Kα). The natural minerals and synthetic oxides that were used for calibration are diopside (Mg, Ca, and Mg), spodumene (Al), orthoclase (K), Cr2O3 (Cr), olivine (Fe), albite (Na), rhodonite (Mn), apatite (P), Ni2Si (Ni), and Cu (Cu). The ZAF modification procedure was applied for data correction (CITIZAF).

3.2. Micro-XRF and LA-ICP-MS

The in situ major element compositions of the bulk tremolite jade samples were analyzed by the X-ray fluorescence (micro-XRF) using a Shimadzu micro-XRF-1800 analyzer (90 mA, 40 kV, and Re anode; Kyoto, Japan). The analysis conditions adopted were a 2 nA beam current and 5 μm beam spot size.
The in situ trace-element mapping of the bulk tremolite jade samples was performed using an NWR 193 nm ArF Excimer laser-ablation system coupled to an iCAP RQ ICP-MS. The ICP-MS was tuned using glass standards NIST 610 and NIST 612 to yield low oxide production rates. The carrier gas He (0.7 L/min) was fed into the cup, and the aerosol was subsequently mixed with 0.79 L/min Ar make-up gas. The following 13 isotopes were selected and measured in all the samples: 24Mg, 29Si, 34S, 43Ca, 45Sc, 47Ti, 51V, 53Cr, 55Mn, 57Fe, 60Ni, 65Cu, and 66Zn, corresponding to a total dwell time of 105 ms. The laser fluence was 3.5 J/cm2, with a repetition rate of 15 Hz and a spot size of 25 µm corresponding to the scan speed of 110 µm/s. The raw isotope data were reduced using the baseline subtract and trace elements data reduction scheme (DRS). The DRS is based on the Iolite package outlined in Paton et al., 2011 [32]. In Iolite, user-defined time intervals are established for the baseline correction procedure for calculating the session-wide baseline-corrected values for each isotope. The trace elements were calibrated by considering the glass standards NIST612 and NIST 610 as external standards.

3.3. UV–Vis–NIR

The UV–Vis–NIR spectroscopy was performed using a UV–Vis spectrophotometer (UV-3600; Shimadzu, Tokyo, Japan) at the following operating conditions: wavelength range of 300–800 nm, slit width of 2 nm, high scanning speed, and sampling interval of 0.2 s.

3.4. EPR

The paramagnetic centers of greyish-purple tremolite jade powder were investigated with EPR spectroscopy using a Bruker EMXPlus-10/12 spectrometer (Bruker Corporation, Billerica, MA, USA) operated with X-band microwave frequencies at both room temperature and liquid-nitrogen temperature. The experimental conditions for room-temperature EPR were as follows: a microwave frequency of ~9.83 GHz, a modulation frequency of 100 kHz, a modulation amplitude of 4 G, and a microwave power of 20 mW. The spectral bands were obtained over a wide spectral range of 500–5000 mT.

4. Results

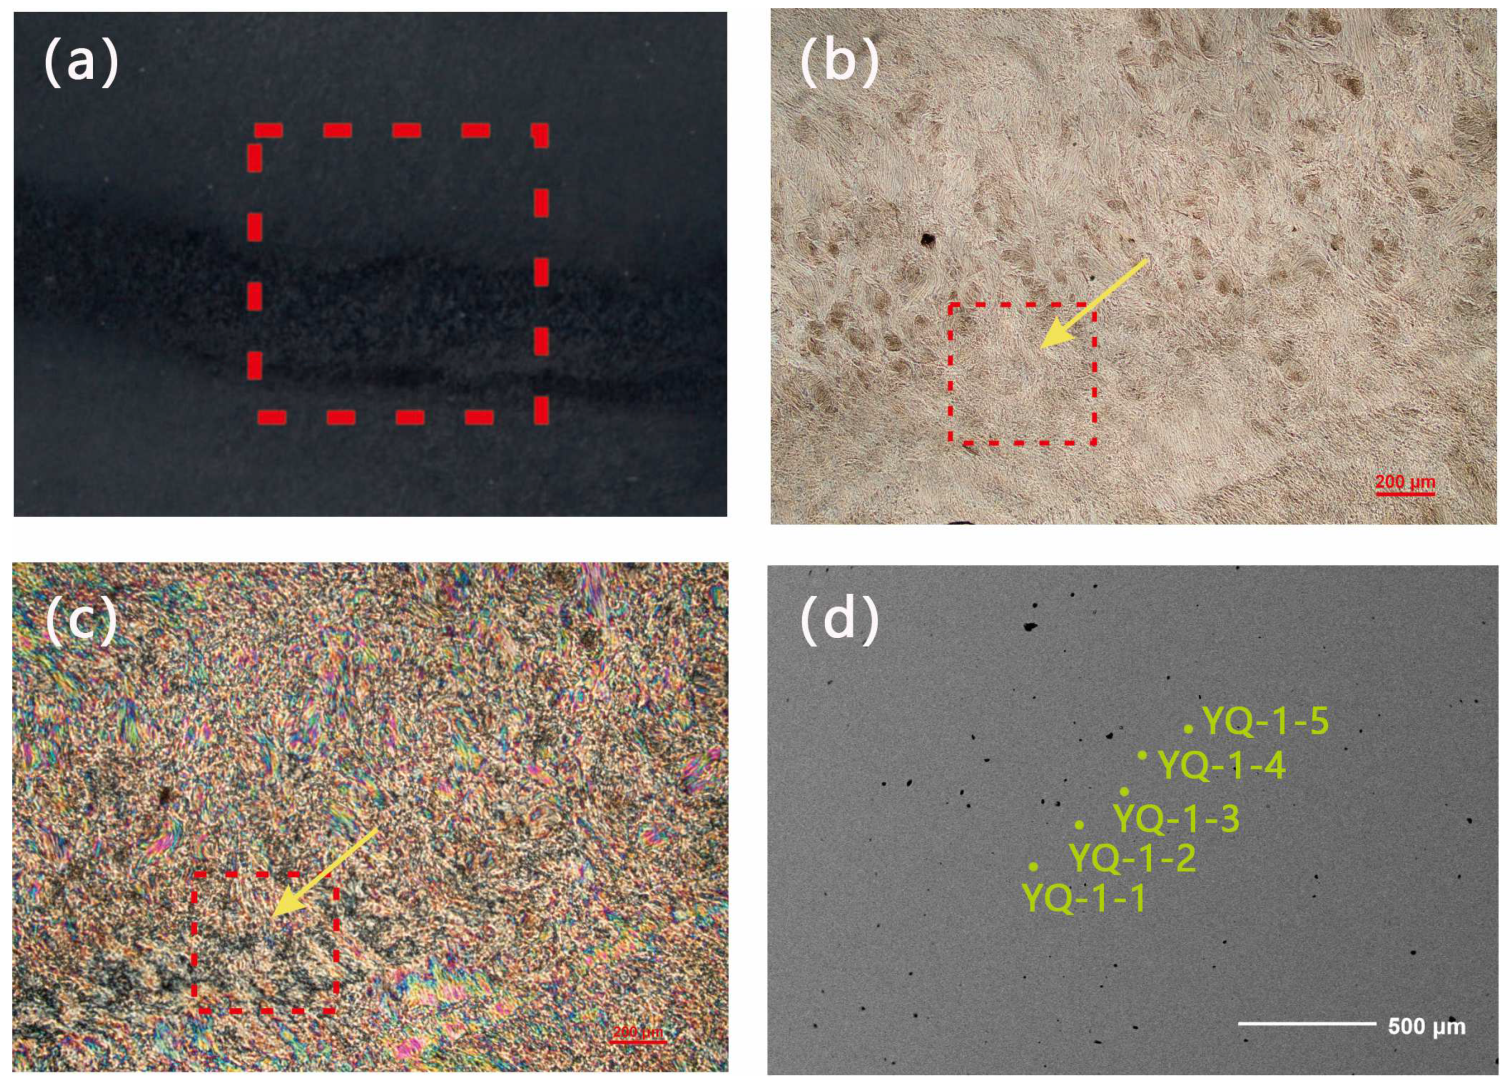
4.1. Mineralogical Characteristics

Figure 2a shows the five reflection spectra in FT-IR, three of which were based on the darker banded region, marked as YQ-1-D1, YQ-1-D2, and YQ-1-D3, and the other two were from the lighter part, marked as YQ-1-L1 and YQ-1-L2. The five spectra indicate the reflectance spectral features of tremolite. There were only small differences in the peak positions of the lighter and the darker parts at the medium- to the low-frequency range.
The FT-IR fingerprint characteristic absorption is shown in Figure 2b. The spectral band between 1200 and 900 cm−1 is assigned to the asymmetric stretching of the Si-O-Si and O-Si-O vibrations [33,34,35,36,37] in tremolite. These several shoulders and peaks near 1153 cm−1 and 1096 cm−1 are attributed to the v(Si-O) stretching, 1064 cm−1 is attributed to the vas (O-Si-O) stretching, and 1008 cm−1 and 923 cm−1 are attributed to the Si-O-Si stretching. The IR absorption peaks (around 1000 cm−1) of the D1, D2, and D3 points at the dark band shifted a little to lower wave numbers compared to the L1 and L2 points at the light band, which indicated that elements Fe2+ and Fe3+ were increasing [38]. The sharp peaks observed in the lower spectral region (700–400 cm−1) are attributed to the symmetric stretching of the Si-O-Si linkage [33,35,37]. The weak reflection peak around 3660 cm−1 is attributed to the bending modes of the OH group [19,33,35,39] and the Si-O-Si vibrations that may appear [40]. The -OH observed in this spectral range is mainly related to Mg (M1, M3) and the substitute metal element such as Fe. The spectral band at 3970 cm−1 is attributed to the Mg-OH stretching vibration and the Mg2+ sites in M1 and M2.
A less intense region was observed between 900 cm−1 and 400 cm−1. The spectral bands at 765 cm−1 and 642 cm−1 were attributed to Si-O-Si [41,42], where the absorbance peak at 765 cm−1 is the typical wave number attributable to tremolite [39,43]. The two weak bands at 550 cm−1 and 473 cm−1 are attributed to the Si-O and M (transition-metal)-O bending vibrations [44], where M can be Fe, Ti, Mn, Cr, etc.
The EPMA test was used to further confirm the major mineral composition and to detect the key elements contributing to the greyish-purple color. This detection focused on the transition region between the lighter greyish-purple to the darker color bands (Figure 3). The EPMA indicated that the mineral content of the sample consisted of almost homogeneous tremolite with few other minerals. The theoretical values implied that the major components were SiO2 (59.1–59.4%), CaO (13.1–13.2%), and MgO (25.1–25.2%) [45,46,47]. Five spots numbered YQ-1-1 to YQ-1-5 indicating color ranging from light to dark were tested, and the results are shown in Table 1. The first transition-metal ions, including Cr, Fe, Ni, Mn, and Cu, were detected. Cr and Ni were observed at low levels. The Ti element reported in the previous study was not detected [10]. Fe content was higher than other transition elements detected. Mn content tends to increase with color deepening. The highest value of Cu was also the value of Mn at the darkest spot of YQ-1-5.

4.2. Elemental Characteristics

4.2.1. Micro-XRF and LA-ICP-MS

Micro-XRF is an efficient, effective, and non-destructive technique for the detection of the major elements in the samples. Ten test points marked as YQ-1-XD1, YQ-1-XD2, YQ-1-XD3, YQ-1-XD4, and YQ-1-XD5 (from the dark banded area) and YQ-1-XL1, YQ-1-XL2, YQ-1-XL3, YQ-1-XL4, and YQ-1-XL5 (from the lighter part) were chosen. The micro-XRF analysis results of the ten selected points of the sample are shown in Table 2. The data indicated that the major element components of the tremolite are Si (50.815–52.196 wt%), Ca (26.486–27.239 wt%), and Mg (20.166–20.845 wt%). For the transition-metal M, the average values of Fe (0.539 wt%), Mn (0.063 wt%), and Cu (0.0264 wt%) at the dark band are higher than the average values of Fe (0.4408 wt%), Mn (0.0482 wt%), and Cu (0.0318 wt%) in the light area. However, as mentioned before, Ti was not detected in this test.
To further determine the relationship between the greyish-purple color and the transition-metal M, this study subsequently performed an in situ element LA-ICP-MS mapping analysis of the trace transition metals. The test region in the element map was chosen around the small part of the dark band for detecting the relative elemental changes in the dark band (Figure 4k). These data indicated that the different color regions display similar Si (Figure 4a), Mg (Figure 4b), and Ca (Figure 4c) contents, but the dark band presents higher Mn (Figure 4g) and Cu (Figure 4j) and lower Fe (Figure 4h).

4.2.2. EPR

The EPR experimental spectra are shown in Figure 5. The results of the EPR further investigated the site occupancy of the first transition metals. The EPR spectrum presents six hyperfine lines at a magnetic field strength of ~3400 G, and a weak peak at ~1500 G (Figure 5a). The ~3400 G magnetic hyperfine splitting recorded (Figure 5b) was characterized by a broad signal centered at g = 2.015, accompanied by forbidden (MS = 2) transitions at g = 4 (I = 5/2). The signal at g = ~4.33 (~1550 G) is attributed to Fe3+ (Figure 5a).
The EPR spectra reveal three Mn2+ centers and a rhombic Fe3+ center at the octahedral sites (M1, M2, and M3), but the spectrum intensities of Mn2+ and Fe3+ are not directly correlated with the concentrations of these elements. The main reason being that Mn also occurs in higher valence states, leading to minor amounts of Fe3+ substituting for Si4+ at the tetrahedral sites (T1 and T2) [18].

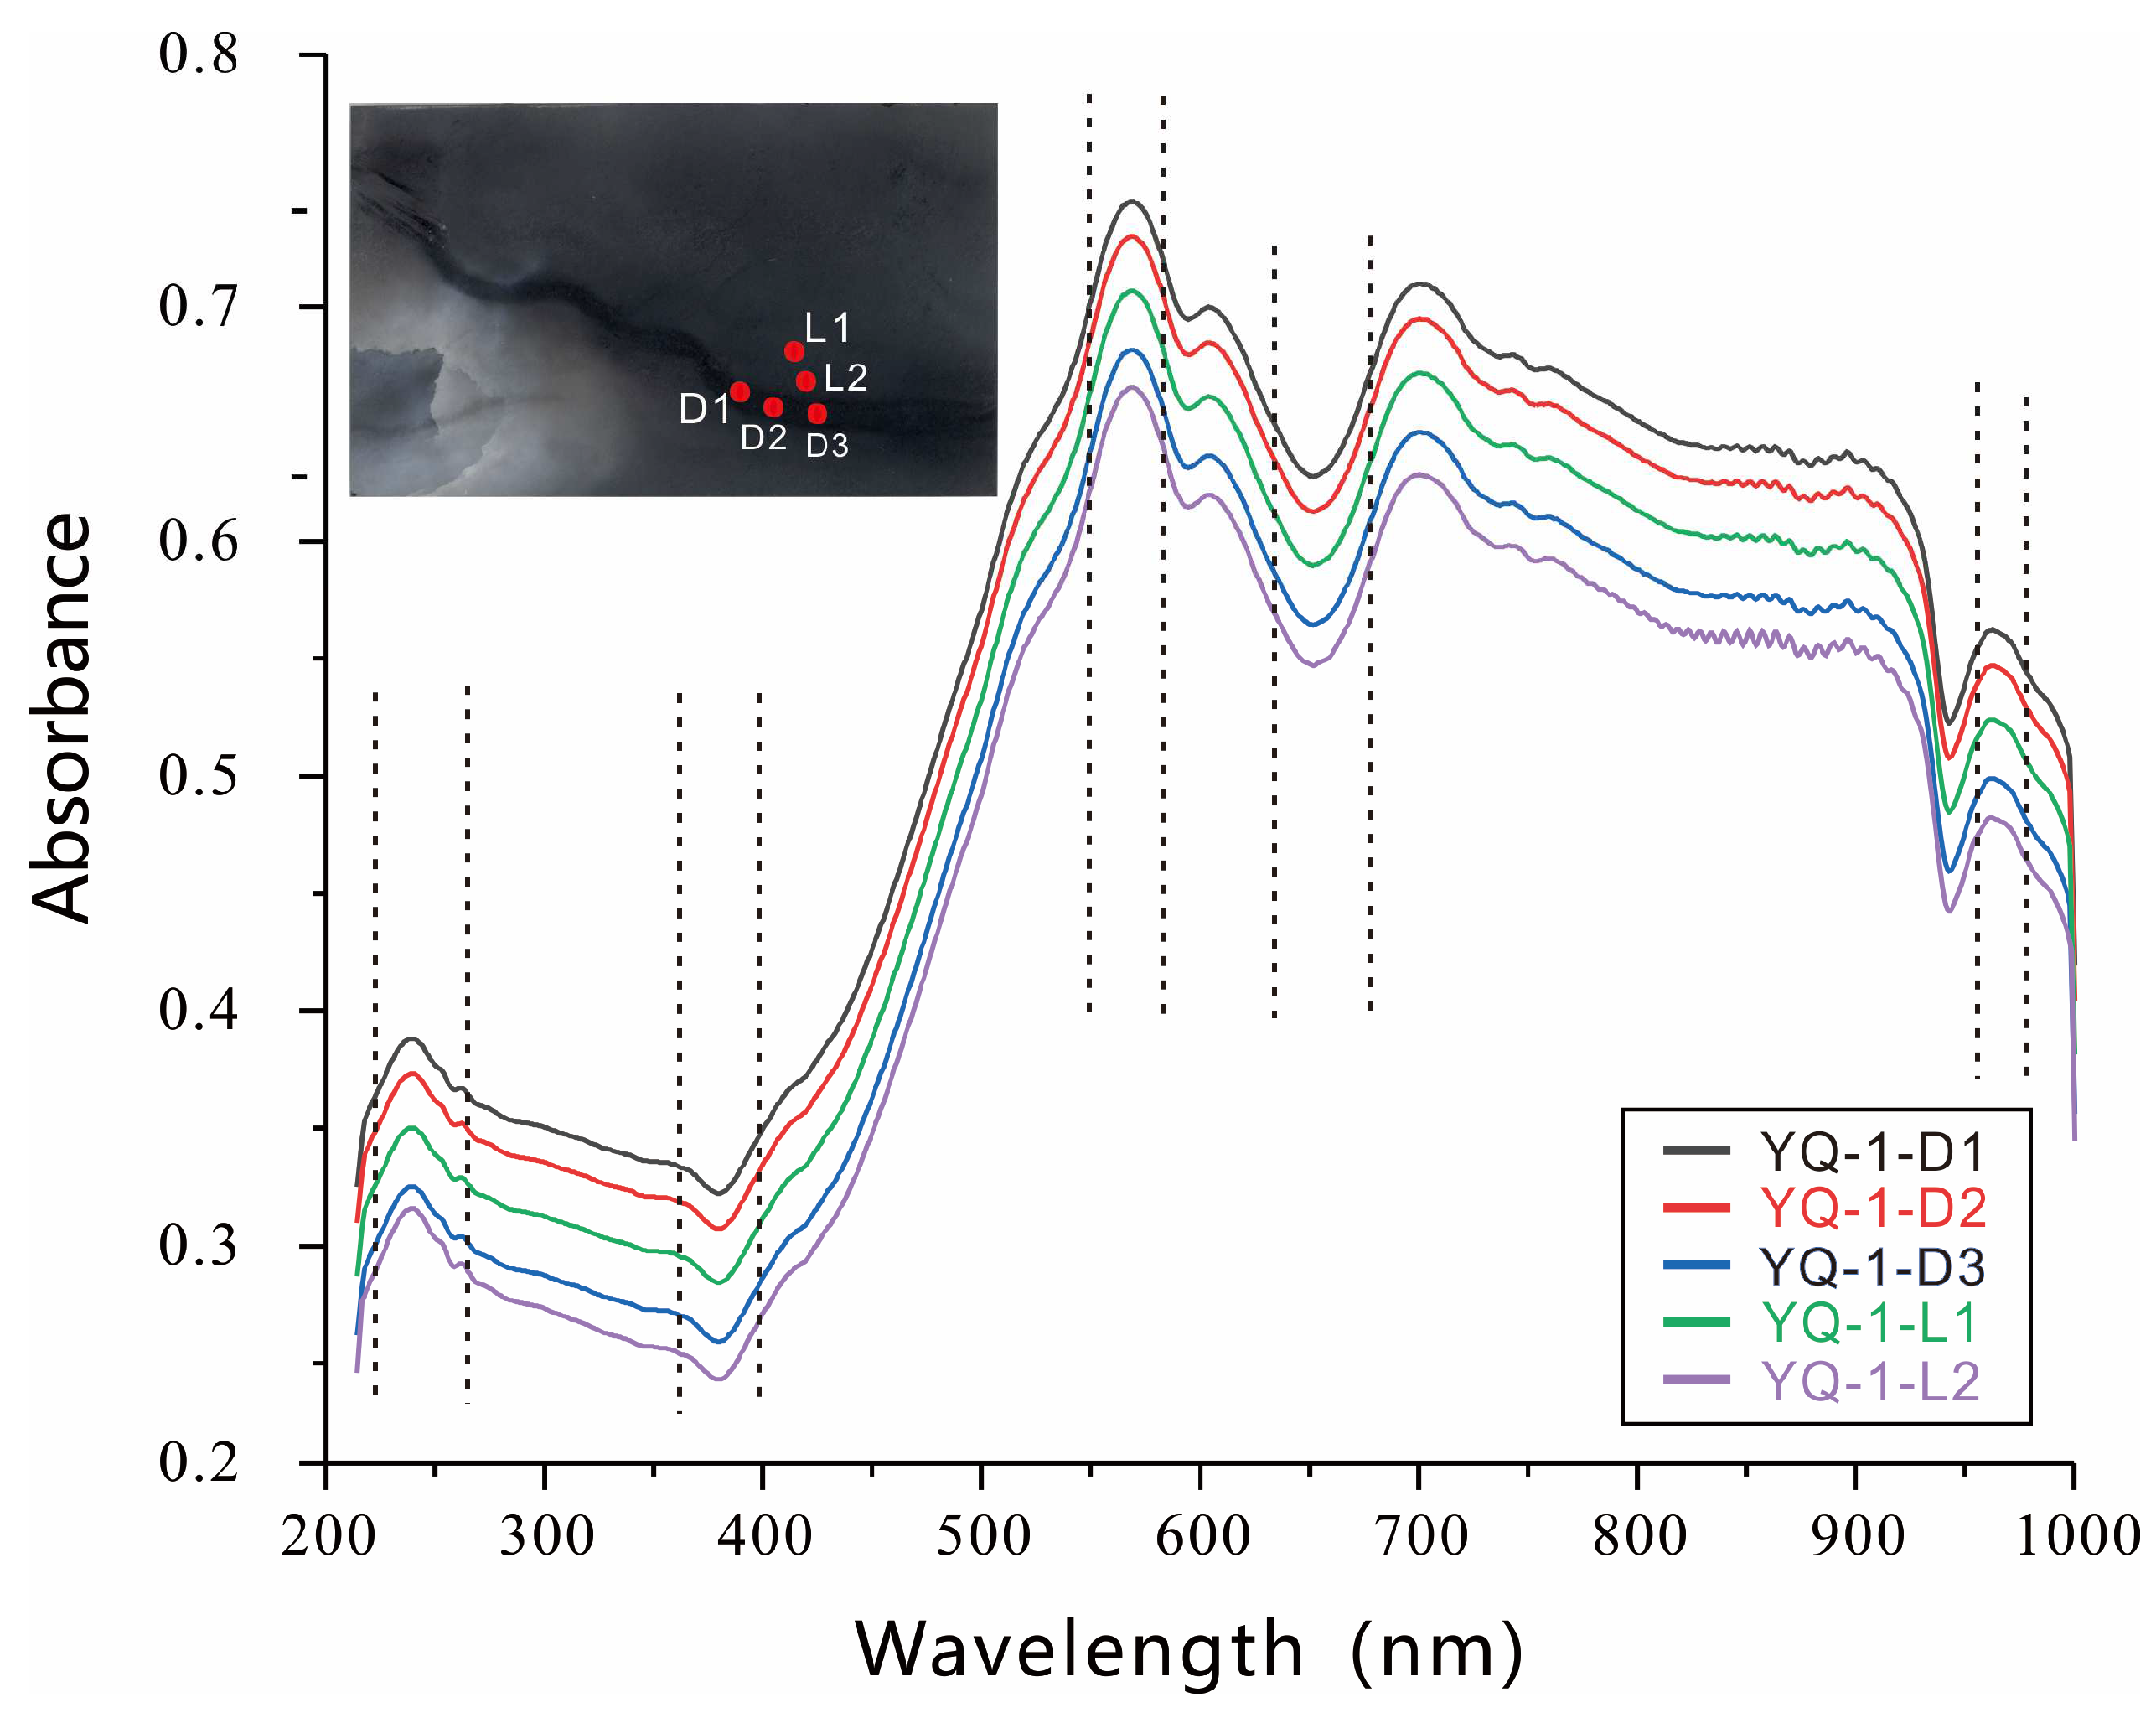
4.3. UV–Vis–NIR Spectrum Characteristics

The UV–Vis–NIR profiles of greyish-purple color tremolite jade at room air temperatures are shown in Figure 6. The absorption spectrum of the sample demonstrated broad and intense absorption bands at 238 nm, 568 nm, and 960 nm; and five broad and weak absorption bands at 600 nm, 700 nm, 745 nm, 760 nm, and 890 nm. It also demonstrated three absorption valley bands at 380 nm, 650 nm, and 940 nm.

5. Discussion

The FT-IR and EPMA analysis indicated that the sample is nearly pure tremolite aggregate and ruled out the possibility of color contributed by the impurity mineral. The official formula from the IMA Master List for tremolite is Ca2(Mg5.0-4.5Fe2+0.0-0.5)Si8O22(OH)2, for actinolite it is Ca2(Mg4.5-2.5Fe2+0.5-2.5)Si8O22(OH)2,, and for ferroactinolite it is Ca2(Mg2.5-0.0Fe2+2.5-5.0)Si8O22(OH)2. It is an end member of the tremolite-ferroactinolite series. The term used is tremolite when the ratio Mg/(Mg + Fe2+) ≥ 0.90, actinolite when the ratio Mg/(Mg + Fe2+) is between 0.50 and 0.90, and ferroactinolite when the ratio Mg/(Mg + Fe2+) < 0.50 [39,48,49]. The FT-IR results indicated that the weak reflection peak at around 3670 cm−1 is due to the bending modes of the OH group [33]. The -OH in this spectral range is mainly related to Mg (M1, M3) and the substitute metals such as Fe. The spectral band at 3970 cm−1 is attributed to the Mg-OH stretching vibration and the Mg2+ in M1 and M2 sites. In addition to the major chemical constituents of Si4+, Mg2+, and Ca2+, the samples included impurities such as Fe, Mn, Ti, Cu, and Ni. These impurity ions are generally first transition metals which include the incomplete d orbital. According to the ligand field theory [44], the color of the minerals is due to the absorption radiation of their electron transitions in the visible range. Each wavelength or frequency of visible light corresponds to a color. Hence, there can be minerals that selectively absorb visible light at certain wavelengths or frequencies to produce color. The color of any mineral is the color of the remaining visible light wavelengths or frequencies not absorbed by that mineral. When the tremolite containing transition metals is irradiated with light, the electrons in the d orbital of the transition element in the mineral absorb the energy of the irradiated light and move from a state of lower energy to a state of higher energy, thereby resulting in absorption phenomenon and color.
Different electron transitions of the minerals in the visible range lead to the color of the minerals. The major factors contributing to the color of greyish-purple tremolite jade are as follows: (1) d–d electronic transition between d electron orbitals, and f–f electron transitions between lanthanide electron orbitals; (2) electron transition caused by the electric charge transfer between the adjacent ions (e.g., Fe2+–Fe3+ charge transfer).
The broad absorption between maxima ~500 nm and ~560 nm in the visible range and maxima at 700 nm and 520 nm in the visible absorption spectrum can lead to a transmission window at ~400–430 nm that produces the violet color, and this is mainly due to Mn ion d–d electronic transition. Schmetzer and Bank (1980) pointed out that the absorption at ~560 nm is attributed to the Fe2+–Ti4+ charge transfer [36]. However, the chemical tests followed in this study could not detect Ti. Thus, the UV–Vis–NIR results of the investigated sample exhibited a broad absorption band at 560 nm (17,850 cm−1), which is because of Mn2+ in octahedral coordination for absorption by the d–d transitions of 6A1g(S) → 4T1g(G) [50]. The 720–760 nm region is due to the Fe2+–Fe3+ charge transfer in the tremolite [51], and the visible absorption spectrum of Fe3+ between maxima 430 nm and 463 nm is caused by the d–d transitions of 6A1 → A1(4G) + 4E(4D). If both the d–d transitions of Fe3+ and the Fe2+–Fe3+ charge transfer coexist in the lattice of the tremolite, the color of the tremolite primarily depends on the latter because of the higher strength of the electric charge. The absorption bands at ~720 and ~760 nm in the visible absorption spectrum can lead to a yellowish-green to brownish-green color. In this study, the UV spectrum of the collected sample demonstrated a very weak narrowband absorption at 745 nm, and the range between 430 nm to 463 nm is not clearly visible. Therefore, the absorption of the Fe ion in greyish-purple tremolite jade is primarily because of the Fe2+–Fe3+ charge transfer. In addition, the optical-absorption maxima in the 690–940 nm region can be assigned to the d–d electronic transition absorption bands of Cu2+ [52] and produce a blue to blueish-green color [53]. The strong band at ~700 nm is assigned to the 2Ag → 2Bg transitions of Cu2+, and the weak band at ~900 nm is assigned to 2B1g → 2A1g. These absorption bands are typically observed in several copper complexes. The UV–Vis–NIR spectrum of the sample exhibited an absorption band at ~700 nm, which is much stronger than that at 745 nm, implying that the d–d electronic transition absorption of Cu2+ plays an important role than the Fe2+–Fe3+ charge transfer. This finding is in agreement with the EPR analysis result.
The optical-absorption experimental techniques and crystal field theory have been widely used in the research of the valence states of the transition-metal ions and the ligand symmetry to illustrate the color of the minerals [54,55,56,57]. A silicon-oxygen tetrahedron (SiO4)4− consists of Si surrounded by four oxygen atoms in the shape of a tetrahedron to form an amphibole crystal structure. The essential characteristic of the amphibole structure is a double chain of corner-linked Si-O tetrahedrons that extend parallel to the c-axis. The silica chains are linked by Ca2+ and Mg2+. Five different voids are present between the silica double chain, namely, M1, M2, M3, M4, and A, where A > M4 > M3 ≈ M1 > M2 [58]. The occupancy of the Ca2+ and Mg2+ cation sites was determined as M1, M2, and M3, where M1 and M2 are smaller, M3 is slightly larger, and the cations of Ca2+ and Mg2+ exist in sixfold coordination. The M1 and M3 coordination octahedrons are composed of 4O2+ (OH), and the M2 coordination octahedrons are composed of 6O. These coordination octahedrons are co-angled with each other, forming a band parallel to the c-axis. The ions with large ionic radius, i.e., Ca2+ or Na+, occupy M4, an 8-fold coordination site. If the void is occupied by Mn2+, Fe2+, Cu2+, Mg2+, etc., it is a sixfold coordination site leading to octahedral distortion. The ions K+ and Na+ with larger radii usually occupy the cation vacancy sites. The different colors of the tremolite are mainly attributed to the trace transition elements. Consistent with the data previously recorded by EPMA, the first transition-metal ions of the greyish-purple color tremolite primarily include Fe, Mn, Ti, Cu, Ni, etc., all belonging to the first main transition series having an unfilled d orbital. The EPR spectra indicated that ~3400 G six hyperfine lines are contributed by the hyperfine interactions between the unpaired electron of transition-metal ion Mn2+ with the 55Mn nucleus in the octahedral site, corresponding to 5/2, 3/2, 1/2, +1/2, +3/2, and +5/2 lines from low to high magnetic field. The radii of Mn2+ (0.091 nm) and Mg2+ (0.078 nm) are close to each other, and the isomorphous replacement tends to occur between them [51]. The resonance absorption spectrum of Mn2+ is nearly isotropic, indicating that Mn2+ has high structural flexibility. In addition, Mg2+ lies in the center of the octahedral site M2, and the symmetry of M2 is higher than those of M1 and M3, as previously mentioned. Thus, Mn2+ is most likely to substitute Mg2+ in the M2 site. Similarly, the radius of Cu2+ (0.073 nm) is closer to that of Mg2+. Therefore, it is also an ideal ion to substitute Mg2+ in the crystal lattice to form octahedral coordination. The EPR spectrum of Cu2+ exhibit typical axial symmetry of ~3100 G, and its g value is ~2.0–2.3 in 298 k [59], with the g value and the peak position approaching those of Mn2+. The EPR result of the sample does not show the Cu2+ spectra because the Cu2+ signal curve was overlapped by the Mn2+ signal curve or the Cu2+ signal was beyond the lower instrument detection limit. The EPR can only detect the Fe3+ absorption spectrum at room temperature, and the spin-lattice relaxation time of Fe2+ is too short to be detected. The spectral lines under the influence of a magnetic field ~1550 G are close to each other and caused by Fe3+ quadruple resonance absorption according to a previous study [60]. The intensity of the resonance absorption of Mn2+ is stronger than that of Fe2+, implying that Mn2+ is the dominant paramagnetic ion in the study samples. Yu et al. (2019) analyzed the EPR spectrum of greyish-purple tremolite jade at the cryogenic temperature of 93 K in their previous study, and the results suggested that the EPR spectrum between 3440 G and 3460 G is caused by the Ti4+ resonance absorption at 93 K [11]. Luo et al. (2017) also analyzed the cryogenic EPR spectrum of the greyish-purple color tremolite jade at 77 K and fitted the EPR experiment data at ~3400 G. The fitting line further confirmed that the resonance signal is mainly due to the spin-forbidden transition of Mn2+ [16]. The chemical composition results indicated that Ti is very low or not detected in this study. Therefore, there is no correlational evidence to support the point of view that the Fe3+-Ti4+ charge transfer is the major reason for the origin of the greyish-purple color. The major elemental analysis results indicated the Fe, Mn, and Cu elements can be the chromophore elements. It is suggested that the average values of the Fe, Mn, and Cu contents in the dark band are higher than those in the light area. This indicated that Cu2+ is closely related to the greyish-purple color apart from Mn and Fe ions mentioned in the previous work.
The in situ LA-ICP-MS mapping further confirmed the relationship between Fe, Mn, Cu, and the greyish-purple color. A 7160 × 5975 µm2 rectangular area was selected on the lighter greyish-purple to the darker color transition region as the analysis area for LA-ICP-MS mapping. The first transition-metal data within this area was collected to investigate the relationships between color variations and the concentration of the first transition metals. The LA-ICP-MS mapping results demonstrated that the relative concentration distribution of Cu, Mn, and Fe has a positive correlation with the greyish-purple color, and the degree of element substitution in the dark band region is larger than that in the light one. The homogeneous distribution patterns of Cr, V, Ni, and Ti illustrate that these first transition elements have no relationship with the color changes. The most significant variance is observed in the relative Mn content in the dark band region followed by Cu and Fe. This further confirmed the contribution of Cu2+ to the greyish-purple color. Luo et al. (2017) evaluated the L*a*b* value of the greyish-purple color tremolite slice of 1 mm thickness, and the calculated dark color was found to be 65, 4, 4 [16], with the corresponding sRGB value of 225, 215, 210. LA-ICP-MS mapping results combined with the UV–Vis–NIR spectrum analysis indicated that the major visible absorption spectrum band is the result of the d–d transitions of Mn2+, and the d–d transition bands of Cu2+ are stronger than the Fe2+–Fe3+ charge transfer. The optical spectroscopy analysis results and the LA-ICP-MS mapping results were in good agreement with each other. Thus, it can be stated that Cu2+, which was not mentioned in the previous studies, also significantly contributed to the greyish-purple color.

6. Conclusions

This study mainly combined mineralogical and spectroscopic methods to investigate greyish-purple color of nephrite from Sanchahe in Qinghai Province, NW China. Both the UV–Vis–NIR spectrum and the EPR confirmed that the d–d transitions of Mn2+ primarily contribute to the greyish-purple color of the tremolite. The limitation of the lower detection limit can be overcome by the application of the micro-XRF and EPMA tests, which may indicate the contribution of Cu to the greyish-purple color. The LA-ICP-MS mapping analysis clearly illustrated the distribution of chromogenic elements and further confirmed that Mn, Cu, and Fe are positively related to the greyish-purple color. Further, the crystal field theory analysis also indicated that the d–d transitions of Mn2+ and Cu2+ and the Fe2+–Fe3+ charge transfer are closely related to the greyish-purple color of the tremolite. It is of utmost significance to study the ionic lattice site occupation of Mn, Cu, and Fe elements in detail in the future. Moreover, the LA-ICP-MS mapping can be especially useful and more relevant for understanding the relationships of very low-level color-inducing elements with the color-inducing mechanism.

Author Contributions

Conceptualization, N.G.; methodology, N.G.; software, N.G. and S.X.; validation, N.G., C.W. and S.X.; formal analysis, N.G.; investigation, N.G. and S.X.; resources, N.G.; data curation, N.G.; writing—original draft preparation, N.G.; writing—review and editing, S.X., N.G. and C.W.; visualization, N.G. and S.X.; supervision, C.W.; funding acquisition, N.G. All authors have read and agreed to the published version of the manuscript.

Funding

This research was funded by the 2022 Tertiary Education Scientific Research Project of Guangzhou Municipal Education Bureau, grant number 202235328. This research was also funded by Guangzhou Panyu Polytechnic, grant numbers 220224086 and 210224251.

Data Availability Statement

Not applicable.

Acknowledgments

The authors are very thankful to Kun Li for providing samples and funds. The authors are grateful to Yuefeng Zhang, Fangfang Huang, Chengqiang Pan, and Ziwei Tang for the help and valuable suggestions.

Conflicts of Interest

The authors declare no conflict of interest.

References

  1. Qiu, Z.; Zhang, Y.; Li, L.; Li, X.; Qin, S. Discussion on Two Metallogenic Mechanisms of Hetian Jade in Hetian Area, Xinjiang. J. Jilin Univ. Earth Sci. Ed. 2015, 45, 1–2. [Google Scholar]
  2. Dong, B. Geological Situation and Jade Characteristics of Golmud Jade in Qinghai Province. Nonmet. Geol. 1996, 5, 23–28. (In Chinese) [Google Scholar]
  3. Chai, F.; Parati, A. Comparative Study of the Gemological Characteristics of Nephrite of Hetian Jade and Qinghai Jade. J. Xinjiang Inst. Technol. 2000, 1, 77–80. [Google Scholar]
  4. Feng, X.; Zhang, B. Composition and Structural Characteristics of Nephrite from Qinghai. J. Gems Gemmol. 2004, 4, 7–9. [Google Scholar]
  5. Liu, H.; Yang, M.; Yang, T.; Li, J. Study on Colour and Gemmological Characteristics of Viridis Nephrite from Qinghai Province. J. Gems Gemmol. 2013, 15, 7–14. [Google Scholar]
  6. Zhou, Z.; Liao, Z.; Ma, T.; Yuan, Y. Study on Ore-Forming Type and Genetic Mechanism of Sanchakou Nephrite Depositin Qinghai Province. J. Tongji Univ. Nat. Sci. 2005, 9, 1191–1194. [Google Scholar]
  7. Wang, J.; Gan, Y.; Li, J.; Wei, J. Analysis on Nephrite Conditions and Discovery Prospects in Dazaohuo Area in Qinghai Province. Plateau Earthq. Res. 2007, 19, 47–51. [Google Scholar]
  8. Zhou, Z.; Liao, Z.; Chen, Y.; Li, Y.; Ma, T. Petrological and Mineralogical Characteristics of Qinghai Nephrite. Rock Miner. Anal. 2008, 1, 17–20. [Google Scholar]
  9. Yu, H.; Ruan, Q.; Sun, Y.; Li, D. Micro-Morphology and Mineral Composition of Different Color Qinghai Nephrites. Rock Miner. Anal. 2018, 37, 626–636. [Google Scholar]
  10. Yu, H.; Ruan, Q.; Liao, B.; Li, D. Geochemical Characteristics and Ar-Ar Dating of Different Deposits in Qinghai Province. Acta Petrol. Miner. 2018, 37, 655–668. [Google Scholar]
  11. Yu, H.; Ruan, Q.; Sha, X.; Yang, Y. Study on Color—Causing Elements in Qinghai Nephrite by Elemental Analysis and Electron Paramagnetic Resonance Spectroscopy. Rock Miner. Anal. 2019, 38, 288–296. [Google Scholar]
  12. Song, H.; Tan, H.; Zu, E. Spectral Characteristics of Qinghai Nephrite with Different Colors. Bull. Chin. Ceram. Soc. 2020, 39, 242–246. [Google Scholar]
  13. Hao, N.; Tao, L.; Wang, N.; Zhang, K. Analysis of Spectral Characteristics and Color Causes of Tremolite Jade Inyeniugou, Qinghai Province. J. Hebei Geo Univ. 2021, 44, 11–15. [Google Scholar]
  14. Zhang, C.; Yu, X.; Yang, F.; Santosh, M.; Huo, D. Petrology and Geochronology of the Yushigou Nephrite Jade from the North Qilian Orogen, Nw China: Implications for Subduction-Related Processes. Lithos 2021, 380–381, 105894. [Google Scholar] [CrossRef]
  15. Li, Y.; Lai, Y. Study on Metallogenic Mechanism of the Tremolite Jade Deposit in Jiubagou, Qinghai Province. Beijing Da Xue Xue Bao 2021, 57, 1087–1100. [Google Scholar]
  16. Luo, Z.; Shen, A.; Yang, M. Study on Color Quantitative Expression, Replication and Color Origin of Gray-Purple Nephrite from Qinghai, China Based on Spectroscopy Methods. Spectrosc. Spectr. Anal. 2017, 37, 822–828. [Google Scholar]
  17. Zhang, B. Systematic Gemology; Geology Press: Beijing, China, 2006. (In Chinese) [Google Scholar]
  18. Yu, H. Coloring and Metallogenic Mechanisms of Different Colors in Qinghai Nephrite. Ph.D. Thesis, Nanjing University, Nanjing, China, 2016. [Google Scholar]
  19. Hao, N.A. Gemological Study of Tremolite Jade in Yeniugou, Qinghai. Master’s Thesis, Hebei GEO University, Shijiazhuang, China, 2021. [Google Scholar]
  20. Jackson, S.E.; Longerich, H.P.; Dunning, G.R.; Freyer, B.J. The Application of Laser-Ablation Microprobe; Inductively Coupled Plasma-Mass Spectrometry (Lam-Icp-Ms) to in Situ Trace-Element Determinations in Minerals. Can. Miner. 1992, 30, 1049–1064. [Google Scholar]
  21. Norman, M.D.; Pearson, N.J.; Sharma, A.; Griffin, W.L. Quantitative Analysis of Trace Elements in Geological Materials by Laser Ablation Icp-Ms: Instrumental Operating Conditions and Calibration Values of Nist Glasses. Geostand. Geoanal. Res. 1996, 20, 247–261. [Google Scholar] [CrossRef]
  22. Günther, D.; Frischknecht, R.; Heinrich, C.A.; Kahlert, H.J. Capabilities of an Argon Fluoride 193 Nm Excimer Laser for Laser Ablation Inductively Coupled Plasma Mass Spectometry Microanalysis of Geological Materials. J. Anal. At. Spectrom. 1997, 12, 939–944. [Google Scholar] [CrossRef]
  23. Hinchey, J.G.; Wilton, D.H.C.; Tubrett, M.N.; Jackson, S.E.; Guenther, D.; Sylvester, P.J. A Lam-Icp-Ms Study of the Distribution of Gold in Arsenopyrite from the Lodestar Prospect, Newfoundland, Canada. Can. Miner. 2003, 41, 353–364. [Google Scholar] [CrossRef]
  24. Woodhead, J.D.; Hellstrom, J.; Hergt, J.M.; Greig, A.; Maas, R. Isotopic and Elemental Imaging of Geological Materials by Laser Ablation Inductively Coupled Plasma-Mass Spectrometry. Geostand. Geoanal. Res. 2007, 31, 331–343. [Google Scholar] [CrossRef]
  25. Ulrich, T.; Kamber, B.S.; Jugo, P.J.; Tinkham, D.K. Imaging Element-Distribution Patterns in Minerals by Laser Ablation- Inductively Coupled Plasma-Mass Spectrometry (La-Icp-Ms). Can. Miner. 2009, 47, 1001–1012. [Google Scholar] [CrossRef]
  26. Rittner, M.; Muller, W. 2D Mapping of La-Icpms Trace Element Distributions Using R. Comput. Geosci. 2012, 42, 152–161. [Google Scholar] [CrossRef]
  27. Paul, B.; Paton, C.; Norris, A.; Woodhead, J.; Hellstrom, J.; Hergt, J.; Greig, A. Cellspace: A Module for Creating Spatially Registered Laser Ablation Images within the Iolite Freeware Environment. J. Anal. At. Spectrom. 2012, 27, 7–76. [Google Scholar] [CrossRef]
  28. Paul, B.; Woodhead, J.D.; Paton, C.; Hergt, J.M.; Hellstrom, J.; Norris, C.A. Towards a Method for Quantitative La-Icp-Ms Imaging of Multi-Phase Assemblages; Mineral Identification and Analysis Correction Procedures. Geostand. Geoanal. Res. 2014, 38, 253–263. [Google Scholar] [CrossRef]
  29. Ubide, T.; McKenna, C.A.; Chew, D.M.; Kamber, B.S. High-Resolution La-Icp-Ms Trace Element Mapping of Igneous Minerals; In Search of Magma Histories. Chem. Geol. 2015, 409, 157–168. [Google Scholar] [CrossRef]
  30. A, C.; Wang, Y.; Ren, J.; Bao, G. Disintegration of the Wanbaogou Group and Discovery of Early Cambrian Strata in the East Kunlun Area. Geol. China 2003, 2, 199–206. [Google Scholar]
  31. Zhou, Z.; Liao, Z.; Ma, T.; Yuan, Y. Study on the Genetic Mechanism and Material Source of Sanchakou Nephrite Deposit in East Kunlun. Contrib. Geol. Miner. Resour. Res. 2006, 3, 195–198. [Google Scholar]
  32. Paton, C.; Hellstrom, J.; Paul, B.; Woodhead, J.; Hergt, J. Iolite: Freeware for the Visualisation and Processing of Mass Spectrometric Data. J. Anal. At. Spectrom. 2011, 26, 2508–2518. [Google Scholar] [CrossRef]
  33. Andrut, M.; Gottschalk, M.; Melzer, S.; Najorka, J. Lattice Vibrational Modes in Synthetic Tremolite-Sr-Tremolite and Tremolite-Richterite Solid Solutions. Phys. Chem. Miner. 2000, 27, 301–309. [Google Scholar] [CrossRef]
  34. Jovanovski, G.; Makreski, P.; Kaitner, B.; Boev, B. Silicate Minerals from Macedonia. Complementary Use of Vibrational Spectroscopy and X-Ray Powder Diffraction for Identification and Detection Purposes. Croat. Chem. Acta 2009, 82, 363. [Google Scholar] [CrossRef]
  35. Lei, C. The Genesis of the Xiaozaohuo Nephrite Deposit in Eastern Kunlun Orogenic Belt. Ph.D. Thesis, China University of Geosciences, Wuhan, China, 2016. [Google Scholar]
  36. Schmetzer, K.; Bank, H. Explanations of the Absorption Spectra of Natural and Synthetic Fe- And Ti-Containing Corundums. Neues Jahrb. Für Miner. Abh. 1980, 139, 216–225. [Google Scholar]
  37. Shurvell, H.F.; Rintoul, L.; Fredericks, P.M. Infrared and Raman Spectra of Jade and Jade Minerals. Internet J. Vib. Spectrosc. 2001, 5, 4. [Google Scholar]
  38. Dai, L.; Jiang, Y.; Yang, M. Study on the Spectral Ldentification Characteristics of “Heiqing” and “Heibi”. Spectrosc. Spectr. Anal. 2021, 41, 292–298. [Google Scholar]
  39. Makreski, P.; Jovanovski, G.; Gajović, A. Minerals from Macedonia: XVII. Vibrational Spectra of some Common Appearing Amphiboles. Vib. Spectrosc. 2006, 40, 98–109. [Google Scholar] [CrossRef]
  40. Farmer, V.C. The Layer Silicates. Monogr. Miner. Soc. 1974, 4, 331–363. [Google Scholar]
  41. Burns, R.G.; Roger, G.J.S. Infrared Study of the Hydroxyl Bands in Clinoamphiboles. Science 1966, 153, 890–892. [Google Scholar] [CrossRef]
  42. Strens, R.G.J. The Infrared Spectra of Minerals. Miner. Soc. Monogr. 1974, 4, 305–330. [Google Scholar]
  43. Patterson, J.H.; O’Connor, D.J. Chemical Studies of Amphibole Asbestos. I. Structural Changes of Heat-Treated Crocidolite, Amosite, and Tremolite from Infrared Absorption Studies. Aust. J. Chem. 1966, 19, 1155–1164. [Google Scholar] [CrossRef]
  44. Ishida, K.; Hawthorne, F.C.; Ando, Y. Fine Structure of Infrared Oh-Stretching Bands in Natural and Heat-Treated Amphiboles of the Tremolite-Ferro-Actinolite Series. Am. Miner. 2002, 87, 891–898. [Google Scholar] [CrossRef]
  45. Wong, J.Y.; Berggren, M.J.; Schawlow, A.L. Far-Infrared Spectrum of Al2O3:V4+. J. Chem. Phys. 1968, 49, 835–842. [Google Scholar] [CrossRef]
  46. Douglas, J.G. Exploring Issues of Geological Source for Jade Worked by Ancient Chinese Cultures with the Aid of X-Ray Fluorescence. In Scientific Research in the Field of Asian Art; Archetype Publications: London, UK, 2003; pp. 192–199. [Google Scholar]
  47. Meinert, L.; Dipple, G.; Nicolescu, S. World Skarn Deposits; Society of Economic Geologists: Littleton, CO, USA, 2005; pp. 299–336. [Google Scholar]
  48. Jia, R.; Jiang, T.; Zhu, Y.; Liu, J. Gemmological Characteristic of “Qinghua” Nephrite from Hetian, Xinjiang. J. Gems Gemmol. 2019, 21, 54–58. [Google Scholar]
  49. Roth, P. The Early History of Tremolite. Axis 2006, 2, 1–10. [Google Scholar]
  50. Stoll, S.; Schweiger, A. Easyspin, a Comprehensive Software Package for Spectral Simulation and Analysis in Epr. J. Magn. Reson. (1997) 2006, 178, 42–55. [Google Scholar] [CrossRef] [PubMed]
  51. Lu, B. The Gemological Mineralogy and Spectroscopy of Nephrite Cat’s Eye and Serpentine Cat’s Eye from Shimian, Sichuan Province, Southwest of China. Ph.D. Thesis, Shanghai University, Shanghai, China, 2005. [Google Scholar]
  52. Abduriyim, A.; Kitawaki, H.; Furuya, M.; Schwarz, D. “Paraíba”-Type Copper-Bearing Tourmaline from Brazil, Nigeria, and Mozambique: Chemical Fingerprinting by La-Icp-Ms. Gems Gemol. 2006, 42, 4–21. [Google Scholar] [CrossRef]
  53. Laurs, B.M.; Zwaan, J.C.; Breeding, C.M.; Simmons, W.B.; Beaton, D.; Rijsdijk, K.F.; Befi, R.; Falster, A.U. Copper-Bearing (Paraiba-Type) Tourmaline from Mozambique. Gems Gemol. 2008, 44, 4–30. [Google Scholar] [CrossRef] [Green Version]
  54. Gallagher, D.; Hong, X.; Nurmikko, A.; Bhargava, R.N. Optical Properties of Manganese-Doped Nanocrystals of Zns. Phys. Rev. Lett. 1994, 72, 416–419. [Google Scholar]
  55. Evans, B.D.; Stapelbroek, M. Optical Properties of the F+ Center in Crystalline Al2O3. Phys. Rev. B 1978, 18, 7089–7098. [Google Scholar] [CrossRef]
  56. McClure, D.S. Optical Spectra of Transition-Metal Ions in Corundum. J. Chem. Phys. 1962, 36, 2757–2779. [Google Scholar] [CrossRef]
  57. Keig, G.A. Influence of the Valence State of Added Impurity Ions on the Observed Color in Doped Aluminum Oxide Single Crystals. J. Cryst. Growth 1968, 2, 356–360. [Google Scholar] [CrossRef]
  58. Luo, G.; Chen, W. Basic Crystallography and Mineralogy; Nanjing University Press: Nanjing, China, 1993; pp. 210–267. [Google Scholar]
  59. Sharma, K.B.N.; Moorthy, L.R.; Reddy, B.J.; Vedanand, S. Epr and Electronic Absorption Spectra of Copper Bearing Turquoise Mineral. Phys. Lett. A 1988, 132, 293–297. [Google Scholar] [CrossRef]
  60. Sherman, D.; Waite, T. Electronic Spectra of Fe3+ Oxides and Oxide Hydroxides in the Near Ir to Near Uv. Am. Miner. Am. Miner. 1985, 70, 1262–1269. [Google Scholar]
Figure 1. (a) Location of the Sanchahe mine in Qinghai of China (the red triangle marked in the map); (b) a photo of the sample: the main study area is marked by the red dotted lines.
Minerals 13 01049 g001
Figure 2. (a) The FT-IR spectra of the sample. The test points of D1, D2, and D3 lie at the dark band; L1 and L2 lie at the light-color area right beside the band. (b) A larger version of the IR fingerprint characteristic absorption of the test points.
Minerals 13 01049 g002
Figure 3. The EPMA test area of the sample. (a) Partial enlarged photo of the sample: the main study area is marked by the red dotted lines; (b) mineral micrograph of the sample; (c) orthogonal polarizing micrograph of the sample; (d) the tested points.
Minerals 13 01049 g003
Figure 4. In situ element LA-ICP-MS mapping of the sample. (ac) major element Si, Mg, and Ca; (dj) first transition-metal elements Ti, V, Cr, Mn, Fe, Ni, and Cu; (k) test region of the sample.
Minerals 13 01049 g004
Figure 5. Powder EPR spectra of the sample. (a) Six hyperfine lines at a magnetic field strength of ~3400 G, and a weak peak at ~1500 G; (b) partial magnification of six hyperfine lines at ~3400 G in (a).
Minerals 13 01049 g005
Figure 6. The UV–Vis–NIR Spectrum of the sample. The test points of D1, D2, and D3 lie at the dark band; L1 and L2 lie at the light-color area right beside the band.
Minerals 13 01049 g006
Table 1. Chemical composition of the sample, as determined by EPMA. Oxides (wt%).
Spots MgOAl2O3 K2OCaOCr2O3FeONa2OSiO2NiOMnOP2O5CuOTotal
YQ-1-125.17 0.12 0.03 13.22 0.00 0.11 0.06 59.65 0.00 0.02 0.00 0.01 98.37
YQ-1-225.21 0.13 0.05 12.78 0.02 0.06 0.06 59.56 0.02 0.01 0.00 0.01 97.89
YQ-1-325.13 0.09 0.04 13.25 0.01 0.08 0.05 59.43 0.04 0.02 0.01 0.01 98.15
YQ-1-425.13 0.10 0.04 13.16 0.00 0.13 0.07 59.21 0.01 0.03 0.01 0.01 97.89
YQ-1-525.19 0.13 0.03 12.95 0.00 0.09 0.07 59.24 0.00 0.04 0.00 0.03 97.77
Average25.16 0.11 0.03 13.10 0.00 0.11 0.05 59.34 0.01 0.02 0.00 0.02 97.96
Sigma0.11 0.02 0.01 0.16 0.01 0.05 0.01 0.19 0.01 0.01 0.00 0.02 0.28
Table 2. The micro-XRF analysis results of the ten selected points of the sample (wt%).
SampleSiCaMgFeZnKSMnCuCrVSrCeTotal
YQ-1-XL1 51.32 26.95 20.85 0.26 0.24 0.07 0.06 0.04 0.02 0.00 0.00 0.01 0.19 100
YQ-1-XL2 51.31 26.96 20.77 0.28 0.24 0.07 0.05 0.04 0.03 0.05 0.00 0.01 0.20 100
YQ-1-XL3 51.34 27.09 20.65 0.31 0.22 0.08 0.02 0.06 0.03 0.02 0.00 0.01 0.18 100
YQ-1-XL451.32 27.14 20.70 0.31 0.22 0.07 0.06 0.05 0.03 0.02 0.07 0.01 0.00 100
YQ-1-XL550.82 27.23 20.71 1.03 0.01 0.07 0.04 0.05 0.02 0.03 0.00 0.00 0.00 100
YQ-1-XD151.18 27.11 20.66 0.86 0.00 0.05 0.03 0.05 0.03 0.03 0.00 0.00 0.00 100
YQ-1-XD250.99 27.24 20.78 0.82 0.00 0.06 0.03 0.06 0.03 0.00 0.00 0.00 0.00 100
YQ-1-XD351.81 27.09 20.17 0.37 0.20 0.04 0.05 0.06 0.03 0.04 0.00 0.00 0.15 100
YQ-1-XD452.20 26.47 20.42 0.32 0.21 0.05 0.03 0.07 0.04 0.00 0.00 0.00 0.20 100
YQ-1-XD552.28 26.60 20.17 0.31 0.21 0.04 0.07 0.08 0.04 0.00 0.00 0.00 0.20 100
Disclaimer/Publisher’s Note: The statements, opinions and data contained in all publications are solely those of the individual author(s) and contributor(s) and not of MDPI and/or the editor(s). MDPI and/or the editor(s) disclaim responsibility for any injury to people or property resulting from any ideas, methods, instructions or products referred to in the content.

