Article

Conversion of Activated Calcium in Industrial Water to Micron CaCO3 Powder Based on CO2 Absorption and Mineralization

Key Laboratory for Ecological Metallurgy of Multimetallic Mineral, Ministry of Education, School of Metallurgy, Northeastern University, Shenyang 110819, China
*
Author to whom correspondence should be addressed.
Minerals 2023, 13(7), 979; https://doi.org/10.3390/min13070979
Submission received: 12 June 2023 / Revised: 15 July 2023 / Accepted: 18 July 2023 / Published: 23 July 2023
(This article belongs to the Special Issue Comprehensive Utilization of Metallurgical Slag)

Abstract

:
Carbon dioxide capture, utilization, and storage (CCUS) is one of the essential approaches to achieving permanent CO2 emission reduction. A new idea of absorbing and mineralizing CO2 with industrial wastewater and converting activated calcium into micron CaCO3 powder is proposed in this paper, which synchronizes water softening and CO2 fixation. Therefore, this paper investigated the characteristics of circulating water quality in the iron and steel industry and the transformation behaviors of CO2 capture by activated calcium to CaCO3 powder in the mild aqueous environment under different process parameters. The phase composition, morphology, and particle size distribution (PSD) of CaCO3 powder were characterized by X-ray diffraction (XRD), scanning electron microscope (SEM), and (laser particle size analyzer) LPSA, respectively. In addition, a green integrated cycle system for industrial water capture of mineralized CO2 was preliminarily constructed, which provides a reference method for carbon reduction and economic utilization of carbon sources in an industrial system.

1. Introduction

With the continuous burning of fossil fuels, greenhouse gases are continuously generated and enter the atmosphere. Global CO2 emissions from energy combustion and industrial processes reached their highest level, 41.3 gigatonnes (Gt), and the atmospheric CO2 concentration reached 417.2 mg/L, in 2022 [1], leading to frequent disasters and glacial ablation. Therefore, how to reduce carbon dioxide emissions or utilize carbon dioxide has become the focus of global industry [2]. Carbon capture, utilization, and storage (CCUS) is one of the key technologies for dealing with global climate change by separating CO2 from industrial processes or the atmosphere and directly utilizing or injecting CO2 into the ground to achieve permanent CO2 reduction [3]. Among them, CO2 mineral sequestration technology combines CO2 with calcium–magnesium silicate minerals or industrial wastes (such as steelmaking slag, blast-furnace slag, calcium carbide slag and waste gypsum) to form stable carbonates (e.g., CaCO3); this technology has a bright future in industrialization due to its good safety performance and economic benefits [4]. The value-added product, CaCO3 powder, is widely used in rubber, paint, ink, medicine, toothpaste, cosmetics, and other fields due to its excellent wear resistance, fluidity, and dispersion.
China’s manufacturing industries, especially the metallurgy and chemical industry, produce a large amount of calcium-containing wastewater and solid waste every year, such as calcium carbide slag, phosphogypsum, steelmaking slag, circulating water, and so on [5,6,7,8]. For example, a large amount of circulating water containing calcium is produced in the pyrolytic treatment technology of steelmaking slag. High-temperature steelmaking slag reacts with water, and CaO dissolves into that water. In the process of steelmaking slag pyrolysis, seven tons of calcium-containing water are produced for every ton of steelmaking slag. In addition, about 20 tons of calcium carbide slurry (about 90% water content) is produced for every ton of polyvinyl chloride (PVC) products. Softening and resource utilization of industrial wastewater with high hardness and high alkalinity has become an important industrial issue.
CO2 mineralization from industrial solid waste or wastewater has the advantages of a high utilization rate of solid waste, high reactivity, and value-added products, which has become a research hotspot. Blast furnace slag, steelmaking slag, waste gypsum (phosphogypsum, desulfurized gypsum, titanium gypsum, etc.), and wastewater are suitable raw materials for CO2 mineralization [9,10]. Chang et al. [11] took steelmaking slag as raw material and reacted it with CO2 for 12 h at 160 °C and a CO2 pressure of 4.8 MPa. The calcium conversion rate reached 68% and storage efficiency was 283 kg CO2/t steelmaking slag. They also found that the conversion of calcium reached 93.5%, at normal pressure and 65 °C, in a high-gravity rotary packing bed [12]. To create mild and effective reaction conditions with higher product purity, the indirect mineralization technology that dissolves calcium and magnesium in industrial solid waste into solution and mineralizes CO2 to form CaCO3 or MgCO3 has also become a research hotspot [13]. Currently, the dissolved solvents include acetic acid, ammonium chloride, ammonium nitrate, ammonium acetate, and alcohol-amine [14]. Teir et al. [15,16] utilized acetic acid (>6 mol/L) to leach steelmaking slag at 70 °C and the calcium leaching rate was over 85%. Sun et al. [17] used NH4Cl as a solvent to leach steelmaking slag at 60 °C and initial CO2 pressure of 10 bar for 60 min, 211 kg CO2 could be fixed per ton of steelmaking slag. To further reduce energy consumption, Ji et al. [18,19] proposed the integrated technology of CO2 mineralization–absorbent regeneration, namely, alcohol–amine was used as an absorbent to capture CO2 and obtained an alcohol-amine solution loaded with CO2. CaO-rich alkaline solid waste was added to the solution to generate CaCO3 and alcohol-amine without CO2, which realized the regeneration of alcohol-amine solution and CO2 storage. In the study of the mineralization mechanism, in order to strengthen the mass transfer and control the particle size distribution and morphology of calcium carbonate powder, physical fields such as continuous bubbling stirring, jet flow, ultrasonic, and super gravity are introduced into the process. The continuous bubbling stirring method enhances the fluid turbulent flow, improves the heat and mass transfer performance, and can obtain uniform powder [20]. The ultrasonic atomization method can change the solution into liquid droplets, which has increased the reaction interfacial area, shortened the reaction time, and effectively controlled the particle size distribution [21]. Ulkeryildiz found that the jet flow can distinguish the crystal region of calcium carbonate from the stability region, and then control the size distribution of calcium carbonate particles in the Ca(OH)2-H2O-CO2 system [22,23]. To sum up, CO2 mineralization with industrial solid waste is making continuous progress towards low energy consumption, high economic benefits, and industrial scale.
Based on the CCUS principle, this paper proposes the process of mineralizing CO2 with calcium-based industrial wastewater to precipitate CaCO3 powder [24,25]. The water quality characteristics of steel circulating water and the influence of CO2, and liquid flow rate on mineralization behavior were investigated. The phase composition, microstructure, and particle size distribution (PSD) of CaCO3 powder were characterized by X-ray diffraction (XRD), scanning electron microscope (SEM), and laser particle size analyzer (LPSA), respectively. An integrated industrial carbon reduction system was initially constructed. The results provide a reference for industrial carbon reduction and water softening and recycling.

2. Materials and Methods

2.1. Quality Analysis of Industrial Water

Table 1 compares the water quality analysis of fresh water, pyrolysis water from the pyrolysis process of steelmaking slag, and circulating water in pipelines in the iron and steel industry, which were measured by ICP-OES (Inductively coupled plasma-optical emission spectrometer, Prodigy Plus). The pyrolysis water of steelmaking slag and circulating water are characterized by high alkalinity, high hardness, and high conductivity, up to pH ≈ 12, calcium hardness >300 mg/L, and 1500~3800 μs/cm, respectively, which dramatically increase the risk of pipeline scaling. The pH value of water is mainly affected by the concentration of OH, HCO3, and CO32−. In the pyrolysis process of steelmaking slag, CaO wrapped in steelmaking slag reacts with H2O to generate Ca(OH)2, leading to an increase in pH and Ca2+ concentration in water. In addition, MgO will also enter the water and increase its hardness and conductivity. When water circulates in the pipeline for a long time, it dissolves a large amount of CO2, which generates a significant increase in CO32− concentration. As CO32− content in the water increases, the scaling of CaCO3 with the small solubility product (Ksp = 2.8 × 10⁻⁹ at 25 °C) will form along the whole pipeline, accompanied by a small amount of MgCO3. Therefore, industrial circulating water requires a pH value of less than 9.0.

2.2. Experimental Procedure

From the perspective of industrialization, the purified flue gas of the aluminum electrolysis process, which contains 60%~70% CO2 and 30%~40% CO (volume fraction), could be chosen as the carbon source [26]. In this paper, pure CO2 gas (volume fraction > 99.99% supplied by the Lambogais Industrial Products trading Co., Ltd., Shengyang, China) is used as the carbon source, with a volume fraction of 50%. The other part of the gas is air, which also has a volume fraction of 50%.
The experimental setup is shown in Figure 1. During the experiment, the effects of CO2 flow rate and liquid flow rate on CaCO3 crystallization behavior, morphology, particle size distribution, CO2 utilization rate, and Ca recovery rate were investigated in a laboratory-scale Venturi mineralization reactor (effective volume 28 L). The flow rate of CO2 gas ranged from 2.0 m3/h to 5.0 m3/h, and the liquid (the compositions of which are the same as that of the circulating water in Table 1) flow rate ranged from 10 m3/h to 19 m3/h, the initial temperature was 25 °C, and the termination pH of the circulating water was controlled at 7.5~9.0. After the mineralization reaction 1~5, the CaCO3 precipitate and circulating water were separated and the CaCO3 precipitate was characterized by XRD, SEM, and LPAS.
Ca(OH)2 (l) = Ca2+ (aq) + 2OH (aq)
CO2 (g) = CO2 (aq)
CO2 (aq) + OH (aq) = HCO3 (aq)
HCO3 (aq)+ OH (aq) = H2O + CO32− (aq)
Ca2+ (aq) + CO32− (aq) = CaCO3 (s)

2.3. Calculation of Utilization Rate and Recovery Rate

Combined with the volume fraction of CO2 in the gas phase before and after the mineralization reaction, the CO2 utilization rate η can be calculated by Equation (6).
η CO 2 = V I V T V I × 100 %
where η represents the utilization rate of CO2 (%). VI and VT represent the initial and terminal volume fraction of CO2 in the gas phase (%), respectively. The volume fraction of CO2 in the gas phase is measured by a gas concentration detector (type: HT-BH).
Based on the change in Ca2+ concentration in an aqueous solution before and after the mineralization reaction, the recovery rate of Ca element under different CO2 gas flow rates can also be calculated by Equation (7).
χ CaCO 3 = C I Ca 2 + C T Ca 2 + C I Ca 2 + × 100 %
where χ represents the recovery rate of Ca, %. C I Ca 2 + and C T Ca 2 + represent the initial and terminal Ca2+ concentration in an aqueous solution (mol/L), respectively.

3. Results

3.1. Effect of CO2 Gas on Mineralization Behavior

3.1.1. Effect of CO2 Gas Flow on the Phase Composition of the Powder

Figure 2 compares the X-ray diffraction patterns of CaCO3 particles formed at different gas flow rates with an initial reaction temperature of 298.15 K and a liquid flow rate of 11.0 m3/h. In the CO2 gas flow rate range of 2.0 m3/h to 5.0 m3/h, CaCO3 particles with calcite crystal form are crystallized, whereas aragonite particles are also generated when the CO2 gas flow rate is low, as shown in Figure 2a. The reason could be explained based on the crystal-dissolution–recrystallization mechanism of CaCO3 particles. Initially, the CaCO3 crystal nuclei form and develop into disordered hydrated amorphous CaCO3, and then the crystals grow along the C-axis and form acicular clusters of aragonite. Under suitable reactive conditions, nucleation rate, and crystal growth rate, aragonite-type CaCO3 dissolves and develops again to form calcite-type CaCO3 with a more stable structure. When the CO2 gas flow rate is small, the low CO2 concentration leads to a low nucleation rate and crystal growth rate, which impedes the transformation from aragonite to calcite. Therefore, it can be seen from Figure 2a that both aragonite and calcite exist. With the increase in CO2 gas flow, a large number of CaCO3 microcrystals are formed at the gas–liquid interface, which continuously drives the dissolution and recrystallization of aragonite to form calcite calcium, as shown in Figure 2b–d.

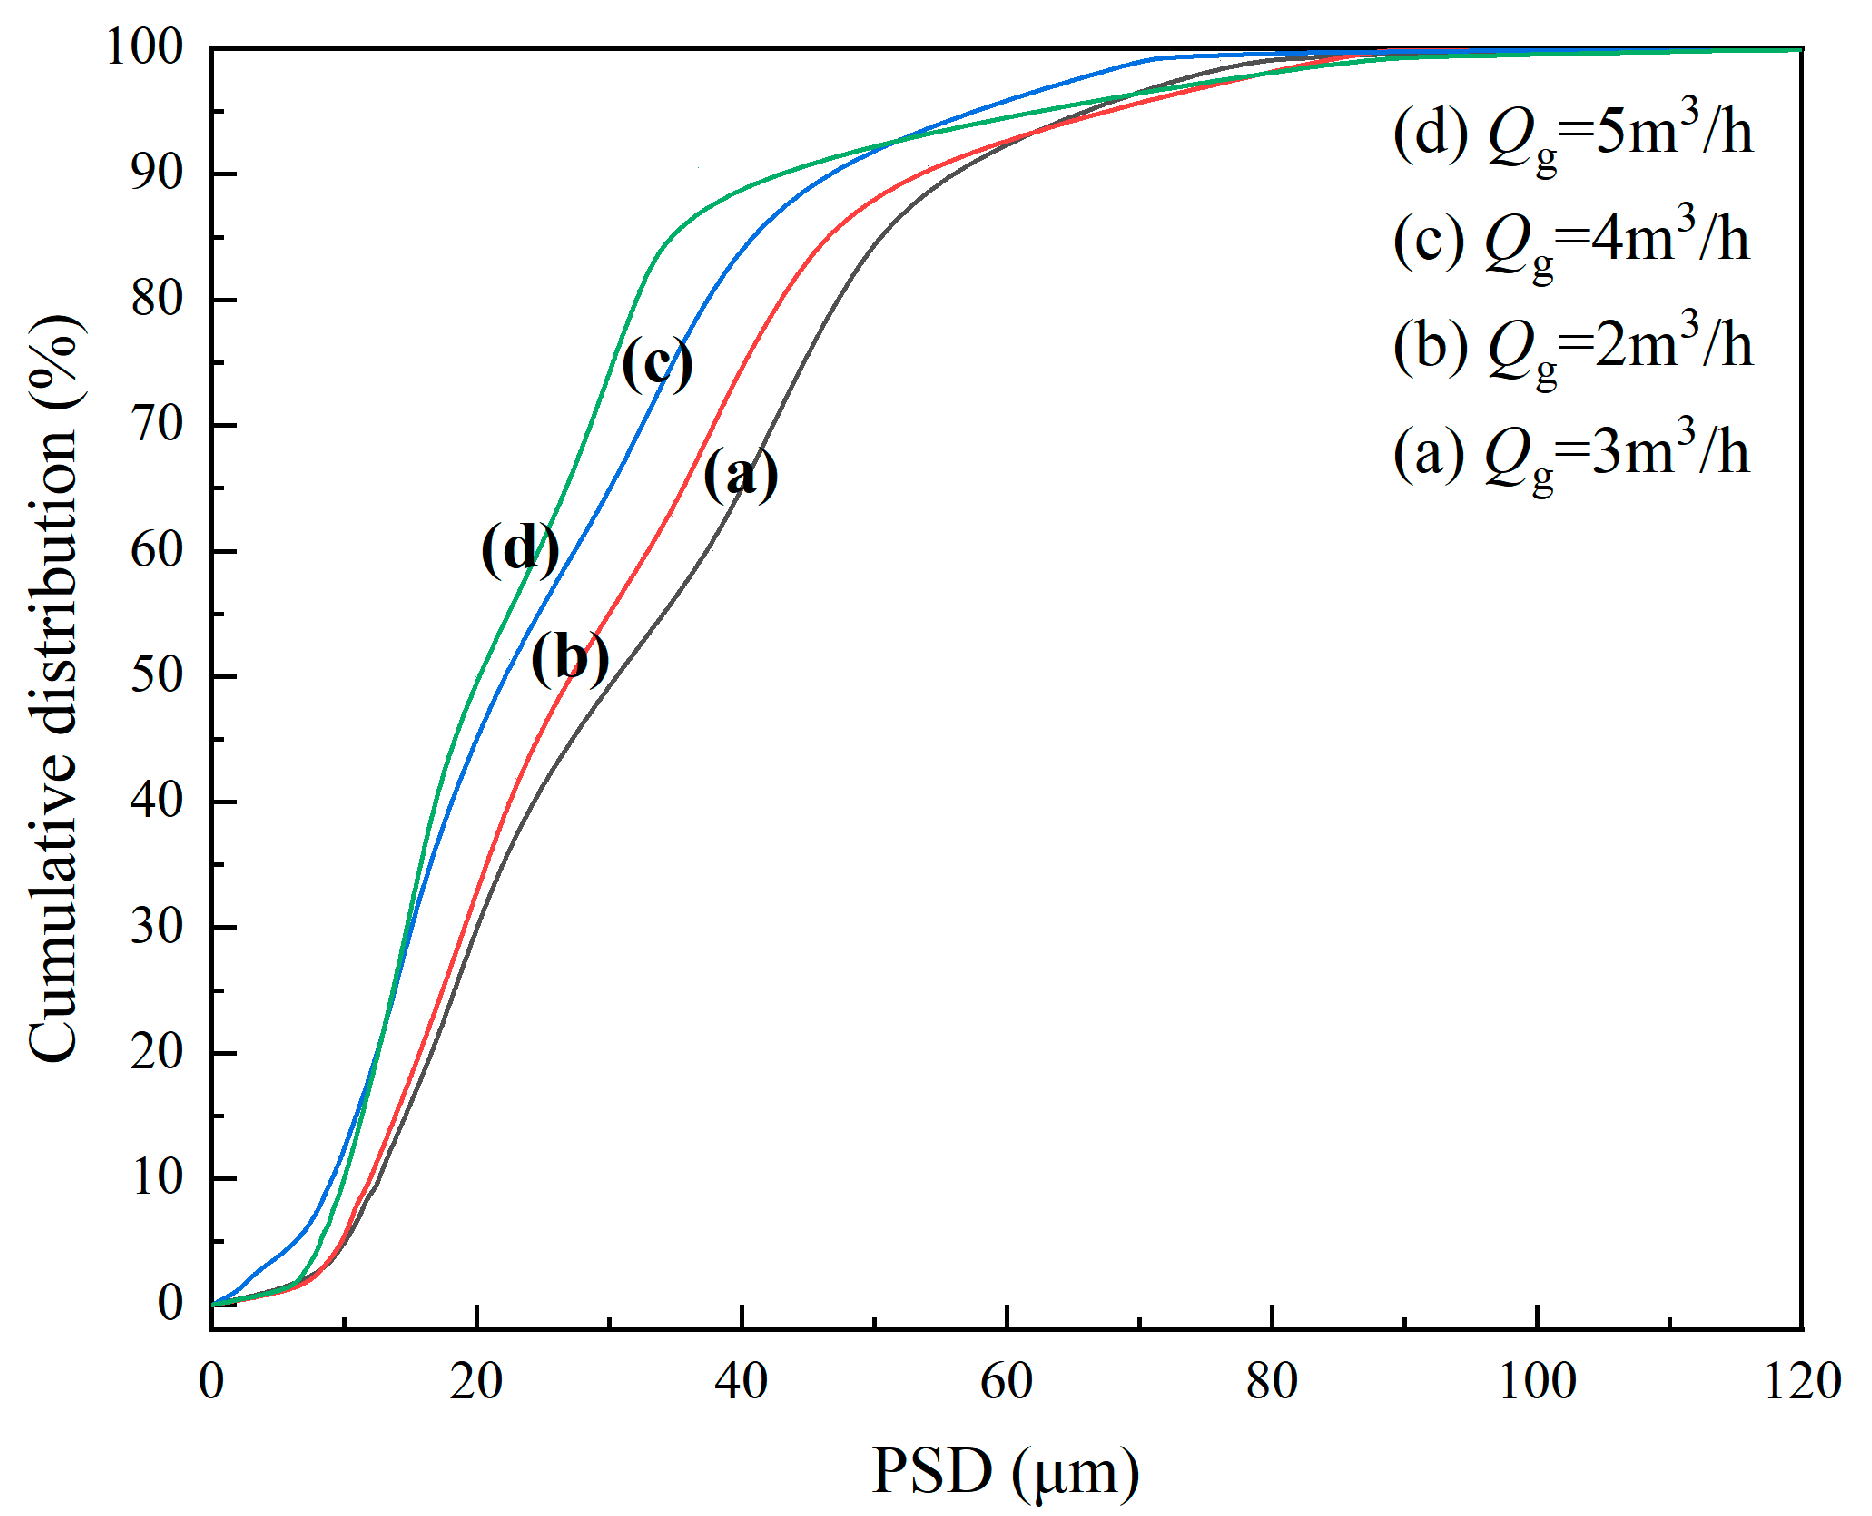
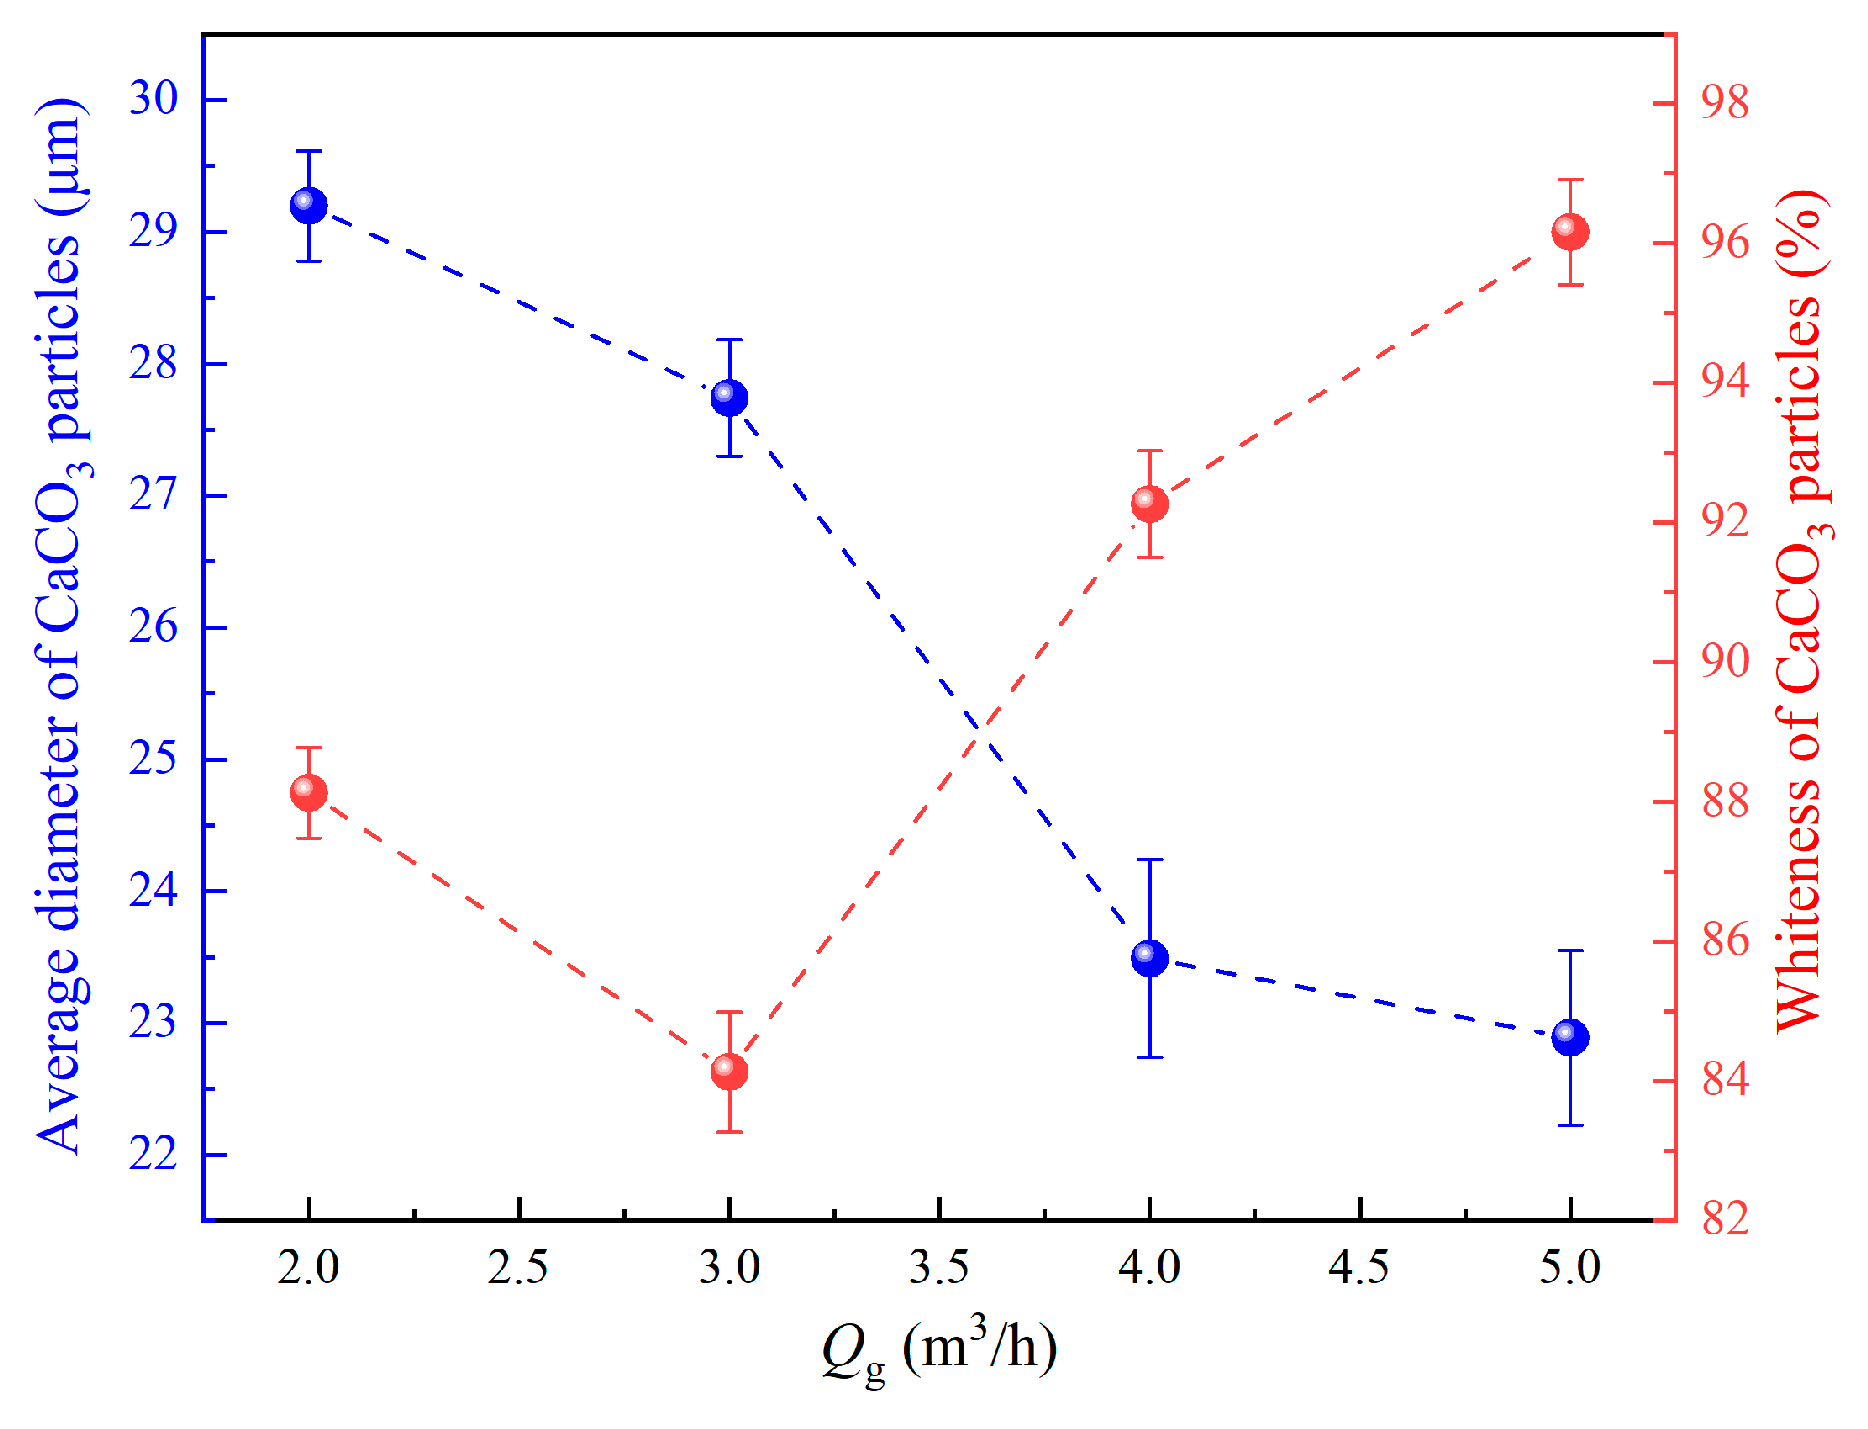
3.1.2. Effect of CO2 Gas Flow on Morphology and Particle Size of CaCO3 Powder

The morphology of CaCO3 particles formed in the mineralization reaction under different CO2 gas flow rates was characterized by scanning electron microscopy (SEM), shown in Figure 3. Although the gas flow rate ranges from 2 m3/h to 5 m3/h, the morphology of CaCO3 particles is almost similar, showing a regular and complete block structure. Figure 3 also illustrates that CaCO3 particle size fluctuates within a certain range, which is concentrated in the range of 20~30 μm. To further elaborate on the particle size distribution (PSD) of CaCO3, a laser particle size analyzer (LPSA) was used to characterize the particle proportions of different sizes, and the results are shown in Figure 4.
Figure 4a–d shows that an increase in the gas flow rate leads to a decrease in the CaCO3 particle size. The crystallization kinetics of CaCO3 particles should be fully considered in the control of particle size. When nucleation behavior is dominant, the mineralization reaction tends to generate micro–nano CaCO3 particles and, conversely, the particle size increases. At the initial stage of the mineralization reaction, Ca2+ and OH in the aqueous solution are excessive relative to CO2 (aq), and the diffusion of CO2 into the liquid film is a rate-limiting step. Thus, the CaCO3 crystal nucleus is constantly formed and occupies a dominant position. At the final stage, a large amount of CaCO3 particles has been generated, increasing the viscosity of the reactive fluid and impeding the diffusion of Ca2+. Therefore, the chemical reaction rate decreases dramatically, during what is the dominant period of crystal growth. The increase in CO2 gas flow rate leads to an increase in CO2 (aq) concentration in the liquid film, which accelerates the nucleation rate and crystal number of CaCO3 but inhibits crystal growth and forms CaCO3 particles with small particle size. Moreover, the increase in gas velocity strengthens the multi-phase mixing performance and the dispersion of bubble and particle distribution in the jet reactor, and also homogenizes the Ca2+ concentration distribution, so that the CaCO3 crystal nuclei in different regions have similar crystal growth rates, thus forming a relatively uniform particle size distribution.

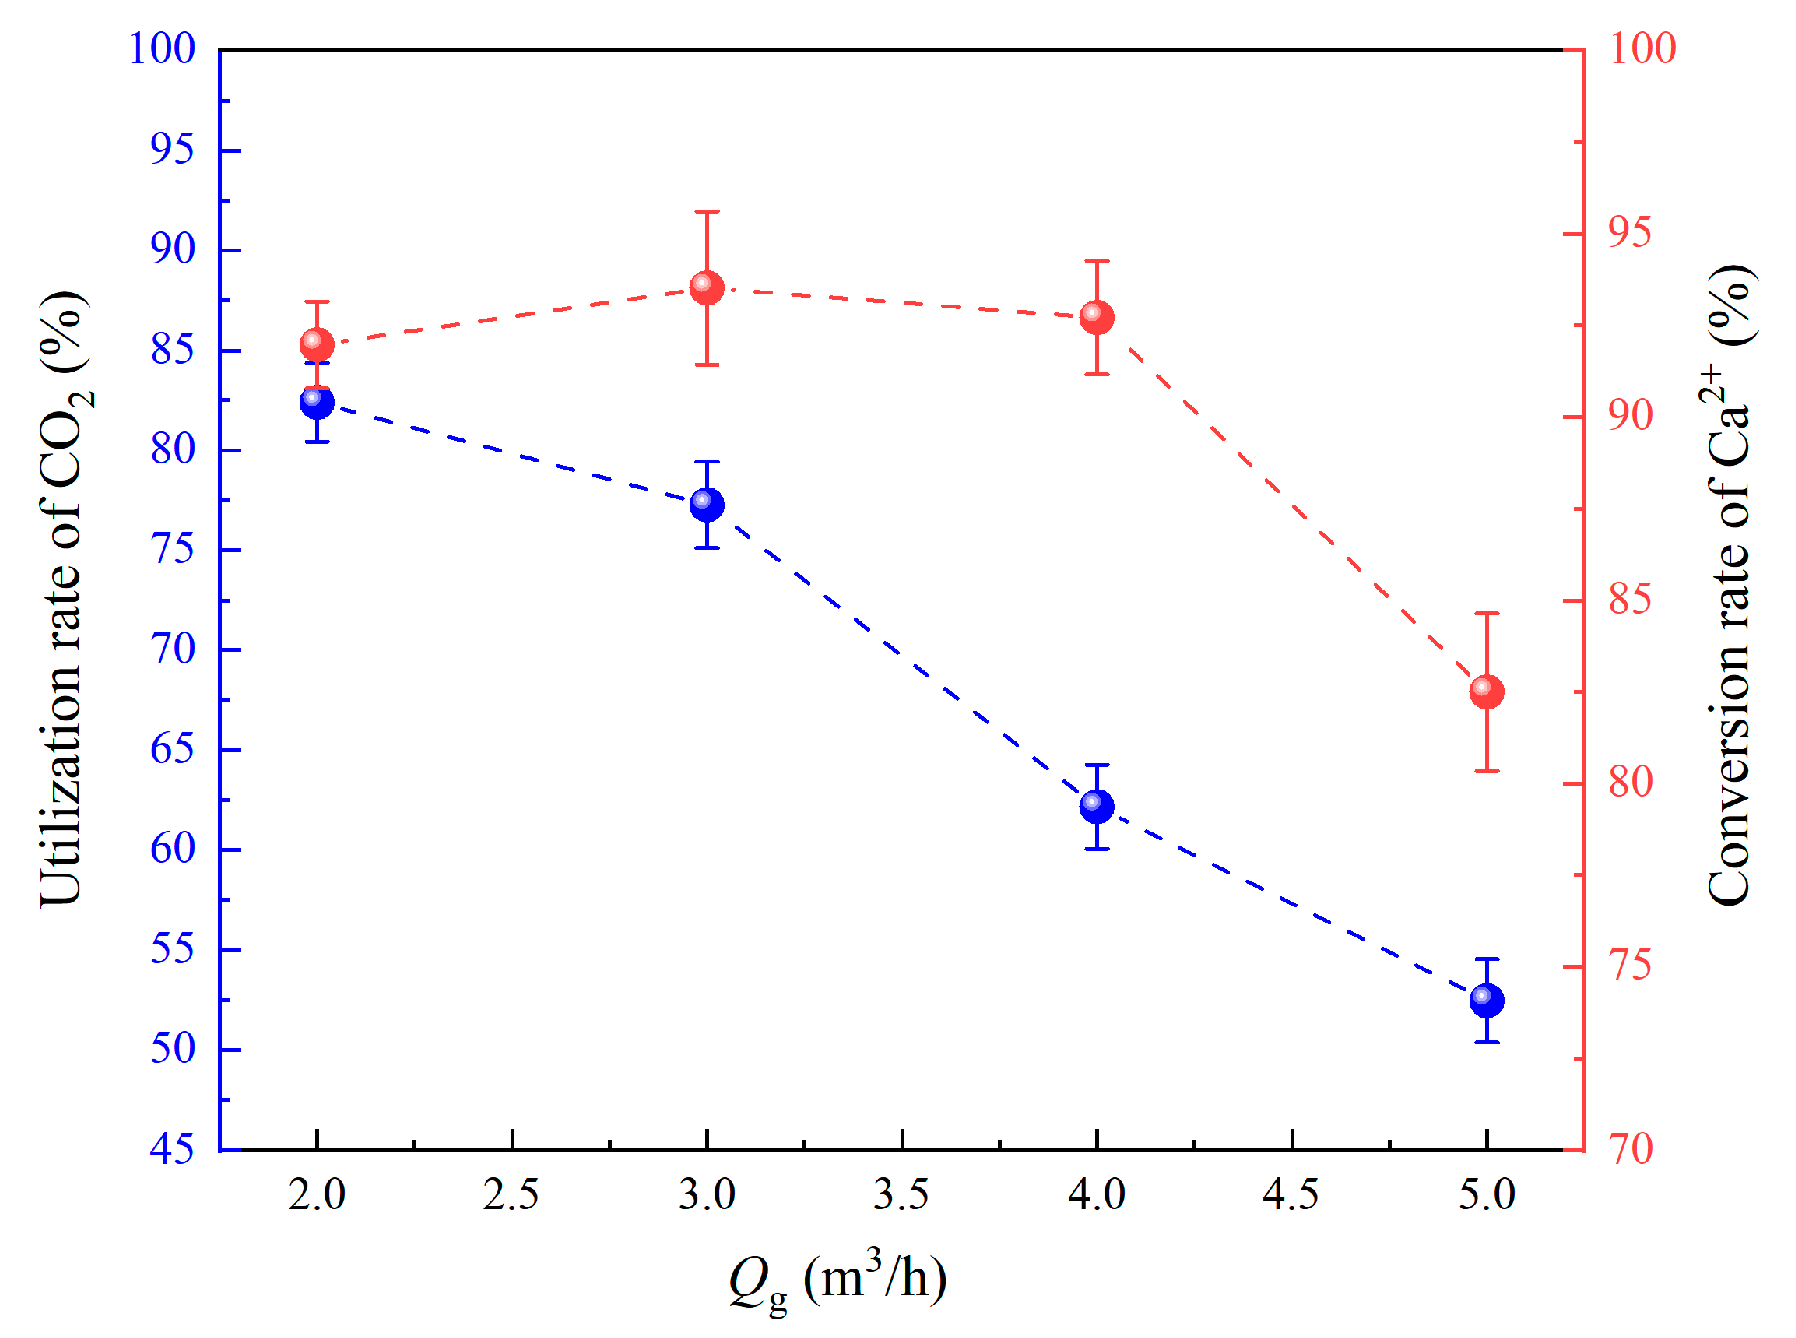
3.1.3. Effect of CO2 Gas Flow Rate on Mineralization Process Control

With the CO2 gas flow rate increasing from 2 m3/h to 5 m3/h, the average size of calcium carbonate particles formed in the mineralization reaction system gradually decreases from 29 μm to 23 μm, as shown in Figure 5. The increase in CO2 gas flow rate in the appropriate operating domain will lead to an increase in the gas holdup and a decrease in bubble diameter. Excessive CO2 gas leads to the re-aggregation of broken bubbles and the formation of large-size bubbles, which reduces the gas–liquid interaction area and indirectly affects the mass transfer behavior and chemical reaction rate of the mineralization. In addition, it can be seen from the whiteness analysis of calcium carbonate particles in Figure 5 that the whiteness of calcium carbonate particles decreases first and then increases with the gas flow. When the gas flow rate exceeds 4 m3/h, the whiteness of calcium carbonate particles can be over 90%. Based on the analysis of calcium carbonate crystal structure, morphology, average particle size, particle size distribution, and whiteness of CaCO3 powder formed in the process of CO2 mineralization, the optimal CO2 gas flow rate is Qg = 4 m3/h.
Figure 6 illustrates the changes in the utilization rate of CO2 and recovery rate of Ca with different gas flow rates. There is a significant decrease in the CO2 utilization rate (about 30%) as the CO2 flow rate increases from 2.0 m3/h to 5.0 m3/h. On one hand, the CO2 utilization rate could be maintained at a high level, within the stoichiometric ratio, to that of Ca2+; although, an obvious decrease in the CO2 utilization rate will occur when the stoichiometric ratio is exceeded. On the other hand, a continuous increase in gas flow rate will lead to an increase in gas holdup in the reactor. Serious coalescence between CO2 bubbles will occur, forming heterogeneous gas–liquid multi-scale structures, and resulting in a decrease in mass transfer performance between CO2 gas bubble and calcic aqueous solution. Moreover, large-scale CO2 bubbles have a faster rising speed, thus shortening the residence time of CO2 bubbles, so their utilization rate becomes worse. From the perspective of the chemical reaction process, the increase in CO2 gas flow rate leads to the reaction of excessive CO2 with CaCO3 particles to form Ca(HCO3)2, which is back dissolved into the solution, resulting in a reduction in Ca2+-recovery efficiency.

3.2. Effect of Calcium-Containing Solution on Mineralization Behavior

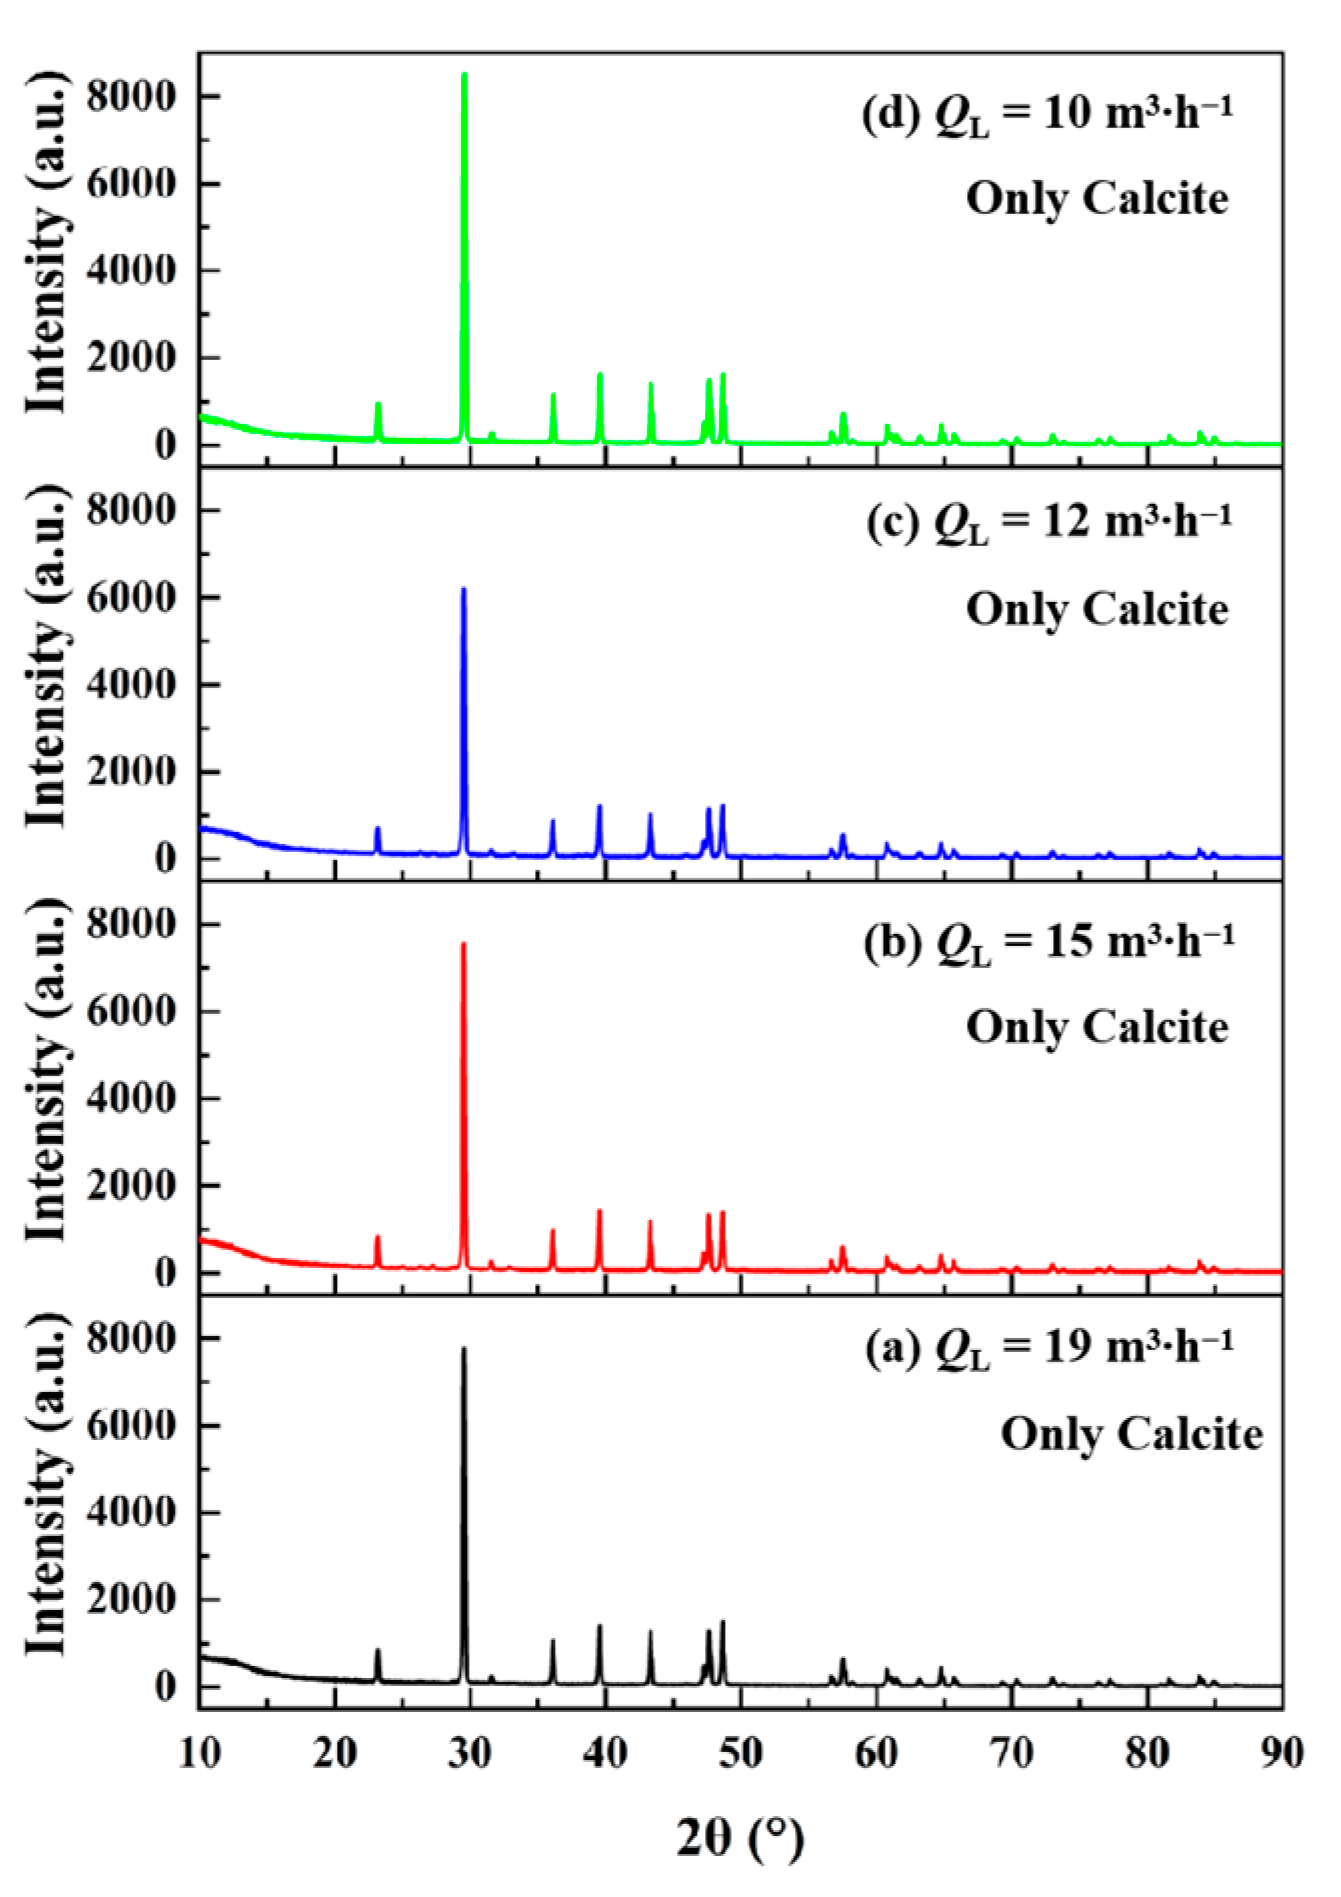
3.2.1. Effect of Liquid Flow on the Phase Composition of the Powder

Figure 7 compares the X-ray diffraction patterns of CaCO3 particles formed at different liquid flow rates with an initial reaction temperature of 298.15 K and a gas flow rate of 4.0 m3/h. The calcite-type CaCO3 powder precipitated out from the mineralization reaction process with a liquid flow rate increasing from 10 m3/h to 19 m3/h. Since the mineralization process of CO2 gas in calcium-containing alkaline wastewater is controlled by gas mass transfer, the increase in liquid flow rate slightly changes the hydrodynamic conditions of the reaction system, but the gas holdup and the average diameter of bubbles are mainly determined by the gas flow rate. Therefore, the change in liquid flow rate does not have a significant effect on the crystal form.

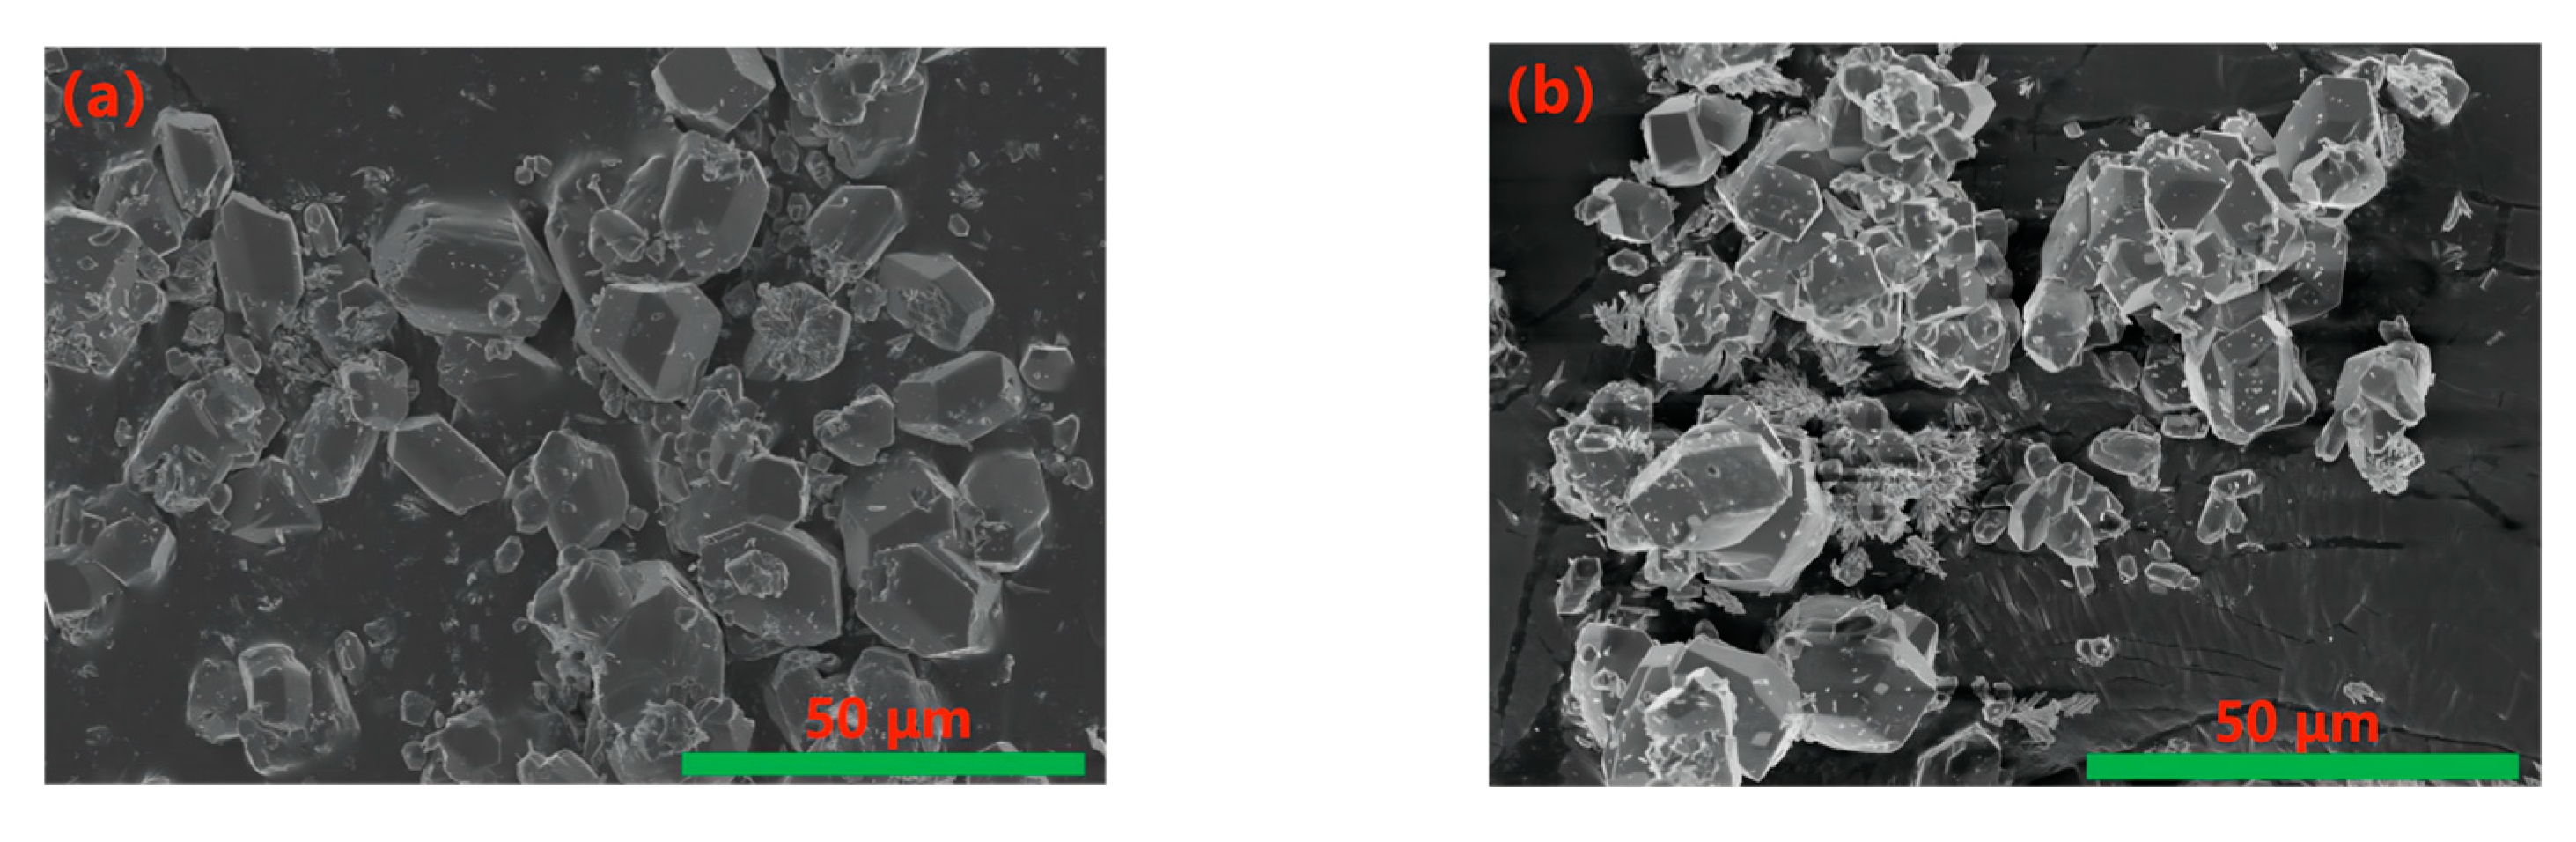
3.2.2. Effect of Liquid Flow on Morphology and Particle Size of CaCO3 Powder

Figure 8 shows the morphologies of CaCO3 particles formed in the mineralization reaction system at different liquid flow rates. The fully developed cubic and polyhedral CaCO3 particles are formed at different liquid flow rates. There are also some large-size and small-size rod-shaped calcium carbonate particles formed by agglomeration and crushing effects, respectively The particle size distribution of calcium carbonate particles is mainly concentrated in the range 20~30 μm.
Figure 9a–d illustrates the particle size distribution of CaCO3 particles measured by a laser particle size analyzer at different liquid flow rates. The collision and fragmentation of large-size particles caused by the change in liquid flow, the increase in Ca2+ supersaturation at the interface, and the improvement in Ca2+ transport efficiency at the late stage of the mineralization reaction compete with each other, which jointly controls the particle size distribution. When the increase in liquid flow rate leads to an improvement of Ca2+ transport efficiency, larger calcium carbonate particles will be formed. In contrast, when the collision and fragmentation of large-size particles in the mineralization reaction system and the increase in nucleation rate caused by the increase in Ca2+ saturation at the interface are dominant, calcium carbonate particles with small particle size will form.
In addition, the increase in solid holdup in the later stage of the reaction leads to an increase in solution viscosity and a difficulty of Ca2+ migration. The increase in liquid flow rate causes the Ca2+ in fresh solution to be continuously transmitted to the interface, which is conducive to the growth and development of particles. Therefore, the increase in liquid flow improves the situations of low Ca2+ concentration and difficult transport in the late stage of the mineralization reaction.

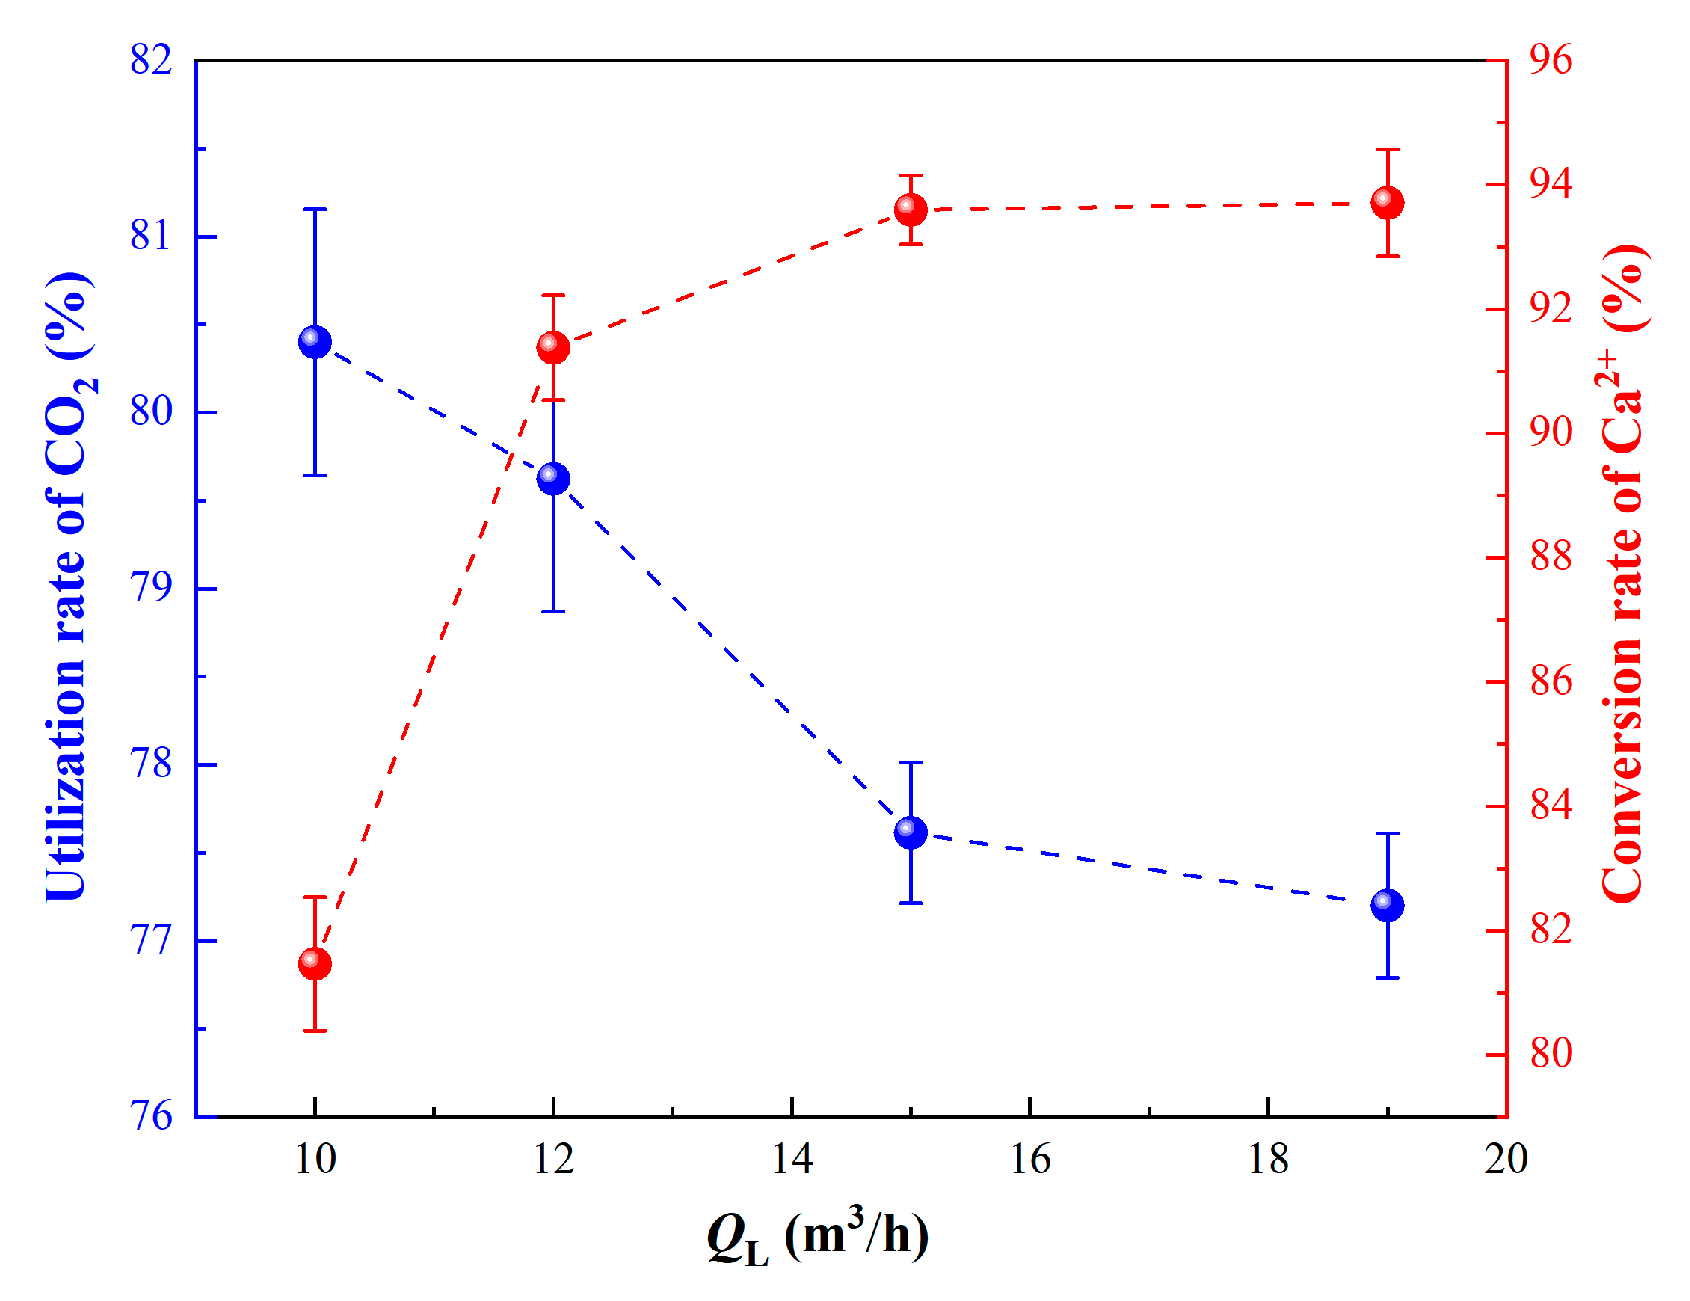
3.2.3. Effect of CO2 Gas Flow Rate on Mineralization Process Control

Figure 10 summarizes the analysis results of the average size and whiteness of calcium carbonate particles in the mineralized reaction system at different liquid flow rates. The average particle size of calcium carbonate particles decreased from 27 μm to 23 μm in the process of the liquid flow rate increasing from 10 m3/h to 12 m3/h. Subsequently, it gradually increased to 29 μm. A small increase in liquid flow rate affected the early stage of the mineralization reaction, increasing the supersaturation of Ca2+ at the gas–liquid interface and thus increasing the nucleation rate, resulting in a decrease in the size of calcium carbonate. The substantial increase in liquid flow rate mainly affected the later stage of the mineralization reaction, increased the ion supersaturation and Ca2+ migration rate, and then increased the crystal growth rate, increasing calcium carbonate particle size. The whiteness of calcium carbonate particles increases with the increase in liquid flow rate. When the liquid flow rate, QL, = 15 m3/h, the whiteness of calcium carbonate particles tends to decrease slightly.
Equations (6) and (7) were used to calculate the CO2 utilization rate and CaCO3 recovery rate under different liquid flow rates, as shown in Figure 11. The increase in liquid flow rate led to a slight decrease in the CO2 utilization rate, but the effect was not significant, and the overall CO2 utilization rate was higher than 75%. The recovery rate of CaCO3 shows an upward trend with the increase in liquid flow rate, which may restrain the phenomenon caused by excessive CO2 gas in the later stage, thus improving the recovery rate of CaCO3. Of course, this process also depends on the flow of CO2 gas and the flow of calcium-containing alkaline wastewater.

3.3. Establishment of Integrated Carbon-Reduction System for Industrial Systems

Based on the transformation behavior of activated calcium to CaCO3 by the mineralization of CO2, this paper combined industrial ecology and carbon footprint theory to attempt to establish an integrated system of collaborative carbon reduction across the chemical industry, metallurgy, energy, and other fields, as shown in Figure 12. The integrated system is mainly composed of a CO2 emission unit (CEU), a calcic waste unit (CWU), and a CO2 mineralization unit (CMU). As the carbon source provider, CEU mainly comes from metal smelting, fossil fuel combustion, and other industrial processes. The core function of the CWU is to provide rich active calcium sources from calcic waste (such as calcium carbide slag, phosphogypsum, steelmaking slag, fly ash, calcium-based wastewater, slurry, etc.) to create favorable raw material conditions for CO2 mineralization. The key task of the CMU is to generate CaCO3 powders of different sizes and morphs (e.g., micro/nanopowders, calcite, nepheline, and aragonite types) by mineralizing CO2 from active calcium sources, to realize carbon reduction and high-value utilization of carbon and calcium elements. This CMU unit contains three key steps: (1) dissolution and purification of calcium source, namely the fixed calcium in the waste is dissolved into the liquid phase, and the alkali metals or alkaline earth metal elements will preferentially generate hydroxide precipitation by controlling the pH value of the solution; thus, an active calcium aqueous solution will be obtained after the solid–liquid separation; (2) enhanced gas–liquid mixing and inter-phase mass transfer between active calcium solution and CO2 gas, to promote efficient mineralization reaction and improve resource utilization efficiency; and (3) in the process of mineralization reaction, the morphology, particle size, purity, and other physical and chemical properties of CaCO3 powder are decided by controlling nucleation, crystal growth, fragmentation and coalescence, morphology modification, etc. After the solid–liquid separation of CO2 mineralized products, softening water, carbon-reducing flue gas, and CaCO3 powder were produced. Softening water can be returned to metal smelting and other processes to realize the recycling of water resources. CaCO3 powder can be utilized in the paper-making, ink, feed, and cosmetics industries according to its physical and chemical properties. Decarbonized flue gas can be directly discharged into the atmosphere, alleviating the greenhouse effect on the atmosphere.

4. Conclusions

This paper proposed the process of mineralizing CO2 from calcium-based industrial wastewater to prepare CaCO3 powder, investigated the influence of CO2 flow rate on mineralization behavior, phase component, micro-structure, and PSD of CaCO3 powder, and preliminarily constructed an industrial carbon reduction integrated system. The main conclusions are described below.
The increase in CO2 gas flow rate strengthens the mass transfer behavior at the gas–liquid interface, leading to an increase in supersaturation at the interface, which leads to the dominant position of crystal nucleation and a decrease in particle size. When the flow rate of CO2 is 5 m3/h, the average size of CaCO3 particles is 23 μm.
A high CO2 gas flow rate will decrease the gas utilization rate and cause back-dissolving behavior of CaCO3. The CO2 gas utilization rate is up to 82.1% and the recovery rate of Ca is up to 93.4%.
When the liquid flow rate in the mineralization reaction system is small, an increase in Ca2+ saturation at the interface leads to an increase in nucleation rate, and the formation of calcium carbonate powder with a small micron particle size is dominant. With an increase in liquid flow rate, the Ca2+ transport efficiency in the late stage of the mineralization reaction is improved, and large calcium carbonate particles form.
A green integrated cycle system for industrial water capture of mineralized CO2 was also preliminarily constructed, which provides a reference method for carbon reduction and economic utilization of carbon sources in an industrial system.
In the future study of mineralized CO2 with calcium-containing wastewater, how to accurately control the particle size distribution and surface topography of ultrafine calcium carbonate powder may become a research hotspot. Meanwhile, the methods for treatment of calcium-containing wastewater from different industrial fields, such as the disposal technology of calcium-containing wastewater from boilers, should be paid attention to and distinguished. In addition, the application of the new technology on an industrial scale also involves knowing how to scale up the polyphase reactor scientifically. Breakthroughs in these problems will help us realize the industrial application of this technology.

Author Contributions

Conceptualization, T.-A.Z. and Y.L.; methodology, investigation, writing—original draft preparation, writing—review and editing, X.-L.L. All authors have read and agreed to the published version of the manuscript.

Funding

This research was funded by Young Elite Scientists Sponsorship Program by CAST, grant number 2022QNRC001.

Data Availability Statement

The data presented in this study are available on request from the corresponding author.

Conflicts of Interest

The authors declare no conflict of interest.

Variables

CConcentration of Ca2+ in aqueous solution, mol/L
QgFlow rate of CO2 gas, m3/h
QLFlow rate of liquid solution, m3/h
VVolume fraction of CO2 in gas phase, %
ηUtilization rate of CO2, %
χRecovery rate of Ca, %

References

  1. IEA. Global Energy Review: CO2 Emissions in 2022. Available online: https://www.iea.org/articles/global-energy-review-CO2-emissions-in-2022 (accessed on 24 April 2023).
  2. Xie, H.P. Developing low-carbon technology and promoting green economy. Energy China 2010, 32, 5–10. [Google Scholar]
  3. MacDowell, N.; Florin, N.; Buchard, A.; Hallett, J.; Galindo, A.; Jackson, G.; Adjiman, C.S.; Williams, C.K.; Shah, N.; Fennell, P. An overview of CO2 capture technologies. Energy Environ. Sci. 2010, 3, 1645–1669. [Google Scholar] [CrossRef] [Green Version]
  4. Lim, M.; Han, G.C.; Ahn, J.W.; You, K.S. Environmental remediation and conversion of carbon dioxide (CO2) into useful green products by accelerated carbonation technology. Int. J. Environ. Res. Public Health 2010, 7, 203–228. [Google Scholar]
  5. Wang, M.; Lawal, A.; Stephenson, P.; Sidders, J.; Ramshaw, C. Post-combustion CO2 capture with chemical absorption: A state-of-the-art review. Chem. Eng. Res. Des. 2011, 89, 1609–1624. [Google Scholar] [CrossRef] [Green Version]
  6. Deng, Z.H. Study on Phase Evolution and Self-Pulverization of Converter Steel Slag. Ph.D. Thesis, University of Science and Technology Beijing, Beijing, China, 2014. [Google Scholar]
  7. Zhao, L.; Wu, D.; Hu, W.; Li, J.; Zhang, Z.; Yang, F.; Wang, Z.; Ni, W. Coupling mineralization and product characteristics of steel slag and carbon dioxide. Minerals 2023, 13, 795. [Google Scholar] [CrossRef]
  8. Moon, H.; Kim, K.; Kim, J.-H.; Lee, M.; Chung, C.-W. Reaction of converter slag with supercritical carbon dioxide and its potential applicability as aggregate for concrete. Appl. Sci. 2021, 11, 1918. [Google Scholar] [CrossRef]
  9. Lackner, K.S.; Wendt, C.H.; Butt, D.P.; Joyce, E.L., Jr.; Sharp, D.H. Carbon dioxide disposal in carbonate minerals. Energy 1995, 20, 1153–1170. [Google Scholar] [CrossRef]
  10. Xie, H.P.; Wang, Y.F.; Chu, W.; Ju, Y. Mineralization of flue gas CO2 with coproduction of valuable magnesium carbonate by means of magnesium chloride. Chin. Sci. Bull. 2014, 59, 2882–2889. [Google Scholar] [CrossRef]
  11. Chang, E.E.; Pan, S.Y.; Chen, Y.H.; Chu, H.W.; Wang, C.F.; Chiang, P.C. CO2 sequestration by carbonation of steelmaking slags in an autoclave reactor. J. Hazard. Mater. 2011, 195, 107–114. [Google Scholar] [CrossRef]
  12. Chang, E.E.; Pan, S.Y.; Chen, Y.H.; Tan, C.S.; Chiang, P.C. Accelerated carbonation of steelmaking slags in a high-gravity rotating packed bed. J. Hazard. Mater. 2012, 227/228, 97–106. [Google Scholar] [CrossRef]
  13. Liu, W.Z.; Teng, L.M.; Rohani, S.; Qin, Z.F.; Zhao, B.; Xu, C.C.; Ren, S.; Liu, Q.C.; Liang, B. CO2 mineral carbonation using industrial solid wastes: A review of recent developments. Chem. Eng. J. 2021, 416, 129093. [Google Scholar] [CrossRef]
  14. Teir, S.; Revitzer, H.; Eloneva, S.; Fogelholm, C.-J.; Zevenhoven, R. Dissolution of natural serpentinite in mineral and organic acids. Int. J. Miner. Process. 2007, 83, 36–46. [Google Scholar] [CrossRef]
  15. Teir, S.; Eloneva, S.; Fogelholm, C.-J.; Zevenhoven, R. Dissolution of steelmaking slags in acetic acid for precipitated calcium carbonate production. Energy 2007, 32, 528–539. [Google Scholar] [CrossRef]
  16. Eloneva, S.; Teir, S.; Salminen, J.; Fogelholm, C.-J.; Zevenhoven, R. Fixation of CO2 by carbonating calcium derived from blast furnace slag. Energy 2008, 33, 1461–1467. [Google Scholar] [CrossRef]
  17. Sun, Y.; Yao, M.S.; Zhang, J.P.; Yang, G. Indirect CO2 mineral sequestration by steelmaking slag with NH4Cl as leaching solution. Chem. Eng. J. 2011, 173, 437–445. [Google Scholar] [CrossRef]
  18. Ji, L.; Yu, H.; Yu, B.; Jiang, K.; Grigore, M.; Wang, X.; Zhao, S.; Li, K. Integrated absorption-mineralisation for energy-efficient CO2 sequestration: Reaction mechanism and feasibility of using fly ash as a feedstock. Chem. Eng. J. 2018, 352, 151–162. [Google Scholar] [CrossRef]
  19. Ji, L.; Yu, H.; Li, K.; Yu, B.; Grigore, M.; Yang, Q.; Wang, X.; Chen, Z.; Zeng, M.; Zhao, S. Integrated absorption-mineralisation for low-energy CO2 capture and sequestration. Appl. Energy 2018, 225, 356–366. [Google Scholar] [CrossRef]
  20. Jimoh, O.A.; Mahmed, N.; Okoye, P.U.; Ariffin, K.S. Utilization of milk of lime (MOL) originated from carbide lime waste and operating parameters optimization study for potential precipitated calcium carbonate (PCC) production. Environ. Earth Sci. 2016, 75, 1251. [Google Scholar] [CrossRef]
  21. Ma, L.; Yang, T.; Wu, Y.; Yue, X.; Yang, J.; Zhang, S.; Li, Q.; Zhang, J. CO2 capture and preparation of spindle-like CaCO3 crystals for papermaking using calcium carbide residue waste via an atomizing approach. Korean J. Chem. Eng. 2019, 36, 1432–1440. [Google Scholar] [CrossRef]
  22. Ulkeryildiz, E.; Kilic, S.; Ozdemir, E. Rice-like hollow nano-CaCO3 synthesis. J. Cryst. Growth 2016, 450, 174–180. [Google Scholar] [CrossRef] [Green Version]
  23. Ulkeryildiz, E.; Kilic, S.; Ozdemir, E. Nano-CaCO3 synthesis by jet flow. Colloid Surf. A 2017, 512, 34–40. [Google Scholar] [CrossRef]
  24. Zhang, T.A.; Dou, Z.H.; Liu, Y.; Lv, G.Z.; Zhao, Q.Y.; Zhang, Z.M.; Zhao, H.L.; Jiang, X.L. A Method for Capturing and Mineralization CO2 from the Flue Gas of Aluminum Electrolysis to Prepare CaCO3 and Recover CO. Chinese Patent No. CN201310380588.3, 25 February 2015. [Google Scholar]
  25. Zhang, T.A.; Liu, Y.; Dou, Z.H.; Lv, G.Z.; Zhao, Q.Y.; Zhang, Z.M.; Zhao, H.L.; Jiang, X.L. A Device for Capturing and Mineralization CO2 from the Flue Gas of Aluminum Electrolysis to Prepare CaCO3 and Recover CO. Chinese Patent No. CN201310380610.4, 25 February 2015. [Google Scholar]
  26. Li, X.K.; Liu, Y.; Li, X.L.; Zhang, T.A. Separation and conversion of fluoride salts in aluminum electrolysis flue gas by one-step ammonia purification. J. Cent. South Univ. 2023, 30, 108–112. [Google Scholar] [CrossRef]
Figure 1. The experimental setup of the CO2 mineralization reaction.
Minerals 13 00979 g001
Figure 2. XRD patterns of CaCO3 particles under different gas flow rates; (a) Qg = 2 m3/h, (b) Qg = 3 m3/h, (c) Qg = 4 m3/h, (d) Qg = 5 m3/h.
Minerals 13 00979 g002
Figure 3. SEM images of CaCO3 particles at different gas flow rates; (a) Qg = 2 m3/h, (b) Qg = 3 m3/h, (c) Qg = 4 m3/h, (d) Qg = 5 m3/h.
Minerals 13 00979 g003aMinerals 13 00979 g003b
Figure 4. Particle size distribution of CaCO3 particles at different gas flow rates; (a) Qg = 2 m3/h, (b) Qg = 3 m3/h, (c) Qg = 4 m3/h, (d) Qg = 5 m3/h.
Minerals 13 00979 g004
Figure 5. Average diameter and whiteness of CaCO3 particles at different gas flow rates.
Minerals 13 00979 g005
Figure 6. The utilization rate of CO2 and recovery rate of Ca at different gas flow rates.
Minerals 13 00979 g006
Figure 7. XRD patterns of CaCO3 particles at different liquid flow rates; (a) QL = 19 m3/h, (b) QL = 15 m3/h, (c) QL = 12 m3/h, (d) QL = 10 m3/h.
Minerals 13 00979 g007
Figure 8. SEM images of CaCO3 particles at different liquid flow rates; (a) QL = 19 m3/h, (b) QL = 15 m3/h, (c) QL = 12 m3/h, (d) QL = 10 m3/h.
Minerals 13 00979 g008aMinerals 13 00979 g008b
Figure 9. Particle size distribution of CaCO3 particles at different liquid flow rates; (a) QL = 19 m3/h, (b) QL = 15 m3/h, (c) QL = 12 m3/h, (d) QL = 10 m3/h.
Minerals 13 00979 g009
Figure 10. Average diameter and whiteness of CaCO3 particles at different liquid flow rates.
Minerals 13 00979 g010
Figure 11. The utilization rate of CO2 and conversion rate of Ca2+ at different liquid flow rates.
Minerals 13 00979 g011
Figure 12. Schematic diagram of the integrated carbon reduction system.
Minerals 13 00979 g012
Table 1. Water quality analysis of the pyrolysis process of steelmaking slag.
CategoryFresh WaterPyrolysis WaterCirculating Water
Temperature/°C~2580~10030~35
pH7.0512.0011.71
Electric conductivity/μs/cm34938001532
Total salinity/mg/L216862328
Total hardness/mg/L137.6760.3318.8
* Calcium hardness/mg/L93.1740.5318.8
* OH alkalinity/mg/L0584242.6
* HCO3 alkalinity/mg/L89.800
* CO32− alkalinity/mg/L0215.644.9
* Total alkalinity/mg/L89.8799.6287.5
Soluble SiO2/mg/L9.713421
Suspended solids/mg/L515063
* data are calculated and measured with CaCO3.
Disclaimer/Publisher’s Note: The statements, opinions and data contained in all publications are solely those of the individual author(s) and contributor(s) and not of MDPI and/or the editor(s). MDPI and/or the editor(s) disclaim responsibility for any injury to people or property resulting from any ideas, methods, instructions or products referred to in the content.

