Article

Machine Learning and EPCA Methods for Extracting Lithology–Alteration Multi-Source Geological Elements: A Case Study in the Mining Evaluation of Porphyry Copper Ores in the Gondwana Metallogenic Belt

1
College of Geomatics, Xi’an University of Science and Technology, Xi’an 710054, China
2
School of Earth Sciences, ZheJiang University, Hangzhou 310027, China
3
Zhejiang Provincial Key Laboratory of Geographic Information Science, Hangzhou 310028, China
*
Author to whom correspondence should be addressed.
Minerals 2023, 13(7), 858; https://doi.org/10.3390/min13070858
Submission received: 22 May 2023 / Revised: 15 June 2023 / Accepted: 23 June 2023 / Published: 25 June 2023
(This article belongs to the Special Issue Mineral Exploration Based on Remote Sensing)

Abstract

:
The location and development of porphyry copper deposits is a key issue for the mining industry. In this study, the Gondwana metallogenic belt was chosen as the study area to compare multiple methods for extracting multi-source geological elements to maximize the accuracy of the datasets used for mining evaluation and to use them to assess porphyry copper mineability. By comparison, a support vector machine (SVM) with an overall classification accuracy of 97.6573% and a Kappa coefficient of 0.9806 was used to extract the lithological distribution of the study area. Spectral feature-enhanced principal component analysis (EPCA) was combined with ASTER images to extract alteration information, with significant improvements in spatial aggregation and overall area compared to other alteration extraction methods, while a hierarchical alteration interpolation method was proposed to overcome the limitations of relying solely on remote sensing images to obtain surface alteration information and qualitatively extend deep alteration information. In addition, by overlaying various geoscientific factors affecting copper mineralization and mining, a Pearson correlation analysis is carried out in conjunction with currently proven or mined copper occurrences, and a weight of evidence approach is used to classify the study area into four mineability classes, which is important for narrowing down potential target areas for mineral exploration and assessing their mining value while contributing to an in-depth understanding of the role of geological elements in mineralization and development.

1. Introduction

The extraction of porphyry copper deposits plays a significant role in the economic development of countries, and positioning and developing copper mines are critical issues in the mining industry [1,2]. Traditional mineral exploration methods rely mainly on geological field surveys, which are time consuming, laborious, and inefficient and usually rely on only one or a few geological information sources, limiting the accuracy and reliability of exploration results [3,4]. In recent years, the use of geophysical, remote sensing, and geological information data for copper exploration has gradually become a mainstream method. These data can provide more comprehensive and accurate geological information, which can help reveal potential copper ore regions [5,6,7].
Therefore, integrating multiple sources of geological elements has become a hot topic in the current field of mineral exploration. This approach can combine various information sources, such as lithology, alteration, and structure, to comprehensively describe geological features and improve the accuracy and reliability of exploration [8,9,10]. Remote sensing technology can provide extensive data acquisition and monitoring, obtaining a large amount of geological data in a short period, significantly improving the efficiency and cost-effectiveness of mineral exploration [11]. In addition, machine learning-based methods, such as supervised classification and support vector machines, are widely used in mineral exploration. They can conduct in-depth mining and analysis of multiple sources of geological elements, improving the accuracy and reliability of exploration results [12,13].
Although the above studies have avoided the shortcomings of traditional mineral exploration, there are still some issues that need to be addressed in current integration research. For example, because most ore deposits are located deep underground, it is challenging to observe and obtain information directly from remote sensing images [14]. Collecting and integrating geologic data from multiple sources improve the precision and accuracy for mining evaluation. However, the applicability of existing methods in this area has not been adequately studied or compared [15]. Currently, the classification and extraction of lithological features mainly rely on manual experience and domain knowledge. More automated and intelligent methods are needed to optimize feature extraction [16,17].
Therefore, based on previous studies, this study uses support vector machines (SVMs) to extract lithological features from the study area, reducing the need for manual visual interpretation and improving the efficiency of classification and feature extraction. In addition, spectral-feature-enhanced principal component analysis (EPCA) was used to extract alteration information from ASTER remote sensing images, enhancing the integrity of the multi-source data. A classification interpolation method based on empirical Bayesian kriging is proposed to overcome the limitation of extracting surface alteration information from remote sensing images only and to achieve a qualitative extension of deep alteration information. Through the enhancement and optimization of the above geological elements, this study integrates multiple geoscientific factors affecting the development and mining of porphyry copper deposits, matches and validates them with existing mining areas, and uses a weight of evidence approach to the mining evaluation of porphyry copper ores in the Gondwana mineralization belt. The model can be used to assess the copper mineralization index and the value of large-scale industrial mining, and the results also provide an important reference for a deeper understanding of the role of multi-sourced geological elements in porphyry copper mineralization.

2. Materials and Methods

2.1. Geological Background of the Study Area

The Gondwana metallogenic belt is located on the northern margin of the Tethys Ocean and is a vast metallogenic belt [18]. In this region, multiple tectonic deformations and magmatic activities occurred from the late Mesozoic to the early Cenozoic, resulting in complex rock compositions and structural patterns [19,20]. The metallogenic dynamic factors of the Gondwana metallogenic belt are closely related to the tectonic evolution of the region [21]. Figure 1 shows that, during the process of the closure of the Tethys Ocean, the Gondwana area experienced multiple strong compressions and shear deformations due to the influence of subduction of the lithosphere and plate collision, forming large-scale deformation zones and fold-fault zones [22]. These tectonic actions provided the foundation conditions for later mineralization. In addition, magmatic activity is also an important cause of the Gondwana mineralization. Under the influence of tectonic deformation, mantle material upwelling formed a series of magmatic intrusions and volcanic activities [23]. Magma and associated hydrothermal alteration formed various mineral deposits, including copper, lead, zinc, tin, tungsten, molybdenum, and other metals. Among them, copper deposits are one of the main types of Gondwana mineralization, and their genesis is closely related to deep-seated magmatic intrusions, hydrothermal alteration, and tectonic deformation [24,25]. In summary, the Gondwana metallogenic belt has lithology, alteration, and structural factors that can be used in a copper anomaly model.

2.2. ASTER Images

The spatial and spectral resolutions of the ASTER sensor are well-suited for extracting mineral alteration information [26]. In this study, lithological classification and alteration information extraction was performed using nine bands from the visible near-infrared (VNIR, Spectral range from 0.52–0.86 µm) and shortwave infrared (SWIR, Spectral range from 1.60–2.43 µm) spectra captured by the ASTER sensor. A total of 93 georeferenced At-Sensor Radiance Measurements (AST_L1T) remote sensing images, covering an area exceeding 150,000 square kilometers, were utilized in the research area. These images underwent preprocessing steps such as radiometric calibration, atmospheric correction, and masking to remove cloud cover [27,28].

2.3. Support Vector Machine

A support vector machine (SVM) is a supervised learning algorithm commonly used for classification and regression analysis [29,30]. Due to its ability to handle high-dimensional data and its robustness to noise, SVM has been widely applied in various cutting-edge applications such as image classification, text classification, and bioinformatics [31]. In the field of geological exploration, SVM is also frequently employed for the classification of features such as lithology [32,33]. Classification methods based on SVM can effectively extract rock-type characteristics in the study area, reducing the need for manual interpretation and improving classification efficiency [34]. The objective of this study is to utilize SVM to extract rock types from the spectral features of remote sensing images in the research area and apply SVM to the classification of remote sensing analysis. Figure 2 illustrates the SVM classification process of lithology in this study. The specific steps are as follows [35]:
First, representative training samples of different rock types within the research area are selected, in conjunction with geological survey maps of the study area. These samples should encompass the characteristics of various rock types present in the geological research area to the greatest extent possible [36]. Second, the spectral features of the training samples are extracted from the remote sensing images. These features include the spectral information of each pixel in the remote sensing image, which can be obtained by analyzing the reflectance or radiance at different wavelengths [37]. After extracting the spectral features, preprocessing and normalization of the feature values are performed to ensure that they are within the same range and exhibit similar variations.
Next, based on the extracted features and their corresponding rock types, an appropriate kernel function is selected to train the SVM model. The choice of the kernel function is crucial for classification performance, as different kernel functions can capture different types of data relationships. By training the SVM model, a decision boundary is established to map the input spectral features to rock types [38].
In this study, a 5-fold cross-validation approach is employed, where the original training dataset is randomly divided into five subsets. One subset is retained as the internal validation data for testing the model, while the remaining four subsets are used for training [39]. This cross-validation process is repeated five times, with each subset used only once as the internal validation data. Through this approach, the performance of the SVM-based remote sensing image classification method can be better evaluated. In each round of the cross-validation process, the performance of the model on different training and validation data combinations can be observed, and average performance metrics are calculated to obtain more reliable results [40]. Finally, the trained SVM model is utilized to classify the rock types of the remaining pixels in the remote sensing image. For these unknown pixels, their spectral features are input into the SVM model, and based on the model’s classification decision rules, they are assigned to specific rock types.
It is important to note that, as shown in Figure 3, due to the association of the formation and development of porphyry copper deposits with magmatic–hydrothermal alteration, porphyry copper deposits are typically found within igneous rocks in most cases [41]. Based on this understanding, this study vectorized the lithological data for the entire Gondwana region based on the original raster data and analyzed and classified the vectorized lithological data based on geological principles. The different lithological types were identified and classified according to their geological features and genesis, including a consideration of the mineral composition, structural features, color, and density of the rocks. Based on the results of the analysis, similar lithological types are integrated and classified. Depending on the purpose and needs of the study, it was determined that over 200 different lithological types representing different geological ages would eventually be integrated into five igneous or granitic rocks. This process provides for the subsequent construction of a porphyry copper mining evaluation based on multiple factors.
The support vector machine algorithm, shown in the following 6 equations, first requires a training dataset where:
T = x 1 , y 1 , x 2 , y 2 , , x N , y N
of which x i R n ,   y i + 1 , 1 ,   i = 1 ,   2   ,   3 N.
Selecting penalty parameters C > 0 and constructing and solving convex quadratic programming problems,
min a 1 2 i = 1 N j = 1 N a i a j y i y j K x i , y i i = 1 N a i
S . t .   i = 1 N a i y i = 0         0 < a i < C ,   i = 1 ,   2   ,   3 N
Obtaining the optimal solution, a * = a 1 * , a 2 * , a N * T ,
w * = i = 1 N a i * y i x i
Choose a component aj* of a* to satisfy the condition 0 < aj* < C, then:
b * = y i i = 1 N a i * y i K x i , x j
Finding the separation hyperplane,
w * · x + b * = 0
The classification decision function is f x = s i g n w * · x + b * .

2.4. Spectral-Feature-Enhanced Principal Component Analysis

Liu et al. introduced a novel approach to extract alteration details from ASTER remote sensing images [42]. Their method combines spectral feature enhancement and principal component analysis (PCA) to enhance traditional alteration extraction techniques. By incorporating spectral-feature-enhanced band values from ASTER’s visible and near-infrared (VNIR) and short-wave infrared (SWIR) bands, the authors improve the accuracy of alteration information extraction [43]. They determine the spectral range for ratio enhancement by analyzing the interval with the most significant slope change, as well as the reflection peaks and absorption troughs on the curve, based on characteristic spectra of minerals. The ratio of reflection peak to absorption trough serves as the principal component for enhancing the spectral differences among different lithologies. To perform EPCA analysis, the authors adopt the Crosta method. They synthesize colors using appropriate band ratios and employ a threshold method combined with a base map for segmentation. As a result, images of iron hydroxide alteration, magnesium hydroxide alteration, and aluminum hydroxide alteration are generated for the study area. This method highlights alteration information and achieves higher spatial aggregation and precision compared to traditional band ratio and PCA methods. It also mitigates the impact of terrain and enhances weak information in the image [44]. However, the EPCA method, as a new method for enhanced extraction of alteration information, has yet to be further developed for application in the field of copper exploration and mining. Therefore, this study is based on the extraction of alteration information in the study area and discusses the advantages of the EPCA method over the traditional Crosta method for the extraction of alteration information.
The basic principle of the EPCA method is represented by Equations (7)–(10). In this method, the initial band of 9 bands in the ASTER image plus 1 spectrally enhanced band is considered to be 10 variables. A matrix of size 93 × 10 is constructed for the 93 scenes in the study area. Principal component transformation is applied to convert this matrix into a 10 × 10 matrix, automatically selecting PC1, PC2, PC3, and PC4 for each image scene. This transformation helps determine the primary contributors to the principal components. Here, ‘p’ denotes the number of image bands, ‘n’ represents the number of frames used, and ‘X1, X2, …, Xp’ represent the observed variables. The array of data information for the n samples is then analyzed accordingly.
X = x 11 x 12 x 1 p x 21 x 22 x 2 p x n 1 x n 2 x n p = X 1 , X 2 , , X p , n = 1 , 2 , 3 , , 93 ; p = 1 , 2 , 3 , , 10
X i = ( x 1 i , x 2 i , , x n i ) T , i = 1 , 2 , , 10
p observed variables can be combined into p new variables (composite variables). This is the dimensionality reduction process of principal component analysis.
F i = w i 1 x 1 + w 2 i x 2 + + w p i x p , i = 1 , 2 , , p ; p = 1 , 2 , , 10
When F satisfies the correlation conditions of principal component analysis, a 10 × 10 transformation matrix W can be constructed.
W = w 11 w 12 w 1 p w 21 w 22 w 2 p w p 1 w p 2 w p p , p = 1 , 2 , , 10

2.5. Alteration Interpolation Method

In the field of geology, information from surface outcrops can often provide clues that help researchers infer and investigate the possibility that more geological information exists deep within the strata [45,46]. For example, signs of mineralization, such as mineralized veinlets, mineralized enclosures, and traces of mineralization, can provide clues as to the type, genesis, and extent of enrichment of a deposit, thus guiding exploration for deeper deposits. Sedimentary rock layers in surface outcrops can reveal past depositional environments and palaeogeographic conditions [47,48].
Taking into account this phenomenon and the issue of hydrothermal alteration, the EPCA method was employed to classify the alteration information in the study area and extract strong alteration signals. When selecting an interpolation method for the altered information, the empirical Bayesian kriging (EBK) method, compared to other interpolation methods, can incorporate the influence of auxiliary information and consider spatial dependency [49,50]. In the interpolation process, auxiliary variables are used to provide additional information about the spatial patterns and relationships of the target variable. In this study, the obtained lithology data and DEM data were included as auxiliary variables to improve the accuracy of interpolation. In addition, the alteration information derived from the above EPCA was stratified to enhance the interpolation results. This overcomes the limitation of the process of extracting alteration information by using remote sensing images such as ASTER in traditional related studies only stopping at the inversion of surface information and achieves qualitative inversion of deep alteration information based on remote sensing images. The following is the basic principle of the EBK method.
Suppose a set of known observations where the attribute value of the ith observed location is Zi and the spatial coordinates of that location are (Xi, Yi, Zi). Estimate the attribute value Z ( u ) for the unknown location, which has the spatial coordinates (X(u), Y(u), Z ( u ) ) [51]. First, a thin-slab spline function is chosen as the semi-variance function γ ( h ) to describe the spatial correlation of the attribute values, where h is the distance between two locations and “Nugget” denotes the small variability that exists between two points at a distance of zero, which can be seen as random fluctuations in the attribute values over a very short range of distances.
γ ( h ) = N u g g e t + b | h 2 | × ln ( | h | )
Assuming that the attribute values obey a Gaussian distribution, the following formula is used to calculate the attribute value estimate Z ( u ) for the unknown location:
Z ( u ) = [ λ i ( u ) × Z i ]
where λ i ( u ) denotes the weight coefficient, reflecting the spatial correlation between the known observations and the unknown location. The weight coefficients can be calculated from the covariance function and the attribute values of the known observations.

3. Results

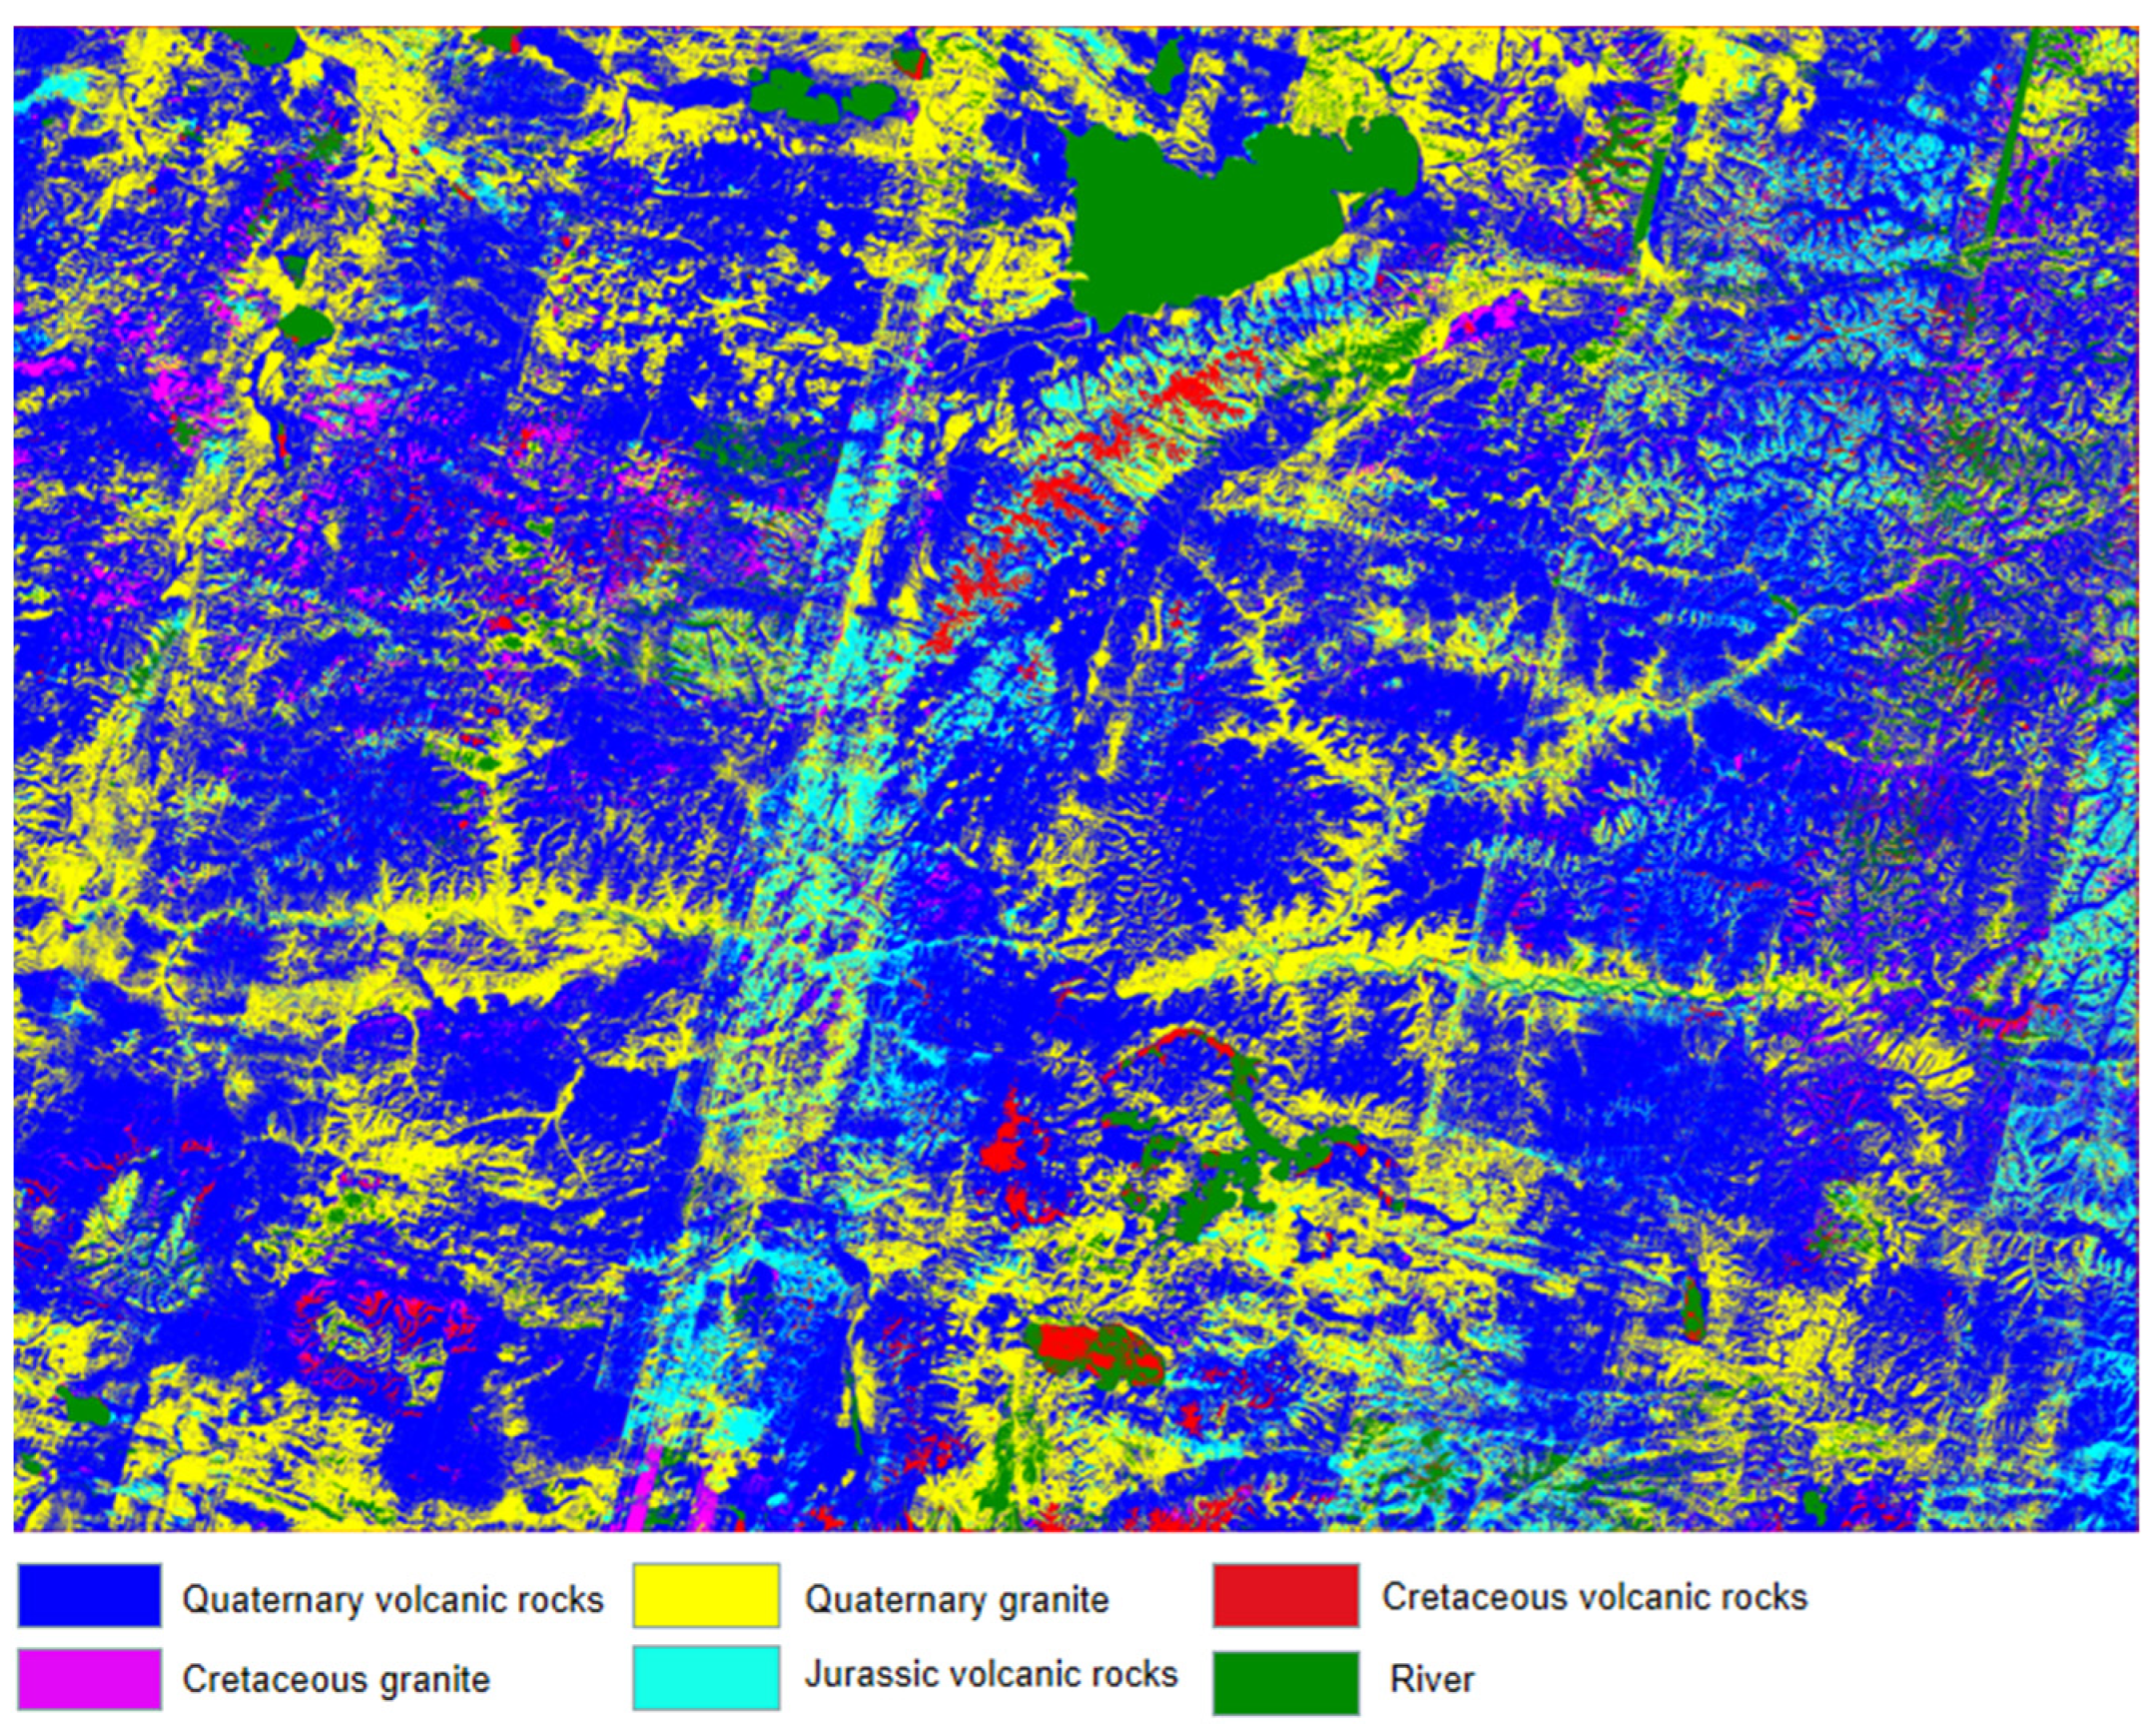
3.1. Lithological Feature Classification Extraction

In this study, nine bands of ASTER images were selected as the dataset for lithology classification. Before inputting the dataset into SVM, all data were normalized. The target classes were divided into seven categories, including five lithological units: Quaternary volcanic rocks, Quaternary granite, Cretaceous volcanic rocks, Cretaceous granite, and Jurassic volcanic rocks, as well as two non-rock categories, namely vegetation and water bodies. These lithological categories play a dominant role in ore-forming dynamics and are consistent with the lithology map shown in Figure 1, as reported in previous studies.
To better compare the performance of SVM in lithology classification, this study also utilized the maximum likelihood (ML) method, neural networks (NN), and minimum distance classification (MD). The results showed that SVM provided the highest overall classification accuracy and kappa coefficient. The performance comparison of the four methods is shown in Table 1. Additionally, distinct regions were selected to visualize and compare the classification results of the four methods, as shown in Figure 4.
According to Table 1, the overall classification accuracy and Kappa coefficient of the SVM classification for rock types are higher than the other three classification methods. Although it comes at the cost of longer classification time, it is acceptable for the research field. Furthermore, as shown in Figure 4, SVM effectively handles the boundary issues between multiple rock types while preserving detailed information as much as possible. It can construct decision boundaries suitable for rock-type classification and maintain high accuracy and robustness during classification. From partial results, SVM also mitigates the striping interference caused by the quality issues of remote sensing images to a certain extent, resulting in more accurate results. In comparison to the other three methods, SVM demonstrates an ability to synthesize information during classification, allowing it to better handle complex data features. On the other hand, methods such as maximum likelihood, neural networks, and minimum distance may fail to fully capture the features of rock data in the Gondwana region, leading to lower classification accuracy.
In conclusion, SVM performs well in rock-type classification due to its effective feature capturing, more representative training samples, ability to handle remote sensing image quality issues, and adaptability to multi-class classification problems. This enables SVM to achieve higher classification accuracy and completeness in this research, resulting in accurate rock-type classification maps (Figure 5).
Figure 5 shows the results of the SVM method of classifying lithologies, and there is a larger range of Quaternary rock types in this area. However, by investigating the geological background, it is possible to identify igneous rocks, particularly Cretaceous and Jurassic igneous rocks, with a high potential for mineralization. This is because the formation of early onset igneous rocks is often accompanied by greater geological alteration, which is consistent with the porphyry copper ore formation kinetic model illustrated previously in Figure 2. Therefore, during the follow-up evaluation, we will focus on the spatial aggregation of igneous rocks in the study area, especially those of the early geological time.

3.2. Alteration Information Extraction and Hierarchical Interpolation

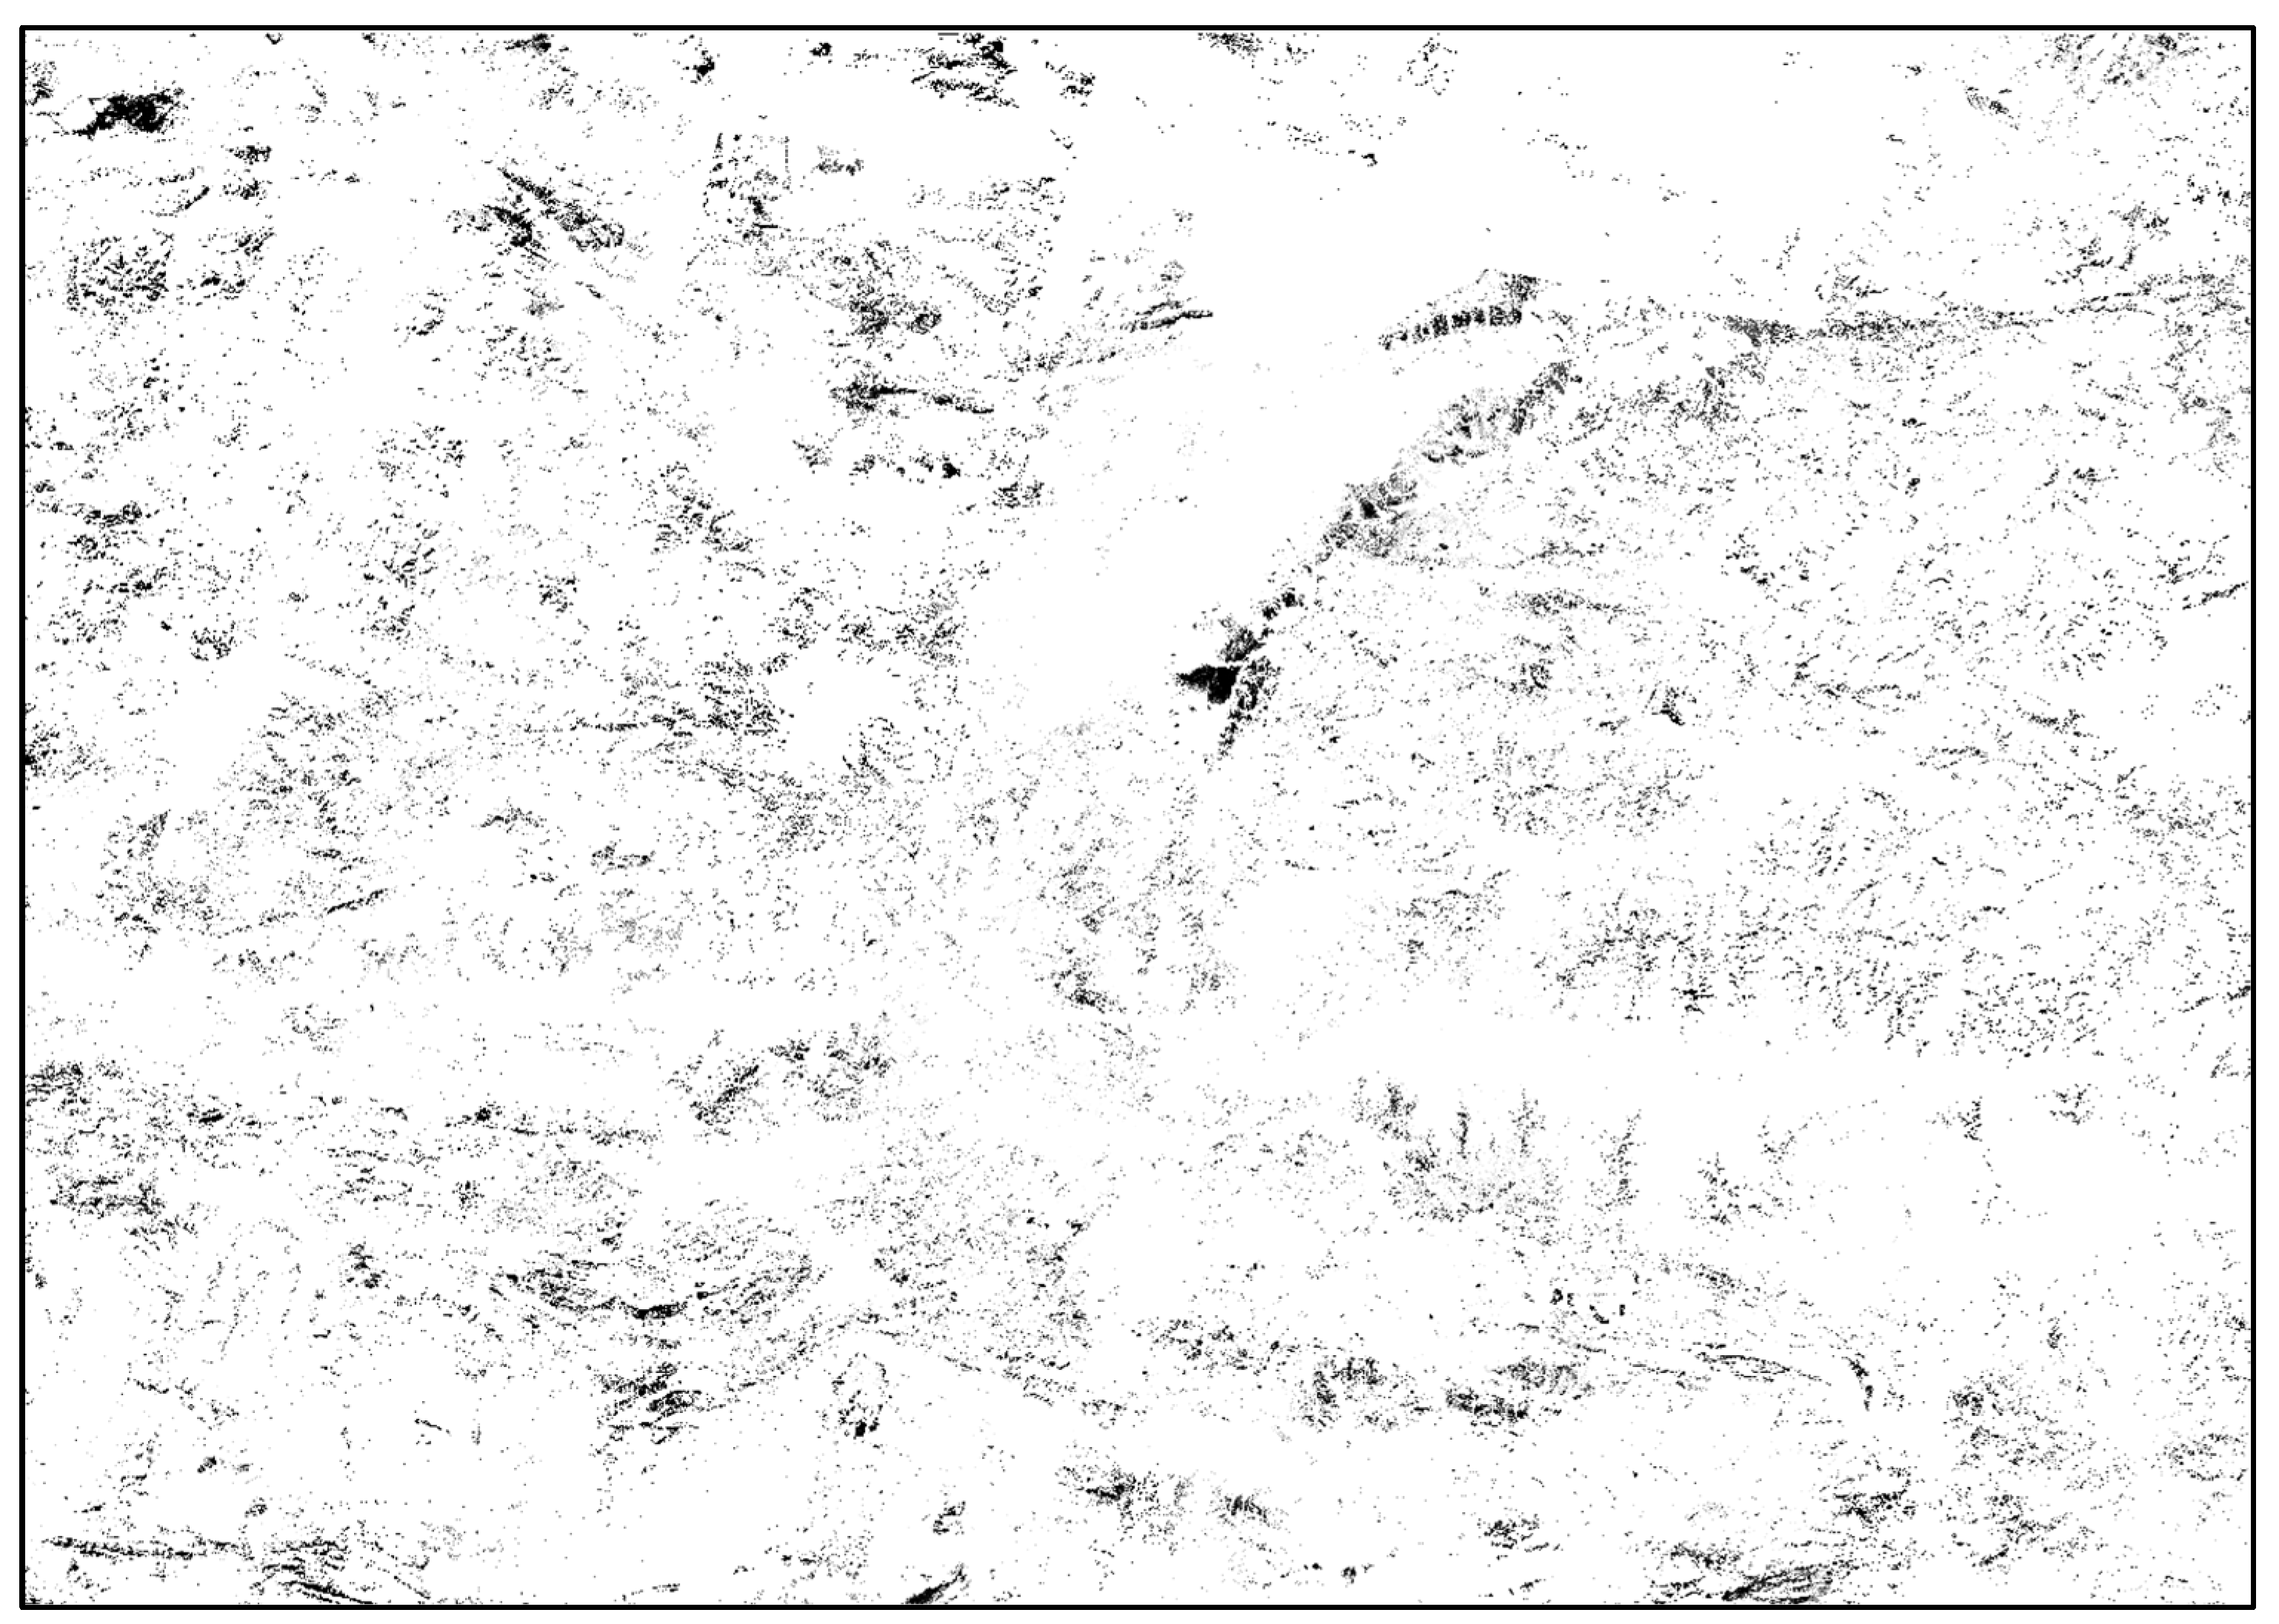
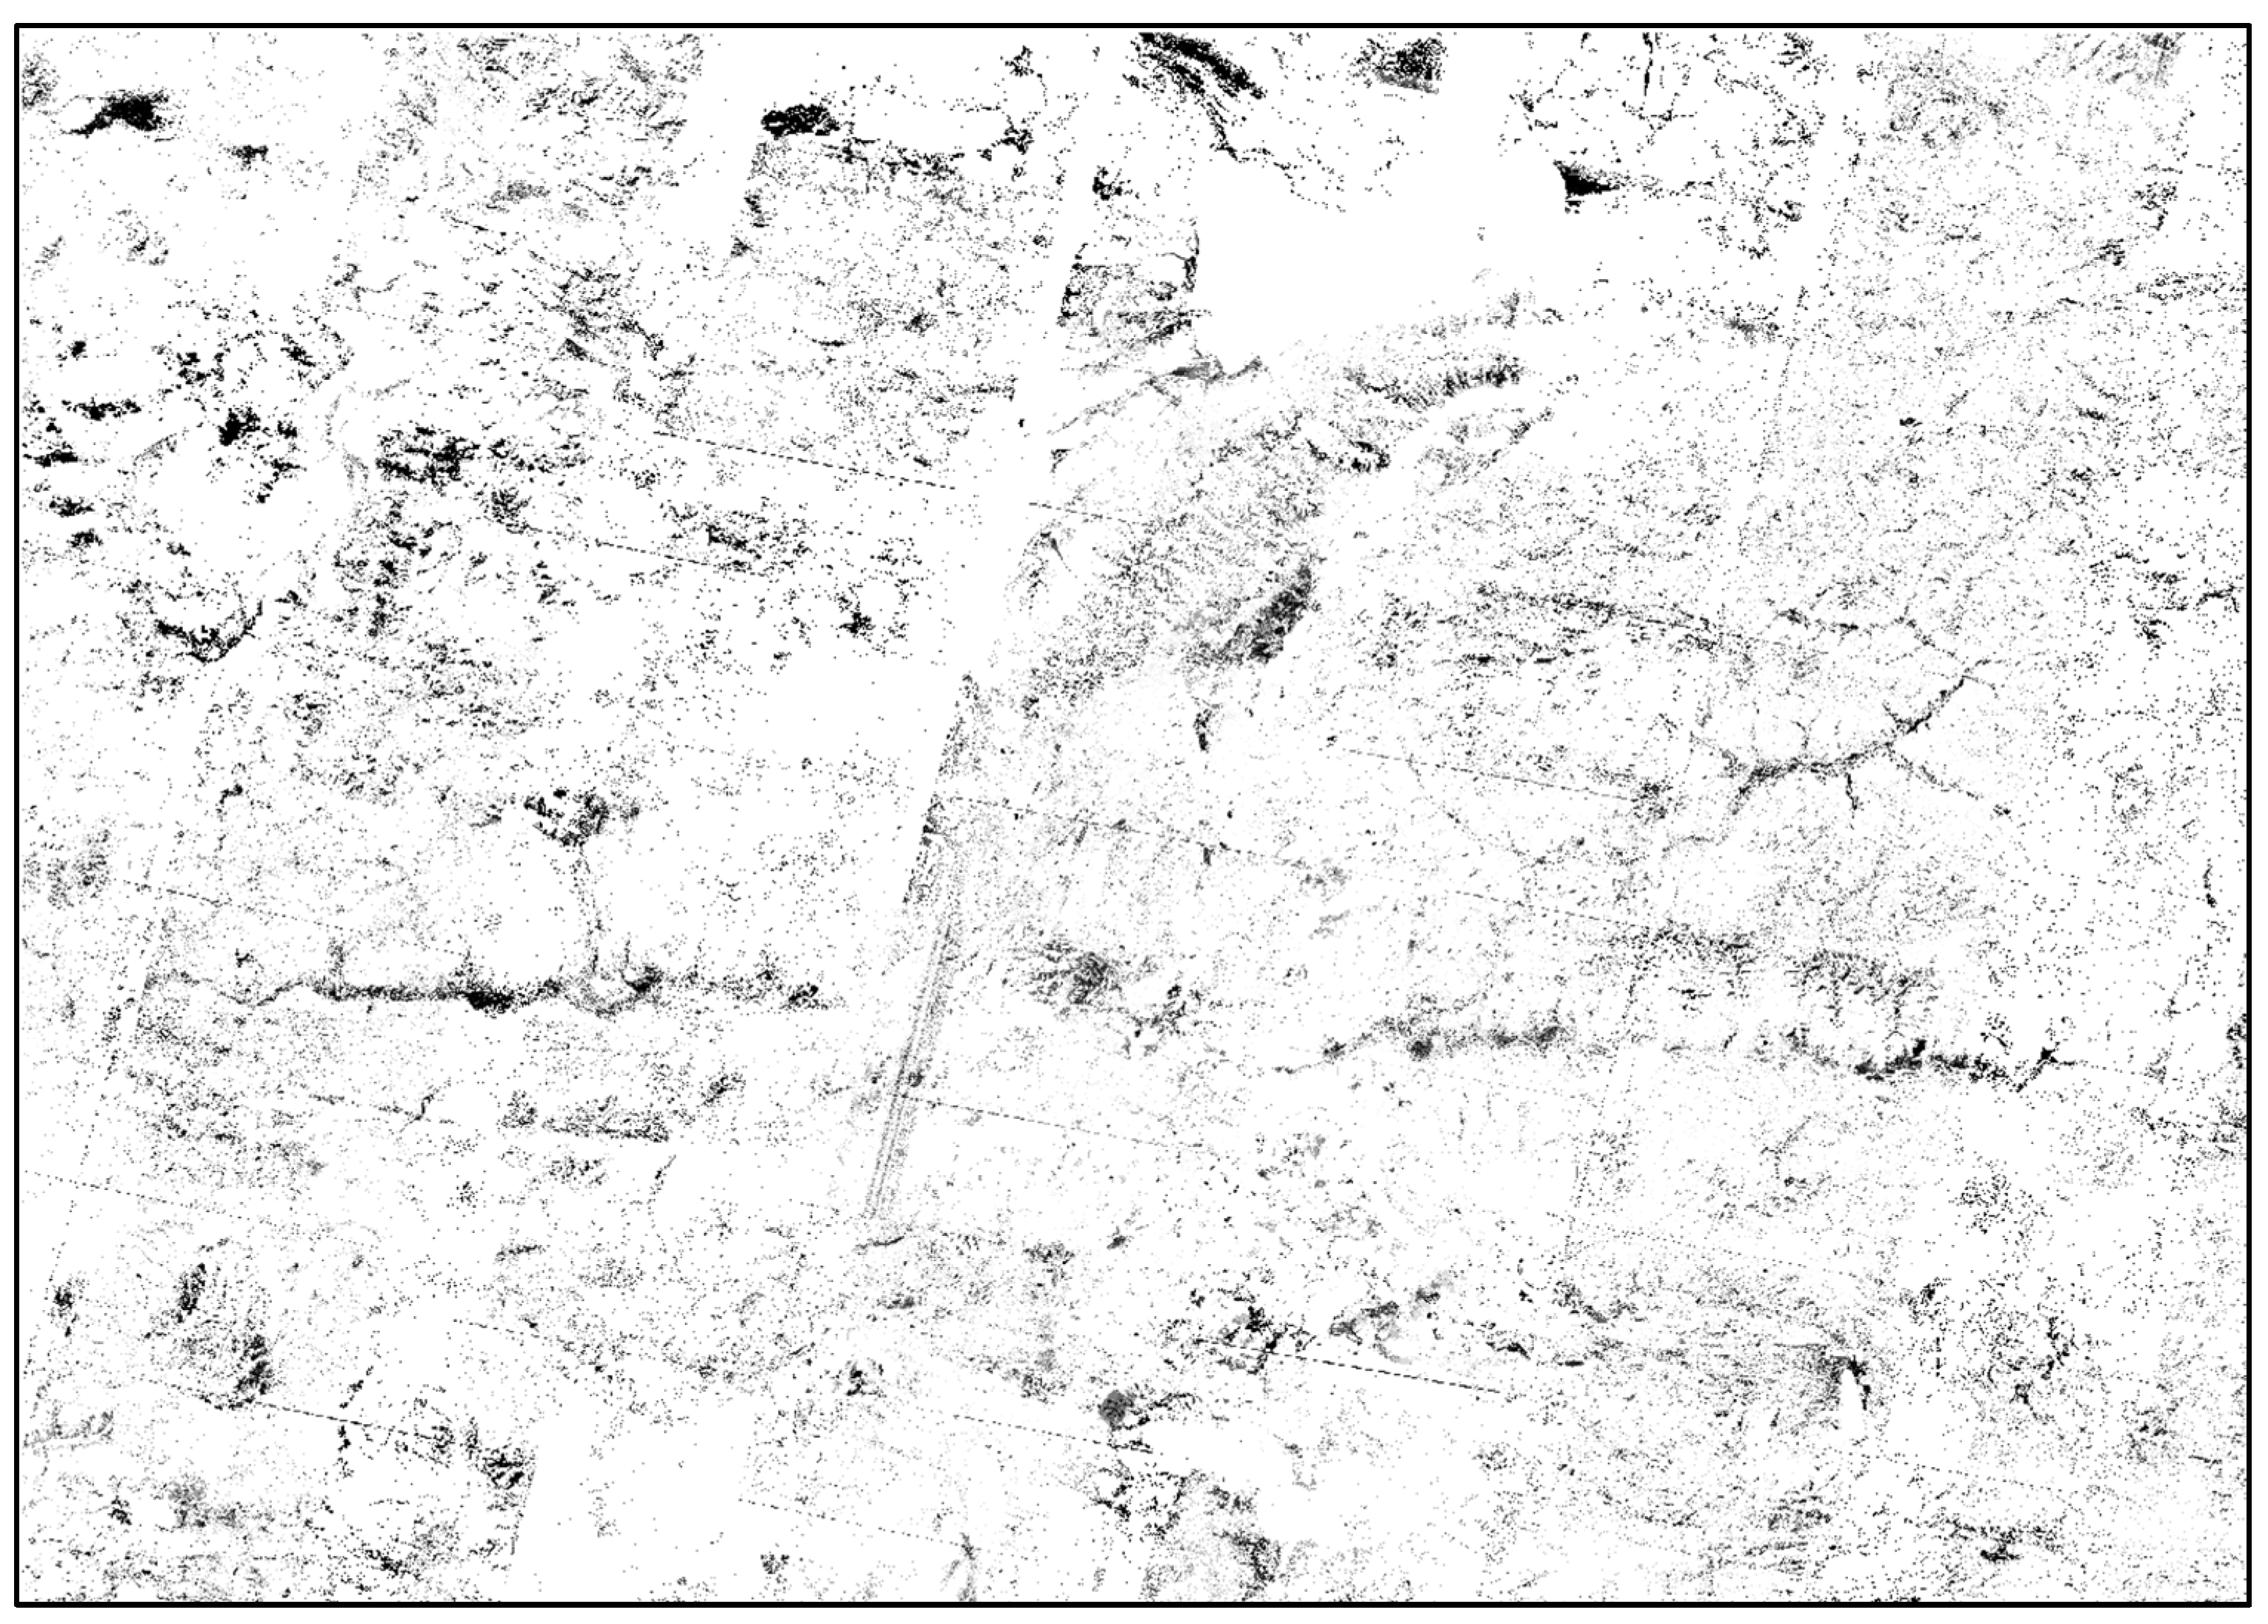
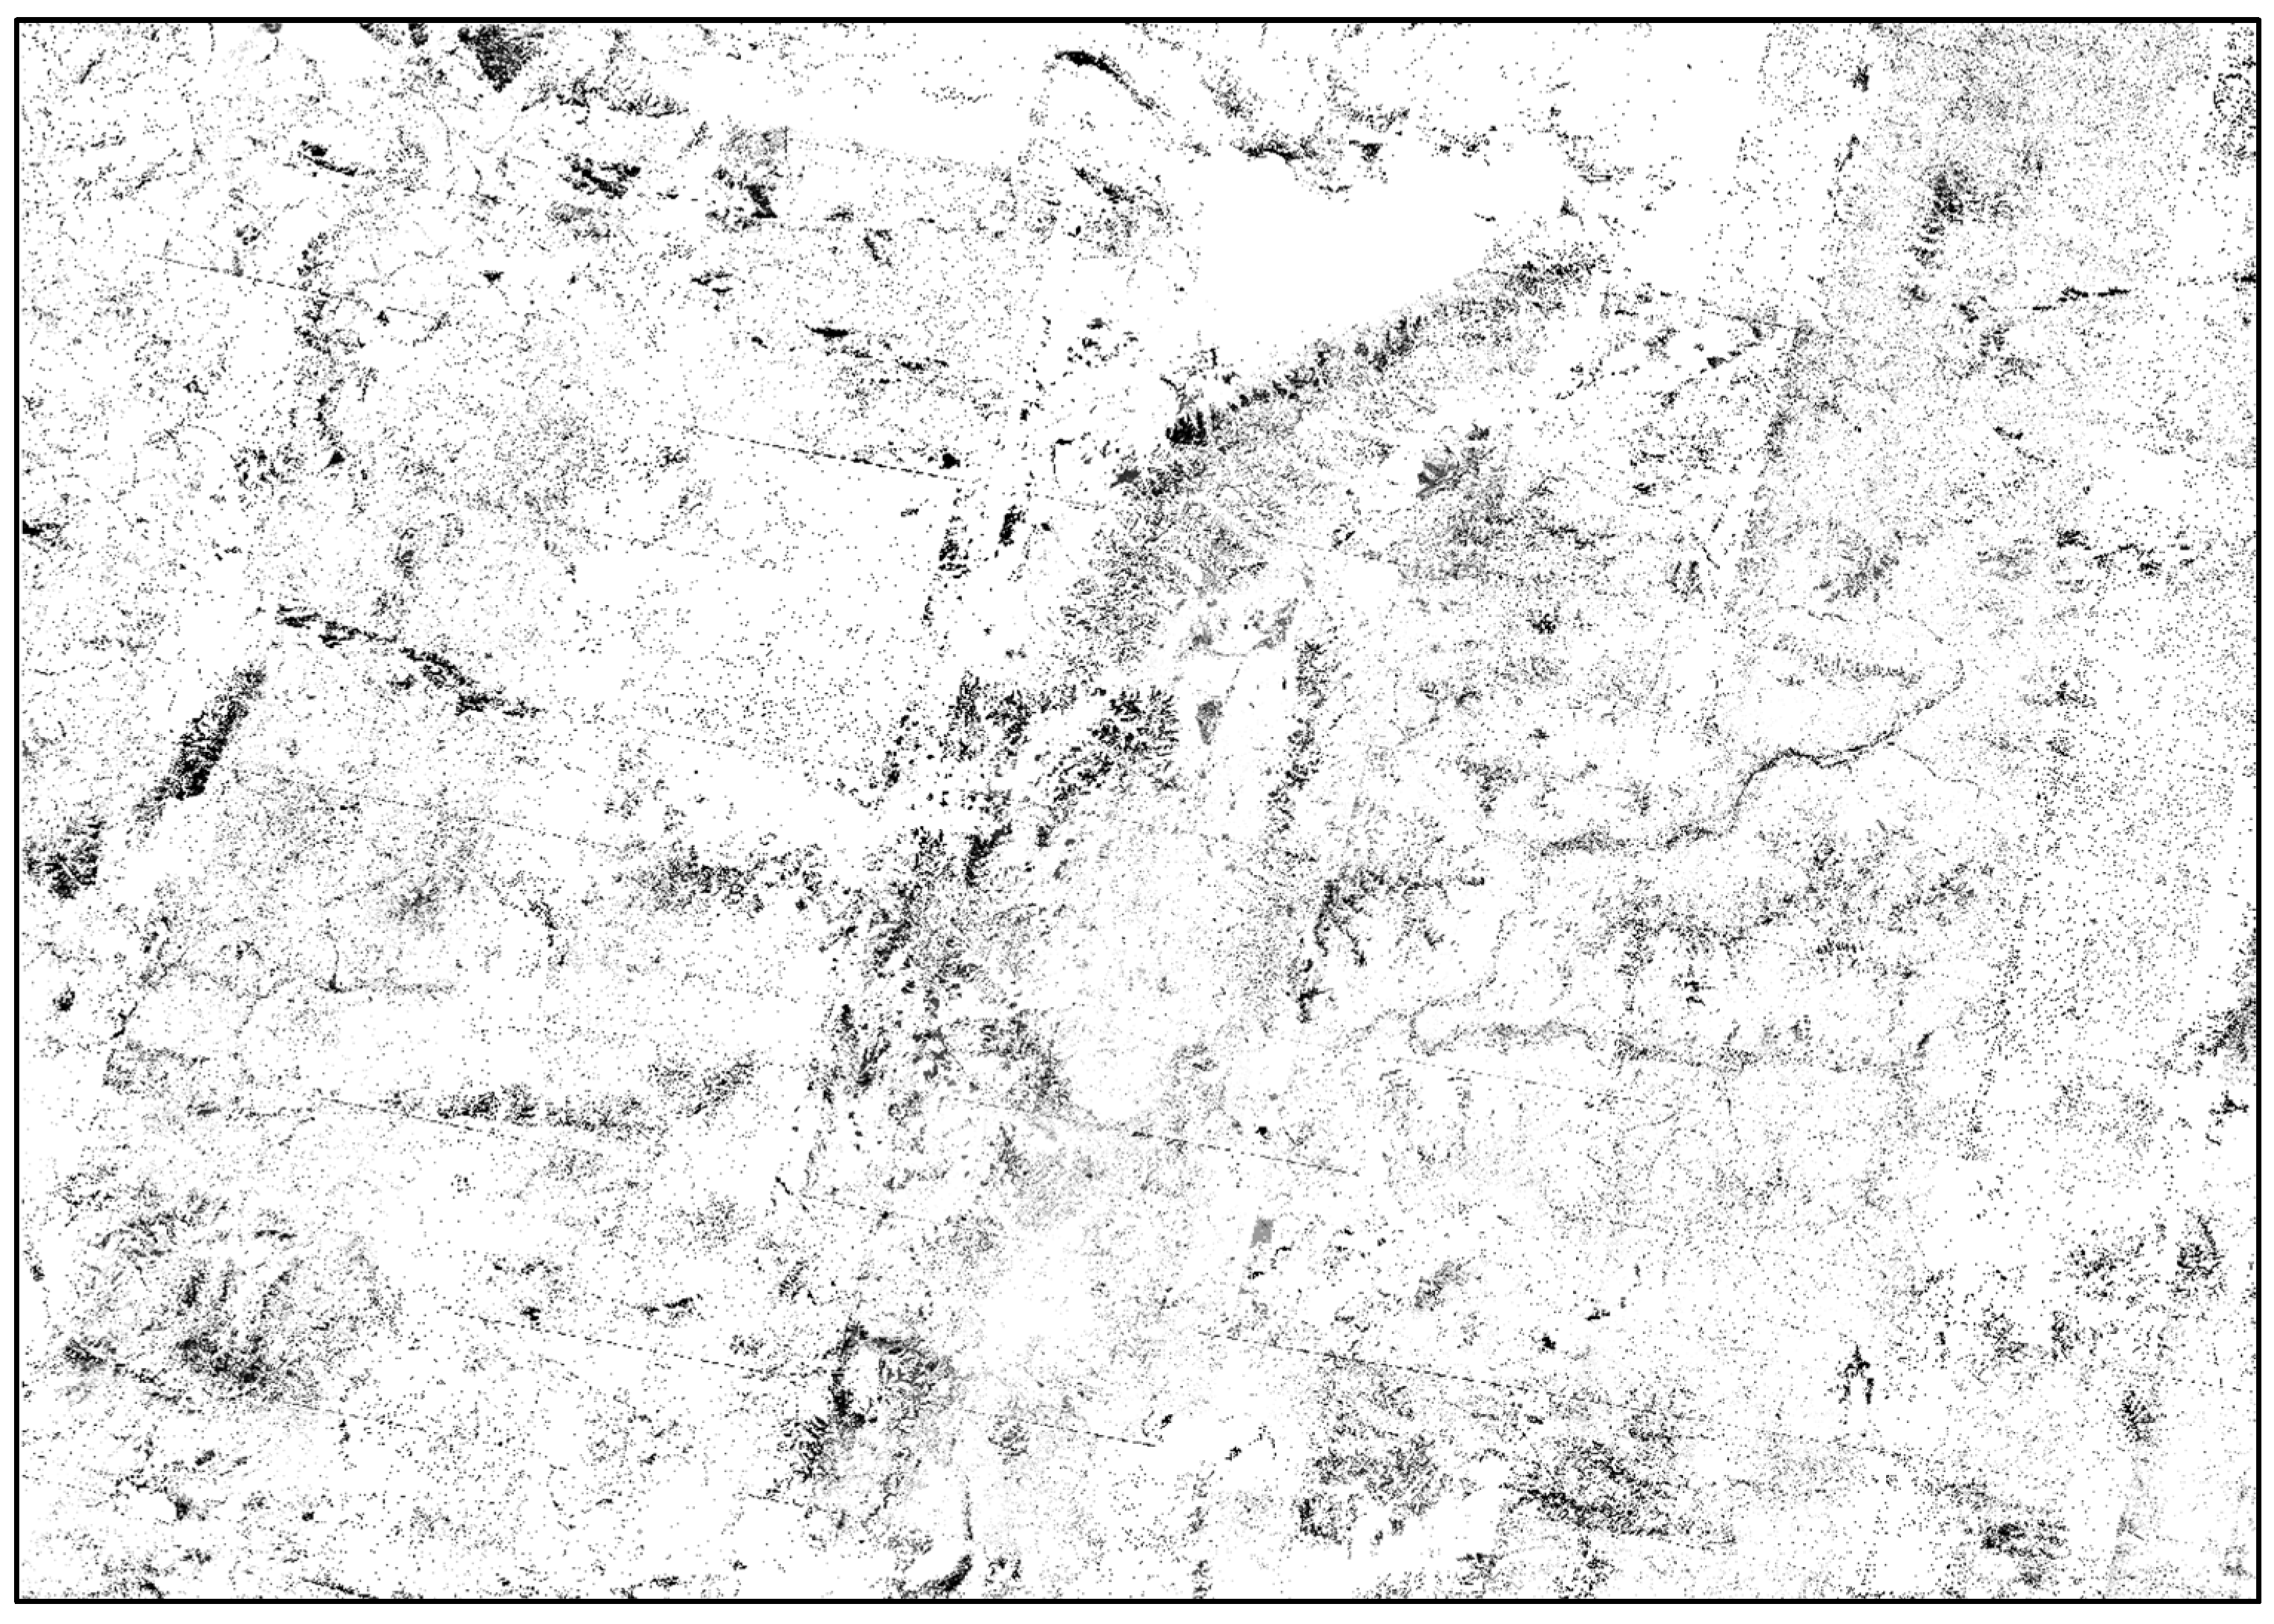
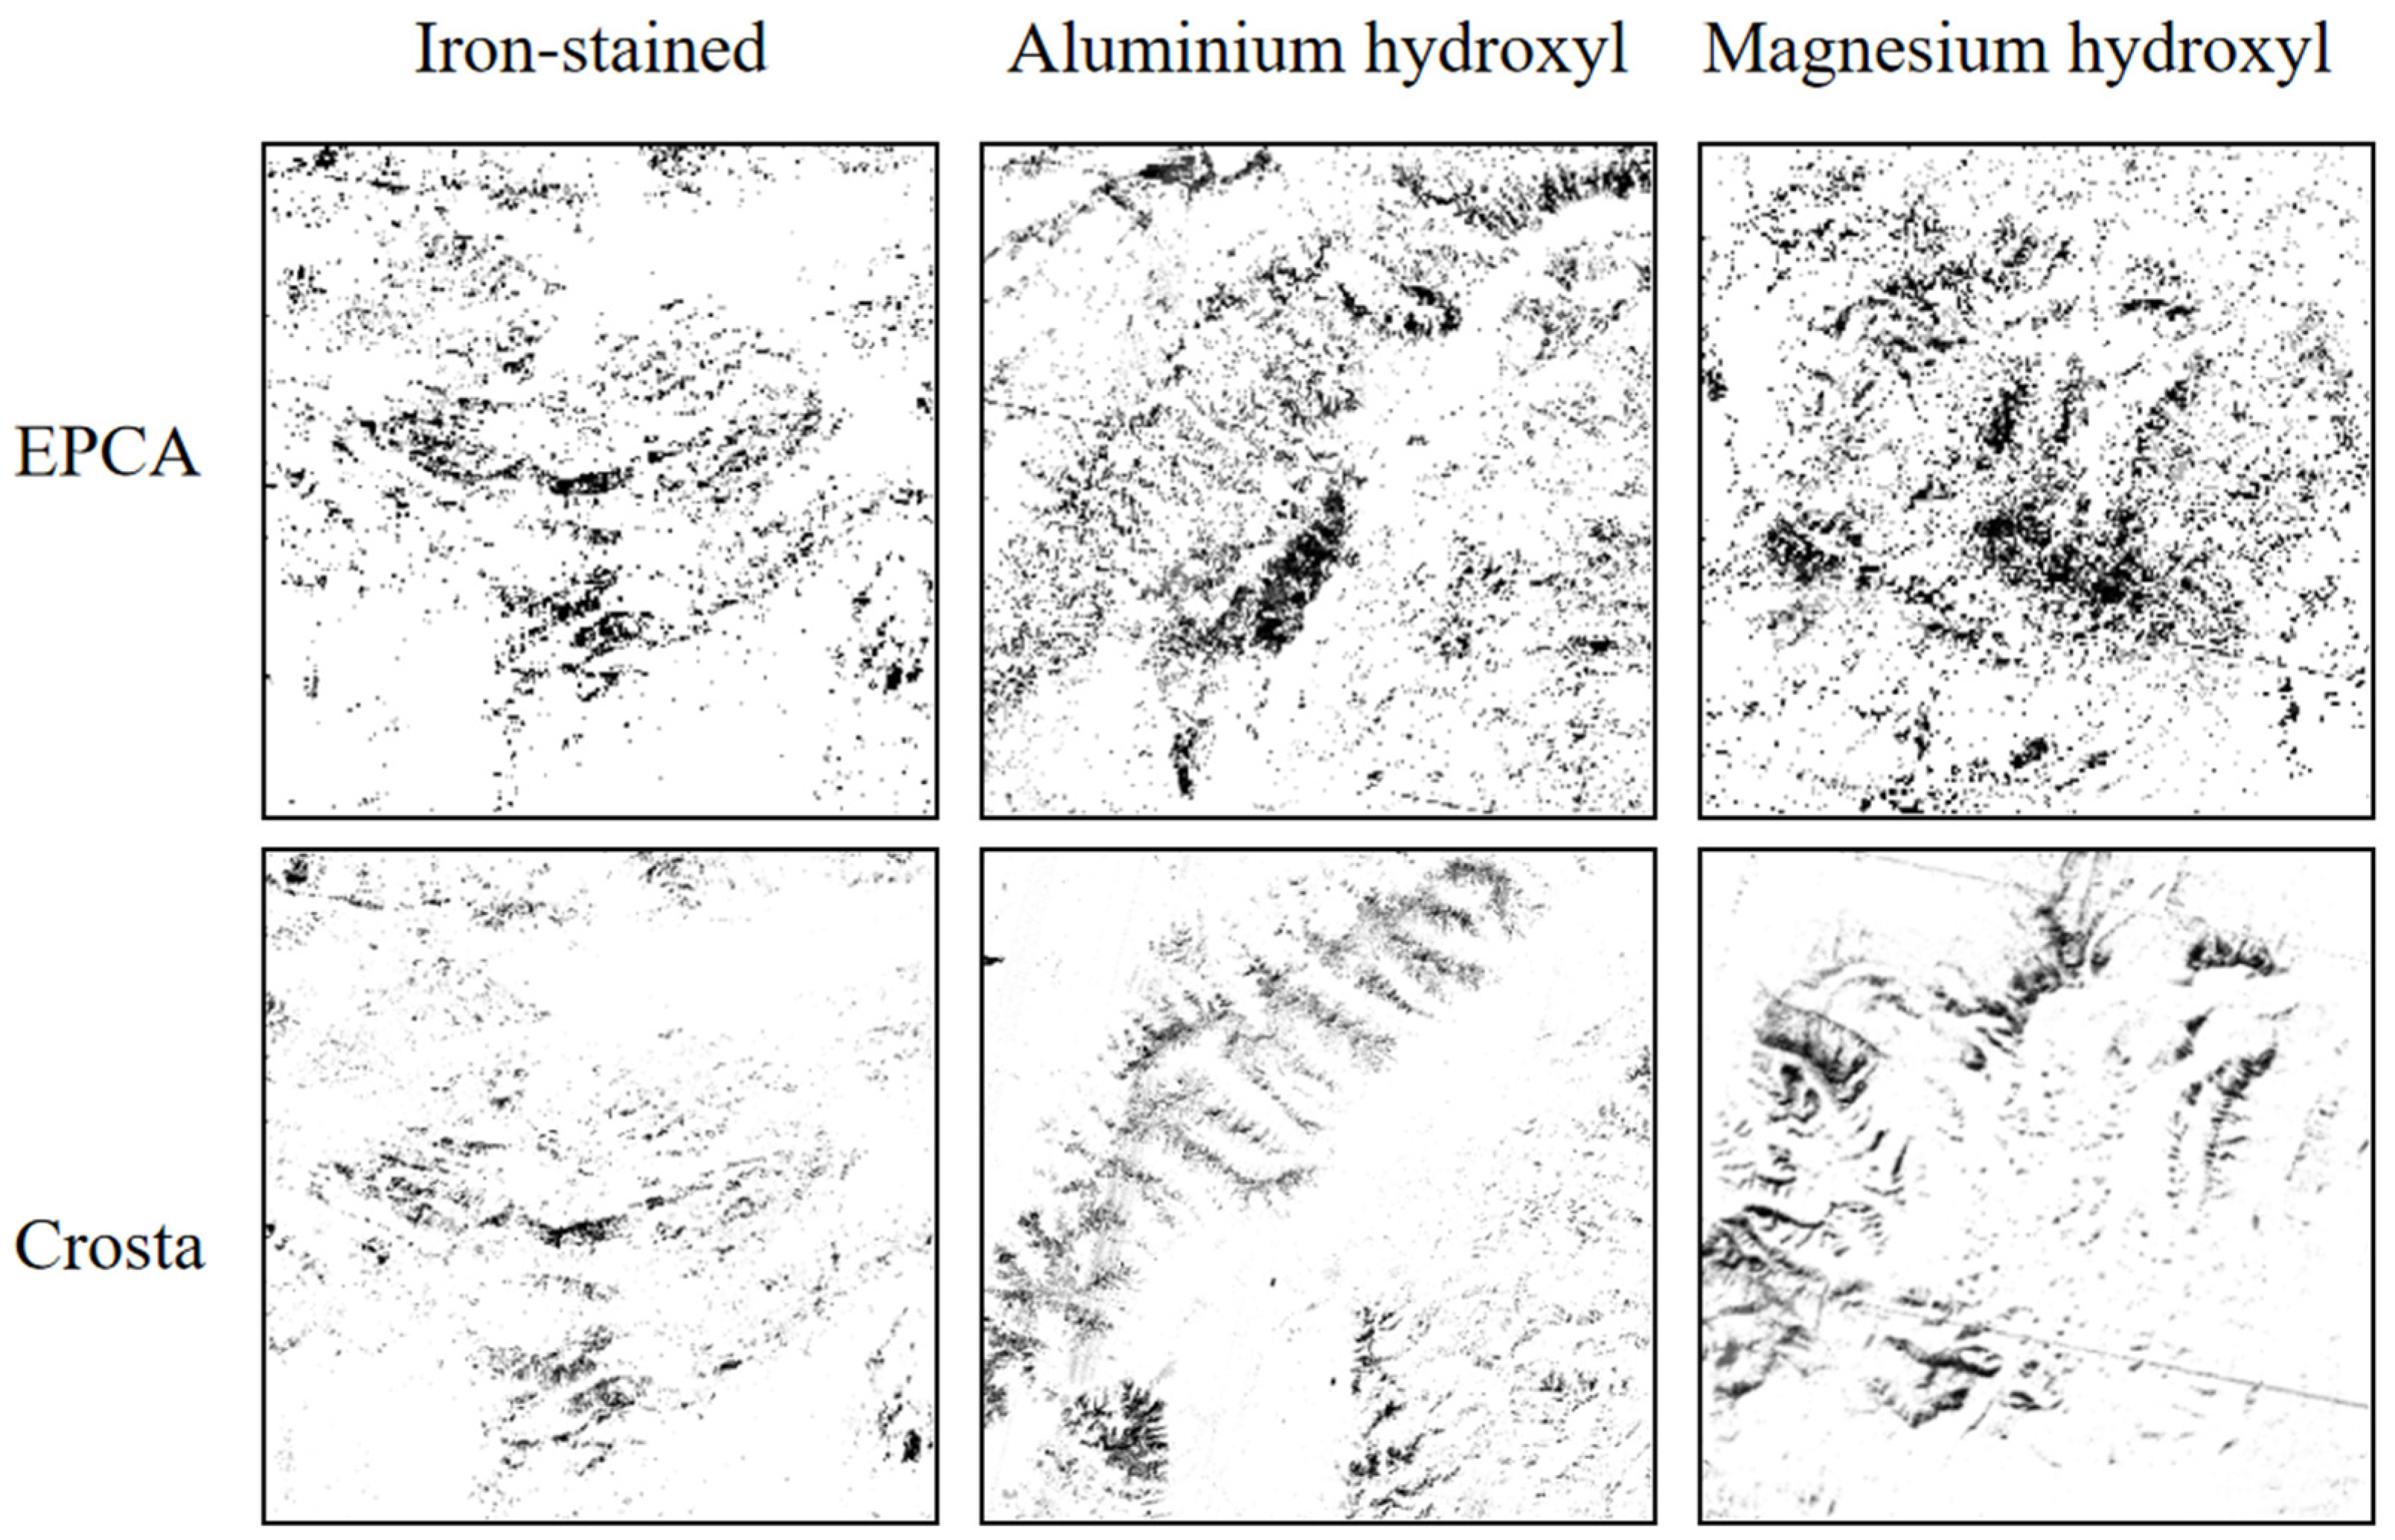
3.2.1. Alteration Information Extraction

In this study, three types of alterations were chosen: iron-stained alteration, aluminum hydroxyl alteration, and magnesium hydroxyl alteration. The EPCA method was employed to reduce redundancy in the spectral information. Initially, the ratio of band 2 to band 1 was used to enhance the spectral information related to iron staining. These enhanced spectral bands (bands 2, 3, and 4) were then subjected to principal component analysis to obtain the results of iron staining etching (Figure 6). Furthermore, the ratio of band 4 and band 7 to band 6 was utilized to enhance the spectral features associated with aluminum hydroxyl. These enhanced spectral bands (bands 4, 6, and 7) were combined and subjected to principal component analysis (Figure 7). Finally, the ratio of band 6 and band 9 to band 7 and band 8 was calculated to enhance the spectral features of magnesium hydroxyl. These enhanced spectral bands (bands 7, 8, and 9) were combined and analyzed using principal component analysis (Figure 8).
According to the results shown in Figure 6, Figure 7 and Figure 8, it can be observed that the extracted three types of alteration information are scattered in location and at different depths. However, according to the data from the geological survey, the three types of alteration information show a trend of superposition and spatial aggregation in the alteration areas that show darker colors on the map. This superposition and aggregation may be more relevant to the geological context of porphyry copper formation. Therefore, in order to further evaluate the distribution of porphyry copper ores, the study will superimpose these three types of alteration information in the subsequent porphyry copper ore evaluation system (Figure 9).
Figure 9 shows the alteration information extracted by the EPCA method for the study area, which shows several spatial aggregations of more intense alteration, expressed in red information in the figure. However, the spatial continuity is poor because ASTER remote sensing images can only capture surface alteration information and cannot be detected in-depth, and there is interference information such as water bodies and vegetation; most of the current work using remote sensing images for mineral alteration information extraction stops at this step. In contrast, copper exploration and mining often require access to deeper levels of alteration information. As mentioned earlier, human exploration, including infrared instruments, radar, and field exploration, is commonly used to obtain subsurface information. However, for such a large study area, traditional human methods are limited, inefficient, and laborious. Therefore, the following interpolation analysis has been carried out specifically for this study.

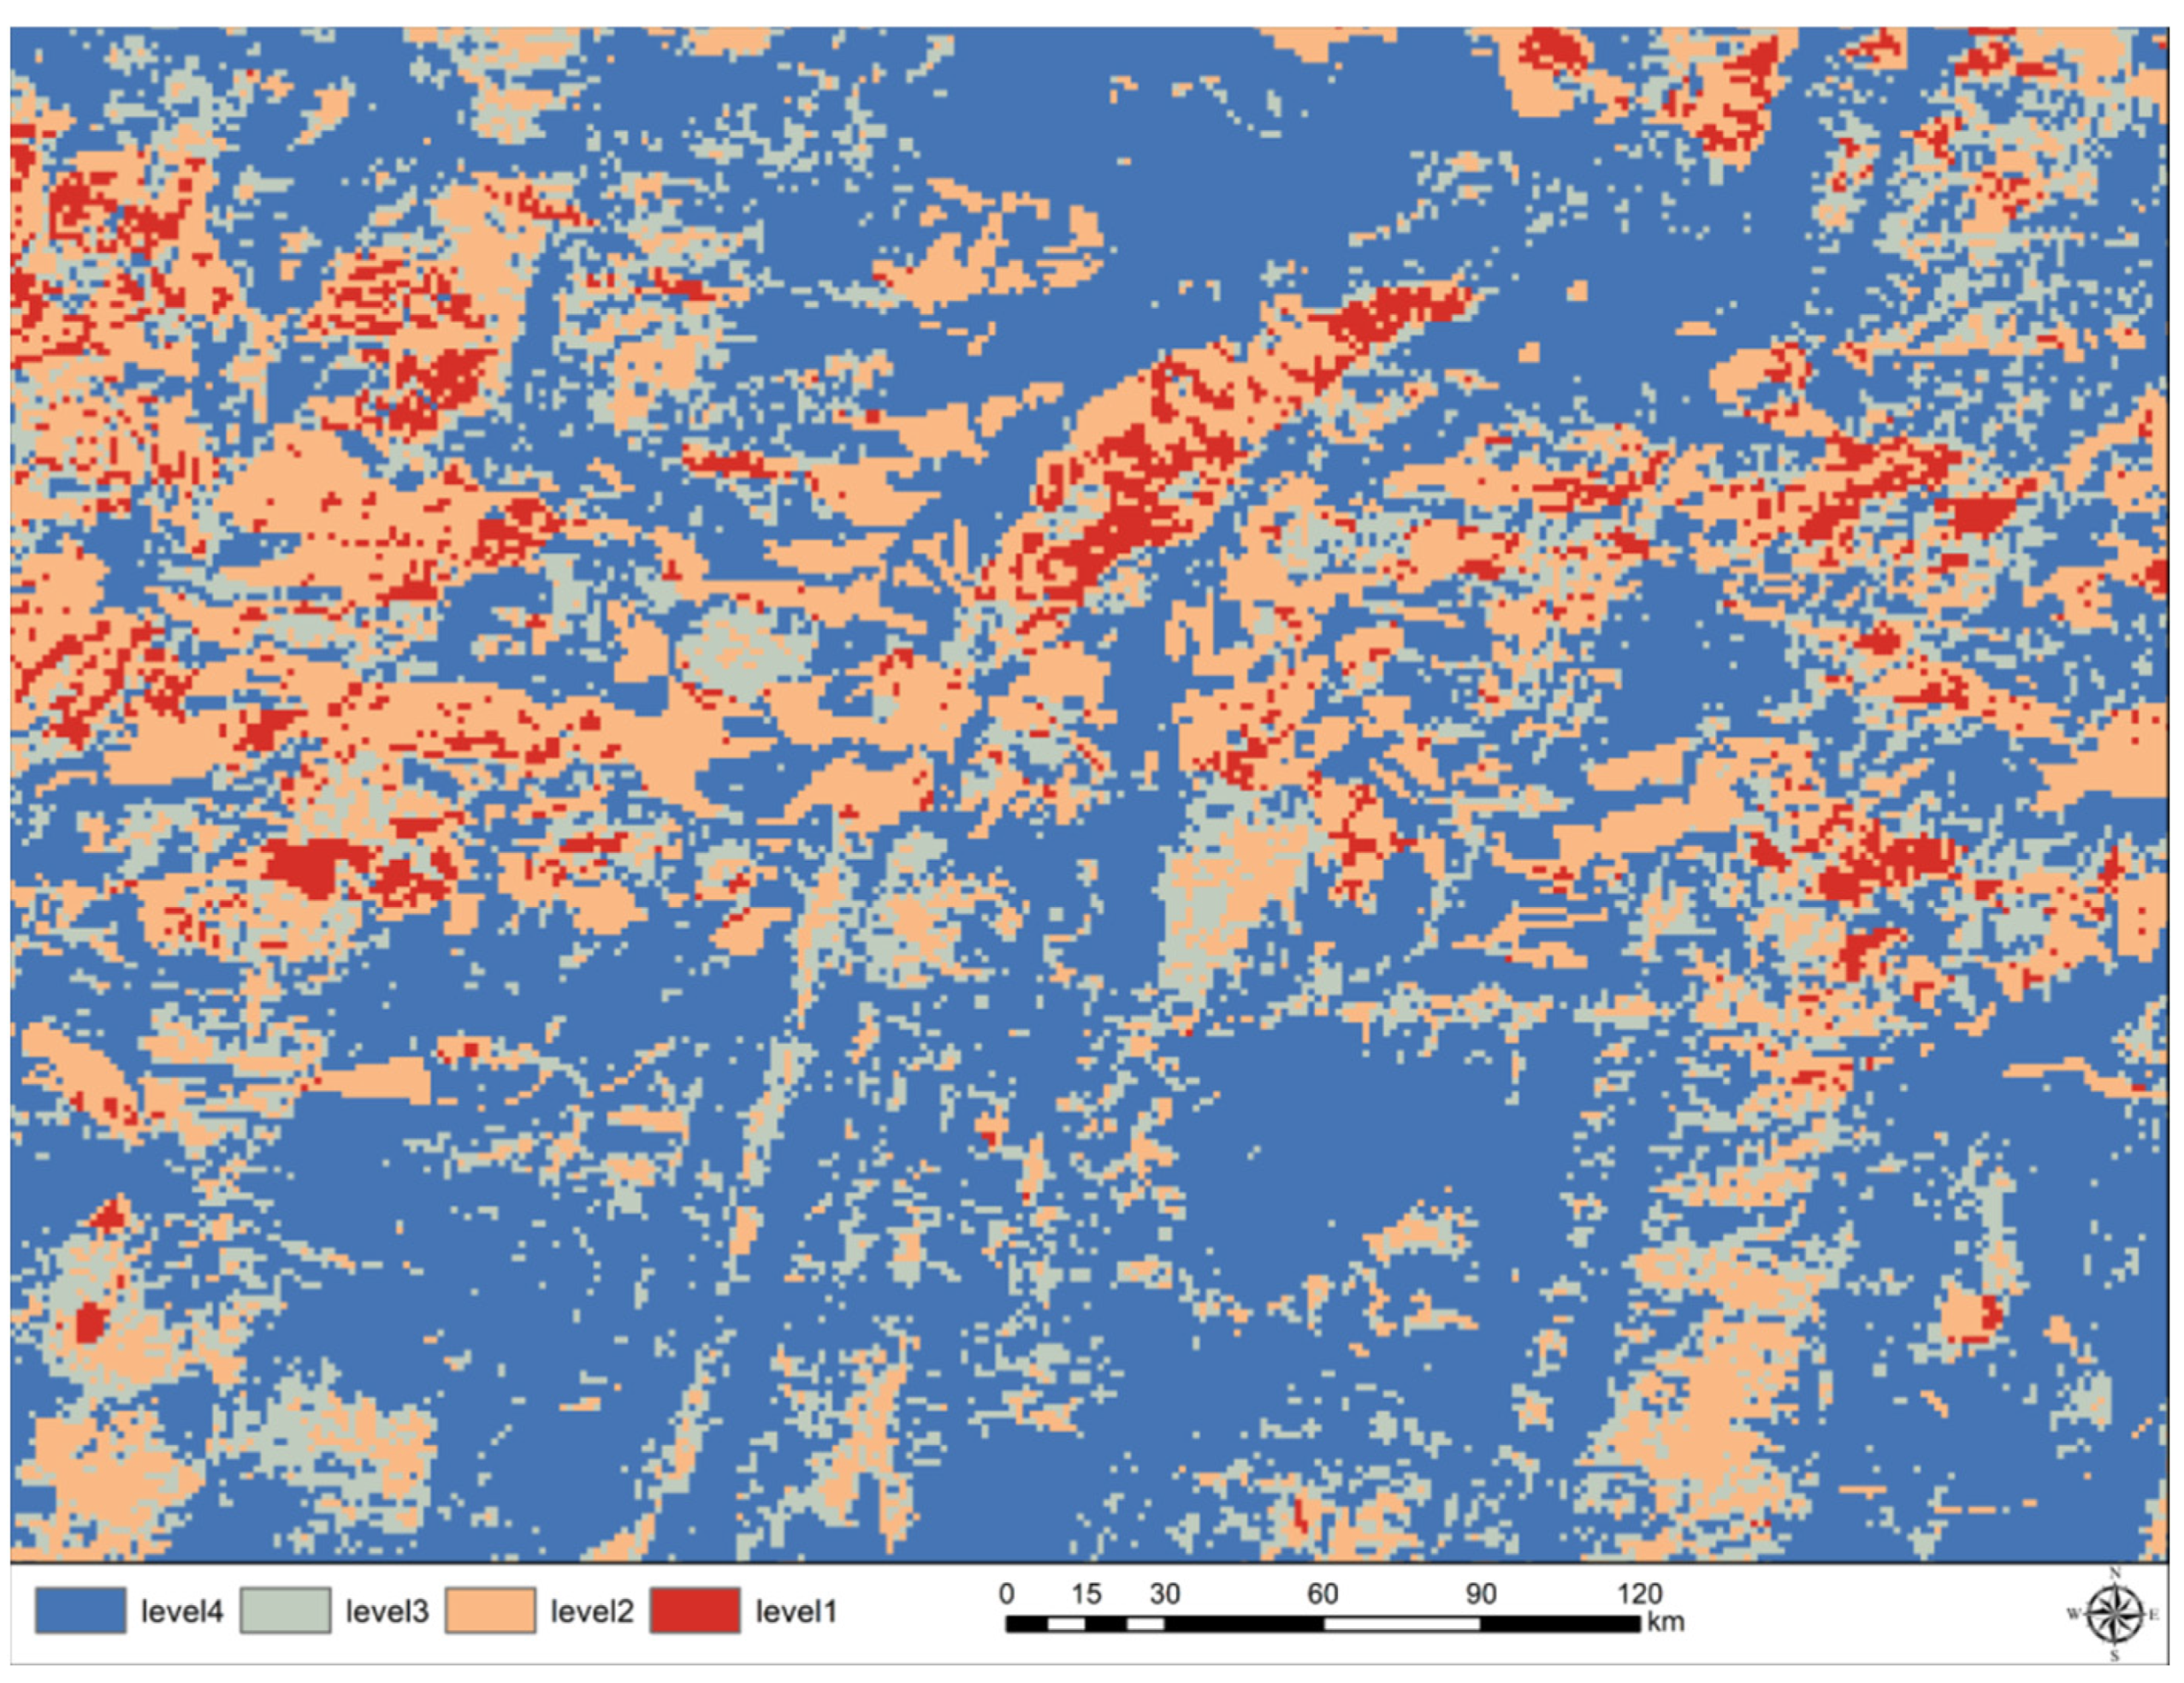
3.2.2. Alteration Interpolation

In this section, the etching results were graded according to intensity based on the previous etching results, following a threshold segmentation method that preserves a quarter of the standard deviation of the degree of etching in Figure 9. The graded results of the etch information were interpolated using empirical Bayesian kriging as a semi-variate function of the thin-slab spline function to obtain Figure 10.
In comparison, Figure 10 exhibits a more pronounced spatial continuity compared to Figure 6, indicating a qualitative analysis of subsurface geological alteration information. Enhanced by the interpolation method, a more pronounced spatial clustering feature of the alteration results was obtained, which provides a solid basis for the design of the copper mining evaluation below. Similar to the surface outcrop mentioned previously, the interpolation results have the advantage of providing a qualitative understanding of deeper alteration information, thus reflecting to some extent the degree of mineral enrichment within the formation. As previously mentioned, these significant spatial clustering phenomena represent the basis for industrial copper mining. Integration of the spatial clustering of lithological and alteration information is necessary in subsequent evaluations. Based on mineralization dynamics considerations, this information plays an important role in the porphyry copper mineralization process.

3.3. Integrated Copper Anomaly Monitoring Model

With the previous treatment of lithology and alteration, this study will evaluate the mining of porphyry copper ores in the study area by integrating lithology–alteration–tectonic multi-source geological elements. Lithological data related to the formation and development of porphyry copper ores classified by SVM, alteration information extracted and interpolated by the EPCA method, and kernel density analysis of the fold zones in the study area are used to obtain the tectonic network. In addition, NDVI, land use data, and DEM data related to copper values were also considered in the evaluation model. The evaluation model for porphyry copper in the study area was obtained by performing Pearson correlation analysis on the 107 different levels of copper occurrences obtained to obtain the weights of each element and by superimposing them using the weight of evidence method. Table 2 provides the various types of data used to build the model as well as the weights of evidence.
Lithology has an important influence on the formation and distribution of copper ores. Some stratigraphic rocks may be enriched in minerals that form copper deposits, such as copper sulfides. Different bodies may have different physical and chemical properties, which affect the processes of mineral dissolution, migration, and deposition and hence the formation and enrichment of copper ores. During the formation of copper ores, hydrothermal fluids and fluids typically interact with the surrounding rocks, resulting in an alteration of the surrounding rocks. These alterations can alter the chemistry of the surrounding rocks and increase the solubility of minerals, thereby facilitating the formation and enrichment of copper minerals. Fracture zones can provide access and space for mineral transport, facilitating the transport and deposition of hydrothermal fluids and fluids. Fracture zones are often used as one of the main controls on deposit formation in copper ores, contributing to mineral accumulation and enrichment through fractures that bring about rupture, deformation, and rock interaction. The DEM provides detailed information on surface topography, including height, slope, and aspect. In copper exploration and mining, DEM can be used to identify potential deposit areas, as some deposits have specific geomorphic features. DEM data can help to determine the relationship between surface morphology and copper formation; for example, topographic features such as mountains, rivers, and valleys may be relevant to the distribution of copper ores. NDVI is primarily associated with vegetation and may provide clues to copper mineralization and alteration. In some areas, vegetation may grow on rocks containing copper minerals, and vegetation absorbs dissolved copper ions from groundwater through the root system, which in turn promotes copper enrichment. Land use may also be associated with the development and extraction of copper ores. The extraction of mineral resources may lead to land use transformations, such as the construction of mine sites and the occupation and degradation of land by mining activities. At the same time, inappropriate mine management and deposit extraction may hurt the surrounding land ecosystem.
In summary, copper development and mining are influenced by a variety of factors, including stratigraphic rock masses, surrounding rock alterations, fracture zones, DEM data, NDVI data, and land use, all of which have an impact on the assessment of copper mining and on the landscape and ecosystem. An analysis of Table 2 shows that the three elements of lithology-alteration-tectonic have a high correlation on copper mineralization and industrial mining, with alteration being the strongest and showing a positive correlation, while lithology and tectonic zones show a negative correlation.
Combining the contents of Table 2, we superimposed all elements according to their corresponding weights and reclassified the results according to a threshold split into four grades (Figure 11). Of these, rank 1 represents the highest copper mining evaluation index and the area where industrial mining is most likely to exist, and as the rank increases, this index decreases, indicating a smaller copper mining evaluation index.
It can be noted through Figure 11 that the spatial clustering of Grade 1 and Grade 2 is more concentrated, which is highly informative for the next step of field surveys, while appropriate field probing acquires new data that can be used to refine the values of the weight of evidence, making the copper mining evaluation model more accurate, which is a positive feedback.

4. Discussion

The detection and exploitation of minerals in remote areas is a very valuable research topic. Due to the vast area and remote location, similar to the study area of this paper, the whole area of the Gondwana mineralization belt, which is located on the Himalayan tectonic belt, is not revealed by field exploration. To address this problem, traditional geological studies have tended to isolate lithological, alteration, and tectonic elements, but this study builds on previous work by integrating lithological–alteration–tectonic multi-source geological elements to conduct a mineral recoverability evaluation study.
The study aims to detect geological anomalies associated with the formation and development of porphyry copper ores. To achieve this, the study employs a variety of elements associated with copper mineralization and development, including SVM classification of lithology data, extraction and hierarchical interpolation of EPCA methods, kernel density of folded zones, and DEM, NDVI, and land use data associated with copper mining. The study also considered factors for successful mining in actual mine construction and potential copper mining areas. To improve the accuracy of the evaluation model, the study integrated as many different datasets as possible and took into account copper mineralization, development, mining difficulty, and actual conditions. The results fill a gap in the field of monitoring and evaluation of porphyry copper ores in a large study area and provide an important reference for further research in related fields.
To validate the results of the EPCA and traditional Crosta methods for extracting alteration information, a local grid of 100 km × 100 km in the study area was selected for statistical analysis of both methods (Figure 12). The results show that the percentage of the total map area extracted by the EPCA method is 9.42%, 15.28%, and 12.70% for Fe, Al, and Mg hydroxyl alteration information, respectively, while the percentage of the results extracted by the Crosta method is 6.11%, 9.09%, and 9.14%, respectively, within the selected area. It can be seen that EPCA outperforms the traditional Crotsa method in terms of spatial aggregation and the importance of change detection. Therefore, this method is chosen as the extraction method of alteration information in the above model building process in this study, which can enhance the results to a certain extent and provide good data support for the establishment and application of copper ore evaluation models.
In the extraction of alteration information from EPCA, this study carried out the extraction of three different alteration results for each of the 93 images of the study area. Two hundred and seventy-nine tables of principal component contributions were obtained in the process, which are not all listed in this study for space reasons, and only the relevant parameters of one image are shown for reference only (Table 3, Table 4 and Table 5).
Using the variance explanation ratio, the feature extraction layers were selected separately for them, and the proportion of corresponding eigenvalues for each principal component was calculated and arranged in descending order to select the principal component with a higher variance explanation ratio. Combined with Table 3, it can be seen that this matrix has the highest proportion of variance explained by PC1, at 62.56%. Therefore, the layer corresponding to PC1 should be selected as the iron-stained alteration feature extraction layer. Similarly, PC1 (74.79%) and PC3 (93.17%) should be selected as the feature extraction layers for aluminum and magnesium hydroxyl alterations, respectively.
By establishing a copper ore assessment model, we are able to evaluate the distribution and potential of potential copper resources in a hierarchical manner. Various geological factors and related elements considered in the model, such as NDVI, land use data, and DEM data, are assigned appropriate weights. By utilizing the evidence weight method, we can combine these factors to generate a comprehensive evaluation result. Such an evaluation result provides scientific references and guidance for copper exploration, significantly narrowing down the search area and enabling accurate targeted manual exploration and large-scale mechanized mining in the future. The analysis of comprehensive geological elements helps identify potential areas of copper mineralization and provides valuable information for decision making and planning in the mineral resource development and management departments, optimizing resource utilization, reducing exploration risks, and improving exploration efficiency.
The results of this study have important significance and broad application prospects. Integrating multi-source geological factors to establish a copper ore evaluation model provides a new method and tool for the stratified evaluation and exploration decision of copper resources, which has important practical value for mineral resource development and management. It can also provide references for research and application in other geological fields, such as the evaluation of other metal deposits, mineral resource management, and environmental protection.
However, this study also has some potential limitations and room for improvement. Firstly, the development of the copper ore evaluation model still requires more validation and verification datasets to further enhance the accuracy and robustness of the model. Secondly, the selection and weight allocation of geological factors in the model (Table 2) needs further research and optimization to ensure the comprehensiveness and reliability of the model. Additionally, the implementation of the model may be constrained by data collection and processing, requiring overcoming challenges in the quality and spatial resolution of remote sensing and geological data. For example, in Figure 9 and Figure 10, noticeable distortions and striped interference caused by the quality of ASTER remote sensing data significantly affect the accuracy of the results.
Of course, the content such as the influencing factors and weights of the model has been adjusted according to the specific conditions in the Gondwana region. For example, considering its unique geographical location, this study assigns a certain proportion of negative weights to the high-altitude areas displayed in the DEM, based on relevant information. However, adjustments can be made in modeling for non-high-altitude areas. Additionally, due to the overall poor transportation conditions in the Tibet region, this study did not incorporate road network datasets into the modeling. However, in more developed areas of mineral extraction, the road network needs to be included as an important influencing factor in the model, as it has a significant impact on mineral extraction and transportation.

5. Conclusions

The accurate location and effective development of porphyry copper deposits are critical to the mining industry. Such deposits have great economic potential, but their complexity and diversity make them challenging to locate and mine. This study evaluates the mining evaluation of porphyry copper deposits in the Gondwana mineralized belt by integrating geological elements such as lithology, alteration, and tectonics.
The Gondwana mineralized belt was selected as the study area. The support vector machine (SVM) method was used to extract the lithological distribution of the study area. Compared to other methods, SVM showed higher accuracy with an overall classification accuracy of 97.6573% and a kappa coefficient of 0.9806. In addition, an enhanced principal component analysis (EPCA) method with spectral features was combined with ASTER images to extract alteration information. A stratified alteration interpolation method based on empirical Bayesian kriging is proposed to overcome the limitation of the traditional method, which stays in surface alteration information extraction and realizes the qualitative extension of alteration information in the deeper part of the stratum. Finally, by integrating a number of geological elements affecting copper mineralization and mining and combining them with a correlation analysis of currently proven or mined copper deposits, a porphyry copper mining evaluation model was developed and overlaid using a weighted evidence method. The results of the study classify the study area into four mining evaluation classes, which are important in determining the location and subsequent development of potential copper mineralization, as well as contributing to an in-depth understanding of how multi-source geological elements act on the copper mineralization and mining process.

Author Contributions

Conceptualization, C.L.; Formal analysis, X.L. and J.F.; Funding acquisition, S.W. and C.Q.; Investigation, M.H.; Methodology, C.L.; Project administration, S.W. and C.Q.; Software, C.L. and L.W.; Validation, L.W. and J.F.; Visualization, M.H.; Writing—original draft, C.L. and X.L.; Writing—review and editing, S.W. and C.Q. All authors have read and agreed to the published version of the manuscript.

Funding

This work was supported by the National Key Research and Development Program of China (no. 2021YFB3900900) and the Provincial Key R&D Program of Zhejiang (no. 2021C01031).

Data Availability Statement

Not applicable.

Acknowledgments

This paper is supported by the Deep-time Digital Earth (DDE) Big Science Program. Thanks are given to Cui Xin et al., from the College of Chemistry and Chemical Engineering of Xi’an University of Science and Technology, for help with the infrared spectroscopic determination of the minerals in this thesis. Thanks are also given to the Chengdu Institute of Geology and Mineral Resources for providing the geological and mineral map of the Tibetan Gondwana mineralization belt.

Conflicts of Interest

The authors declare no conflict of interest.

References

  1. Atienza, M.; Lufin, M.; Soto, J. Mining linkages in the Chilean copper supply network and regional economic development. Resour. Policy 2021, 70, 101154. [Google Scholar] [CrossRef]
  2. Moreau, K.; Laamanen, C.; Bose, R.; Shang, H.; Scott, J. Environmental impact improvements due to introducing automation into underground copper mines. Int. J. Min. Sci. Technol. 2021, 31, 1159–1167. [Google Scholar] [CrossRef]
  3. Yousefi, M.; Kreuzer, O.P.; Nykänen, V.; Hronsky, J. Exploration information systems–A proposal for the future use of GIS in mineral exploration targeting. Ore Geol. Rev. 2019, 111, 103005. [Google Scholar] [CrossRef]
  4. Kay, M.; Dimitrakopoulos, R. Integrated interpolation methods for geophysical data: Applications to mineral exploration. Nat. Resour. Res. 2000, 9, 53–64. [Google Scholar] [CrossRef]
  5. Salem, S.M.; Arafa, S.A.; Ramadan, T.M.; Gammal, E. Exploration of copper deposits in Wadi El Regeita area, Southern Sinai, Egypt, with contribution of remote sensing and geophysical data. Arab. J. Geosci. 2013, 6, 321–335. [Google Scholar] [CrossRef]
  6. Ranjbar, H.; Shahriari, H.; Honarmand, M. Integration of ASTER and airborne geophysical data for exploration of copper mineralization. A case study of Sar Cheshmeh area. In Proceedings of the 20th Congress, International Society for Photogrammetry and Remote Sensing, Istanbul, Turkey, 12–23 July 2004; pp. 12–13. [Google Scholar]
  7. Mohebi, A.; Mirnejad, H.; Lentz, D.; Behzadi, M.; Dolati, A.; Kani, A.; Taghizadeh, H. Controls on porphyry Cu mineralization around Hanza Mountain, south-east of Iran: An analysis of structural evolution from remote sensing, geophysical, geochemical and geological data. Ore Geol. Rev. 2015, 69, 187–198. [Google Scholar] [CrossRef]
  8. Pan, D.; Xu, Z.; Lu, X.; Zhou, L.; Li, H. 3D scene and geological modeling using integrated multi-source spatial data: Methodology, challenges, and suggestions. Tunn. Undergr. Space Technol. 2020, 100, 103393. [Google Scholar] [CrossRef]
  9. Wang, B.; Wu, L.; Li, W.; Qiu, Q.; Zhong, X.; Hao, L.; Yuan, Z. A semi-automatic approach for generating geological profiles by integrating multi-source data. Ore Geol. Rev. 2021, 134, 104190. [Google Scholar] [CrossRef]
  10. Wang, G.; Ma, Z.; Li, R.; Song, Y.; Yan, C.; Qu, J.; Zhang, S. Integration of multi-source and multi-scale datasets for 3D structural modeling for subsurface exploration targeting, Luanchuan Mo-polymetallic district, China. J. Appl. Geophys. 2017, 139, 269–290. [Google Scholar] [CrossRef]
  11. Shirmard, H.; Farahbakhsh, E.; Müller, R.D.; Chandra, R. A review of machine learning in processing remote sensing data for mineral exploration. Remote Sens. Environ. 2022, 268, 112750. [Google Scholar] [CrossRef]
  12. Dumakor-Dupey, N.K.; Arya, S. Machine Learning—A Review of Applications in Mineral Resource Estimation. Energies 2021, 14, 4079. [Google Scholar] [CrossRef]
  13. Sun, T.; Li, H.; Wu, K.; Chen, F.; Hu, Z. Data-driven predictive modelling of mineral prospectivity using machine learning and deep learning methods: A case study from southern Jiangxi Province, China. Minerals 2020, 10, 102. [Google Scholar] [CrossRef] [Green Version]
  14. Das, S. Delineation of groundwater potential zone in hard rock terrain in Gangajalghati block, Bankura district, India using remote sensing and GIS techniques. Model. Earth Syst. Environ. 2017, 3, 1589–1599. [Google Scholar] [CrossRef] [Green Version]
  15. Huang, A.; Shen, R.; Li, Y.; Han, H.; Di, W.; Hagan, D. A methodology to generate integrated land cover data for land surface model by improving Dempster-Shafer theory. Remote Sens. 2022, 14, 972. [Google Scholar] [CrossRef]
  16. Wang, Z.; Di, H.; Shafiq, M.A.; Yazeed, A.; Ghassan, A.R. Successful leveraging of image processing and machine learning in seismic structural interpretation: A review. Lead. Edge 2018, 37, 451–461. [Google Scholar] [CrossRef]
  17. Zhu, A.X.; Wang, R.; Qiao, J.; Qin, C.; Chen, Y.; Jing, L.; Fei, D.; Yang, L.; Zhu, T. An expert knowledge-based approach to landslide susceptibility mapping using GIS and fuzzy logic. Geomorphology 2014, 214, 128–138. [Google Scholar] [CrossRef]
  18. Searle, M.P.; Windley, B.F.; Coward, M.P.; Herren, E.; Rex, A.; Colchen, M. The closing of Tethys and the tectonics of the Himalaya. Geol. Soc. Am. Bull. 1987, 98, 678–701. [Google Scholar] [CrossRef]
  19. Wang, Y.; Zhou, L.; Gao, S.; Li, J.; Hu, Z.; Yang, L.; Hu, Z. Variation of molybdenum isotopes in molybdenite from porphyry and vein Mo deposits in the Gangdese metallogenic belt, Tibetan plateau and its implications. Miner. Depos. 2016, 51, 201–210. [Google Scholar] [CrossRef]
  20. Tafti, R.; Mortensen, J.K.; Lang, J.R.; Rebagliati, M.; Oliver, J.L. Jurassic U-Pb and Re-Os ages for the newly discovered Xietongmen Cu-Au porphyry district, Tibet, PRC: Implications for metallogenic epochs in the southern Gangdese belt. Econ. Geol. 2009, 104, 127–136. [Google Scholar] [CrossRef]
  21. Sheng, Y.; Jin, S.; Comeau, M.J.; Becken, M.; Zhang, L.; Dong, H.; Wei, W.; Ye, G. Controls on the metallogenesis of the Lhasa–Mozugongka district, Gangdese Belt, Tibetan Plateau: Constraints on melt distribution and viscosity from the 3-D electrical structure of the lithosphere. Ore Geol. Rev. 2022, 145, 104881. [Google Scholar] [CrossRef]
  22. Searle Michael, P.; Roberts, M.W.; Chung, S.; Lee, Y.; Li, K. Age and anatomy of the Gongga Shan batholith, eastern Tibetan Plateau, and its relationship to the active Xianshui-he fault. Geosphere 2016, 12, 948–970. [Google Scholar] [CrossRef] [Green Version]
  23. Pour; Beiranvand, A.; Hashim, M.; Park, Y. Gondwana-Derived Terranes structural mapping using PALSAR remote sensing data. J. Indian Soc. Remote Sens. 2018, 46, 249–262. [Google Scholar] [CrossRef]
  24. Zaw, K.; Meffre, S.; Lai, C.K.; Clive.; Burrett.; Santosh, M. Tectonics and metallogeny of mainland Southeast Asia—A review and contribution. Gondwana Res. 2014, 26, 5–30. [Google Scholar]
  25. Kamona, A.F.; Günzel, A. Stratigraphy and base metal mineralization in the Otavi Mountain Land, Northern Namibia—A review and regional interpretation. Gondwana Res. 2007, 11, 396–413. [Google Scholar] [CrossRef]
  26. Toutin, T. ASTER DEMs for geomatic and geoscientific applications: A review. Int. J. Remote Sens. 2008, 29, 1855–1875. [Google Scholar] [CrossRef] [Green Version]
  27. Gabr, S.; Ghulam, A.; Kusky, T. Detecting areas of high-potential gold mineralization using ASTER data. Ore Geol. Rev. 2010, 38, 59–69. [Google Scholar] [CrossRef]
  28. Chen, Q.; Zhao, Z.; Zhou, J.; Zhu, R.; Xia, J.; Sun, T.; Zhao, X.; Chao, J. ASTER and GF-5 satellite data for mapping hydrothermal alteration minerals in the longtoushan Pb-Zn deposit, SW China. Remote Sens. 2022, 14, 1253. [Google Scholar] [CrossRef]
  29. Hearst, M.A.; Dumais, S.T.; Osuna, E.; Platt, J.; Schoikopf, B. Support vector machines. IEEE Intell. Syst. Appl. 1998, 13, 18–28. [Google Scholar] [CrossRef] [Green Version]
  30. Kecman, V. Support vector machines–an introduction. In Support Vector Machines: Theory and Applications; Springer: Berlin, Heidelberg, 2005; pp. 1–47. [Google Scholar]
  31. Feng, W.; Sun, J.; Zhang, L.; Cao, C.L.; Yang, Q. A support vector machine based naive Bayes algorithm for spam filtering. In Proceedings of the 2016 IEEE 35th International Performance Computing and Communications Conference (IPCCC), Las Vegas, NV, USA, 9–11 December 2016; IEEE: New York City, NY, USA, 2016; pp. 1–8. [Google Scholar]
  32. Somvanshi, M.; Chavan, P.; Tambade, S.; Shinde, S.V. A review of machine learning techniques using decision tree and support vector machine. In Proceedings of the 2016 International Conference on Computing Communication Control and Automation (ICCUBEA), Pune, India, 12–13 August 2016; IEEE: New York City, NY, USA, 2016; pp. 1–7. [Google Scholar]
  33. Yu, L.; Porwal, A.; Holden, E.J.; Cao, C.; Yang, Q. Towards automatic lithological classification from remote sensing data using support vector machines. Comput. Geosci. 2012, 45, 229–239. [Google Scholar] [CrossRef]
  34. Demir, S.; Şahin, E.K. Liquefaction prediction with robust machine learning algorithms (SVM, RF, and XGBoost) supported by genetic algorithm-based feature selection and parameter optimization from the perspective of data processing. Environ. Earth Sci. 2022, 81, 459. [Google Scholar] [CrossRef]
  35. Dias Canedo, E.; Cordeiro Mendes, B. Software requirements classification using machine learning algorithms. Entropy 2020, 22, 1057. [Google Scholar] [CrossRef]
  36. Abbaszadeh, M.; Hezarkhani, A.; Soltani-Mohammadi, S. An SVM-based machine learning method for the separation of alteration zones in Sungun porphyry copper deposit. Geochemistry 2013, 73, 545–554. [Google Scholar] [CrossRef]
  37. Yousefi, M.; Tabatabaei, S.H.; Rikhtehgaran, R.; Pour, A.; Pradhan, B. Application of Dirichlet process and support vector machine techniques for mapping alteration zones associated with porphyry copper deposit using ASTER remote sensing imagery. Minerals 2021, 11, 1235. [Google Scholar] [CrossRef]
  38. Mohammadi, N.M.; Hezarkhani, A. Application of support vector machine for the separation of mineralised zones in the Takht-e-Gonbad porphyry deposit, SE Iran. J. Afr. Earth Sci. 2018, 143, 301–308. [Google Scholar] [CrossRef]
  39. Salimi, A.; Ziaii, M.; Amiri, A.; Hosseinjanizadeh, M.; Karimpouli, S.; Moradkhani, M. Using a Feature Subset Selection method and Support Vector Machine to address curse of dimensionality and redundancy in Hyperion hyperspectral data classification. Egypt. J. Remote Sens. Space Sci. 2018, 21, 27–36. [Google Scholar] [CrossRef]
  40. Kaplan, U.E.; Topal, E. A new ore grade estimation using combine machine learning algorithms. Minerals 2020, 10, 847. [Google Scholar] [CrossRef]
  41. Mao, J.; Zheng, W.; Xie, G.; Lehmann, B.; Goldfarb, R. Recognition of a Middle–Late Jurassic arc-related porphyry copper belt along the southeast China coast: Geological characteristics and metallogenic implications. Geology 2021, 49, 592–596. [Google Scholar] [CrossRef]
  42. Liu, C.; Qiu, C.; Wang, L.; Feng, J.; Wu, S.; Wang, Y. Application of ASTER Remote Sensing Data to Porphyry Copper Exploration in the Gondwana Region. Minerals 2023, 13, 501. [Google Scholar] [CrossRef]
  43. Zhang, X.; Pazner, M.; Duke, N. Lithologic and mineral information extraction for gold exploration using ASTER data in the south Chocolate Mountains (California). ISPRS J. Photogramm. Remote Sens. 2007, 62, 271–282. [Google Scholar] [CrossRef]
  44. Fang, C.; Xu, B.; Hu, F.; Chen, X.; Liu, Y. Cu-polymetallic Deposit Prognosis in the Banggonghu-Nujiang Metallogenic Belt Based on ASTER Remote Sensing Alterration Information Extraction. Resour. Environ. Eng. 2016, 68, 65–82. [Google Scholar]
  45. Dodick, J.; Orion, N. Cognitive factors affecting student understanding of geologic time. J. Res. Sci. Teach. Off. J. Natl. Assoc. Res. Sci. Teach. 2003, 40, 415–442. [Google Scholar] [CrossRef]
  46. Laubach, S.E.; Lander, R.H.; Criscenti, L.J.; Urai, L.; Pollyea, J.; Hooker, R.; Narr, J.; Evans, W.; Kerisit, M.; Olson, S.; et al. The role of chemistry in fracture pattern development and opportunities to advance interpretations of geological materials. Rev. Geophys. 2019, 57, 1065–1111. [Google Scholar] [CrossRef] [Green Version]
  47. Dolphin, G.; Dutchak, A.; Karchewski, B.; Copper, J. Virtual field experiences in introductory geology: Addressing a capacity problem, but finding a pedagogical one. J. Geosci. Educ. 2019, 67, 114–130. [Google Scholar] [CrossRef] [Green Version]
  48. Rajesh, H.M. Application of remote sensing and GIS in mineral resource mapping-An overview. J. Mineral. Petrol. Sci. 2004, 99, 83–103. [Google Scholar] [CrossRef] [Green Version]
  49. Gribov, A.; Krivoruchko, K. Empirical Bayesian kriging implementation and usage. Sci. Total Environ. 2020, 722, 137290. [Google Scholar] [CrossRef]
  50. Senoro, D.B.; de Jesus KL, M.; Mendoza, L.C.; Apostol, E.; Escalona, K.; Chan, E. Groundwater quality monitoring using in-situ measurements and hybrid machine learning with empirical Bayesian kriging interpolation method. Appl. Sci. 2022, 12, 132. [Google Scholar] [CrossRef]
  51. Li, Z.; Tao, H.; Zhao, D.; Li, H. Three-dimensional empirical Bayesian kriging for soil PAHs interpolation considering the vertical soil lithology. Catena 2022, 212, 106098. [Google Scholar] [CrossRef]
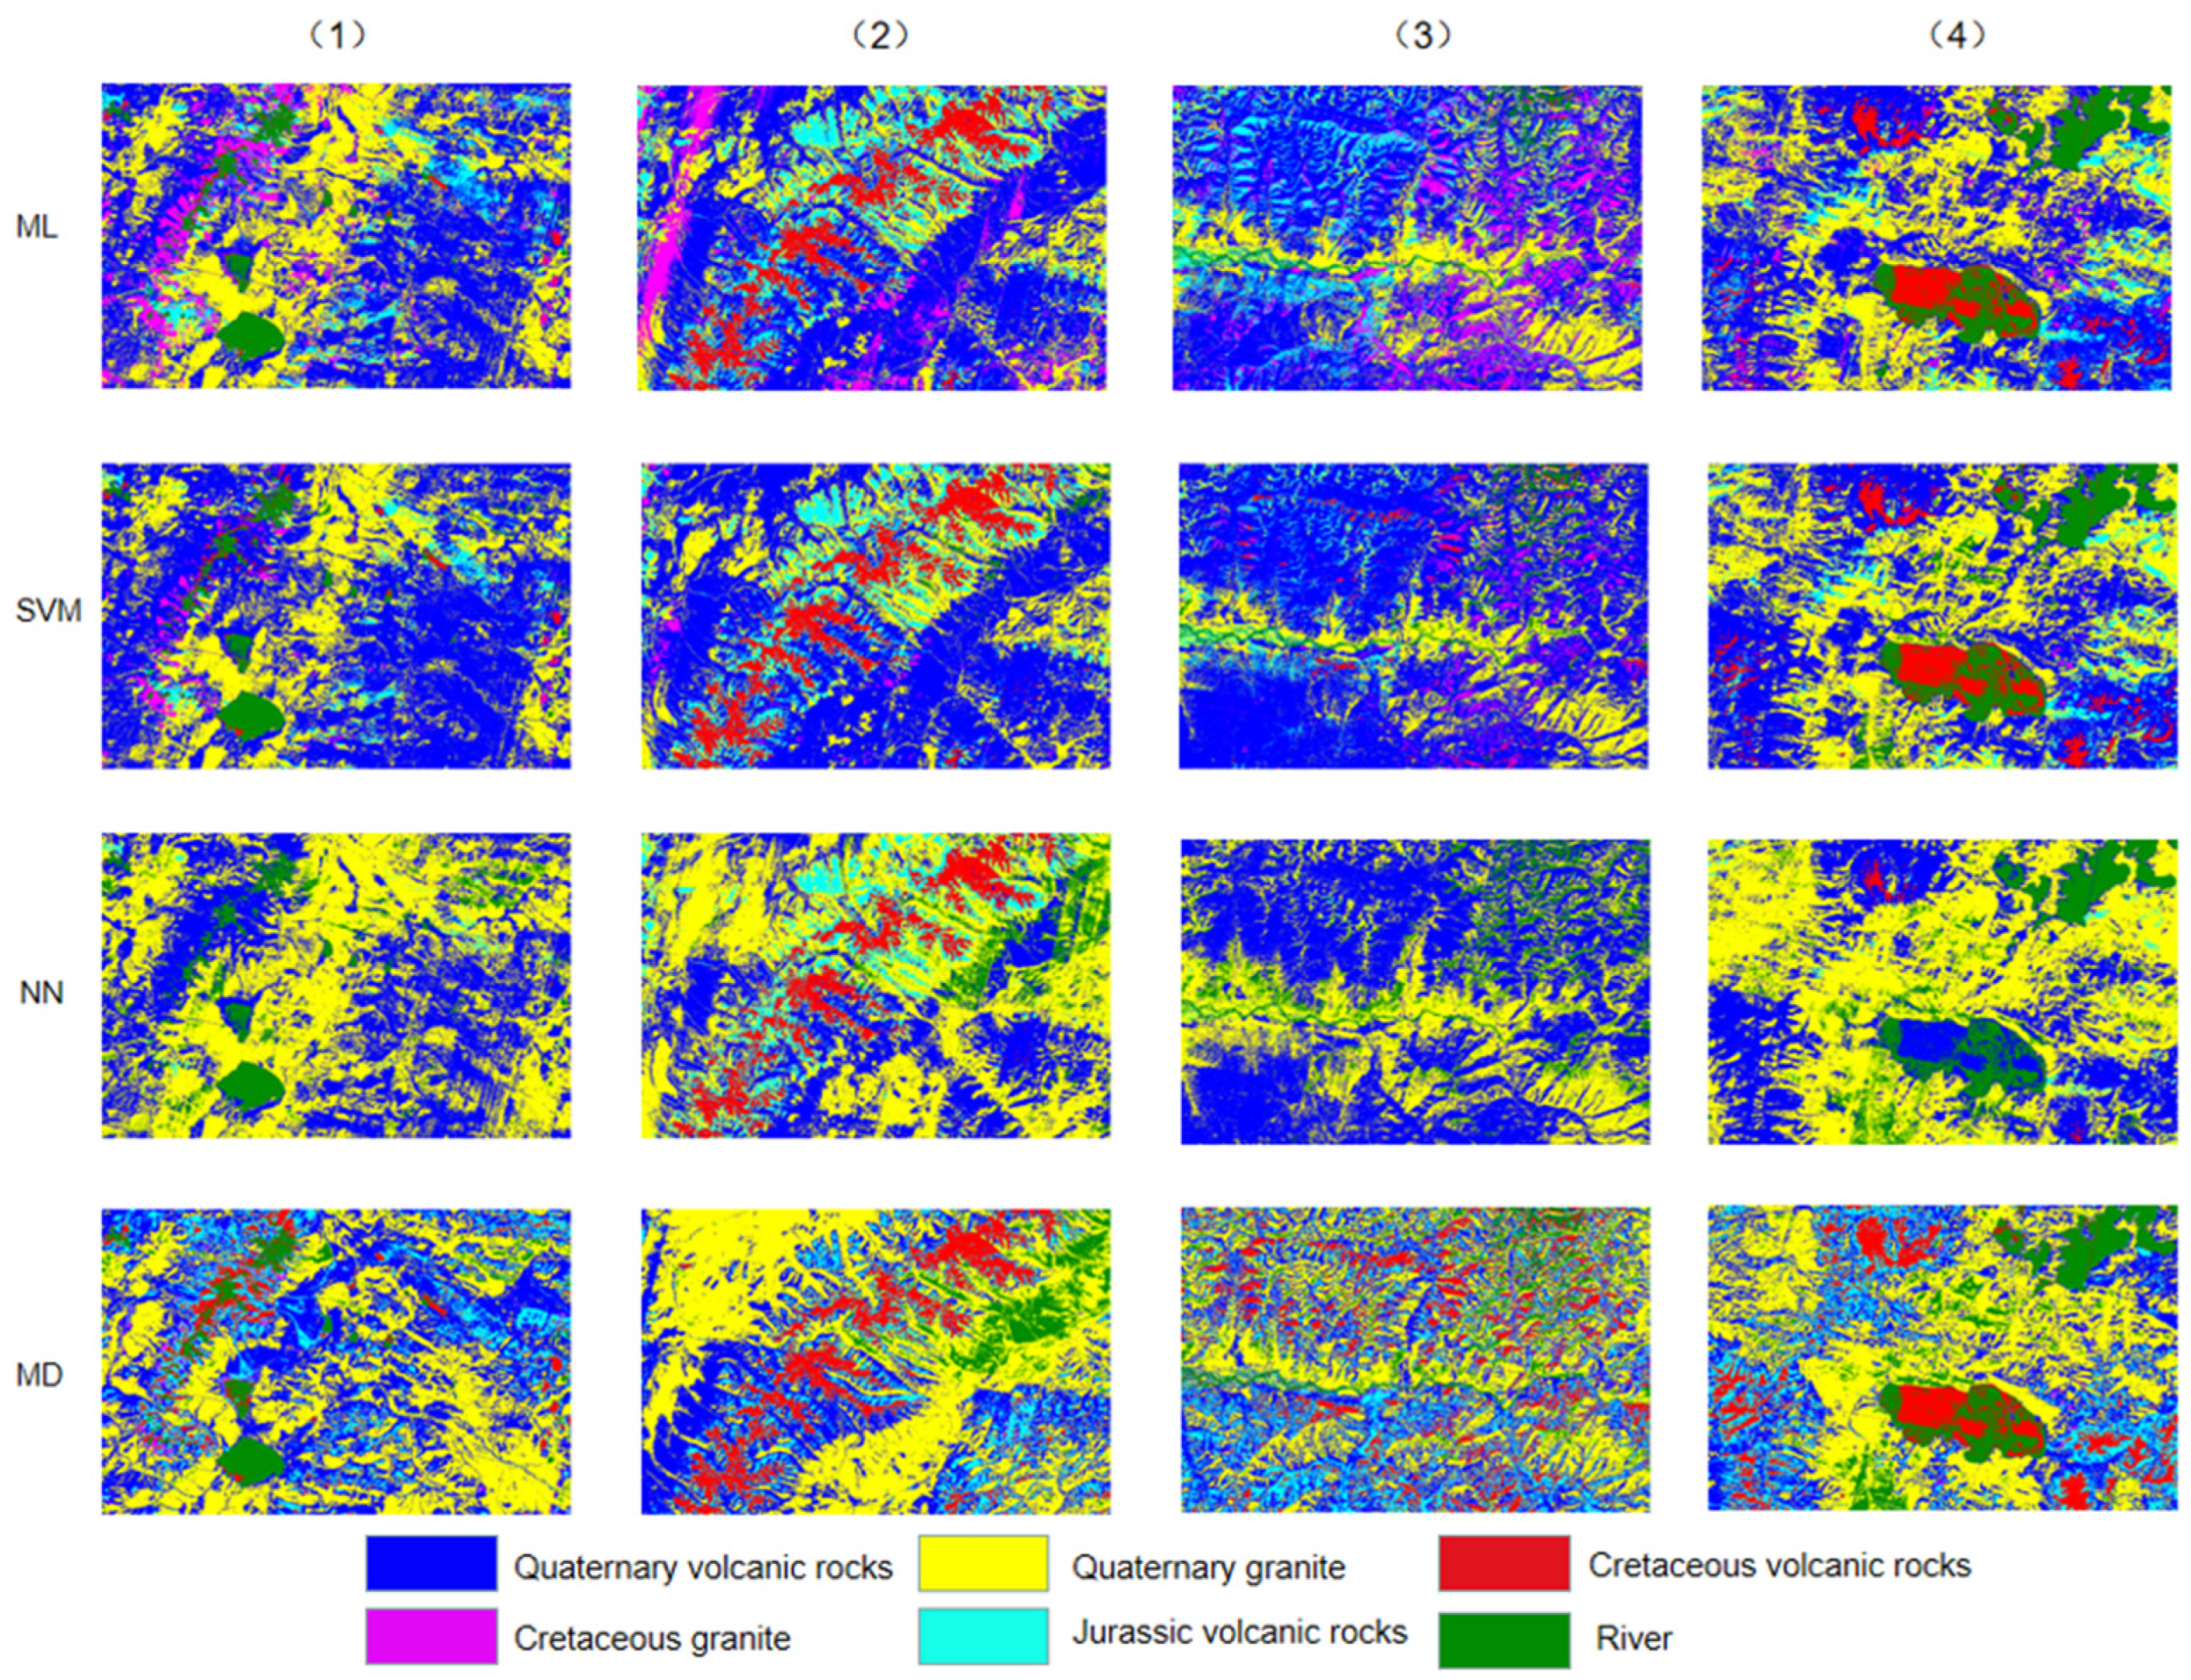
Figure 1. Lithology–alteration–tectonic geological model of copper mineralization in the Gondwana region.
Minerals 13 00858 g001
Figure 2. Flow diagram of SVM classification of study area lithology.
Minerals 13 00858 g002
Figure 3. Location and geologic map of the Gondwana mineralization.
Minerals 13 00858 g003
Figure 4. Visual comparison of the results of the four classification methods.
Minerals 13 00858 g004
Figure 5. Visual comparison of the results of the four classification methods.
Minerals 13 00858 g005
Figure 6. Results of the EPCA method for extracting iron-stained alteration information.
Minerals 13 00858 g006
Figure 7. Results of the EPCA method for extracting aluminum hydroxyl alteration information.
Minerals 13 00858 g007
Figure 8. Results of the EPCA method for extracting magnesium hydroxyl alteration information.
Minerals 13 00858 g008
Figure 9. EPCA method for extracting alteration information from the study area.
Minerals 13 00858 g009
Figure 10. Interpolated alteration.
Minerals 13 00858 g010
Figure 11. Study area porphyry copper mining evaluation model.
Minerals 13 00858 g011
Figure 12. Comparison of the EPCA and Crosta methods for the extraction of three types of alteration information.
Minerals 13 00858 g012
Table 1. Comparison of the accuracy of the results of the classification methods.
Classification MethodOverall Classification AccuracyKappa CoefficientCalculation Time
Maximum Likelihood96.5717%0.94833 s
Support vector machines97.6573%0.980650 s
Neural Networks93.9738%0.889120 s
Minimum Distance91.9555%0.77973 s
Table 2. Multi-source geological element modeling information.
Target LayerGuideline LayerIndicator Layer
Weight of EvidenceImpact Factor
Combined mineralization predictionsAssociated with copper mineralization Geological information−0.165347Lithology
0.435802Hydrothermal alteration
Constructed information−0.186623fracture zones
0.051104DEM
Associated with copper miningLand Information0.229439NDVI
0.000473Land use
Table 3. PCA sign matrix for iron-stained alterations.
EigenvectorsB2/B1B2B3B4
PC1−0.30295−0.33081−0.90442−0.05013
PC2−0.05282−0.114120.07628−0.00652
PC3−0.596250.654850.015810.00103
PC4−0.00032−0.00783−0.004500.97912
Table 4. PCA sign matrix for aluminum hydroxy alterations.
Eigenvectors(B4 + B7)/B6B4B6B7
PC10.771050.489170.087520.11926
PC2−0.51891−0.69928−0.12343−0.43836
PC30.204350.45268−0.72478−0.48112
PC40.30726−0.250210.66796−0.57311
Table 5. PCA sign matrix for Magnesium hydroxyl alterations.
Eigenvectors(B6 + B9)/(B7 + B8)B7B8B9
PC1−0.149720.37618−0.745610.53147
PC20.81783−0.09891−0.48174−0.28745
PC30.05863−0.032920.99149−0.11432
PC4−0.50498−0.90952−0.143280.07028
Disclaimer/Publisher’s Note: The statements, opinions and data contained in all publications are solely those of the individual author(s) and contributor(s) and not of MDPI and/or the editor(s). MDPI and/or the editor(s) disclaim responsibility for any injury to people or property resulting from any ideas, methods, instructions or products referred to in the content.

