Article

The Role of Particle Size and Shape on the Recovery of Copper from Different Electrical and Electronic Equipment Waste

1
Mineral Processing Engineering Department, Faculty of Mines, Istanbul Technical University, Istanbul 34469, Turkey
2
Chemical Engineering Department, Faculty of Engineering, Sivas Cumhuriyet University, Sivas 58140, Turkey
*
Author to whom correspondence should be addressed.
Minerals 2023, 13(7), 847; https://doi.org/10.3390/min13070847
Submission received: 6 June 2023 / Revised: 19 June 2023 / Accepted: 21 June 2023 / Published: 22 June 2023

Abstract

:
The increasing world population and the development of technology have boosted the demand for electrical and electronic equipment (EEE). Equipment that has completed its life cycle causes serious damage to the environment due to its toxic components. In addition, it contains many more base metals (copper, aluminum, nickel, lead, tin, etc.) and precious metals (silver, gold, palladium, platinum, etc.) compared with a run of mine ore. Recycling these values with an economic and environmental understanding will ensure sustainability and prevent the rapid depletion of natural resources. Specific gravity, magnetic, electrostatic, optical, surface, thermal, and other property differences between particles as well as the shape, size, and distribution of individual particles directly determine the success of the recycling process. By determining the behavior of the particles during enrichment and producing grains suitable for enrichment with better performance in the size reduction stage, the quality of the concentrate to be subjected to the final chemical/metallurgical treatment will be enhanced. The main aim of this study is to reveal the effect of particle size and shape properties on the recovery of valuable metals from two different waste electrical and electronic equipment (WEEE) sources, end-of-life printed circuit boards and waste electric wires, using environmentally friendly, easier-to-use, and cost-effective mechanical, physical, and physiochemical processes. Deciding on the most suitable enrichment process after detailed characterization of the products obtained from different comminution equipment and their particle size and shape directly affected the amount, content, and recovery of the final concentrate.

1. Introduction

Electrical and electronic equipment (EEE) is defined as a broad product group with circuit or electrical components with a power or battery source. Innovations in technology and the rapid expansion of the market cause EEE to be frequently replaced by consumers. This situation has become a very critical issue for both the production of electronic equipment and the disposal of waste. Globally, the amount of e-waste is increasing at an alarming rate of about 2.5 Mt per year [1] and is predicted to reach 74.7 Mt in 2030 [2]. In 2026, the global electronics recycling market will rise to $65.8 billion with a Compound Annual Growth Rate (CAGR) of 12.7% [3]. EEE contains many heavy metals and toxic substances consisting of Pb, Ni, Sb, Hg, Co, Cd, Be, polyvinyl chloride (PVC), brominated flame retardants, etc. In addition, it is a very important reservoir containing significant amounts of precious and base metals such as gold, silver, copper, iron, aluminum, and nickel [4]. Waste management systems include processes for the recovery of materials to reduce the production cost of many products such as metal, plastic, glass, and paper, to prevent health and environmental problems and to preserve natural resources. They are quite different from conventional mining operations because the physical structure and chemical composition of the wastes differ greatly [5].
In recent years, it has been widely recognized that it is essential to use and reuse raw materials to recover metal from waste and ensure residual waste approaches zero. Therefore, recycling, defined as the addition of secondary raw materials to the economy by searching for secondary sources, recovering valuable components, and processing materials necessary to produce salable products, has become important [6]. Since secondary resources have a heterogeneous content of metals, glass fibers, plastics, and ceramics, recycling valuable metals requires advanced technologies and a different multidisciplinary approach such as separation, collection, transport, treatment, and disposal [7]. Unlike the run-of-mine ores, there is no specific size fraction for their liberation and special treatment techniques are needed, such as segregation, collection, transport, treatment, and disposal. Some countries have announced their descriptions of the term for waste electrical and electronic equipment (WEEE). According to the European Union (EU) Directive, WEEE includes all components, subassemblies, and consumables that are part of a product [8]. The purposes of this regulation are limiting the use of certain harmful substances in electrical and electronic goods to protect the environment and human health from the production of electrical and electronic goods to their final disposal, determining the applications to be exempted from these restrictions, controlling the import of electrical and electronic goods, and the formation of electrical and electronic wastes and the amount of waste to be disposed of, to regulate the legal and technical principles regarding reuse, recycling, recovery methods and targets to reduce.
Around the world, about 40 million tons of electronic waste is generated every year and this amount constitutes approximately 5% of the total solid waste [9]. WEEE includes about 10% accessories, 14% electronic equipment, 34% communication equipment, and 42% household appliances consisting of information technology and communication equipment, large and small household appliances, consumer equipment, lighting devices, control and monitoring units, toys, sports, and medical equipment [1]. The rate of consumption of electronics and other complex products, which generates large volumes of waste, further complicates the problem of bulk recycling. Iron and steel form the major portion of WEEE, while plastics are the second largest group. Metals and alloys, mostly copper, brass, aluminum, and steel, make up roughly 50% of this waste. Non-ferrous metals (copper and aluminum) and precious metals (gold, silver, and platinum) rank third in abundance and have outstanding commercial value [10]. Copper makes up about 25%–30% of the total metal used in printed circuit boards (PCBs) and contains about 20–40 times higher content than exploitable copper ore [11]. Copper is a key component of the energy transition to carbon neutrality due to its superior electrical conductivity. The transition heavily relies on the electrification of energy end uses (such as heat pumps and electric vehicles) and renewable power generation (such as wind and solar PV), both of which utilize significant amounts of copper. Because copper can be recycled indefinitely without losing its properties, copper metal of the same quality can be obtained from copper-containing scrap as from copper ore production. The yearly demand for global refined copper is projected to quadruple by 2050 compared with 2020 as a result of the energy transition, population increase, and economic development. The production of refined copper is anticipated to double, reaching 50 million tons per year, with copper scrap accounting for 10 million tons of the total [12]. Plastics, which have a large share in the waste matrix, are used as polystyrene (PS), Acrylonitrile butadiene styrene (ABS), High Impact Polystyrene (HIPS), Polypropylene (PP), Polycarbonate (PC), and Polyurethane (PU) [13].
PCBs have a 3%–5% share in e-waste composition and mainly contain 28% metal and 23% plastic materials; the remaining portion is mostly ceramic and fiber materials [14]. Organic materials mainly include plastics and flame retardants, while glass-reinforced epoxy resin and metallic materials are predominantly used in PCBs [15,16]. PCBs are composed of high amounts of base metals such as copper, iron, aluminum, and tin, as well as very high concentrations of precious metals such as Au, Ag, and Pd. Ceramic components mainly include alumina, alkaline earth oxides, silica, mica, and barium [17,18].
Waste electrical cables, which have a significant share in e-waste, are mainly composed of plastics, copper, and aluminum. The wire and cable recycling markets are prognosticated to be valued at USD 30.5 Bn by 2031 [19]. According to their structure and usage, they are partitioned into five main categories which are magnetic wires, non-insulated wires, electrical wires and cables, power cables, and communication cables [20,21]. The cable consists of an electrical conductor (copper or aluminum metal core), an insulator (plastic), auxiliary elements (cable shielding material), and an outer sheath (covering all materials). Insulating material consists of thermoplastic (mainly PVC, polyolefins, polyethylene, and polyurethane) and thermoset (ethylene propylene, cross-linked polyethylene, ethyl vinyl acetate, silicone, neoprene, and natural rubber) [22]. Ceramic terminal blocks are used for power and thermocouple wiring in high-temperature locations. Cable recovery processes, which are carried out especially for economic and environmental reasons, represent an important field of industrial activity. The most valuable component in cable recycling is copper and the main purpose is to obtain high-purity copper by separating the metals from the insulating layers and sheaths. Copper is used as a conductor material in cables in different coatings and alloys. For example, tinned copper wire is preferred in applications where corrosion resistance and electrical connectivity are a priority and can last much longer than bare copper. These strands are slightly silvery in color and are quite flexible [23]. Brass wire, an alloy of copper and zinc, is used in the manufacture of electrical components due to its corrosion resistance and conductive properties. Due to their durability, these wires are well-suited for electrical connectors [24]. Depending on the cable type, the price of a PVC-coated electrical cable is around USD 3000 per ton. The price of the electrical wire produced after cutting and plastic separation varies according to the Cu content. For example, a mixed copper wire containing 95% Cu and 5% Al can be sold for approximately USD 5000 per ton in April 2023, while the price of the copper wire rises to approximately USD 8000 per ton when the Cu purity is increased by 99%. In addition, recycled aluminum can be sold for between USD 1500 and 1700 per ton, depending on its quality [25]. As a result, the value of a ton of recycled material can be increased by approximately USD 2680 with an effective copper–aluminum separation.
The recycling of WEEE is a very current and important issue in terms of environmental, economic, legal, and technological aspects. The biggest challenge experienced today is the systematic implementation of the collection, transportation, separation, and recycling of e-waste [7]. The complete recycling of the PCB components requires sequential application, involving mechanical, physical, and chemical processes. Automatic cable cutting is the most viable way to recover metal from cable scrap in developed countries. The separation of electric cables can be performed through gravity separation techniques (based on density/size/shape difference, such as air gravity, jigging, shaking table separation, etc.), electrostatic separation, flotation, etc. [26]. Today, there are many simple and effective techniques for recycling thick waste cables. They are easily stripped or crushed into small scrap ingots and then sorted. However, it may become necessary to use multi-step techniques for recycling fine waste electric cables (WECs). Due to their size, selectivity may decrease in the separation process, thus increasing metal loss [27].
In particular, the physical processes, which are applied effectively before the final chemical processes, provide many benefits in economic, technological, and environmental terms [28]. Unlike ores, PCBs cannot have a specific size fraction for liberation. Zhang and Forssberg (1999) and Li et al. (2010) investigated the degree of liberation, shape, and size of PCB particles [29,30]. They reported that metallic fractions in PCBs started to be released from plastics below 3 mm after shredding/crushing. The majority of copper wires have an elongated shape, while the plastic and ceramic particles are cubic or flat. In the study by Sarvar et al. (2015), it was found that −2.38 + 1.68 mm plastic particles were separated from the metallic fraction, but ceramic and board particles were liberated at −0.42 + 0.21 and −0.21 mm, respectively [31]. The behavior of particles in a medium is significantly affected by their shape and particle size distribution (PSD) properties [32]. For this reason, it is necessary to determine the morphological properties of the particles together with the particle size, especially in the enrichment processes. As a result of comminution such as crushing and grinding to reach a sufficient grain liberation rate (over 80%) before the enrichment processes, the particles become smaller and change shape [33]. Particles with different morphological properties can be produced in the size reduction process using different equipment. In this sense, the enrichment method, to be made after the shape of the particles is determined, is one of the most basic elements that increase the success of the process.
Two of the methods aimed at recycling WEEE in this study are gravity separation, where separation is based on the density difference of the materials, and froth flotation, where separation is based on the hydrophobicity difference of the materials. Shaking tables, which are one of the most used gravity equipment in the ore preparation industry due to their simple, environmentally friendly, and inexpensive properties, basically concentrate the particles according to their specific gravity and also by their sizes and shapes [34,35,36]. The separation process depends on the displacement of the particles in the medium, so the shape of the particles greatly affects their movement. Since the rolling movement of the flat particles is limited, the possibility of mixing with the other product increases and the separation process becomes difficult. Between two particles of the same mass, a plate and/or needle-like one precipitates more slowly than a spherical particle. For example, naturally, laminated mica particles can be separated from feldspar using a shaking table [37]. Also, the velocities of the moving particles, which have different shapes in the fluid medium, will change as they are subjected to different resistive forces. Cui and Forssberg (2003) performed metal/nonmetal separation using a shaking table for copper/plastic separation [38]. They suggested that the gravity separation of metals and plastics liberated in coarse sizes after primary crushing has very important advantages for the downstream processing stages. The comminution process to ensure the liberation of metal and nonmetals that make up the waste matrix causes the production of a large amount of fine fraction. The fine fraction below about 75 µm, which still has a significant metallic value, cannot be adequately captured by conventional gravity separators, and as a result, losses increase due to metals escaping into the light product, and selectivity is severely reduced [39]. Ofori-Sarpong and Amankwah (2011) investigated the effects of disc mill, ball mill, vibratory pulverizer, and hammer mill outputs on gold recovery in their enrichment studies using a Knelson concentrator. It has been revealed that the hammer mill produces spherical-shaped particles, while the ball mill causes the formation of flat gold particles [40].
Froth flotation, in which the separation is performed based on the physicochemical surface difference of the particles, is an enrichment technique that was developed especially for the recovery of the fine fraction that cannot be captured by conventional gravity equipment. Plastic particles with low free surface energy move to the floating product due to their non-wetting properties [41,42], while metal particles with higher free surface energy get wet and remain in the sink [43]. However, the selective flotation separation of plastics from metals is not only based on different wettability properties, but is also related to their surface roughness, heterogeneity, particle shape, and particle size. Metallic particles with ductile properties can turn into different shapes during crushing and grinding. Irregular particles have higher flotation recovery, velocity, contact area, flotation kinetics, and bubble-particle angle than spherical particles [44]. In particular, the flat-shaped ones are easily transported upwards in the pulp regardless of their high specific gravity. With the selection of appropriate size reduction equipment, spherical-shaped metal particles can be generated so that they remain in the sinking product during the reverse flotation process and can be prevented from floating with plastics. Ogunniyi and Vermaak (2019) researched the effects of variables such as flow rate and impeller speed on the flotation of fine-size WPCBs [39]. They successfully concentrated the valuable metal fraction in the sinking product using reverse flotation and separated the plastics in the floating product. One of the main drawbacks of flotation is the use of different kinds and amounts of chemicals, the shape of the particles, and their behavior in the particulate system. Based on this information, the main purpose of this study is to reveal the effect of particle size and shape on physical and physicochemical processes for the recovery of precious metals in two different secondary sources such as end-of-life printed circuit boards (EOL PCBs) and waste electric wires (WEWs). Particle shape in each size reduction step should be characterized to determine the mechanism and forces that cause the particle shapes to be formed. Thus, the behavior of a grain with a specific shape in the separation process (shaking table and flotation) and how it should be produced to achieve an advanced enrichment performance will be revealed.

2. Materials and Methods

2.1. Material Preparation

Experimental studies were carried out using two different WEEE samples to examine the behavior of particles in the enrichment processes. The photos of the secondary materials (EOL PCBs and WEWs) used in experimental studies are illustrated in Figure 1.

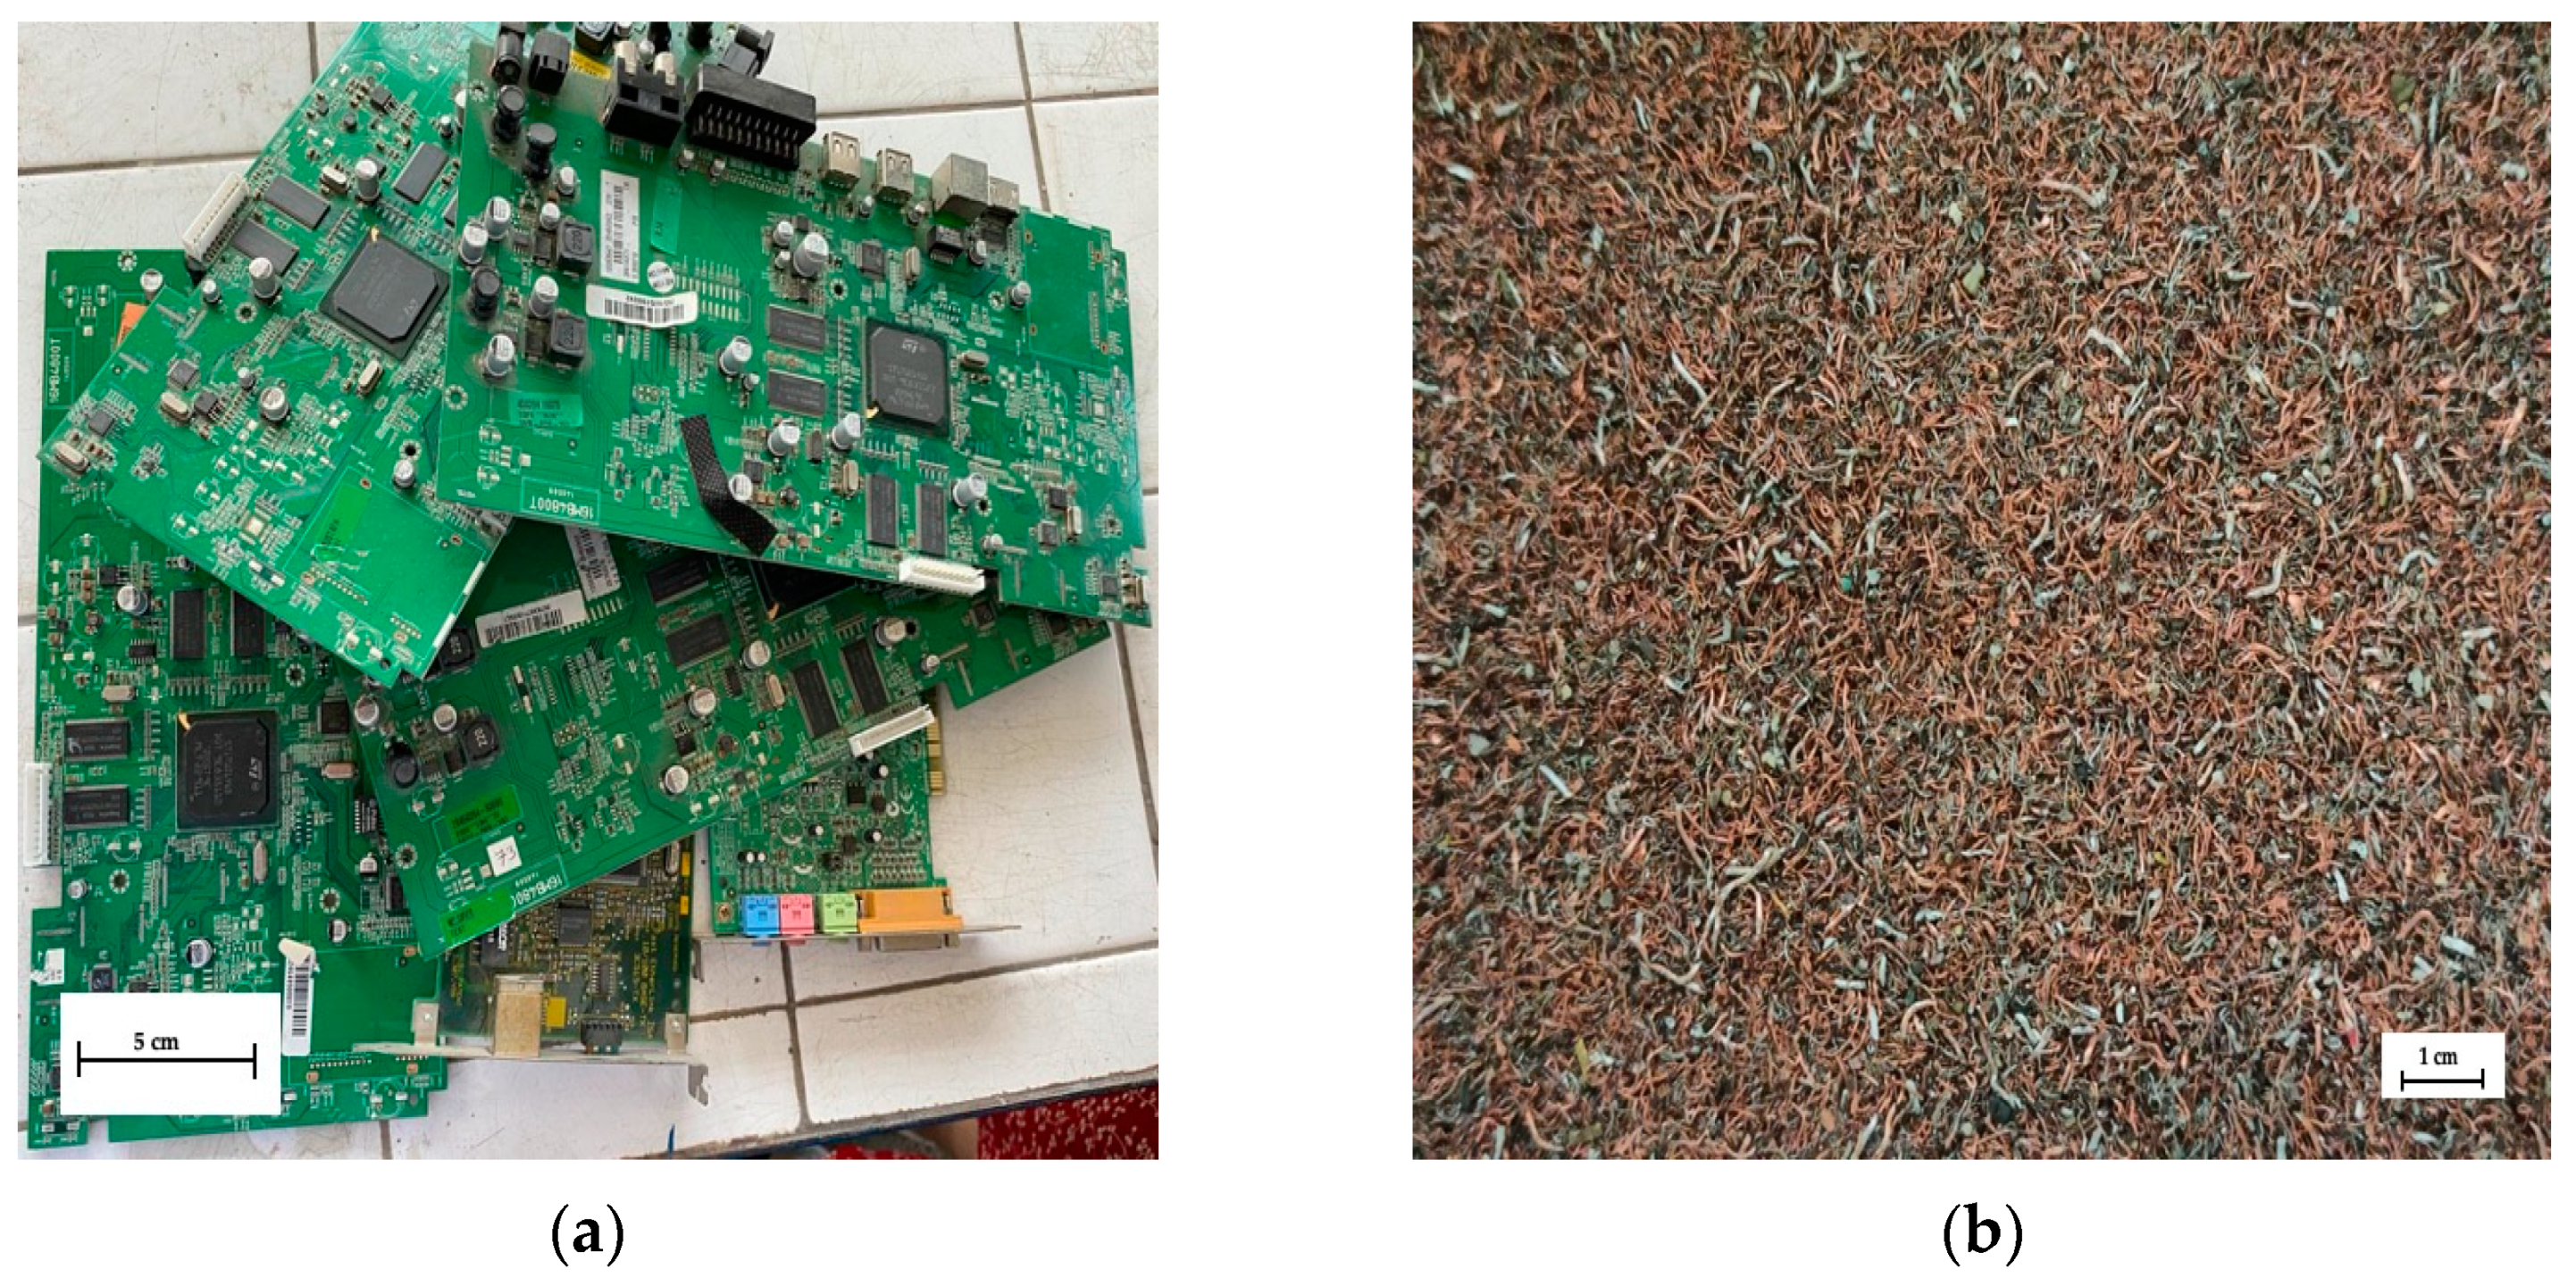
2.1.1. End-of-Life Printed Circuit Boards (EOL PCBs)

About 100 kg of EOL motherboards of printers from different brands and models were collected from Exitcom Recycling Co. located in Kocaeli, Türkiye. Primarily, the components of the cooler, processor, chips, pins, slots, resistors, condensers, and batteries located on boards whose base was made of composite fiberglass material were manually disassembled. In this way, possible breakdowns and contaminations in the crushing and enrichment processes were inhibited. The gradual comminution and beneficiation processes applied on the dismantled PCB samples are illustrated in Figure S1.
Dismantled and manually sorted PCBs were shredded into finer pieces using a four-bladed rotary cutting shredder. Crushed materials of different sizes can be produced through replaceable sieves with different aperture diameters located under the single-shaft shredder. The material trapped between the rotating blades and the sieve was continuously and superficially fragmented under the influence of compressive and shear forces. Thus, composite materials with a layered structure were easily separated from each other. After the first stage crushing process, the material was sorted using a 2 mm standard sieve. The visual examinations showed that the −2 mm fraction mainly contained copper, aluminum, and alloy wires and was defined as a metal-dense product (MDP). The +2 mm fraction containing mostly locked plastic, glass fiber, and ceramic particles, along with metals, was subjected to the hammer crusher (by Ünal Co.) for further liberation of components. To achieve sufficient liberation of metals, especially from the locked board pieces, the material was ground to finer sizes using a disc mill. The particle size distribution of the comminuted products was managed using wet sieve analysis.

2.1.2. Waste Electric Wires (WEWs)

A sample containing approximately 50 kg of mixed WEWs was obtained from a recycling company in Ankara. As seen in Figure S2, firstly, the waste material that mainly contained electrical wires and cables, power cables, and communication cables was fed to the cable-cutting equipment in the recycling plant to provide an efficient particle liberation of plastics and metals. The shredded material was then subjected to the air gravity separator to concentrate the particles according to their specific gravity difference. Insulated fractions (plastics) with a low specific gravity compared with the metals were removed from the upper part as a light product by being caught in the airflow moving from the bottom up. The heavy product, which was mostly wire-shaped and had different grain size distributions containing high amounts of metals, was obtained from the compartment at the bottom. This heavy fraction, in which the metal particles were almost liberated, was used in the characterization and enrichment studies using the differences in the specific gravity and surface properties of the WEW particles.
After drying, the samples were dissolved in hot aqua regia (HNO3 (5 mL, 69%), HCl (15 mL, 36%), and H2O2 (2 mL, 30% at about 45 °C for 12 h) to ensure that metallic parts were completely dissolved. The insoluble fraction (e.g., plastic, thermoset resins) was filtered out, and the filtrate was analyzed using atomic absorption spectrometry (AAS) and inductively coupled plasma (ICP) (margin of error = ±2%).

2.2. Beneficiation Methods

The shape and surface properties of the particles, the density, and the magnetic and electrostatic property differences between precious and gangue materials determined the selection of the proper physical enrichment method. The specific gravity of the metals in WEEE is substantially higher than that of plastics, which essentially make up most of the waste matrix. In the first part of the study, physical separation experiments were carried out through the gravity technique. The large specific gravity difference between metals and plastics and the suitable particle size difference brought up the idea of using the shaking table because of its simplicity, ease of use, effectiveness, high capacity, environmental friendliness, and cheapness.
The laboratory-type Wilfley shaking table used in the enrichment studies of PCB and WEW samples crushed below 1 mm was made of a fiberglass deck with a rectangular shape (800 mm in length and 400 mm in width). The inclination of the table can be adjusted easily. With the help of differential movement, the particles in contact with the surface of the table were moved via friction from the feeding zone on the right to the left. The riffles, which were 6 mm high on the right side of the deck (the feed section), decreased toward the left side (the concentrate section). Two water sources were placed on the deck as feed and wash water. With the water current moving from top to bottom, the light and coarse grains were caught by the drag force of the water and left the table faster by crossing the riffles. Heavy and fine grains, on the other hand, were taken from the farthest point on the left of the table by not passing over the riffles. The test conditions were as follows: 10 L/min wash water, 2 mm stroke length, 300 cycles per min frequency, 3° lateral angle, 30 kg/h feed rate. At the end of the experiments, three products, namely, concentrate (heavy), middling, and tailing (light) were obtained using two splitters.
A series of systematic tests were carried out to determine the most suitable working conditions in flotation studies using two WEEE samples with different physical and chemical properties. For the behavior of the shape of the copper particles in flotation, firstly, after the plastics were removed using reverse flotation, the shape characterization of the copper particles in the concentrate and residual products, which were fed into the copper flotation, was carried out. In other words, due to the natural hydrophobic properties of plastics, the reverse flotation method in this study emerged as an environmentally friendly and effective solution for the enrichment of WEEE. A self-aerated Denver-type flotation machine with a volume of 1.5 L was used in the flotation experiments [44,45].
In particular, fine-sized plastics that came into contact with water after grinding easily formed large-sized aggregates. These agglomerated particles can also trap fine metal particles which are in free form. Therefore, 100 g of WPCB powder was mixed with 1000 mL of tap water at high speed (1500 rpm) for about 15 min to prevent this agglomeration, which causes problems in the enrichment process, and to create free particles and clean surfaces. Methyl isobutyl carbinol, MIBC, (DOW Chemical Company) was added to produce more stable and smaller bubbles. Potassium amyl xanthate (KAX, from Solvay Group), was used as a collector agent for copper particles. After the flotation reagents were adequately contacted with the pulp, the air valve was opened, and floating plastic particles were collected. The flotation experiments for the PCB sample were conducted under the following conditions: impeller speed of 1100 rpm, airflow rate of 3 L/min, condition time of 3 min, and flotation time of 3 min. Only copper flotation was performed in the WEW sample since the plastic was separated beforehand and there were small numbers of plastic particles in the sample. Because there were heavy and thick copper wires in the sample, the impeller speed was increased to 1500 rpm to transport these particles to the froth zone more easily. Each test used 50 g of a sample that was conditioned with KAX for about 3 min. MIBC was added into the cell about 1 min before the flotation. After the collector and frother reagents were sufficiently in contact with the particles, the air valve (4 L/min air flow rate) was opened and the floated product was collected for 4 min. The recovery rate used to evaluate and discuss the experimental results was calculated with the following, Equation (1).
R (%) = (Cc/Ff) × 100
where C is the weight of the concentrate, c is the metal content of the concentrate, F is the weight of the feed, and f is the metal content of the feed.

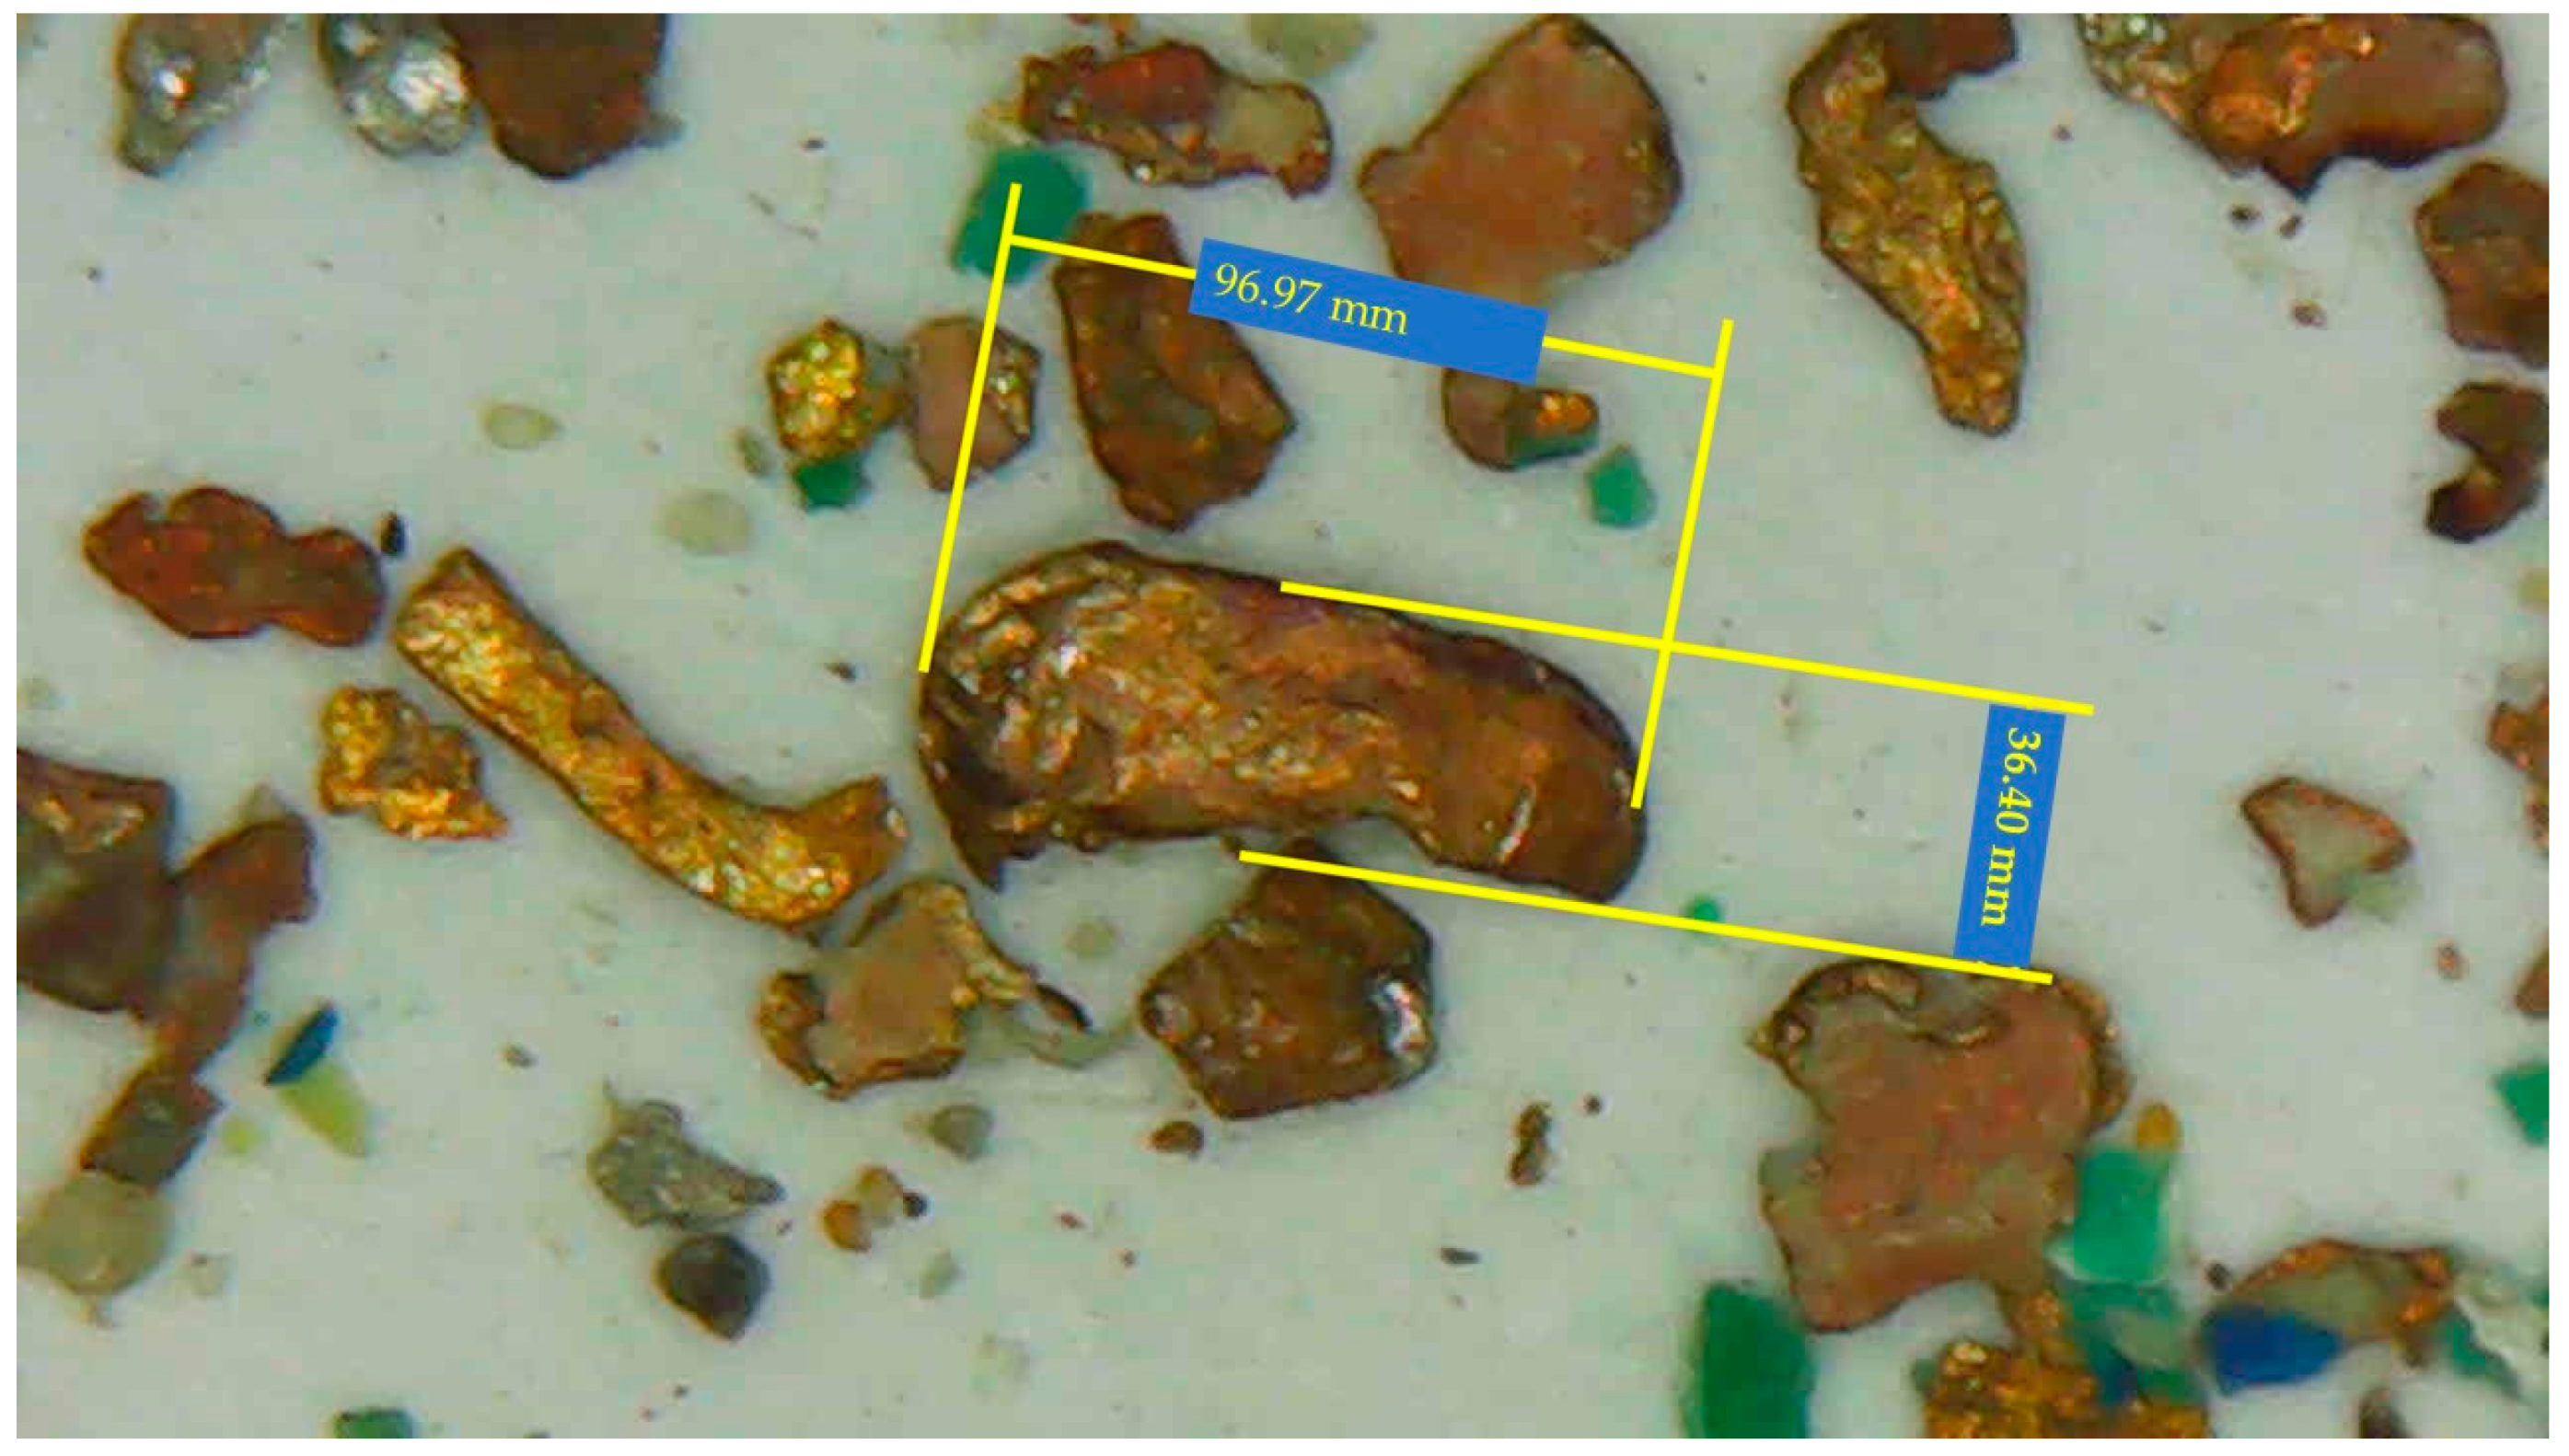
2.3. Particle Shape Characterization

Characterization studies of PCBs with the aid of a microscope were provided after comminution, size classification, and beneficiation. Image analysis is based on the principle of observing and measuring two-dimensional photographs of sections obtained from rock samples or mineral fragments. Measurements of the size of individual mineral particles and/or the distributions of grain sizes in samples are extremely important to determine the degree of liberation of minerals during beneficiation. The knowledge about size distribution allows for the prediction of liberation characteristics and the use of minimal amounts of energy comminution. Samples prepared after each size reduction process were separated into different size fractions after sieve analysis. Material from each size fraction was taken and placed in the observation glass and examined under a microscope (Leica brand). The obtained images were transferred to digital media via a camera as analog signals. According to the results obtained from the image analysis, the particles in the size groups were categorized as shown in Figure S3.
Microscopic images not only help to see the color differences of particles in the samples, but also give insight into the characterization of the shape of the valuable and gangue minerals in the various products as well as liberated particles [46]. The general shape of the particles for each sample was characterized by performing 2D manual measurements of the axis of each particle on the microscope images of the representative samples taken from the sampling locations shown in the flow charts (Figures S1 and S2).
As shown in Figure 2, the axes of the particles were measured using the Corel Draw 10 program. After importing the images, only the examination of the particle projection was used to determine the form of the particles. The major axis length (L) and width (W) of each particle were measured in millimeters and utilized as input for the Microsoft Excel application under the assumption that the projection of the particle had an elliptic shape [47]. Five measurements were made for the major (L) and the minor (W) axis of each particle, and the arithmetic mean of the five values was then calculated for each particle. Then, the average length (L) and width (W) values of those particles were computed based on the scale of the image. For each product, the same process was applied to about all particles for all images. As a result, using the measured average length and width as input, the basic parameters of the particle projection, such as area (A) and perimeter (P), were determined [48].
Area   ( A ) = π LW 4
Perimeter   P = π 2   3 L + W LW 2  
Two shape factors (Equations (4) and (5)) were derived from these fundamental measurements and calculations to characterize the shape of the particles from each sampling point, including elongation (E) and roundness (R) [49,50,51]. The perfect rounded particle had a maximum roundness of 1.0.
Elongation (E) = L/W
Roundness (R) = 4πA/P2

3. Results and Discussion

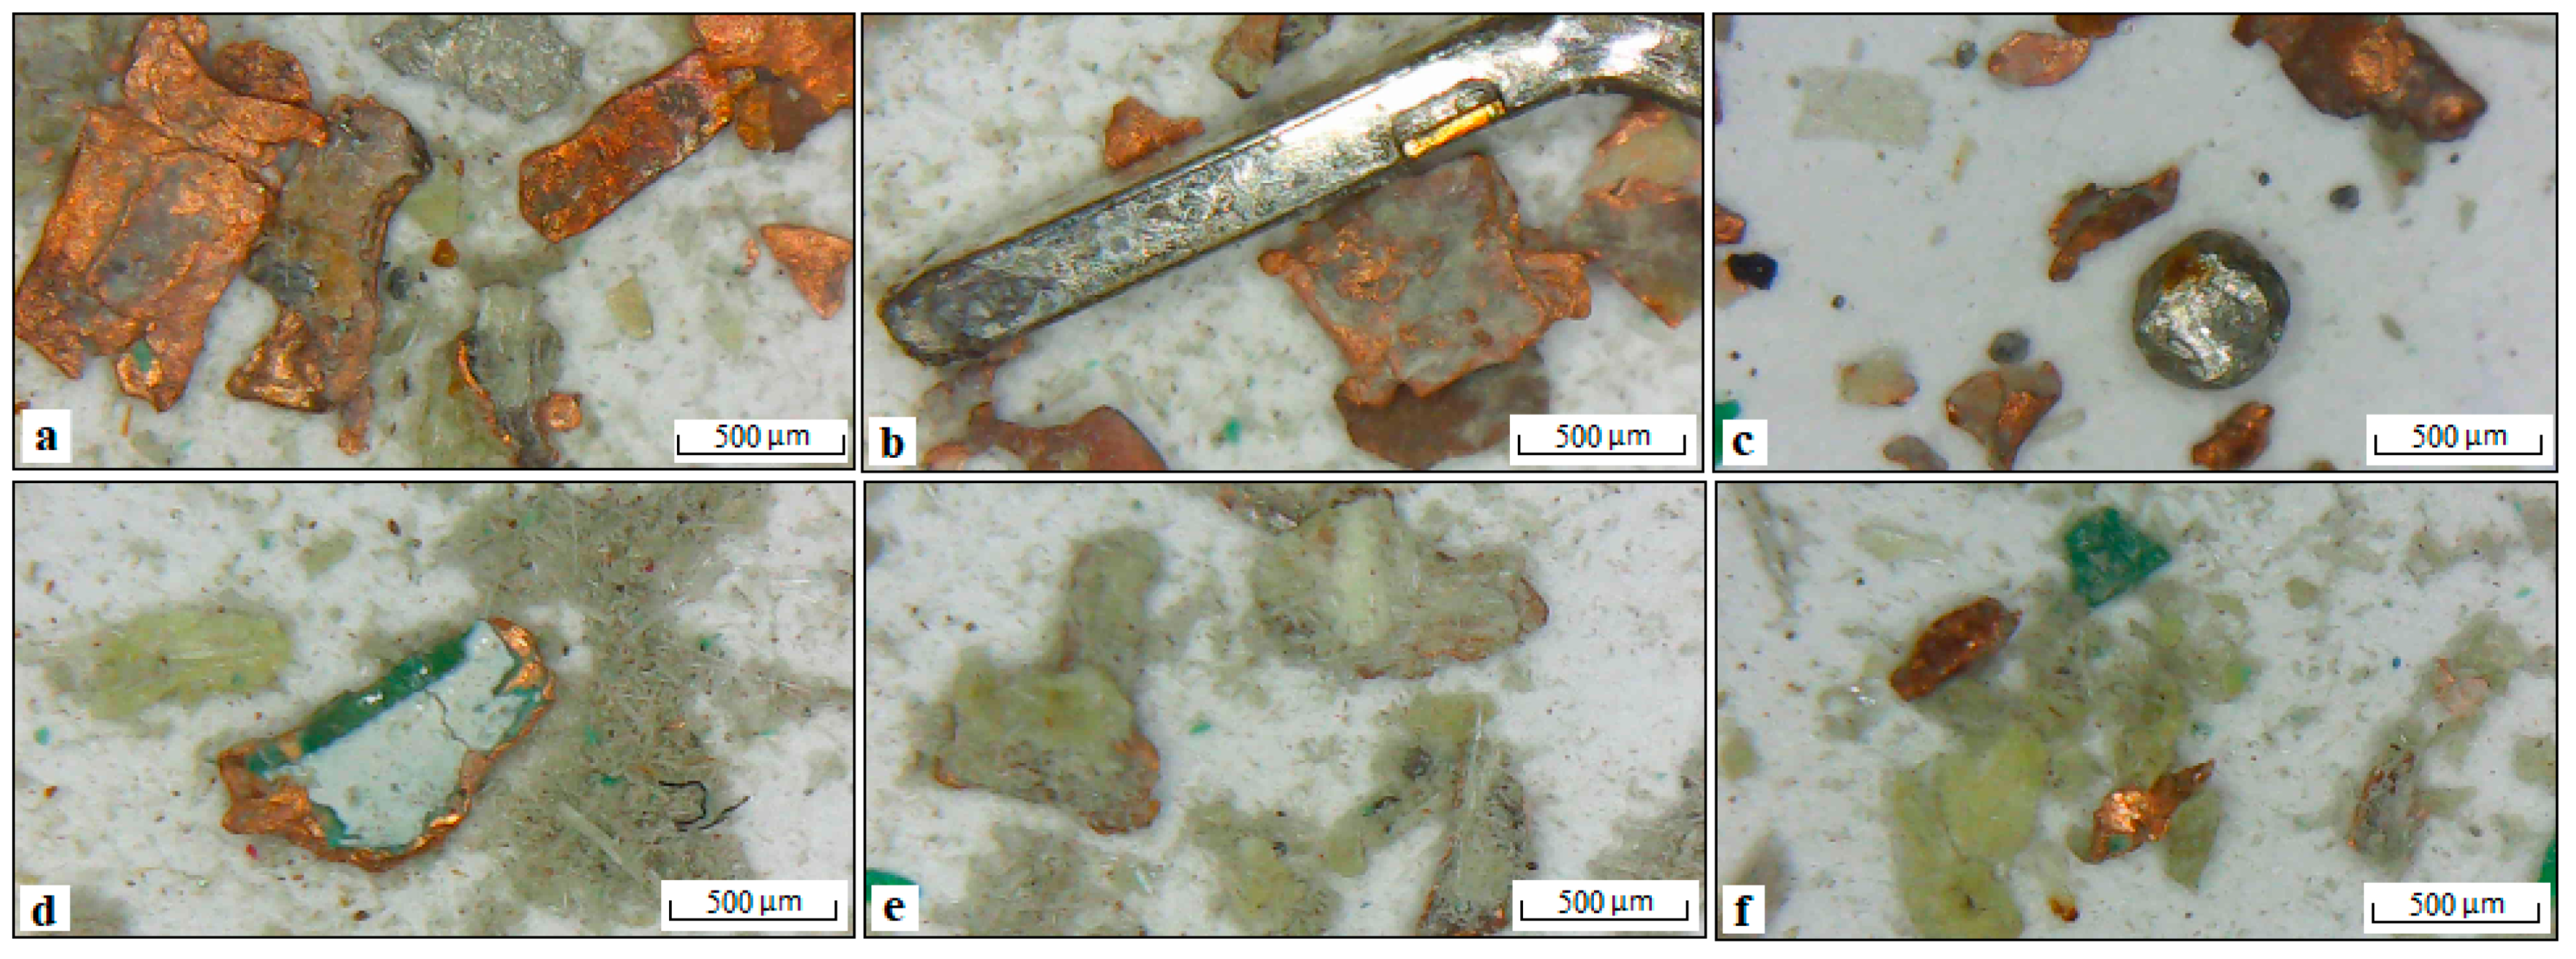
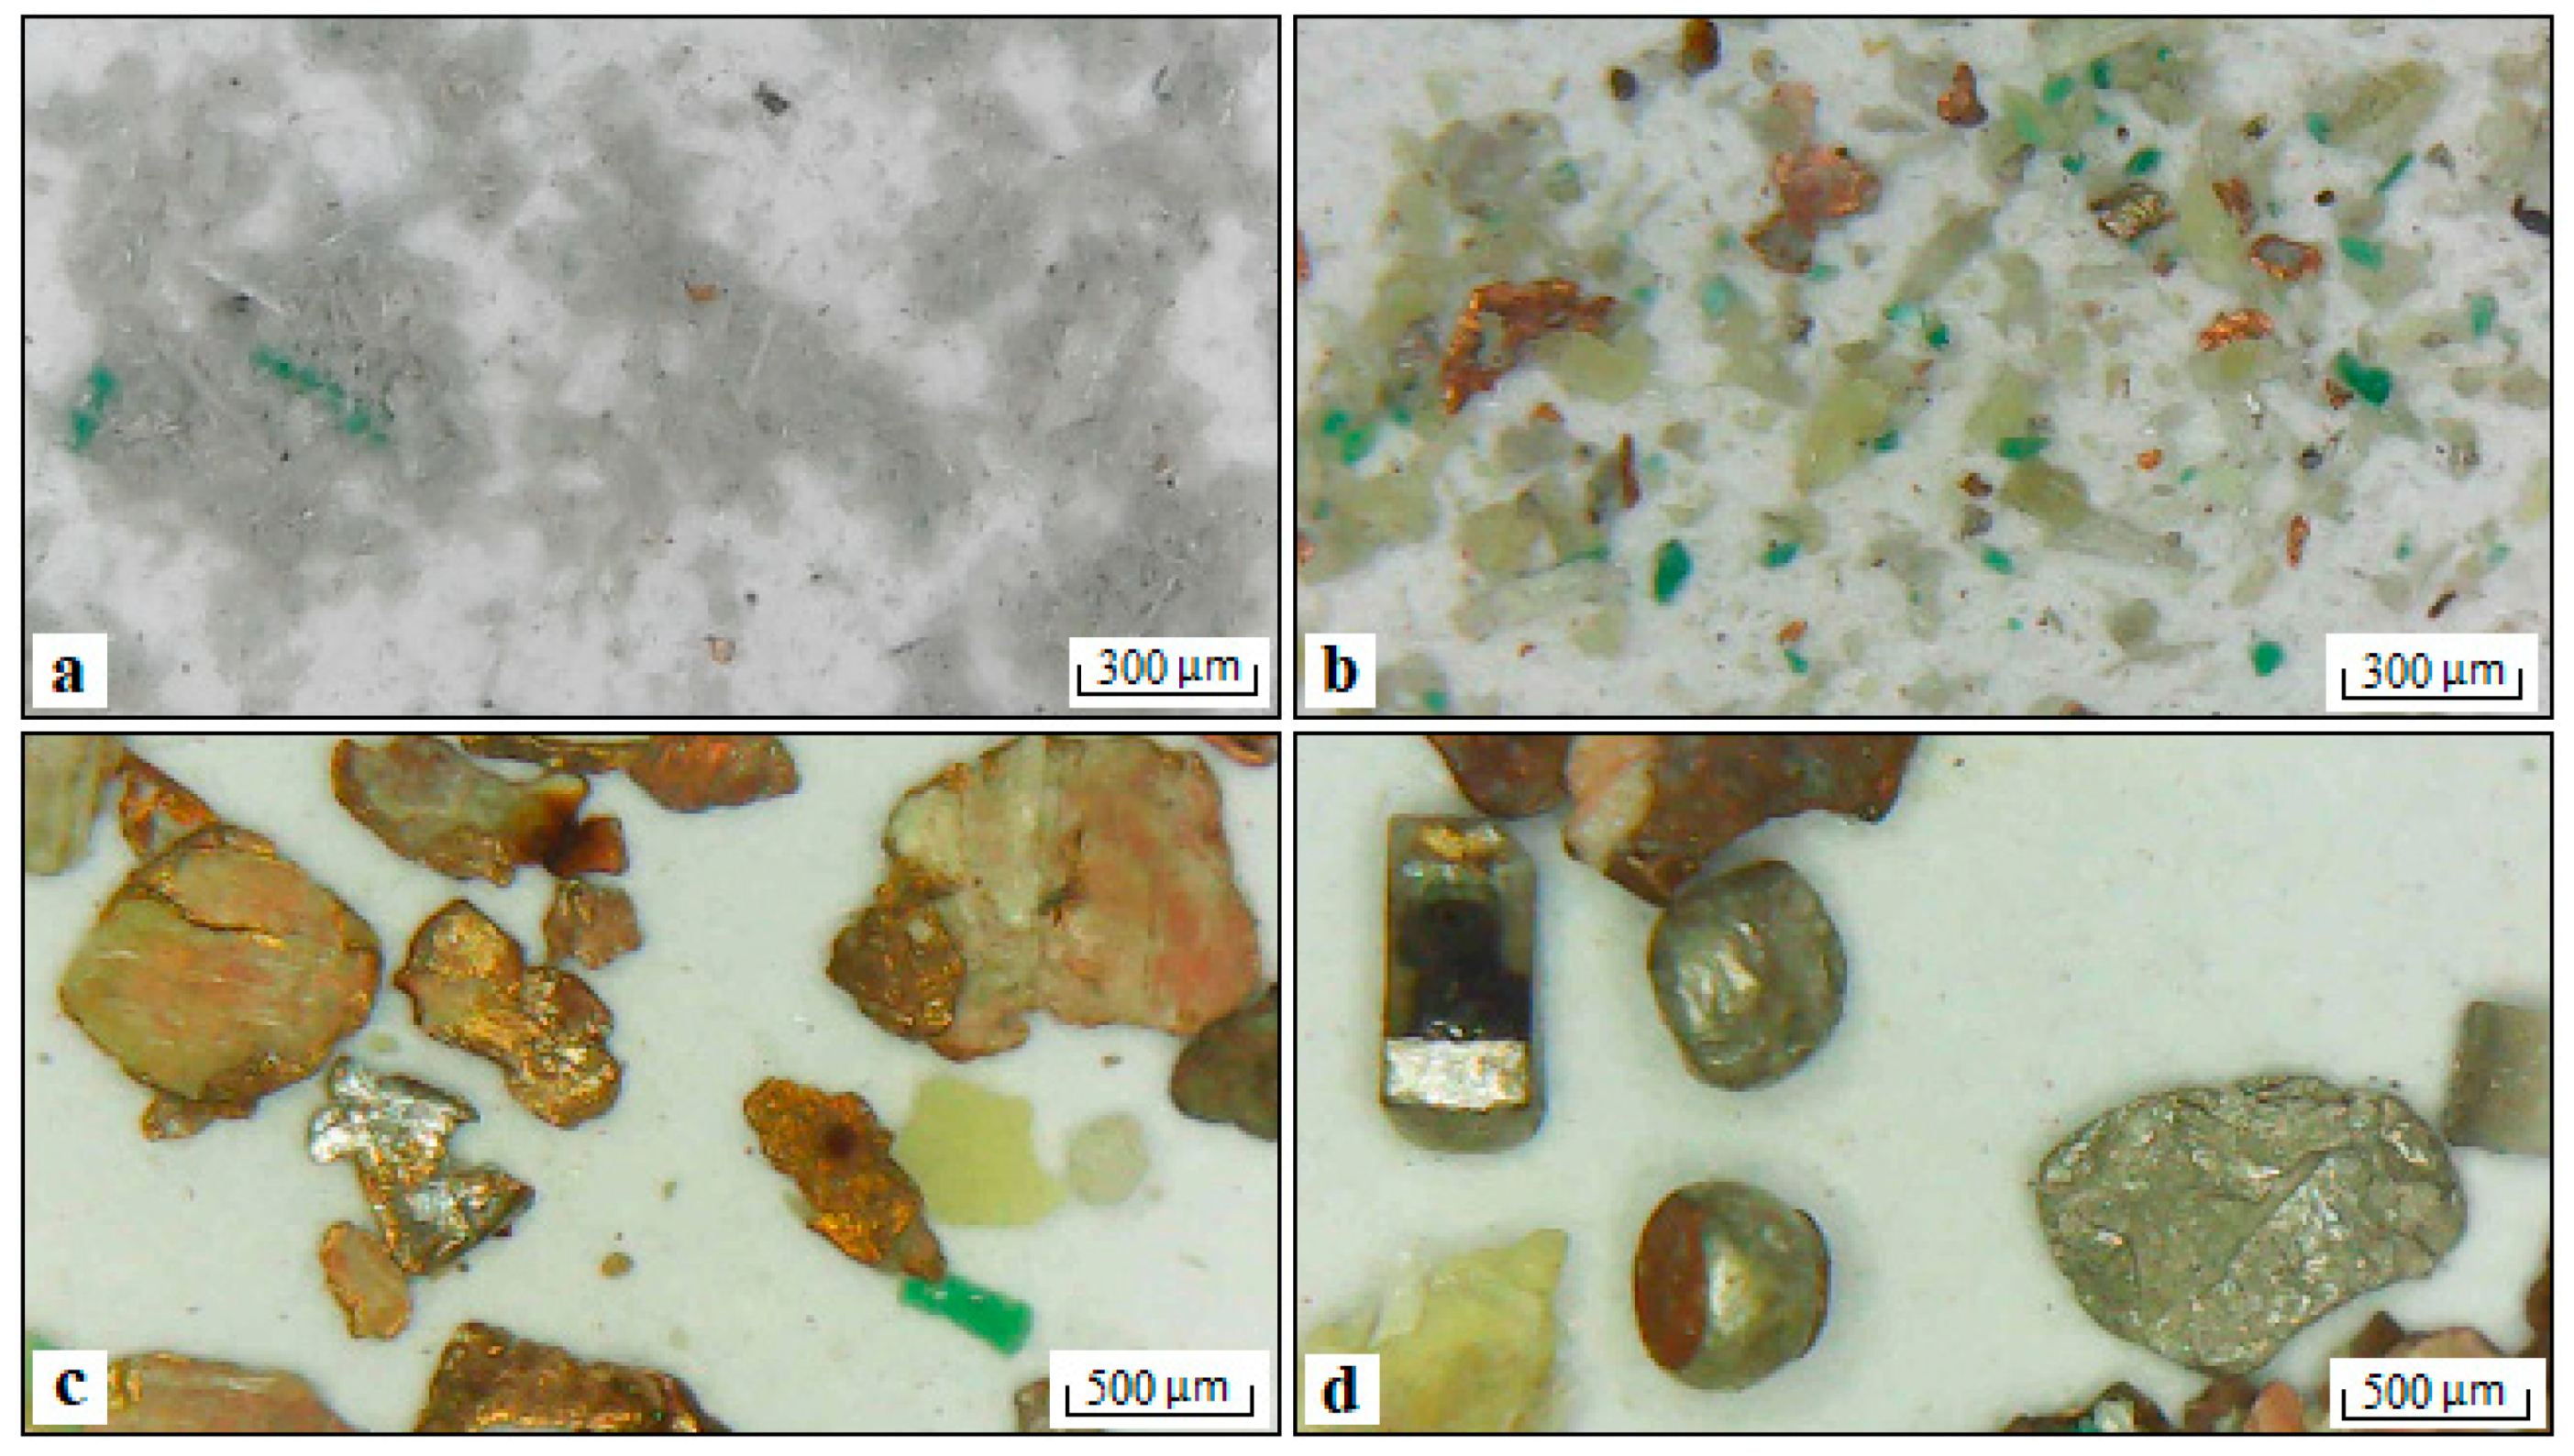
3.1. End-of-life Printed Circuit Boards (EOL PCBs)

After the gradual size reduction process was completed, the representative PCB sample was prepared using the quartering method for characterization and beneficiation studies. The sieve analysis was performed on the output product of each crusher using standard screens of different sizes. PSD curves of the PCB samples after the primary (shredder), secondary (hammer), and tertiary (disc mill) crushing are given in Figure S4. The d80 and the d50 sizes of the shredded material were found as 7.2 mm and 4.7 mm, respectively. −4.76 + 2 mm was the most dominant fraction with a share of 50.2%. Only about 10% of the shredded product had a particle size of less than 1.5 mm. The microscope images of the particles in different fractions after the shredder are presented in Figure 3.
It was observed that the particles in the +4.76 mm and −4.76 + 2 mm fractions were mostly composed of interlocked board pieces and that the metals adhered between the plate, which had a layered structure, could not be stripped sufficiently. Especially at the −2 + 0.212 mm fraction, large amounts of free plastic and metal particles were detected; however, there were still interlocking board particles in the −2 + 1 mm fraction. Based on observations, it is recommended to use gravity separation methods below 1 mm, since it contains a large number of free plastic particles with low densities compared with other components. In addition, the number of free plastic, ceramic, and board particles below 0.106 mm is much higher than free metals. Due to their malleable structure, metals could not pass to finer sizes and generally remained above this fraction as liberated particles.
Since many coarse particles existed and the ratio of locked particles was higher than 70%, the hammer mill was used as a secondary crusher, and the d80 and the d50 sizes were decreased dramatically to 4 mm and 1.8 mm, respectively. Approximately half of the material fed in the hammer crusher, which had a curved screen with a 6 mm sieve opening in its lower compartment, passed below 2 mm. In the first stage of crushing, only 12% of the total fed could pass below 2 mm. Although the amount of material in the fractions was more uniform, a large number of locked board samples were observed, especially in the 4.76 + 2 mm size range (Figure 4).
After secondary crushing to achieve a higher liberation rate, a large number of acicular glass fibers, scaly plastic particles of different colors, and rod-shaped metals were detected. Especially below 1 mm, with the impact effect of the hammer crusher, the metal and nonmetal particles were largely separated from each other; malleable soft metals taking the form of plates, metals, and plastics were largely liberated; and the number of locked grains decreased. The materials constituting the waste fraction and metals were separated from the slot they were attached to, and some locked plastic, ceramic, and board particles of various colors and sizes were found, especially in the +0.5 mm fraction. In the −0.5 + 0.212 mm fraction, the metals plated by the impact and the copper wires still clamped with the board drew attention. In sizes smaller than 0.212, plastic, ceramic, and board particles forming the waste matrix were highly liberated, the number of fiber particles increased, and the metallic particles became sparse.
The d80 and the d50 sizes of the ground PCBs were determined as 530 and 110 microns, respectively. Microscope images of the particles in different fractions after the disc mill are illustrated in Figure 5. As a result of grinding this fraction with a disc mill, small metal particles with rounded corners and spherical shapes were produced because the discs inside the device rotate in a circular direction and grind the material with the compression force.
The cut-off size for the enrichment processes was determined by the degree of metal liberation and the operating parameters of the equipment. The data in the publications of Burat, one of the authors of this study, in which metal recovery from PCBs on computer motherboards was investigated, were compiled in Figure S5 and explained with the captured images of printers’ PCBs [15,34,45]. As a result of the two-stage crushing process, the shaking table was adopted to the comminuted product with a d80 size of 4 mm for concentrating the metallic values, while the sample that was crushed below 500 microns in a disc mill was used for the froth flotation. Preliminary mechanical experiments showed that most needle-like and rod-like metallic fractions can be concentrated using a simple classification operation (using a 2 mm sieve). Despite the high metallic fraction, the MDP fraction was fed to the shaking table to investigate the enrichment possibilities. A heavy product assaying 59.9% Cu, 259 g/t Au, and 677 g/t Ag was obtained by feeding the MDP fraction containing 49.8% Cu, 253 g/t Au, and 587 g/t Ag. Free acicular and filamentous metallic particles could not spread on the table surface due to these shape features and mostly moved interlocked. While they were moving in clumps, they also imprisoned the waste matrix inside them. As a result of the shaking table test performed in the −4 + 0.5 mm size group with 45.5% Cu content, a heavy and a light product containing 56.1% and 5.6% Cu were obtained, respectively. In particular, resins and glass fibers that were still locked together with metals reduced selectivity (−4.76 + 1 mm fraction in Figure 4), while fine-sized liberated metal particles escaped into the light product with the drag force of fluidizing water, reducing the total recovery rate to some extent. Koyanaka et al. (1999) reported that glass fibers and epoxy resins, which are more brittle than metallic materials, passed into the fine fraction and their concentrations increased after the impact grinding process of PCBs [52]. In line with their findings, the −0.5 mm fraction had the lowest Cu content (19.3% Cu); however, metallic particles were more liberated compared with coarser fractions. As a result of the gravity separation, a heavy product with a Cu content of 61.4% was obtained, while the light product was removed with a Cu content of 1.5%. As can be seen in the −0.212 + 0.106 mm fraction in Figure 4f, some metal particles became flattened with the impact force of the hammer crusher and mixed into the light product. For this reason, it was necessary to carry out the enrichment process in the largest size where each material was sufficiently free, and the remaining locked particles should be included in the re-enrichment process (as froth flotation) after the gradual grinding process.
The PCB sample, which was reduced below 1 mm after the gradual crushing processes, was fed to the shaking table for metal–plastic separation, and the results are given in Table 1. About 28.4% by weight of the feed was concentrated as a heavy product assaying 62.46% Cu, 53 g/t Au, and 1884 g/t Ag. Due to the high specific gravity difference between plastics and metals, the total metal content of the heavy product was found to be 69%, while the light product was only 27%. The separation efficiency of aluminum is quite high compared with that of other metals. Due to its low specific gravity and plate-shaped structure, it was taken from the light product with a recovery rate of about 91%. However, the metal contents of the light product were still high, especially due to the formations observed as large locked grains.
Compared with minerals, the grindability of a typical WPCB is very low. Due to the ductility of metals, the comminution process generally produces flat-shaped metal particles [45]. More than one metal grain can come together and generate larger or thicker grains. Additionally, depending on the working principle of the grinding system, these metal particles can acquire a spherical shape. Liberated and thicker plate-shaped (Figure 6a), rod-like (Figure 6b), and spherical (Figure 6c) metal particles were easily obtained from the concentrate compartment with the aid of riffles on the shaking table. On the contrary, in the light product, locked board particles (Figure 6d,e) were mostly observed together with liberated plastic and fiber particles. Despite having a high specific gravity, the flat-shaped fine metal particles did not collapse easily and were mixed with the light product by being carried due to the drag force of the water (Figure 6f). Ulusoy and Atagun (2023) found that the rounder chromite particles were collected in the concentrate product, whereas the most elongated gangue particles were accumulated in the tailing product [51]. It has been understood from characterization studies and gravity tests that the grinding process plays an important role in the change of particle shape. It can be turned into an advantage in the flotation process of metal particles with a layered structure, which creates problems in gravity separation and mixes with the light product.
Multi-stage flotation experiments were carried out with the addition of a collector and frother, taking advantage of the difference in surface properties of plastic and metal particles. For this purpose, the printer’s PCB powder ground below 1 mm was fed into the flotation cell. Without the addition of any reagent, the neutral pH of the pulp averaged 8.1. In the first stage, the plastic particles were floated without a collector or frother. In the second stage, a total of 300 g/t MIBC was used to float the larger and hydrophilic plastic particles that did not float in the previous flotation stage, and no collector was added. In the last stage, a total of 900 g/t KAX was used to float the copper particles. The results of the flotation experiment are shown in Table 2.
Float 1, which corresponded to 26.4% of the total fed and was almost composed of plastic particles, was removed with a metal loss of approximately 4%. With increasing KAX concentration, copper particles whose surfaces became hydrophobic were successfully floated and a copper concentrate assaying 82.11% content was obtained. The copper content of the sink product was still relatively high due to the large-sized copper and its alloys. Due to the spherical shape and more hydrophilic nature of the particles consisting of tin and its alloys, they remained in the sinking product and increased the Sn content.
The micrographs in Figure 7 indicate that the froth product was mainly composed of light materials such as plastics and fibers, while a big part of the metallic components and ceramics were found in the sink. The free metals, whose corners were rounded and spherical by the disc mill (Figure 7d), could not be transported to the froth zone by bubbles and remained in the cell. It was found that PCB particles with higher elongation and less roundness had higher flotation recovery than particles with lower elongation and more roundness. Therefore, much fewer and finer flattened metal particles were observed in the floating product. In addition, regardless of their shape, some metal particles can be mixed with the floating product by being physically trapped in the rising waste matrix by clinging to air bubbles.
Fine-sized PCB particles are defined by their small mass and large specific surface area, as with other primary sources. Coarser, plate-shaped, light, and hydrophobic plastics, independent of their grain size, were easily captured by air bubbles moving from bottom to top and carried upwards. Some non-flat, rounded metal particles, on the other hand, can be caught by the hydrophilic fiber material and plastics and finally lost in the floating product. The flotation of the hydrophilic fiber material was due to the non-wetting resin used for the board manufacturing stage. Reducing the material to a finer size than necessary will increase the metal content in the floating product, and the total metal recovery will be significantly reduced in the reverse flotation process [53].
According to Han et al. (2018), He and Duan (2017), and Allan and Woodcock (2001), plastics with low free surface energy reported to the float product due to their hydrophobic properties in the flotation of WPCB, whereas metal particles with higher free surface energy got wet and remained in the sink product [54,55,56]. In this study, elongated copper particles were observed in the float product, while rounded copper particles were observed in the sink product. This indicates the role of particle shape as well as hydrophobicity and size effect.
On the other hand, metal particles that acquire a cubic or spherical shape with prolonged grinding will sink by resisting the upward flow. In the first stage of the flotation process, if the plastic product will be floated and the metal fraction will be sunk, a comminution system that produces spherical-shaped particles must be selected. If the single metal in the sinking product is given a sheet-like feature after plastic flotation, metal particles can be floated and separated from the other metals. Despite some challenges, the reverse flotation results indicated that metallic values could be gained successfully from PCB powders.

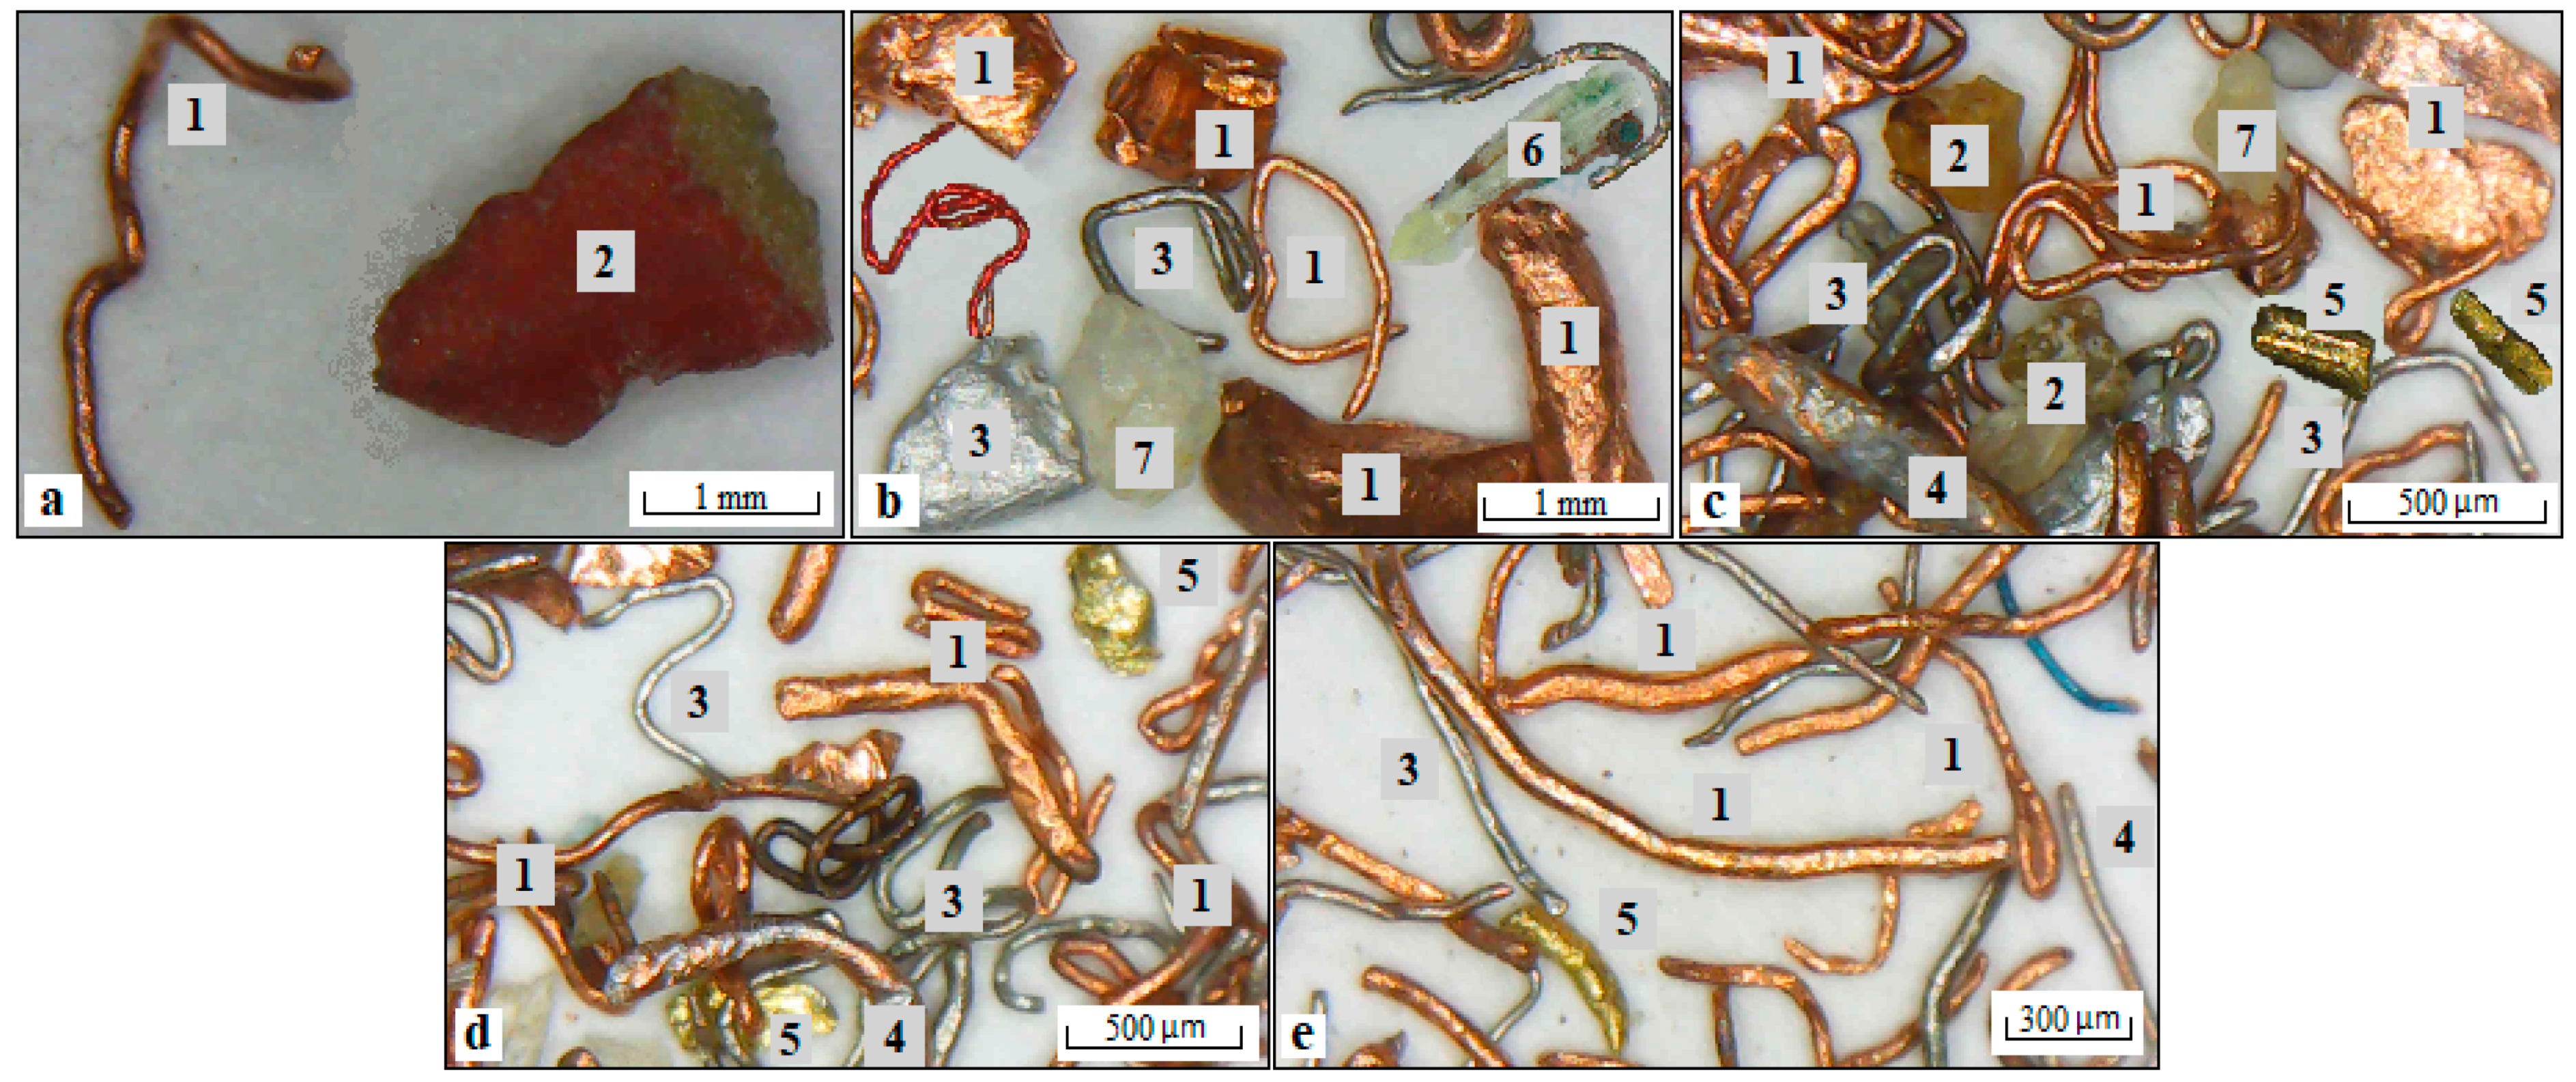
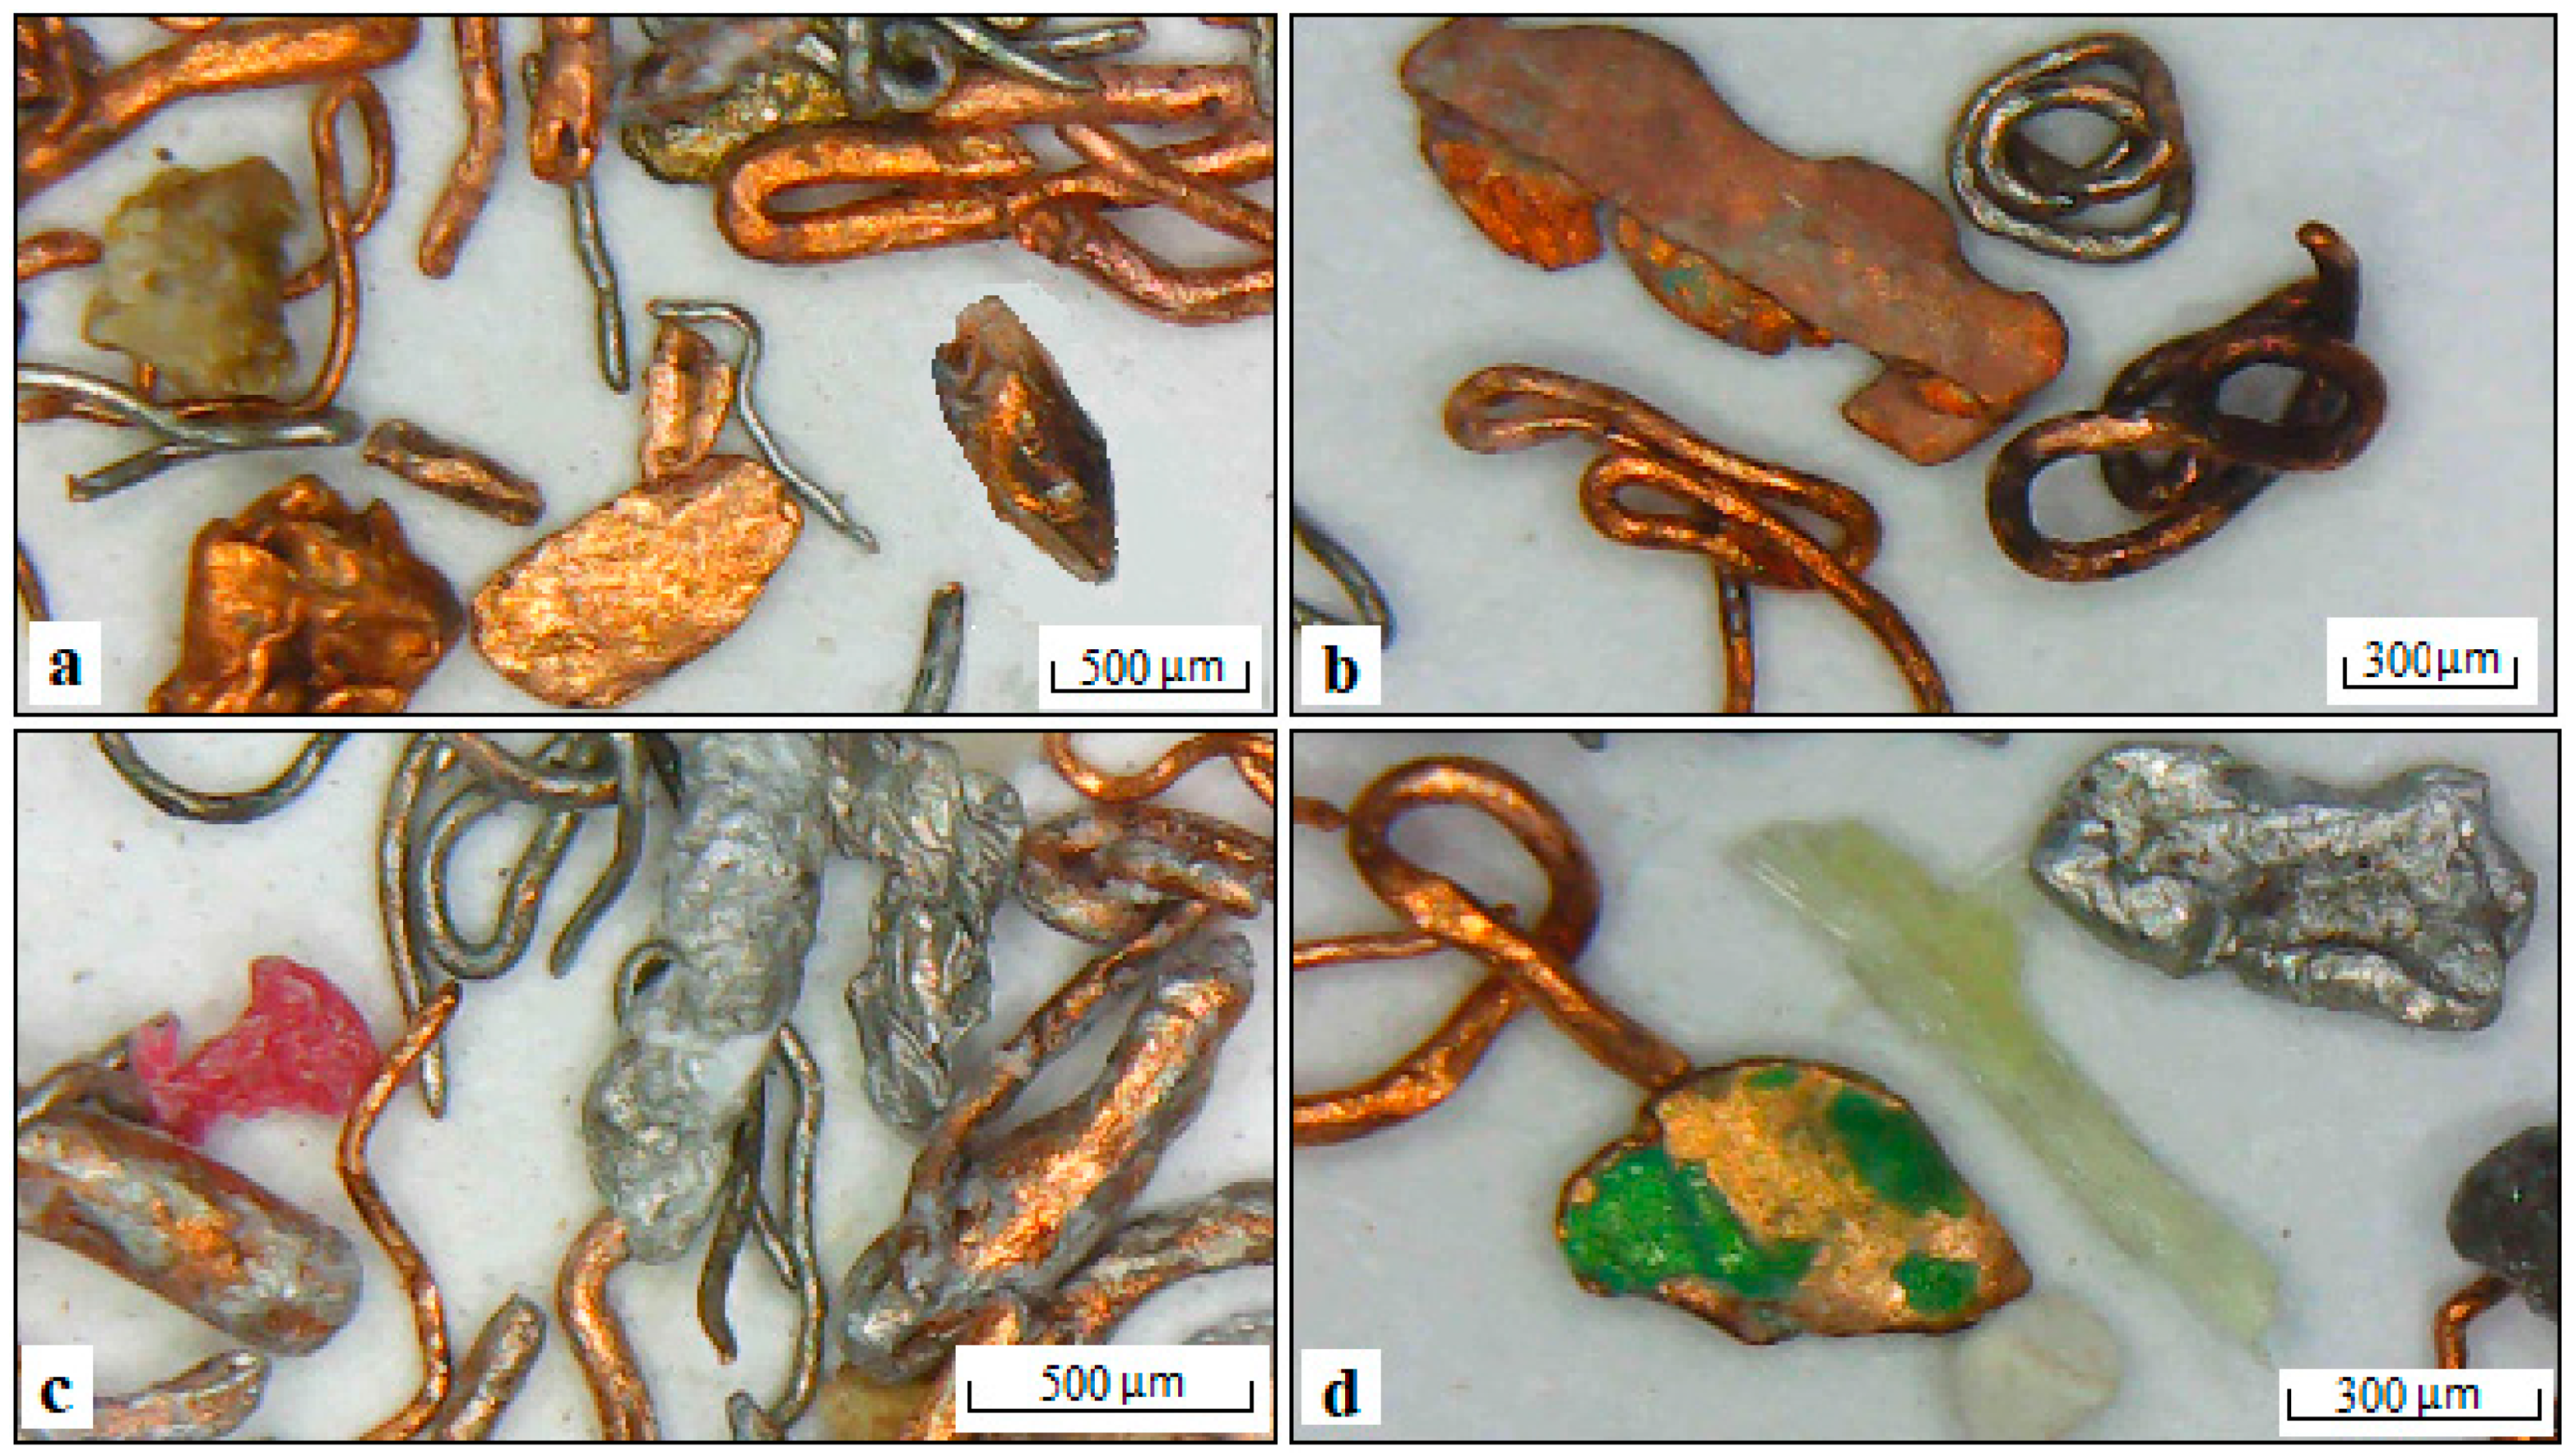
3.2. Waste Electric Wires (WEWs)

After the quartering procedure, the representative sample was obtained and the particles were sieved into five fractions, +1 mm, −1 + 0.5 mm, −0.5 + 0.3 mm, −0.3 + 0.212 mm, and −0.212 mm, using an electric shaker with standard sieves. The PSD curve of the sample and the images of the fractions are given in Figure S6. About 99% wt. of the sample was cumulatively less than 1 mm. The d80 and the d50 sizes were determined as 480 and 270 microns, respectively. The −0.5 + 0.3 mm and −0.212 mm fractions dominated with a portion of 29.4% and 36.1%. As a result of chemical analyses, it was determined that the metal contents of the WEW sample were 85.81% Cu, 8.62% Al, 0.51% Zn, 0.35% Sn, and 0.06% Fe. Single microscope images of WEW particles in various fractions after the sieve analyses were captured and are presented in Figure 8.
It was observed that the particles were mostly tinned and bare copper wires and aluminum wires. While copper particles originate from the core of the cable, aluminum and iron metals or alloys are shielded on these wires for protection. These wires, which are widely used in many industries and EEE applications, can turn into different shapes and sizes as a result of cutting processes. While the +1 mm fraction was mainly composed of the plate and angular-shaped plastic and ceramic particles, there were fewer bent coarse copper wire particles. While the number of coarse and gray-colored metal particles increased in the −1 + 0.5 mm size group, only a small amount of plastic and ceramic particles were observed. As can be seen in Figure 8b, although the copper particles indicated with # 1 had similar spherical diameters, there was a significant difference in their shapes. While the two copper grains in the upper left corner of this picture had an angular shape, wire-like copper was seen just below them. Since natural or processed colloidal particles often have irregular or non-spherical shapes, the theoretical assumption was based on ideal spherical particles. The formation of aspherical particles was expected to change the interaction between the particles, liquid, and surface, thereby changing the behavior or properties of particles in processes or applications. In addition, while the material was distributed heterogeneously in the −0.5 mm size group, plenty of fine copper particles were found, especially below 0.3 mm. For this reason, the color of this fraction was more copper-red (see Figure S6) than the others. In the smallest fraction (0.212 mm), thin metal particles were seen in abundance, which were not bent and, therefore, easily passed through the sieve gaps.
As a result of the shredding and air gravity separation processes carried out in the recycling facility, the heavy fraction, which was obtained with a high content of metallic fraction, was fed to the shaking table for selective separation of Cu from other metals. As seen in Table 3, 87.5% by weight of the feed was concentrated as heavy product assaying 92.84% Cu and 2.98% Al, while the light product contained 35.27% Cu and 48.55% Al. Because of the large specific gravity difference between the plastic and metal particles, the success of the gravity process could be obtained more easily. However, it was very challenging to selectively separate metallic particles from the pre-concentrate. In particular, due to their acicular and filamentous shape features, the metal wires could not spread sufficiently on the surface of the shaking table and moved as clamped.
Among the metallic fraction, the copper particles with the highest specific gravity (8.95 g/cm3), especially the finer ones, were taken from the heavy section, as expected, while the thicker wires with the largest length/width ratio were taken from the middle section by moving slower on the table. Since Al is the metal with the lowest specific gravity (2.7 g/cm3) among the metals in the rough fraction, the Al particles moved to the middle separation zone and were separated as a light product. However, due to the thicker copper wires in this fraction, selectivity could not be achieved. As can be seen in Figure 9a,b, while heavy copper wires and angular copper grains that became round by bending with crushing and impact forces moved with the heavy product, plate and wire-shaped aluminum and thin copper wires with low specific gravity plastic, ceramic, and fiber particles were obtained from the light product (see Figure 9c,d).
Copper flotation was performed with the addition of a collector and frother, taking advantage of the differences in the surfaces of the metal particles. The neutral pH of the pulp was 7.65 without the addition of any reagents. In the copper flotation tests carried out in four stages, a total of 900 g/t KAX was used, with 300 g/t in the first stage and 200 g/t in the other three stages. A total of 20 g/t MIBC was added at each stage to collect the copper particles, whose surfaces were rendered hydrophobic by the collector, to the flotation zone. The results of the copper flotation experiment are shown in Table 4 and the images of flotation products are presented in Figure 10.
It is clear from Table 4 that the floatability of the copper particles was improved by increasing the collector dosage. About 28.9% of the weight of the feed was floated with the addition of 300 g/t KAX and the amount of the total floats increased to 82.1% when the collector concentration increased to 900 g/t. A copper concentrate assaying 93.54% Cu could be obtained with 31.4% Cu recovery in float 1 product.
It is seen in Figure 10a that the fine-sized copper particles, whose non-wetting properties were increased by the addition of the collector, were transferred to the froth zone and recovered with high efficiency and selectivity. The small number of plastic particles that displaced the heavy product in the gravity separation process were moved to float 1 due to their high hydrophobicity property. With the increase in the collector amount, coarser and thicker copper particles that could not float previously due to their weight were floated in the second stage. In addition to the effect of particle size and shape, the surface properties of the particles directly affected the success of the flotation. The number of brass grains (yellow grain in Figure 10b) in the float 2 product was the highest. This clearly explains the high content of Zn in this product. Thin aluminum wires, which are more hydrophilic compared with copper, stood out in float 4.
As the selectivity decreased with increasing collector amounts, a more complex structure was observed. Since the content of float products was improved by adding more reagent dosages, some copper grains in particular were still relatively heavy for the bubbles, and especially large and thicker ones remained in the cell, increasing the Cu content in the tailings. Also, in the sink product, mostly coarse and pressed-shaped aluminum particles, together with hydrophilic ceramic particles and very thick copper wires, were observed. Furthermore, the Sn content in the sink product was quite high. The reason for this is that the copper particles whose surfaces were covered with tin did not float and remained in the sink product.

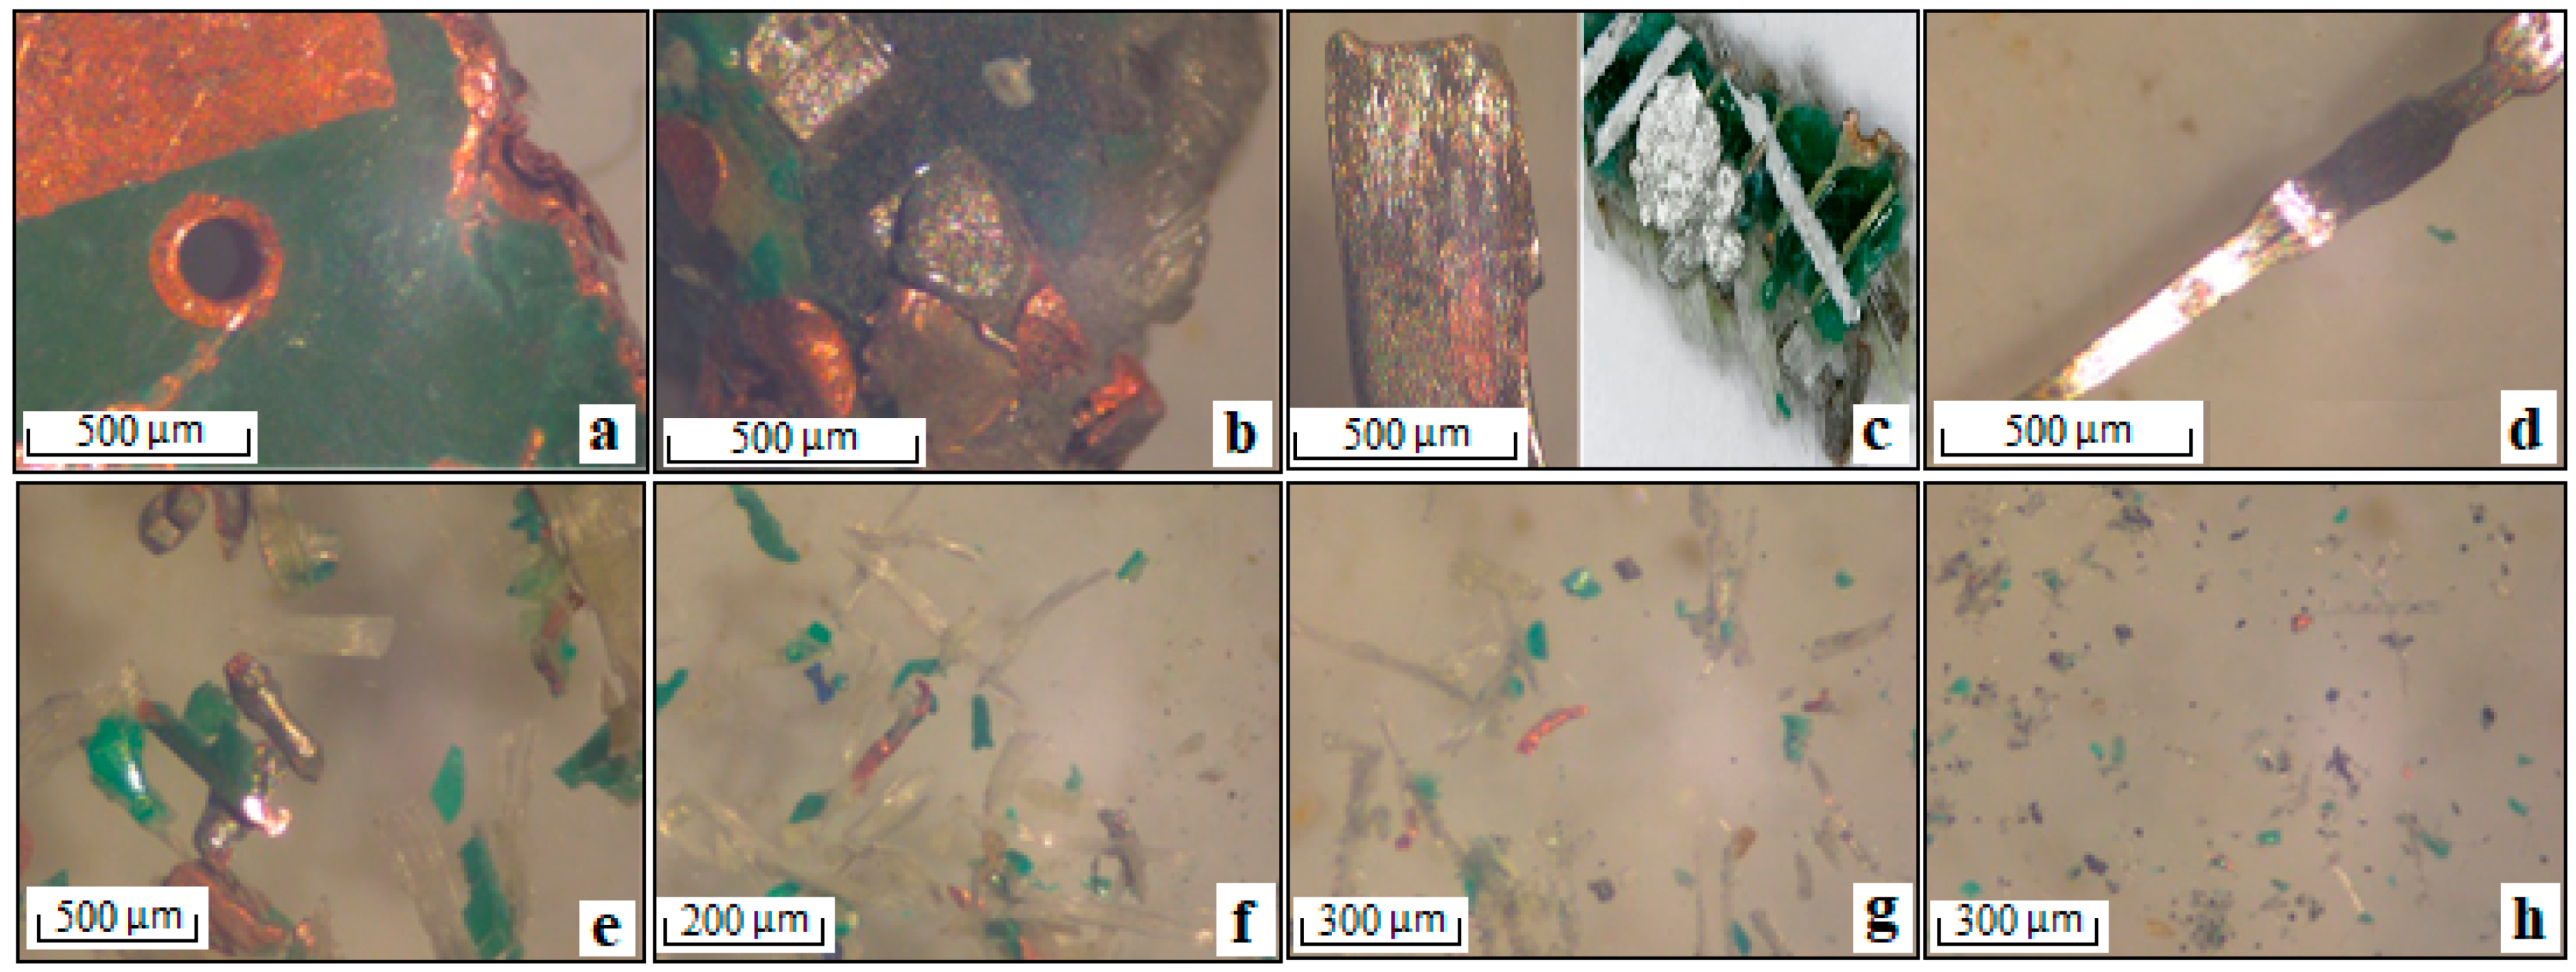
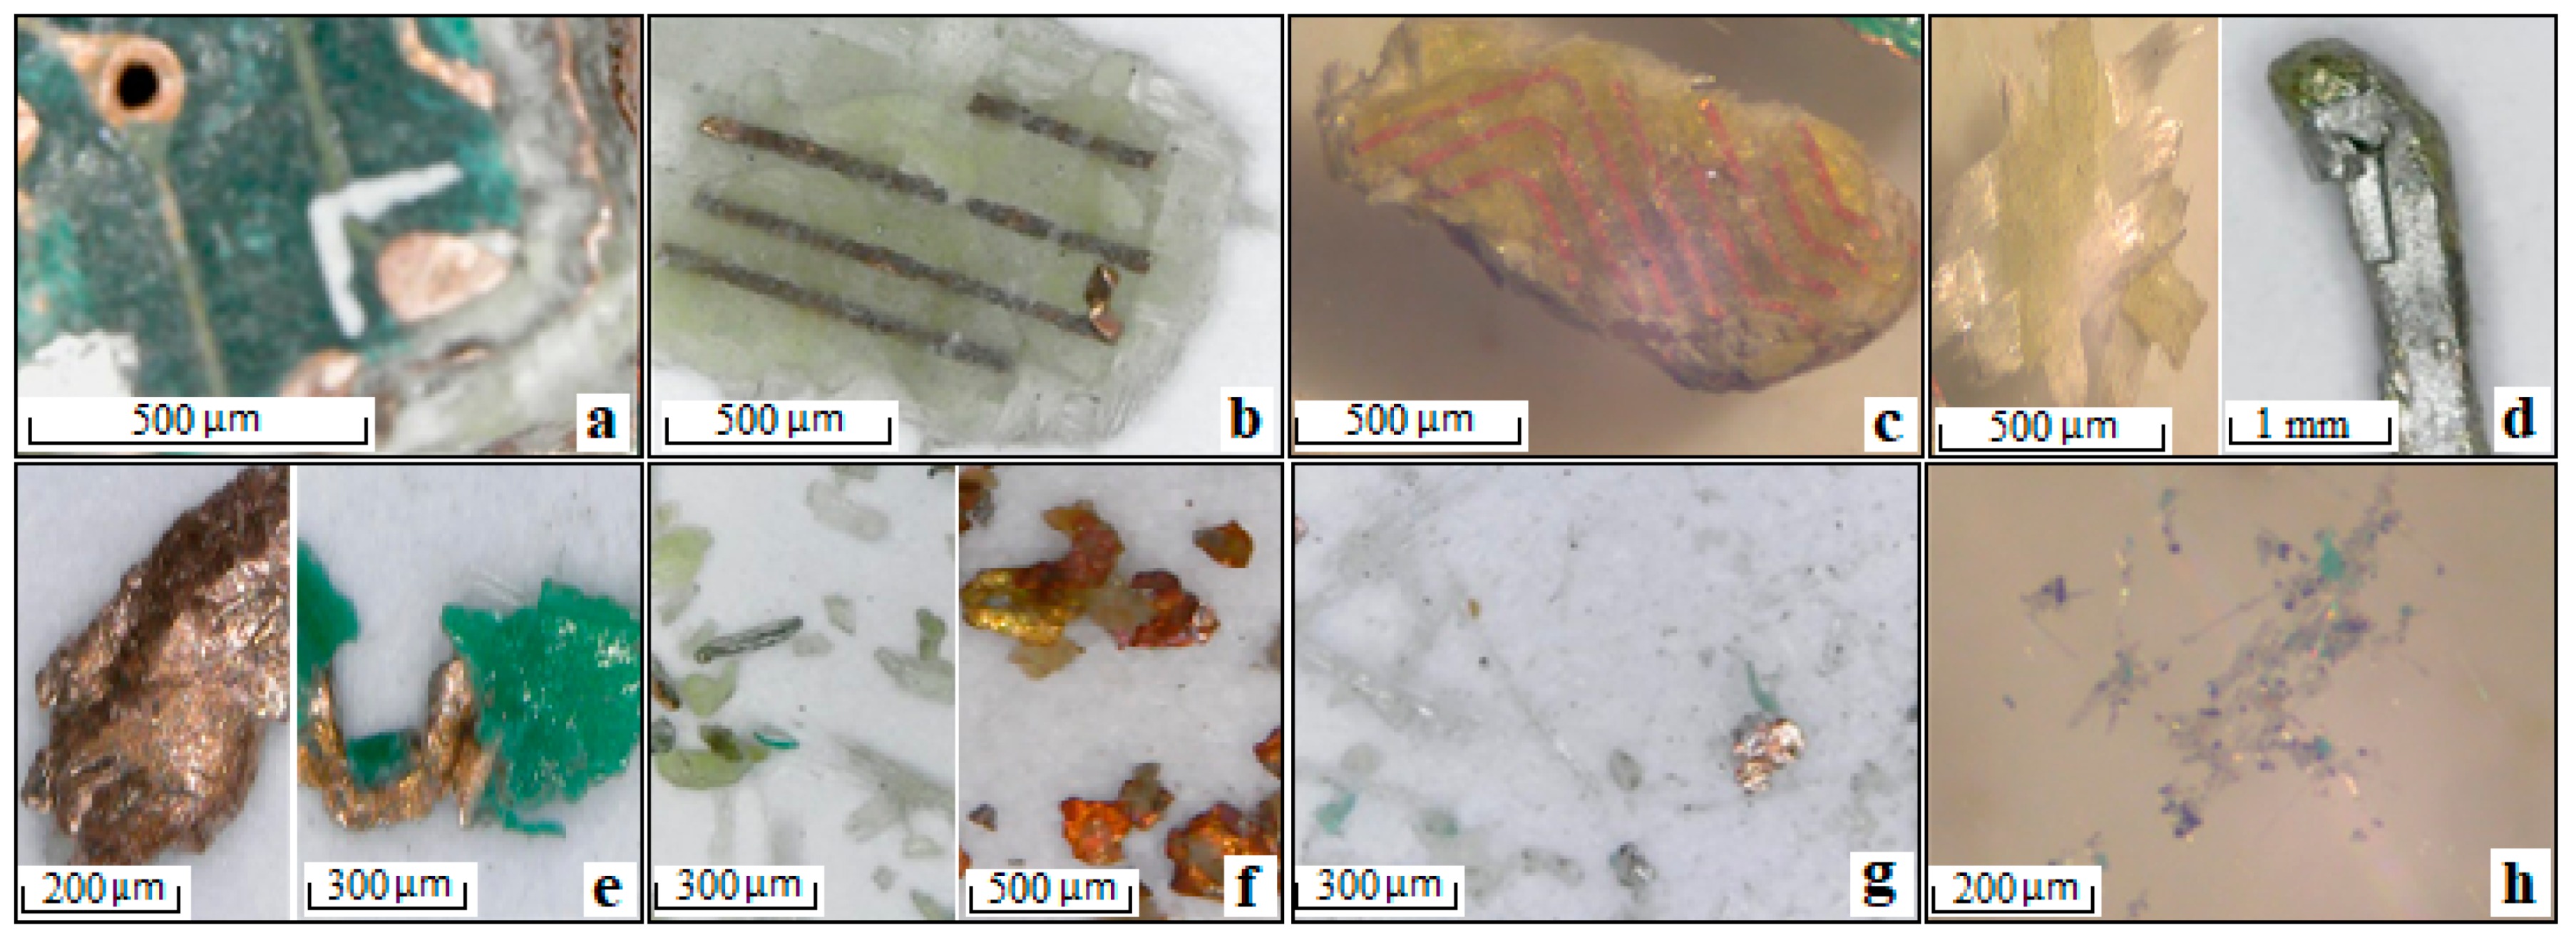
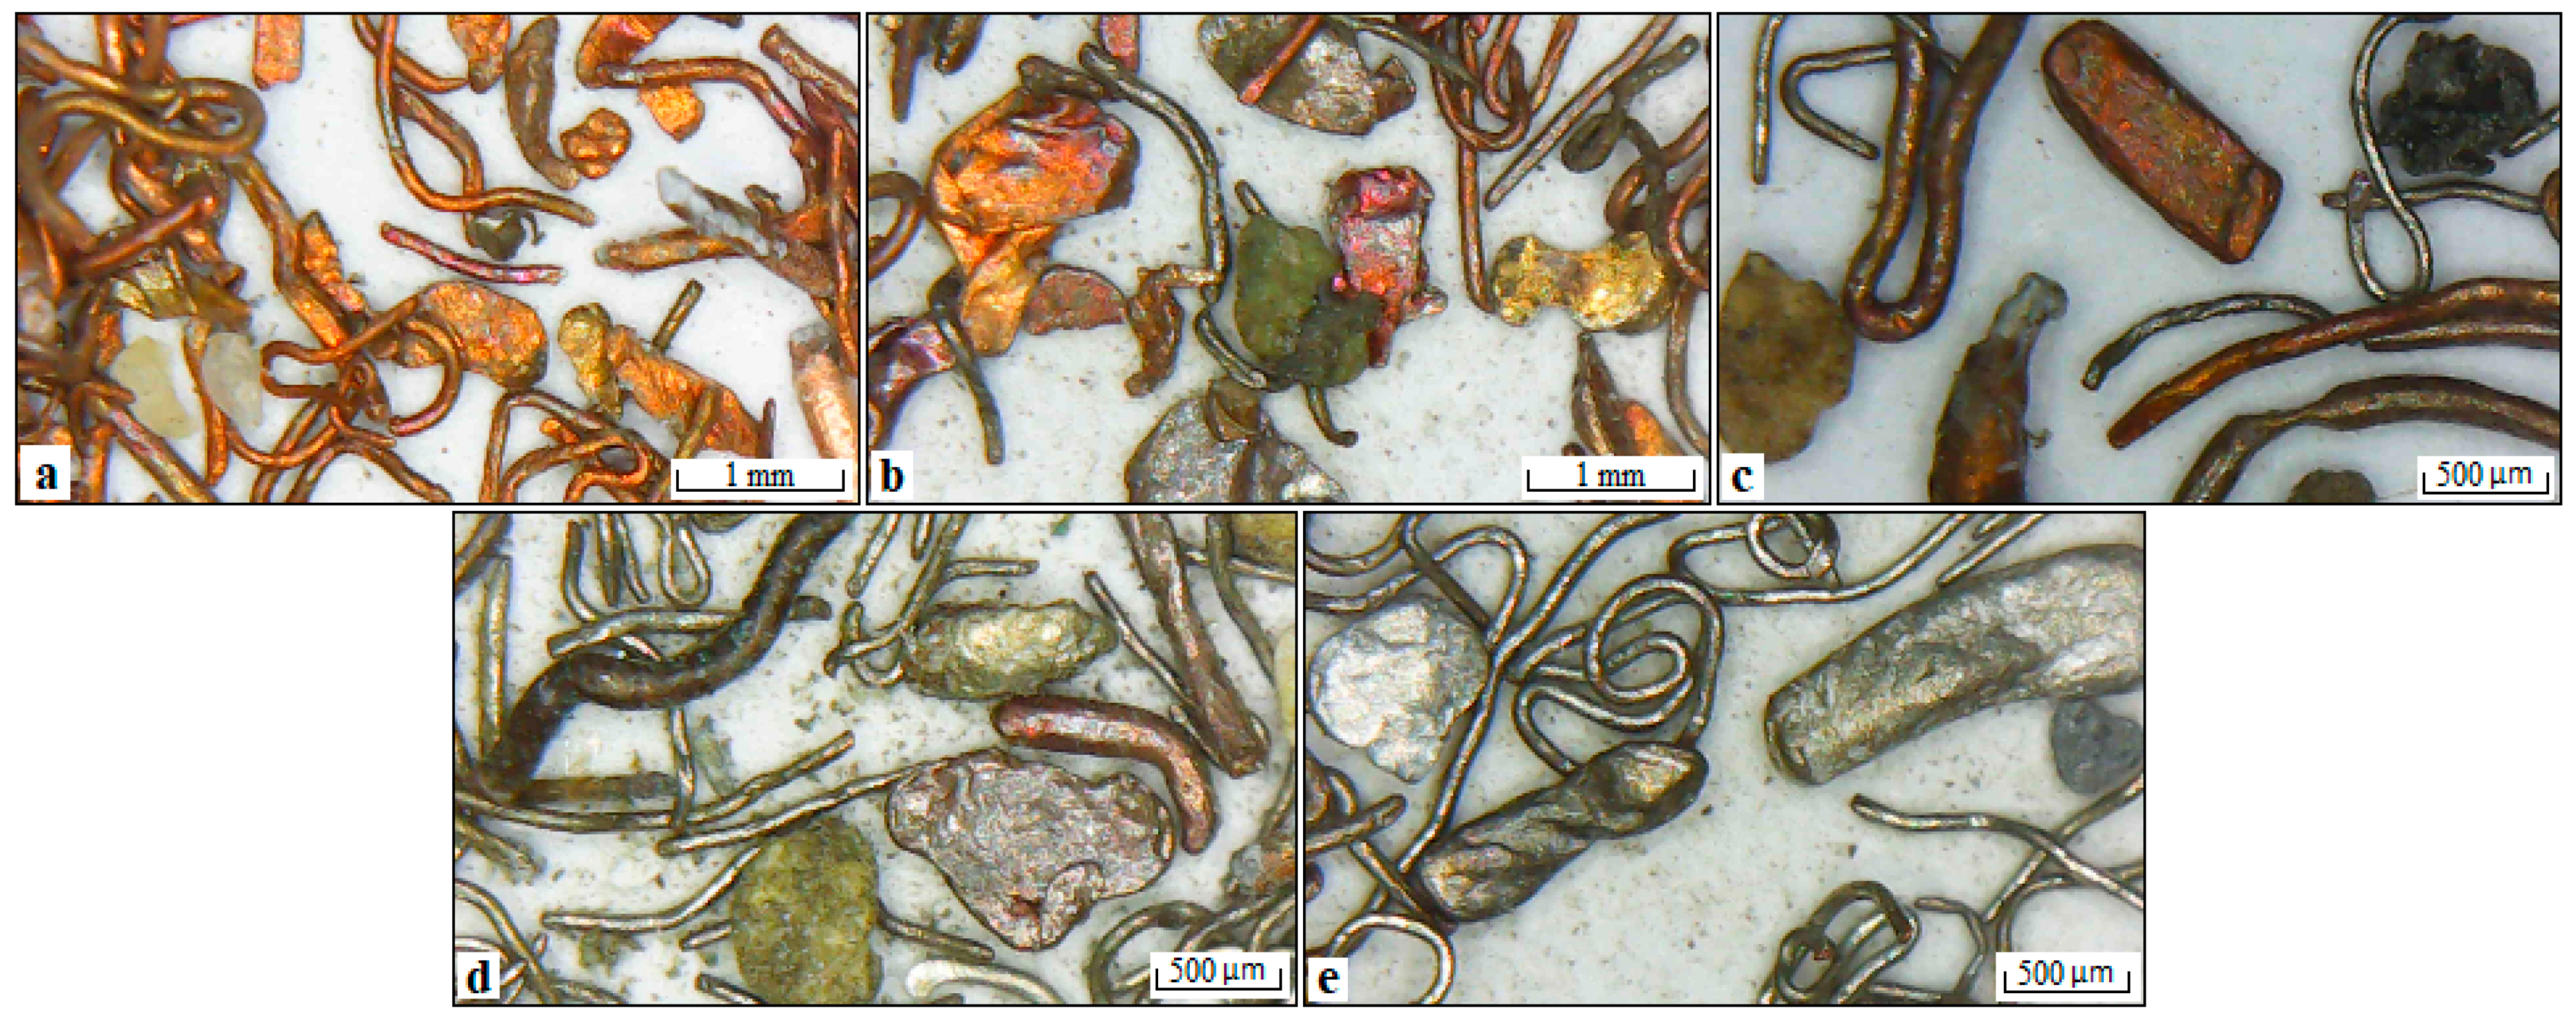
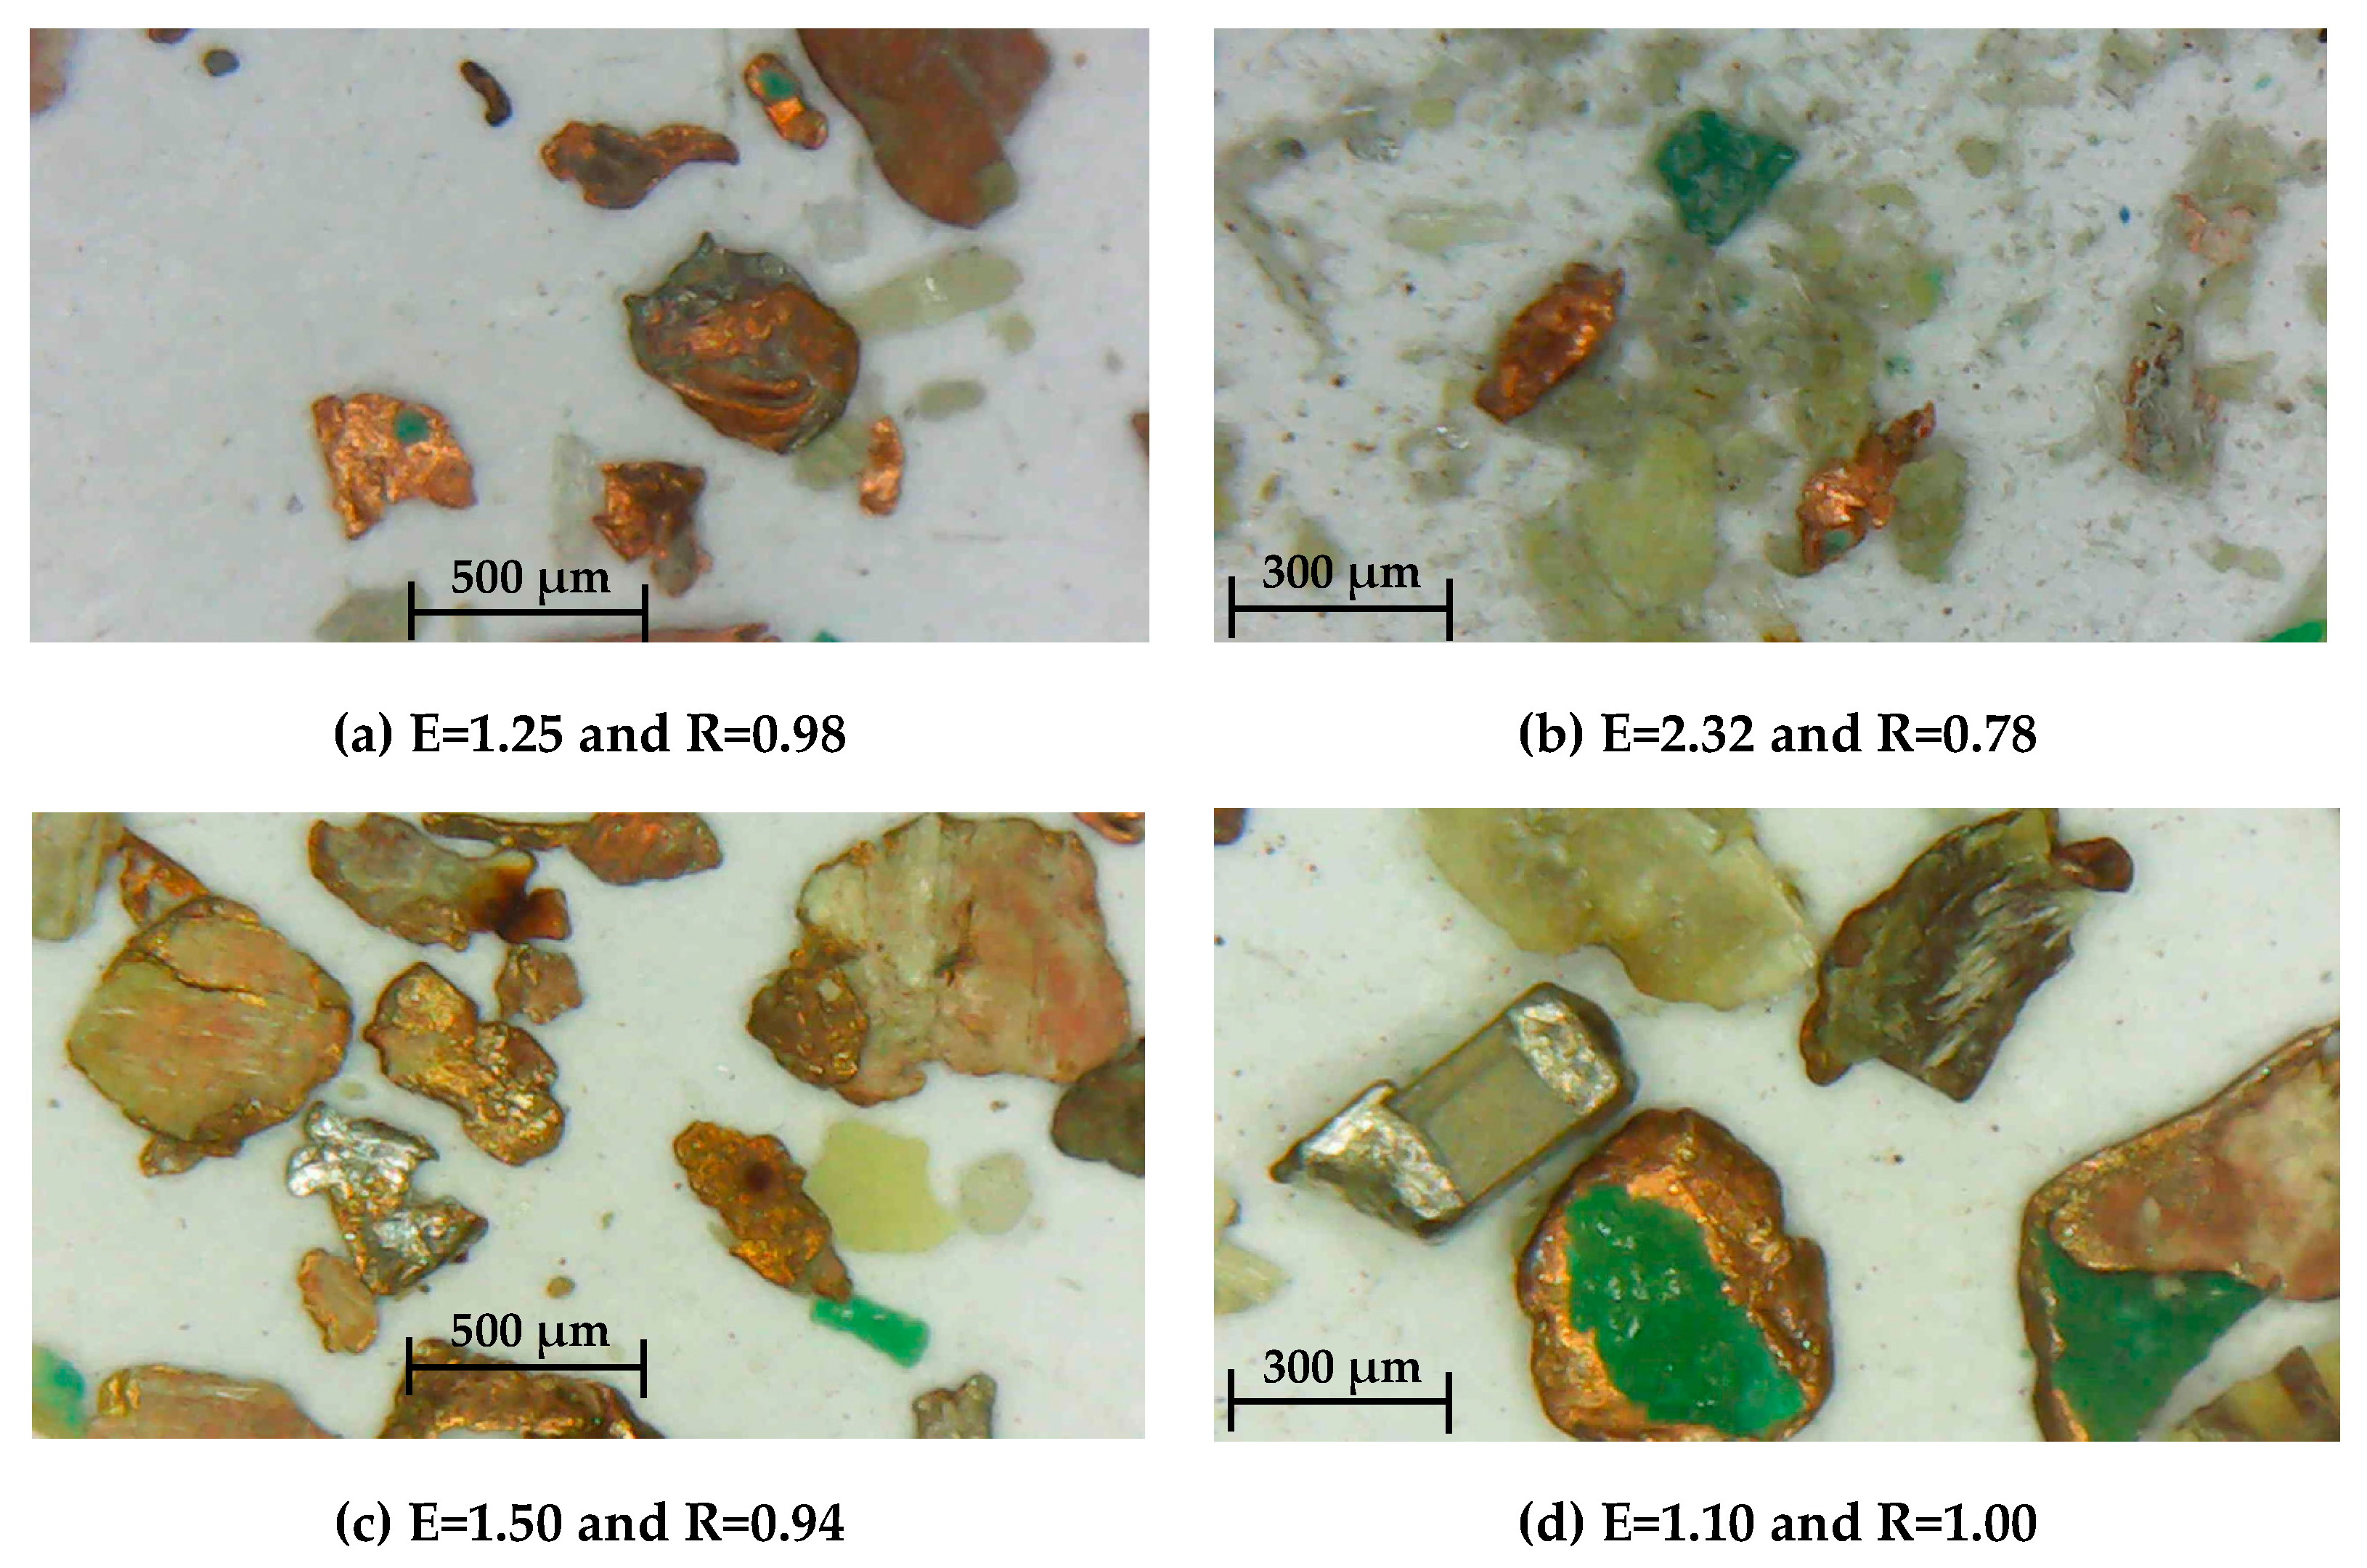
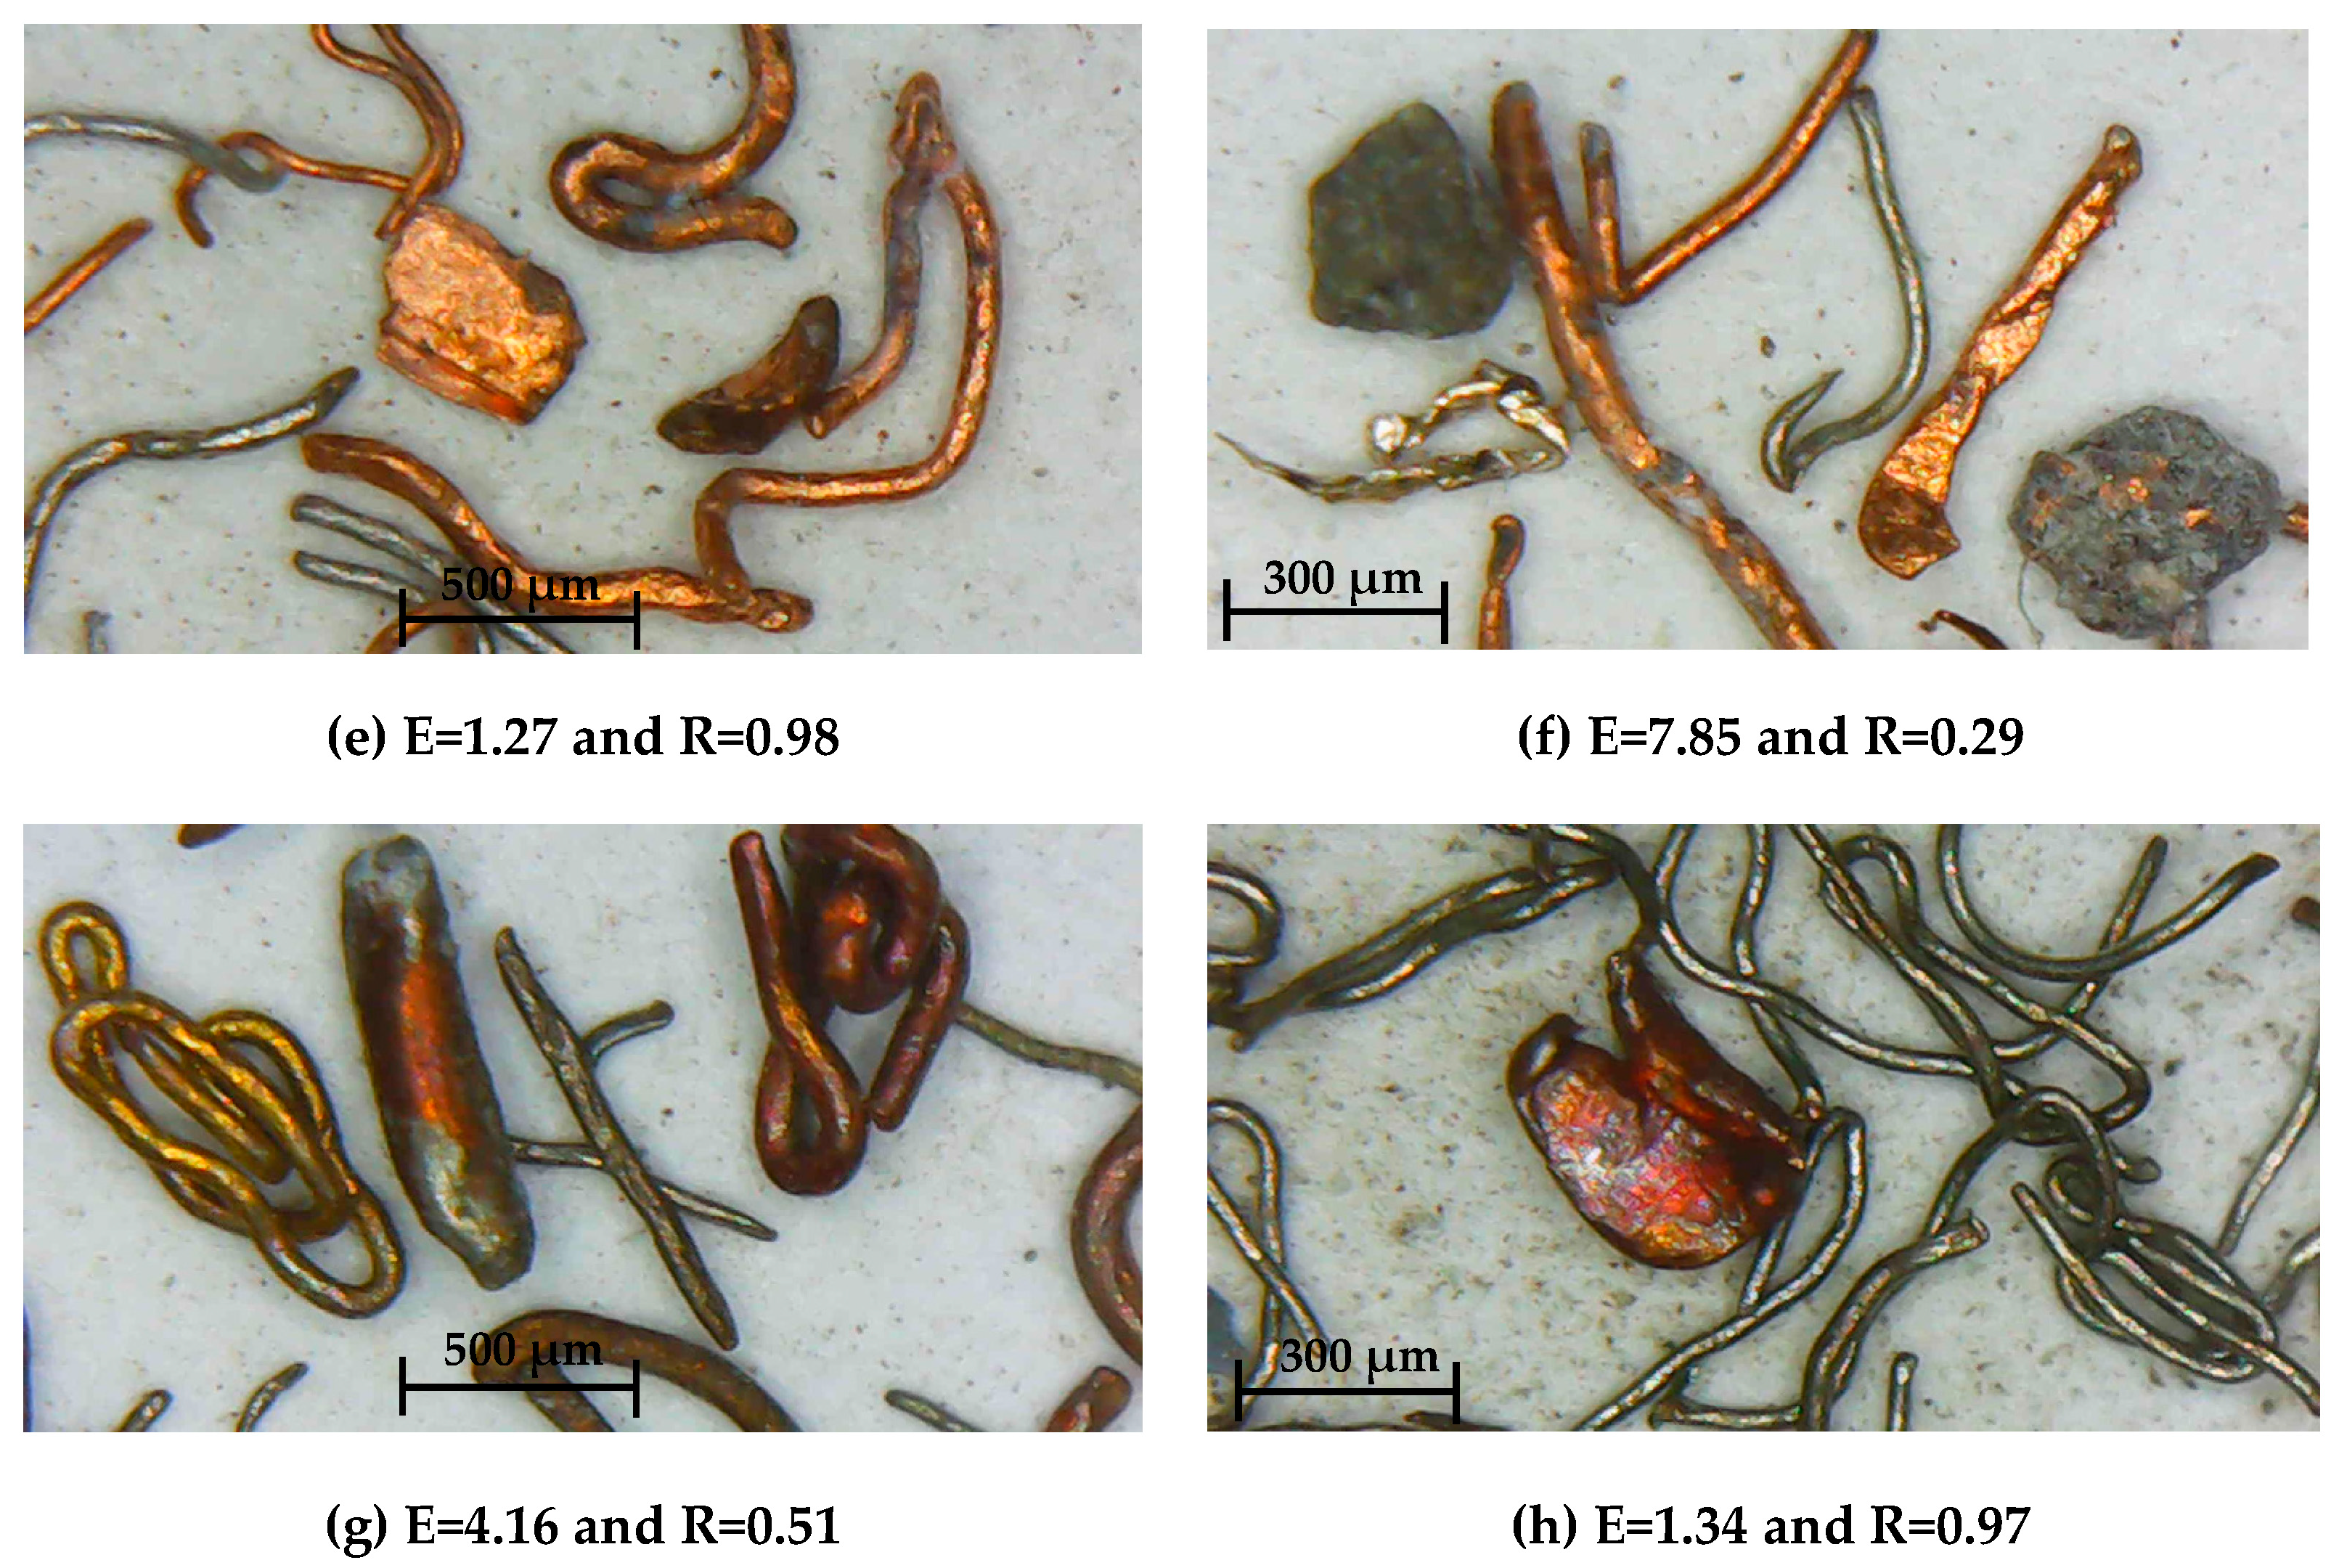
3.3. Shape Characterization of Copper Particles in Gravity and Flotation Separation Stages

The recovery of copper metals from PCBs and WEWs is not only necessary, but also mandatory using the circular economy principle and for economic and ecological considerations (Suponik et al., 2021) [57]. Since the motion of a particle in a fluid is dependent not only on the particle’s density, but also on its size and shape, with large particles being affected more than smaller ones, a thorough investigation should be conducted to thoroughly understand the role of particle shape for copper in concentrate and tailing products of both PCBs and WEWs, which are significantly heterogeneous and complex in terms of the type, size, and shape of components and materials [38].
As seen from Figure 11, for both PCB and WEW materials, the role of particle shape on gravity separation using a shaking table is the opposite of the role of particle shape on flotation, i.e., the round copper particles were mostly observed in the concentrate product (heavy) in gravity separation (see Figure 11a,e), whereas elongated copper particles were observed in the tailing product (light) in gravity separation (see Figure 11b,f). These results are vice versa for flotation separation. In other words, concentrate products of flotation had mainly elongated copper particles, while the tailing products had rounder copper particles (see Figure 11c,g). Ulusoy and Atagun (2023) showed that particle geometry, including particle size and shape as well as density of the minerals, plays a crucial role in separation using a shaking table. Additionally, as the particle shape deviates from an ideal spherical shape, their behavior will be different in the separation process [35].
These results are attributed to the different mechanisms of the separation techniques used in this study. Particles with different shapes were subjected to different drag forces in the water medium. This caused different movements of particles in the water medium in shaking table separation [40].

4. Conclusions

Particles with different morphological properties can be produced according to the size reduction processes applied in the recycling of WEEE. The separation of particles with different particle shapes and sizes in pre-concentration processes can be turned into an advantage. Thus, the coarse metallic concentrate directly contributes to process improvement and environmental issues in downstream metallurgical processes. Gravity separation of metals and plastics which are liberated in coarse sizes after primary crushing can be easily achieved at relatively coarse sizes. The remarkable shape differences between the particles in the material fed to the shaking table have a distinctive effect on their separation in the fluid medium. It has been understood from characterization studies and gravity tests that the grinding process, especially with a disc mill, plays an important role in the change of the grain shape. Despite their high specific gravity, metal particles acquire a laminar shape, especially in the crushing process with compressive force, and mix with the light product on the shaking table, reducing the recovery efficiency. The recovery of metal particles with a layered structure, which creates problems in gravity separation, can be turned into an advantage in the flotation process. Metallic particles with ductile properties can be formed into different shapes during crushing and grinding. In particular, flat-shaped particles are easily transported upwards in the pulp despite their high specific gravity. With the appropriate selection of size reduction equipment, spherical-shaped metal particles can be produced so that they remain in the cell during the reverse flotation process and can be prevented from floating with plastics. The free metals, whose corners were rounded and spherical with the disc mill, could not be easily transported to the froth zone by bubbles and remained in the cell. In the floating product, mostly, fine and flat metal particles were observed. In the first stage of the flotation process, if a plastic product with a low metal content is to be floated, a comminution system should be chosen that will give the metal particles a spherical shape. If a specific metal in the sinking product is given a plate-like property after plastic flotation, metal particles can be separated from the others using flotation.
In conclusion, this study showed that particle size and shape play a crucial role in secondary source recycling processes. Deciding on the most suitable enrichment process after detailed characterization of the products obtained from different comminution devices will directly affect the amount, content, and recovery of the final concentrate.

Supplementary Materials

The following supporting information can be downloaded at: https://www.mdpi.com/article/10.3390/min13070847/s1, Figure S1: Schematic diagram of preparation and beneficiation studies on PCBs; Figure S2. Schematic diagram of preparation and beneficiation studies on WEWs; Figure S3. Optical micrographs of comminuted PCB particles after hammer crusher: (a) free metals, (b) free plastics, (c) free board pieces, (d) free ceramics, (e) free fibers, (f) locked board pieces, (g) locked plastics, (h) locked ceramics; Figure S4. PSD curves of the comminuted products of PCBs; Figure S5. The contents of heavy fractions in shaking table separation at different fractions; Figure S6. The PSD of the WEC sample and the images of products in different size groups.

Author Contributions

F.B., N.İ.D. and H.N.D. contributed to the investigation, methodology, and experimental design. F.B. wrote the paper. F.B. and U.U. were involved in supervision, validation, visualization, review, and editing. All authors have read and agreed to the published version of the manuscript.

Funding

This research received no external funding.

Data Availability Statement

Not applicable.

Acknowledgments

The present study is based on the results of an undergraduate thesis conducted at Istanbul Technical University. The authors sincerely thank the Mineral Processing Engineering Department of Istanbul Technical University for providing laboratory equipment analysis for this research.

Conflicts of Interest

The authors declare no conflict of interest.

References

  1. Forti, V.; Baldé, C.P.; Kuehr, R.; Bel, G. The Global E-Waste Monitor 2020: Quantities, Flows and the Circular Economy Potential. Available online: https://www.itu.int/en/ITU-D/Environment/Documents/Toolbox/GEM_2020_def.pdf (accessed on 30 April 2023).
  2. Nithya, R.; Sivasankari, C.; Thirunavukkarasu, A. Electronic waste generation, regulation and metal recovery: A review. Environ. Chem. Lett. 2021, 19, 1347–1368. [Google Scholar] [CrossRef]
  3. Seif, R.; Salem, F.Z.; Allam, N.K. E-waste recycled materials as efficient catalysts for renewable energy technologies and better environmental sustainability. Environ. Dev. Sustain. 2023. [Google Scholar] [CrossRef]
  4. Kaya, M. Recovery of metals and nonmetals from electronic waste by physical and chemical recycling processes. Waste Manag. 2016, 57, 64–90. [Google Scholar] [CrossRef] [PubMed]
  5. Kaya, M. Current WEEE recycling solutions. In Waste Electrical and Electronic Equipment Recycling: Aqueous Recovery Methods; Veglio, F., Birloaga, I., Eds.; Woodhead Publishing: Delhi, India, 2018; pp. 33–39. ISBN 978-0-08-102058-6. [Google Scholar]
  6. Ulusoy, U. Review of the recovery of cobalt from secondary resources. In Critical and Rare Earth Elements: From Secondary Resources, 1st ed.; Pillai, A., Akcil, A., Eds.; CRS Press/Taylor and Francis Group: New York, NY, USA, 2019; pp. 115–153. ISBN 978-0-367-08647-3. [Google Scholar]
  7. Goosey, M.; Kellner, R. Recycling technologies for the treatment of end of life printed circuit boards (PCBs). Circuit World 2003, 29, 33–37. [Google Scholar] [CrossRef]
  8. Directive, E.U. 96/EC of the European Parliament and of the Council of 27 January 2003 on waste electrical and electronic equipment (WEEE), L 37/24. Off. J. Eur. Union. 2003, 37, 24–38. [Google Scholar]
  9. Kumar, A.; Holuszko, M.; Espinosa, D.C.R. E-waste: An overview on generation, collection, legislation and recycling practices. Resour. Conserv. Recycl. 2017, 122, 32–42. [Google Scholar] [CrossRef]
  10. Salama, A.; Richard, G.; Medles, K.; Zeghloul, T.; Dascalescu, L. Distinct recovery of copper and aluminum from waste electric wires using a roll-type electrostatic separator. Waste Manag. 2018, 76, 207–216. [Google Scholar] [CrossRef]
  11. Xiu, F.R.; Weng, H.; Qi, Y.; Yu, G.; Zhang, Z.; Zhang, F.S.; Chen, M. A novel recovery method of copper from waste printed circuit boards by supercritical methanol process: Preparation of ultrafine copper materials. Waste Manag. 2017, 60, 643–651. [Google Scholar] [CrossRef]
  12. International Copper Association (ICA). Copper—The Pathway to Net Zero, March 2023. Available online: copperalliance.org (accessed on 6 June 2023).
  13. Martinho, G.; Pires, A.; Saraiva, L.; Ribeiro, R. Composition of plastics from waste electrical and electronic equipment (WEEE) by Direct Sampling. Waste Manag. 2012, 32, 1213–1217. [Google Scholar] [CrossRef]
  14. Zhou, Y.; Qiu, K. A New Technology for recycling materials from waste printed circuit boards. J. Hazard. Mater. 2010, 175, 823–828. [Google Scholar] [CrossRef]
  15. Tanısalı, E.; Özer, M.; Burat, F. Precious metals recovery from waste printed circuit boards by gravity separation and leaching. Miner. Process. Extr. Metall. Rev. 2020, 42, 24–37. [Google Scholar] [CrossRef]
  16. Pilone, D.; Kelsall, G.H. Metal recovery from electronic scrap by leaching and electrowinning IV. In Proceedings of the TMS Fall Extraction and Processing Conference; The Minerals, Metals & Materials Society: Vancouver, BC, Canada, 2003; Volume 2, pp. 1565–1575. [Google Scholar]
  17. Li, J.; Shrivastava, P.; Gao, Z.; Zhang, H.C. Printed circuit board recycling: A state-of-the-art survey. IEEE Trans. Electron. Packag. Manuf. 2004, 27, 33–42. [Google Scholar] [CrossRef]
  18. Duan, H.; Hou, K.; Li, J.; Zhu, X. Examining the technology acceptance for dismantling of waste printed circuit boards in light of recycling and environmental concerns. J. Environ. Manag. 2011, 92, 392–399. [Google Scholar] [CrossRef] [PubMed]
  19. Wire and Cable Recycling Market Is Estimated to Gain a Valuation of US$ 30.5 Bn by 2031, TMR Report. Available online: https://www.globenewswire.com/news-release/2022/06/27/2469853/0/en/Wire-and-Cable-Recycling-Market-is-Estimated-to-Gain-a-Valuation-of-US-30-5-Bn-by-2031-TMR-Report.html (accessed on 30 April 2023).
  20. Li, L.; Liu, G.; Pan, D.; Wang, W.; Wu, Y.; Zuo, T. Overview of the recycling technology for copper-containing cables. Resour. Conserv. Recycl. 2017, 126, 132–140. [Google Scholar] [CrossRef]
  21. Xu, J.; Kumagai, S.; Kameda, T.; Saito, Y.; Takahashi, K.; Hayashi, H.; Yoshioka, T. Separation of copper and polyvinyl chloride from thin waste electric cables: A combined pvc-swelling and centrifugal approach. Waste Manag. 2019, 89, 27–36. [Google Scholar] [CrossRef]
  22. Blinová, L.; Godovčin, P. Importance of recycling the waste-cables containing copper and PVC. Res. Pap. Fac. Mater. Sci. Technol. Slovak Univ. Technol. 2021, 29, 1–21. [Google Scholar] [CrossRef]
  23. Tinned Copper Wire. Available online: https://www.remingtonindustries.com/uninsulated-wire/tinned-copper-wire/ (accessed on 30 April 2023).
  24. Copper, Brass & Bronze Wire. Available online: https://www.metalassociates.net/copper-brass-bronze-wire/ (accessed on 30 April 2023).
  25. Scrap Copper Prices. Available online: https://www.hurmetsan.com/hurda-kablo-fiyatlari/ (accessed on 30 April 2023).
  26. Pita, F.; Castilho, A. Separation of copper from electric cable waste based on mineral processing methods: A case study. Minerals 2018, 8, 517. [Google Scholar] [CrossRef] [Green Version]
  27. Lu, J.; Xu, J.; Kumagai, S.; Kameda, T.; Saito, Y.; Yoshioka, T. Separation mechanism of polyvinyl chloride and copper components from swollen electric cables by mechanical agitation. Waste Manag. 2019, 93, 54–62. [Google Scholar] [CrossRef]
  28. Wills, B.A. Wills’ Mineral Processing Technology: An Introduction to the Practical Aspects of Ore Treatment and Mineral Recovery, 7th ed.; Elsevier/BH: Oxford, UK, 2006; ISBN 0750644508. [Google Scholar]
  29. Zhang, S.; Forssberg, E. Intelligent liberation and classification of electronic scrap. Powder Technol. 1999, 105, 295–301. [Google Scholar] [CrossRef]
  30. Li, J.; Duan, H.; Yu, K.; Liu, L.; Wang, S. Characteristic of low-temperature pyrolysis of printed circuit boards subjected to various atmosphere. Resour. Conserv. Recycl. 2010, 54, 810–815. [Google Scholar] [CrossRef]
  31. Sarvar, M.; Salarirad, M.M.; Shabani, M.A. Characterization and mechanical separation of metals from computer printed circuit boards (PCBs) based on mineral processing methods. Waste Manag. 2015, 45, 246–257. [Google Scholar] [CrossRef] [PubMed]
  32. Murphy, K.A.; Dahmen, K.A.; Jaeger, H.M. Transforming mesoscale granular plasticity through particle shape. Phys. Rev. X 2019, 9, 011014. [Google Scholar] [CrossRef] [Green Version]
  33. Ulusoy, U.; Yekeler, M.; Hiçyilmaz, C. Determination of the shape, morphological and wettability properties of quartz and their correlations. Miner. Eng. 2003, 16, 951–964. [Google Scholar] [CrossRef]
  34. Burat, F.; Özer, M. Physical separation route for printed circuit boards. Physicochem. Probl. Miner. Process. 2018, 54, 554–566. [Google Scholar] [CrossRef]
  35. Ulusoy, U. A Review of particle shape effects on material properties for various engineering applications: From macro to nanoscale. Minerals 2023, 13, 91. [Google Scholar] [CrossRef]
  36. Ulusoy, U.; Hiçylmaz, C.; Yekeler, M. Role of shape properties of calcite and barite particles on apparent hydrophobicity. Chem. Eng. Process. Process Intensif. 2004, 43, 1047–1053. [Google Scholar] [CrossRef]
  37. Kademli, M.; Gulsoy, O.Y. The role of particle size and solid contents of feed on mica-feldspar separation in gravity concentration. Physicochem. Probl. Miner. Process. 2012, 48, 645–654. [Google Scholar] [CrossRef]
  38. Cui, J.; Forssberg, E. Mechanical recycling of waste electric and electronic equipment: A review. J. Hazard. Mater. 2003, 99, 243–263. [Google Scholar] [CrossRef]
  39. Ogunniyi, I.O.; Vermaak, M.K.G. Froth flotation for beneficiation of printed circuit boards comminution fines: An overview. Miner. Process. Extr. Metall. Rev. 2009, 30, 101–121. [Google Scholar] [CrossRef]
  40. Ofori-Sarpong, G.; Amankwah, R.K. Comminution environment and gold particle morphology: Effects on gravity concentration. Miner. Eng. 2011, 24, 590–592. [Google Scholar] [CrossRef]
  41. Yenial, Ü.; Burat, F.; Yüce, A.E.; Güney, A.; Kangal, M.O. Separation of PET and PVC by flotation technique without using alkaline treatment. Miner. Process. Extr. Metall. Rev. 2013, 34, 412–421. [Google Scholar] [CrossRef]
  42. Güney, A.; Özdilek, C.; Kangal, M.O.; Burat, F. Flotation Characterization of PET and PVC in the presence of different plasticizers. Sep. Purif. Technol. 2015, 151, 47–56. [Google Scholar] [CrossRef]
  43. Burat, F.; Baştürkcü, H.; Özer, M. Gold&silver recovery from jewelry waste with combination of physical and physicochemical methods. Waste Manag. 2019, 89, 10–20. [Google Scholar] [CrossRef]
  44. Mennik, F.; Dinç, N.İ.; Burat, F. Selective recovery of metals from spent mobile phone lithium-ıon batteries through froth flotation followed by magnetic separation procedure. Results Eng. 2023, 17, 100868. [Google Scholar] [CrossRef]
  45. Dinç, N.İ.; Tosun, A.U.; Baştürkcü, E.; Özer, M.; Burat, F. Recovery of valuable metals from WPCB fines by centrifugal gravity separation and froth flotation. J. Mater. Cycles Waste Manag. 2022, 24, 224–236. [Google Scholar] [CrossRef]
  46. Ulusoy, U.; Atagun, O.N. Particle shape characterization of shaking table streams in a turkish chromite concentration plant by using dynamic ımaging and microscopical techniques. Part. Sci. Technol. 2023, 41, 141–150. [Google Scholar] [CrossRef]
  47. Forssberg, E.; Zhai, H. Shape and surface properties of particles liberated by autogenous grinding. Scand. J. Metall. 1985, 1, 25–32. [Google Scholar]
  48. Beyer, W.H. Handbook of Mathematical Sciences, 6th ed.; Beyer, W.H., Ed.; CRC Press: Boca Raton, FL, USA, 1978; pp. 7–30. [Google Scholar]
  49. Heywood, H. The scope of particle size analysis and standardization. In Proceedings of the Institution of Chemical Engineers, Symposium on Particle Size Analysis, London, UK, 4 February 1947. [Google Scholar]
  50. Hausner, H.H. Characterization of the powder particle shape. Planseeber. Pulvermetall. 1966, 14, 75–84. [Google Scholar]
  51. Hagerman, T.H.; Black, K.; Lilliesköld. Shape and Surface of Mineral Grains Tested for Mortar and Concrete Purposes through Image Analysis; Swedish Council for Building Research: Stockholm, Swedish, 1980; Volume 26, pp. 63–72. [Google Scholar]
  52. Koyanaka, S.; Ohya, H.; Lee, J.C.; Iwata, H.; Endoh, S. Impact milling of printed circuit board wastes for resources recycling and evaluation of the liberation using heavy medium separation. J. Soc. Powder Technol. Jpn. 1999, 36, 479–483. [Google Scholar] [CrossRef] [Green Version]
  53. Burat, F.; Demirağ, A.; Şafak, M.C. Recovery of noble metals from floor sweeping jewelry waste by flotation-cyanide leaching. J. Mater. Cycles Waste Manag. 2020, 22, 907–915. [Google Scholar] [CrossRef]
  54. Han, J.; Duan, C.; Li, G.; Huang, L.; Chai, X.; Wang, D. The influence of waste printed circuit boards characteristics and nonmetal surface energy regulation on flotation. Waste Manag 2018, 80, 81–88. [Google Scholar] [CrossRef]
  55. He, J.; Duan, C. Recovery of metallic concentrations from waste printed circuit boards via reverse floatation. Waste Manag. 2017, 60, 6018–6628. [Google Scholar] [CrossRef] [PubMed]
  56. Allan, G.C.; Woodcock, J.T. A review of the flotation of native gold and electrum. Miner. Eng. 2001, 14, 931–962. [Google Scholar] [CrossRef]
  57. Suponik, T.; Franke, D.M.; Nuckowski, P.M.; Matusiak, P.; Kowol, D.; Tora, B. Impact of Grinding of Printed Circuit Boards on the Efficiency of Metal Recovery by Means of Electrostatic Separation. Minerals 2021, 11, 281. [Google Scholar] [CrossRef]
Figure 1. The samples used in experimental studies: (a) EOL PCBs and (b) WEWs.
Minerals 13 00847 g001
Figure 2. Measurement of the length (L) and width (W) of each particle projection exported from a microscope image on the COREL Draw program.
Minerals 13 00847 g002
Figure 3. Optical micrographs of the PCB particles ((a): +4.76 mm; (b): −4.76 + 2 mm; (c): −2 + 1 mm; (d): −1 + 0.5 mm; (e): −0.5 + 0.212 mm; (f): −0.212 + 0.106 mm; (g): −0.106 + 0.053 mm; (h): −0.053 mm) in different fractions after the shredding.
Minerals 13 00847 g003
Figure 4. Optical micrographs of the PCB particles ((a): +4.76 mm; (b): −4.76 + 2 mm; (c): −2 + 1 mm; (d): −1 + 0.5 mm; (e): −0.5 + 0.212 mm; (f): −0.212 + 0.106 mm; (g): −0.106 + 0.053 mm; (h): −0.053 mm) in different fractions after the hammer crushing.
Minerals 13 00847 g004
Figure 5. Optical micrographs of the PCB particles ((a): −1 + 0.5 mm; (b): −0.5 + 0.212 mm; (c): −0.212 + 0.106 mm; (d): −0.106 + 0.053 mm; (e): −0.053 mm) in different fractions after the disc milling.
Minerals 13 00847 g005
Figure 6. Optical micrographs of the particles in the heavy ((ac)) and the light fractions ((df)) of PCB sample after the shaking table test.
Minerals 13 00847 g006
Figure 7. Optical micrographs of the particles in the float ((a): float 1; (b): float 2; (c): float 3) and the sink (d) fractions of the PCB sample after flotation tests.
Minerals 13 00847 g007
Figure 8. Optical micrographs of particles (1: copper, 2: plastic, 3: aluminum, 4: tinned copper; 5: brass, 6: fiber, 7: ceramic) at different fractions ((a): +1 mm; (b): −1 + 0.5 mm; (c): −0.5 + 0.3 mm; (d): −0.3 + 0.212 mm; (e): −0.212 mm) in the various fractions of WEW sample.
Minerals 13 00847 g008
Figure 9. Optical micrographs of the particles in the heavy (a,b) and the light fractions (c,d) of the WEW sample after the shaking table test.
Minerals 13 00847 g009
Figure 10. Optical micrographs of the particles in the float ((a): float 1; (b): float 2; (c): float 3; (d): float 4) and the sink (e) fractions after the flotation test.
Minerals 13 00847 g010
Figure 11. Shape characterization of copper particles (a) at the concentrate product using a shaking table for PCB, (b) at the tailing product using a shaking table for PCB, (c) at the concentrate product using copper flotation for PCB, (d) at the tailing product using copper flotation for PCB, (e) at the concentrate product using a shaking table for WEW, (f) at the tailing product using a shaking table for WEW, (g) at the concentrate product using copper flotation for WEW, and (h) at the tailing product using copper flotation for WEW.
Minerals 13 00847 g011aMinerals 13 00847 g011b
Table 1. Metal contents and recoveries after gravity separation of PCBs.
ProductsAmount, %CuAuAgSnAl
C, %R, %C, g/tR, %C, g/tR, %C, %R, %C, %R, %
Heavy28.462.4652.15358.4188451.05.4658.920.79.3
Light71.622.7447.91541.671949.01.5141.082.7290.7
Total100.034.02100.026100.01050100.02.63100.02.15100.0
C: Content; R: Recovery.
Table 2. Metal contents and recoveries after the flotation of PCBs.
ProductsAmount, %CuAuAgSnAl
C, %R, %C, g/tR, %C, g/tR, %C, %R, %C, %R, %
Float 126.41.581.24749.63819.60.77.34.1548.0
Float 229.512.3210.61618.742612.00.8710.12.6834.6
Float 321.482.1151.41411.9102521.01.512.60.757.0
Sink22.755.436.82219.8264257.47.8570.01.0510.4
Total100.034.17100.025100.01045100.02.54100.02.29100.0
C: Content; R: Recovery.
Table 3. Metal contents and recoveries after the gravity separation of WEWs.
ProductsAmount, %CuAlFeSnZn
C, %R, %C, %R, %C, %R, %C, %R, %C, %R, %
Heavy87.592.8494.92.9830.10.0463.60.3997.50.5695.6
Light12.535.275.148.5569.90.1636.40.072.50.184.4
Total100.085.64100.08.68100.00.06100.00.35100.00.51100.0
C: Content; R: Recovery.
Table 4. Metal contents and recoveries after the flotation of WEWs.
ProductsAmount, %CuAlFeSnZn
C, %R, %C, %R, %C, %R, %C, %R, %C, %R, %
Float 128.993.5431.50.010.10.015.00.032.40.3218.1
Float 218.187.0518.38.1417.30.026.30.084.11.2544.2
Float 323.785.1223.59.2525.80.0520.70.2416.00.6530.2
Float 411.481.5110.814.1419.00.0611.90.6420.40.184.0
Sink17.976.5415.918.0837.80.1856.11.1457.10.13.5
Total100.085.95100.08.52100.00.06100.00.36100.00.51100.0
C: Content; R: Recovery.
Disclaimer/Publisher’s Note: The statements, opinions and data contained in all publications are solely those of the individual author(s) and contributor(s) and not of MDPI and/or the editor(s). MDPI and/or the editor(s) disclaim responsibility for any injury to people or property resulting from any ideas, methods, instructions or products referred to in the content.

