Article

Characterization of Nigerian Zircon Sand and Its Suitability for Different Industrial Applications

by
Benneth Ifenna Okoli
1,2,*,
Olufemi A. Agboola
1,2,
Azikiwe Peter Onwualu
3,
Abdulhakeem Bello
4,
Olusegun Samuel Sholiyi
1,2,
Vitalis C. Anye
3 and
Olatunbosun T. Yusuf
1,2
1
Department of Aerospace Engineering, African University of Science and Technology, Km. 10 Airport Rd., P.M.B 681, Garki, Abuja 900107, Nigeria
2
National Space Research and Development Agency, Institute of Space Science and Engineering, Obasanjo Space Centre, Umaru Musa Yar’adua Express Way, P.M.B 437, Garki, Abuja 900108, Nigeria
3
Department of Materials Science and Engineering, African University of Science and Technology, Km. 10 Airport Rd., P.M.B 681, Garki, Abuja 900107, Nigeria
4
Department of Theoretical and Applied Physics, African University of Science and Technology, Km. 10 Airport Rd., P.M.B 681, Garki, Abuja 900107, Nigeria
*
Author to whom correspondence should be addressed.
Minerals 2023, 13(6), 711; https://doi.org/10.3390/min13060711
Submission received: 18 April 2023 / Revised: 17 May 2023 / Accepted: 19 May 2023 / Published: 23 May 2023
(This article belongs to the Section Mineral Processing and Extractive Metallurgy)

Abstract

:
This paper describes the potential industrial use of zircon from Nigeria (Plateau, Nasarawa, Kano, Kaduna, Bauchi, and Adamawa states). Different techniques, equipment, and indices such as scanning electron microscope, energy dispersive X-ray fluorescence, X-ray diffraction, Fourier transform infrared spectroscopy, specific gravity, refractive index, pH, and hardness were used to examine the samples. The X-ray diffraction showed predominantly quartz, zirconium oxide, and other heavy minerals. All twelve samples showed the presence of Zr-O, SiO 4 2 , Zr-OH, and OH, with pH values ranging from 7.3 to 7.8. Six of the zircon samples had a refractive index between 1.4 and 12.5. The hardness values ranged from 0.0021 to 0.0703 GPa, while the elastic moduli were between 0.00558 and 0.9593 GPa. Four of the twelve untreated zircon samples with specific gravities above 4.2 g/cm3, which is the United States Geological Survey minimum recommended standard for zircon sand, needed to be upgraded to increase the ZrO2 weight percentages and purity toward improving their suitability for zircon-reinforced composites applications in aerospace and also for ceramic, foundry, building and construction, and refractory industries. The study’s findings can be incorporated by the industries into their businesses for the development of novel industrial materials as well as the processing methods and procedures for beneficiation of the mineral for value-addition.

1. Introduction

Systematic mining in Nigeria started in 1903 after the colonial government commissioned mineral surveys of the Southern and Northern protectorates [1]. The discovery of marketable crude oil after years of neglect set back the mining sector in Nigeria. As part of efforts to position the mining sector as both a development engine and for economic diversification, the Federal Government of Nigeria (FGN) issued a Roadmap for the Growth and Development of Nigeria’s (ERGP) Mining Industry in 2016. Diversifying the economy away from oil and boosting local content utilization are two key components of the Roadmap. Developing the mining industry, including adding value to the minerals that are mined, is one approach to diversify the economy. The ERGP recognized the industry as a strategic target for diversifying Nigeria’s economy. As part of ERGP’s blueprint execution, the Solid Minerals Development Fund (SMDF) was founded under the Nigerian Minerals and Mining Act [2]. One of the minerals being promoted is zircon sand. Thus, there is a need to encourage the extraction and use of zircon sand for the aerospace industry and other industrial applications. These policy measures are aimed to encourage domestic and foreign investment in local minerals [1].
The aerospace industry seeks to operate its planes as effectively as possible, lowering fuel consumption and reducing environmental impact [3]. Millions of Dollars are spent on developing advanced materials in designing more efficient engines and improving manufacturing procedures to reduce waste and environmental impact [3,4,5,6,7,8]. Manufacturing parts with lightweight, rough-terrain-capable materials is a key efficiency strategy [3]. Local zircon sand is used to make high-zirconia. Zircon, a mineral found in ancient heavy mineral sand deposits, is used to make turbine blades. Its unique properties make it ideal for jet engine ceramics to ensure the effective and clean operation, and it supports the production of many sophisticated plane parts [3].
In Nigeria, zircon sand has been in existence. The largest composition of these sand deposits is found mostly in the Northern regions of Nigeria. The zircon sand is produced as a byproduct of the tin mining process [9,10,11,12]. Prior research on Nigerian zircon sand centered on its application as foundry sand, refractory material, and composite analysis. There is no discussion of the mineral’s structure, composition, or mineralogy, and it has unknown potential for aerospace industry and other enterprises and a location database.
In-depth literature studies have been conducted on zircon sand characterization and its uses [8,13,14,15,16,17,18,19,20,21]. Nonetheless, there is little information in these data about the precise methods for evaluating zircon sand characterization in Nigeria aiming to reveal the uses, effectiveness of the characterization, and quality of the local product and render a parallel comparative evaluation between the local product and the globally accepted zircon sand.
Due to its hardness, high modulus of elasticity, and exceptional thermal stability, zircon is being investigated for aluminum metal matrix composites (AMCs) [22,23]. Zircon’s particle-reinforced hardness improves its mechanical and load-bearing capacities, according to a structural study [24]. To allow for considerable improvements in the operating conditions and lifetimes of essential rocket nozzle and engine components (combustion chamber, coupler, and bulkhead), high-melting, lightweight materials that are chemically, mechanically, and thermally durable are required. Zircon-reinforced composite is one example of such material. Zirconia composites can be utilized to make solid rocket motors (SRM) for launch vehicles (rockets) due to their stability and light weight. Solid propellant rocket motors are frequently employed in civil and military applications that demand a high thrust-to-weight ratio for short time intervals [25]. By modifying their design, solid rocket motors can produce a wide range of thrust. The most effective design criterion is the geometry of the nozzle and rocket engine components [25]. The inertness of the material, the material’s ability to withstand high temperature and pressure, and the corrosion resistance of the working fluid are major design issues for rocket SRM. Zirconium is a grayish-white metal that is used in a variety of industrial, commercial, and scientific applications [26]. It is the twentieth most abundant element in the Earth’s crust and is found in zircon (ZrSiO4) and baddeleyite (ZrO2) [26].
It is common to evaluate the purity of zircon by comparing the ratio of zirconium oxide (zirconia) to hafnium oxide (hafnia), and it has been shown that zircon generally has a ratio of 50 zirconium to 1 hafnium [27,28]. Although there is no minimum grade requirement, commercially available zircon grades are frequently comparable everywhere [28]. Standard-grade zircon normally contains 65% minimum zirconium oxide–hafnium oxide, 0.25% maximum titanium oxide, and 0.12% maximum iron oxide. The intermediate-grade zircon is 65.5% minimum zirconium oxide–hafnium oxide, 0.03% maximum titanium oxide, and 0.1% maximum iron oxide. Premium-grade zircon normally has 66% minimum zirconium oxide–hafnium oxide, 0.1% maximum titanium oxide, and 0.05% maximum iron oxide in its chemical makeup [28]. Zircon has a ZrO2 content between 63% and 67%, a specific gravity of 4.2–4.86 g/cm3, and a Mohs hardness of 7.5 [29,30,31,32].
Zirconium can be found in both primary igneous deposits (magmatic or volcanic) and secondary placer deposits (heavy mineral sands) [3]. Approximately 97 percent of zirconium compounds and zirconium metal produced worldwide are derived from zircon recovered from heavy mineral sand deposits (also known as secondary placer type deposits), with the remaining 3 percent originating from primary igneous deposits such as baddeleyite [33]. The primary steps are mining, wet concentration, and dry separation. Wet mining (using dredges for unconsolidated deposits) or dry mining (employing scrapers, dozers, and excavators, typical for cemented deposits) are both utilized for extraction. The wet concentration process [34] uses a gravity circuit to separate valuable heavy mineral sand from nonvaluable and lighter gangue to produce a high-grade heavy mineral concentrate (85–95 percent) (HMC) [35]. Zircon and its concentrates are in high demand in emerging research and development including zircon 3D printing, solar cells, shape memory alloys (SMA), advanced coatings and functional materials, advanced ceramics, grinding media and grinding technologies, biomedical applications, catalysis, fuel cells and batteries, adsorption and immobilization, sensing, nanomaterials, nanorods, nanostructures and nanofabrication, optical materials, electronics and solid state devices, fabrication of ceramic membranes, and developing passive energy-saving systems [3,36,37].
Industrial applications of the Nigerian zircon mineral are undervalued and contribute little to national economic diversification. The FGN’s diversification strategy includes the mining and export of zircon sand on a considerable scale and a ban on the importation of minerals or materials that are deposited in the nation to encourage local content utilization [2]. These initiatives will only be successful if scientific knowledge and data enable stakeholders along the mineral value chain to make informed decisions. The Federal Ministry of Mines and Steel Development (MMSD), Mines Environmental Compliance Department (MEC), Mineral Resources and Environmental Management Committee (MIREMCO), Roadmap for the Growth and Development of the Nigerian Mining Industry, Nigerian Local Content Monitoring Board (NLCMB), Nigerian Geological Survey Agency (NGSA), and Raw Materials Research and Development Council (RMRDC) are some of the FGN instituted organizations carrying out these tasks. The current study aims to support these efforts with experimental data. The mineral’s structure, chemical composition, functional groups, refractive index, specific gravity, hardness, pH value, physical appearance, mineralogy, the potential for aerospace and other enterprises, and a location database are presented. All twelve samples have pH values ranging from 7.3 to 7.8. Six of the zircon samples have a refractive index between 1.4 and 12.5. The hardness values ranged from 0.0021 to 0.0703 GPa, while the elastic moduli were between 0.0558 and 0.9593 GPa. Four samples have ZrO2 content above 20% and good specific gravities of 4.2–4.4 g/cm3; 4.2 is the USGS minimum standard for zircon sand. In essence, the major objective of this study was to offer important scientific data that will support the efforts of several governments, organizations, investors, researchers, companies, and other enablers in Africa and other developing continents on the value addition of zircon sand deposits in Nigeria.

2. Materials and Methods

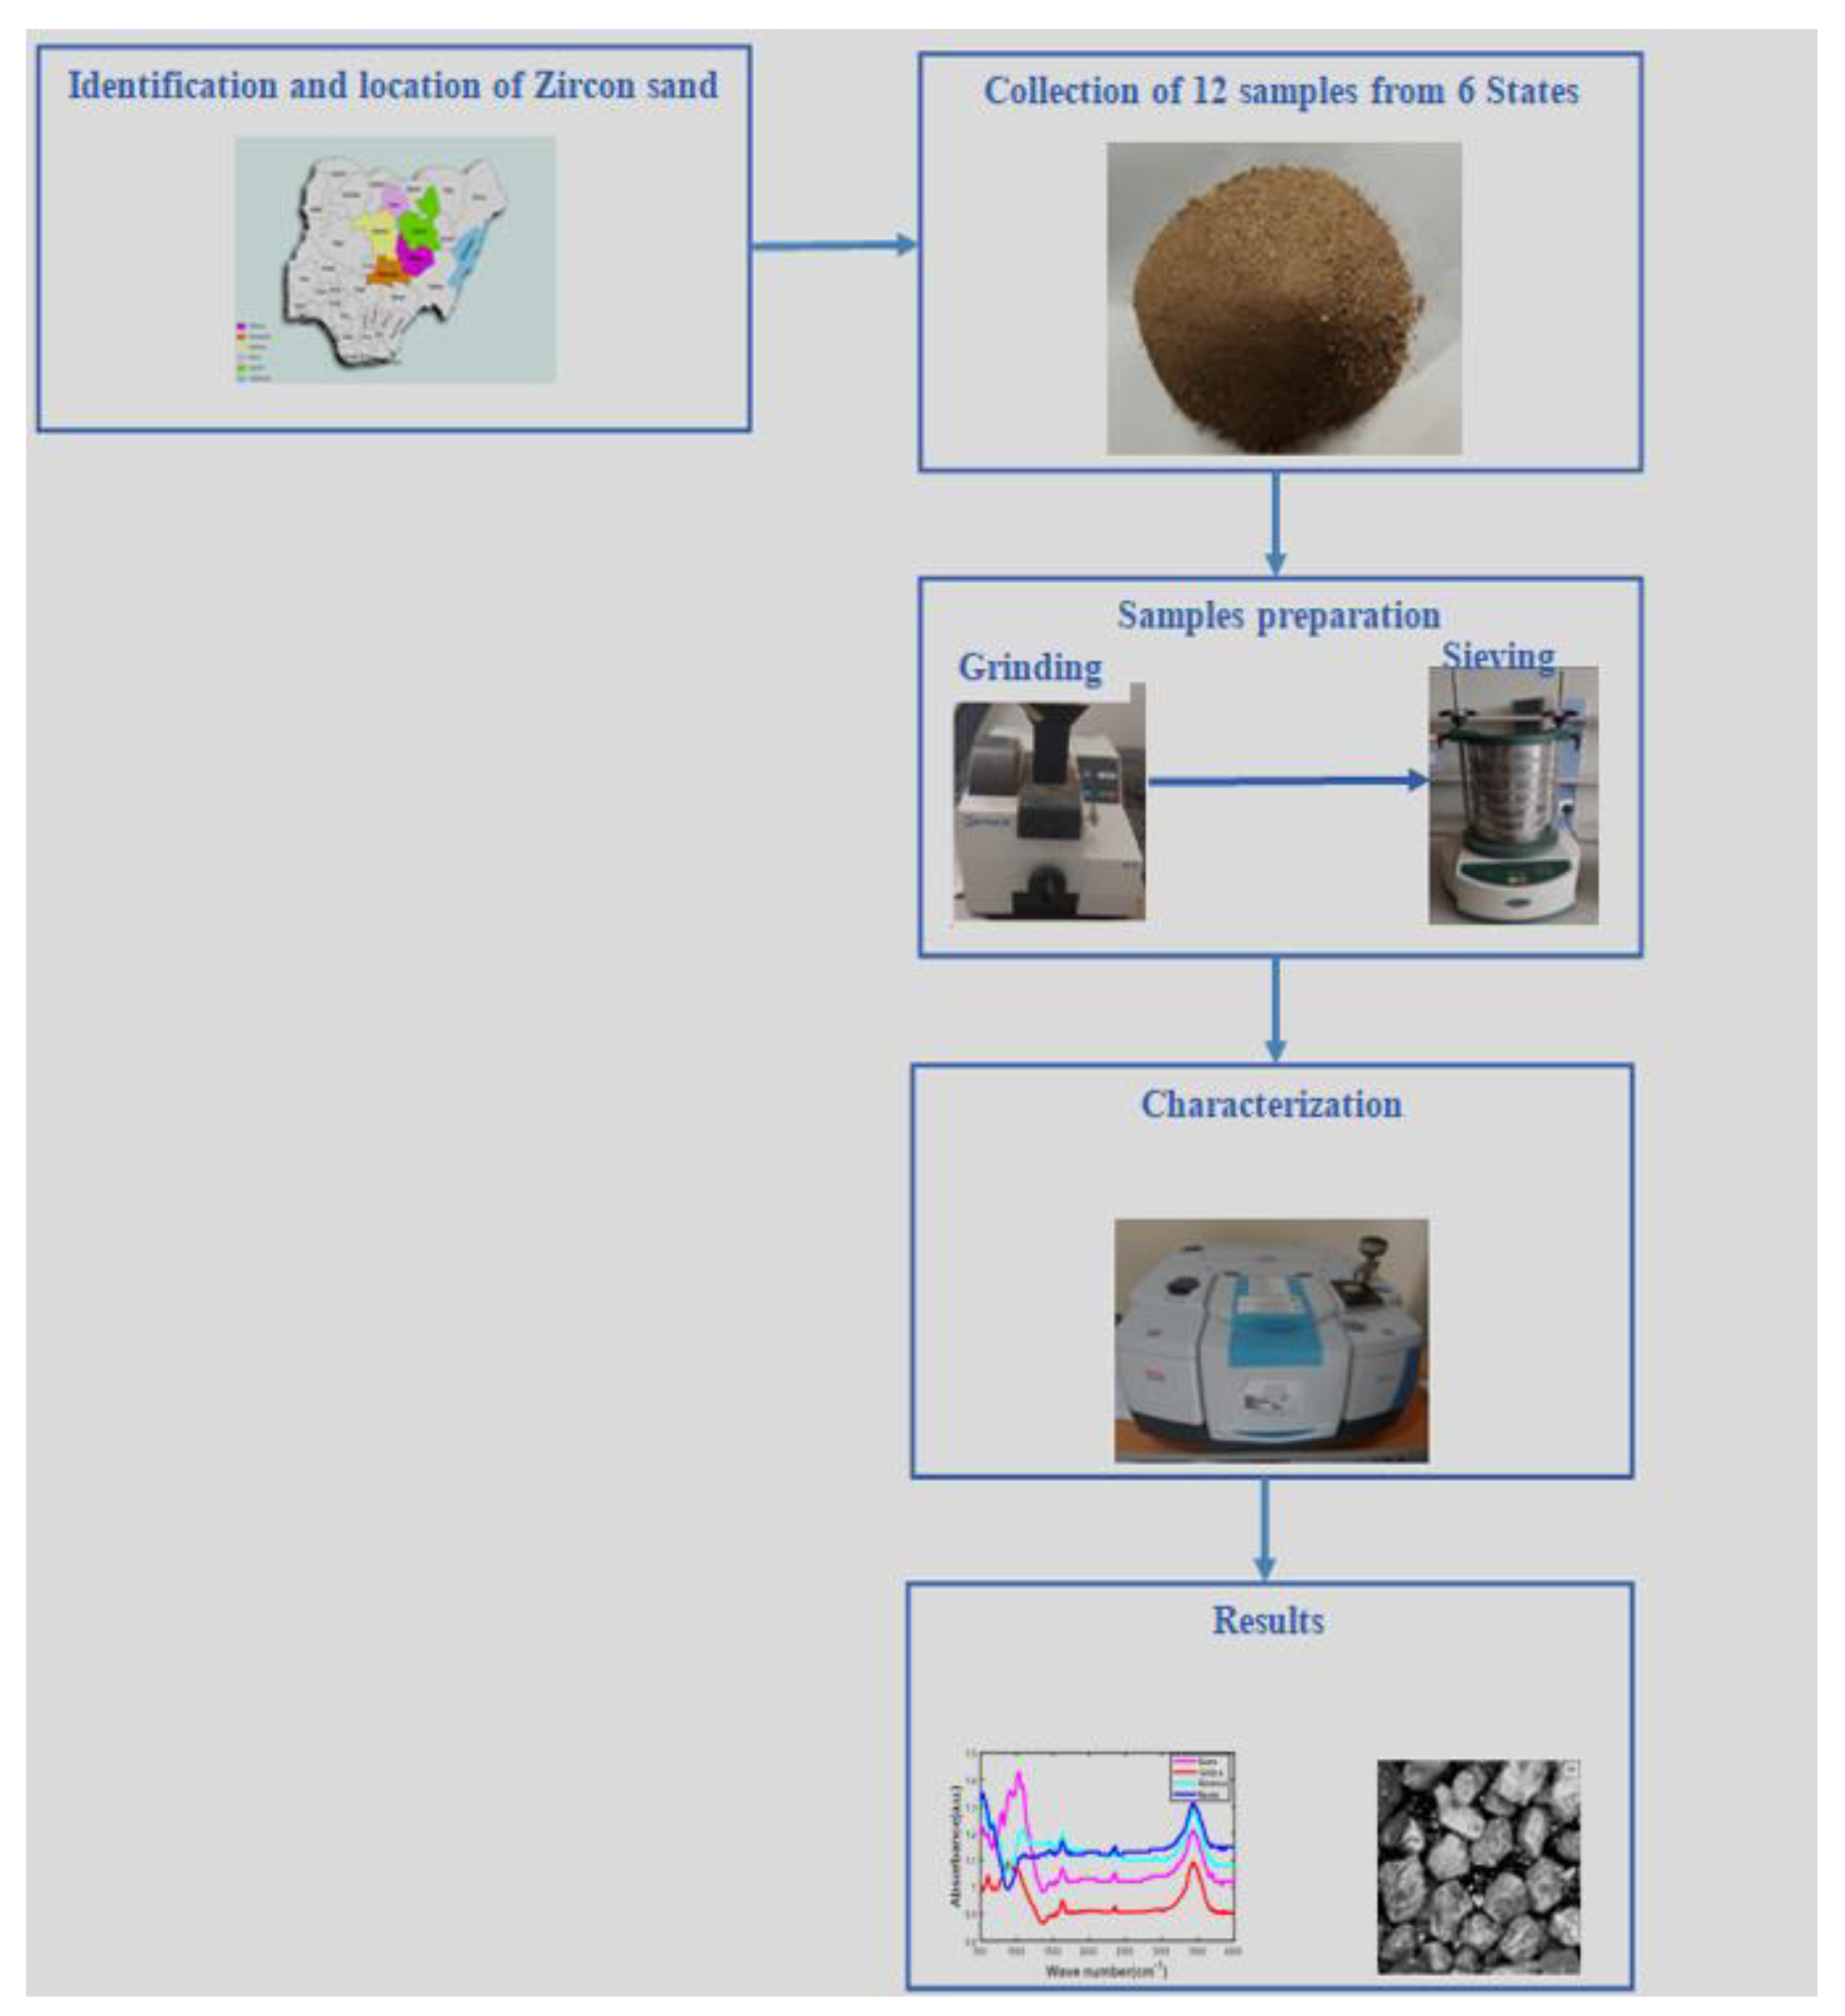
2.1. Overview of Methodology
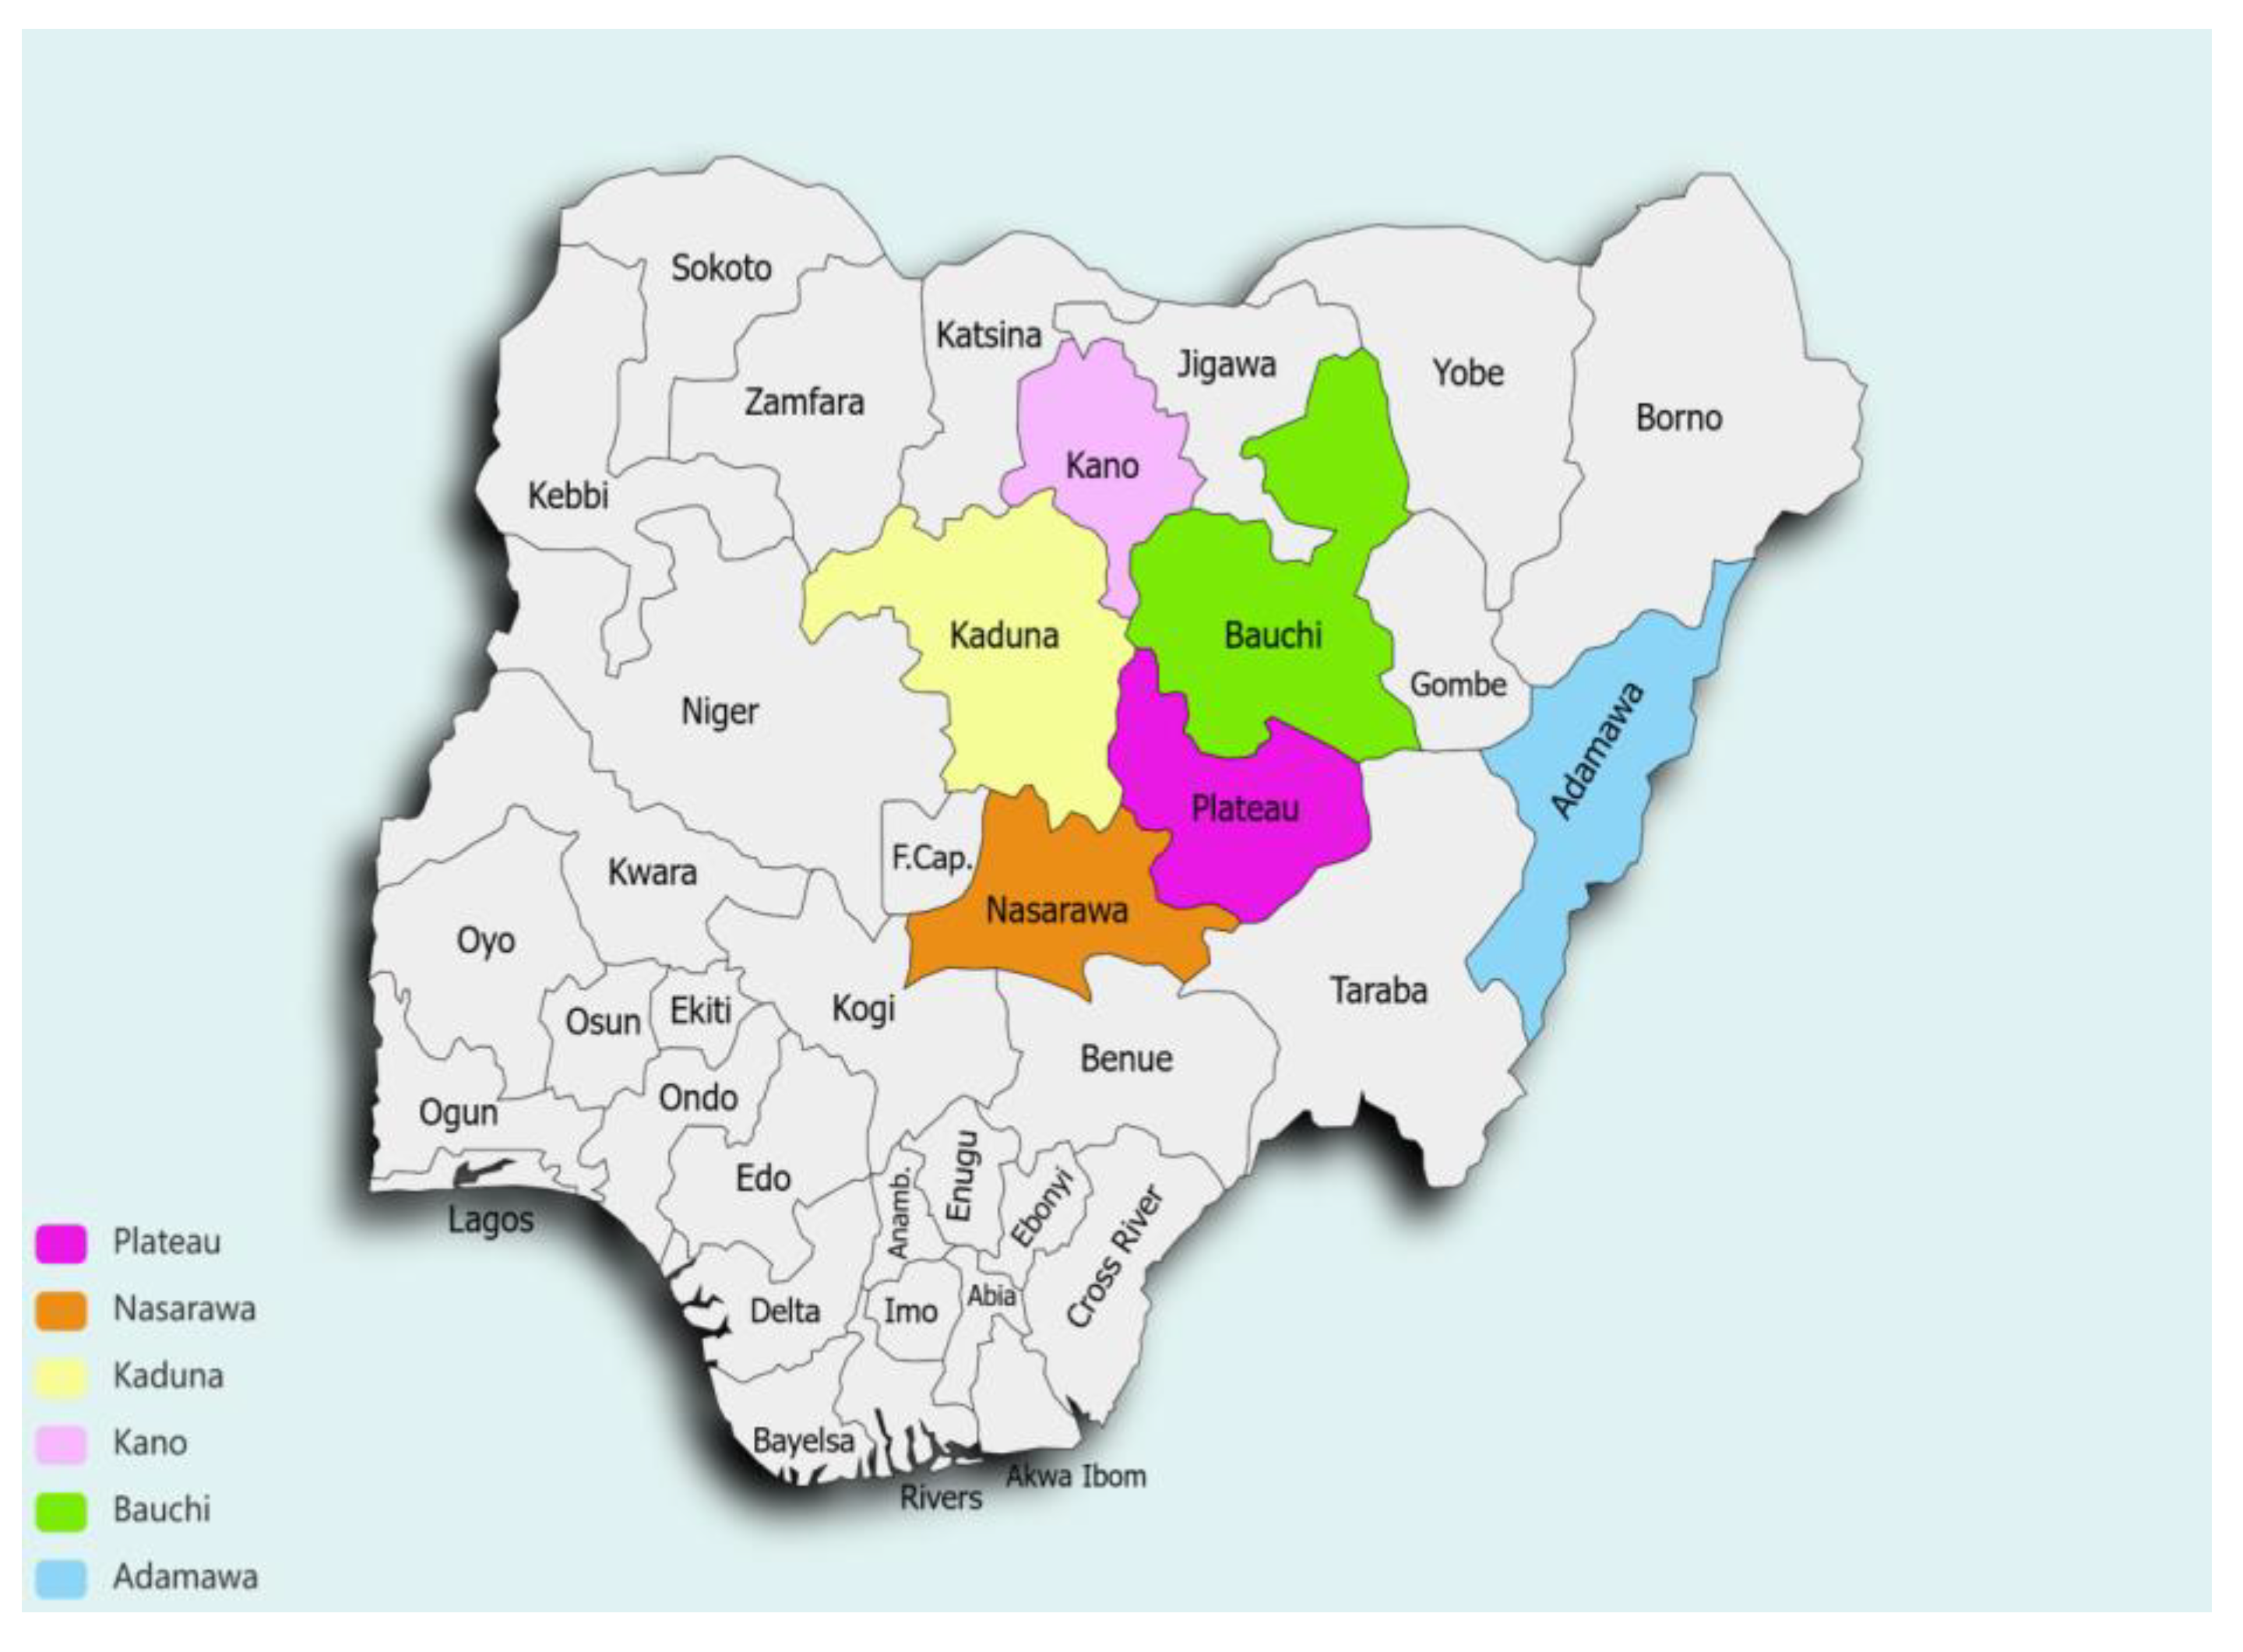
The study’s methodology flowchart is shown in Figure 1. The approach includes identifying the different locations where the samples are deposited. Those sites were visited, and the samples were collected in bags. To prepare the samples for the various tests outlined, the samples were ground and sieved. The prepared samples were characterized, and the results obtained were documented.

2.2. Study Location

Previous investigations on zircon sand have revealed that Northern Nigeria, specifically Taraba, Plateau, Nasarawa, and Kano, are among the producing states. Beyond these states, other key producers are Kaduna, Bauchi, and Adamawa states. The following states provided the research samples used in this study (one per state): Kuru in Plateau state, Arikya in Nasarawa state, Riruwai in Kano state, and Koma in Adamawa state. The samples from Kaduna state were collected in two distinct locations, Banki and Damau, and in Bauchi, samples were collected from six places, namely, Gumau, Rishi, Wul, Dawa, Kirfi vein 1, and Kirfi vein 2. Figure 2 is a map of Nigeria that identifies the sites from which samples were collected.

2.3. Sample Collection and Preparation

The various zircon deposit locations in Nigeria were visited, including Plateau, Nasarawa, Kano, Kaduna, Bauchi, and Adamawa, with typical samples collected from artisanal miners working on the sites. The lithology of the deposits was investigated by examining the rock exposed within the deposits. The samples were collected at various locations and labeled to facilitate identification. Table 1 shows the sampling state, locations, GPS coordinates, and local government area. The samples were crushed using a jaw crusher (Retsch GmbH, Haan, Germany, Jaw crusher BB 50 rostfrei—rostfrei). Using an Endecotts (Octagon 200, Endecotts Limited, London, UK) sieve, the samples were separated into four sizes: 425 microns, 150 microns, 106 microns, and 45 microns.

2.4. Samples Characterization

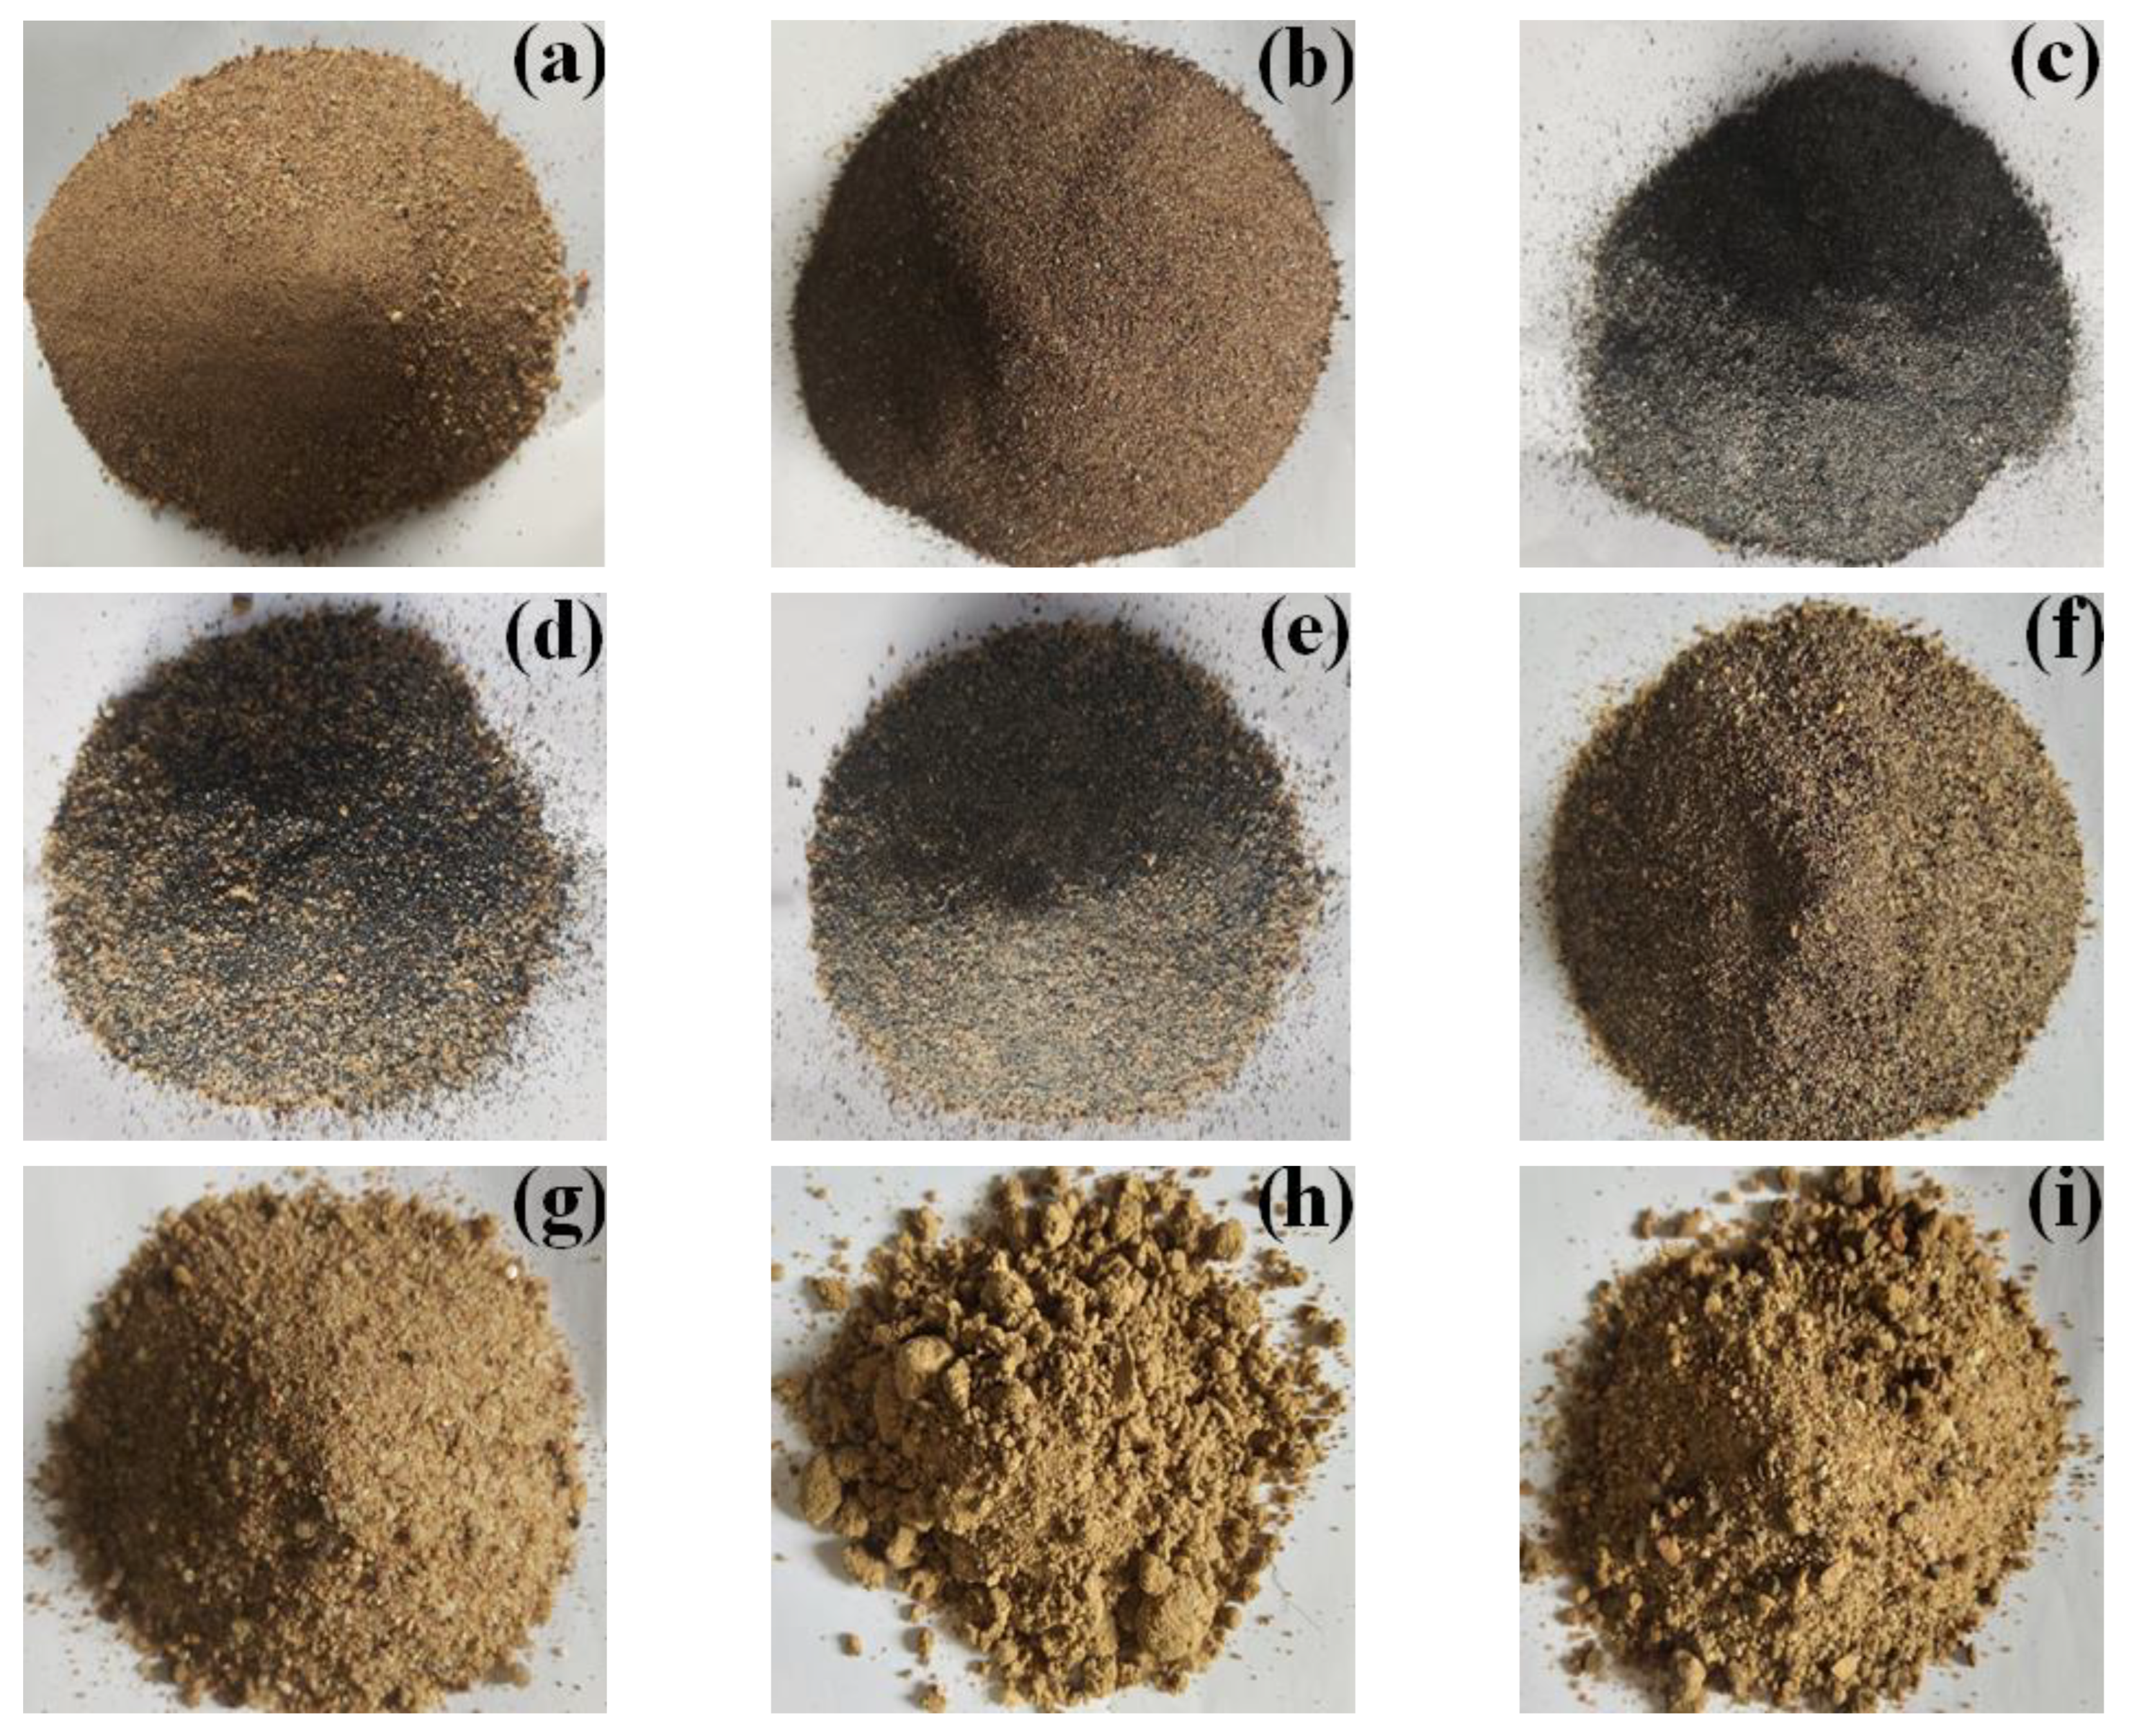
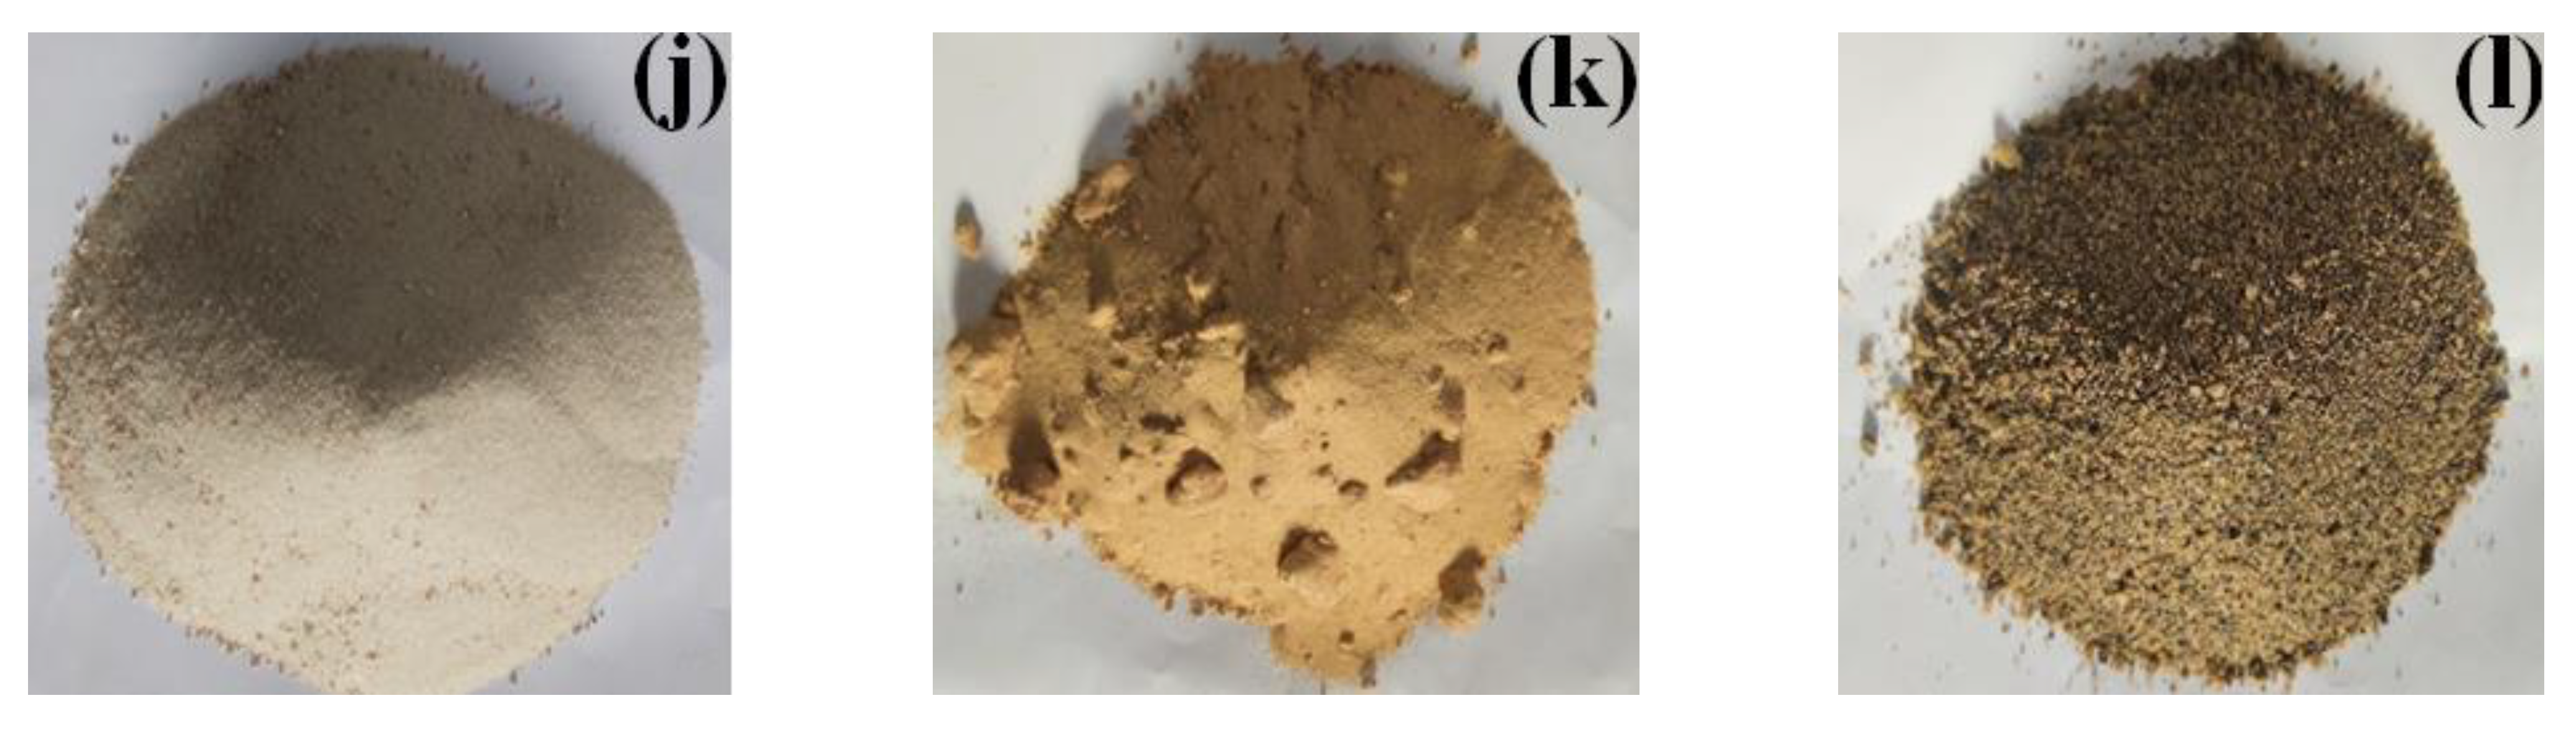
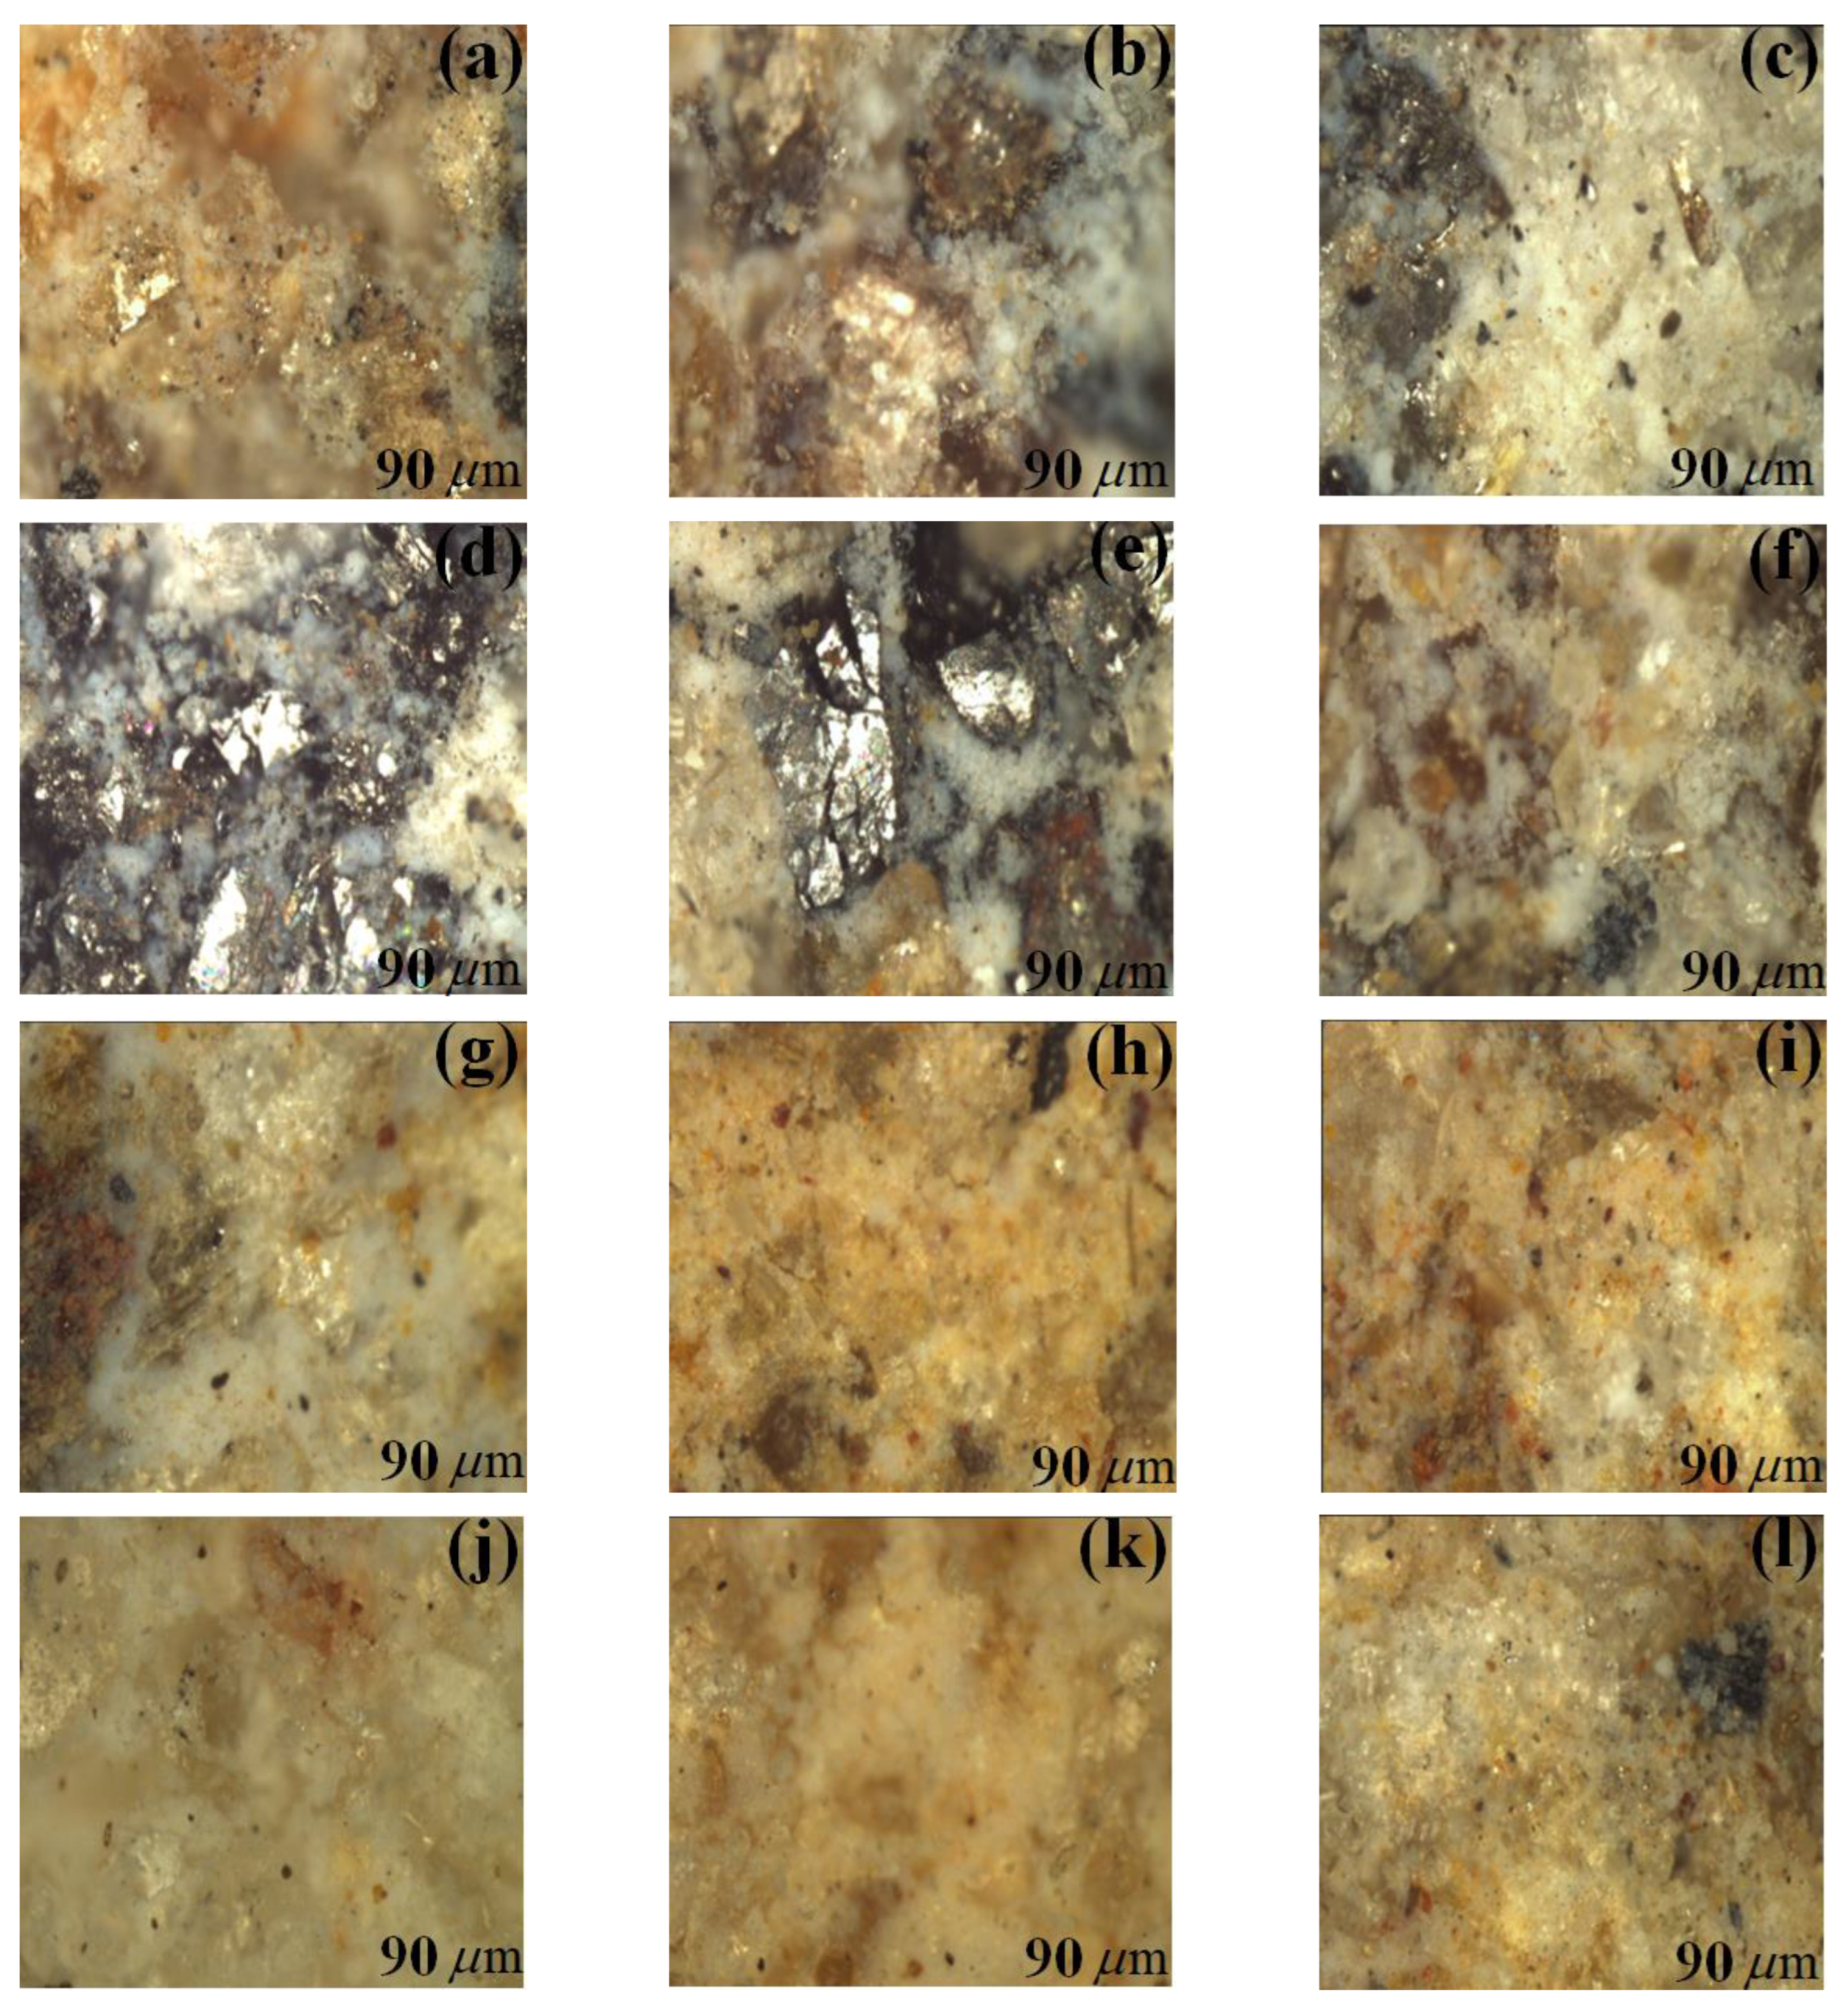
2.4.1. Visual Inspection
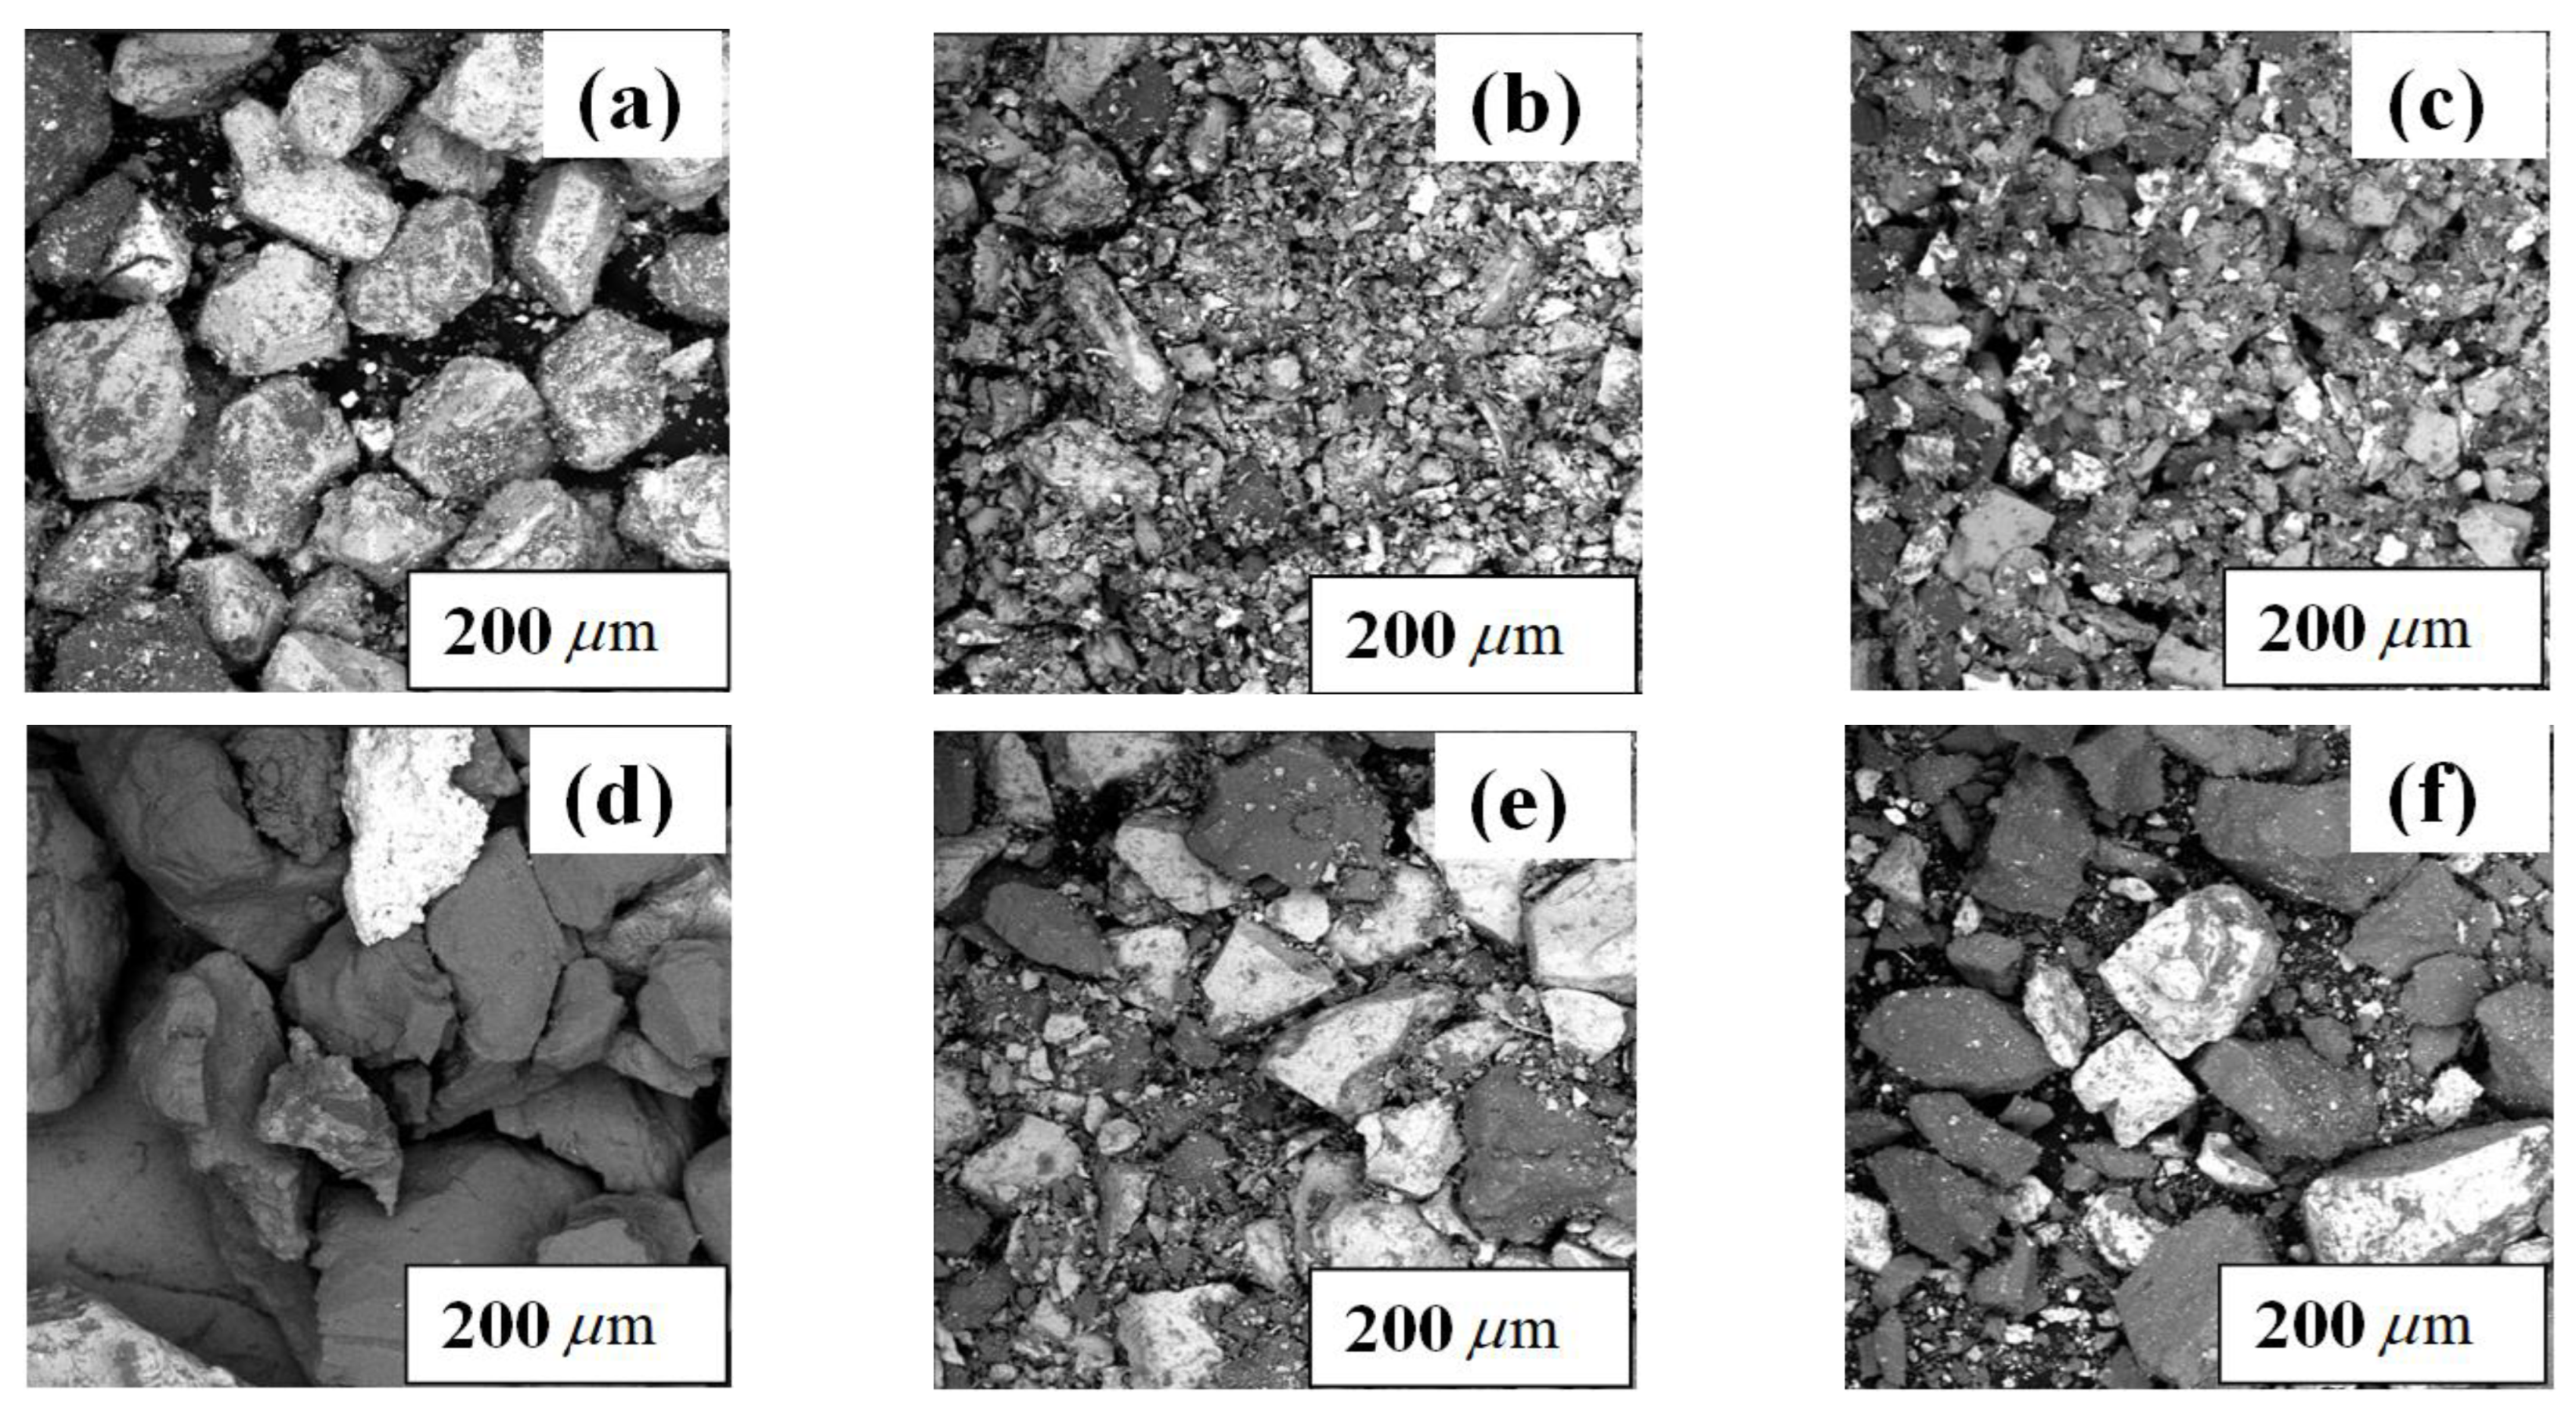
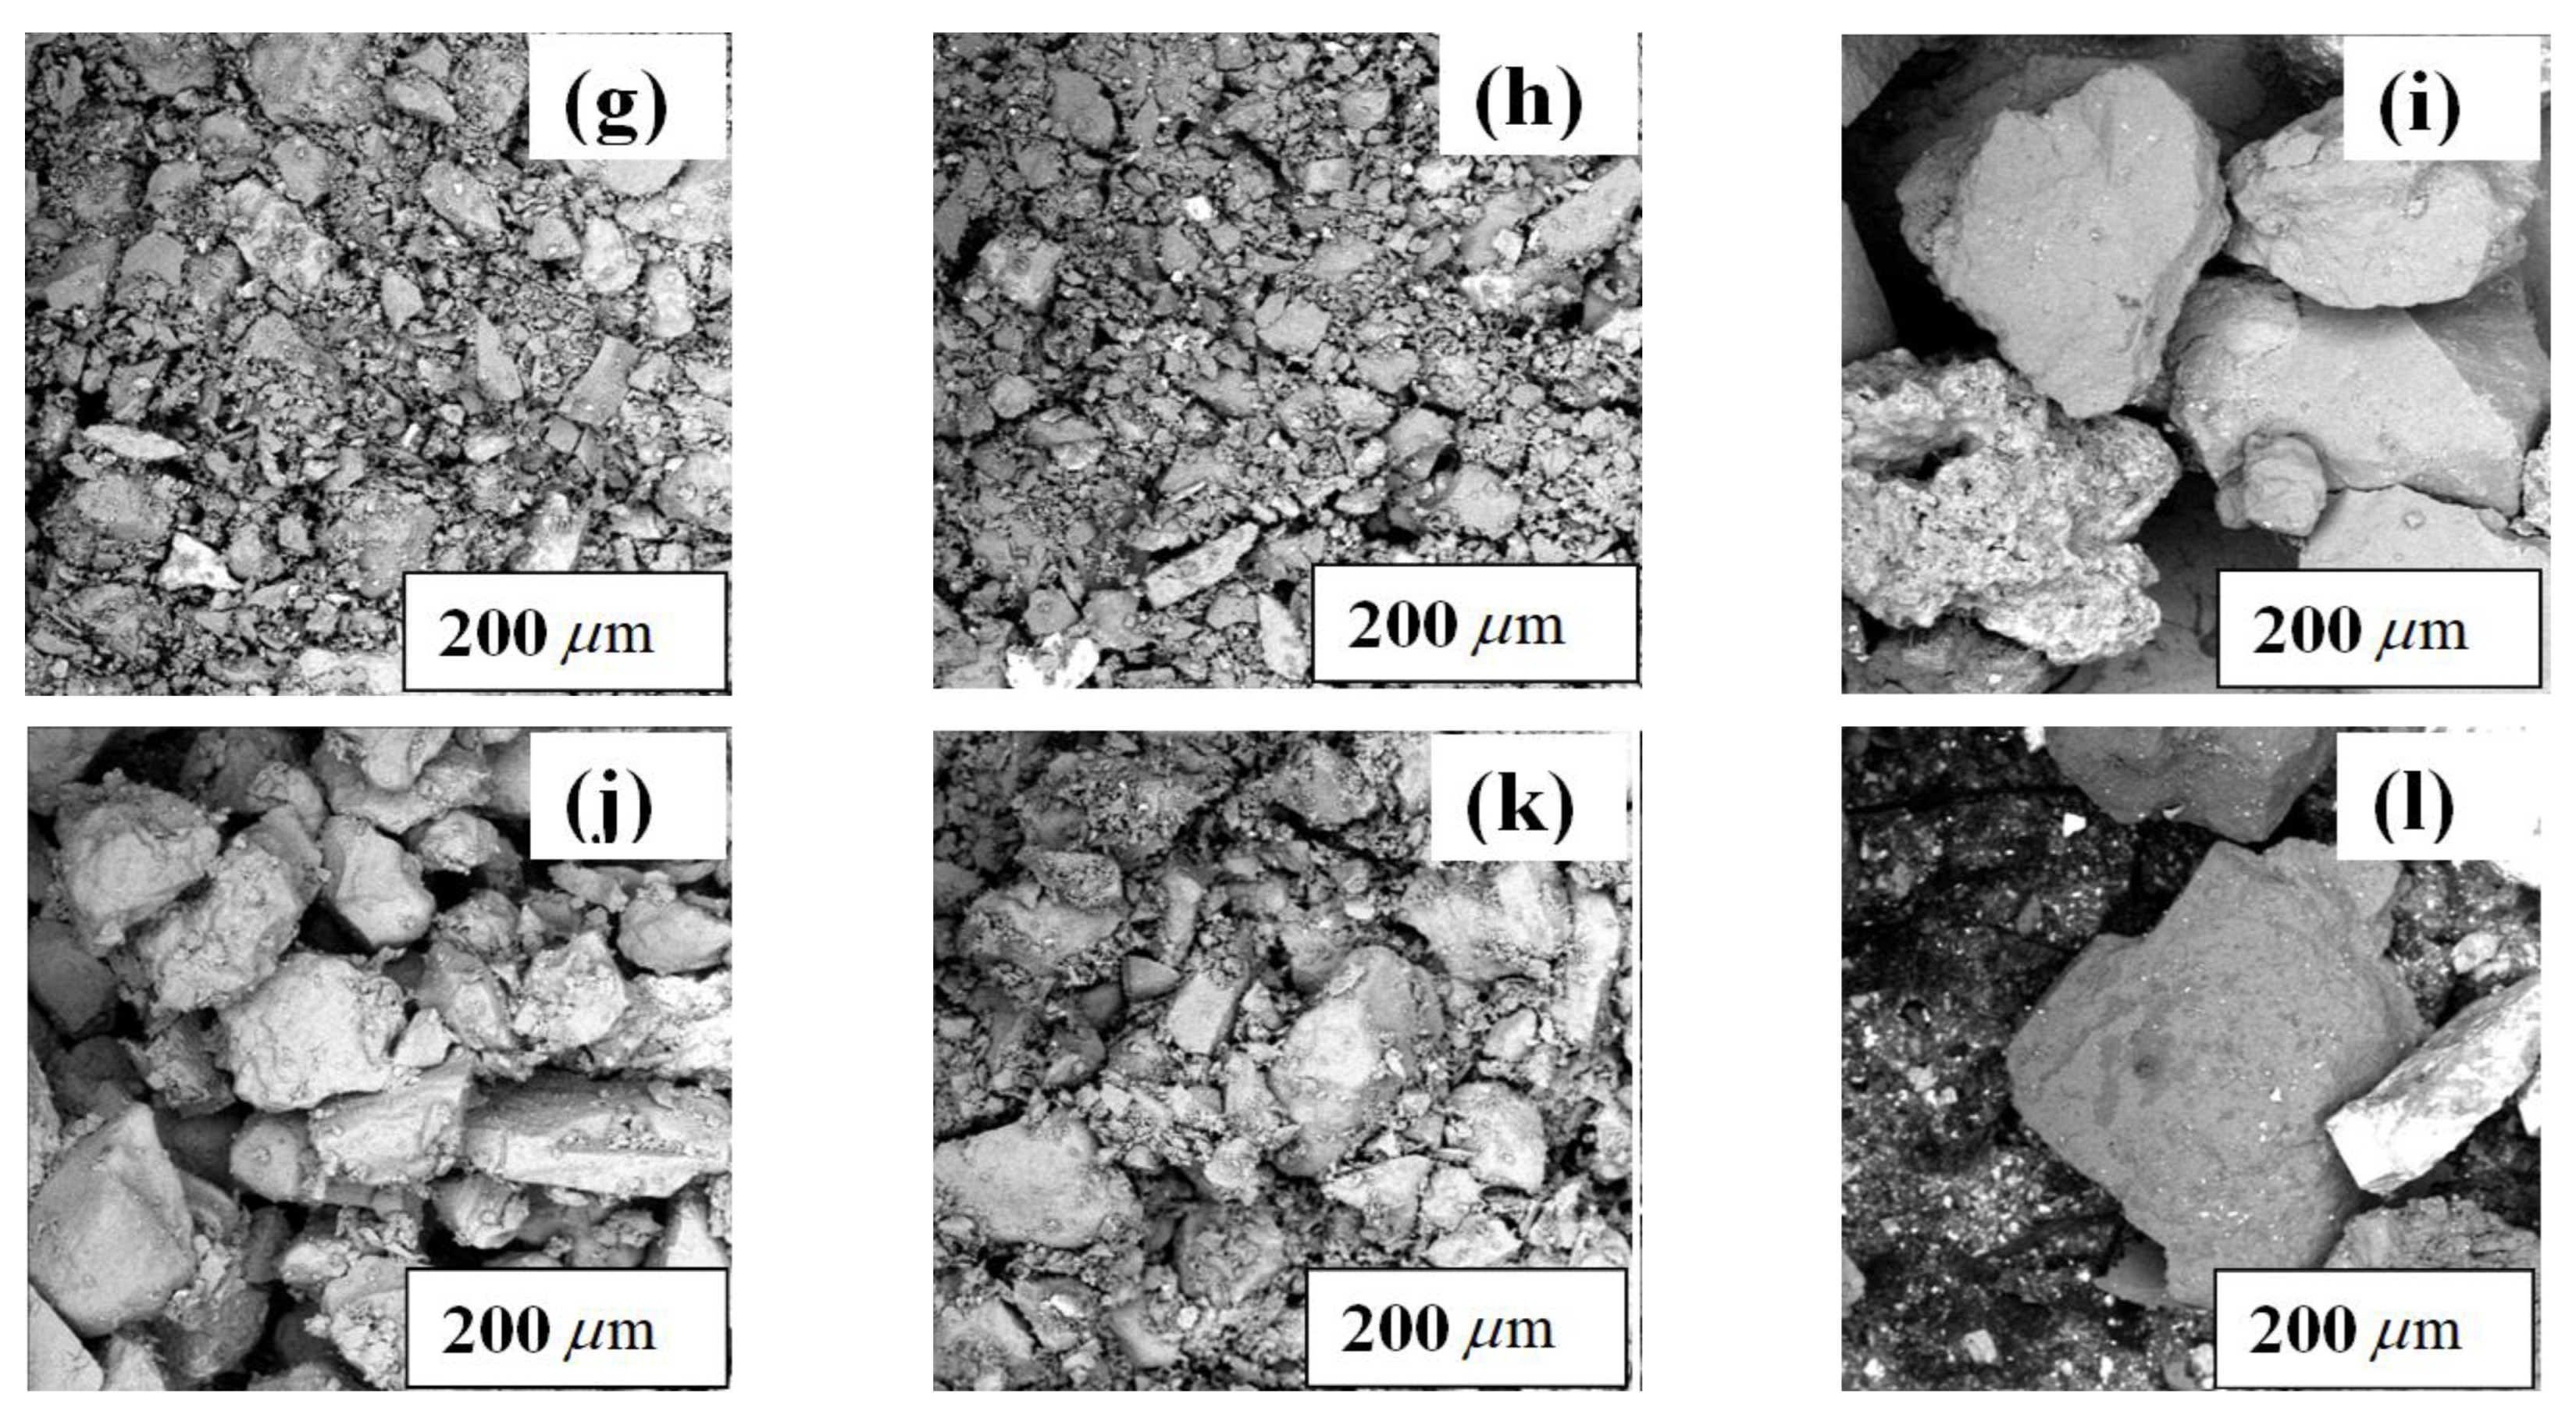
The color of the samples collected from the various mining locations was determined through an assessment utilizing the human eye.

2.4.2. Morphology

The morphology was characterized using a Phenom ProX desktop SEM (ProX 800-07334 MVE01570775 Phenom World, Thermo Fisher Scientific, Basel, Switzerland), while the 45-micron size was utilized to establish the morphology of each specimen.

2.4.3. Chemical Analysis

Determination of the chemical composition of the samples was carried out using an energy-dispersive X-ray fluorescence (ARL QUANT’X EDXRF analyzer 9952120, Thermo fisher scientific, Basel, Switzerland). The 45-micron size was used to determine the chemical analysis of each sample. We weighed 2 g of each sample and placed it into the sample holder in a vacuum for 10 min before transferring it to the XRF spectrometer.

2.4.4. Mineralogical Evaluation

The 45-micron size was used to determine the mineralogy of each sample. The structure and crystalline phase of the samples were determined using an X-ray diffractometer (ARL’XTRA, Thermo Fisher Scientific, Basel, Switzerland) with a rotating anode at 45 kV and 40 mA and illuminated using a Cu anode material. The patterns were recorded at 2 degrees, and the scan range angle ranged from 4.99 to 77.99 degrees. For all the samples, a dwell time of 29.07 s, and a scan step size of 0.026261 degrees was maintained.

2.4.5. Functional Groups

Potassium bromide (KBr) pellets of all samples were prepared using the 45-micron sizes; this size was used to obtain a homogeneous mixture with the KBr as large particles scatter the infrared beam and cause a slope baseline of spectrum. For the preparation, the sample-to-KBr ratio was fixed at a 1:10 ratio. The Fourier transform infrared (FT-IR) spectra of all the prepared samples were analyzed using an FT-IR spectrophotometer (Nicolet iS50 FT-IR, Thermo Fisher Scientific, Waltham, MA, USA) in the frequency range of 500–4000 cm−1.

2.4.6. Determination of Sample pH

A BenchMeter (pH 510 pH/mV/0C meter, Singapore) was used to determine the pH. A digital weighing balance (Ohaus, Nänikon, Switzerland) was used to obtain a weight of 0.5 g for each sample using the 45-micron diameters. Each sample was thoroughly mixed in 0.5 mL of distilled water and stirred to form a soil slurry. The electrode was immersed in the slurry for 65 min and stirred every 10 min. When the pH meter’s scale stabilized, readings were taken at room temperature.

2.4.7. Determination of Sample Specific Gravity

The specific gravity was determined by the pycnometer method in line with the American Standard Testing Method ASTM D 854-00 [38]. A weight of 100 g was measured using a digital weighing balance (NewClassic MF, MS8001S/01, Mettler Toledo, Greifensee, Switzerland) and was maintained for all samples. The tests were conducted using 150-micron sizes. Each sample was placed in the pycnometer, mixed with distilled water, stirred with a glass rod, and allowed to soak for 10 min. The tests were performed at 25 °C. The specific gravity of the samples was computed using Equation (1) [39]:
S G = w 2 w 1 w 4 w 1 w 3 w 2
where S G —specific gravity, w 1 —weight of the pycnometer, w 2 —weight of the pycnometer + sample, w 3 —weight of the pycnometer + sample + water, and w 4 —weight of the pycnometer + water.

2.4.8. Determination of Sample Refractive Index

A refractometer (RFT-A3S, Abbe, Alma, MI, USA) was employed to determine the refractive index. A few drops of each sample were placed on the refractometer’s glass slide using the 150-micron size. The dark portion of the image seen through the refractometer’s eyepiece was adjusted to match align the intersection of the cross. When there was no parallax error, the scale pointer responded by pointing to the refractive index. This procedure was repeated, and the mean value was recorded as the refractive index.

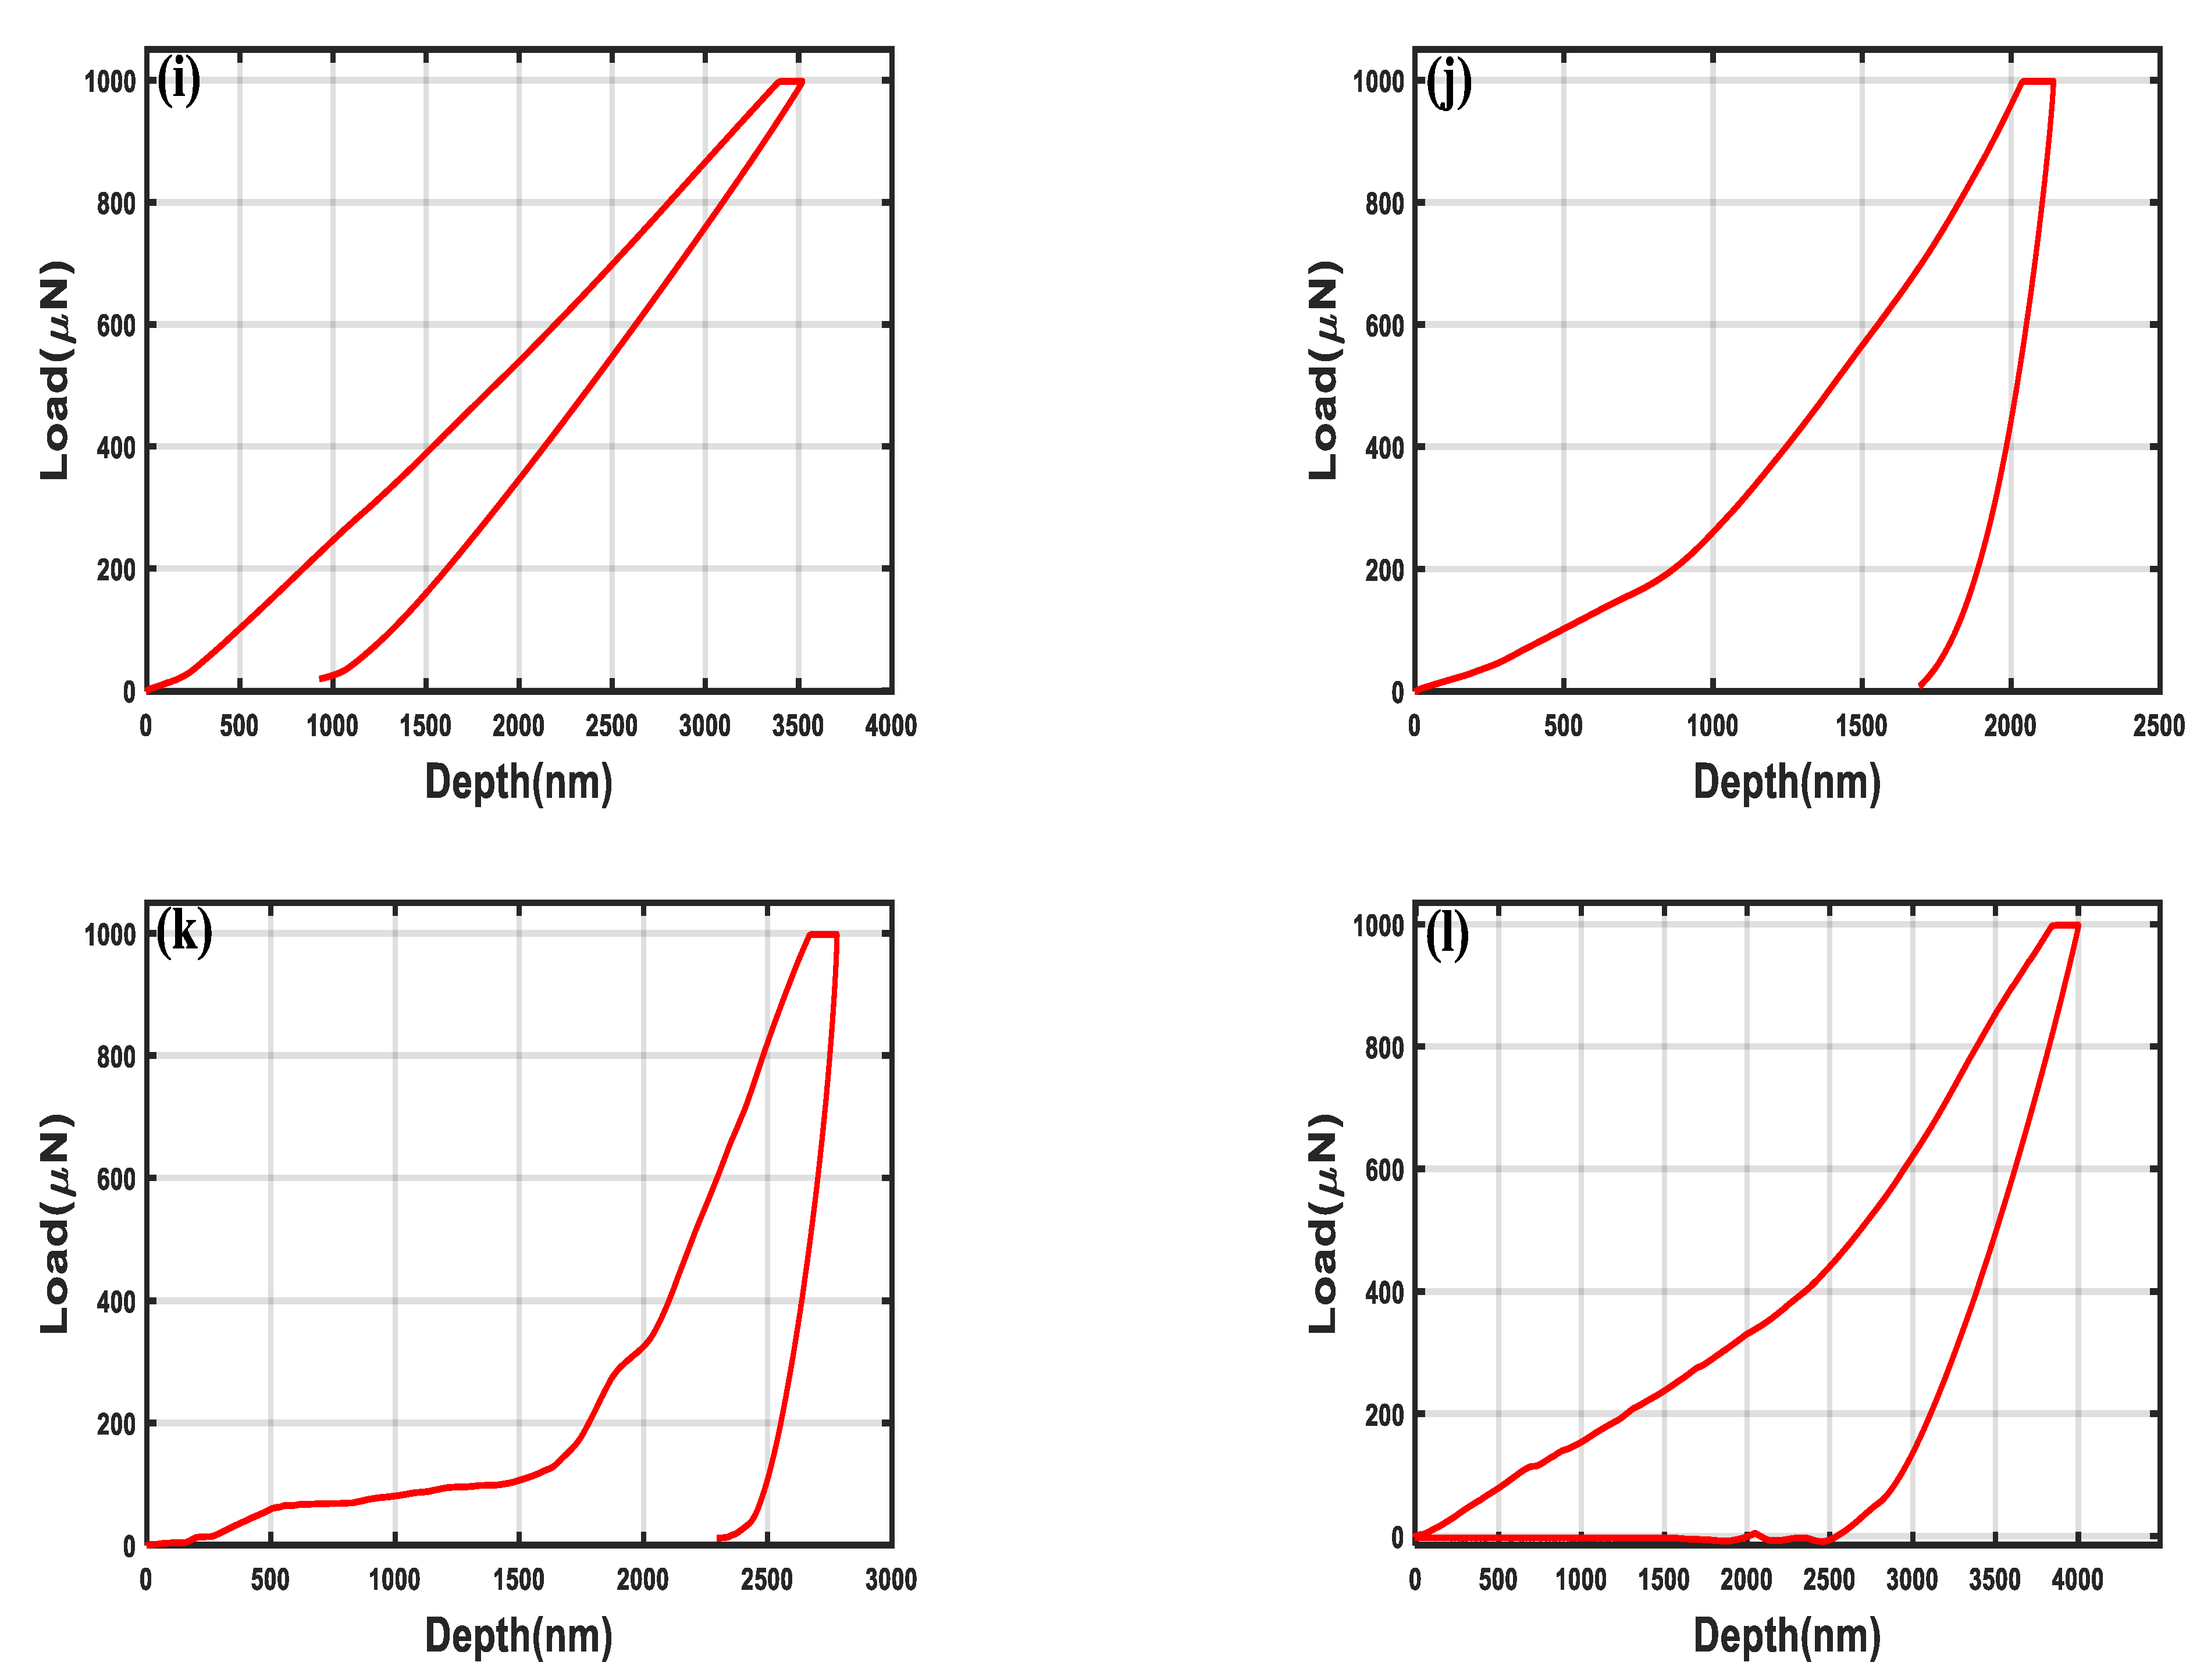
2.4.9. Determination of Sample Nanohardness and Elastic Modulus

The samples should be compacted into a solid mass (pellets) before their hardness can be measured. Indentation was performed using a TI 950 Hysitron TriboIndenter (Bruker Instruments, Minneapolis, MN, USA) instrumented with a diamond Berkovich tip. A trapezoidal load function was used, during which each sample was loaded for 10 s at a rate of 100 μ N/s, held for 2 s, and then unloaded for another 10 s at the same rate. The load-displacement data were then recorded, which was used to compute the elastic modulus and hardness. The nanoindentation curve starts with an initial loading stage followed by the unloading stage. The loading stage can be regarded as the combination of elastic and plastic deformation, while the unloading stage can be viewed as the recovery of the pure elastic deformation that can be used to calculate the hardness and elastic modulus of the indent. The values of the maximum displacement hm and contact stiffness S at maximum force Fm were extracted from the experimental loading curves. A power law was used to fit the unloading curve, resulting in the exponent m. The hardness H was calculated using Equation (2) [40]:
H = F m A c
where Ac is defined as a function of the contact depth, and Ac = f (hc). The contact depth hc was calculated using S, Fm, hm, and m values [41,42].
The reduced modulus Er was calculated by Equation (3) [41]:
E r = π · S 2 β A c
where β is a constant that depends on the indenter geometry. For a Berkovich indenter, β = 1.034 [43].
The elastic modulus (E) was then calculated using Equation (4) [41]:
1 E r = 1 ν 2 E + 1 ν i 2 E i
where ν is the Poisson’s ratio of the test sample, and Ei and ν i are the elastic modulus and Poisson’s ratio, respectively, of the indenter. The value of Ei for the test with a diamond indenter is 1141 GPa and ν i is 0.07 [41].
The indentation hardness and elastic modulus were determined by performing the tests four times on each sample and calculating the average values.

3. Results and Discussion

3.1. Physical Examination and Morphology

The color variation (Figure 3) may be due to the mineralogy, compositions, the formation of the samples, the dominant crystals’ physical structure, and the presence of impurities that can be removed during beneficiation [44,45,46]. Oxygen content in a sample has a significant impact on sample colors [47].
The SEM micrographs of all the samples are shown in Figure 4. Kuru (Figure 4a) indicates an angular blocky, which corroborates the work done by [48]. The brown–orange Arikya (Figure 4b) has a wedge shape, while the gray–brown Riruwai (Figure 4c) has an angular blocky shape. Banki (Figure 4d), Damau (Figure 4e), and Gumau (Figure 4f) all showed an angular blocky shape, while a granular shape was observed in the Rishi (Figure 4g) and Wul (Figure 4h) samples. A subangular shape was observed in samples from Dawa (Figure 4i) and Kirfi vein 1 (Figure 4j), while Kirfi vein 2 (Figure 4k) and Koma (Figure 4l) showed an angular blocky shape [45]. All of the sample morphologies indicate that zircon has a prismatic and pyramidal morphology, which is supported by [49,50]. According to Corfu et al. [49], many factors, such as crystal composition and crystallization temperature, affect crystal shape. Pupin [50] attributed the pyramidal faces’ growth to chemical parameters, whereas the prismatic faces’ development was largely related to the temperature of crystallization.

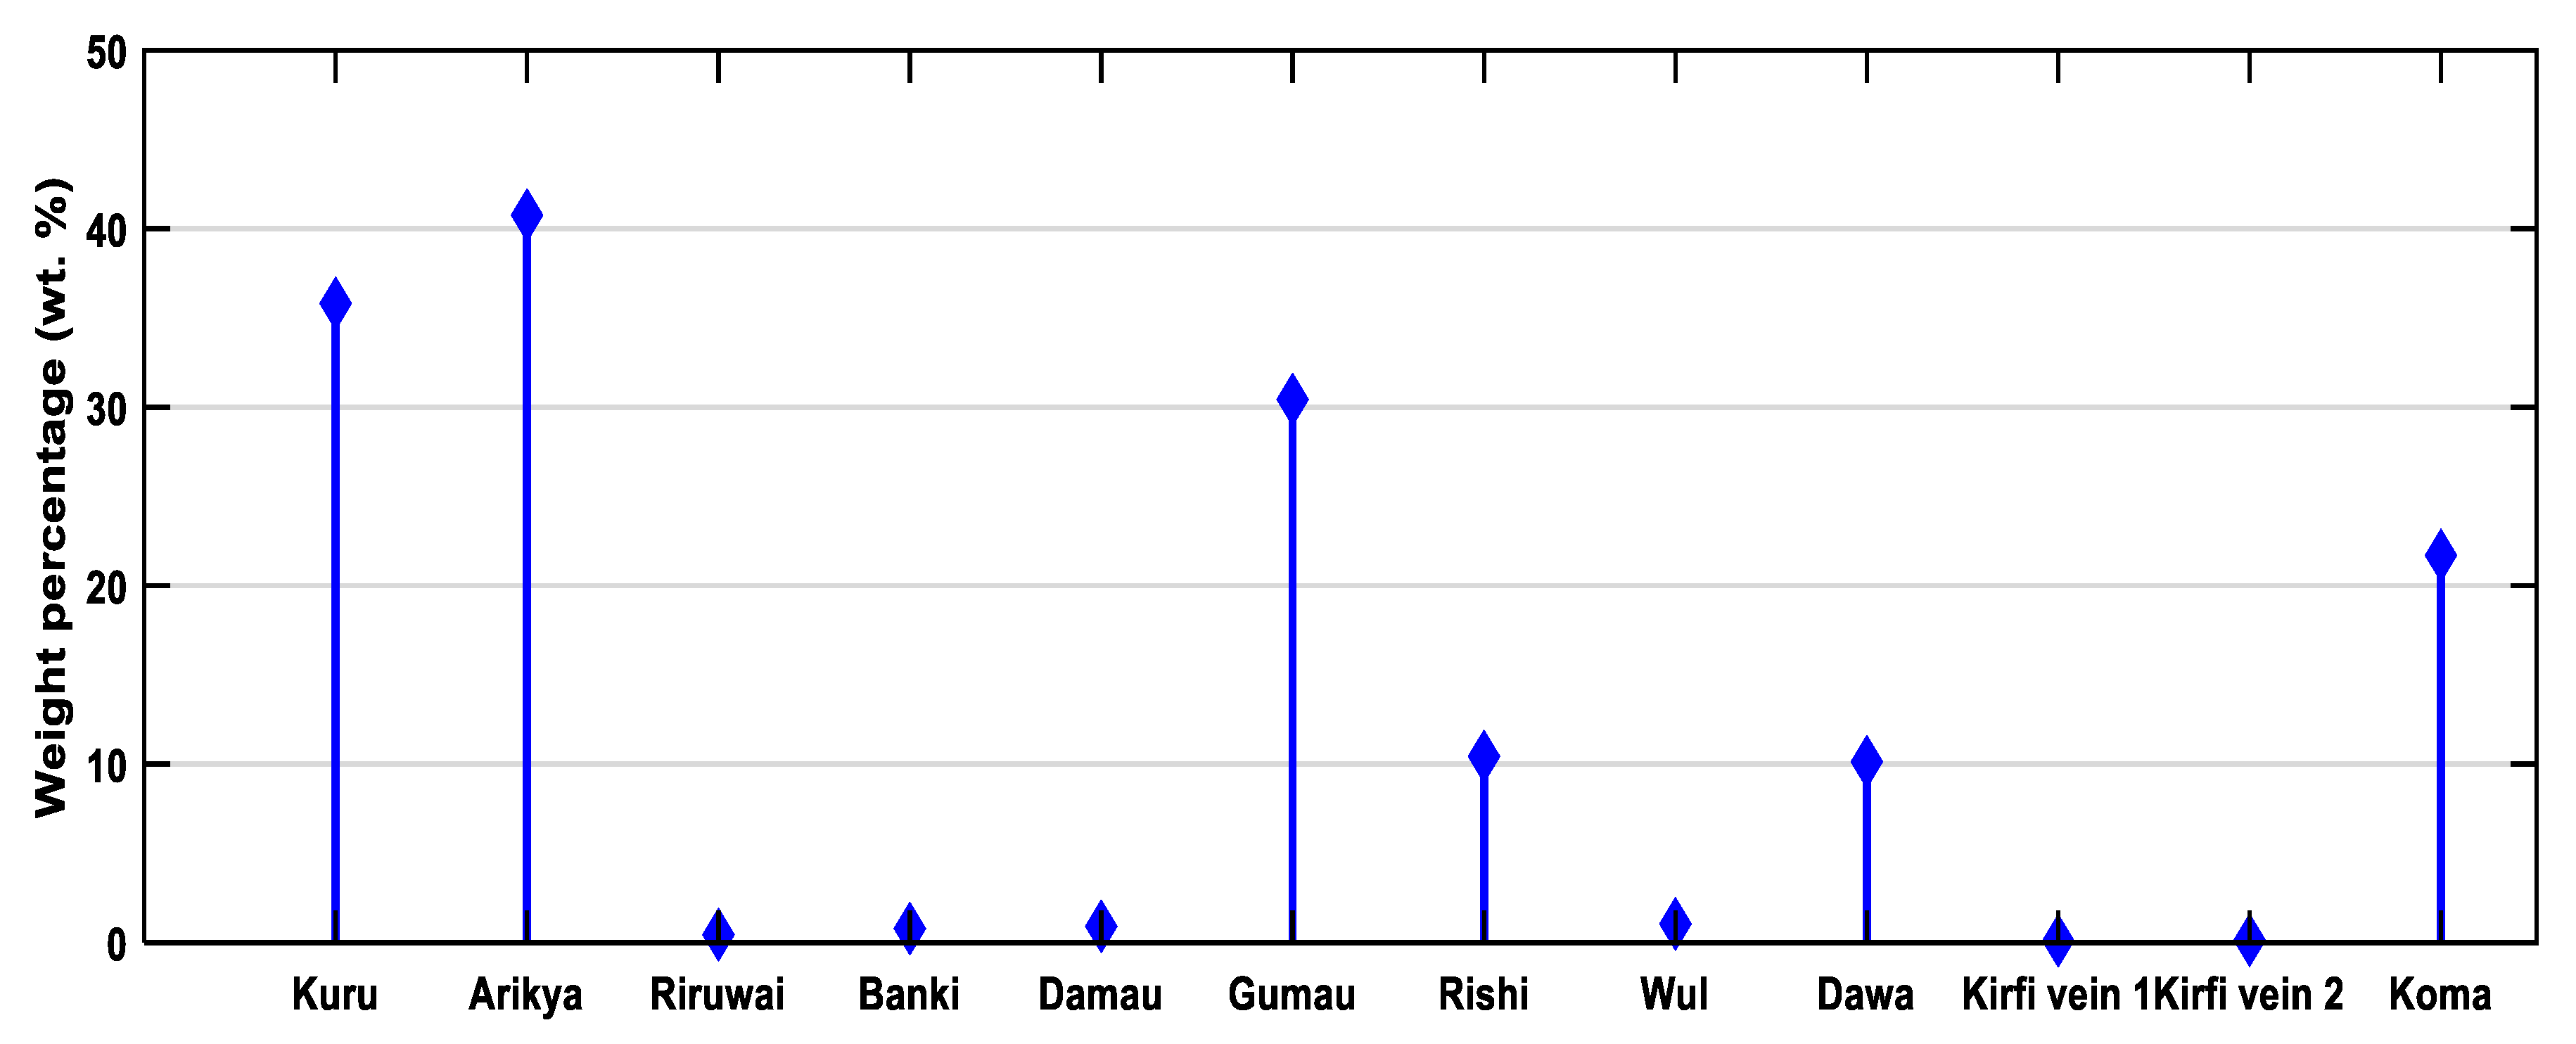
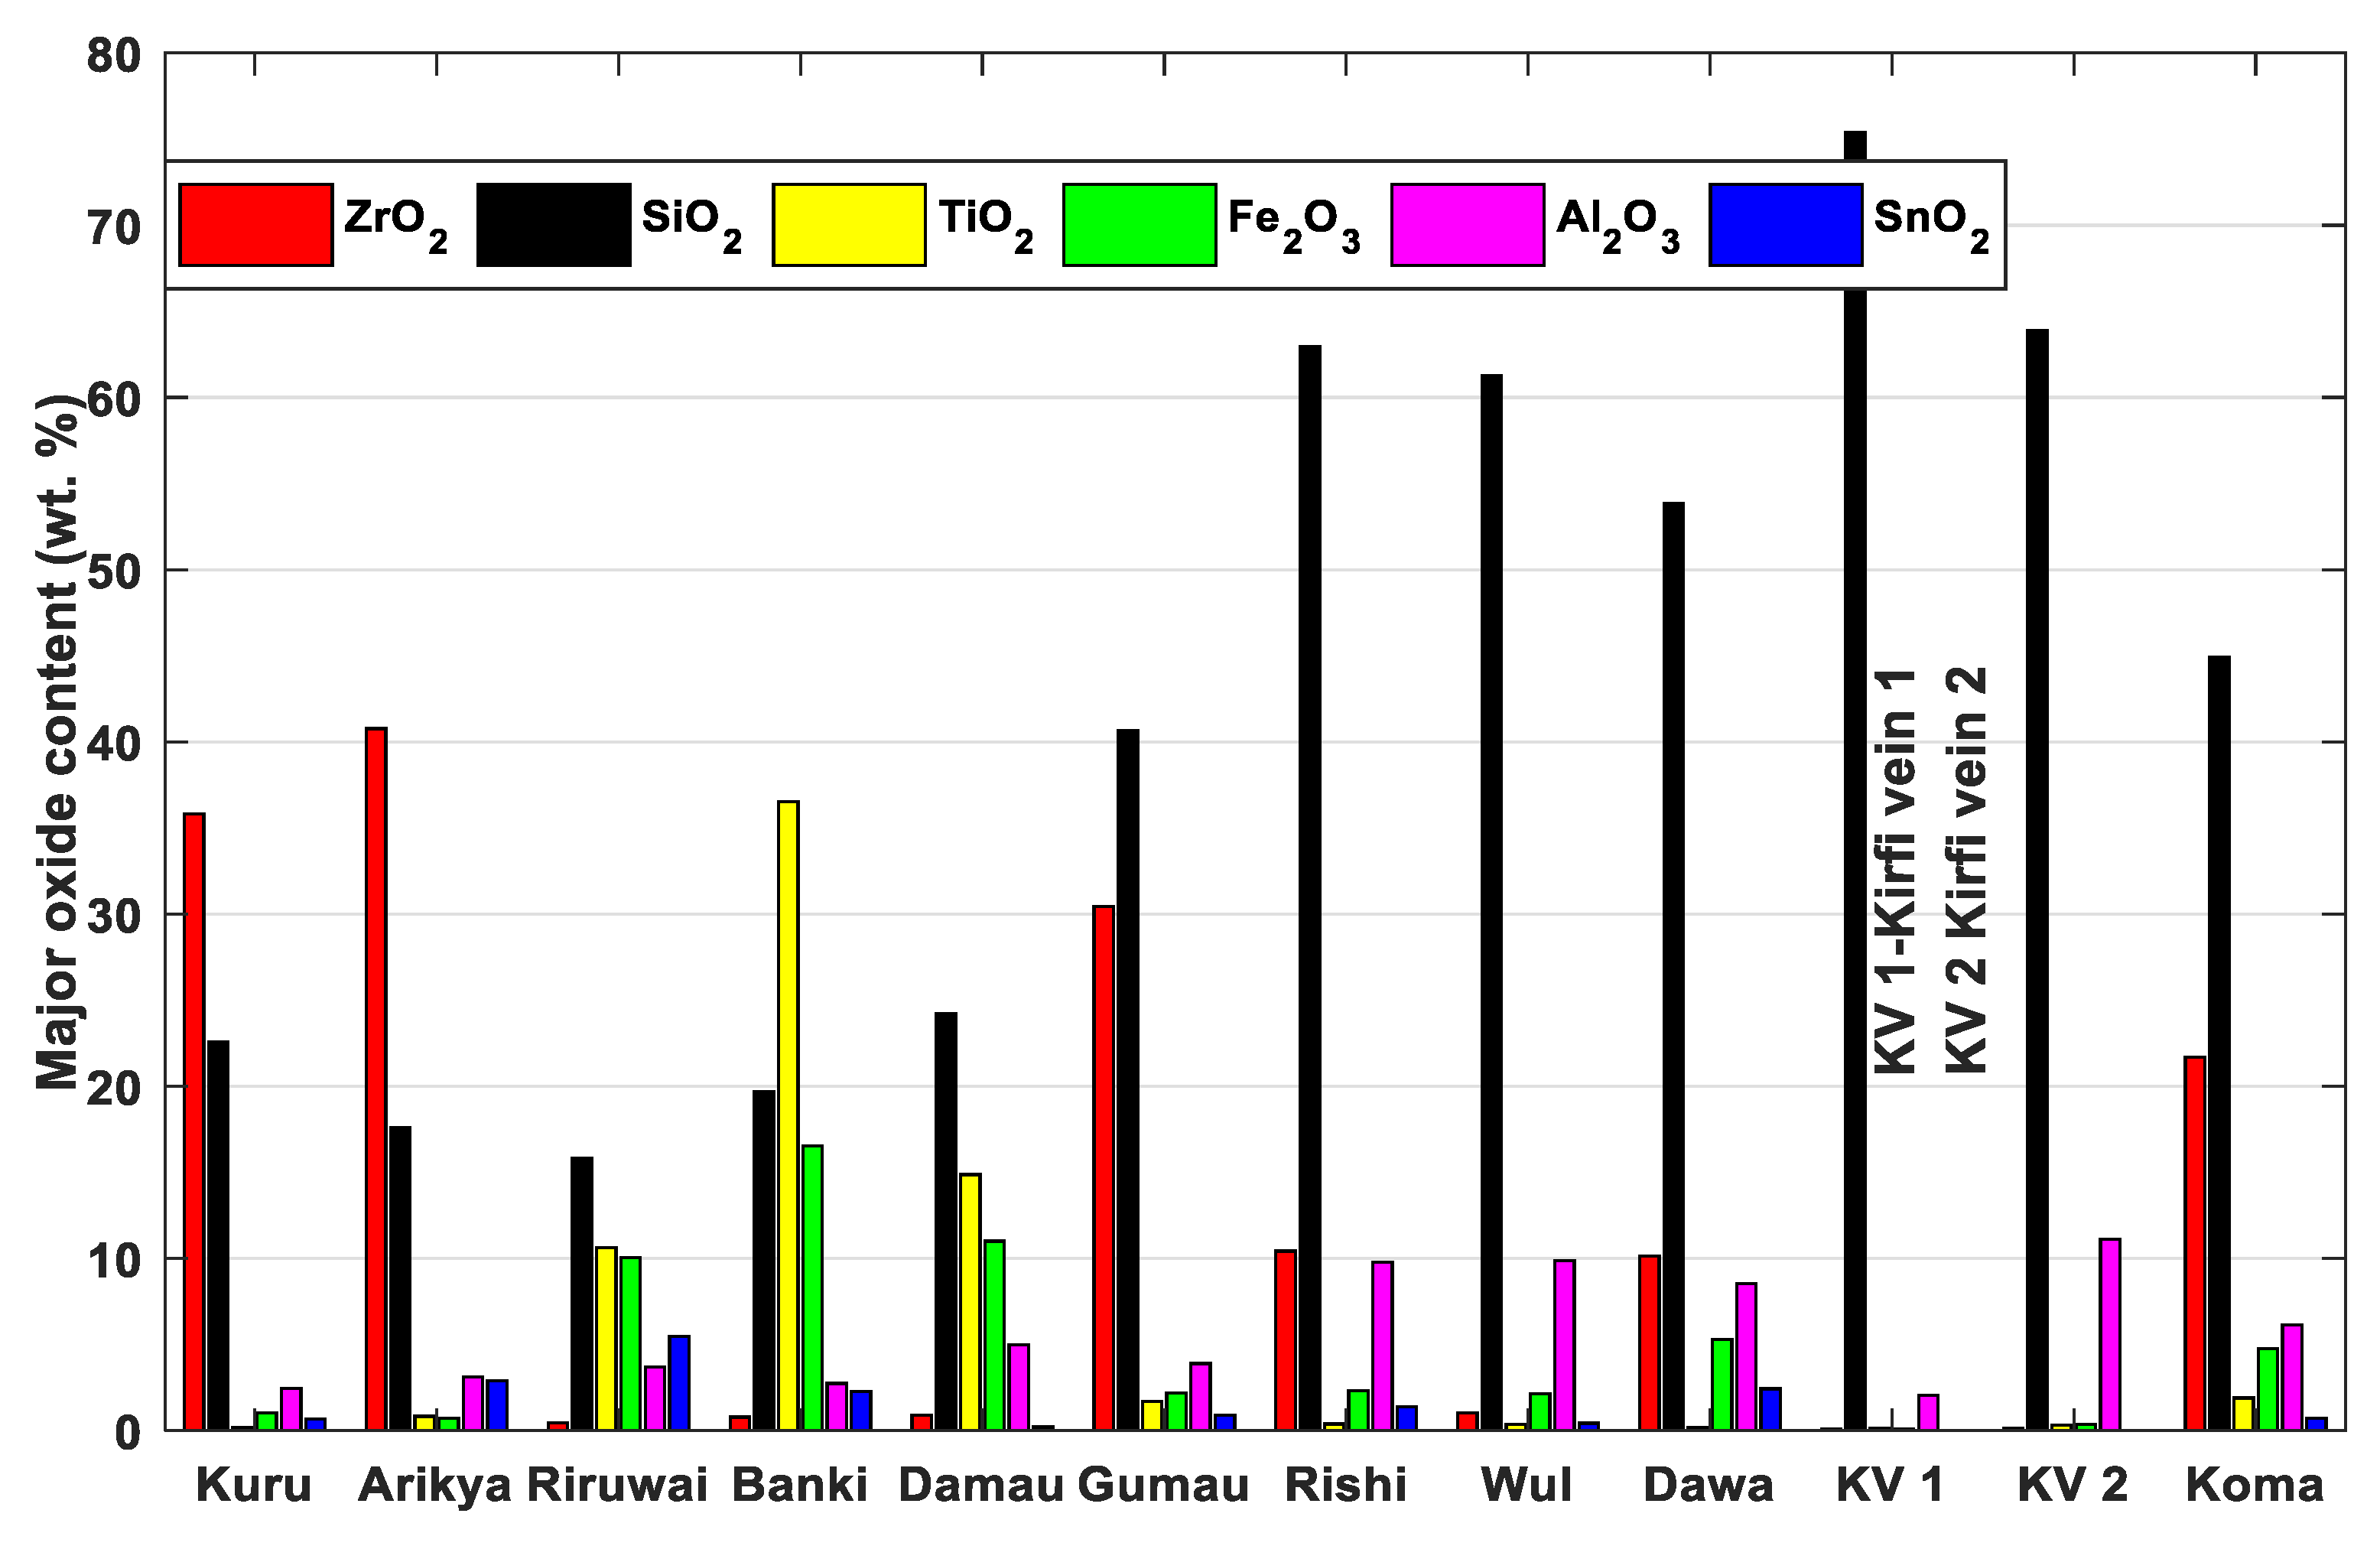
3.2. Chemical Composition
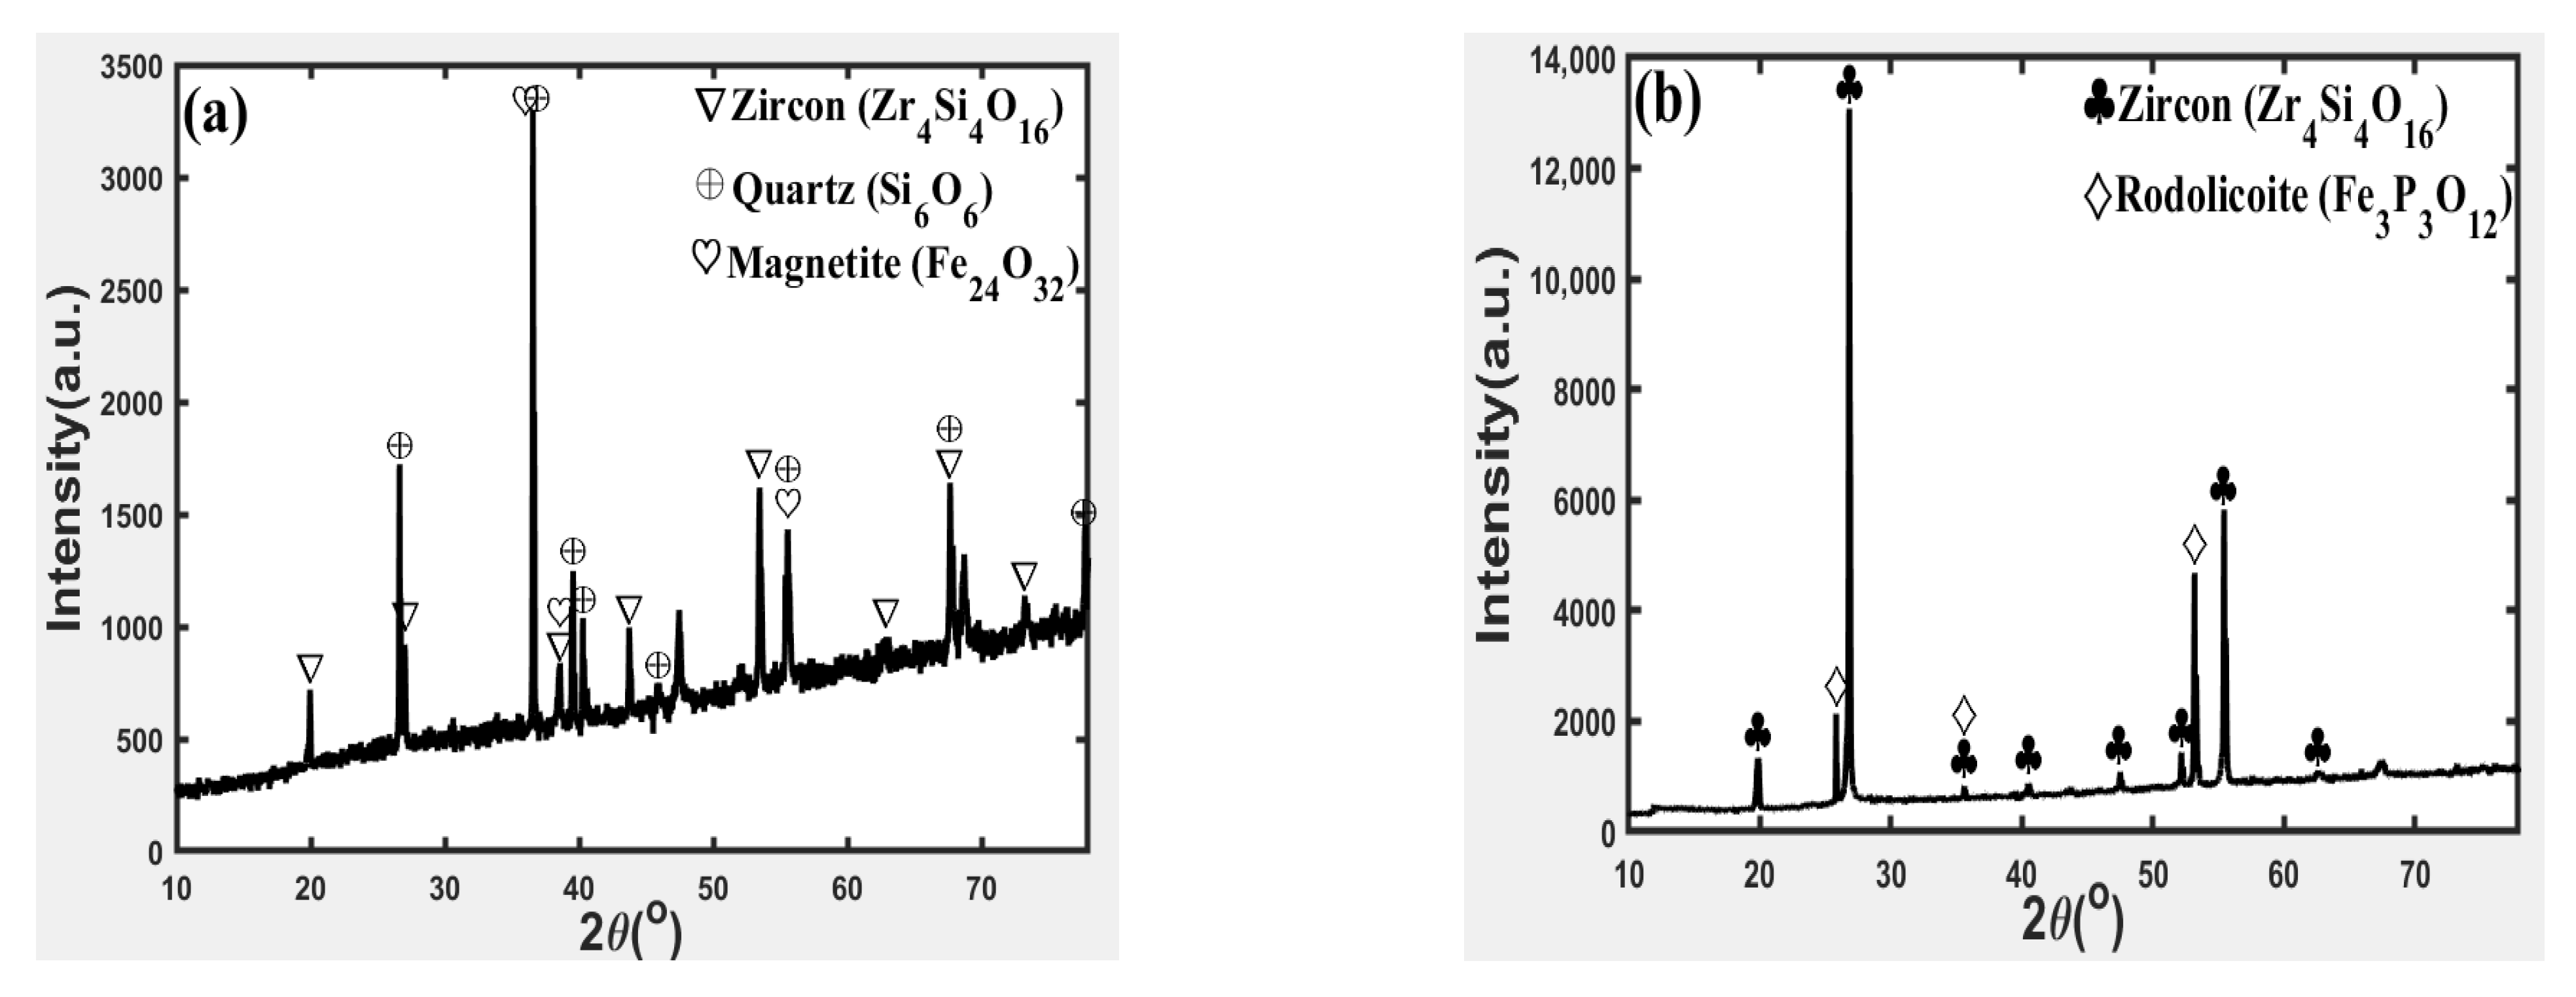
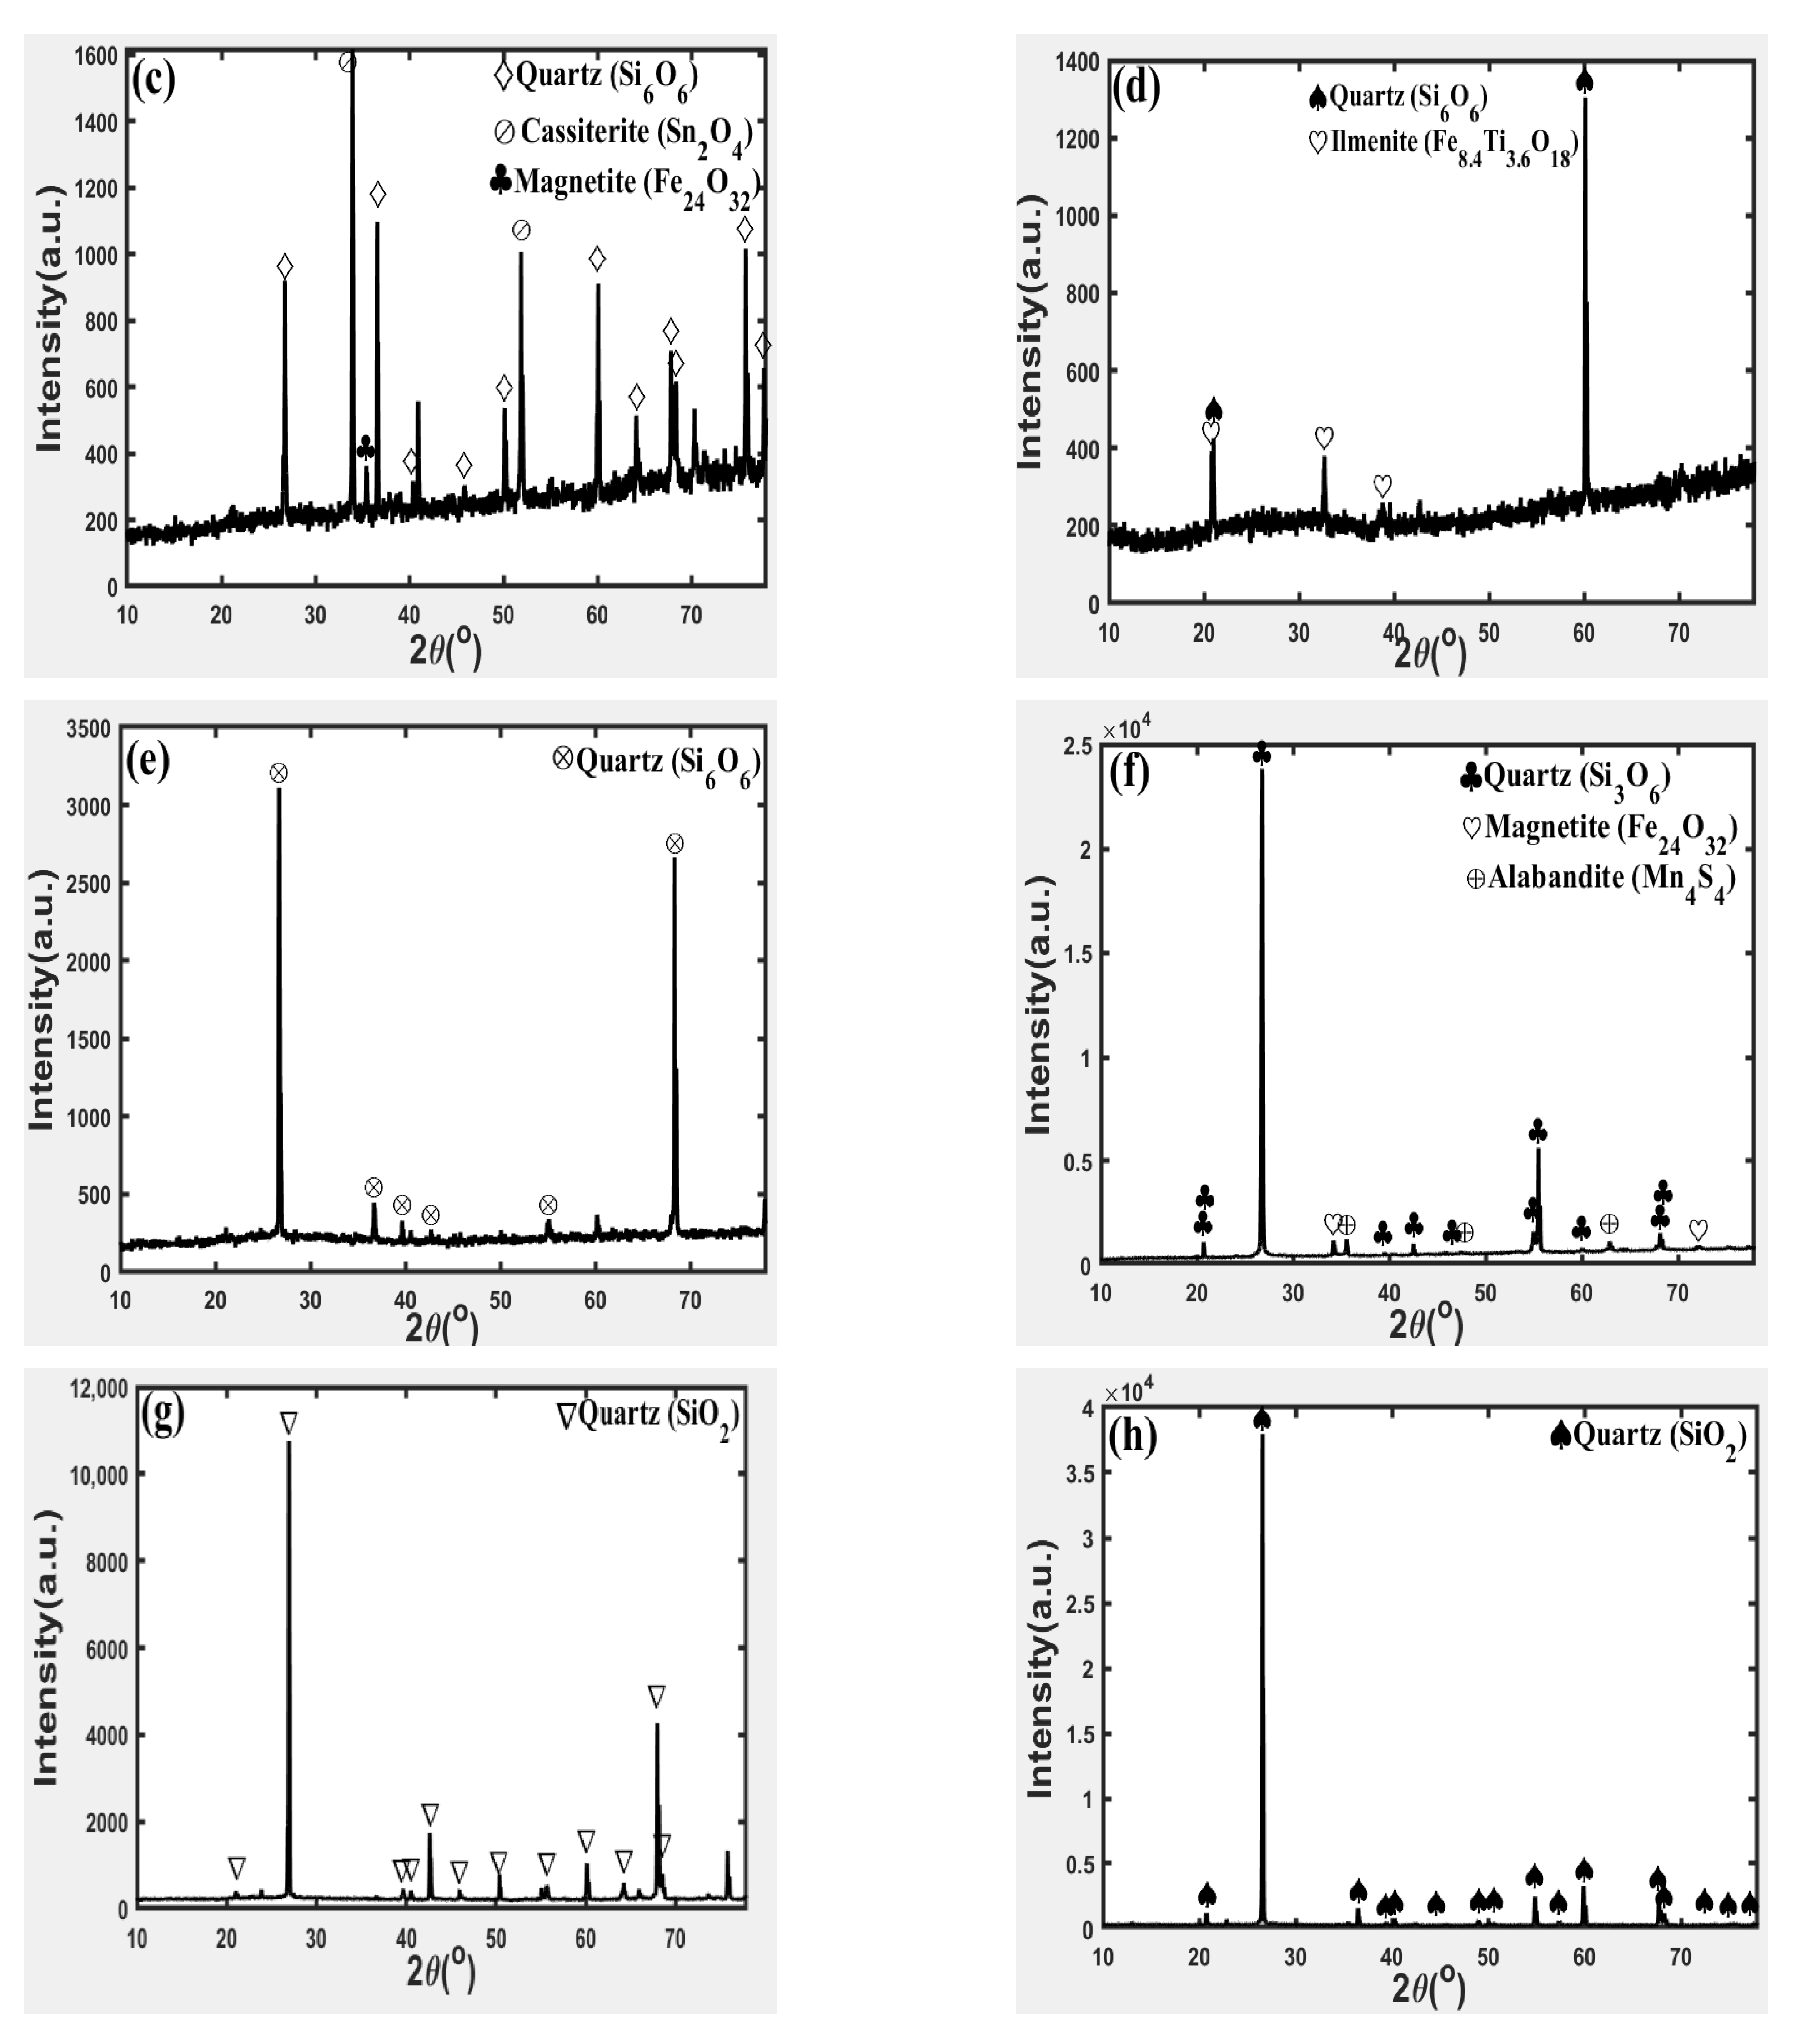
The samples percentage of elemental oxides (Table 2) from EDXRF analysis revealed that they all contain different elements in weight percentages [51]. According to [23,50,52], zircon is composed of 67.2 wt.% ZrO2 and 32.8 wt.% SiO2, with a wide range of trace elements (20–25 wt.%), including hafnium (Hf) and yttrium (Y) (0.1 Y (wt.%) 1.0) as minor elements, phosphorus (P), and rare earth elements. Metasomatized quartz syenite is the most common host for low-ZrO2 zircons [53]. All our samples (Table 2) contain ZrO2 in different weight percentages ranging from 0.107 to 40.765 wt.%. The ZrO2 weight percent of all our samples is shown in Figure 5.
The presence of impurities such as calcium (Ca), niobium (Nb), thorium (Th), iron (Fe), and rare earth elements (REEs) in these samples contributes to the low ZrO2 content [53]. The Y concentration was detected in three of our samples: 0.003751 wt.% (Banki sample), 0.00334 wt.% (Rishi sample), and 0.00304 wt.% (Dawa sample). The elements in the largest abundance are rare earth elements (REEs), P, uranium (U), and Th [51]. The rare earth elements mostly contain zircon crystals, which enhance the quality of P [52]. The EDXRF results (Table 2) of our samples indicate that P was detected in all the samples. We conclude that rare earth elements are abundant in all of the examined samples. Crystalline zircon contains between 0.75 and 1.64 wt.% hafnium oxide (HfO2), while metamict zircon has between 1.40 and 6.0 wt.% HfO2 [54]. In all the samples, HfO2 was not detected or it was below the detection limits (bdl). In crystalline zircon, typical uranium oxide (UO2) and thorium oxide (ThO2) concentrations range from 0.06 to 0.40 wt.%, while in metamict zircon, concentrations range from 0.20 to 1.5 wt.% [55,56,57]. Eight samples from this study (Table 2) have UO2 levels within the metamict zircon range. In the other four samples, UO2 was not detected; perhaps they are bdl. ThO2 concentrations ranged from 0 to 0.20 wt.% in crystalline zircon but between 0.10 and 1.50 wt.% in metamict zircon [55,56,57]. Four of our samples (Table 2) have ThO2 concentrations that are in the crystalline phase, while five samples are in the metamict phase. Zircon does not crystallize with lead ion (Pb2+) because of its ionic radius (1.29 Å in eightfold coordination), and lead ion (Pb2+) is not incorporated into zircon when it crystallizes [55]. Zircon is essential for geochronology because its concentration of radiogenic Pb depends on the time and structural state of zircon as a result of the decay of 238U, 235U, and 232Th [57]. All samples (Table 2) show lead oxide (PbO2) concentrations. The weight percentages of PbO2 concentrations in our eight samples are extremely low. In most cases, crystalline zircon has trace levels of Ca2+, but metamict zircon has Ca2+ incorporated into its structure. Ca2+ is the most prevalent indication of zircon alteration [57]. Eleven of the samples (Table 2) have relatively high concentrations of Ca2+. Ca2+ concentration in Kirfi vein 1 sample is low: 0.046 wt.%. All other in situ measured elements are found (Table 2) in trace amounts in unaltered igneous zircon [51]. All our samples contain these elements in trace amounts excluding Li, Be, F, and Na (Table 2). Belousova [58] investigated several trace elements in zircon, including Ti, Mn, Fe, gallium (Ga), and tin (Sn), as well as the rare earth elements. The chemical composition analysis from all our samples (Table 2) indicates that these elements were detected. Figure 6 shows the major oxide content of some selected elements from this study. Table 3 presents the summary of major oxide content for some selected elements.

3.3. Mineralogy

The X-ray diffraction patterns of the samples are presented in (Figure 7). The results show that the predominant crystalline phases in the Kuru sample (Figure 7a) are magnetite (Fe24O32), quartz (Si6O6) with JCPDS card 33-1161 [59], and zircon (Zr4Si4O16) with JCPDS card 06-0266 [59]. Different structural patterns reported from the Kuru sample are a result of trace elements present in the majority of heavy mineral concentrate (HMC) and supported by EDXRF results (Table 2). The XRD of the Arikya sample (Figure 7b) reveals that the principal crystalline phase is zircon (Zr4Si4O16), with traces of rodolicoite (Fe3P3O12), which imparts the sample’s brownish color. Cassiterite (Sn2O4) is the major crystalline phase in the Riruwai sample (Figure 7c), with traces of magnetite and quartz. Samples from Banki (Figure 7d) consist primarily of quartz (Si6O6) with traces of ilmenite (Fe8.4Ti3.6O18), which is a significant titanium mineral and the primary source of titanium dioxide. The crystalline phase in the Damau sample (Figure 7e) is mostly quartz (Si6O6). The Gumau sample (Figure 7f) is mainly quartz (Si3O6) with traces of magnetite and alabandite (Mn4S4). The Rishi, Wul, and Dawa samples (Figure 7g–i) are primarily quartz (SiO2). The Kirfi vein 1 and Kirfi vein 2 samples (Figure 7j,k) are predominantly quartz (Si3O6). The Koma sample’s (Figure 7l) main crystalline phase is rutile (Ti1.92Nb0.02Cr0.02Al0.02Fe0.02O4H0.22), with traces of magnetite (Fe24O32) and quartz (Si3O6).

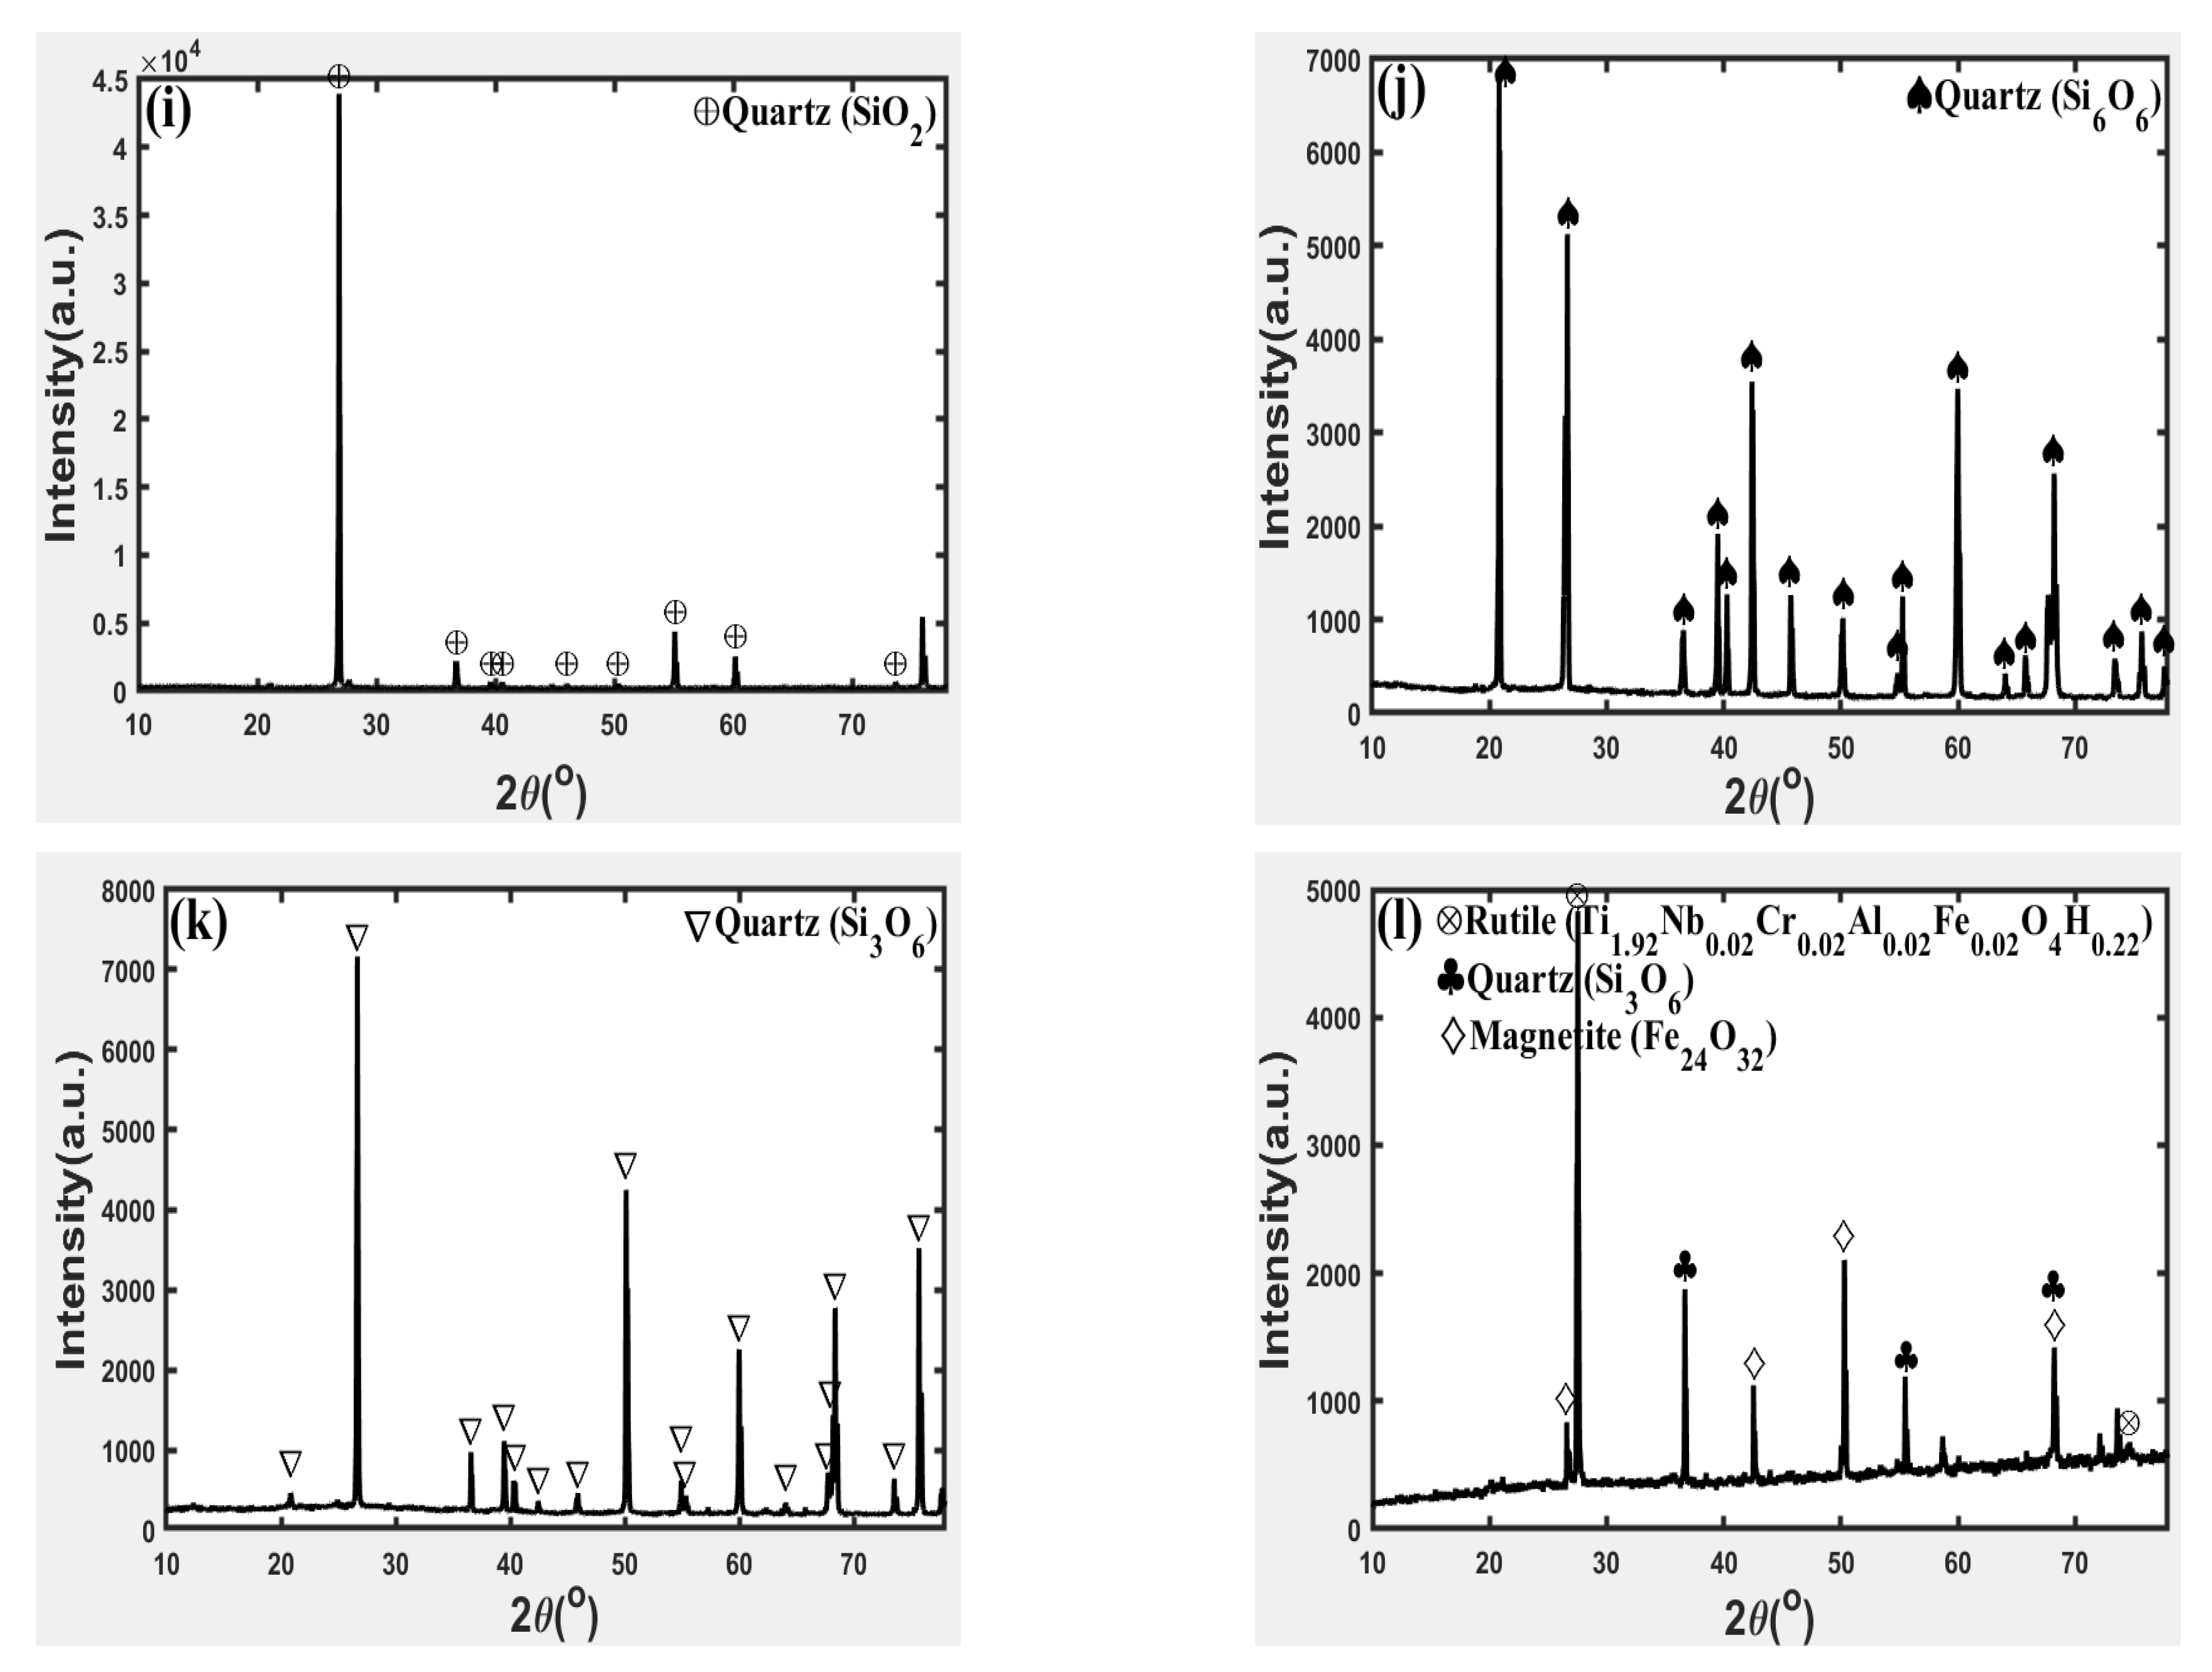
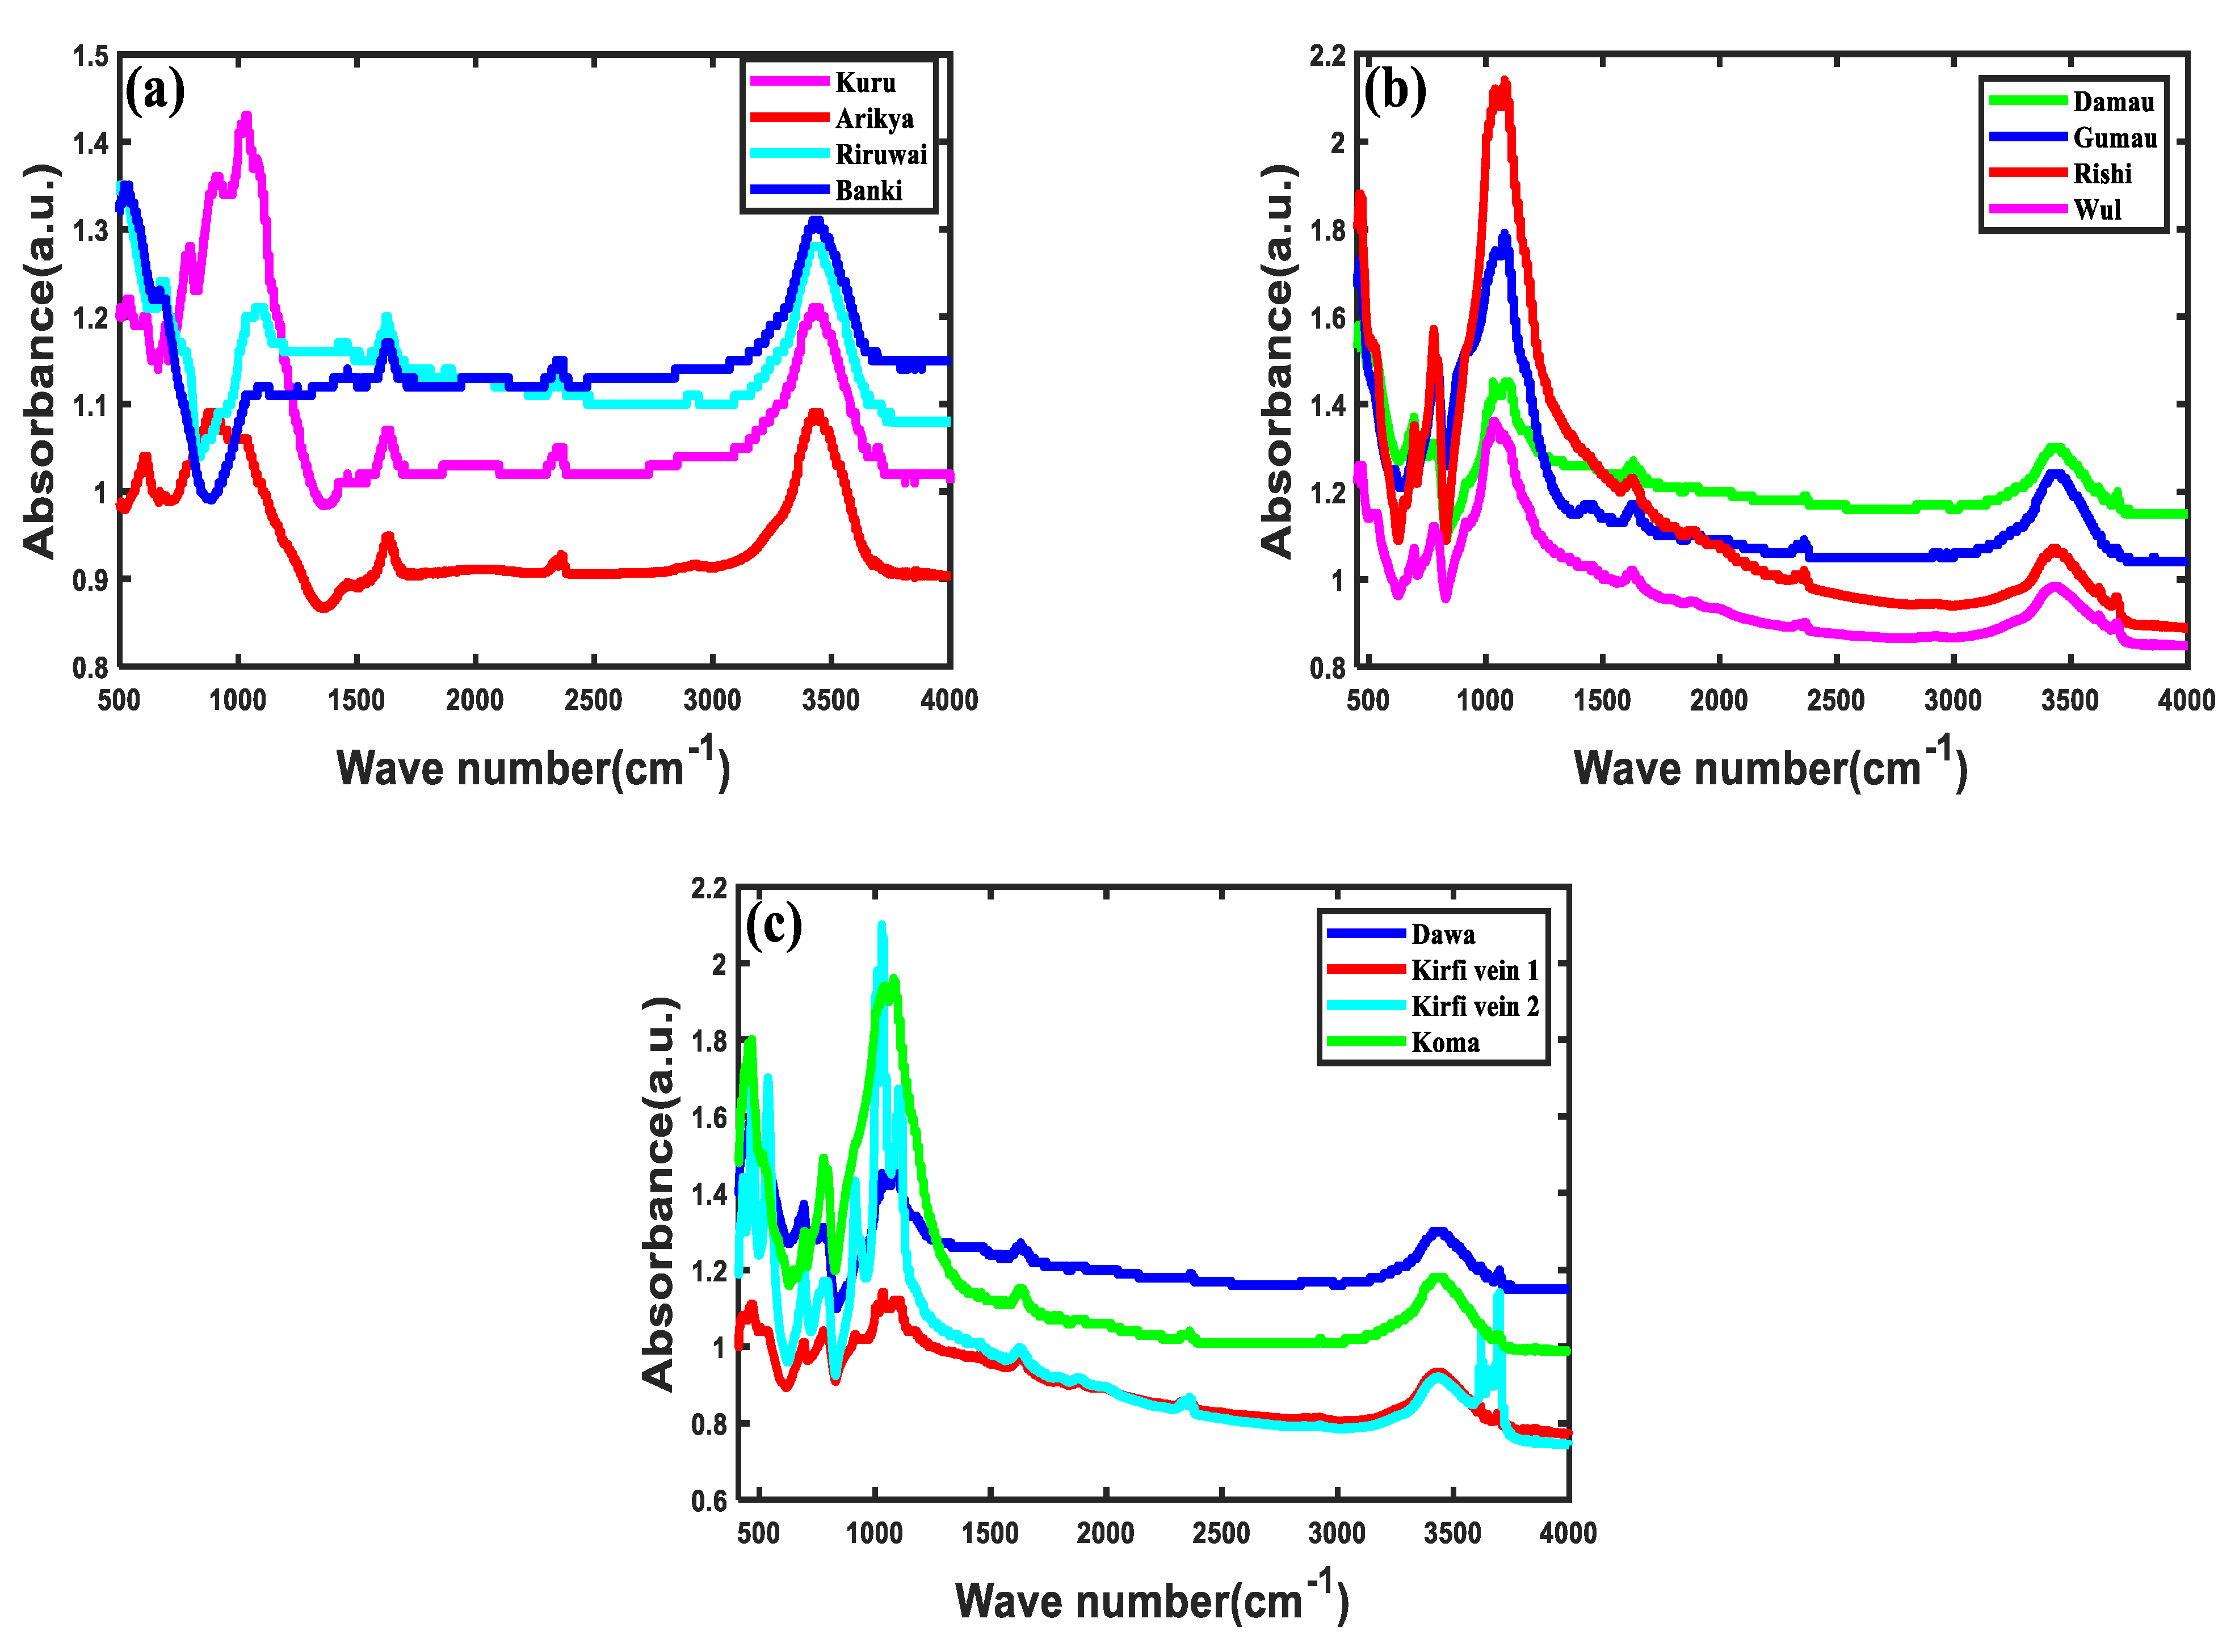
3.4. Functional Groups

The FT-IR spectra of all the samples are shown in Figure 8. The sharp peaks observed around 500 cm−1 in all our samples (Figure 8a–c) correspond to the stretching vibration of Zr-O in the ZrO2 phase [60,61]. Cassiterite’s distinctive peaks (Figure 8a–c) were found at 541.01 (Kuru sample), 502.52 (Riruwai sample), 518.41 (Banki sample), 514.49 (Damau sample), and 537.50 cm−1 (Kirfi vein 2 sample) [62]. In all the samples (Figure 8a–c), the peaks at 609.17, 609.14, 691.96, 668.96, 692.62, 693.42, 694.00, 693.88, 693.32, 693.32, 694.60, and 694.35 cm−1 were linked to bending vibration of SiO 4 2 [62]. Notably, the peaks (Figure 8a–c) at 693.99, 798.42, 1034.15 (Kuru sample); 668.88, 877.19 (Arikya sample); 1088.47 (Riruwai sample); 1103.08 (Banki sample); 777.05, 1033.93, 1084.73 (Damau sample); 778.99, 1080.89 (Gumau sample); 777.27, 1081.28 (Rishi sample); 777.90, 1035.32 (Wul sample); 777.77, 1034.81, 1077.72 (Dawa sample); 778.35, 1008.44, 1033.29, 1100.10 (Kirfi vein 1); 794.95, 1007.84, 1032.23, 1104.37 (Kirfi vein 2); and 778.03, and 1081.16 cm−1 (Koma sample) suggested that all the samples were quartz-rich with traces of kaolin [63,64,65]. In addition, the peaks (Figure 8a,c) at 911.85 (Kuru sample) and 913.34 cm−1 (Kirfi vein 2 sample) were attributed to stretching vibration of SiO 4 2 [62]. The peak (Figure 8a) situated at 1458.62 cm−1 from the Riruwai sample can be related to the absorption of nonbridging -OH groups. The absorption of nonbridging -OH groups was observed at 1384 cm−1 by [64]. There is a shift of 75 cm−1 when compared with our result. This may be caused by several variables, including the valences of the cation and anion; the coordination number of the cation; the coefficient of relative bond strength, which ranges from 1 to 2 depending on how covalent the bond is; the interatomic distance between the cation and anion; and the cation’s reduced mass as reported by [66]. According to [66], the absorption band is shifted to higher frequencies by decreasing the coordination number and increasing a cation’s valency in the range of 1 to 6. In contrast, as atomic mass increases, the frequency decreases.
Notwithstanding that the samples were dried before the FT-IR analysis, the clear band in the range of 1640–1600 cm−1 observed in Figure 8a–c centered at 1636.61 (Kuru sample), 1629.48 (Arikya sample), 1629.30 (Riruwai sample), 1636.73 (Banki sample), 1628.90 (Damau sample), 1624.54 (Gumau sample), 1624.72 (Wul sample), 1629.11 (Dawa sample), 1623.88 (Kirfi vein 1 sample), and 1624.40 cm−1 (Koma sample) may be attributed to the deformation vibrations of OH-adsorbed water [67], or it may be connected to the magnesium-rich chlorite [65]. The stretching vibration of the hydroxyl zirconium (Zr-OH) bond is indicated by the peaks (Figure 8a–c) at 2359.98 (Kuru sample), 2359.86 (Arikya sample), 2361.26 (Riruwai sample), 2360.89 (Banki sample), 2359.83 (Gumau sample), and 2360.34 cm−1 (Kirfi vein 1 sample) [68]. The significant absorption peaks (Figure 8a–c) in the region of 3200 to 3800 cm−1 observed in all our samples were due to stretching vibration -OH group of water molecules, which was absorbed by ZrO2 nanoparticles [64].

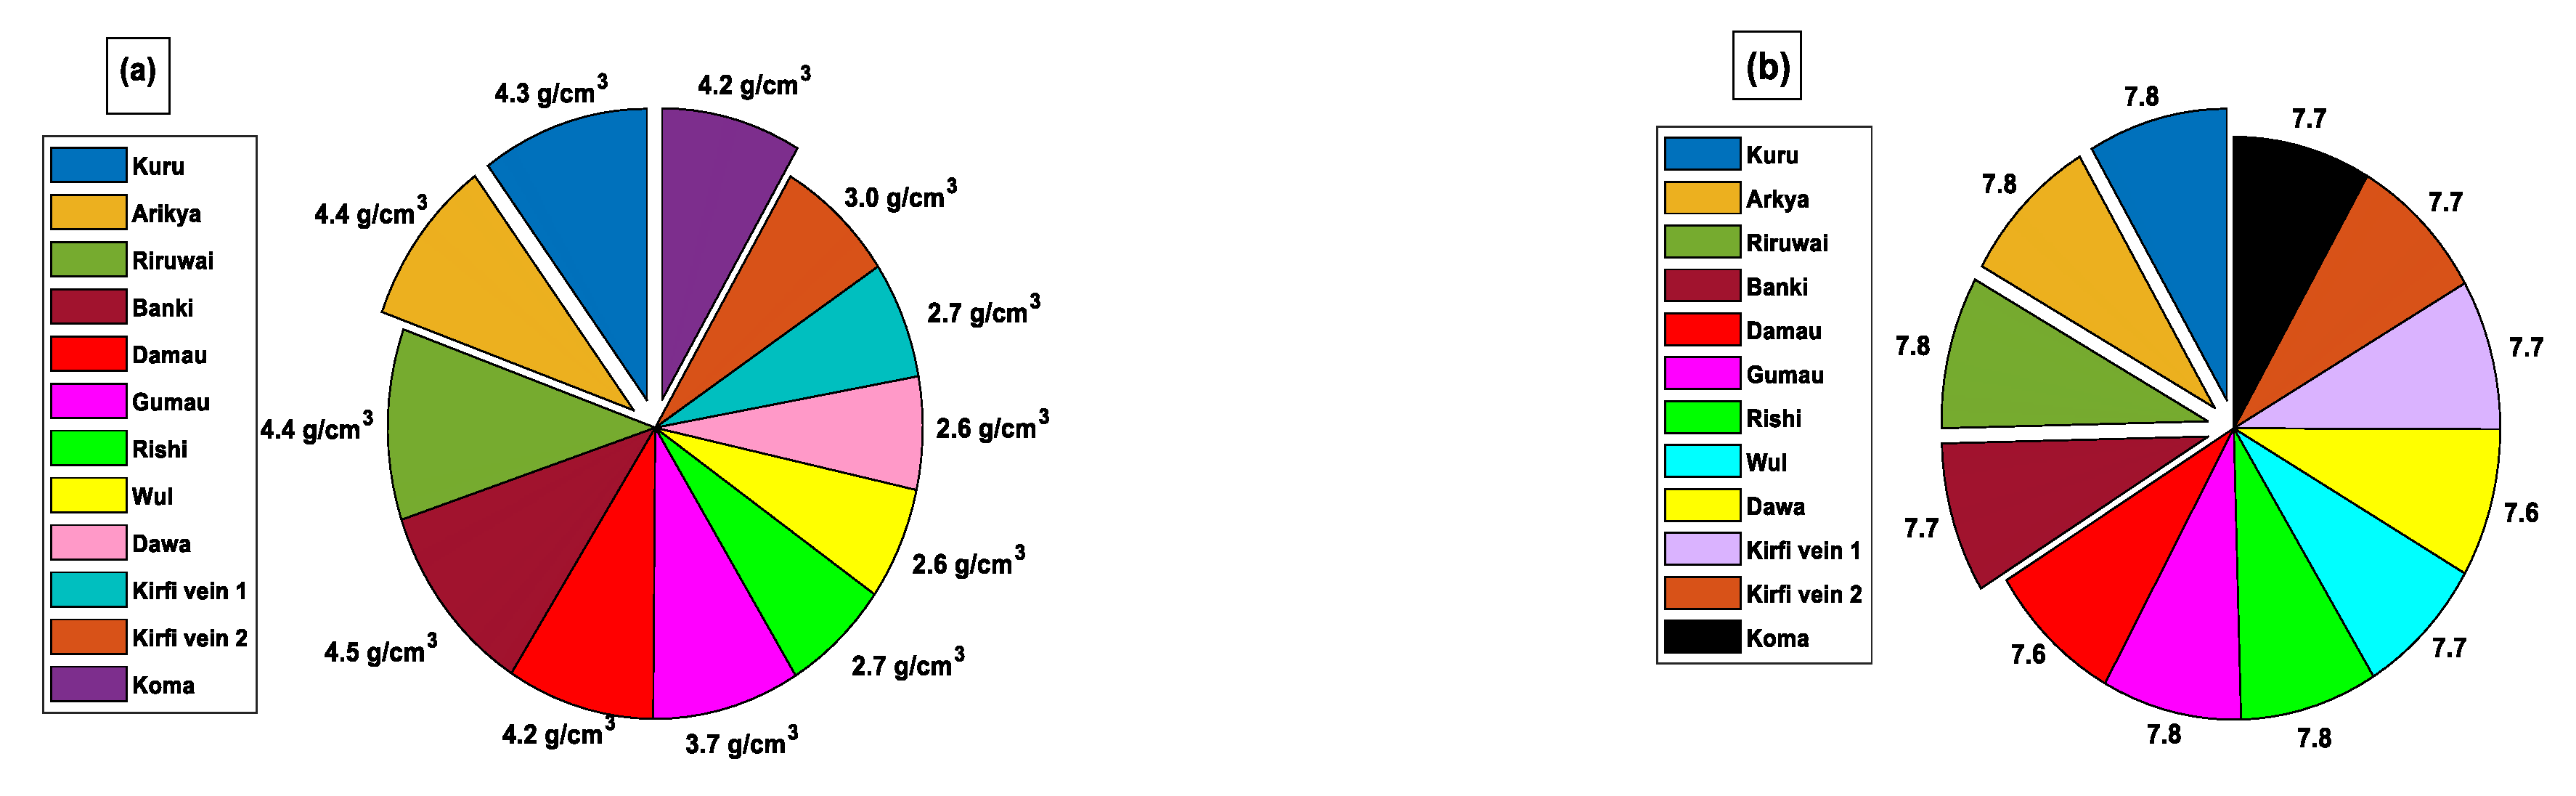
3.5. Specific Gravity

The specific gravities for all the samples are shown in Figure 9a and Table 4. The values range from 2.6 to 4.5 g/cm3. The Kuru and Arikya samples are at 4.3 and 4.4 g/cm3, respectively. Riruwai is at 4.4 g/cm3, while Banki is at 4.5 g/cm3. Damau is at 3.7 g/cm3, while Gumau and Koma have the same value of 4.2 g/cm3. The Rishi and Kirfi vein 1 samples have a low specific gravity of 2.7 g/cm3.
The lowest value of 2.6 g/cm3 was obtained for the samples from Wul and Dawa. The density of the green or dark brown zircon is 3.9–4.1 g/cm3 [69]. Samples from Rishi, Wul, Dawa, Kirfi vein 1, and Kirfi vein 2 fell below the expected operational values. Generally, zircon always has a specific gravity of between 4.2 and 4.86 g/cm3 [31]. The different variations in the values could be a result of the impurities and the low ZrO2 (Figure 5) that are embedded in each sample.

3.6. pH Values

All sample pH values (Table 4 and Figure 9b) exhibited a similar alkaline trend. Kuru, Arikya, Riruwai, and Gumau all have a pH of 7.8. In contrast, Banki, Rishi, Kirfi veins 1 and 2, and Koma have pH values of 7.7. The pH for Wul is 7.3, while the pH for Dawa is 7.6. The pH values corroborate with the report by [70].

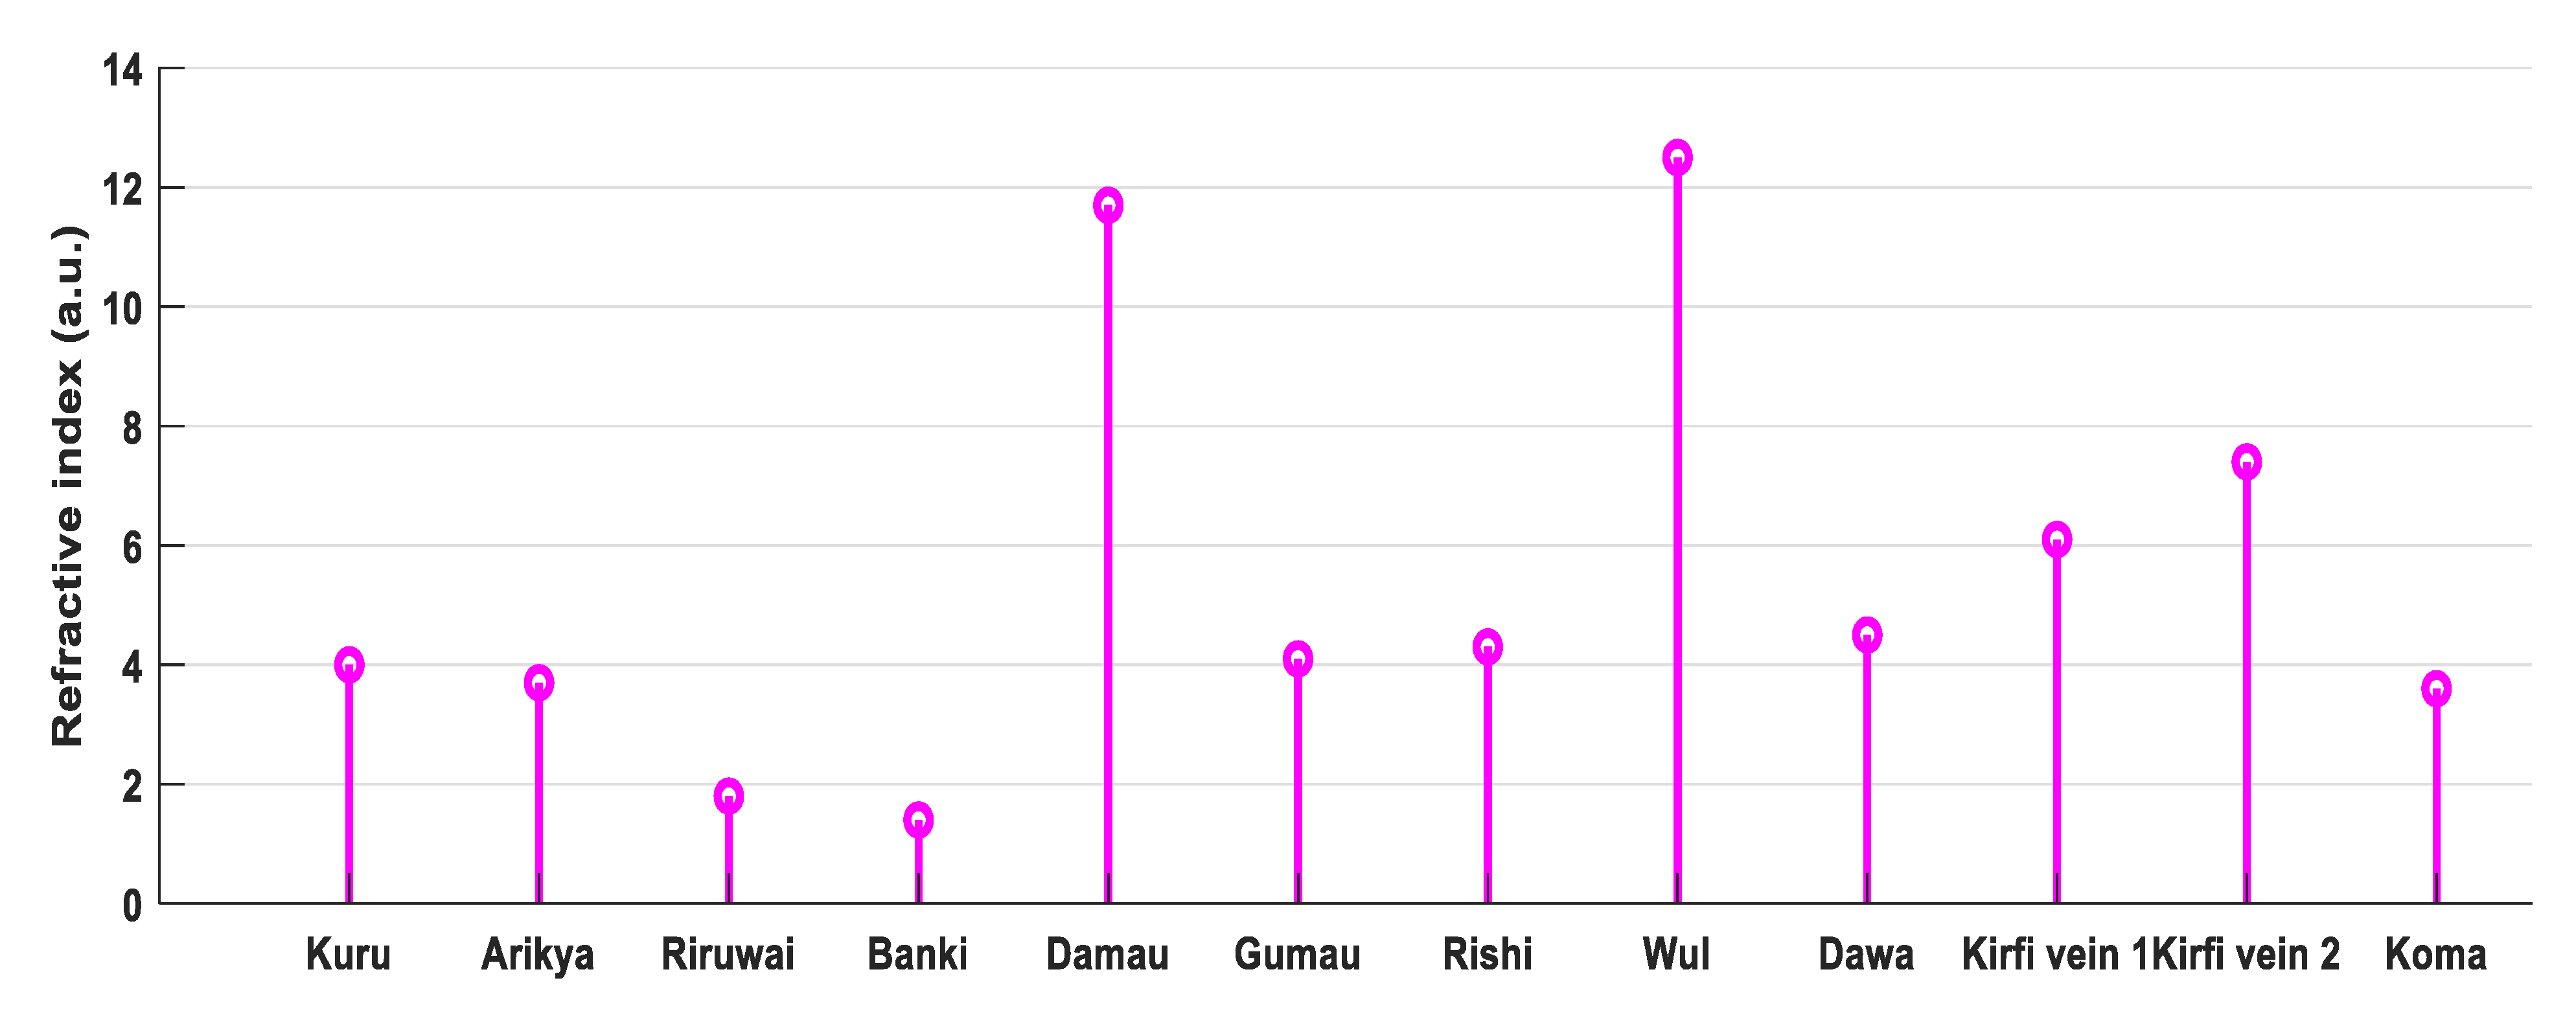
3.7. Refractive Index

The refractive index results of all the samples are shown in Table 4 and Figure 10. The values range from 1.4 to 12.5. We observed a remarkable trend in the refractive index values of these samples (Riruwai, Banki, Damau, Wul, Kirfi vein 1, and Kirfi vein 2), given that the samples contain little or no ZrO2.
The range of values between 3.6 and 4.5 was obtained for the Kuru, Arikya, Gumau, Rishi, Dawa, and Koma samples. Thus, according to the results in Table 2, these samples contain ZrO2 in varying percentages, which could explain why the values are similar. We believe that impurities, as shown in Table 2, are responsible for the difference in the values, although the values for these samples (Kuru, Arikya, Gumau, Rishi, Dawa, and Koma) do not correspond to the expected refractive index of between 1.78 and 1.82 for green or dark brown zircon.

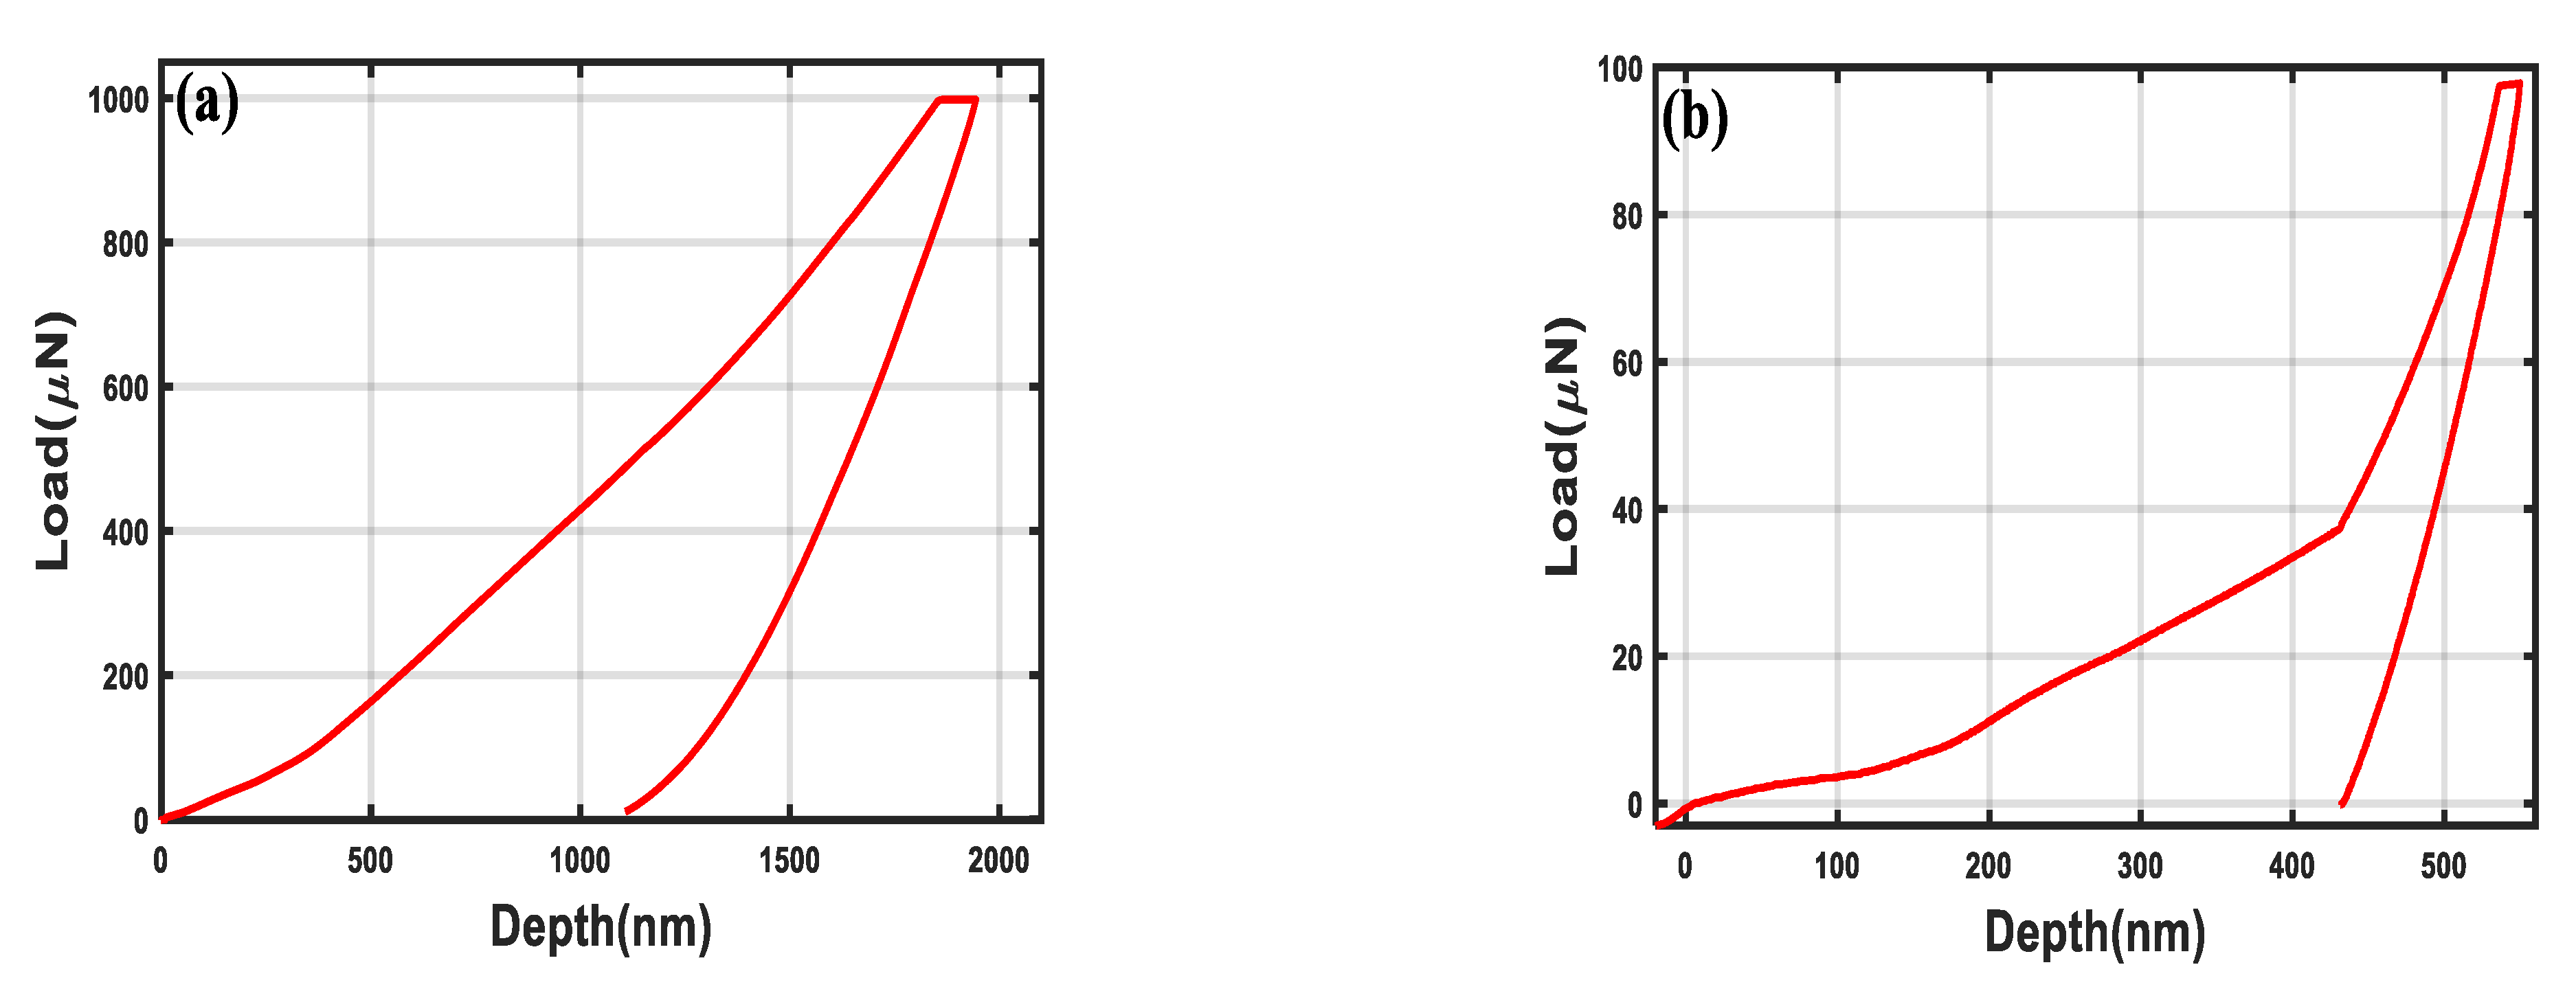
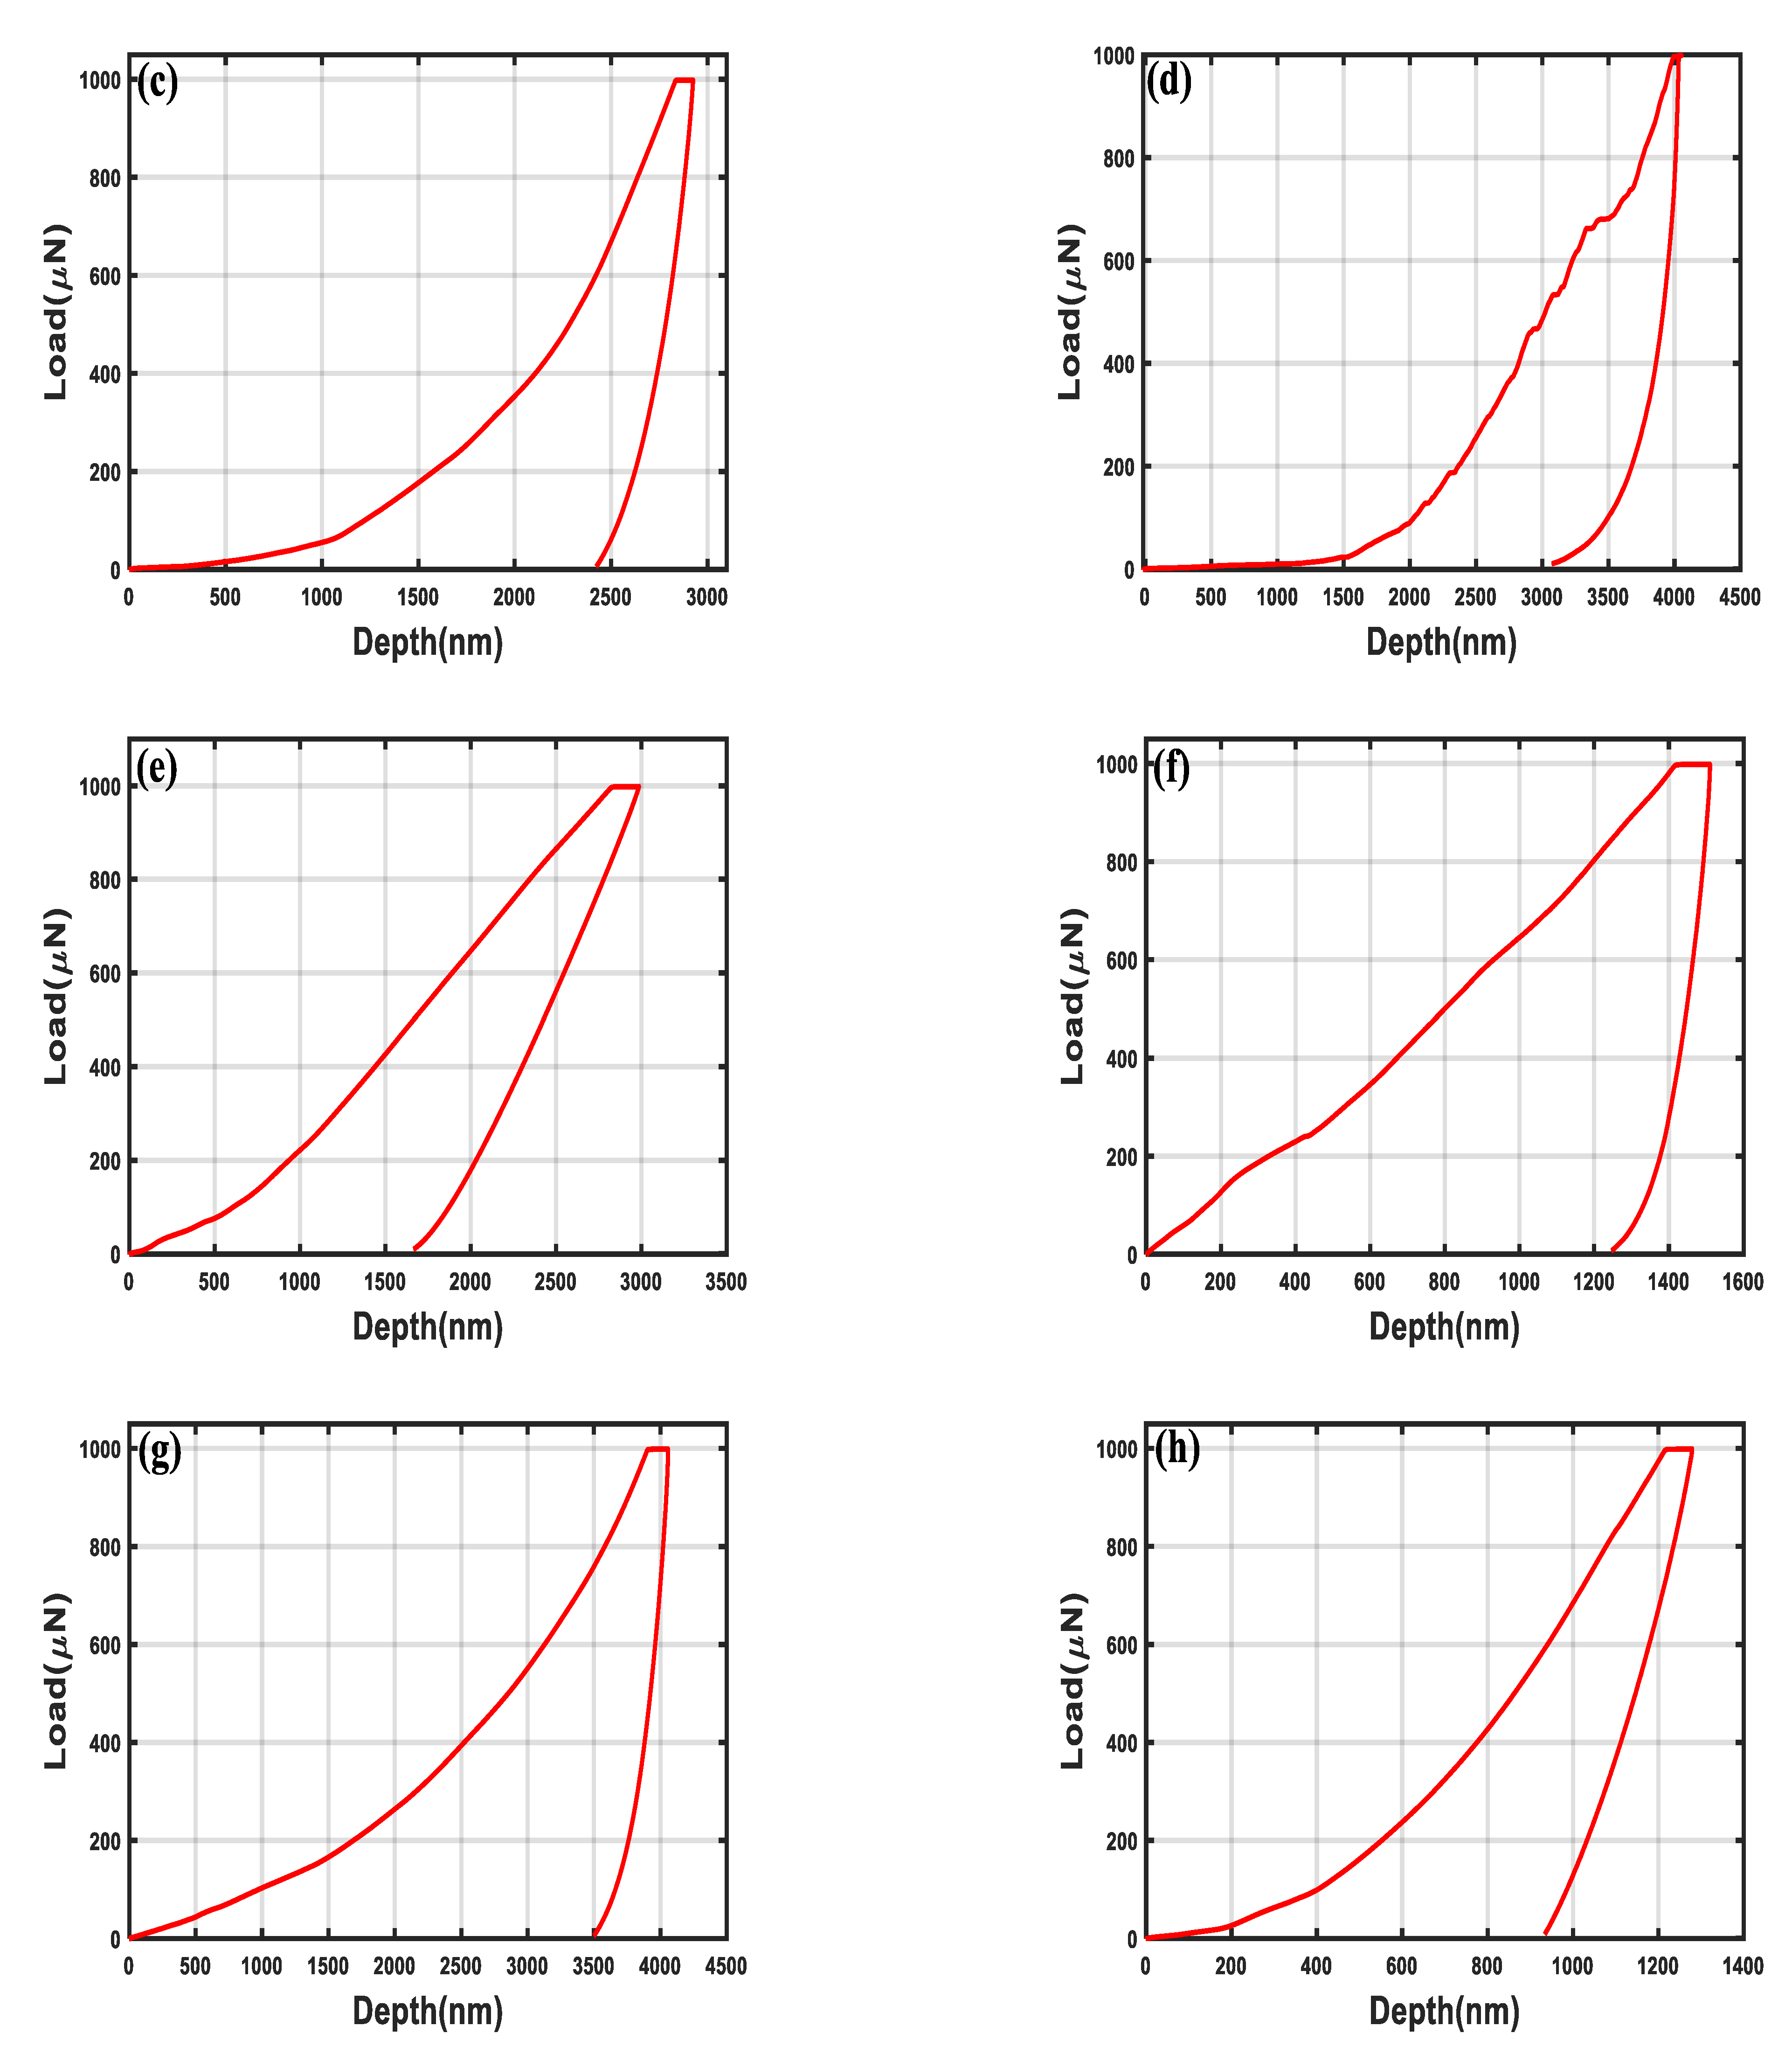
3.8. Nanohardness and Elastic Modulus

Figure 11a–l shows the load-depth graphs for the as-received samples. The nanohardness and elastic modulus values obtained for the samples are presented in Table 5. The elastic modulus is from 0.0558 ± 0.0035 GPa to 0.9593 ± 1.1800 GPa, while the hardness ranges from 0.0021 ± 0.0006 GPa to 0.0703 ± 0.1082 GPa. The hardness values from the Arikya, Gumau, and Dawa samples can be attributed to the fact that they contain ZrO2, as corroborated by the FT-IR results in Figure 8. Surprisingly, samples that contain low ZrO2 content have high hardness values. This is because the samples are cassiterite- and quartz-rich, as shown in Figure 7.
The different plateaus of the load-depth curves in Figure 11 may have been caused by many factors including aging of the samples, surface oxide formation, property variations between samples (compositional variation, polishing variation, residual stress, etc.), or any other time-dependent variable [71,72].
Figure 12a–l show the scanning probe microscope (SPM) images of the as-received samples before indentation tests.

3.9. Aerospace Engineering and Other Industrial Applications of Zircon Sand

As stated above, zircon is useful in many sectors of the economy, and thus the suitability of zircon sands for various industrial applications was investigated in this study. The samples examined from the specified mining locations had a zircon percentage ranging between 0.1% and 40% of zirconium oxide (ZrO2) content before beneficiation and removal of other impurities. This suggests that zircon sand from the various mining regions must be upgraded to the minimum purity, composition, and SG using gravity, magnetic, and electrostatic separation techniques before they can be used for preliminary composite formulation in the aerospace industry and other applications, such as cement, tiles, and building and construction, among others [4,5,6,7,8,13,30,73,74]. Prior to being utilized for the main applications, some of the impurities must be removed through the separation techniques mentioned above to increase the weight percentage of ZrO2 in the samples. Interfering impurities or contaminants must be removed for the samples to be used effectively since they can impair performance and limit applications in industries. After the purification, the samples will be synthesized to produce a high-quality ZrO2 needed for the zircon-reinforced composites for SRMs. SiO2 is the main impurity material found in all the samples, as seen in Table 3. SiO2 can be removed from the samples to improve the quality of the sample where necessary [75,76]. As illustrated in Table 6, some impurities are mixed with zircon to improve the sample properties. Since all the samples include the necessary chemical components (Table 2), they must be upgraded before they can be used for the various applications listed in Table 6. Once unwanted impurities are eliminated, the percentage composition of ZrO2, purity, and SG can be adjusted to meet the application’s specifications [33,77].

4. Conclusions

Several possibilities for zircon sand minerals in the aerospace and industrial sectors were revealed in this investigation. Twelve zircon sand samples were collected from Taraba, Plateau, Nasarawa, Kano, Kaduna, Bauchi, and Adamawa. The samples’ properties were assessed based on the physical appearance, shape, chemical composition, mineral content, functional groups, pH, specific gravity, refractive index, and nanohardness. These indices were used to study the molecular structure of ZrSiO4 and compared to USGS zirconium standards. Four samples (Kuru, Arikya, Gumau, and Koma) with ZrO2 content above 20% will be upgraded to the minimum purity and composition to increase the ZrO2 wt.% before they can be used in the aerospace industry to develop zircon-reinforced composites due to their good specific gravities of 4.2–4.4 g/cm3; 4.2 is the USGS minimum standard for zircon sand. They can also be utilized in ceramic, foundry, building and construction, glass, advanced ceramic, precision investment casting, paint, paper, cosmetics, and refractory industries. Although the mineral has potential industrial applications, sadly it is not making a significant contribution to national development as no value is added to it at present. The findings of this study are currently being used to determine the best type of zircon sand to use in the development of low-cost zircon-reinforced composite for the design and fabrication of solid rocket motors (SRM) for launch vehicles (rockets). This will promote increased utilization of locally produced materials and value addition to the mineral resources of Nigeria. Future work will look at enhancing the samples to the minimum zirconium oxide concentration, purity, and specific gravity by removing the unwanted mineral components using gravity, magnetic, and electrostatic separation techniques. The anticipated result, together with the current study, will serve as a reference for choosing the sample for the composite formulation. Thus, the enhanced zircon sand will be produced and evaluated for effectiveness in increasing the ZrO2 content and contaminant removal.

Author Contributions

Conceptualization: B.I.O.; methodology: B.I.O. and A.P.O.; formal analysis and investigation: B.I.O.; resources: B.I.O. and A.P.O.; data curation and writing—original draft preparation: B.I.O.; writing—review and editing: A.P.O., A.B. and O.T.Y.; supervision: O.A.A., A.P.O., A.B., O.S.S., O.T.Y. and V.C.A.; project administration: O.A.A. and A.P.O. All authors have read and agreed to the published version of the manuscript.

Funding

This research received no external funding.

Data Availability Statement

Data sharing is not applicable to this article as no datasets were generated or analyzed during the current study.

Acknowledgments

The authors acknowledge the assistance of the African Development Bank (AfDB) laboratory, AUST, Nigeria, and the Nigerian Geological Survey Agency (NGSA).

Conflicts of Interest

The authors declare no conflict of interest.

References

  1. FGN. Federal Republic of Nigeria. Nigeria Extractive Industries Transparency Initiative (NEITI) NEITI Secretariat; Federal Government of Nigeria: Abuja, Nigeria, 2011.
  2. MMSD. Nigeria’s Mining and Metal Sector, Investment Promotion Brochure; Ministry of Mines and Steel Development: Abuja, Nigeria, 2017.
  3. ZIA. Zircon Industry Association. Available online: https://www.zircon-association.org/zircon-essential-in-keeping-aircraft-airborne.html (accessed on 13 April 2021).
  4. Brian, E.W.; Robert, E.B. Technology Focus: Composites and Coatings Rapid Fabrication of Carbide Matrix/Carbon Fiber Composites. Available online: https://ntrs.nasa.gov/citations/20100010928 (accessed on 5 August 2022).
  5. Dickerson, M.B.; Hoffman, W.P. Rocket Nozzle Liners via the Displacive Compensation of Porosity (DCP) Method. J. Mater. Sci. 2004, 9, 6005–6015. [Google Scholar] [CrossRef]
  6. van de Goor, G.; Sagesser, P.; Berroth, K. Electrically Conductive Ceramic Composites. In Advanced Multilayered and Fibre-Reinforced Composites; Haddad, Y.M., Ed.; Kluwer Academic Publishers: Norwell, MA, USA, 1998; pp. 311–322. [Google Scholar]
  7. Jankowiak, A.; Justin, J.F. Ultra High Temperature Ceramics for Aerospace Applications; HAL: Bangalore, India, 2014. [Google Scholar]
  8. Low, I.M.; McPherson, R. Fabrication of new Zirconium Boride Ceramics. J. Mater. Sci. Lett. 1989, 8, 1281–1284. [Google Scholar] [CrossRef]
  9. Asuquo, L.O.; Bassey, E.N.; Ihom, A.P. Characteristics of Zircon Sand and the Effect on Foundry Casting. J. Mech. Ind. Res. 2013, 1, 27. [Google Scholar] [CrossRef]
  10. Bute, S.I.; Yang, X.; Cao, J.; Liu, L.; Deng, J.; Haruna, I.V.; Girei, M.B.; Abubakar, U.; Akhtar, S. Origin and Tectonic Implications of Ferroan Alkali-calcic Granitoids from the Hawal Massif, East-Eastern Nigeria Terrane: Clues from Geochemistry and Zircon U-Pb-Hf isotopes. Int. Geol. Rev. 2020, 62, 129–152. [Google Scholar] [CrossRef]
  11. Key, R.M.; Johnson, C.C.; Horstwood, M.S.A.; Lapworth, D.J.; Knights, K.V.; Kemp, S.J.; Watts, M.W.; Gillespie, M.; Adekanmi, M.; Arisekola, T. Investigating High Zircon Concentrations in the Fine Fraction of Stream Sediments Draining the Pan-African Dahomeyan Terrane in Nigeria. Appl. Geochem. 2012, 27, 1525–1539. [Google Scholar] [CrossRef]
  12. Kröner, A.; Ekwueme, B.N.; Pidgeon, R.T. The Oldest Rock in West Africa: SHRIMP Zircon Age for Early Archean Migmatitic Orthogneiss at Kaduna, Northern Nigeria. J. Geol. 2001, 109, 399–406. [Google Scholar] [CrossRef]
  13. Damonte, L.C.; Rivas, P.C.; Pasquevich, A.F.; Andreola, F.; Bondioli, F.; Ferrari, A.M.; Laura, T.; Cinelli, G. Structural Characterization of Natural and Processed Zircons with X-Rays and Nuclear Techniques. Adv. Condens. Mater Phys. 2017, 2017, 9. [Google Scholar] [CrossRef]
  14. Tahli, L.; Wahyudi, T.A. Characteristic Study of Popay Zircon Sand Used for Ceramics, Refractory and Foundry Raw Materials. Indones. Min. J. 2017, 19, 1–17. [Google Scholar] [CrossRef]
  15. Biswas, R.K.; Habib, M.A.; Karmakar, A.K.; Islam, M.R. Preparation of Some Useful Compounds of Zirconium from Bangladeshi Zircon. Ind. Eng. Chem. Res. 2012, 51, 13552–13561. [Google Scholar] [CrossRef]
  16. Khattab, R.M.; Hanna, S.B.; Zawrah, M.F.; Girgis, L.G. Alumina–zircon Refractory Materials for Lining of the Basin of Glass Furnaces: Effect of Processing Technique and TiO2 Addition. Ceram. Int. 2015, 41, 1623–1629. [Google Scholar] [CrossRef]
  17. Subuki, I.; Mohsin, M.F.; Ismail, M.H.; Suriani, F. Study of the Synthesis of Zirconia Powder from Zircon Sand Obtained from Zircon Minerals Malaysia by Caustic Fusion Method. Indones. J. Chem. 2020, 20, 782–790. [Google Scholar] [CrossRef]
  18. Bhattacharyyaa, B.N.; Bhushana, B.; Sen, S. Zircon Sand from Kerala Beach, its Mineralogy, Metamictization and Suitability as a Raw-Material for Glaze Opacification. Trans. Indian Ceram. Soc. 1968, 27, 37–41. [Google Scholar] [CrossRef]
  19. ILUKA. Mineral Sands Industry Information. Available online: https://iluka.com/media/41fcyzqo/mineral-sands-industry-information-nov19.pdf (accessed on 5 August 2022).
  20. Kovaleva, M.; Prozorova, M.; Arseenko, M.; Tyurin, Y.; Kolisnichenko, O.; Yapryntsev, M.; Novikov, V.; Vagina, O.; Sirota, V. Zircon-Based Ceramic Coatings Formed by a New Multi-Chamber Gas-Dynamic Accelerator. Coatings 2017, 7, 142. [Google Scholar] [CrossRef]
  21. Aral, H.; Pownceby, M.I.; Im, J. Characterisation and Beneficiation of Zircon- Rich Heavy Mineral Concentrates from Central Kalimantan (Borneo, Indonesia). Appl. Earth Sci. (Trans. Inst. Min. Met. B) 2008, 117, 77–88. [Google Scholar] [CrossRef]
  22. Banerji, A.; Surappa, M.K.; Rohatgi, P.K. Cast Aluminum Alloys Containing Dispersions of Zircon Particles. Metall. Trans. B 1983, 14, 273–283. [Google Scholar] [CrossRef]
  23. Ejiofor, J.U.; Okorie, B.A.; Reddy, R.G. Powder Processing and Properties of Zircon-Reinforced Al-13.5Si-2.5Mg Alloy Composites. J. Mater. Eng. Perform. 1997, 6, 326–334. [Google Scholar] [CrossRef]
  24. Kaur, K.; Pandey, O.P. Dry Sliding Wear Behavior of Zircon Sand Reinforced Al-Si alloy. Tribol. Lett. 2010, 38, 377–387. [Google Scholar] [CrossRef]
  25. NASRDA. Design of Reusable Solid Rocket Motor (SRM); National Space Research and Development Agency: Abuja, Nigeria, 2012. [Google Scholar]
  26. Adams, R. Review of Zirconium. Min. Eng. 2012, 64, 57. [Google Scholar]
  27. Pownceby, M.I.; Sparrow, G.J.; Aral, H.; Smith, L.K.; Bruckard, W.J. Recovery and Processing of Zircon from Murray Basin Mineral Sand Deposits. Trans. Inst. Min. Metall. Sect. C Miner. Process. Extr. Metall. 2015, 124, 240–253. [Google Scholar] [CrossRef]
  28. USDOI. Minerals Yearbook; US Dep. Inter. (USDOI), Bur. Mines: Washington, DC, USA, 1992.
  29. Considine, G.D.; Kulik, P.H. Scientific Encyclopedia, 10th ed.; John Wiley & Sons, Inc.: Hoboken, NJ, USA, 2008. [Google Scholar]
  30. Enghag, P. Encyclopedia of the Elements; WILEY-VCH Verlag GmbH & Co., KGaA: Weinheim, Germany, 2004. [Google Scholar]
  31. USGS. International Strategic Minerals Inventory Summary Report-Zirconium; U.S. Geological Survey Circular: Denver, CO, USA, 1992.
  32. Volp, K.M.; Russill, J.; Donovan, G.O. Exploration for Offshore Heavy Mineral Sands by Grupo Minero Esmeralda Colombiana, Colombia. In Proceedings of the 7th International Heavy Minerals Conference ‘What Next’, Drakensberg, South Africa, 20–23 September 2009; The Southern African Institute of Mining and Metallurgy: Johannesburg, South Africa, 2009; pp. 163–176. [Google Scholar]
  33. USGS. Zirconium and Hafnium: Critical Mineral Resources of the United States—Economic and Environmental Geology and Prospects for Future Supply; U.S. Geological Survey: Reston, VA, USA, 2017.
  34. Lines, M. An overview of the Mineral Sands Industry. AusIMM Bull. 2008, 2, 38–41. [Google Scholar]
  35. ILUKA. Annual Report. Available online: https://www.annualreports.com/Company/Iluka-Resources (accessed on 8 February 2022).
  36. Cheng, L.; Zhuang, C.; Li, S.; Huang, G.; Zhang, H.; Gan, F.; Xu, N.; Hou, S. Thermal Performance Optimization Simulation Study of a Passive Solar House with a Light Steel Structure and Phase. Energies 2023, 16, 3725. [Google Scholar] [CrossRef]
  37. Khebli, Z.; Bouzerara, F.; Brihi, N.; Figoli, A.; Russo, F.; Galiano, F.; Chahredine, S. Fabrication of a Zircon Microfiltration Membrane for Culture Medium Sterilization. Membranes 2023, 13, 399. [Google Scholar] [CrossRef] [PubMed]
  38. ASTM D854; Standard Test Methods for Specific Gravity of Soil Solids by Water Pycnometer. The American Society for Testing and Materials: West Conshohocken, PA, USA, 2000; pp. 1–7.
  39. Prakash, K. Geotechnical Engineering Laboratory Instruction Manual. Available online: https://sjce.ac.in/wp-content/uploads/2018/01/Geotechnical-Lab-Manual.pdf (accessed on 14 August 2022).
  40. Gaillard, Y.; Amiot, F. Grid Nano-Indentation as Full-Field Measurements. Compos. Part A Appl. Sci. Manuf. 2020, 132, 105807. [Google Scholar] [CrossRef]
  41. Oliver, W.C.; Pharr, G.M. An Improved Technique for Determining Hardness and Elasctic Modulus using Load and Displacement Sensing Indentation Experiments. J. Mater. Res. 1992, 7, 1564–1583. [Google Scholar] [CrossRef]
  42. Woirgard, J.; Dargenton, J.C. An Alternative Method for Penetration Depth Determination in Nanoindentation Measurements. J. Mater. Res. 1997, 12, 2455–2458. [Google Scholar] [CrossRef]
  43. King, R.B. Elastic Analysis of Some Punch Problems for a Layered Medium. Int. J. Solids Struct. 1987, 23, 1657–1664. [Google Scholar] [CrossRef]
  44. Leger, R.G.; Millette, G.J.F.; Chomchan, S. The Effects of Organic Matter, Iron Oxides and Moisture on the Color of two Agricultural Soils of Quebec. Can. J. Soil Sci. 1979, 59, 191–202. [Google Scholar]
  45. Owens, P.R.; Rutledge, E.M. Morphology in Encyclopedia of Soils in the Environment; Elsevier Ltd.: Cambridge, MA, USA, 2005; pp. 511–520. [Google Scholar]
  46. Spielvogel, S.; Knicker, H.; Kögel-Knabner, I. Soil Organic Matter Composition and Soil Lightness. J. Plant Nutr. Soil Sci. 2004, 167, 545–555. [Google Scholar] [CrossRef]
  47. National Soil Survey Center. Field Book for Describing and Sampling Soils; U.S. Department of Agriculture: Washington, DC, USA, 2002.
  48. Bansal, V.; Syed, A.; Bhargava, S.K.; Ahmad, A.; Sastry, M. Zirconia Enrichment in Zircon Sand by Selective Fungus-Mediated Bioleaching of Silica. Langmuir 2007, 23, 4993–4998. [Google Scholar] [CrossRef]
  49. Corfu, F.; Hanchar, J.M.; Hoskin, P.W.O.; Kinny, P. Atlas of zircon textures. Rev. Mineral. Geochem. 2003, 53, 469–500. [Google Scholar] [CrossRef]
  50. Pupin, J.P. Zircon and Granite Petrology. Contrib. Mineral. Petrol. 1980, 73, 207–220. [Google Scholar] [CrossRef]
  51. Hoskin, P.W.O.; Schaltegger, U. The Composition of Zircon and Igneous and Metamorphic Petrogenesis. Rev. Mineral. Geochem. 2013, 53, 27–62. [Google Scholar] [CrossRef]
  52. Anfinson, O.A.; Leier, A.L.; Embry, A.F.; Dewing, K. Detrital Zircon Geochronology and Provenance of the Neoproterozoic to Late Devonian Franklinian Basin, Canadian Arctic Islands. Bull. Geol. Soc. Am. 2012, 124, 415–430. [Google Scholar] [CrossRef]
  53. Sarangua, N.; Watanabe, Y.; Echigo, T.; Hoshino, M. Chemical Characteristics of Zircon from Khaldzan Burgedei Peralkaline Complex, Western Mongolia. Minerals 2019, 9, 10. [Google Scholar] [CrossRef]
  54. Gao, Z.; Pan, J. Factors Affecting Zircon Metamictization in Granites. Chin. J. Geochem. 1986, 5, 180–188. [Google Scholar] [CrossRef]
  55. Harley, S.L.; Kelly, N.M. Tiny but Timely. Elements 2007, 3, 13–18. [Google Scholar] [CrossRef]
  56. Murakami, T.; Chakoumakos, B.C.; Ewing, R.C.; Lumpkin, G.R.; Weber, W.J. Alpha-Decay Event Damage in Zircon. Am. Mineral. 1991, 76, 1510–1532. [Google Scholar]
  57. Zaman, M.M.; Antao, S.M. Crystal Chemistry and Structural Variations for Zircon Samples from Various Localities. Minerals 2020, 10, 947. [Google Scholar] [CrossRef]
  58. Belousova, E.A.; Griffin, W.L.; O’Reilly, S.Y.; Fisher, N.I. Igneous Zircon: Trace Element Composition as an Indicator of Source Rock Type. Contrib. Mineral. Petrol. 2002, 143, 602–622. [Google Scholar] [CrossRef]
  59. Genoveva, G.R.; Elizabeth, T.R.G.; Eduardo, O.R. The Influence of Agitation Speed on the Morphology and Size Particle Synthesis of Zr(HPO4)2 H2O from Mexican Sand. J. Miner. Mater. Charact. Eng. 2007, 6, 39–51. [Google Scholar]
  60. Horti, N.C.; Kamatagi, M.D.; Nataraj, S.K.; Wari, M.N.; Inamdar, S.R. Structural and Optical Properties of Zirconium Oxide (ZrO2) Nanoparticles: Effect of Calcination Temperature. Nano Express 2020, 1, 1. [Google Scholar] [CrossRef]
  61. Guo, G.Y.; Chen, Y.L.; Ying, W.J. Thermal, Spectroscopic and X-ray Diffractional Analyses of Zirconium Hydroxides Precipitated at low pH Values. Mater. Chem. Phys. 2004, 84, 308–314. [Google Scholar] [CrossRef]
  62. Peng, H.; Luo, W.; Wu, D.; Bie, X.; Shao, H.; Jiao, W.; Liu, Y. Study on the Effect of Fe3+ on Zircon Flotation Separation from Cassiterite using Sodium Oleate as Collector. Minerals 2017, 7, 108. [Google Scholar] [CrossRef]
  63. Müller, C.M.; Pejcic, B.; Esteban, L.; Piane, C.D.; Raven, M.; Mizaikoff, B. Infrared Attenuated Total Reflectance Spectroscopy: An Innovative Strategy for Analyzing Mineral Components in Energy Relevant Systems. Sci. Rep. 2014, 4, 6764. [Google Scholar] [CrossRef] [PubMed]
  64. Routray, S.; Mohanty, R.; Swain, R.; Sahu, S.; Mishra, B.R. Preparation and Characterisation of Zirconia Nano-Materials Prepared from Zircon Minerals of Brahmagiri Coast. J. Inst. Eng. Ser. E 2021, 102, 87–95. [Google Scholar] [CrossRef]
  65. Jozanikohan, G.; Abarghooei, M.N. The Fourier Transform Infrared Spectroscopy (FTIR) Analysis for the Clay Mineralogy Studies in a Clastic Reservoir. J. Pet. Explor. Prod. Technol. 2022, 12, 2093–2106. [Google Scholar] [CrossRef]
  66. Povnnennykh, A.S. The use of Infrared Spectra for the Determination of Minerals. Am. Mineral. 1978, 63, 956–959. [Google Scholar]
  67. Kuligiewicz, A.; Derkowski, A. Tightly Bound Water in Smectites. Am. Mineral. 2017, 102, 1073–1090. [Google Scholar] [CrossRef]
  68. Dwivedi, R.; Maurya, A.; Verma, A.; Prasad, R.; Bartwal, K.S. Microwave Assisted Sol-gel Synthesis of Tetragonal Zirconia Nanoparticles. J. Alloys Compd. 2011, 509, 6848–6851. [Google Scholar] [CrossRef]
  69. Shi-Lun, G.; Bao-Liu, C. Handbook of Radioactivity Analysis, 3rd ed.; Elsevier Inc.: Amsterdam, The Netherlands, 2012; Volume 275, p. 96. [Google Scholar]
  70. The Chemours Company FC. Zircon Sands. Available online: https://www.chemours.com/en/-/media/files/minerals/mineral-zircon-product-info.pdf?rev=5b038a8469294159b0b51d76a72aa459 (accessed on 4 March 2022).
  71. Ruiz-moreno, A.; Hähner, P.; Kurpaska, L.; Jagielski, J.; Spätig, P.; Trebala, M.; Hannula, S.P.; Merino, S.; de Diego, G.; Namburi, H.; et al. Round Robin into Best Practices for the Determination of Indentation Size Effects. Nanomaterials 2020, 10, 130. [Google Scholar] [CrossRef]
  72. Chudoba, T.; Jennett, N.M. Higher Accuracy Analysis of Instrumented Indentation Data Obtained with Pointed Indenters. J. Phys. D Appl. Phys. 2008, 41, 21. [Google Scholar] [CrossRef]
  73. IAEA. Radiation Protection and NORM Residue Management in the Zircon and Zirconia Industries; IAEA: Vienna, Austria, 2007. [Google Scholar]
  74. Selby, J. The Industrial uses of Zircon and Zirconia, and the Radiological Consequences of these uses. In Proceedings of the Fifth International Symposium, Seville, Spain, 19–22 March 2007; pp. 19–22. [Google Scholar]
  75. Nurlaila, R.; Musyarofah; Muwwaqor, N.F.; Kuswoyo, T.A.; Pratapa, S. Phase Analysis of ZrO2-SiO2 Systems Synthesized Through Ball Milling Mechanical Activations. AIP Conf. Proc. 2017, 1788, 030122. [Google Scholar]
  76. Yuhelda, Y.; Amalia, D.; Nugraha, E.P. Processing Zirconia through Zircon Sand Smelting with NaOH as a Flux. Indones. Min. J. 2017, 19, 39–49. [Google Scholar] [CrossRef]
  77. Routray, S.; Rao, R.B. Beneficiation and Characterization of Detrital Zircons from Beach Sand and Red Sediments in India. J. Miner. Mater. Charact. Eng. 2011, 10, 1409–1428. [Google Scholar] [CrossRef]
Figure 1. Methodology flowsheet.
Minerals 13 00711 g001
Figure 2. Map of Nigeria showing the study locations.
Minerals 13 00711 g002
Figure 3. Color variations of all the as-received zircon sand samples (All images dimensions: 4.5 cm × 4.8 cm) (a) Kuru (brown-orange), (b) Arikya (brown–orange), (c) Riruwai (gray–brown), (d) Banki (gray–yellow), (e) Damau (gray–brown), (f) Gumau (brown–orange), (g) Rishi (brown–orange), (h) Wul (brown–yellow), (i) Dawa (brown–orange), (j) Kirfi vein 1 (gray–orange), (k) Kirfi vein 2 (brown–orange), and (l) Koma (orange–yellow).
Minerals 13 00711 g003aMinerals 13 00711 g003b
Figure 4. SEM images of the as-received zircon minerals indicating their morphological variations. (a) Kuru—showing angular blocky, (b) Arikya—wedge, (c) Riruwai—angular blocky, (d) Banki–angular blocky, (e) Damau–angular blocky, (f) Gumau—angular blocky, (g) Rishi—granular, (h) Wul–granular, (i) Dawa–subangular blocky, (j) Kirfi vein 1–subangular blocky, (k) Kirfi vein 2–angular blocky, and (l) Koma–angular blocky.
Minerals 13 00711 g004aMinerals 13 00711 g004b
Figure 5. ZrO2 weight percentages of all the as-received samples.
Minerals 13 00711 g005
Figure 6. Major oxide content for some selected elements.
Minerals 13 00711 g006
Figure 7. XRD arrangements of all the as-received zircon sand samples for (a) Kuru, (b) Arikya, (c) Riruwai, (d) Banki, (e) Damau, (f) Gumau, (g) Rishi, (h) Wul, (i) Dawa, (j) Kirfi vein 1, (k) Kirfi vein 2, (l) Koma.
Minerals 13 00711 g007aMinerals 13 00711 g007bMinerals 13 00711 g007c
Figure 8. FT-IR spectra of the as-received zircon sand samples from different locations; (a) spectra of Kuru, Arikya, Riruwai, and Banki; (b) spectra of Damau, Gumau, Rishi, and Wul; (c) spectra of Dawa, Kirfi vein 1, Kirfi vein 2, and Koma.
Minerals 13 00711 g008
Figure 9. Values for (a) specific gravity and (b) pH values of all the as-received zircon sand samples.
Minerals 13 00711 g009
Figure 10. Refractive indexes of all the as-received zircon sand samples.
Minerals 13 00711 g010
Figure 11. Load-depth (L-d) graphs for nanoindentation of the as-received samples, (a) Kuru, (b) Arikya, (c) Riruwai, (d) Banki, (e) Damau, (f) Gumau, (g) Rishi, (h) Wul, (i) Dawa, (j) Kirfi vein 1, (k) Kirfi vein 2, (l) Koma.
Minerals 13 00711 g011aMinerals 13 00711 g011bMinerals 13 00711 g011c
Figure 12. In-situ SPM images of the as-received samples before indentation tests, (a) Kuru, (b) Arikya, (c) Riruwai, (d) Banki, (e) Damau, (f) Gumau, (g) Rishi, (h) Wul, (i) Dawa, (j) Kirfi vein 1, (k) Kirfi vein 2, (l) Koma.
Minerals 13 00711 g012
Table 1. Sampling locations.
S/NStateLocal Government AreaLocationGPS Coordinates
1PlateauJos-southKuruLatitude: 9°42′59.99″ N
Longitude: 8°50′59.99″ E
2NasarawaLafiaArikyaLatitude: 8°29′17.99″ N
Longitude: 8°30′59.99″ E
3KanoDoguwaRiruwaiLatitude: 10°52′46.67″ N
Longitude: 8°39′50.00″ E
4KadunaAnchauBankiLatitude: 10°35′2.8″ N
Longitude: 7°26′2.8″ E
DamauLatitude: 10°54′0″ N
Longitude: 8°26′0″ E
5BauchiToroGumauLatitude: 10°14′52″ N
Longitude: 9°1′4″ E
ToroRishiLatitude: 10°29′0″ N
Longitude: 8°56′0″ E
ToroWulLatitude: 9°57′7.03″ N
Longitude: 8°52′13.04″ E
ToroDawaLatitude: 10°24′0″ N
Longitude: 9°1′0″ E
KirfiKirfi vein 1Latitude: 10°23′39.37″ N
Longitude: 10°31′56.03″ E
Kirfi vein 2Latitude: 10°23′39.37″ N
Longitude: 10°31′56.03″ E
6AdamawaJadaKomaLatitude: 8°41′19.50″ N
Longitude: 12°19′2.75″ E
Table 2. EDXRF spectroscopy elemental oxide percentage composition of the as-received zircon sand samples from different mining sites.
Percentage of Elemental Oxide Composition for Different Samples
Elements/
Oxides
KuruArikyaRiruwaiBankiDamauGumauRishiWulDawaKirfi Vein 1Kirfi
Vein 2
Koma
CuO0.4050.0140.2790.0020.0510.0360.000120.0460.0030.0030.0060.012
ZnO0.0900.0400.0030.0120.0080.0050.0150.0110.0290.0010.0020.047
Ga2O30.1000.0700.0200.000260.000620.0600.0020.0030.0020.000200.0010.030
Au2.0000.9000.300 0.0200.800 0.070 01000.0030.200
HgO0.3800.0850.267 0.141 0.028 0.0040.0170.114
Y2O3 0.004 0.003 0.003
As2O30.5660.2540.004 0.0130.366 0.0380.0160.0050.261
Br0.2000.1000.009 0.0030.100 0.020 0.0080.0360.100
Rb2O1.5350.7450.0420.0180.0030.6132.0420.0101.2680.0010.0010.906
ZrO235.82040.7650.4440.7890.91430.43910.4341.04910.1390.1070.13621.704
Nb2O50.2580.0661.2680.3860.0590.4220.1440.3130.0020.0400.0300.273
PbO0.2700.1160.0010.0080.0060.1770.0180.0210.0410.0090.0030.131
Bi2O50.2000.0900.0150.0370.0040.0700.0400.0100.0340.00010.0020.100
ThO21.5040.6890.045 0.0030.555 0.103 0.0010.0030.946
Fe2O31.0340.73110.05816.53711.0002.1872.3282.1345.3130.1130.3594.767
Co3O40.2530.1910.552 0.7190.194 0.138 0.0090.0230.265
NiO1.6721.6381.604 1.6051.649 1.613 1.6141.6141.626
Ta2O510.007.0001.2570.0100.0045.0000.0050.105 0.00020.0052.000
WO30.0060.0010.0010.0110.0000840.0001960.0120.0001280.0120.0000090.0000180.000407
Sc2O30.0000470.0020.000300 0.0000300.000023 0.000023 0.0000030.0000070.000027
TiO20.1790.83310.62836.51314.8611.7090.3990.3760.1860.1560.3201.902
V2O50.0090.0430.7710.0650.8950.0560.0080.0160.0130.0070.0130.074
Cr2O30.0090.2000.010 0.0040.0200.0010.0070.0070.000350.0010.030
MnO0.0510.1000.3642.1631.0730.0830.1170.0500.2000.0050.0080.219
La2O30.6183.51330.35 40.975.211 1.295 0.5271.0715.830
CeO20.3254.54211.87 10.990.891 0.603 0.1560.2761.683
MgO2.90.90.90.982.60.23.403.01.623.00.90.7
Eu2O3 0.874
Al2O32.453.133.72.7424.993.909.7829.878.5542.0511.126.13
SiO222.5517.6115.8019.69924.2340.6562.94461.2553.82675.40363.9044.91
P2O55.66610.4821.0000.1940.1743.5630.2840.2000.2250.4000.3002.036
SO30.3000.5000.0800.0390.00040.2000.0050.0040.0260.0090.0080.100
Ag2O0.0040.00040.001 0.0010.0020.0010.00020.0010.0010.0020.002
GeO2 0.00041 0.00028 0.00049
Sb2O30.0010.0030.0080.1190.000090.002 0.0030.2000.0010.000090.00020
I0.0010.0020.0070.0000360.0001000.0007000.0004650.00030000.0001000.0000490.0000700.001
Cs2O0.0830.0090.003 0.1000.077 0.010 0.1350.0120.010
BaO0.000420.0010.0030.2870.00070.0030.0170.0070.0220.0030.0040.0003
Cl0.0040.0020.001 0.000270.002 0.0010.0160.00030.00010.001
K2O3.004.002.000.3240.060.502.7281.262.6810.240.030.39
CaO0.751.952.140.5490.1790.760.1070.1610.4270.0460.1000.453
SrO0.0030.000060.0001055.0960.0001430.000103.9860.0024.8750.0002730.0004840.001
CdO1.600.41.3 0.410.8 1.700.012.001.110.10
SnO20.6982.9045.4752.2670.2100.9051.3720.4332.4310.0140.0090.712
U3O81.3593.5080.246 0.3480.968 0.604 0.3390.3572.507
Table 3. Summary of zircon and major oxide contents for some selected elements from the as-received zircon sand samples.
SamplesMajor Contaminant Minerals (wt.%)
ZrO2 (wt.%)SiO2TiO2Fe2O3Al2O3SnO2
Kuru35.8222.550.181.032.450.69
Arikya40.7717.610.830.733.132.90
Riruwai0.4415.8010.6310.063.705.48
Banki0.7919.6936.5116.542.742.27
Damau0.9124.2314.8711.004.990.21
Gumau30.4440.651.712.193.900.91
Rishi10.4362.940.392.339.781.37
Wul1.0561.250.382.139.870.43
Dawa10.1453.830.195.318.552.43
Kirfi vein 10.1175.400.150.112.050.01
Kirfi vein 20.1463.900.320.3611.120.01
Koma21.7044.911.904.776.130.71
Table 4. Derived characteristics of the as-received zircon sand samples.
Samples Properties
Specific GravityRefractive IndexpH Value
Kuru4.34.07.8
Arikya4.43.77.8
Riruwai4.41.87.8
Banki4.51.47.7
Damau3.711.77.6
Gumau4.24.57.8
Rishi2.74.37.7
Wul2.612.57.3
Dawa2.64.57.6
Kirfi vein 12.76.17.7
Kirfi vein 23.07.47.7
Koma4.23.67.7
Table 5. Nanohardness and elastic modulus values obtained for the different as-received zircon sand samples.
SamplesElastic Modulus (GPa)Hardness (GPa)
Kuru0.1487 ± 0.07080.0089 ± 0.0067
Arikya0.2475 ± 0.12100.0147 ± 0.0030
Riruwai0.9593 ± 1.18000.0703 ± 0.1082
Banki0.1093 ± 0.00380.0021 ± 0.0006
Damau0.0819 ± 0.00870.0052 ± 0.0028
Gumau0.4165 ± 0.44560.0139 ± 0.0074
Rishi0.1552 ± 0.06550.0043 ± 0.0029
Wul0.8975 ± 0.31840.0447 ± 0.0361
Dawa0.1593 ± 0.23210.0500 ± 0.0840
Kirfi vein 10.5208 ± 0.37520.0175 ± 0.0199
Kirfi vein 20.3465 ± 0.11290.0065 ± 0.0053
Koma0.0558 ± 0.00350.0028 ± 0.0012
Table 6. US Geological Survey (USGS) and American Society for Testing and Materials (ASTM) basic specification standards for various industrial applications using zircon sand.
IndustryApplicationsZrO2 Std Minimum Content in ZrSiO4 (wt.%)Major ConstituentsParameterResearch Samples Suitable for the Application after Mineral Separation
Aerospace Zircon-reinforced composites for rocket nozzle inserts, nose caps, leading edges, propulsion systems components, and zircon-based ceramic coatings≥65Cf, SiC, TaC, Si3N4, B4C, Al2O3ZrO2 content; specific gravity: 4.2–4.86 g/cm3Kuru, Arikya, Gumau, Koma
RefractoryFired zircon and alumina–zirconia–silica (AZS), firebricks, crucibles, hearths and nozzles (in the handling of molten metals and extrusion dies), refractory mortar≥60Al2O3, SiO2, Fe2O3, FeCr2O4, MgO, CaOZrO2 content; specific gravity: ≥3.84 g/cm3Kuru, Arikya, Gumau, Koma
CeramicIndustrial tiles, glazes, sanitary wares, porcelain tiles, wall tiles, glazed bricks, artworks, and dinner wares≥65SiO2, Na2O, K2O, B2O3, Al2O3, CaO, Fe2O3, MgORefractive index: 1.92–1.96; ZrO2 contentKuru, Arikya, Gumau, Koma
FoundrySand molds and cores, metal chills≥64SiO2, Al2O3, CaO, Fe2O3pH value: 6.8–7.0; ZrO2 contentKuru, Arikya, Gumau, Koma
Building and constructionZircon-reinforced cement≥67Al2O3, CaO, Fe2O3, SiO2, TiO3, MgO, SO3ZrO2 contentKuru, Arikya, Gumau, Koma
GlassCathode ray tubes of televisions and computer monitors≥63SiO2, CaCO3, Na2CO3Refractive index: 1.92–1.96Kuru, Arikya, Gumau, Koma
Precision investment castingBack-up slurry, shell molds, prime coat slurry≥64Al2O3, SiO2Specific gravity: 4.2–4.86 g/cm3Kuru, Arikya, Gumau, Koma
Advanced ceramicAbrasives, grinding wheels, sharpening stones, abrasive papers≥65Al2O3, Fe2O3, SiO2ZrO2 content; hardness: 7–7.5Kuru, Arikya, Gumau, Koma
Disclaimer/Publisher’s Note: The statements, opinions and data contained in all publications are solely those of the individual author(s) and contributor(s) and not of MDPI and/or the editor(s). MDPI and/or the editor(s) disclaim responsibility for any injury to people or property resulting from any ideas, methods, instructions or products referred to in the content.

