Article

In Situ High-Pressure Raman Spectroscopic, Single-Crystal X-ray Diffraction, and FTIR Investigations of Rutile and TiO2II

1
School of Earth Sciences and Resources, China University of Geosciences, Beijing 100083, China
2
Center for High Pressure Science and Technology Advanced Research, Beijing 100193, China
3
State Key Laboratory of Lithospheric Evolution, Institute of Geology and Geophysics, Chinese Academy of Sciences, Beijing 100029, China
4
Institute of Geology, Chinese Academy of Geological Sciences, Beijing 100037, China
*
Author to whom correspondence should be addressed.
Minerals 2023, 13(5), 703; https://doi.org/10.3390/min13050703
Submission received: 6 April 2023 / Revised: 14 May 2023 / Accepted: 19 May 2023 / Published: 21 May 2023

Abstract

:
In ultrahigh-pressure (UHP) metamorphic rocks, rutile is an important accessory mineral. Its high-pressure polymorph TiO2II can be a significant indicator of pressure in the diamond stability field. In the present study, in situ high-pressure Raman spectroscopic measurements of natural rutile in UHP eclogite from the main hole of the Chinese Continental Scientific Drilling Project (CCSD) have been conducted up to ~16 GPa. Rutile and recovered TiO2II have also been analyzed via single-crystal X-ray diffraction and FTIR spectroscopy. The results indicate that (1) the phase transition from rutile to baddeleyite-type TiO2 terminates at about 16 GPa under compression at ambient temperature; (2) the metastable TiO2II in the exhumated UHP rocks formed during deep continental subduction can be characterized by a highly distorted octahedral site in the crystal structure. X-ray powder diffraction analyses (with Cu Kα radiation) at ambient conditions are sufficient for identifying the lamellae of TiO2II within natural rutile based on the angles (2θ) of two strong peaks at 25.5° and 31.5°; (3) rutile and recovered TiO2II in the continental slabs can contain certain amounts of water during deep subduction and exhumation. The estimated water contents of rutile in the present study range from 1590 to 1780 ppm of H2O by weight. In the crystal structure of TiO2II, hydrogen can be incorporated close to the long O-O edges (>2.5143 Å) of the TiO6 octahedra. Further studies on the pressure–temperature stability of hydroxyls in rutile and TiO2II may help to understand the transportation and release of water in subducted continental slabs.

1. Introduction

Rutile (ideal formula: TiO2) is an important accessory mineral in ultrahigh-pressure metamorphic rocks formed during deep continental subduction [1,2]. According to previous investigations of water in nominally anhydrous minerals (NAMs), rutile can hold up to 0.28 wt% of H2O in the form of structural OH [3,4]. Therefore, it is also expected to be a potential host phase of water in subducting continental slabs.
Rutile has a tetragonal structure with space group of P42/mnm. It is made up of only one octahedral site that is commonly occupied by Ti4+ (Figure 1). Previous in situ X-ray diffraction experiments at ambient temperature at a pressure of up to 60 GPa [5,6] showed that rutile begins to transform to its high-pressure polymorph with the monoclinic baddeleyite (ZrO2) structure (space group P21/c) at about 12 GPa under compression. Upon the release of pressure, baddeleyite-type TiO2 converts at 7 GPa into TiO2II (space group Pbcn), which is another high-pressure polymorph of rutile with the orthorhombic α-PbO2 structure (Figure 1) and is metastable at a normal pressure. The baddeleyite-type TiO2 is 11.3(9)% denser than rutile and TiO2II is 2.1(3)% denser than rutile. The estimated zero-pressure bulk moduli are 230(20), 260(30), and 290(20) for rutile, TiO2II and baddeleyite-type TiO2, respectively [6].
In situ high-pressure spectroscopic studies [7,8,9] indicated that the phase transition from rutile to baddeleyite-type TiO2 begins at 13 GPa and terminates at 21 to 23 GPa at room temperature. Upon decompression, the baddeleyite-type TiO2 to TiO2II transition occurs around 7 GPa and terminates at about 5 GPa. In addition, previous investigations of high-pressure and high-temperature phase equilibria of TiO2 showed that the phase boundary between rutile and TiO2II changes from having a negative slope to having a positive slope with increasing temperature at about 6 GPa and 850 °C [10]. Therefore, in natural ultrahigh-pressure (UHP) metamorphic rocks, widely observed nano-crystal lamellae of TiO2II within (or coexisting with) rutile can be a significant indicator of pressure in the diamond stability field [11,12,13].
To better understand the high-pressure behavior and crystal structure of rutile and its high-pressure polymorphs in continental slabs during ultra-deep subduction and exhumation, in situ high-pressure Raman spectroscopic measurements of rutile in UHP eclogite collected from continental subduction environment have been conducted up to ~16 GPa in the present work. Natural rutile and recovered TiO2II have also been analyzed via single-crystal X-ray diffraction and FTIR spectroscopy.

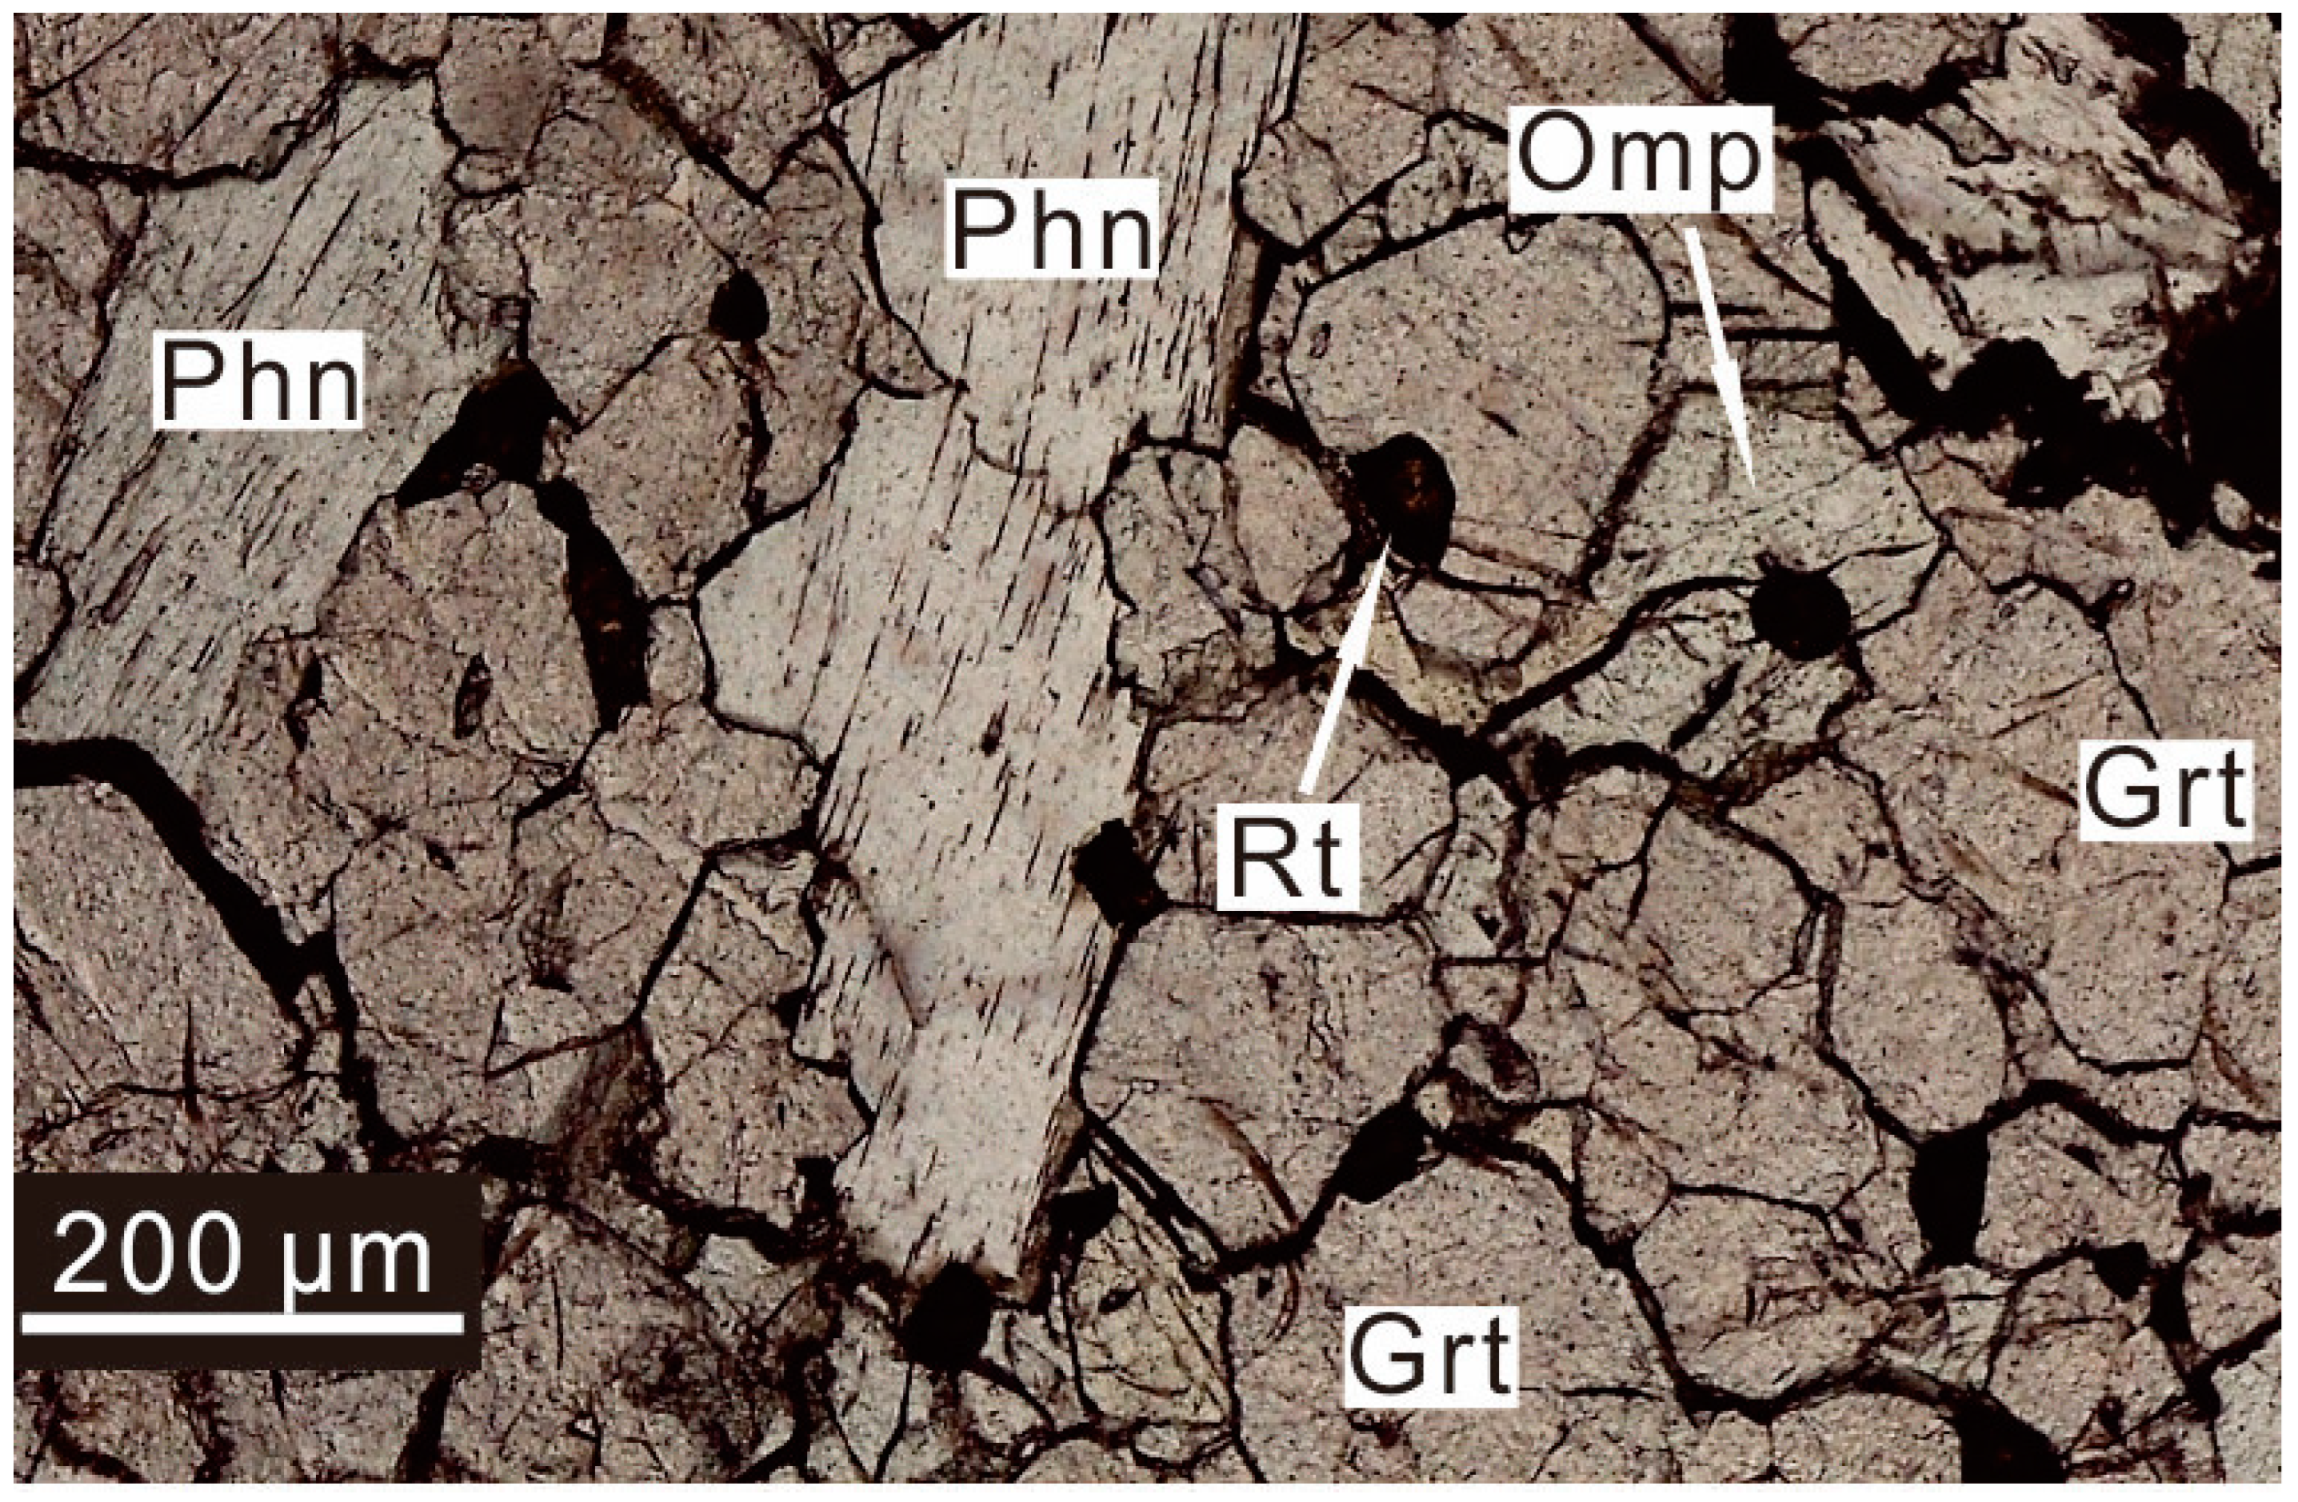
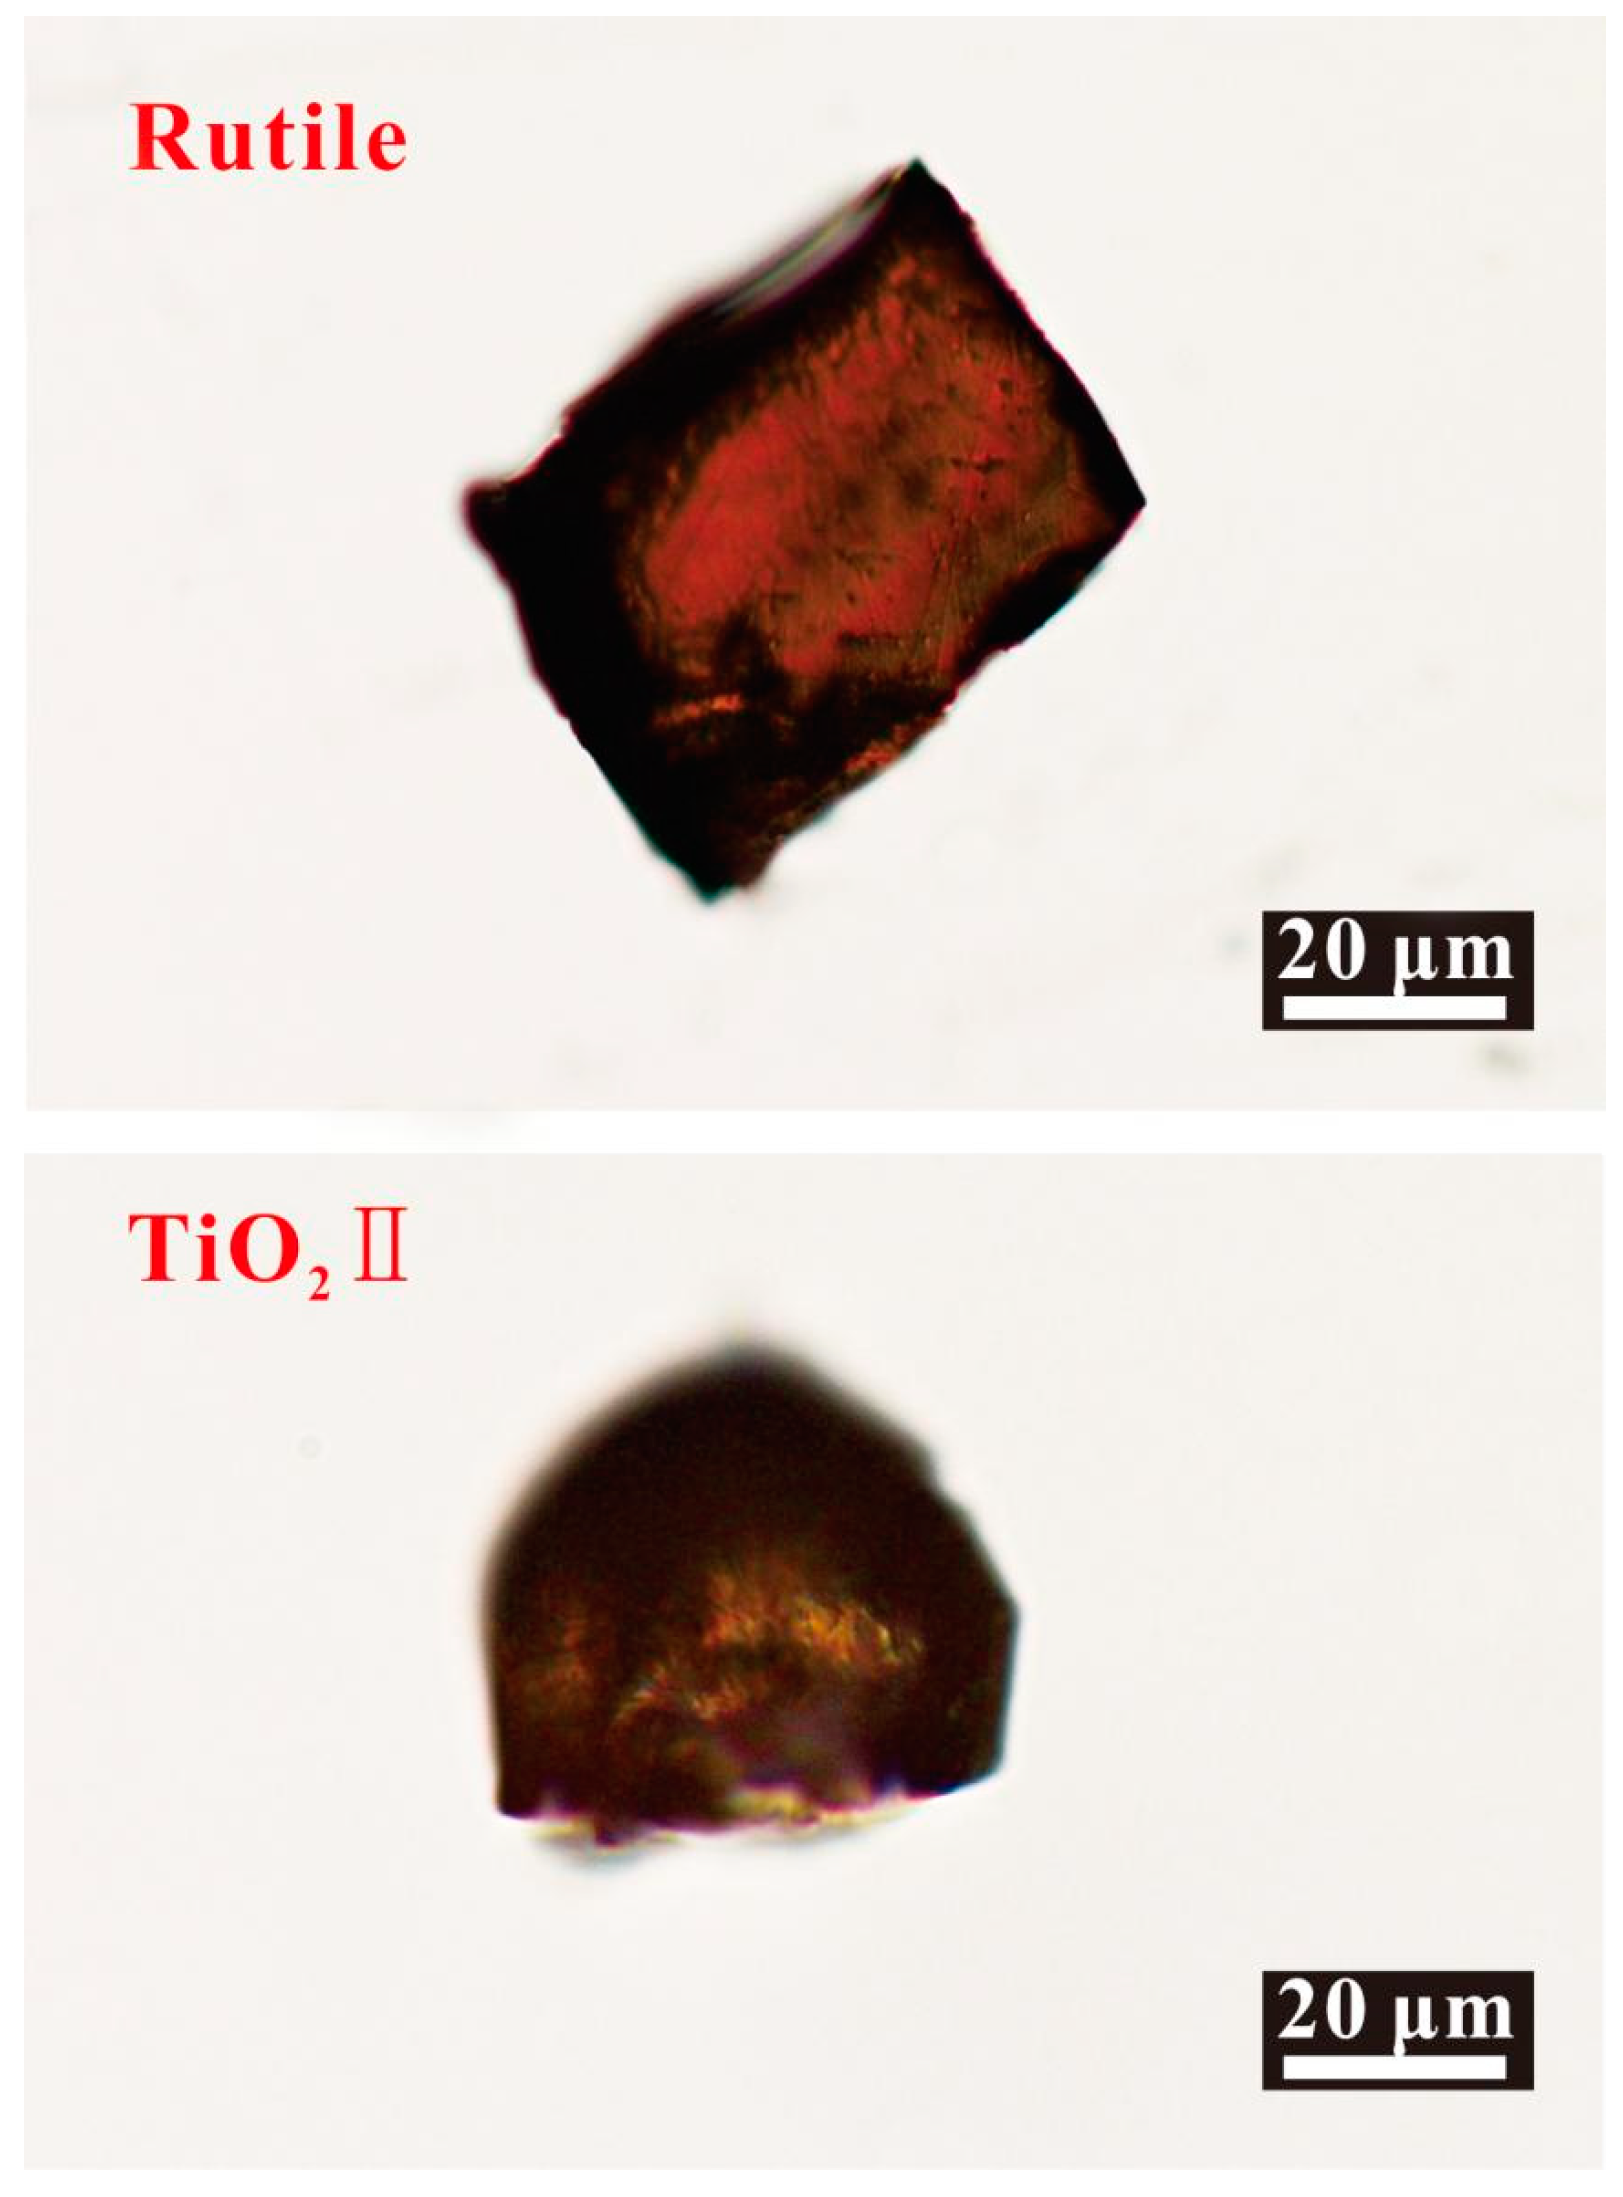
2. Sample Description and Experimental Methods

Natural rutile (Ti0.988Fe0.011O2) was collected from an UHP eclogite (no. B132R114P1a) in the main hole of the Chinese Continental Scientific Drilling Project (CCSD) in a supracrustal rock slab, which was subducted to a depth of over 100 km and then exhumed to the surface during continental collisional orogeny [14,15]. The eclogite is composed of fresh medium-grained garnet, omphacite, phengite, and minor rutile (Figure 2) and has experienced peak metamorphic P-T conditions greater than 3 GPa and 700 °C [15].
In situ high-pressure Raman spectroscopic measurements were conducted using a symmetric-type diamond anvil cell (DAC) with a pair of type IIa diamond anvils (culet of ~0.3 mm in diameter). A rhenium gasket was pre-indented to have a thickness of ~60 μm, and a hole of a diameter of ~0.15 mm was drilled as the sample chamber. A rutile sample with the size of 40 × 40 × 30 μm was selected and loaded into the sample chamber together with two ruby spheres. Argon (Ar) was loaded as a pressure-transmitting medium. The potential pressure gradients are estimated to be lower than 0.2 GPa at pressures up to 20 GPa [16]. Raman spectra were collected with a HORIBA LabRAM HR Evolution laser Raman spectrometer at Institute of Geology, Chinese Academy of Geological Sciences, in the wavenumber range of 100 to 1200 cm−1 (spectral resolution of 1 cm−1), using 10 accumulations and a 5 s exposure time with a 20× microscope objective. All spectra were excited by a 532 nm solid-state laser at a power of 100 mW. Pressure was calculated from the shift of the ruby R1 luminescent line [17]. The frequencies (cm−1) of the bands in the spectra from in situ high-pressure Raman spectroscopic measurements are listed in Table 1.
Single crystals of natural rutile (about 60 × 40 × 30 μm in size) and recovered TiO2II (about 40 × 40 × 30 μm in size) (Figure 3) were mounted on glass fibers for single-crystal X-ray diffraction measurements, respectively. Intensity data were collected with a Bruker D8 Venture diffractometer at Center for High Pressure Science and Technology Advanced Research, Beijing, using APEX4 software. An X-ray (λ = 0.71073 Å) was conducted with a IµS 3.0 generator using a rotating Mo anode. Crystal structures were refined from the intensity data via SHELXL-2018 [18] in the package WINGX [19]. The refinements were based on the scattering factors and absorption coefficients for Ti4+ and O2− from the International Tables for Crystallography, Volume C [20]. The refined unit cell parameters and atom positions of rutile and TiO2II are given in Table S1. We calculated X-ray powder diffraction patterns for the Cu Kα radiation (λ = 1.5405 Å) of rutile and TiO2II from the crystal structure data collected via single-crystal X-ray diffraction, using the program CrystalDiffract. These are compared in Figure 4.
Unpolarized infrared spectra of three natural rutile samples and recovered TiO2II were collected at ambient conditions in the wavenumber range of 3000 to 3800 cm−1, using a Bruker INVENIO-R FTIR spectrometer with a 15× objective on the HYPERION 1000 microscope at Institute of Geology and Geophysics, Chinese Academy of Sciences. Each spectrum was accumulated over 128 scans with a 2 cm−1 resolution. The calculation of the water contents referred to [21], using Lambert–Beer’s Law in the form c = a/ε, wherein the absorption coefficient a = A/t, and where c is the water concentration (mol·L−1), ε is the integrated molar absorption coefficient (L·mol−1·cm−1), A is the measured absorbance, and t is the thickness (cm) of the measured crystal plate. The unpolarized absorbance of randomly oriented grains in this study is estimated to be one-third of the sum of the three principal absorbances [22].

3. Result and Discussion

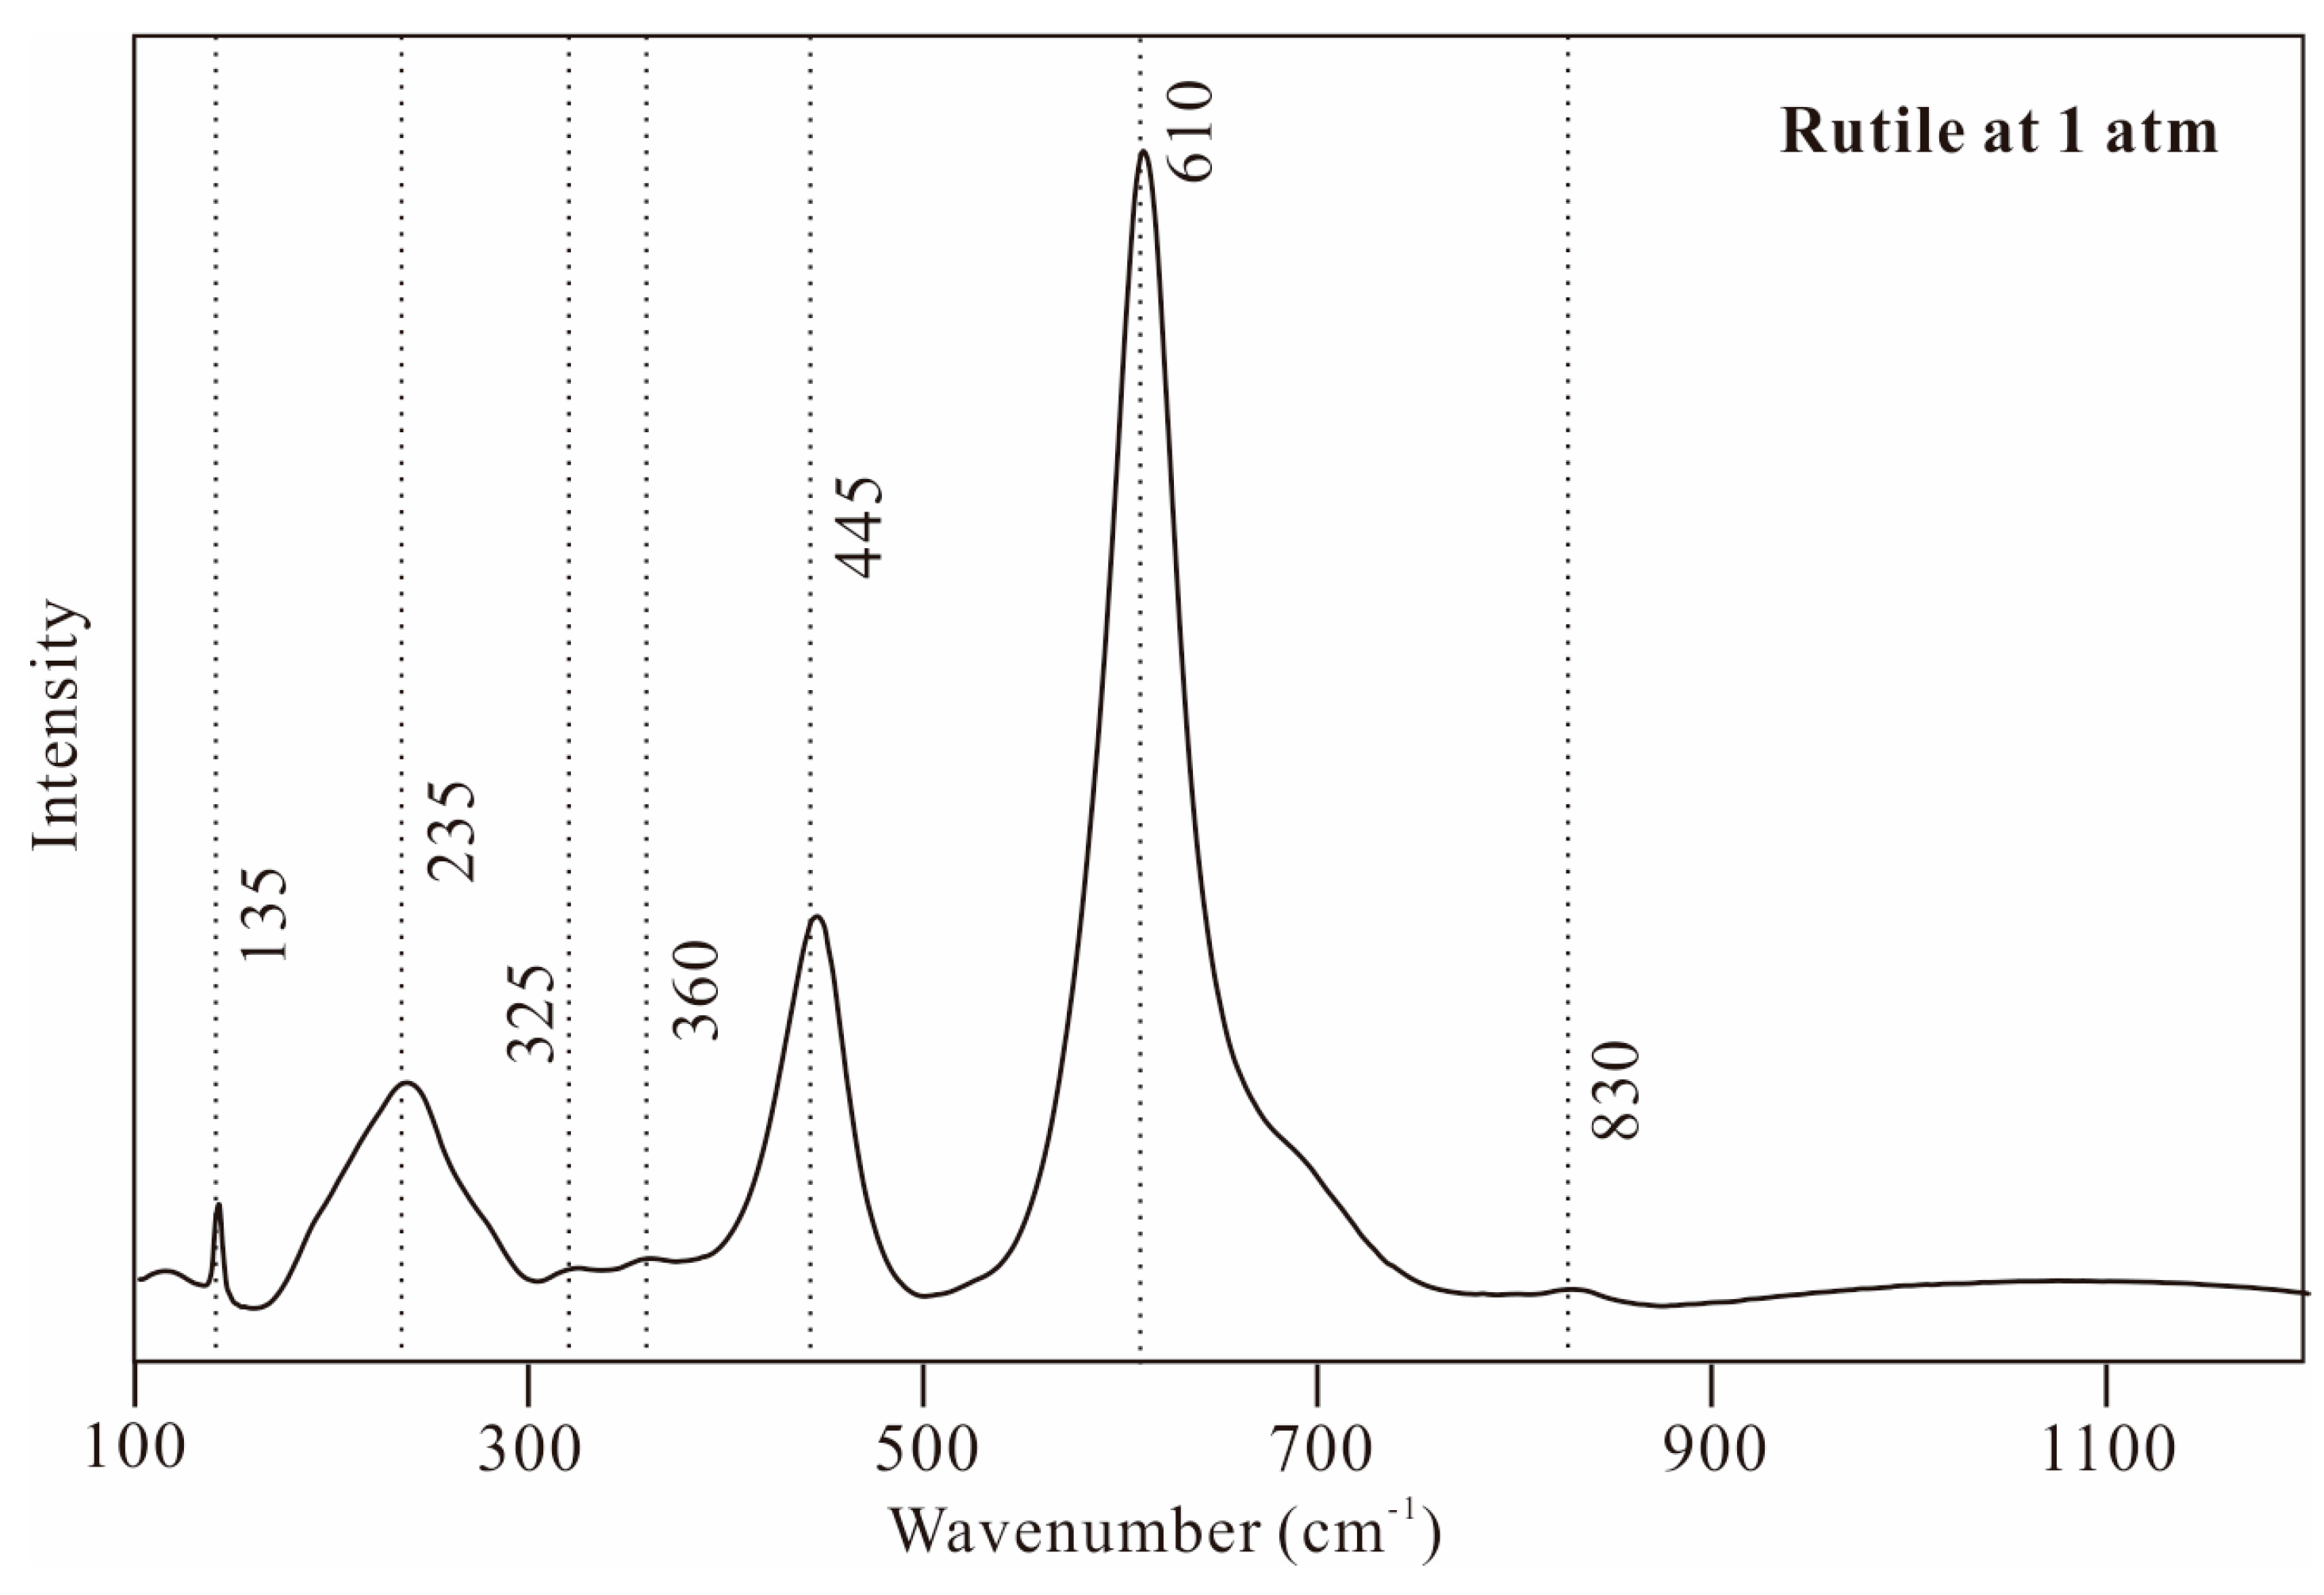
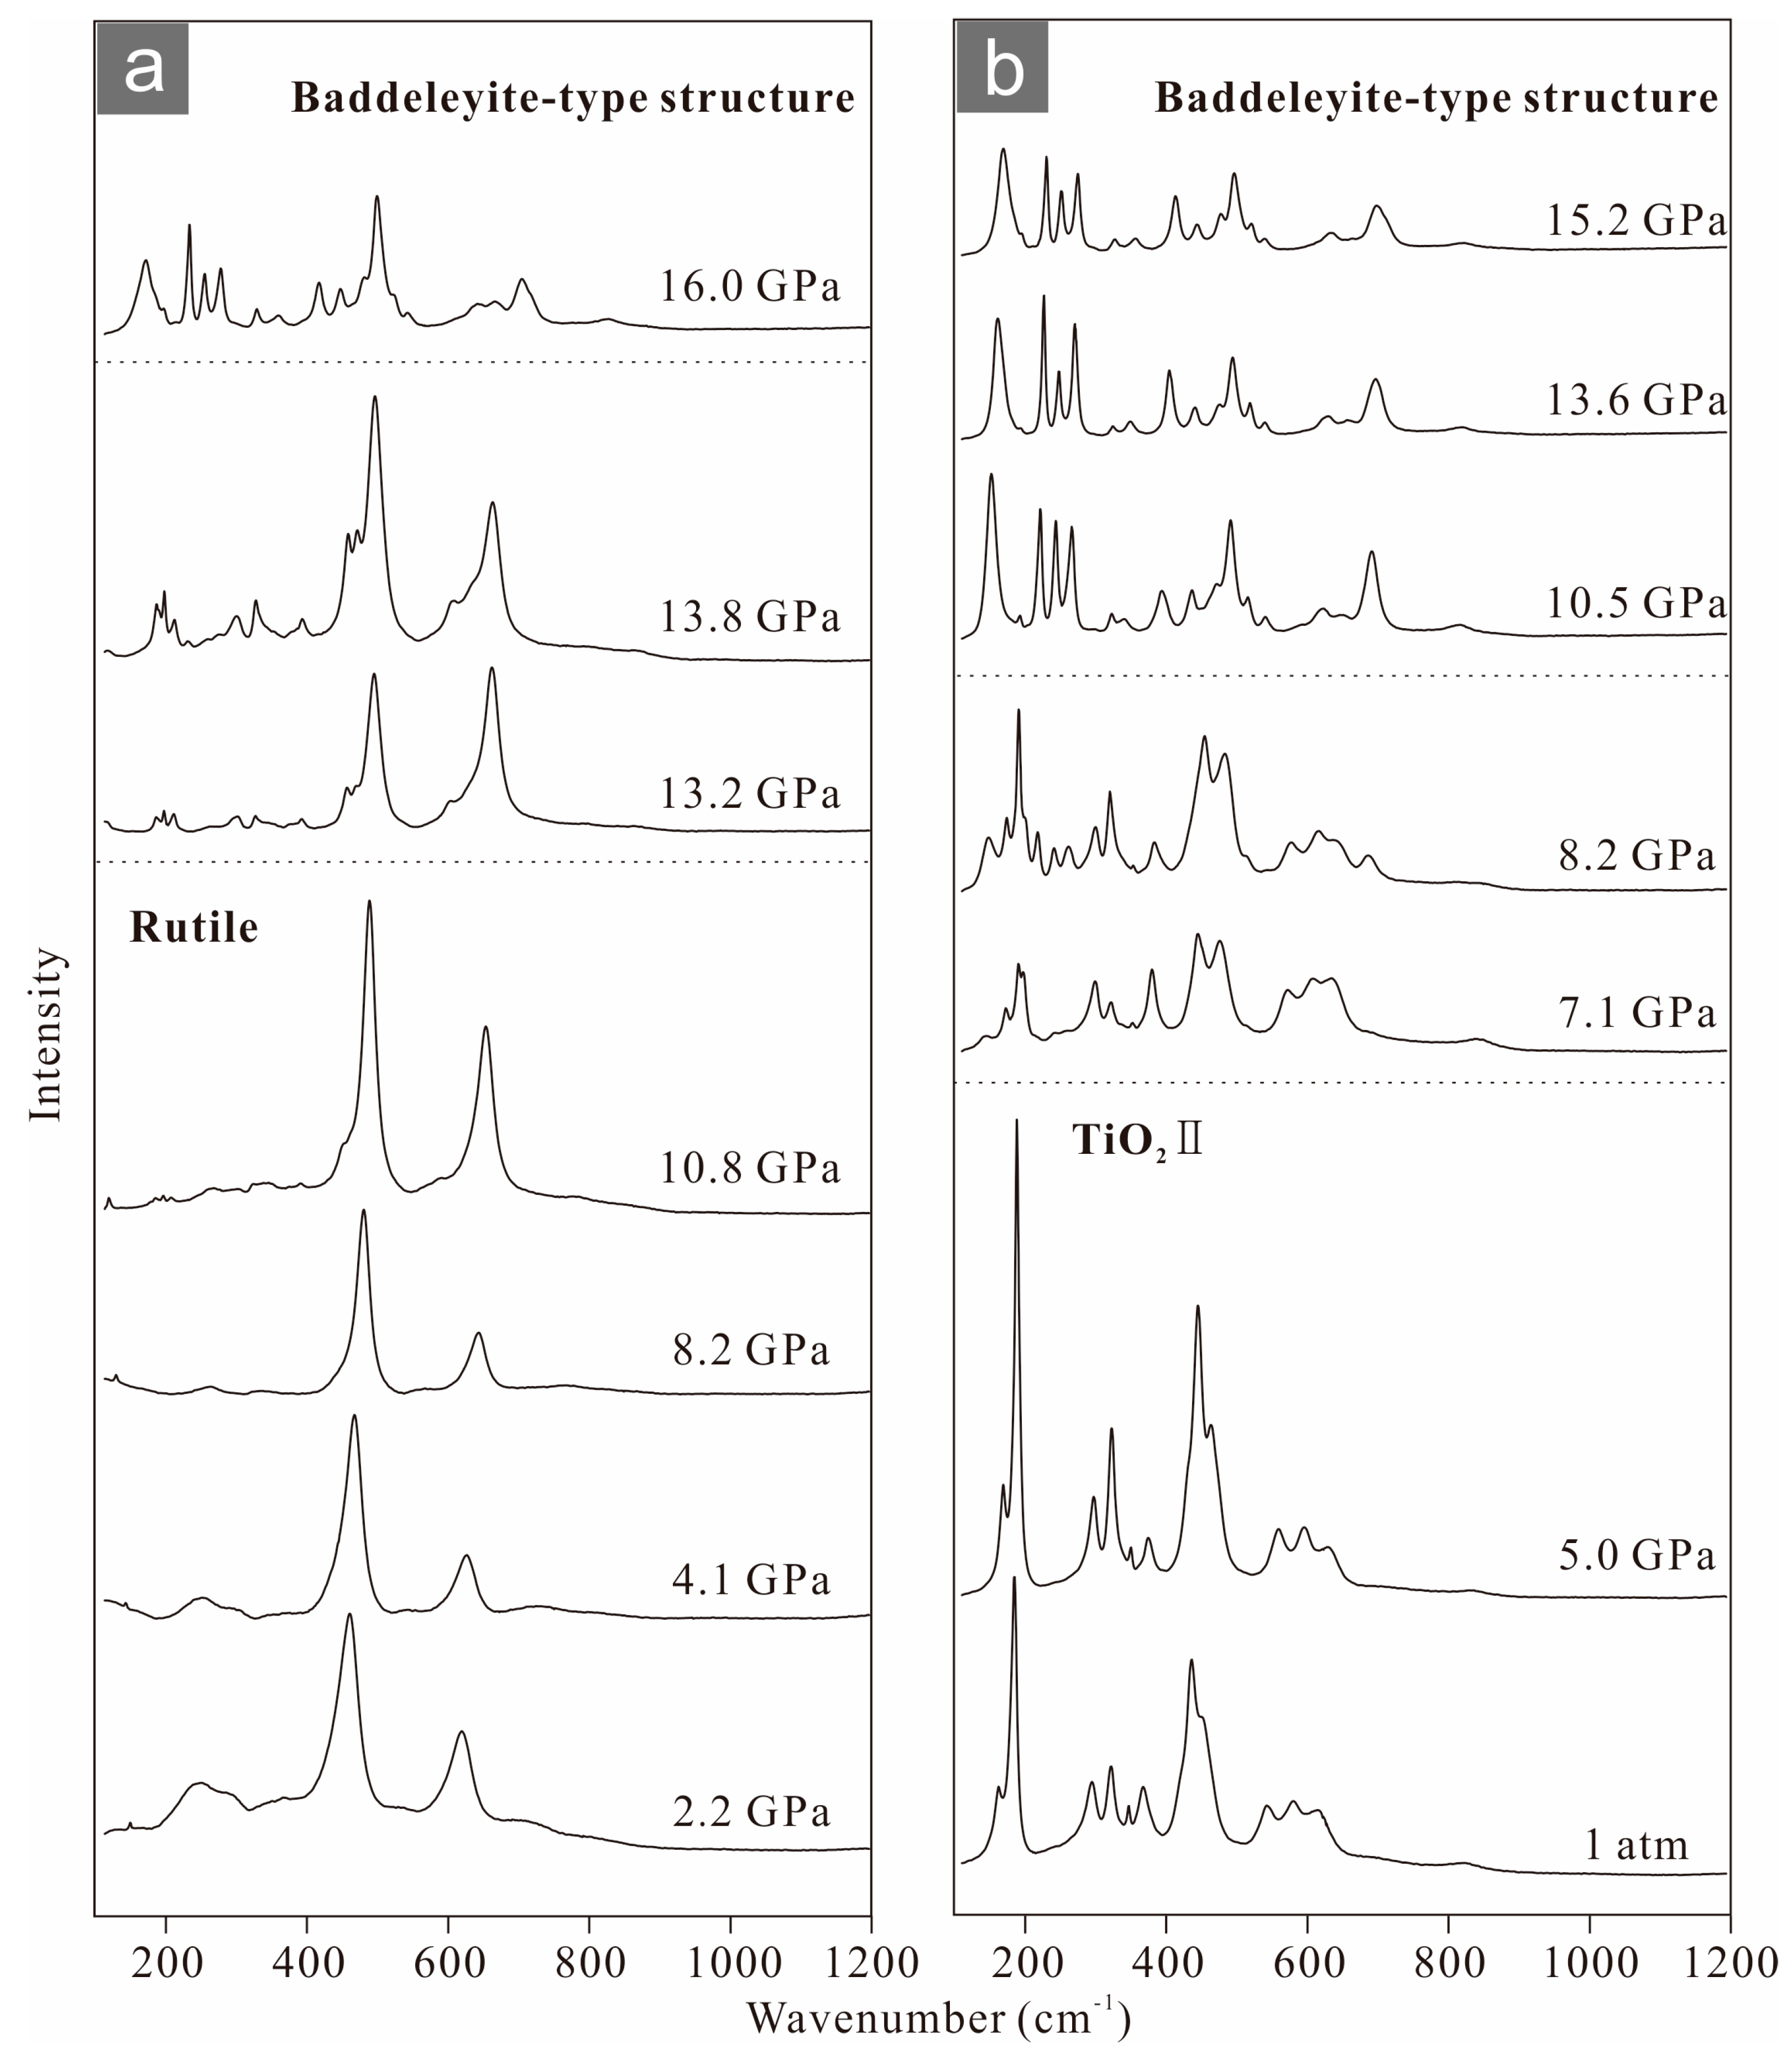
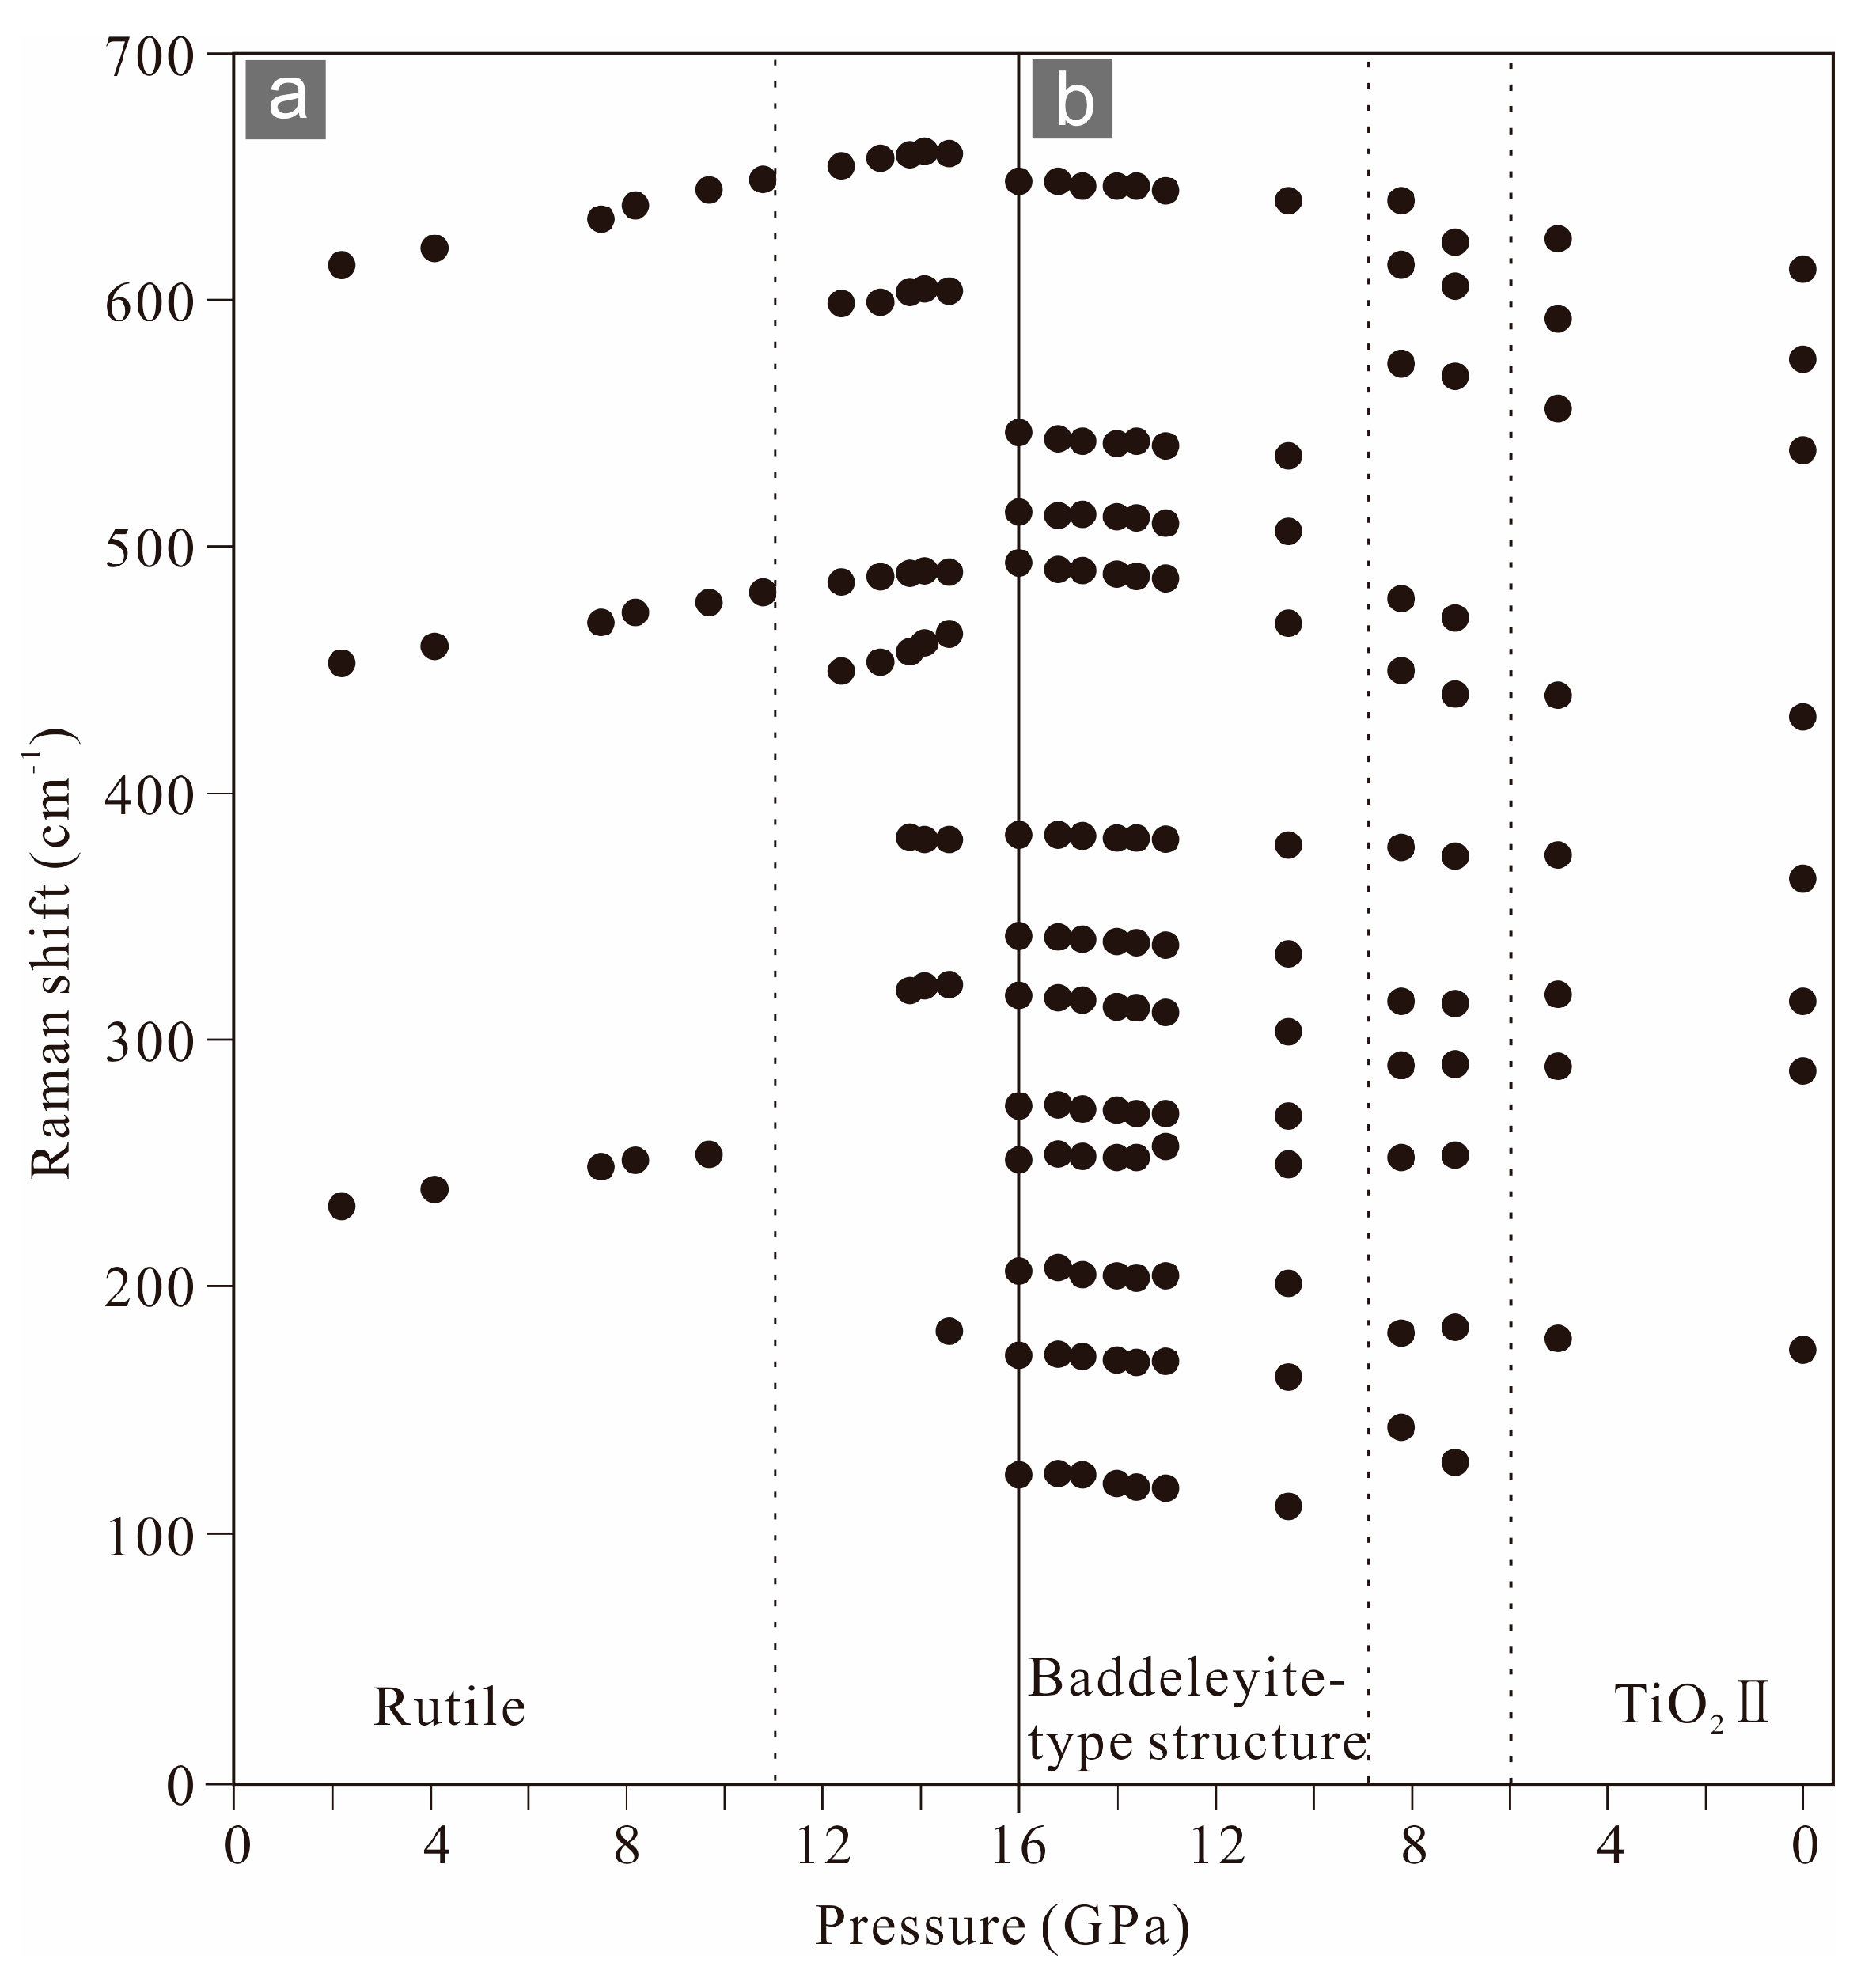
3.1. In Situ High-Pressure Raman Spectroscopy

Under ambient condition, as shown in Figure 5, the Raman spectrum of rutile in this study exhibits seven bands at 135, 235, 325, 360, 445, 610 and 830 cm−1. The broad band at 235 cm−1 is ascribed to multi-phonon scattering, which indicates the disordered crystal structure of rutile at 1 atm [1,8,23]. The two strong bands at 445 and 610 cm−1 are attributed to the O-Ti-O bending vibration and asymmetric Ti-O stretching vibration, respectively. The two weak bands at 135 and 830 cm−1 are due to the rotation of the TiO6 octahedra and symmetric Ti-O stretching vibration, respectively [1,7,9,24].
In the Raman spectra collected in the in situ high-pressure experiment (Figure 6 and Table 1), three strong bands at 235, 445, and 610 cm−1 can be observed, while the bands initially located at 135, 325, 360, and 830 cm−1 can hardly be detected due to their relatively low intensity. At elevated pressures up to 10.8 GPa, the bands at 445 and 610 cm−1 linearly shift to higher frequencies without discontinuity (Figure 7a), indicating the continuous and steady compression of the TiO6 octahedra. In accordance with previous observations [7,8], the intensity of the 235 cm−1 band decreases with increasing pressure (Figure 6a). This decrease can be explained by the increased ordering of the crystal structure under compression [8]. At pressures above 13.2 GPa, a number of new, sharp bands instantaneously appear in the spectrum (Figure 6a), implying the beginning of the rutile-to-baddeleyite-type TiO2 transition. At about 16 GPa, the Raman spectrum displays 12 bands at 159, 221, 264, 323, 350, 408, 440, 492, 634, 660, 702, and 833 cm−1 (Figure 6a and Table 1). These bands are consistent with the previously reported vibrational modes of baddeleyite-type TiO2 [7,9,25], indicating the termination of the transition.
As shown in Figure 6b and Figure 7b, Raman bands of baddeleyite-type TiO2 linearly shift to lower frequencies with decreasing pressure down to 10 GPa without notable discontinuity and band broadening, revealing that the crystal structure of baddeleyite-type TiO2 is still stable during decompression. In addition, there is no observable increase or decrease in the intensities of the bands upon the release of pressure. In the pressure range of about 9 to 6 GPa, the bands exhibit a highly non-linear shift with an abrupt change in frequency due to the phase transition from baddeleyite-type TiO2 to TiO2II. The intensities of the bands change anomalously with the appearance of a number of new bands (Figure 6 and Figure 7). In accordance with the reported vibrational modes of TiO2II [7,8,9], the Raman spectrum shows eight bands at 178, 288, 318, 374, 440, 555, 592, and 624 cm−1 at about 5 GPa (Figure 6b and Table 1), demonstrating the termination of the phase transformation. All these bands are still visible in the Raman spectrum of the recovered TiO2II at 1 atm. However, the two strong bands at about 178 and 440 cm−1 decrease in intensity after the pressure is released, implying that their intensities can be pressure-dependent (Figure 6b).
The present work shows that the pressure interval (13 to 16 GPa) of the rutile to baddeleyite-type TiO2 transition at ambient temperature is significantly narrower than that (12 to 21 GPa) reported in previous studies [7,9]. In addition, a transition in rutile can also be observed to begin at about 7 GPa [8], implying a wider pressure interval. Therefore, more work is needed to determine the potential influence of kinetic factors (such as minor impurities, grain size, pressure medium and length of time under pressure) on this phase transition. In addition, at room temperature, the transformation may reflect a slow rate of abrupt transition [8]. Further high-pressure and high-temperature experiments are expected to reveal the equilibrium phase boundary among these rutile polymorphs.

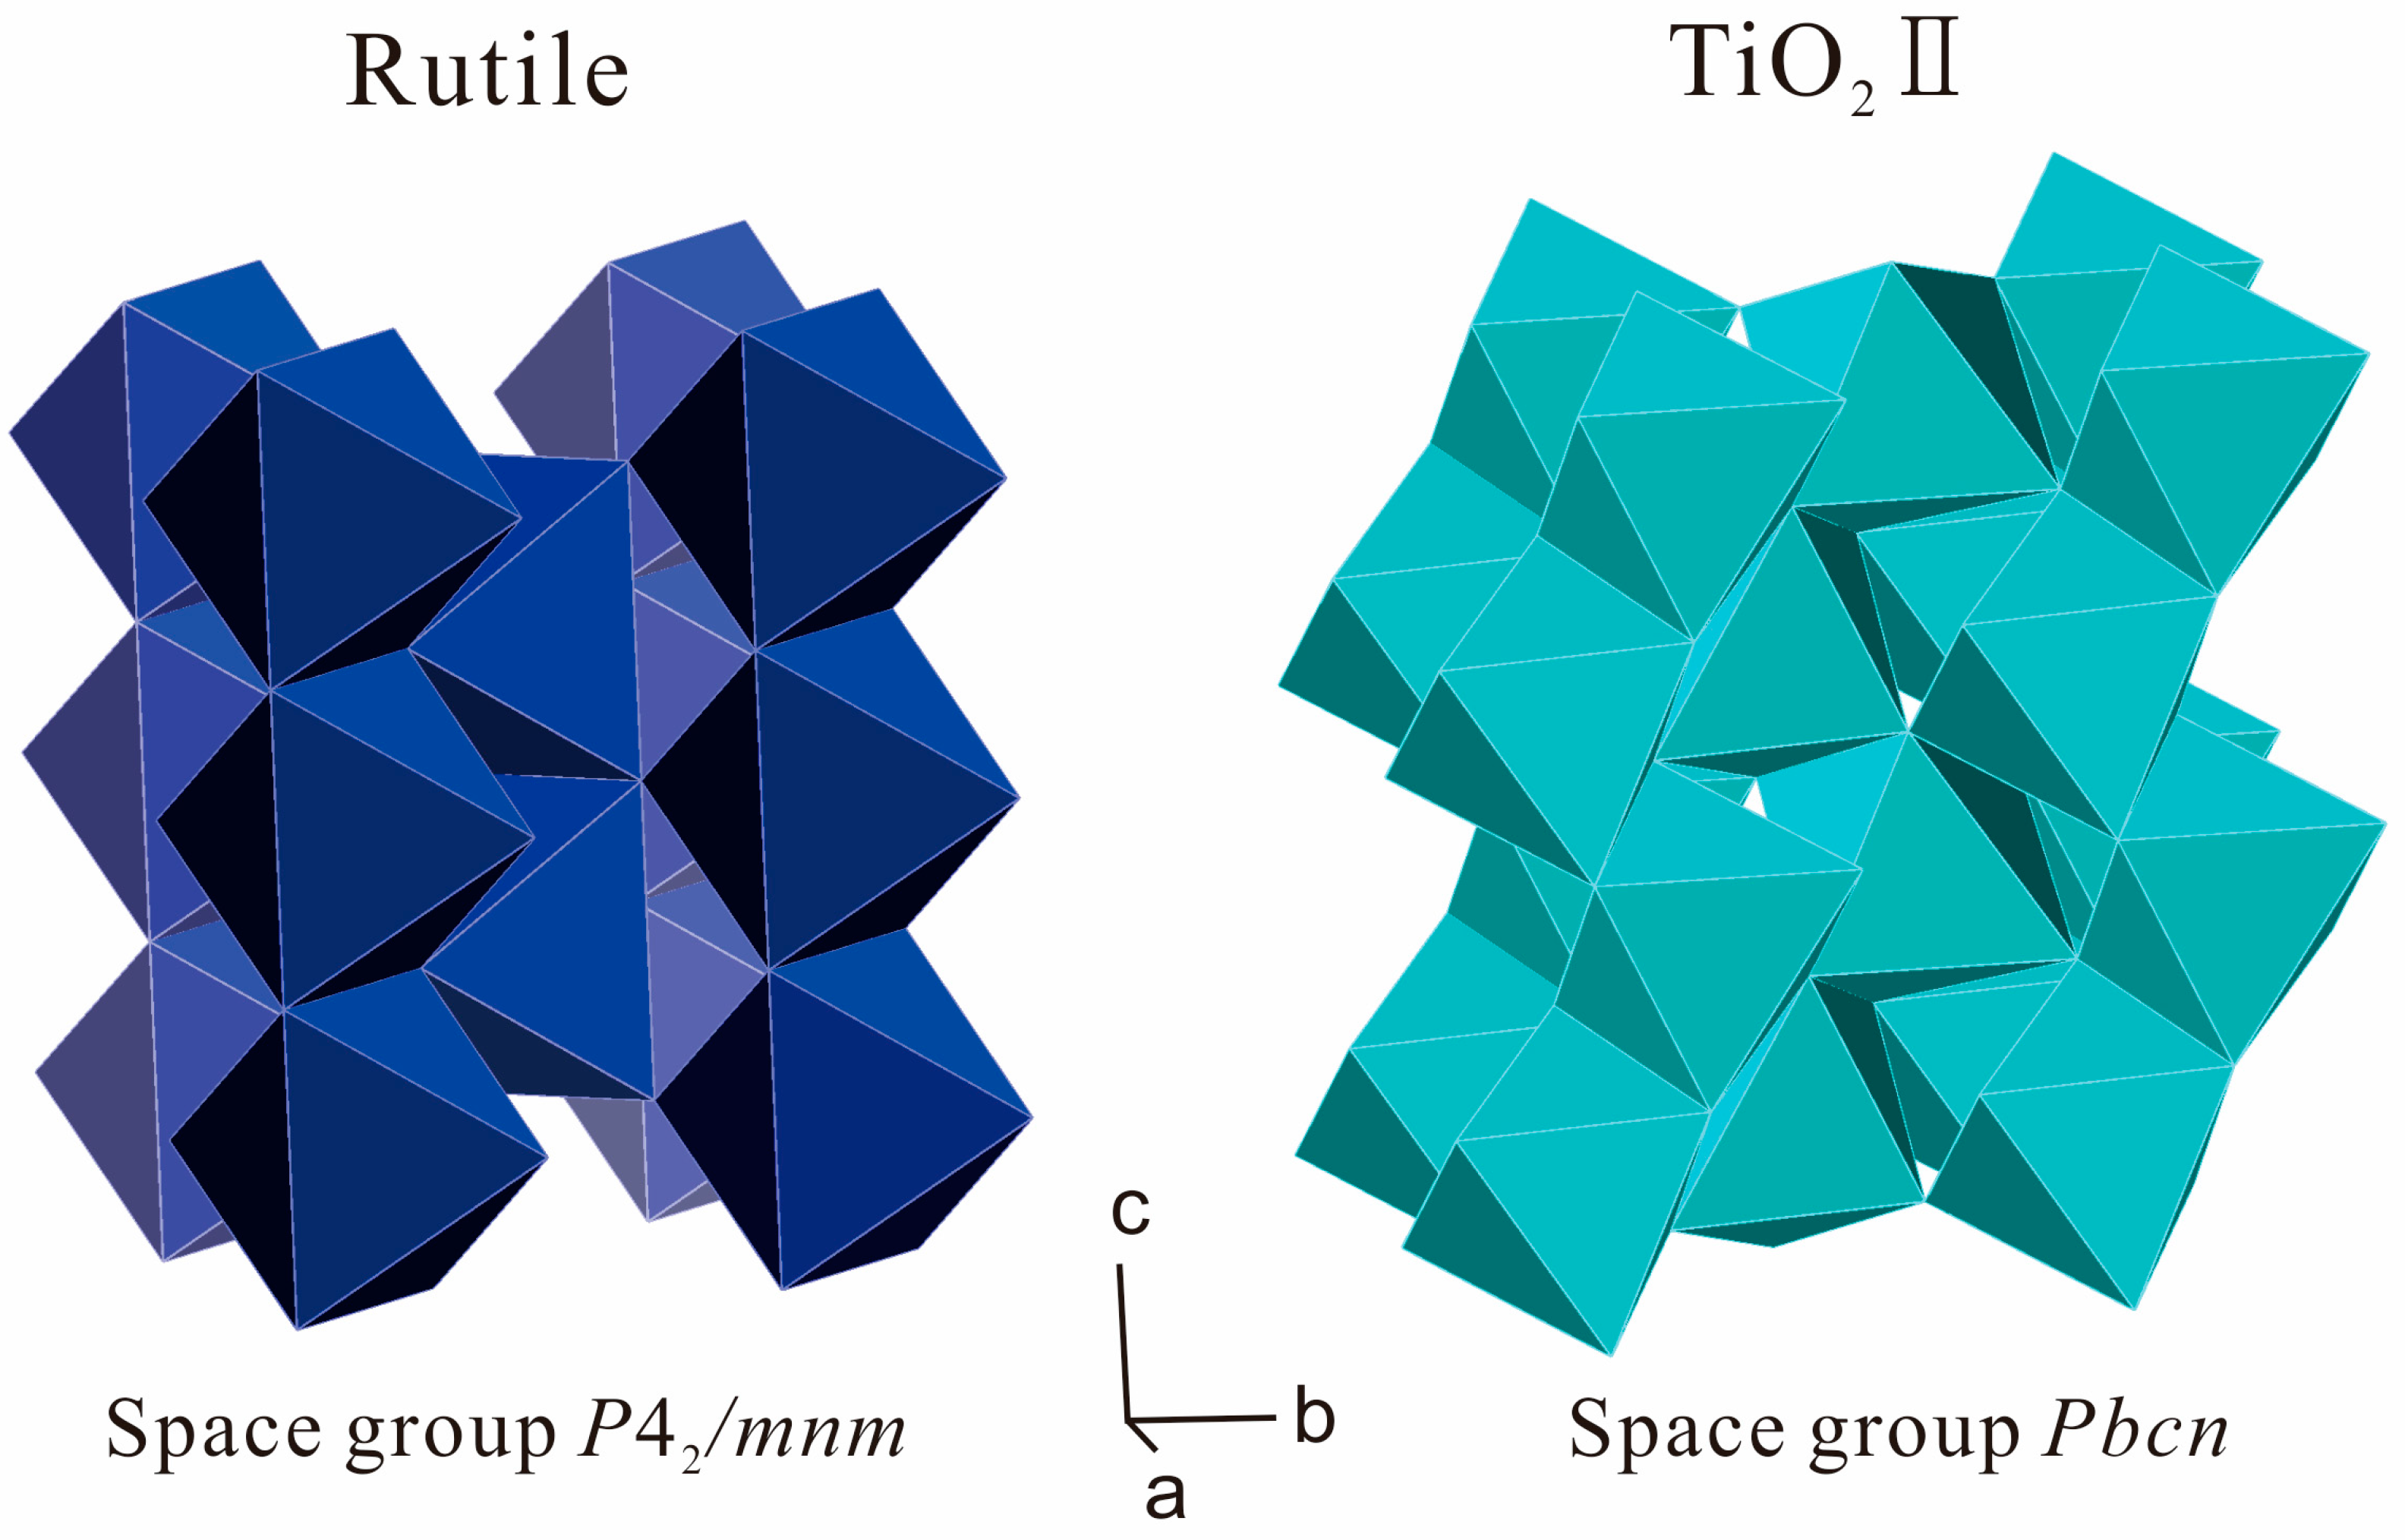
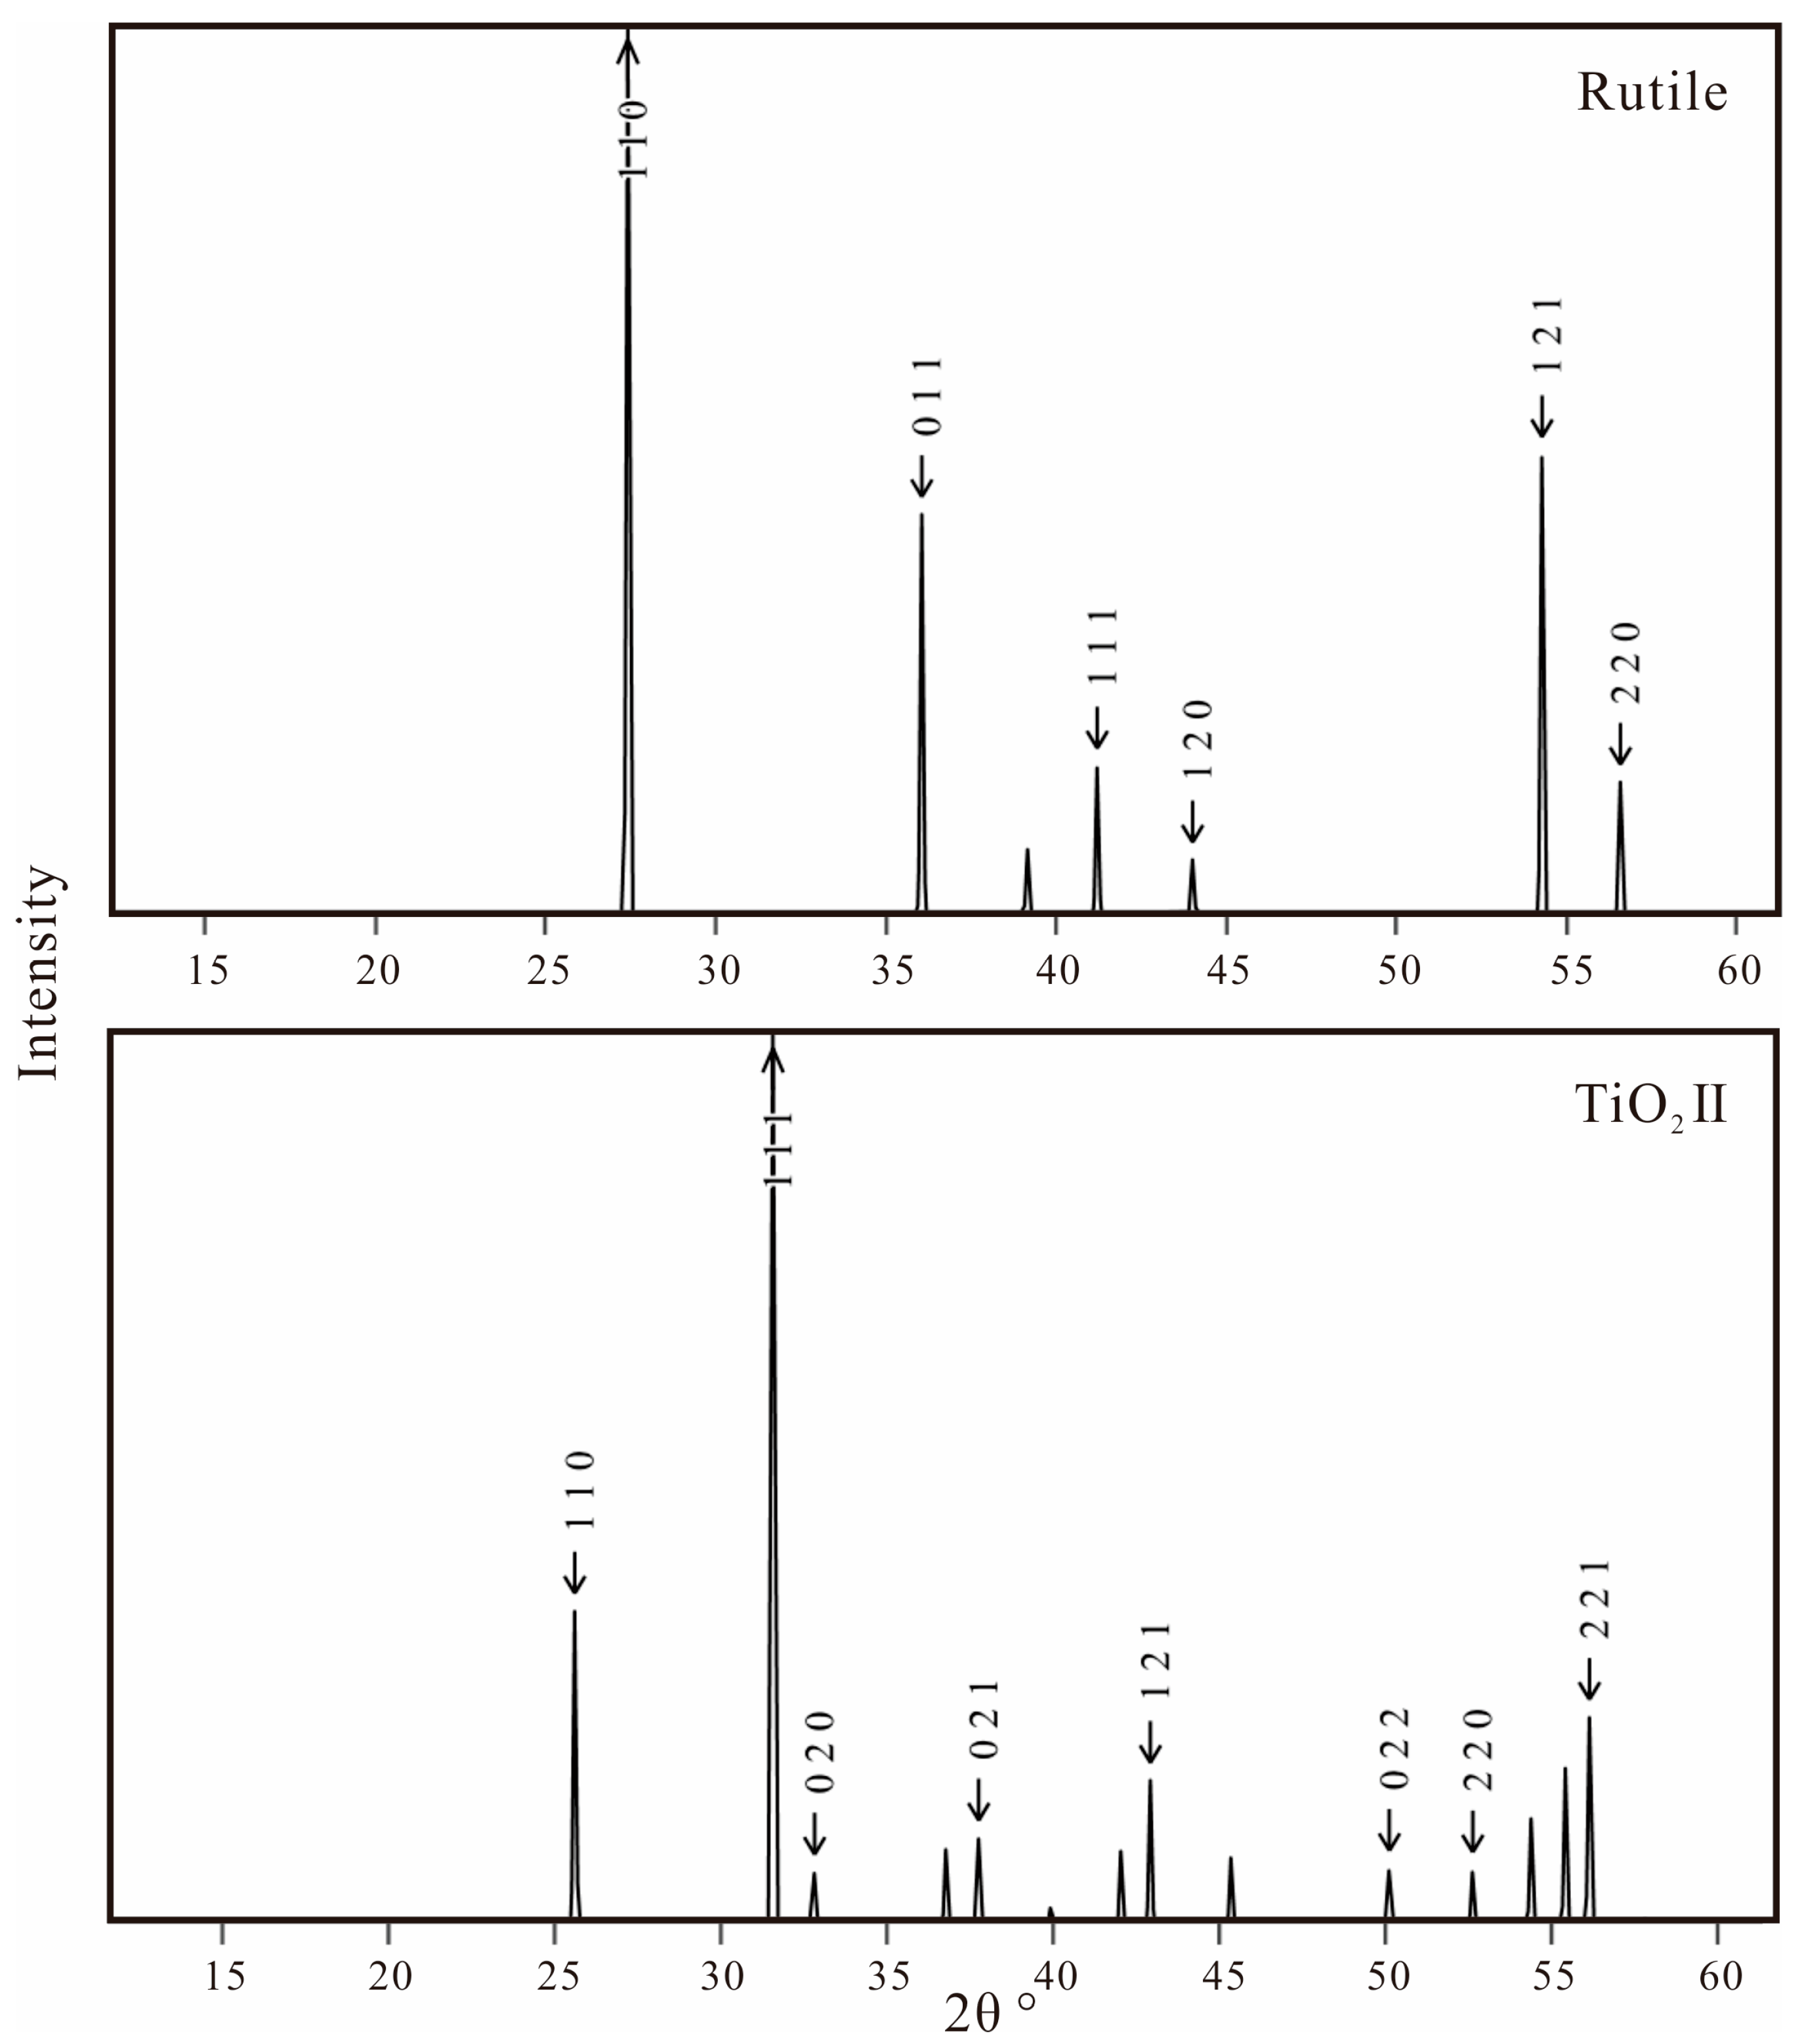
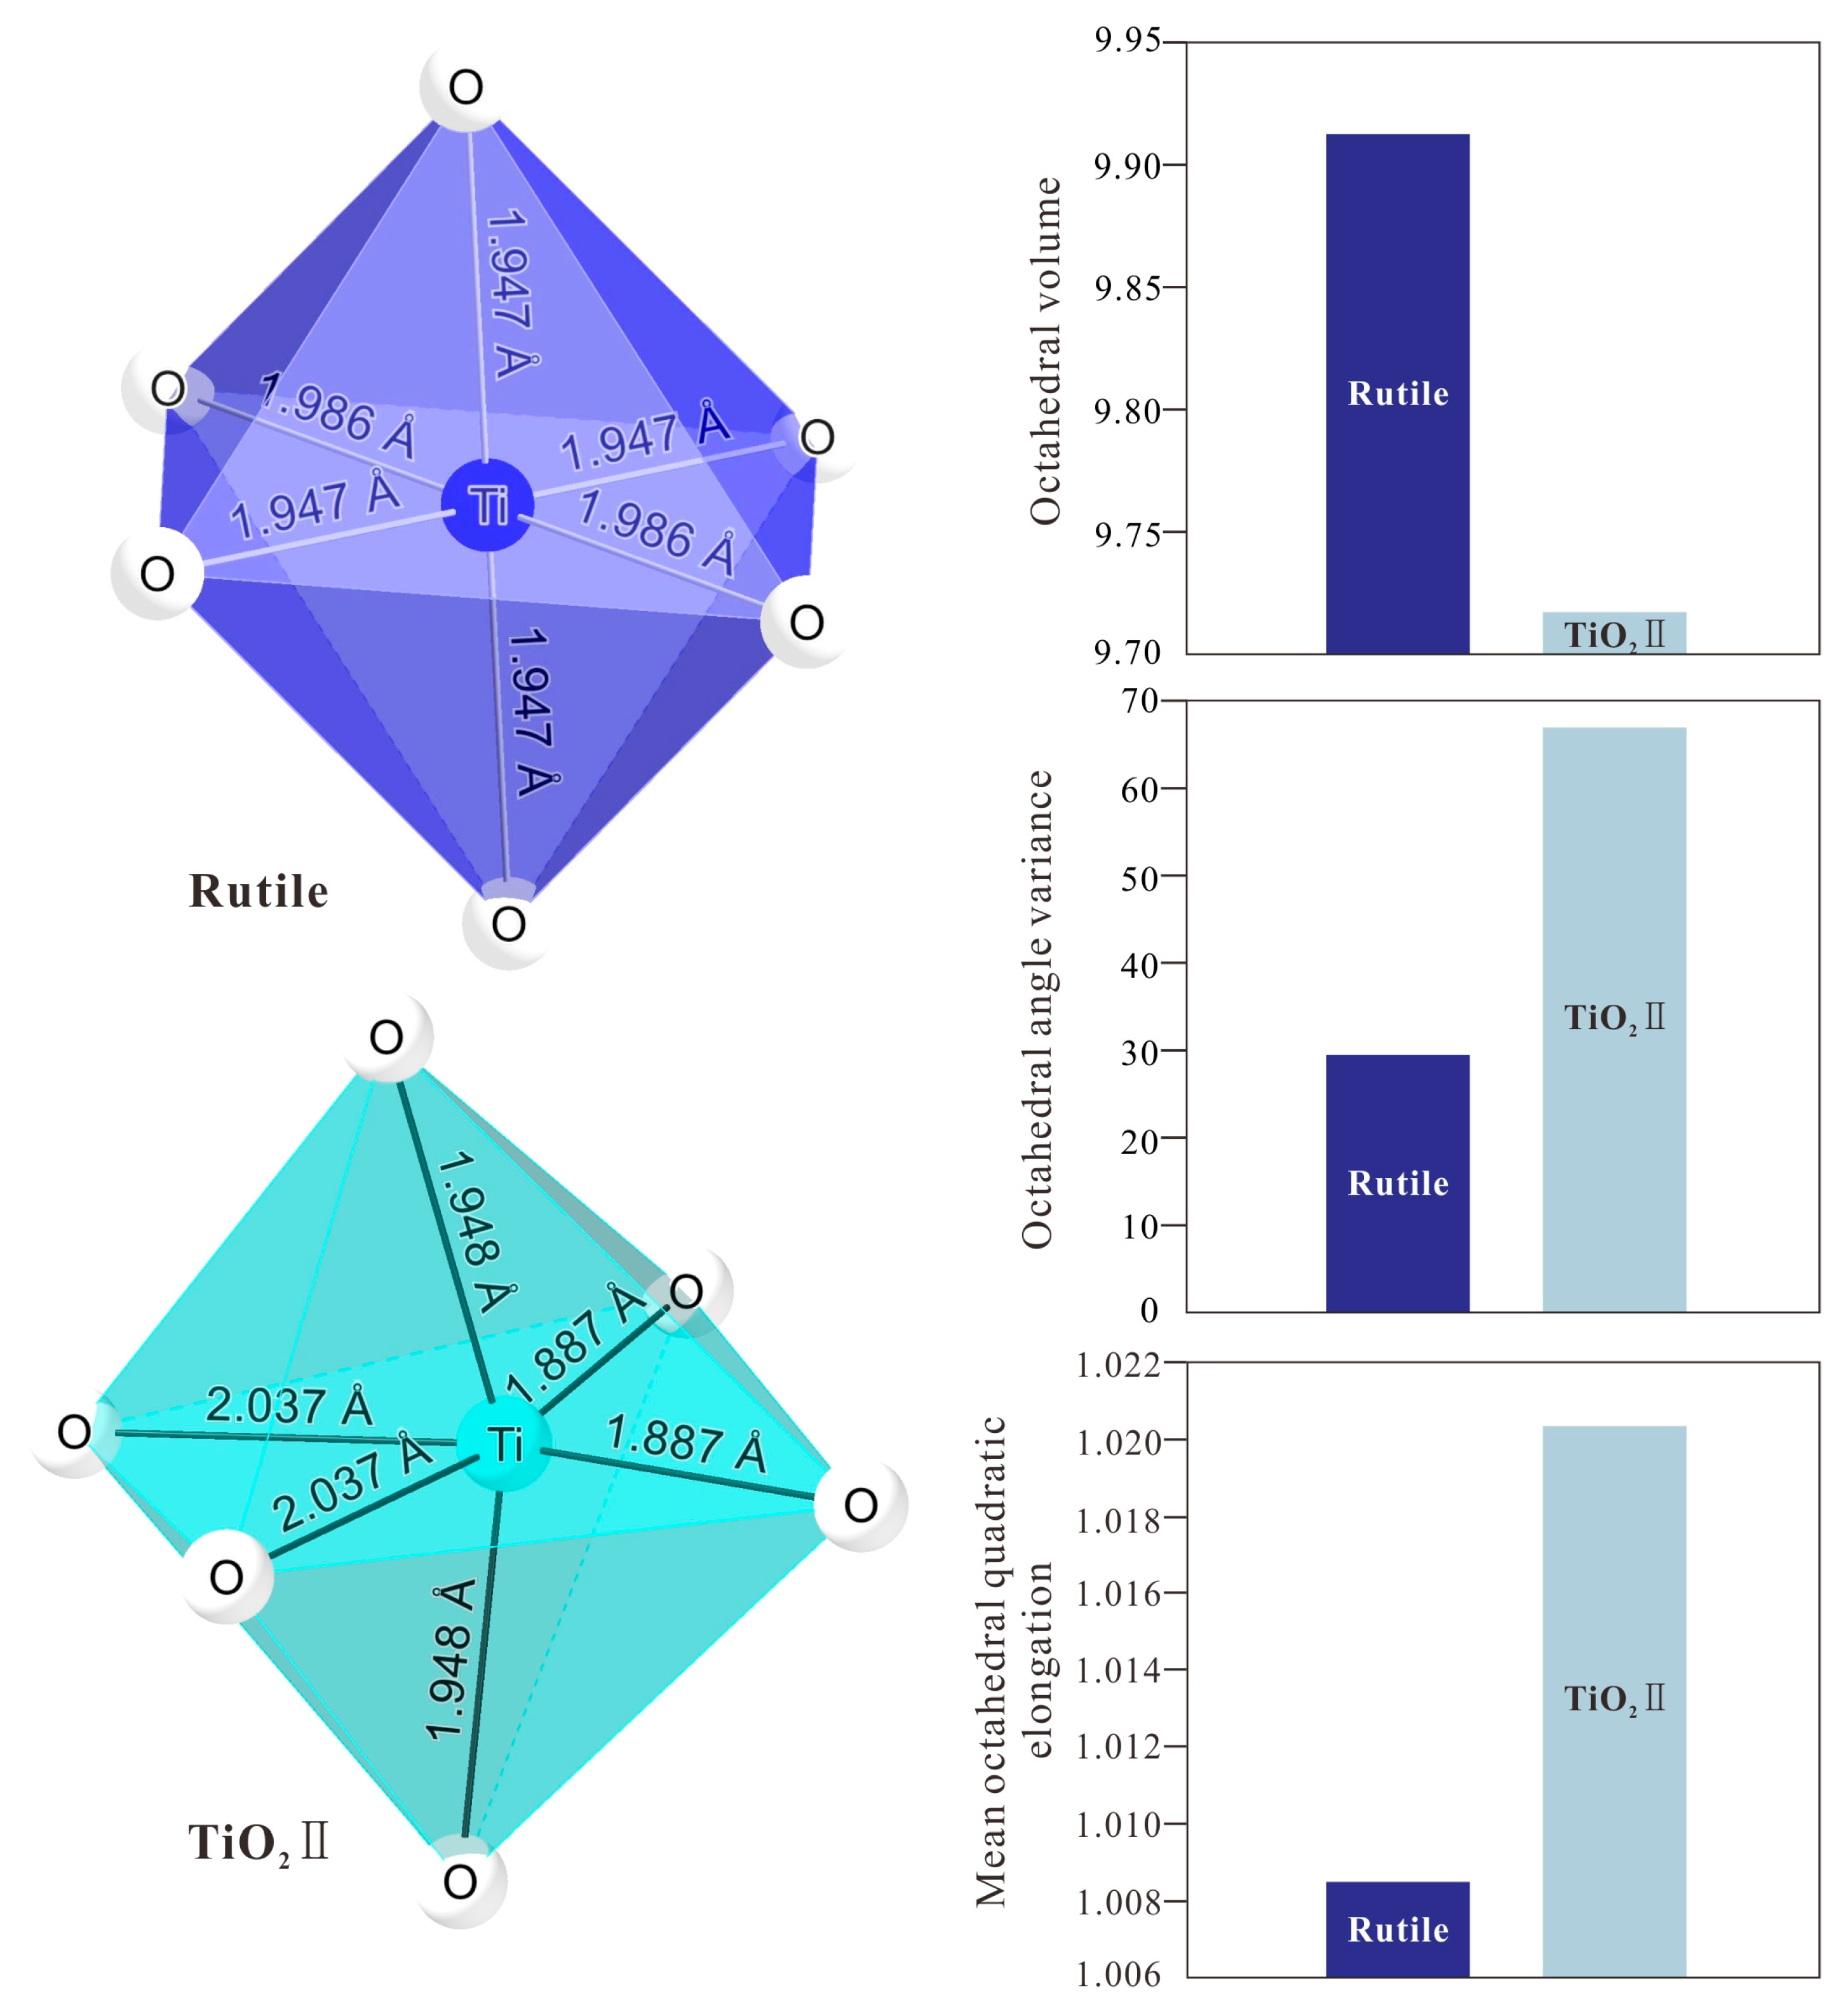
3.2. Single-Crystal X-ray Diffraction Analyses

According to single-crystal X-ray diffraction measurements in this study (Table 2), the average Ti-O distance of the octahedral site (1.9574 Å) in recovered TiO2II is similar to that in rutile (1.9599 Å), whereas TiO2II has smaller TiO6 octahedra, compared to rutile (Figure 8). As shown in Figure 8 and Table 2, the central Ti4+ in the octahedral site in rutile is bonded to four oxygens at an identical distance (1.9467 Å), which is slightly shorter than the lengths of other two Ti-O bonds (1.9863 Å). However, in the crystal structure of TiO2II, two Ti-O bonds (2.0368 Å) are much longer than the other two (1.8874 Å) in a plane. As a result, the estimated mean octahedral quadratic elongation [26] and octahedral angle variance of the octahedral site in TiO2II are significantly larger than those in rutile (Figure 8 and Table 2), indicating that the recovered TiO2II has more distorted TiO6 octahedra than rutile does under ambient conditions [27]. As shown in Figure 4, X-ray powder diffraction analyses (with Cu Kα radiation) are expected to identify the lamellae of TiO2II within natural rutile under ambient conditions based on the angles (2θ) of two strong peaks at 25.5° and 31.5°.

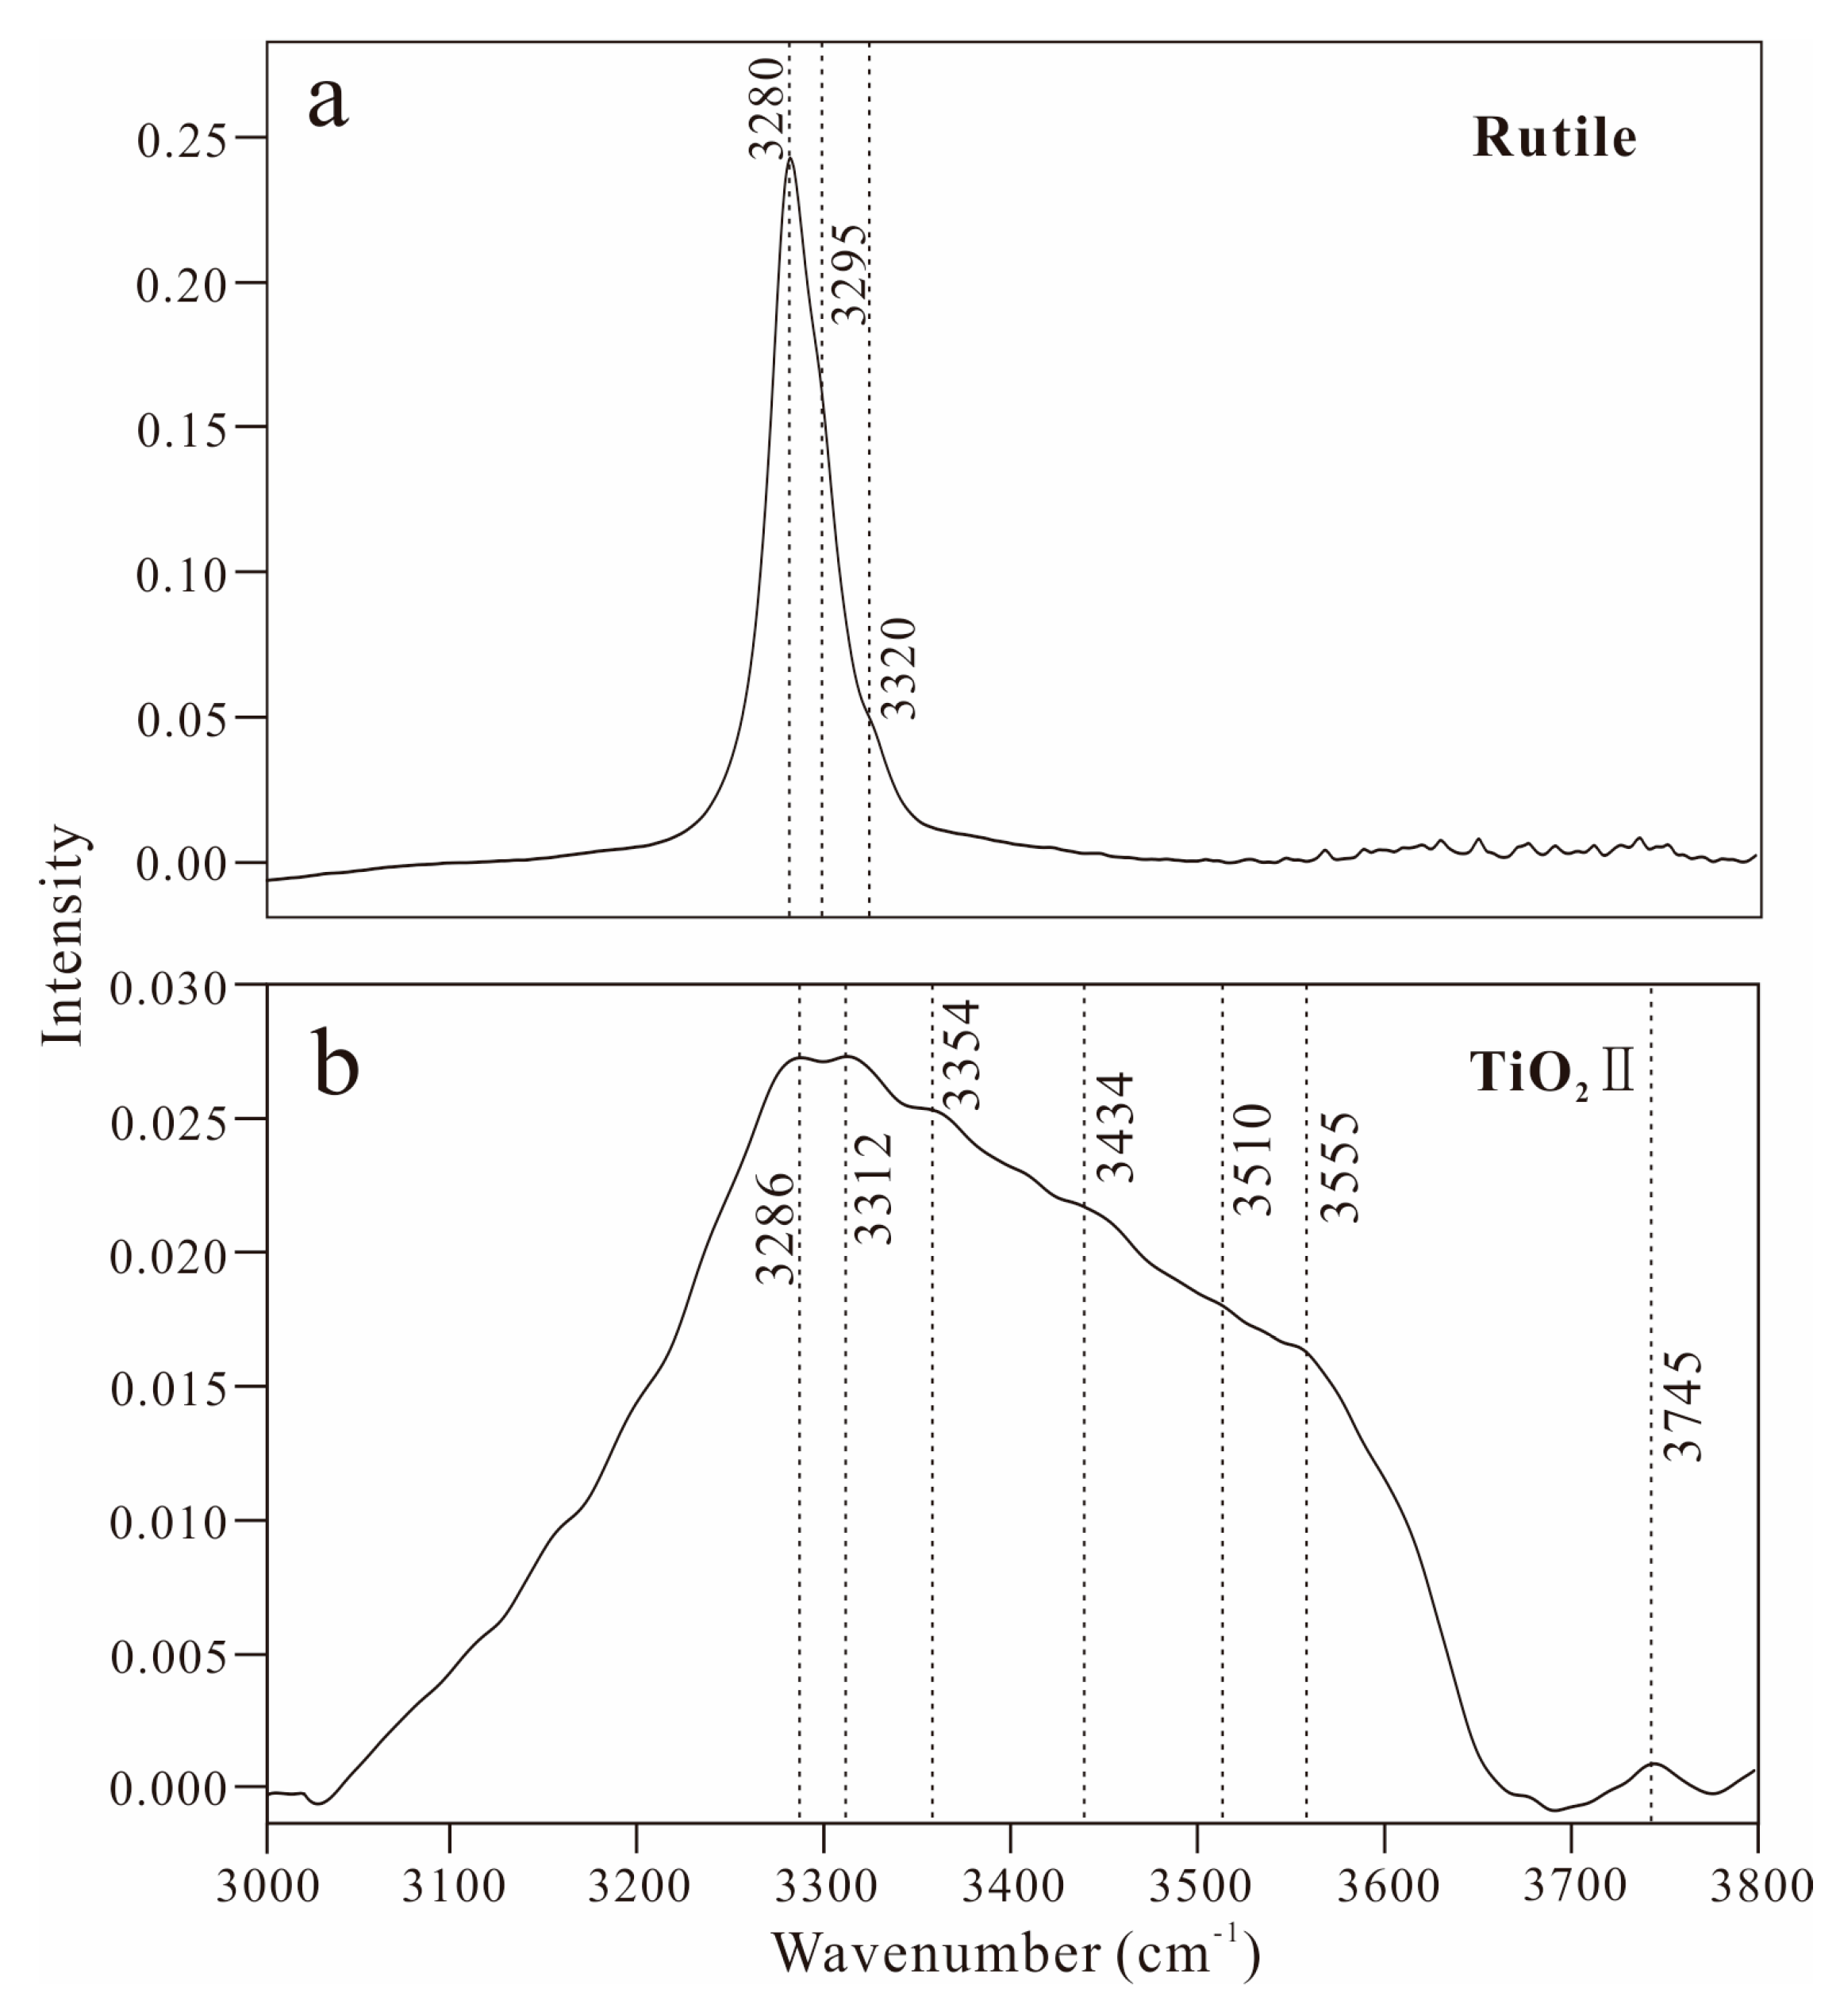
3.3. FTIR Spectroscopy

The representative mid-infrared spectrum of natural rutile in this study displays three absorption bands at 3280, 3295, and 3320 cm−1 in the wavenumber range of 3000 to 3800 cm−1 (Figure 9a). All these bands are ascribed to the O-H stretching vibration [2,3,4]. The main O-H band at 3280 cm−1 can be observed in the infrared spectra of both natural and synthetic rutile [1,2,4,28]. This band is attributed to H incorporated close to the shared O-O edge (the shortest edge of the TiO6 octahedron) and is not associated with any substitutional defects in the crystal structure [29,30]. However, the two weak O-H bands at 3320 and 3295 cm−1 are, respectively, related to Ti3+ and Fe3+ impurities at the octahedral site [2,29,31]. The water contents of three rutile samples are estimated to be 1590, 1620, and 1780 ppm of H2O by weight, respectively. The maximum water content of rutile generally increases with increasing inferred temperature and pressure [3]. Therefore, rutile from the UHP eclogite in this study has a relatively high water solubility compared to that of other crustal rocks. For instance, the maximum reported water concentration of rutile in pegmatite is only 820 ppm of H2O by weight [3,21].
In the IR spectrum of recovered TiO2II under ambient conditions, seven bands at 3286, 3312, 3354, 3434, 3510, 3555, and 3745 cm−1 can be observed (Figure 9b). All these bands are consistent with the reported bands of TiO2II in the range of 3000 to 3800 cm−1 [7], implying that TiO2II in the continental slabs can also contain certain amounts of water. The bands at 3354, 3434, 3510, 3555, and 3745 cm−1 are probably associated with longer O-O edges or O-O distances (>2.5143 Å) (Table 2), indicating the relatively weak effects of hydrogen bonding (O-H∙∙∙O) on O-H stretching [32,33,34]. Since the broad bands around 3400 to 3450 cm−1 can also be due to liquid water (or sub-microscopic fluid inclusions) in NAMs [3], the possibility that water molecules are taken up by TiO2II after a phase transition occurs cannot be excluded. Since several hundred parts per million of water in NAMs can trigger original partial melting of HP and UHP rocks [35], further studies on the pressure–temperature stability of hydroxyls in rutile and TiO2II may also help to understand the transportation and release of water in continental slabs during deep subduction and exhumation.

4. Conclusions

(1) In situ high-pressure Raman spectroscopic measurements of natural rutile in an UHP eclogite indicate that the phase transition from rutile to baddeleyite-type TiO2 terminates at about 16 GPa under compression at ambient temperature. The estimated pressure interval (13 to 16 GPa) of the transition is significantly narrower than that (12 to 21 GPa) reported in previous studies. Kinetic factors are expected to have influences on this transition at room temperature.
(2) According to single-crystal X-ray diffraction analyses, in the exhumated UHP rocks formed during deep continental subduction, the metastable TiO2II can be characterized by highly distorted octahedra in the crystal structure. Under ambient conditions, X-ray powder diffraction analyses (with Cu Kα radiation) are sufficient to identify the lamellae of TiO2II within natural rutile based on the angles (2θ) of two strong peaks at 25.5° and 31.5°
(3) Infrared spectroscopic investigations demonstrate that rutile and recovered TiO2II in the continental slabs can contain certain amounts of water during deep subduction and exhumation. The estimated water contents of rutile in this study range from 1590–1780 ppm H2O by weight. The bands with high frequencies (>3350 cm−1) in the IR spectrum of recovered TiO2II are probably attributed to H incorporated close to the long O-O edges (>2.5143 Å) of the TiO6 octahedra.

Supplementary Materials

The following supporting information can be downloaded at: https://www.mdpi.com/article/10.3390/min13050703/s1. Table S1: Unit-cell and atom position parameters for rutile and TiO2II.

Author Contributions

L.Z. suggested the basis of the paper; X.L. (Xiaofeng Lu) and L.Z. wrote the paper; X.L. (Xiaofeng Lu) and S.G. performed in situ high-pressure Raman spectroscopic measurements. L.Z. and P.W. performed single-crystal X-ray diffraction analysis; X.L. (Xiaoguang Li) and Z.Z. performed infrared spectroscopic investigations; X.L. (Xiaofeng Lu) discussed the methods and results; X.Q. performed Raman spectroscopic measurements under ambient conditions. All authors have read and agreed to the published version of the manuscript.

Funding

This study was supported by the National Natural Science Foundation of China (nos. 42172044 and 41802035).

Data Availability Statement

The unit-cell and atom position parameters for rutile and TiO2II have been added in the supplementary material file.

Conflicts of Interest

The authors declare no conflict of interest.

References

  1. Wang, S.; Zhang, J.H.; Smyth, J.R.; Zhang, J.F.; Liu, D.; Zhu, X.; Wang, X.; Ye, Y. Crystal Structure, Thermal Expansivity and High-Temperature Vibrational Spectra on Natural Hydrous Rutile. J. Earth Sci. 2020, 31, 1190–1199. [Google Scholar] [CrossRef]
  2. Yang, Y.; Xia, Q.K.; Feng, M.; Gu, X.Y. In situ FTIR investigations at varying temperatures on hydrous components in rutile. Am. Miner. 2011, 96, 1851–1855. [Google Scholar] [CrossRef]
  3. Johnson, E.A. Water in Nominally Anhydrous Crustal Minerals: Speciation, Concentration, and Geologic Significance. Rev. Mineral. Geochem. 2006, 62, 117–154. [Google Scholar] [CrossRef]
  4. Vlassopoulos, D.; Rossman, G.R.; Haggerty, S.E. Coupled substitution of H and minor elements in rutile and implications of high OH contents in Nb- and Cr-rich rutile from the upper mantle. Am. Miner. 1993, 78, 1181–1191. [Google Scholar]
  5. Endo, S.; Sato, H.; Tang, J.; Nakamoto, Y.; Kikegawa, T.; Shimomura, O.; Kusaba, K. Baddeleyite-type high-pressure phase of TiO2 and its stable P-T region. High-Press. Res. Appl. Earth Planet. Sci. 1992, 67, 457–461. [Google Scholar]
  6. Gerward, L.; Olsen, J.S. Post-rutile high-pressure phases in TiO2. J. Appl. Cryst. 1997, 30, 259–264. [Google Scholar] [CrossRef]
  7. Chen, F.; Su, W.; Li, X.G.; Hu, X.M.; Gao, J. In situ high temperature and high-pressure investigation of crystal structure and OH of rutile in jadeite quartzite from the Dabie Mountains, China. Acta Petrol. Sin. 2021, 37, 3893–3902. [Google Scholar]
  8. Mammone, J.F.; Sharma, S.K.; Nicol, M. Raman study of rutile (TiO2) at high pressure. Solid State Commun. 1980, 34, 799–802. [Google Scholar] [CrossRef]
  9. Xiao, W.S.; Zhang, H.; Tan, D.Y.; Weng, K.N.; Li, Y.C.; Luo, C.J.; Liu, J.; Xie, H.S. Raman characterization of rutile phase transitions under high-pressure and high-temperature. Spectrosc. Spect. Anal. 2007, 27, 1340–1343. [Google Scholar]
  10. Olsen, J.S.; Gerward, L.; Jiang, J.Z. On the rutile/α-PbO2-type phase boundary of TiO2. J. Phys. Chem. Solids 1999, 60, 229–233. [Google Scholar] [CrossRef]
  11. Goresy, A.E.; Ming, C.; Gillet, P.; Dubrovinsky, L.; Ahuja, R. A natural shock-induced dense polymorph of rutile with alpha-PbO2 structure in the suevite from the Ries crater in Germany. Earth Planet. Sc. Lett. 2001, 192, 485–495. [Google Scholar] [CrossRef]
  12. Meng, D.W.; Wu, X.L.; Fan, X.Y.; Zhang, Z.J.; Chen, H.; Meng, X.; Zheng, J.P. High pressure response of rutile polymorphs and its significance for indicating the subduction depth of continental crust. Acta Geol. Sin. 2008, 82, 371–376. [Google Scholar]
  13. Wu, X.L.; Meng, D.W.; Han, Y.J. α-PbO2-type nanophase of TiO2 from coesite-bearing eclogite in the Dabie Mountains, China. Am. Miner. 2005, 90, 1458–1461. [Google Scholar] [CrossRef]
  14. Liu, F.L.; Xu, Z.Q.; Xue, H.M.; Meng, F.C. Ultrahigh-pressure mineral inclusions preserved in zircons separated from eclogite and its country-rocks in the main drill hole of Chinese Continental Scientific Drilling Project (0~4500 m). Acta Petrol. Sin. 2005, 21, 277–292. [Google Scholar]
  15. Zhang, Z.M.; Xiao, Y.L.; Hoefs, J.; Liou, J.G.; Simon, K. Ultrahigh pressure metamorphic rocks from the Chinese Continental Scientific Drilling Project: I. Petrology and geochemistry of the main hole (0–2,050 m). Contrib. Mineral. Petr. 2006, 152, 421–441. [Google Scholar] [CrossRef]
  16. Klotz, S.; Chervin, J.C.; Munsch, P.; Le Marchand, G. Hydrostatic limits of 11 pressure transmitting media. J. Phys. D Appl. Phys. 2009, 42, 075413. [Google Scholar] [CrossRef]
  17. Mao, H.K.; Xu, J.; Bell, P.M. Calibration of the ruby pressure gauge to 800-kbar under quasi-hydrostatic conditions. J. Geophys. Res. 1986, 91, 4673–4676. [Google Scholar] [CrossRef]
  18. Sheldrick, G.M. SHELXL: Programs for Crystal Structure Analysis; University of Göttingen: Göttingen, Germany, 2018. [Google Scholar]
  19. Farrugia, L.J. WinGX suite for small-molecule single-crystal crystallography. J. Appl. Crystallogr. 1999, 32, 837–838. [Google Scholar] [CrossRef]
  20. Prince, E. International Tables for Crystallography, Volume C: Mathematical Physical and Chemical Tables, 3rd ed.; Reidel: Dordrecht, The Netherlands, 2004. [Google Scholar]
  21. Maldener, J.; Rauch, F.; Gavranic, M.; Beran, A. OH absorption coefficients of rutile and cassiterite deduced from nuclear reaction analysis and FTIR spectroscopy. Miner. Petrol. 2001, 71, 21–29. [Google Scholar] [CrossRef]
  22. Kovács, I.; Hermann, J.; O’Neill, H.; Gerald, J.F.; Sambridge, M.; Horváth, G. Quantitative absorbance spectroscopy with unpolarized light: Part II. Experimental evaluation and development of a protocol for quantitative analysis of mineral IR spectra. Am. Miner. 2008, 93, 765–778. [Google Scholar] [CrossRef]
  23. Lan, T.; Tang, X.L.; Fultz, B. Phonon Anharmonicity of Rutile TiO2 Studied by Raman Spectrometry and Molecular Dynamics Simulations. Phys. Rev. B 2012, 85, 094305. [Google Scholar] [CrossRef]
  24. Porto, S.; Fleury, P.A.; Damen, T.C. Raman spectra of TiO2, MgF2, ZnF2, FeF2, and MnF2. Phys. Rev. 1967, 154, 522. [Google Scholar] [CrossRef]
  25. Lagarec, K.; Desgreniers, S. Raman study of single crystal Anatase TiO2 up to 70 GPa. Solid State Commun. 1995, 94, 519–524. [Google Scholar] [CrossRef]
  26. Robinson, K.; Gibbs, G.V.; Ribbe, P.H. Quadratic elongation: A quantitative measure of distortion in coordination polyhedra. Science 1971, 172, 567–570. [Google Scholar] [CrossRef]
  27. Zhang, L.; Smyth, J.R. Crystal chemistry of metal element substitution in olivine and its high-pressure polymorphs: Implications for the upper-mantle and the mantle transition zone. Earth-Sci. Rev. 2022, 232, 104127. [Google Scholar] [CrossRef]
  28. Johnson, O.; Ohlsen, W.; Kingsbury, P.J. Defects in rutile. III. Optical and electrical properties of impurities and charge carriers. Phys. Rev. 1968, 175, 1102–1108. [Google Scholar] [CrossRef]
  29. Bromiley, G.D.; Hilairet, N. Hydrogen and minor element incorporation in synthetic rutile. Mineral. Mag. 2005, 69, 345–358. [Google Scholar] [CrossRef]
  30. Bromiley, G.D.; Shiryaev, A.A. Neutron irradiation and post-irradiation annealing of rutile (TiO2-x): Effect on hydrogen incorporation and optical absorption. Phys. Chem. Miner. 2006, 33, 426–434. [Google Scholar] [CrossRef]
  31. Khomenko, V.; Langer, K.; Rager, H.; Fett, A. Electronic absorption by Ti3+ ions and electronic delocalization in synthetic blue rutile. Phys. Chem. Miner. 1998, 25, 338–346. [Google Scholar] [CrossRef]
  32. Libowitzky, E. Correlation of O-H stretching frequencies and O-H···O hydrogen bond lengths in minerals. Monatsh. Chem. 1999, 130, 1047–1059. [Google Scholar] [CrossRef]
  33. Nisr, C.; Leinenweber, K.; Prakapenka, V.; Prescher, C.; Tkachev, S.; Shim, S.-H. Phase transition and equation of state of dense hydrous silica up to 63 GPa. J. Geophys. Res.-Sol. Earth 2017, 122, 6972–6983. [Google Scholar] [CrossRef]
  34. Xue, X.Y.; Kanzaki, M.; Fukui, H.; Ito, E.; Hashimoto, T. Cation order and hydrogen bonding of high-pressure phases in the Al2O3-SiO2-H2O system: An NMR and Raman study. Am. Miner. 2006, 91, 850–861. [Google Scholar] [CrossRef]
  35. Seaman, S.J.; Williams, M.L.; Jercinovic, M.J.; Koteas, G.C.; Brown, L.B. Water in nominally anhydrous minerals: Implications for partial melting and strain localization in the lower crust. Geology 2013, 41, 1051–1054. [Google Scholar] [CrossRef]
Figure 1. Projection of crystal structures (consisting of TiO6 octahedra) of rutile and TiO2II based on the single-crystal X-ray diffraction analyses in this study.
Minerals 13 00703 g001
Figure 2. Micro-photographs of eclogite (no. B132R114P1a) from the main hole of the Chinese Continental Scientific Drilling Project. Abbreviations: Rt = rutile, Phn = Phengite, Grt = Garnet, Omp = Omphacite.
Minerals 13 00703 g002
Figure 3. Photomicrographs of natural rutile and recovered TiO2II in this study.
Minerals 13 00703 g003
Figure 4. The calculated X-ray powder diffraction patterns for Cu Kα radiation (λ = 1.5405 Å) of rutile and TiO2II.
Minerals 13 00703 g004
Figure 5. The Raman spectrum of rutile in the wavenumber range of 100 to 1200 cm−1 under ambient conditions.
Minerals 13 00703 g005
Figure 6. Representative Raman spectra of rutile with varying pressure under (a) compression and (b) decompression.
Minerals 13 00703 g006
Figure 7. Variations in band frequencies in the Raman spectra with varying pressure under (a) compression and (b) decompression.
Minerals 13 00703 g007
Figure 8. Structural representations and geometry parameters of octahedral sites in rutile and TiO2II.
Minerals 13 00703 g008
Figure 9. Representative mid-infrared absorption spectra of (a) natural rutile and (b) recovered TiO2II under ambient conditions. The spectrum of rutile was normalized to 30 μm thickness but was vertically offset.
Minerals 13 00703 g009
Table 1. Frequencies (cm−1) of the bands in the spectra from in situ high-pressure Raman spectroscopic measurements.
Pressure (GPa)Phase 1 (Rutile)
2.2 232.80 452.85 614.03 ---------
4.1 239.46 459.78 620.86 ---------
7.5 248.66 469.17 633.03 ---------
8.2 251.21 473.11 638.38 ---------
9.7 253.77 477.56 644.70 ---------
10.8 -481.55 648.59 ---------
Phase 2
12.4 ---449.38 485.44 598.69 654.41 -----
13.2 ---453.34 487.90 599.17 657.32 -----
13.8 179.33 320.30 382.16 457.30 489.38 603.04 658.92 -----
14.1 182.43 321.81 381.16 460.76 490.36 604.49 660.23 -----
14.6 181.91 322.32 381.16 464.72 489.87 603.62 659.26 -----
Phase 3 (baddeleyite-type TiO2)
16.0 159.17 221.01 264.99 323.33 351.05 408.63 439.47 492.33 634.01 660.71 702.25 833.26
15.2 159.69 221.53 267.02 325.86 351.55 407.64 438.97 492.33 630.60 658.77 698.88 833.26
14.7 159.17 220.50 263.46 324.85 349.54 406.14 437.98 491.84 630.11 659.74 697.43 830.90
14.0 154.51 218.96 262.95 324.34 349.04 402.65 436.94 490.86 628.17 658.29 696.47 830.43
13.6 152.44 217.43 261.42 324.34 347.03 402.15 436.00 490.86 627.19 657.80 697.43 830.90
13.0 151.92 217.94 262.95 329.89 347.03 399.66 435.00 489.87 626.22 654.90 695.51 828.54
10.5 142.58 209.72 258.87 320.80 346.02 390.17 430.53 486.92 602.37 650.53 690.20 822.88
Phase 4
8.2 142.58 180.88 252.23 289.40 315.75 378.15 449.38 478.54 573.97 614.03 640.33 -
7.1 128.56 183.46 253.25 289.91 314.74 374.15 439.96 471.14 569.11 605.46 623.06 -
Phase 5 (TiO2II)
5.0 178.82 288.89 318.28 374.65 439.47 555.97 592.40 624.76 ----
0.0 174.17 287.37 315.75 365.12 431.03 538.90 575.91 612.22 ----
Table 2. Site geometry and occupancy parameters for rutile and TiO2II.
RutileTiO2II
Average bond length1.9599Average bond length1.9574
Octahedral volume9.9127Octahedral volume9.7171
Octahedral angle variance29.4997Octahedral angle variance66.5861
Mean octahedral quadratic elongation1.0085Mean octahedral quadratic elongation1.0203
<Ti-O> (2)1.9863<Ti-O> (2)1.8874
<Ti-O> (4)1.9467<Ti-O> (2)1.9481
<O-O> edge2.7812<Ti-O> (2)2.0368
<O-O> edge (shared edge)2.5284<O-O> edge2.8360
<O-O> edge2.9607<O-O> edge2.8873
<O-O> distance3.8934<O-O> edge2.9488
<O-O> distance3.9726<O-O> edge2.7310
Occupancy1<O-O> edge (shared edge)2.5143
<O-O> edge2.7168
<O-O> edge2.6509
<O-O> distance3.8317
Occupancy1
Note: the bond length and atom distance are measured in Å.
Disclaimer/Publisher’s Note: The statements, opinions and data contained in all publications are solely those of the individual author(s) and contributor(s) and not of MDPI and/or the editor(s). MDPI and/or the editor(s) disclaim responsibility for any injury to people or property resulting from any ideas, methods, instructions or products referred to in the content.

