Article

Exploratory Mapping of the Geothermal Anomalies in the Neoproterozoic Arabian Shield, Saudi Arabia, Using Magnetic Data

1
Department of Geology and Geophysics, College of Science, King Saud University, P.O. Box 2455, Riyadh 11451, Saudi Arabia
2
Applied Geophysics Programme, Department of Physics, University of Calabar, Calabar PMB 1115, Cross River State, Nigeria
3
Geology Department, Faculty of Science, Suez University, Suez 43518, Egypt
4
Faculty of Natural Sciences, Matej Bel University in Banska Bystrica, Tajovského 40, 974 01 Banska Bystrica, Slovakia
*
Author to whom correspondence should be addressed.
Minerals 2023, 13(5), 694; https://doi.org/10.3390/min13050694
Submission received: 18 February 2023 / Revised: 16 May 2023 / Accepted: 17 May 2023 / Published: 19 May 2023

Abstract

:
In this paper, certain areas of the Kingdom of Saudi Arabia (KSA) are assessed in order to map potential geothermal energy zones. To evaluate high-resolution aerial magnetic data, spectral depth analysis using a modified centroid approach was used. The calculated geothermal parameters were gridded in order to delineate the regions characterised by a shallow Curie point depth (CPD) and a high geothermal gradient (GG) as well as a high heat flow (HF). The CPD, GG and HF calculated from the analysed data varied in the ranges of 6.0–15.0 km, 40.0–100.0 °C/km and 90.0–270.0 mW/m2, respectively. The obtained results show the concurrence of the positions of shallow CPD (<8.0 km), high GG (>83.5 °C/km) and high HF (>211.0 mW/m2). The geothermal systems that are oriented in the E–W direction are related to the Red Sea tectonics, the tectonic opening of the Red Sea/Gulf of the Suez Rift, hot subterranean anomalies and high enthalpy from radioactive granites. Likewise, the geologic structures (fractures and faults) related to the Red Sea tectonics serve as channels for the movement of hydrothermal fluids and the deposition of associated minerals. All in all, another geophysical study involving deep boreholes, and seismic, magnetotelluric, electromagnetic and geochemical data should be conducted to evaluate and estimate precisely the economic reserves of geothermal resources.

1. Introduction

The Red Sea geodynamic processes control the tectonics and geology of the Kingdom of Saudi Arabia (KSA) and have caused the formation of a new oceanic crust along the axial trough, which is strongly supported by geophysical and geological results [1]. The Kingdom of Saudi Arabia is thought to be rich in geothermal energy resources, particularly the Neoproterozoic Arabian Shield, which is characterized by vast thermal springs, lava fields and volcanic and tectonic activities [2].
Early assessments of the geothermal potential in the KSA, conducted with geothermometers and geochemical, geological and geophysical approaches, found a wide range of reservoir temperatures (130–220 °C) and heat flows (120–210 W/m2) linked with hot springs [3]. These hot springs and minerals exist in the neighbourhood of the magmatic intrusions of the Precambrian to the Recent age [4]. Previous geophysical studies have shown that the major Northwest–Southeast-, Northeast–Southwest- and East–West-directed fault zones control the geothermal systems and the deposition of gold, base metals and other precious metals [4,5,6,7]. Several geoscience investigations in the KSA focused on hydrocarbon and mineral explorations [8]. However, a few geothermal investigations have been conducted in the KSA [3,9,10]. These recent geothermal investigations are expected to help the KSA to become completely powered by renewable and low-carbon energies, hence freeing up more hydrocarbon for export to boost the economy [9]. Nevertheless, the KSA has a high electricity production of about 240 terawatts with about 192 terawatts and 17 million kWh applied for cooling purposes and desalination processes, respectively [3]. These activities and others have increased the CO2 released from fuel combustion in the KSA from 252,000 Gg (in the year 2000) to about 446,000 Gg, presently [3].
Several recent geoscience studies all over the world are centred on reconnaissance explorations for geothermal resources [11,12,13] using magnetic data. Seismic, magnetotelluric, electrical resistivity, transient electromagnetic and bottom-hole temperature techniques, on the other hand, can be used in geothermal research and monitoring [14]. Overall, the magnetic method is an effective exploratory tool for determining the presence, lateral extent and depth of natural resources in the subsurface [15,16,17,18,19]. Likewise, magnetic data have been successfully applied in mapping the subsurface bedrock topography [2] and sediment thicknesses [20,21,22], in the early phases of geothermal developments. The magnetic data have significantly reduced the quantity of drilled wells needed to evaluate feasible geothermal fields. This method is the least expensive geophysical procedure for delineating the geothermal system of a region [23]. The aero-magnetic method is an operative tool in defining the regional surficial geologic borders [19] as well as the basement framework [24]. Likewise, it can be used for isolating anomalous geologic structures and bodies triggered by magnetic disparities [25]. In addition, magnetic data can be applied for mineral assessment programs, delineating hydrothermally altered rocks and geologic structures [26]. Additionally, it can be used in petroleum explorations, archaeological investigations and detection of unexploded ordnance [27,28]. Furthermore, lineaments and rift minerals interconnected with igneous intrusions can be explored by applying magnetic data [2,16]. This technique has been valuable in delineating geothermal reservoirs, basement framework, igneous intrusions [20] and magma chambers interconnected with the geothermal system source of heat [29]. Additionally, the magnetic method can be used to locate regions with diminished magnetization caused by thermal events, hydrothermal system assessment [30], concealed anomalies originated by granitic as well as magmatic structures [16] and associated lineaments [31,32,33]. Over the years, the various procedures involved in magnetic data acquisition, corrections, enhancements, presentations and interpretations have been considerably upgraded [19]. On the other hand, this method is normally connected with ill-posed inverse problems and characterized by unstable and non-unique solutions [19,20,34,35]. Nevertheless, reliable solutions to magnetic results can be acquired by applying enhanced procedures combined with a proper knowledge of geology [19].
In this investigation, Magsat satellite-generated magnetic data flown by NASA were used to offer insights into the subsurface geothermal anomalies [36]. The data that have the potential to probe different rock properties were applied to locate and determine the trend of geothermal systems and structures within the KSA. The world is composed of continents with various crustal blocks. These crustal blocks have different compositions, tectonic histories, ages and wide range of magnetic susceptibilities caused mostly by igneous intrusions [37]. Magnetic properties associated with various crustal blocks can be measured at satellite altitudes [38,39]. Previous studies have shown that igneous intrusion and extrusion have distinct magnetic content [19]. The satellite magnetic data can be used to detect anomalies over oceanic rises, plateaux and subduction regions that are in general inferred for induced magnetization effects [40]. These magnetic anomalies ordinarily and absolutely match to bathymetric structures with anomaly peaks over rises and plateaux, and trough over the basins [41]. Magnetic anomaly maps using a regional to continental scale are becoming readily accessible from terrestrial, shipborne and airborne surveys [42]. Satellite-generated magnetic data are generally well-thought-out to seal the coverage lacunas in the regional assembling of these near-surface surveys. All in all, crustal magnetic anomaly maps at satellite heights can be analysed simply for regional geologic structures [42]. Nevertheless, for analyses and deductions involving smaller-scale magnetic structures, satellite height anomalies are normally enhanced downwards [42]. On the other hand, aeromagnetic techniques flown from aircrafts or drones are routinely conducted around the world for various applications, as the magnetometer is, today, a standard instrument on any airborne geophysical survey. For example, many continents, such as North America, are entirely covered with aeromagnetic surveys with lines spaced from 0.1 to 1 km.

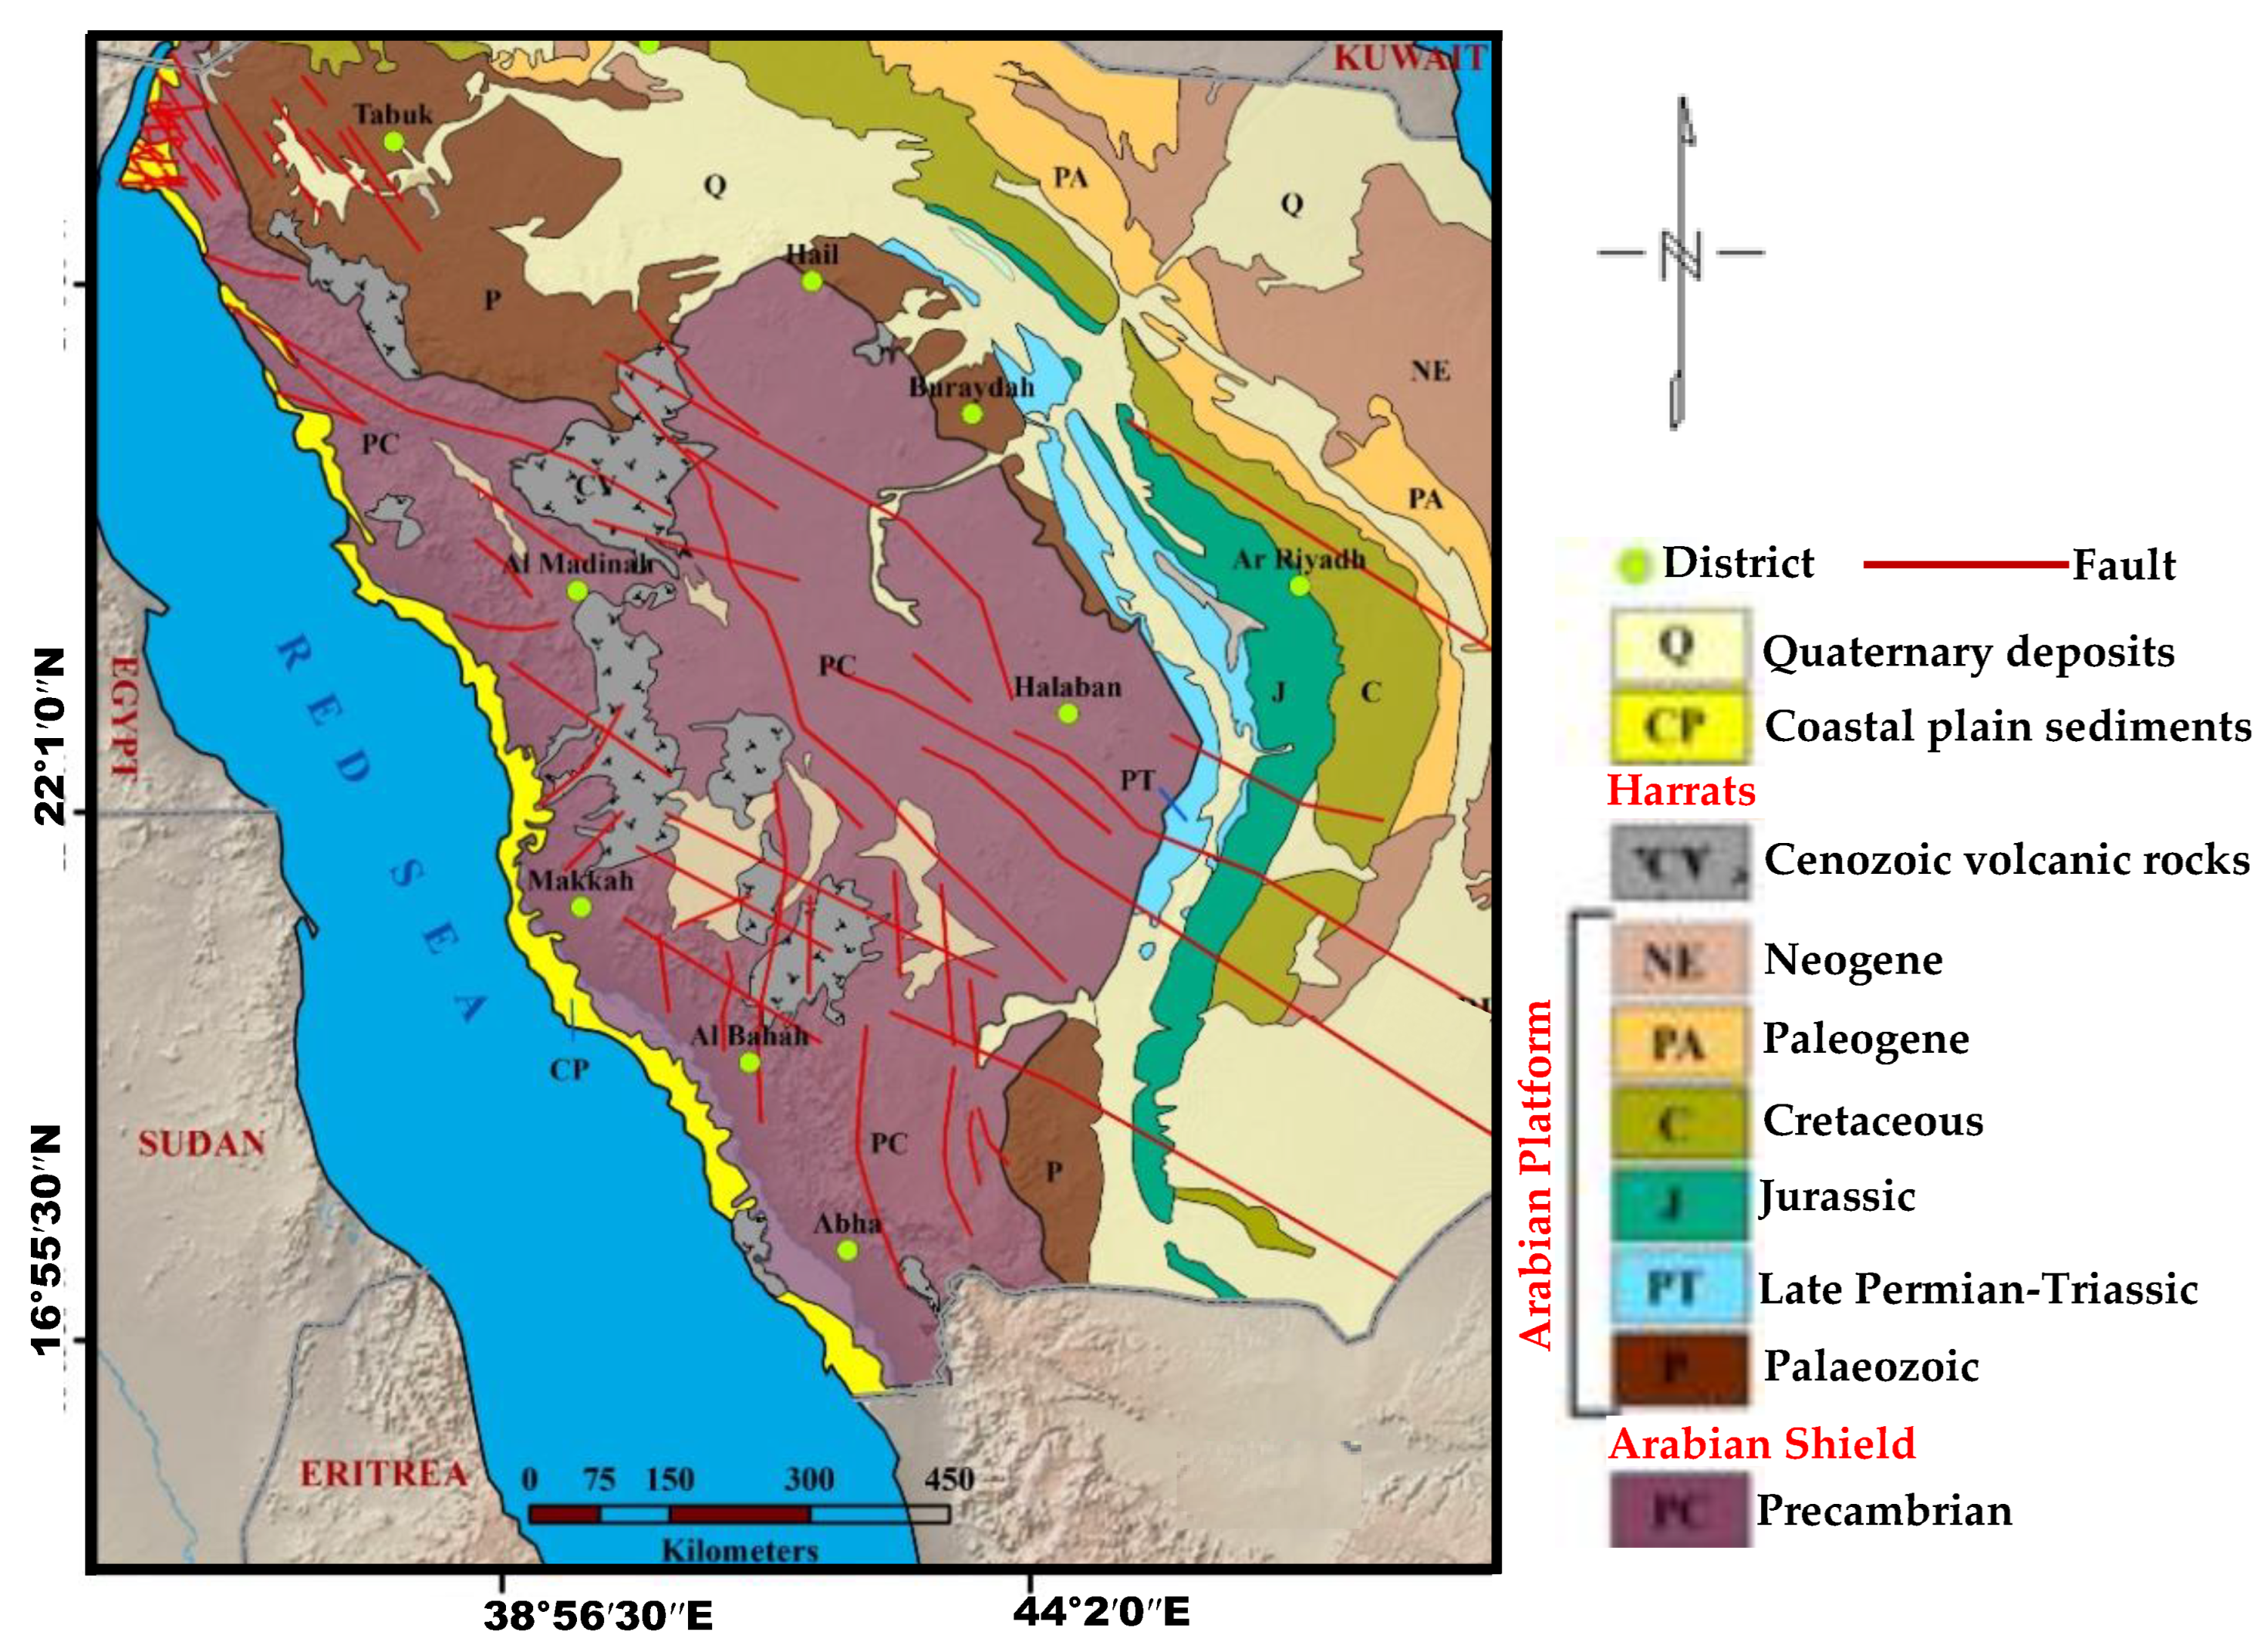
2. Location and Geological Background

The studied geological region is a section of the Arabian Shield (AS) in Saudi Arabia. It is geographically situated between latitudes 16.0°–30.0° N and longitudes 35.0°–48.0° E (Figure 1). The study location is bordered by Jordan, Iraq and Kuwait, Iran and Arabian Gulf, Rub’Al Khali Desert, Oman, Yemen, Egypt and Red Sea, and Eritrea to the northwest, north, northeast, east, southeast, south, west and southwest, respectively. The Kingdom of Saudi Arabia is characterized by two geological provinces: the Arabian Shield in the west and the Arabian Shelf in the east. The Arabian Shield (SA) is dominated by Precambrian (igneous and metamorphic) rocks classified into the Asir, Jeddah, Afif, Ad Dawadimi, Ar Rayn, Ha’il, Hijaz and Midyan terranes on the basis of their formation modes [43]. There are pockets of Archean and Paleoproterozoic lithologies inside the prevalent Neoproterozoic lithologies, which arose over 300 million years of the tectonic crustal expansion that commenced 850 Ma ago [44]. A sequence of magmatic arcs, sedimentary and volcanic basins, and granitic intrusions were produced by at least three continental collisions over the course of 300 million years. The opening of the Mozambique Ocean was triggered by the breakup and separation of Rodinia between 900 and 800 Ma ago, and intra-oceanic subduction is frequent [45].
The island arcs above them were accreted to the AS by the convergence of cratonic blocks during Cryogenian–Ediacaran, and the accretion zone is exposed on the surface as suture zones. With the formation of Gondwana, the accretions began in the southern AS, progressed north and finally concluded in the northeast AS. In the eastern AS, where the halt of accretion is poorly understood, no pre-EAO blocks are recorded. The Arabian Shelf is a succession of Paleozoic and newer sediments that were predominantly deposited along passive borders and contain up to 10 km of limestones and siliciclastics [44,45].
The Paleozoic series contains the world-famous oil and gas fields [46]. With the collision of east and west Gondwana, the NW-trending Najd fault system, crustal-scale sinistral strike-slip faults and ductile shear zones formed and had an effect on the AS [47]. This Najd fault system (NFS), which is approximately 2000 km long, 400 km wide and partially covered by Cenozoic lavas and alluvium [48], is comprised of a network of parallel and en echelon faults as well as secondary structures, such as strike-slip, oblique-slip, thrust and normal faults as well as folds and dike swarms. As a result of movement along the Najd fault system, the Dokhan volcanic, granite plutonism and molasse basins have been revealed and developed [47]. In some instances, the Najd fault system reactivates older Neo-Proterozoic terranes by traversing them. The NFS has predominantly brittle deformation, while the south-eastern AS contains a tectonic fabric that penetrates the fault zone. In addition, strike-slip faults with a north–south orientation in the southern AS (Asir Terrane) and eastern AS [44] are part of crustal-scale fault systems. Within the Jeddah Terrane, strike-slip faults have a northeast–southwest orientation [48]. These prominent geological structures serve as weak zones for igneous intrusions as well as pathways for hot springs and harrats. The geophysical information and wells drilled in the Rub’ Al Khali indicate the existence of a basin beneath the Quaternary sand [49].
Figure 1. Geological setting of the study location (modified after [6,50]).
Minerals 13 00694 g001

3. Materials and Methods

The data used for this investigation were Magsat satellite-generated magnetic data flown by NASA and downloaded using doi:10.7289/V5H70CVX (accessed on 14 June 2019). Earth Magnetic Anomaly Grid (2-arc-minute resolution), version 3 (EMAG2v3), was delivered as a zip file that holds comma-delimited data (CSV). The digitized data were imported into the Geosoft Oasis Montaj platform by clicking the database tool. The digitized magnetic data in the database were further processed and gridded using the minimum curvature procedure. The enhanced operation enabled the data to be displayed in the colour raster format (Figure 2). On the whole, the reduced total magnetic intensity anomaly data were observed to vary from a minimum of −75.0 nT to a maximum of 65.5 nT within the study area. These satellite magnetic data have been observed to be very useful in delineating near-surface magnetic anomalies [42]. Furthermore, it is a powerful instrument that is frequently used to investigate time differences in the Earth’s core field at satellite height and at the core-mantle boundary [42]. The available codes, such as magmap.omn as well as spectrum calculation and display in [50,51] from Geosoft® (version 7.5.0), were applied to conduct all spectral analyses required for reconnaissance geothermal exploration in the KSA.

Spectral Analysis and Centroid Depth Method
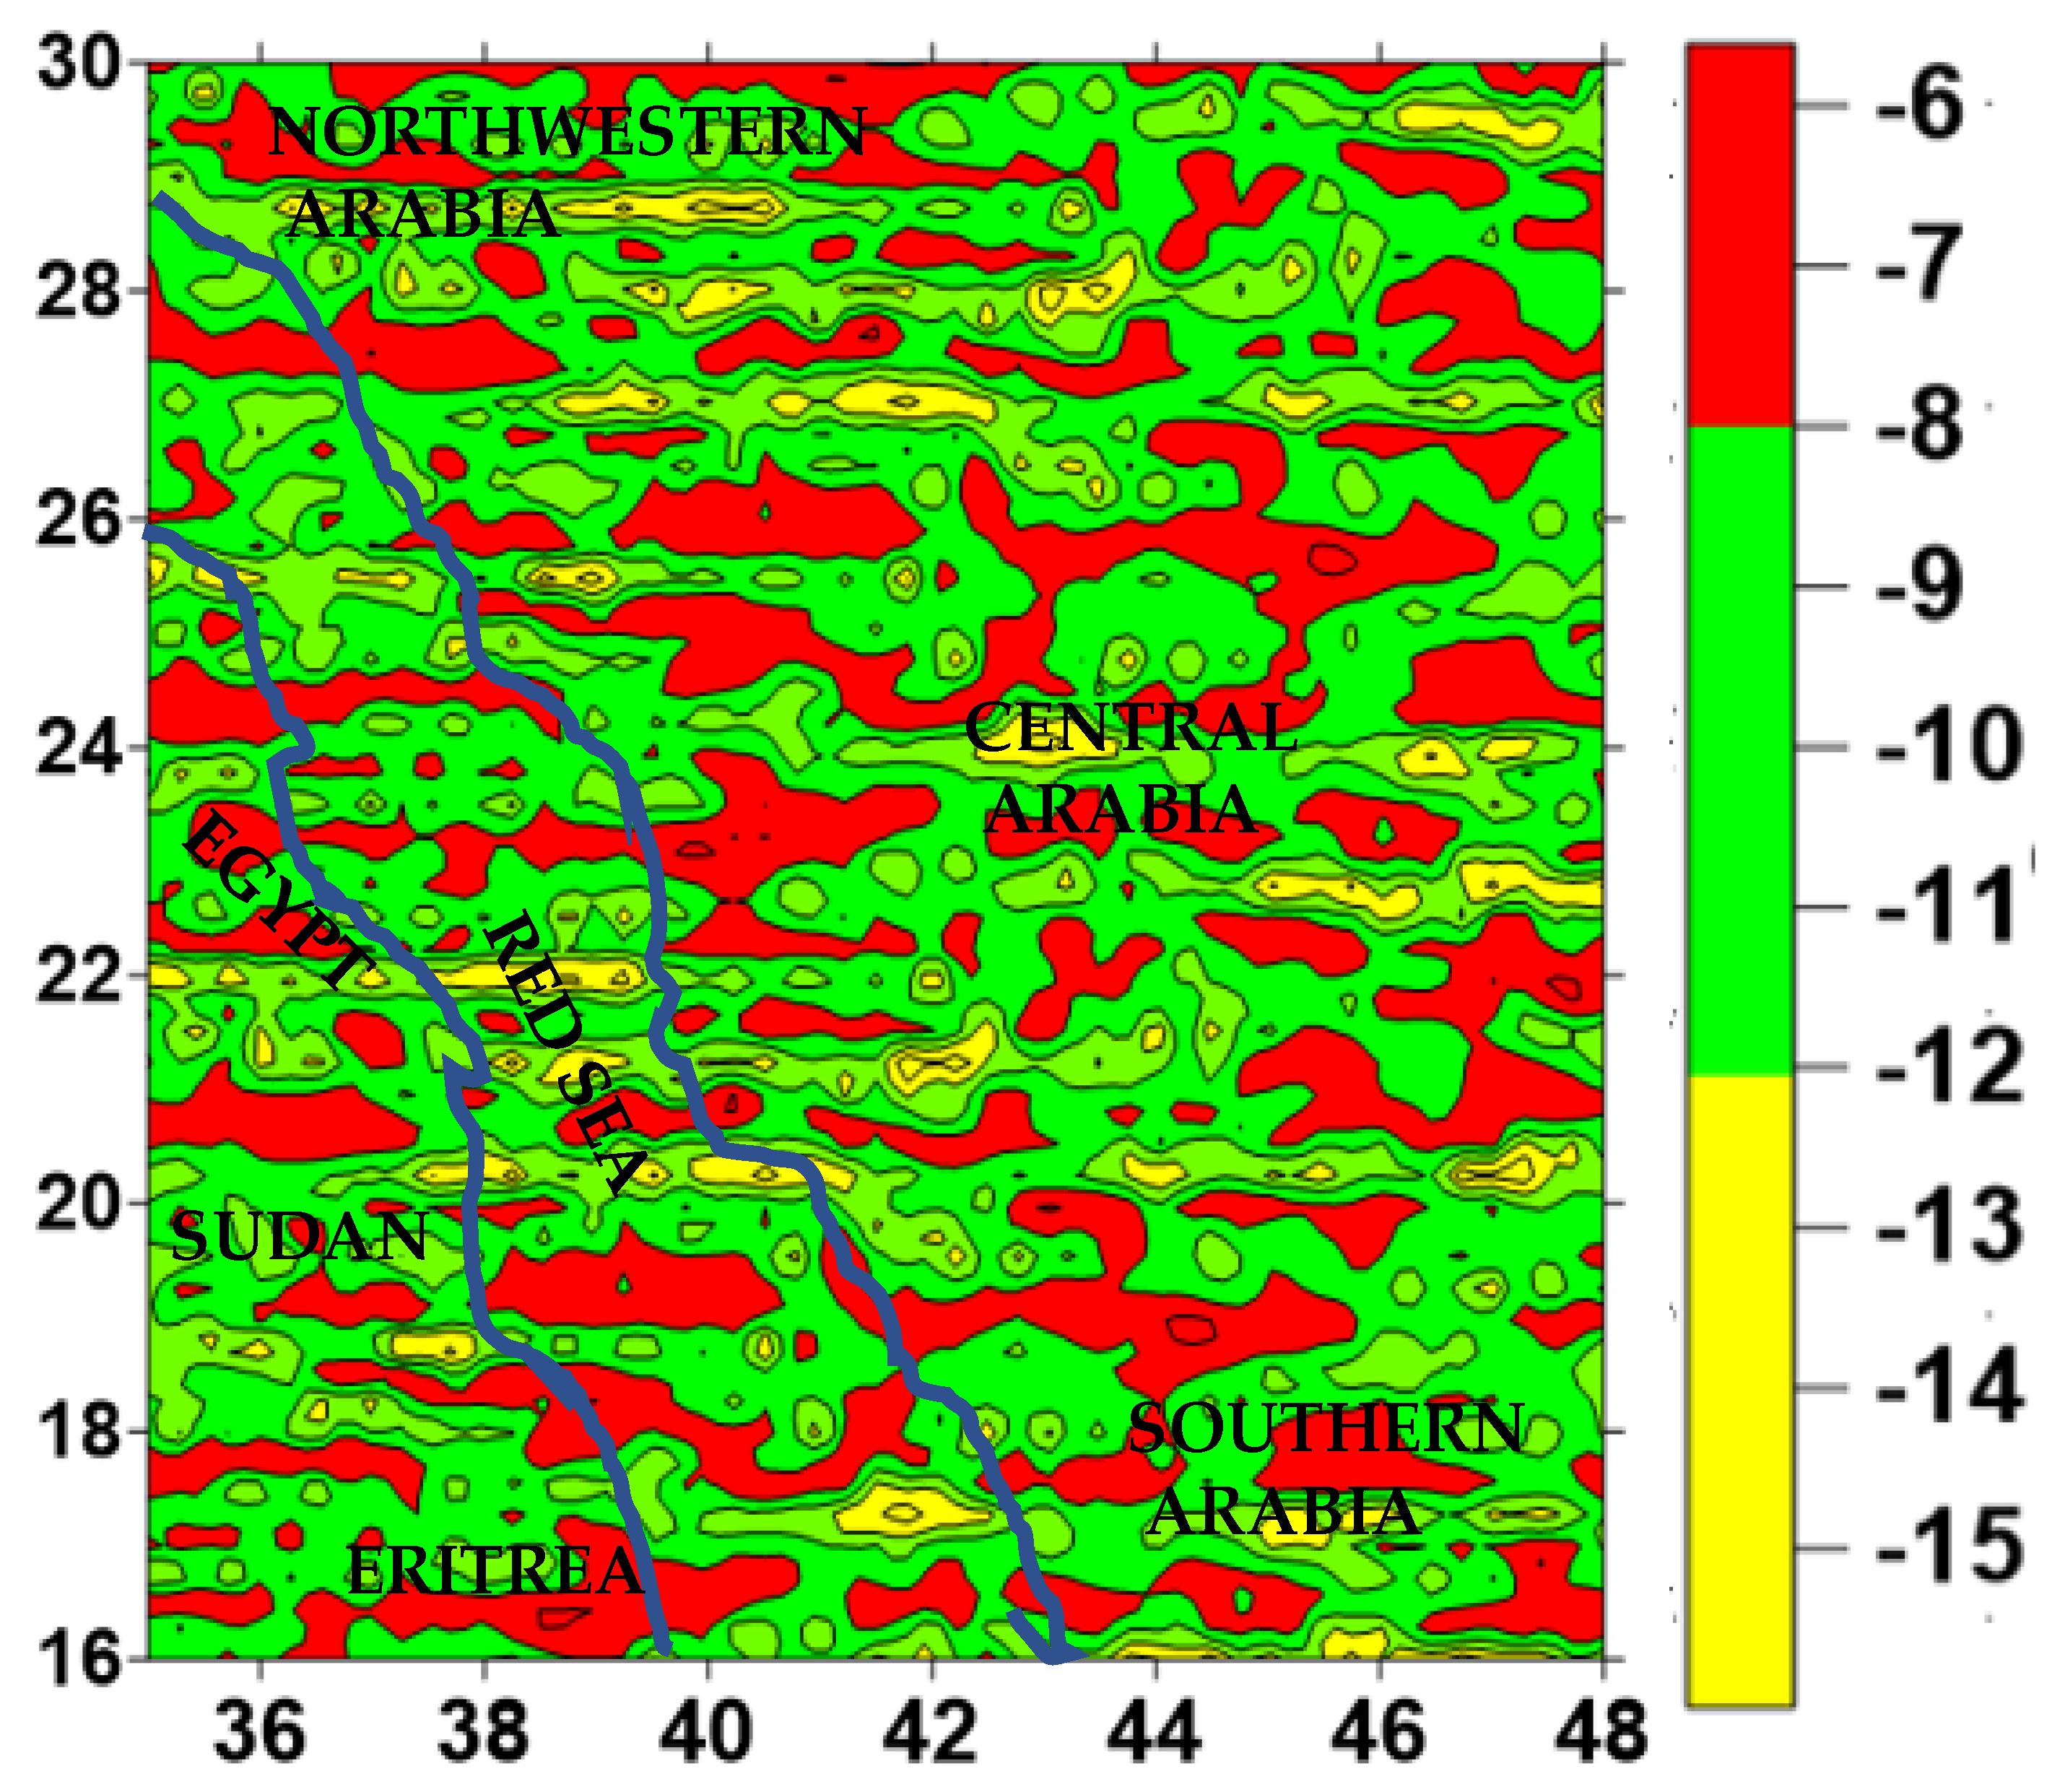
In order to properly evaluate the geothermal anomalies caused by a series of volcanic eruptions, igneous intrusions and the Red Sea tectonics in the KSA, the spectral analysis procedure applying the centroid technique was adopted. The procedure has been observed to be very effective in the approximation of Curie point depth [52]. The procedure to approximate the depth extent of magnetic bodies can be grouped into two categories: those that evaluate the shape of isolated magnetic anomalies [53] and those that examine the statistical properties of the patterns of magnetic anomalies [54]. Both approaches offer the relationship between the spectrum of magnetic anomalies and the depth of a magnetic source by transforming the spatial data into the frequency domain. The authors of [55] indicated that the latter technique is more suitable for the regional compilations of magnetic anomalies. The technique applied here was similar to the technique of [54]. The top bound and the centroid of a magnetic source, Zt and Z0, respectively, were computed from the power spectrum of magnetic anomalies and were applied to approximate the basal depth of the magnetic source Zb.
Assuming that the layer extends infinitely far in all horizontal directions, the depth to the top bound of a magnetic source is small compared with the horizontal scale of a magnetic source, and that magnetization M(x,y) is a random function of x and y, [54] introduced the power–density spectra of the total-field anomaly ΦT:
Φ Δ T k x , k y = Φ M k x , k y × F k x , k y
F k x , k y = 4 π 2 C m 2 Θ m 2 Θ f 2 e 2 k Z t 1 e k Z b Z t 2
where Φ M is the power–density spectra of magnetisation, Cm is a proportionality constant, and Θ m and Θ f are factors for magnetization direction and geomagnetic field direction, respectively. This equation can be simplified by noting that all terms, except Θ m 2 and Θ f 2 , are radially symmetric. Moreover, the radial averages of Θ m and Θ f are constant. If M x , y is completely random and uncorrelated, Φ M k x , k y is a constant. Hence, the radial average of Φ Δ T is:
Φ Δ T k = A e 2 k Z t A e 2 k Z t 1 e k Z b Z t 2
where A is a constant. For wavelengths less than about twice the thickness of the layer, Equation (3) approximately becomes:
ln Φ Δ T k 1 2 = ln B k Z t
where B is a constant. We could estimate the top bound of a magnetic source by the slope of the power spectrum of the total filed anomaly. On the other hand, Equation (3) can be rewritten as:
Φ Δ T k 1 2 = C e k Z 0 e k Z t Z 0 e k Z b Z 0
where C is a constant. At long wavelengths, Equation (5) is:
Φ Δ T k 1 2 = C e k Z 0 e k d e k d e k Z 0 2 k d
where 2d is the thickness of the magnetic source. From Equation (6),
ln Φ Δ T k 1 2 k = ln D k Z 0
where D is a constant. We could estimate the top bound and the centroid of the magnetic source by fitting a straight line through the high-wavenumber and low-wavenumber parts of the radially averaged spectra of l n Φ Δ T k 1 2 and l n Φ Δ T k 1 2 / k from Equations (4) and (7), respectively. Figure 3 shows an example of a power spectrum of magnetic anomaly data. From the slope of the power spectrum, the top bound and the centroid of a magnetic layer composed of a horizontal (equivalent) layer were estimated. The basal depth of the magnetic source is:
Z t = 2 Z 0 Z b
The obtained basal depth of the magnetic source is assumed to be the Curie point depth. The obtained Curie point depth reflects the average value of the area. If magnetization in the Earth’s crust is arbitrarily and uncorrelatedly distributed, the mean azimuthal power spectrum can be employed to compute Zt and Zb by Equations (6)–(8).
Fourier’s law is a central relationship when considering conductive heat conveyance [53]. Fourier’s law assumes the following form in the 1-D case, supposing a vertical direction for temperature disparity and a constant temperature gradient dT/dz:
q = k d T d z
where q is labelled as the heat flux and k is the coefficient of thermal conductivity.
The Curie temperature (θ) can be well-defined as:
θ = d T d z z b
where Zb is the CPD, supposing there are no heat sources or heat sinks between the Earth’s surface and the CPD; and dT/dz is constant and the surface temperature is 0 °C. The authors of [53] proved that any particular depth to a thermal isotherm is in reverse proportion to heat flow. Equations (9) and (10) were used to calculate HF and GG values, which were based on CPD estimates derived from magnetic computations.
The magnetic data (Figure 2) from this investigation were segmented into 3021 spectral blocks (of 156.25 km2 each) with 50% overlap before generating a power spectrum plot for each block to map the varying sizes of geothermal anomalies and related structures in the subsurface. Related parameters, such as CPD, GG and HF, were acquired and subsequently gridded. The calculated geothermal parameters are presented in Supplementary Table S1.

4. Results

The Curie point depth (Figure 4) varied in the range of 6.0–8.0 km (red), 8.1–12.0 km (green), and 12.1–15.0 km (yellow) for the shallow, intermediate and deep geothermal sources, respectively. Regions (Figure 4) with a shallow CPD were related to areas characterized by granitoid intrusions, volcano-sedimentary sequences and intra-oceanic island arcs [44,56]. The GG map (Figure 5) delineated low (yellow), intermediate (green) and high (red) geothermal gradient zones with <60 °C/km, 61.0–82.5 °C/km and 83.5–100 °C/km, respectively. Furthermore, the HF map (Figure 6) indicated low (90–150 mW/m2), intermediate (151–210 mW/m2) and high (211–270 mW/m2), and they coincide with the results in Figure 5. The interconnected peak GG (Figure 5) and HF (Figure 6) regions match the locations of low CPD (Figure 4) characterized by intense seismic and tectonics activities [57]. Recent geoscience studies [11,36] have indicated that resources are reliant on tectonic events. The series of tectonic events associated with the Red Sea tectonics created a network of geologic structures (Figure 1). High concentrations of these geologic features in the vicinity of the Red Sea serve as movement and depositional pathways for Harrats [3], hydrothermal fluids and related minerals [58,59].

5. Discussions

The magnetic method is an essential geophysical tool commonly applied in reconnaissance geothermal energy assessments [29]. Many geoscience researchers have used this strategy to conduct reconnaissance investigations of geothermal energy sources [11,12,13,29,30,60,61]. The rocks in the study area, which exist in the neighbourhood of the Gulf of Aqaba/Dead Sea transform fault, rift-transform triple junction of the Red Sea and Gulf of Suez [62], have been extensively metamorphosed by the Red Sea tectonic events [57]. The investigated area is characterized by dike swarms, normal and oblique faults as well as poly-deformational phases of tensional and shearing regimes. The major zones of high magnetization (Figure 2) within the study location are observed to follow a trend in the NW–SE and E–W directions. Based on geological mapping, the regional faults, just as in the case of the Red Sea (Figure 1), are oriented mainly in the NW–SE direction. The central region and adjoining areas bordering the Red Sea are characterized by these faults, while the northern, north-western and south-eastern flanks of the study area are devoid of such geologic structures (Figure 1). The poly-deformational events associated with the Red Sea tectonic occurrences are interconnected with the geologic structures mapped onshore. Furthermore, volcanic activities have been reported in the study area [2]. Ref. [63] reported emanations of hydrochloride acid and sodium chloride in volcanoes. Similarly, [64,65] documented the volcanic source of brine. Brine fields in rift environments dominated by igneous intrusions have been observed in recent geoscience studies [2,58,59,66,67,68,69]. These igneous intrusions are commonly associated with hydrothermal fluids and are believed the be the main source of the salination of groundwater [31,57,58] witnessed in the KSA. In addition, the multifaceted geologic structures (that is, faults, fractures and fissures) of the study area created pathways for hydrothermal fluid migration as well as mineral deposition zones [32]. Recent geophysical reports, metallogenic investigations as well as geologic mapping have indicated that hydrothermal polymetallic mineral occurrences are linked to deep-seated granite pluton [20,70]. Hydrothermal processes are thought to have played a significant influence on brine formation in Nigeria’s rifted Benue Basin [31]. Inside and outside of rift settings characterized by extrusive and intrusive igneous rocks, hydrothermal fluid and hydrothermal circulation systems with high salinity dissolved minerals, such as lead, zinc, copper and gold, making them abundant [32]. Because of its vast hydrocarbon potential, geothermal anomalies, mineral deposits, complex tectonics and related geologic features, the KSA has recently become a focal point of geoscience research [4,70]. Geophysical explorations, geological field mapping, isotopic, hydro-geochemical and geomorphic structures, as well as tectonic and stratigraphic investigations in the KSA, revealed that economic minerals, such as gold, volcanogenic sulphides and epithermal precious and base metals, are strongly linked to tectonic settings, major fault systems, volcanoes and sedimentary series [57,71,72].
Furthermore, the investigated area is dominated by extensive plutonic igneous intrusions [57], and hence the geothermal resources are classified as low enthalpy, medium enthalpy (hot springs) and high enthalpy resources (harrats) [3]. In general, the dispensing surface temperatures and flow rates of thermal springs in KSA range from 31 to 96 °C and 5 to 20 L/m, respectively. In this study, regions characterized by a shallow Curie point depth (<8.0 km) (Figure 4) are characterized by a high geothermal gradient (83.5–100.0 °C/km) (Figure 5) as well as a high heat flow (211.0–270.0 mW/m2) (Figure 6), and are assumed to be possible geothermal zones [61]. The shallow CPD zones (<8.0 km) well-defined by spikes (Figure 7a) correlate positively with the localities of peak GG (Figure 7b and HF (Figure 7c). Based on the previous findings of [30,61], probable geothermal anomalies are defined by a low Curie point depth coexistent with a high heat flow and temperature gradient. In general, the geothermal structures are oriented the E–W direction (Figure 4, Figure 5 and Figure 6), and they are controlled majorly by the E–W oblique-slip faults [57]. However, previous geophysical reports have indicated that they are other major geothermal structures that follow the NW–SE and NE–SW directions [72] within the KSA. The NW–SE geothermal structures assumed the direction of the Red Sea and regional geologic structures (Figure 1). Nonetheless, the E–W-oriented geothermal anomalies mapped in this investigation have a direct linkage with the Red Sea tectonics. In general, the geothermal structures caused by harrats that occur at the southwest, western and north-western portions of the research area are the related tectonic opening of the Red Sea/Gulf of the Suez Rift in this area [72]. Other sources are from unconfined hot springs with a direct connection to hot subsurface anomalies through an open network of active faults and fractures as well as high enthalpy from radioactive elements of pre- and post-orogenic granite [57]. Furthermore, comprehensive geophysical exploration involving seismic reflection, bottom-hole temperature (BHT), transient electromagnetic (TEM) or magnetotelluric methods is required especially at the volcanic eruption regions, to assess the country’s economic reserves of geothermal resources for complementary energy production.

6. Conclusions

In the Kingdom of Saudi Arabia, a geothermal reconnaissance investigation was conducted using downward continued Magsat-generated magnetic data flown by NASA. The Curie point depth, geothermal gradient and heat flow estimated values were computed and gridded in this study. This study’s Curie depths, geothermal gradient and heat flow were in the range of 6.0–15.0 km, 40.0–100.0 °C/km and 90.0–270.0 mW/m2, respectively. The positions of the shallow Curie point depth (6.0–8.0 km) coincided with the placement of a high geothermal gradient (83.5–100.0 °C/km) and HF (211.0–270.0 mW/m2). These geothermal systems have a direct association with the bordering Red Sea tectonic events. Additionally, the tectonic opening of the Red Sea/Gulf of Suez Rift, hot springs with direct links to hot subsurface anomalies and high enthalpy from radioactive components in pre- and post-orogenic granite are all causal factors. Regardless of the successful delineation of geothermal structures, additional research involving the integration of deep boreholes and seismic, magnetotelluric, electromagnetic and geochemical data should be conducted in order to further evaluate and properly estimate the economic reserves of geothermal resources.

Supplementary Materials

The following supporting information can be downloaded at: https://www.mdpi.com/article/10.3390/min13050694/s1. Table S1: Calculated geothermal parameters obtained from magnetic data.

Author Contributions

Conceptualization, A.M.E. and S.E.E.; methodology, C.A.U.; software, A.E.A.; validation, C.A.U., A.M.E. and A.E.A.; formal analysis, A.M.E.; investigation, A.E.A.; resources, K.A.; data curation, C.A.U.; writing—original draft preparation, A.M.E. and C.A.U.; writing—review and editing, K.A., N.A.-O., B.Y.H. and S.A.H.; visualization, P.A. and K.A.; supervision, S.E.E.; project administration, C.A.U.; funding acquisition, K.A. and N.A.-O. All authors have read and agreed to the published version of the manuscript.

Funding

The authors extend their appreciation to the Deputyship for Research and Innovation, “Ministry of Education” in Saudi Arabia for funding this research (IFKSUOR3-192-2).

Data Availability Statement

Not applicable.

Acknowledgments

The authors would like to thank two anonymous reviewers for their comments and suggestions. The authors are much obliged to the Minerals Journal proofreading team for handling the work, sending reviews, and preparing the proof.

Conflicts of Interest

The authors declare no conflict of interest.

References

  1. El-Isa, Z.H.; Shanti, A.A. Seismicity and Tectonics of the Red Sea and Western Arabia. Geophys. J. Int. 1989, 97, 449–457. [Google Scholar] [CrossRef]
  2. Eldosouky, A.M.; El-Qassas, R.A.Y.; Pham, L.T.; Abdelrahman, K.; Alhumimidi, M.S.; El Bahrawy, A.; Mickus, K.; Sehsah, H. Mapping Main Structures and Related Mineralization of the Arabian Shield (Saudi Arabia) Using Sharp Edge Detector of Transformed Gravity Data. Minerals 2022, 12, 71. [Google Scholar] [CrossRef]
  3. Lashin, A.; Al Arifi, N.; Chandrasekharam, D.; Al Bassam, A.; Rehman, S.; Pipan, M. Geothermal Energy Resources of Saudi Arabia: Country Update. In Proceedings of the World Geothermal Congress, Melbourne, Australia, 19–25 April 2015. [Google Scholar]
  4. Surour, A.A.; Bakhsh, R. Microfabrics and microchemistry of sulfide ores from the 640 FW-E level at the Al Amar gold mine, Saudi Arabia. J. Microsc. Ultrastruct. 2013, 1, 96–110. [Google Scholar] [CrossRef]
  5. Mercier-Langevin, P.; Hannington, M.D.; Dubé, B.; Bécu, V. The goldcontent of volcanogenic massive sulfide de-posits. Miner. Deposita 2011, 46, 509–539. [Google Scholar] [CrossRef]
  6. Al Shanti, A.M.S. Mineral Deposits of the Kingdom of Saudi Arabia; Scientific Publication Center King Abdulaziz University: Jeddah, Saudi Arabia, 2009. [Google Scholar]
  7. Harbi, H.M.; Eldougdoug, A.A.; Al Jahdli, N.S. Evolution of the ArabianShield and associated mineralizations with emphasis on gold mineralization. In Proceedings of the 9th Arab Conference for Mineral Resources, Jeddah, Saudi Arabia, 30 October–1 November 2006. [Google Scholar]
  8. Salem, A.; Ali, M.Y. Mapping basement structures in the northwestern offshore of Abu Dhabi from high-resolution aeromagnetic data. Geophys. Prospect. 2015, 64, 726–740. [Google Scholar] [CrossRef]
  9. Lashin, A.; Chandrasekharam, D.; Al Bassam, A.; Al Arifi, N.; Rehman, S.; Al Faifi, H. A review of the Geothermal Resources of Saudi Arabia: 2015-2020. In Proceedings of the World Geothermal Congress, Reykjavik, Iceland, 27 April–1 May 2020. [Google Scholar]
  10. Rehman, S.; Shash, A. Geothermal Resources of Saudi Arabia—Country Update Report. In Proceedings of the World Geo-thermal Congress, Antalya, Turkey, 24–29 April 2005. [Google Scholar]
  11. Ejiga, E.G.; Yusoff, I.; Ismail, N.E.H.; Kumar, R. Geothermal energy assessment through the Curie point depth, geothermal gradient, and heat flow around the Akiri hot spring region in Central Nigeria. Environ. Earth Sci. 2022, 81, 115. [Google Scholar] [CrossRef]
  12. Abdullahi, M.; Kumar, R. Curie depth estimated from high-resolution aeromagnetic data of parts of lower and middle Benue trough (Nigeria). Acta Geod. Et Geophys. 2020, 55, 627–643. [Google Scholar] [CrossRef]
  13. Abraham, E.M.; Obande, E.G.; Chukwu, M.; Chukwu, C.G.; Onwe, M.R. Estimating depth to the bottom of magnetic sources at Wikki Warm Spring region, northeastern Nigeria, using fractal distribution of sources approach. Turk. J. Earth Sci. 2015, 24, 494–512. [Google Scholar] [CrossRef]
  14. Mariita, N.O. Application of geophysical methods to geothermal energy exploration in Kenya. In Proceedings of the Short Course V on Exploration for Geothermal Resources, organized by UNU-GTP, GDC and KenGen, at Lake Bogoria and Lake Naivasha, Naivasha, Kenya, 29 October–19 November 2010. [Google Scholar]
  15. Ben, U.C.; Mbonu, C.C.; Thompson, C.E.; Ekwok, S.E.; Akpan, A.E.; Akpabio, I.; Eldosouky, A.M.; Abdelrahman, K.; Alzahrani, H.; Gómez-Ortiz, D.; et al. Investigating the applicability of the social spider optimization for the inversion of magnetic anomalies caused by dykes. J. King Saud Univ. Sci. 2023, 35, 102569. [Google Scholar] [CrossRef]
  16. Eldosouky, A.M.; Ekwok, S.E.; Akpan, A.E.; Achadu, O.-I.M.; Pham, L.T.; Abdelrahman, K.; Gómez-Ortiz, D.; Alarifi, S.S. Delineation of structural lineaments of Southeast Nigeria using high resolution aeromagnetic data. Open Geosci. 2022, 14, 331–340. [Google Scholar] [CrossRef]
  17. Ben, U.C.; Ekwok, S.E.; Achadu, O.-I.M.; Akpan, A.E.; Eldosouky, A.M.; Abdelrahman, K.; Gómez-Ortiz, D. A Novel Method for Estimating Model Parameters From Geophysical Anomalies of Structural Faults Using the Manta-Ray Foraging Optimization. Front. Earth Sci. 2022, 10, 870299. [Google Scholar] [CrossRef]
  18. Ben, U.C.; Ekwok, S.E.; Akpan, A.E.; Mbonu, C.C.; Eldosouky, A.M.; Abdelrahman, K.; Gómez-Ortiz, D. Interpretation of Magnetic Anomalies by Simple Geometrical Structures Using the Manta-Ray Foraging Optimization. Front. Earth Sci. 2022, 10, 849079. [Google Scholar] [CrossRef]
  19. Ekwok, S.E.; Akpan, A.E.; Ebong, D.E. Enhancement and modelling of aeromagnetic data of some inland basins, southeastern Nigeria. J. Afr. Earth Sci. 2019, 155, 43–53. [Google Scholar] [CrossRef]
  20. Ekwok, S.E.; Akpan, A.E.; Achadu, O.-I.M.; Eze, O.E. Structural and lithological interpretation of aero-geophysical data in parts of the Lower Benue Trough and Obudu Plateau, southeast Nigeria. Adv. Space Res. 2021, 68, 2841–2854. [Google Scholar] [CrossRef]
  21. Ekwok, S.E.; Akpan, A.E.; Ebong, E.D.; Eze, O.E. Assessment of depth to magnetic sources using high resolution aeromagnetic data of some parts of the Lower Benue Trough and adjoining areas, Southeast Nigeria. Adv. Space Res. 2021, 67, 2104–2119. [Google Scholar] [CrossRef]
  22. Ekwok, S.E.; Akpan, A.E.; Ebong, E.D. Assessment of crustal structures by gravity and magnetic methods in the Calabar Flank and adjoining areas of Southeastern Nigeria—A case study. Arab. J. Geosci. 2021, 14, 308. [Google Scholar] [CrossRef]
  23. Moghaddam, M.M.; Mirzaei, S.; Nouraliee, J.; Porkhial, S. Integrated magnetic and gravity surveys for geothermal exploration in Central Iran. Arab. J. Geosci. 2016, 9, 506. [Google Scholar] [CrossRef]
  24. Hassanein, H.I.E.; Soliman, K.S. Aeromagnetic Data Interpretation of Wadi Hawashiya Area for Identifying Surface and Subsurface Structures, North Eastern Desert, Egypt. J. KAU Earth Sci. 2009, 20, 117–139. [Google Scholar]
  25. Beckett, K.A. Airborne Geophysics Applied to Groundwater Modelling. In Advances in Regolith; Roach, I.C., Ed.; Cooperative Research Centre for Landscape Environments and Mineral Exploration: Bentley, WA, USA, 2003; pp. 8–10. [Google Scholar]
  26. Eldosouky, A.M.; Elkhateeb, S.O. Texture analysis of aeromagnetic data for enhancing geologic features using co-occurrence matrices in Elallaqi area, South Eastern Desert of Egypt. NRIAG J. Astron. Geophys. 2018, 7, 155–161. [Google Scholar] [CrossRef]
  27. Essa, K.S.; Elhussein, M. PSO (Particle Swarm Optimization) for Interpretation of Magnetic Anomalies Caused by Simple Geometrical Structures. Pure Appl. Geophys. 2018, 175, 3539–3553. [Google Scholar] [CrossRef]
  28. Telford, W.; Gelbert, I.; Sheritt, R. Applied Geophysics, 2nd ed.; Cambridge University Press: London, UK, 1990. [Google Scholar]
  29. Represas, P.; Santos, F.A.; Ribeiro, J.; Ribeiro, J.A.; Almeida, E.P.; Gonçalves, R.; Moreira, M.; Mendes-Victor, L.A. Interpretation of gravity data to delineate structural features connected to low-temperature geothermal resources at Northeastern Portugal. J. Appl. Geophys. 2013, 92, 30–38. [Google Scholar] [CrossRef]
  30. Alfaifi, H.J.; Ekwok, S.E.; Ulem, C.A.; Eldosouky, A.M.; Qaysi, S.; Abdelrahman, K.; Andráš, P.; Akpan, A.E. Explor-atory assessment of geothermal resources in some parts of the Middle Benue Trough of Nigeria using airborne potential field data. J. King Saud Univ. Sci. 2023, 35, 102521. [Google Scholar] [CrossRef]
  31. Ekwok, S.E.; Akpan, A.E.; Achadu, O.-I.M.; Thompson, C.E.; Eldosouky, A.M.; Abdelrahman, K.; Andráš, P. Towards understanding the source of brine mineralization in Southeast Nigeria: Evidence from high-resolution airborne magnetic and gravity data. Minerals 2022, 12, 146. [Google Scholar] [CrossRef]
  32. Ekwok, S.E.; Akpan, A.E.; Achadu, O.-I.M.; Ulem, C.A. Implications of tectonic anomalies from potential field data in some parts of Southeast Nigeria. Environ. Earth Sci. 2021, 81, 6. [Google Scholar] [CrossRef]
  33. Ekwok, S.E.; Achadu, O.-I.M.; Akpan, A.E.; Eldosouky, A.M.; Ufuafuonye, C.H.; Abdelrahman, K.; Gómez-Ortiz, D. Depth Estimation of Sedimentary Sections and Basement Rocks in the Bornu Basin, Northeast Nigeria Using High-Resolution Airborne Magnetic Data. Minerals 2022, 12, 285. [Google Scholar] [CrossRef]
  34. Ekwok, S.E.; Akpan, A.E.; Kudamnya, E.A. Exploratory mapping of structures controlling mineralization in Southeast Nigeria using high resolution airborne magnetic data. J. Afr. Earth Sci. 2020, 162, 103700. [Google Scholar] [CrossRef]
  35. Ekwok, S.E.; Akpan, A.E.; Kudamnya, E.A.; Ebong, E.D. Assessment of groundwater potential using geophysical data: A case study in parts of Cross River State, south-eastern Nigeria. Appl. Water Sci. 2020, 10, 144. [Google Scholar] [CrossRef]
  36. Abraham, E.; Itumoh, O.; Chukwu, C.; Rock, O. Geothermal Energy Reconnaissance of Southeastern Nigeria from Analysis of Aeromagnetic and Gravity Data. Pure Appl. Geophys. 2019, 176, 1615–1638. [Google Scholar] [CrossRef]
  37. Hinze, W.J.; Zietz, J. The composite magnetic anomaly map of the conterminous United States. In The Utility of Regional Gravity and Magnetic Anomaly Maps; Society of Exploration Geophysicists: Tulsa, Oklahoma, 1985. [Google Scholar]
  38. Ravat, D.N.; Hinze, W.J.; von Frese, R.R.B. Analysis of MAGSAT magnetic contrasts across Africa and South America. Tectonophysics 1992, 212, 59–76. [Google Scholar] [CrossRef]
  39. Von Frese, R.; Hinze, W.J.; Olivier, R.; Bentley, C.R. Regional magnetic anomaly constraints on continental breakup. Geology 1986, 14, 68–71. [Google Scholar] [CrossRef]
  40. Toft, P.B.; Arkani-Hamed, J. Magnetization of the Pacific Ocean lithosphere deduced from Magsat data. J. Geophys. Res. Atmos. 1992, 97, 4387–4406. [Google Scholar] [CrossRef]
  41. Hinze, W.; von Frese, R.R.B.; Ravat, D.N. Mean magnetic contrasts between oceans and continents. Tectonophysics 1991, 192, 117–127. [Google Scholar] [CrossRef]
  42. Kim, H.R.; von Frese, R.R.B.; Golynsky, A.V.; Taylor, P.T.; Kim, J.W. Application of satellite magnetic observations for estimating near-surface magnetic anomalies. Earth Planets Space 2004, 56, 955–966. [Google Scholar] [CrossRef]
  43. Johnson, P.R. Proterozoic Geology of Western Saudi Arabia—Southern Sheet, Saudi Geological Survey; Library U.S. Bureau of mines western field operation center east 360 3rd Ave. Spokane: Washington, DC, USA, 2000.
  44. Stern, R.J.; Johnson, P. Continental lithosphere of the Arabian Plate: A geologic, petrologic, and geophysical synthesis. Earth Sci. Rev. 2010, 101, 29–67. [Google Scholar] [CrossRef]
  45. Stern, R.J. Neoproterozoic formation and evolution of Eastern Desert continental crust—The importance of the infra-structure superstructure transition. J. Afr. Earth Sci. 2017, 146, 15–27. [Google Scholar] [CrossRef]
  46. Laboun, A.A. The Paleozoic Geology of Saudi Arabia: History, Tectono-Stratigraphy, Glaciations, and Natural Resources. In The Structural Geology Contribution to the Africa-Eurasia Geology: Basement and Reservoir Structure, Ore Mineralisation and Tectonic Modellin; Springer: Berlin/Heidelberg, Germany, 2019; pp. 99–103. [Google Scholar]
  47. Johnson, P.; Andresen, A.; Collins, A.; Fowler, A.; Fritz, H.; Ghebreab, W.; Kusky, T.; Stern, R. Late Cryogenian–Ediacaran history of the Arabian–Nubian Shield: A review of depositional, plutonic, structural, and tectonic events in the closing stages of the northern East African Orogen. J. Afr. Earth Sci. 2011, 61, 167–232. [Google Scholar] [CrossRef]
  48. Brown, G.F. Eastern margin of the Red Sea and the coastal structures in Saudi Arabia. Philos. Trans. R. Soc. London. Ser. A Math. Phys. Sci. 1970, 267, 75–87. [Google Scholar]
  49. Stewart, S.A. Structural geology of the Rub’ Al-Khali Basin, Saudi Arabia. Tectonics 2016, 35, 2417–2438. [Google Scholar] [CrossRef]
  50. Le-Nindre, Y.-M.; Vaslet, D.; Le-Metour, J.; Bertrand, J.; Halawani, M. Subsidence modelling of the Arabian platform from Permian to Paleogene outcrops. Sediment. Geol. 2003, 156, 263–285. [Google Scholar] [CrossRef]
  51. Oasis Montaj, version 7.0. Mapping and Processing System. The Core Software Platform for Working with Large Volume Spatial Data. Geosoft Inc.: Ontorio, ON, Canada, 2008; 50–150.
  52. Tanaka, A. Global Centroid Distribution of Magnetized Layer From World Digital Magnetic Anomaly Map. Tectonics 2017, 36, 3248–3253. [Google Scholar] [CrossRef]
  53. Bhattacharyya, B.K.; Leu, L.-K. Spectral analysis of gravity and magnetic anomalies due to two-dimensional structures. Geophysics 1975, 40, 993–1013. [Google Scholar] [CrossRef]
  54. Spector, A.; Grant, F.S. Statistical models for interpreting aeromagnetic data. Geophysics 1970, 35, 293–302. [Google Scholar] [CrossRef]
  55. Shuey, R.T.; Schellinger, D.K.; Tripp, A.C.; Alley, L.B. Curie depth determination from aeromagnetic spectra. Geophys. J. R. Astron. Soc. 1977, 50, 75–101. [Google Scholar] [CrossRef]
  56. Johnson, P.R.; Woldehaimanot, B. Development of the Arabian-Nubian Shield: Perspectives on Accretion and De-Formation in the East African Orogen and the Assembly of Gondwana; Proterozoic East Gondwana: Supercontinent assembly and breakup; Yoshida, M., Windley, B.F., Dasgupta, S., Eds.; Geological Society, London, Special Publications: Bath, UK, 2003; pp. 289–325. [Google Scholar]
  57. Haredy, R.; Aboulela, H.; El-Shafei, M. Tectonic setting and seismicity of the Ras Alsheikh Hamid area, northern Red Sea, Saudi Arabia. Arab. J. Geosci. 2019, 12, 769. [Google Scholar] [CrossRef]
  58. Mineral Resources of the Western US. The Teacher-Friendly Guide to the Earth Scientist of the Western US. 2017. Available online: http://geology.Teacherfriendlyguide.Org/index.php/mineral-w (accessed on 1 December 2014).
  59. Xu, K.; Yu, B.; Gong, H.; Ruan, Z.; Pan, Y.; Ren, Y. Carbonate reservoirs modified by magmatic intrusions in the Bachu area, Tarim Basin, NW China. Geosci. Front. 2015, 6, 779–790. [Google Scholar] [CrossRef]
  60. Tanaka, A.; Okubo, Y.; Matsubayashi, O. Curie point depth based on spectrum analysis of the magnetic anomaly data in East and Southeast Asia. Tectonophysics 1999, 306, 461–470. [Google Scholar] [CrossRef]
  61. Bansal, A.R.; Gabriel, G.; Dimri, V.P.; Krawczyk, C.M. Estimation of the depth to the bottom of magnetic sources by a modified centroid method for fractal distribution of sources: An application to aeromagnetic data in Germany. Geophysics 2011, 76, L11–L22. [Google Scholar] [CrossRef]
  62. Aboulela, H.A.; Aboud, E.; Bantan, R.A. Seismicity and major geologic structures of Tiran and Sanafir islands and their surroundings in the Red Sea. Environ. Earth Sci. 2017, 76, 793. [Google Scholar] [CrossRef]
  63. Daubeny, C. A Description of Active and Extinct Volcanos; Cambridge University Press: Cambridge, UK, 2014; pp. 168–172. [Google Scholar] [CrossRef]
  64. Ballaert, W. Origin of Salt Deposits. Proc. Brit. Assoc. Adv. Sci., part 2, 100. 1852. Available online: https://www.michigan.gov/-/media/Project/Websites/egle/Documents/Programs/OGMD/Catalog/13/PU-15-Aopt.pdf?rev=dff3b057974649418829946d927289da (accessed on 16 May 2023).
  65. Darwin, C. The Structure and Distribution of Coral Reefs. Being the First Part of the Geology of the Voyage of the Beagle, under the Command of Capt. Fitzroy, R.N. During the Years 1832 to 1836; Smith Elder and Co. Geological Observations: London, UK, 1842; Volume 3, p. 235. [Google Scholar]
  66. Blundy, J.; Mavrogenes, J.; Tattitch, B.; Sparks, S.; Gilmer, A. Generation of porphyry copper deposits by gas–brine reaction in volcanic arcs. Nat. Geosci. 2015, 8, 235–240. [Google Scholar] [CrossRef]
  67. Dill, H.G.; Botz, R.; Berner, Z.; Hamad, A.B.A. The origin of pre- and synrift, hypogene Fe-P mineralization during the Cenozoic along the Dead Sea Transform Fault, Northwest Jordan. Econ. Geol. 2010, 105, 1301–1319. [Google Scholar] [CrossRef]
  68. Risacher, F.; Alonso, H.; Salazar, C. The origin of brines and salts in Chilean salars: A hydrochemical review. Earth Sci. Rev. 2003, 63, 249–293. [Google Scholar] [CrossRef]
  69. Sharma, R.; Srivastava, P.K. Hydrothermal fluids of magmatic origin. In Modelling of Magmatic and Allied Processes, Society of Earth Scientists Series; Springer: Berlin/Heidelberg, Germany, 2014. [Google Scholar] [CrossRef]
  70. Gandhi, S.S.; Prasad, N.; Charbonneau, B.W. Geological and geophysical signatures of a large polymetallic exploration target at Lou Lake, southern Great Bear magmatic zone, Northwest Territories. In Current Research; Geological Survey of Canada: Ottawa, ON, Canada, 1996; pp. 147–158. [Google Scholar] [CrossRef]
  71. Johnson, P.; Zoheir, B.; Ghebreab, W.; Stern, R.; Barrie, C.; Hamer, R. Gold-bearing volcanogenic massive sulfides and orogenic-gold deposits in the Nubian Shield. S. Afr. J. Geol. 2017, 120, 63–76. [Google Scholar] [CrossRef]
  72. Lashin, A. A preliminary study on the potential of the geothermal resources around the Gulf of Suez, Egypt. Arab. J. Geosci. 2013, 6, 2807–2828. [Google Scholar] [CrossRef]
Figure 2. Satellite-generated total magnetic intensity anomaly map.
Minerals 13 00694 g002
Figure 3. Representative spectral plot of the study area.
Minerals 13 00694 g003
Figure 4. Curie point depth map.
Minerals 13 00694 g004
Figure 5. Gradient map.
Minerals 13 00694 g005
Figure 6. Heat flow map.
Minerals 13 00694 g006
Figure 7. Three-dimensional representation of (a) Curie point depth, (b) geothermal gradient and (c) heat flow maps.
Minerals 13 00694 g007
Disclaimer/Publisher’s Note: The statements, opinions and data contained in all publications are solely those of the individual author(s) and contributor(s) and not of MDPI and/or the editor(s). MDPI and/or the editor(s) disclaim responsibility for any injury to people or property resulting from any ideas, methods, instructions or products referred to in the content.

