
Characterization of an Amazon Soil Profile by Laser-Induced Breakdown, Raman, and Fluorescence Spectroscopies

 , ,
, , 
Abstract
:1. Introduction
2. Materials and Methods
2.1. Soil Samples
2.2. Laser-Induced Breakdown Spectroscopy
2.3. Raman Spectroscopy
2.4. Fluorescence Spectroscopy and Fluorescence Lifetime
3. Results and Discussion
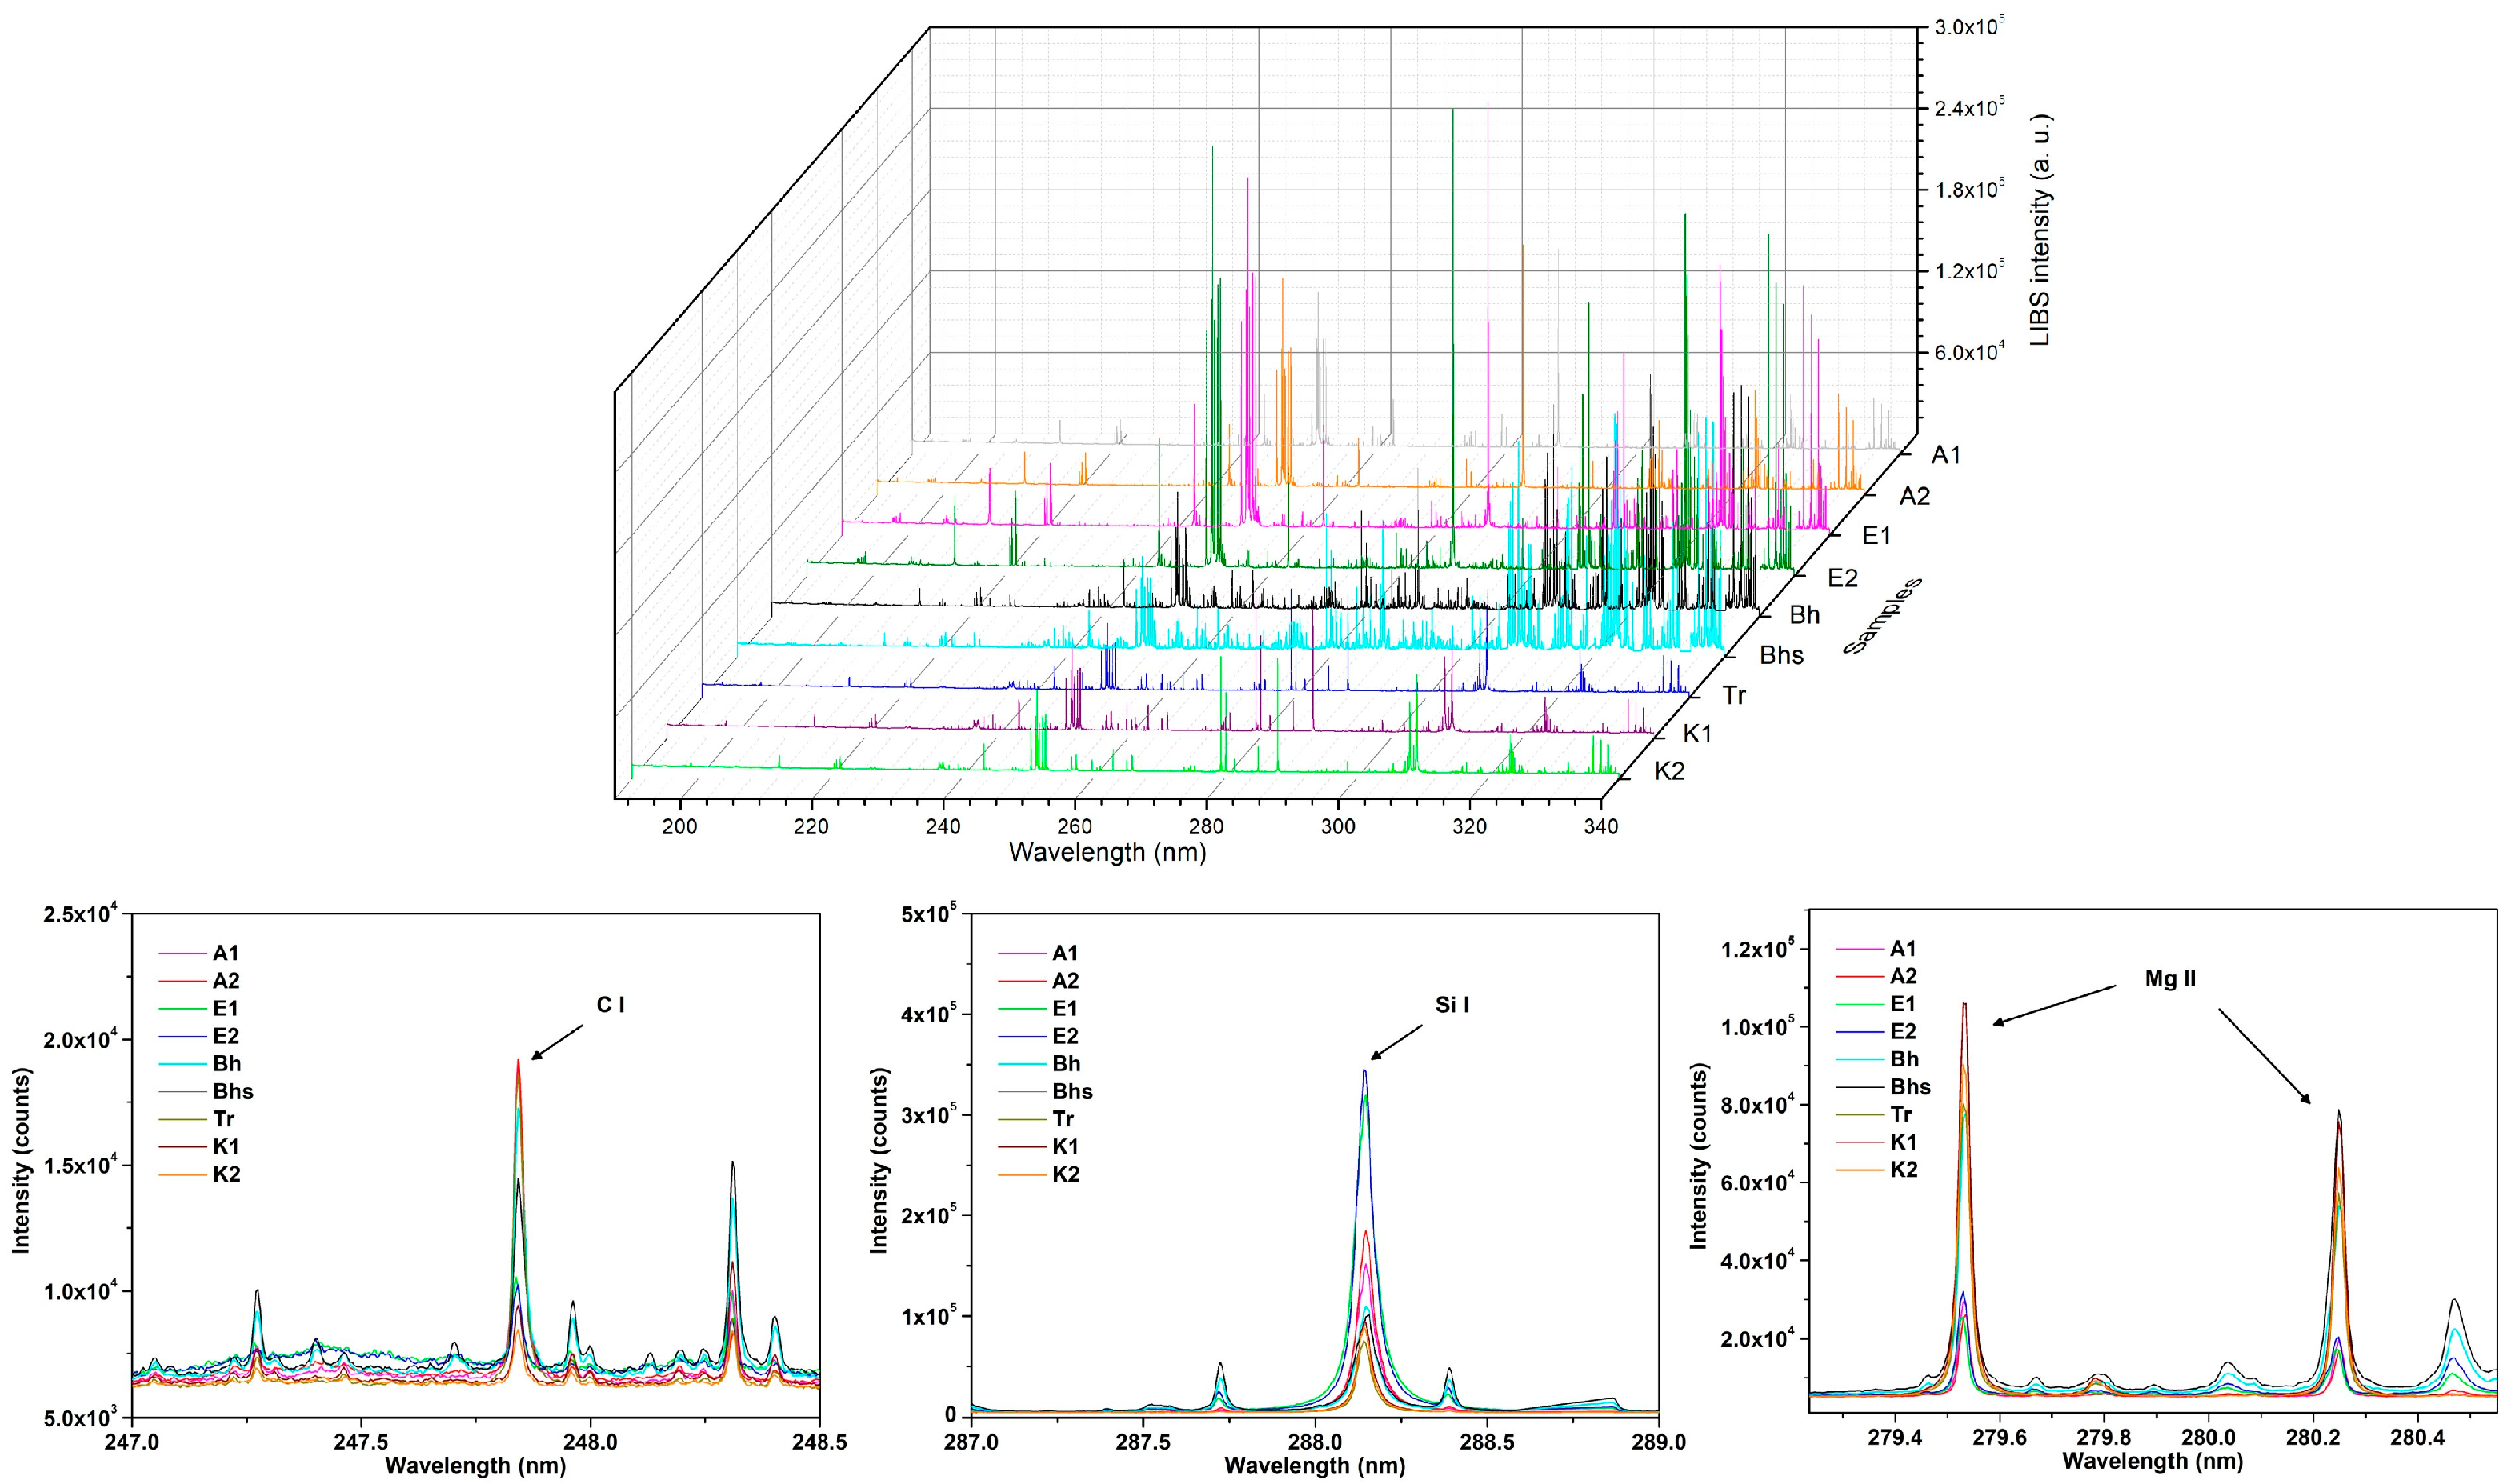
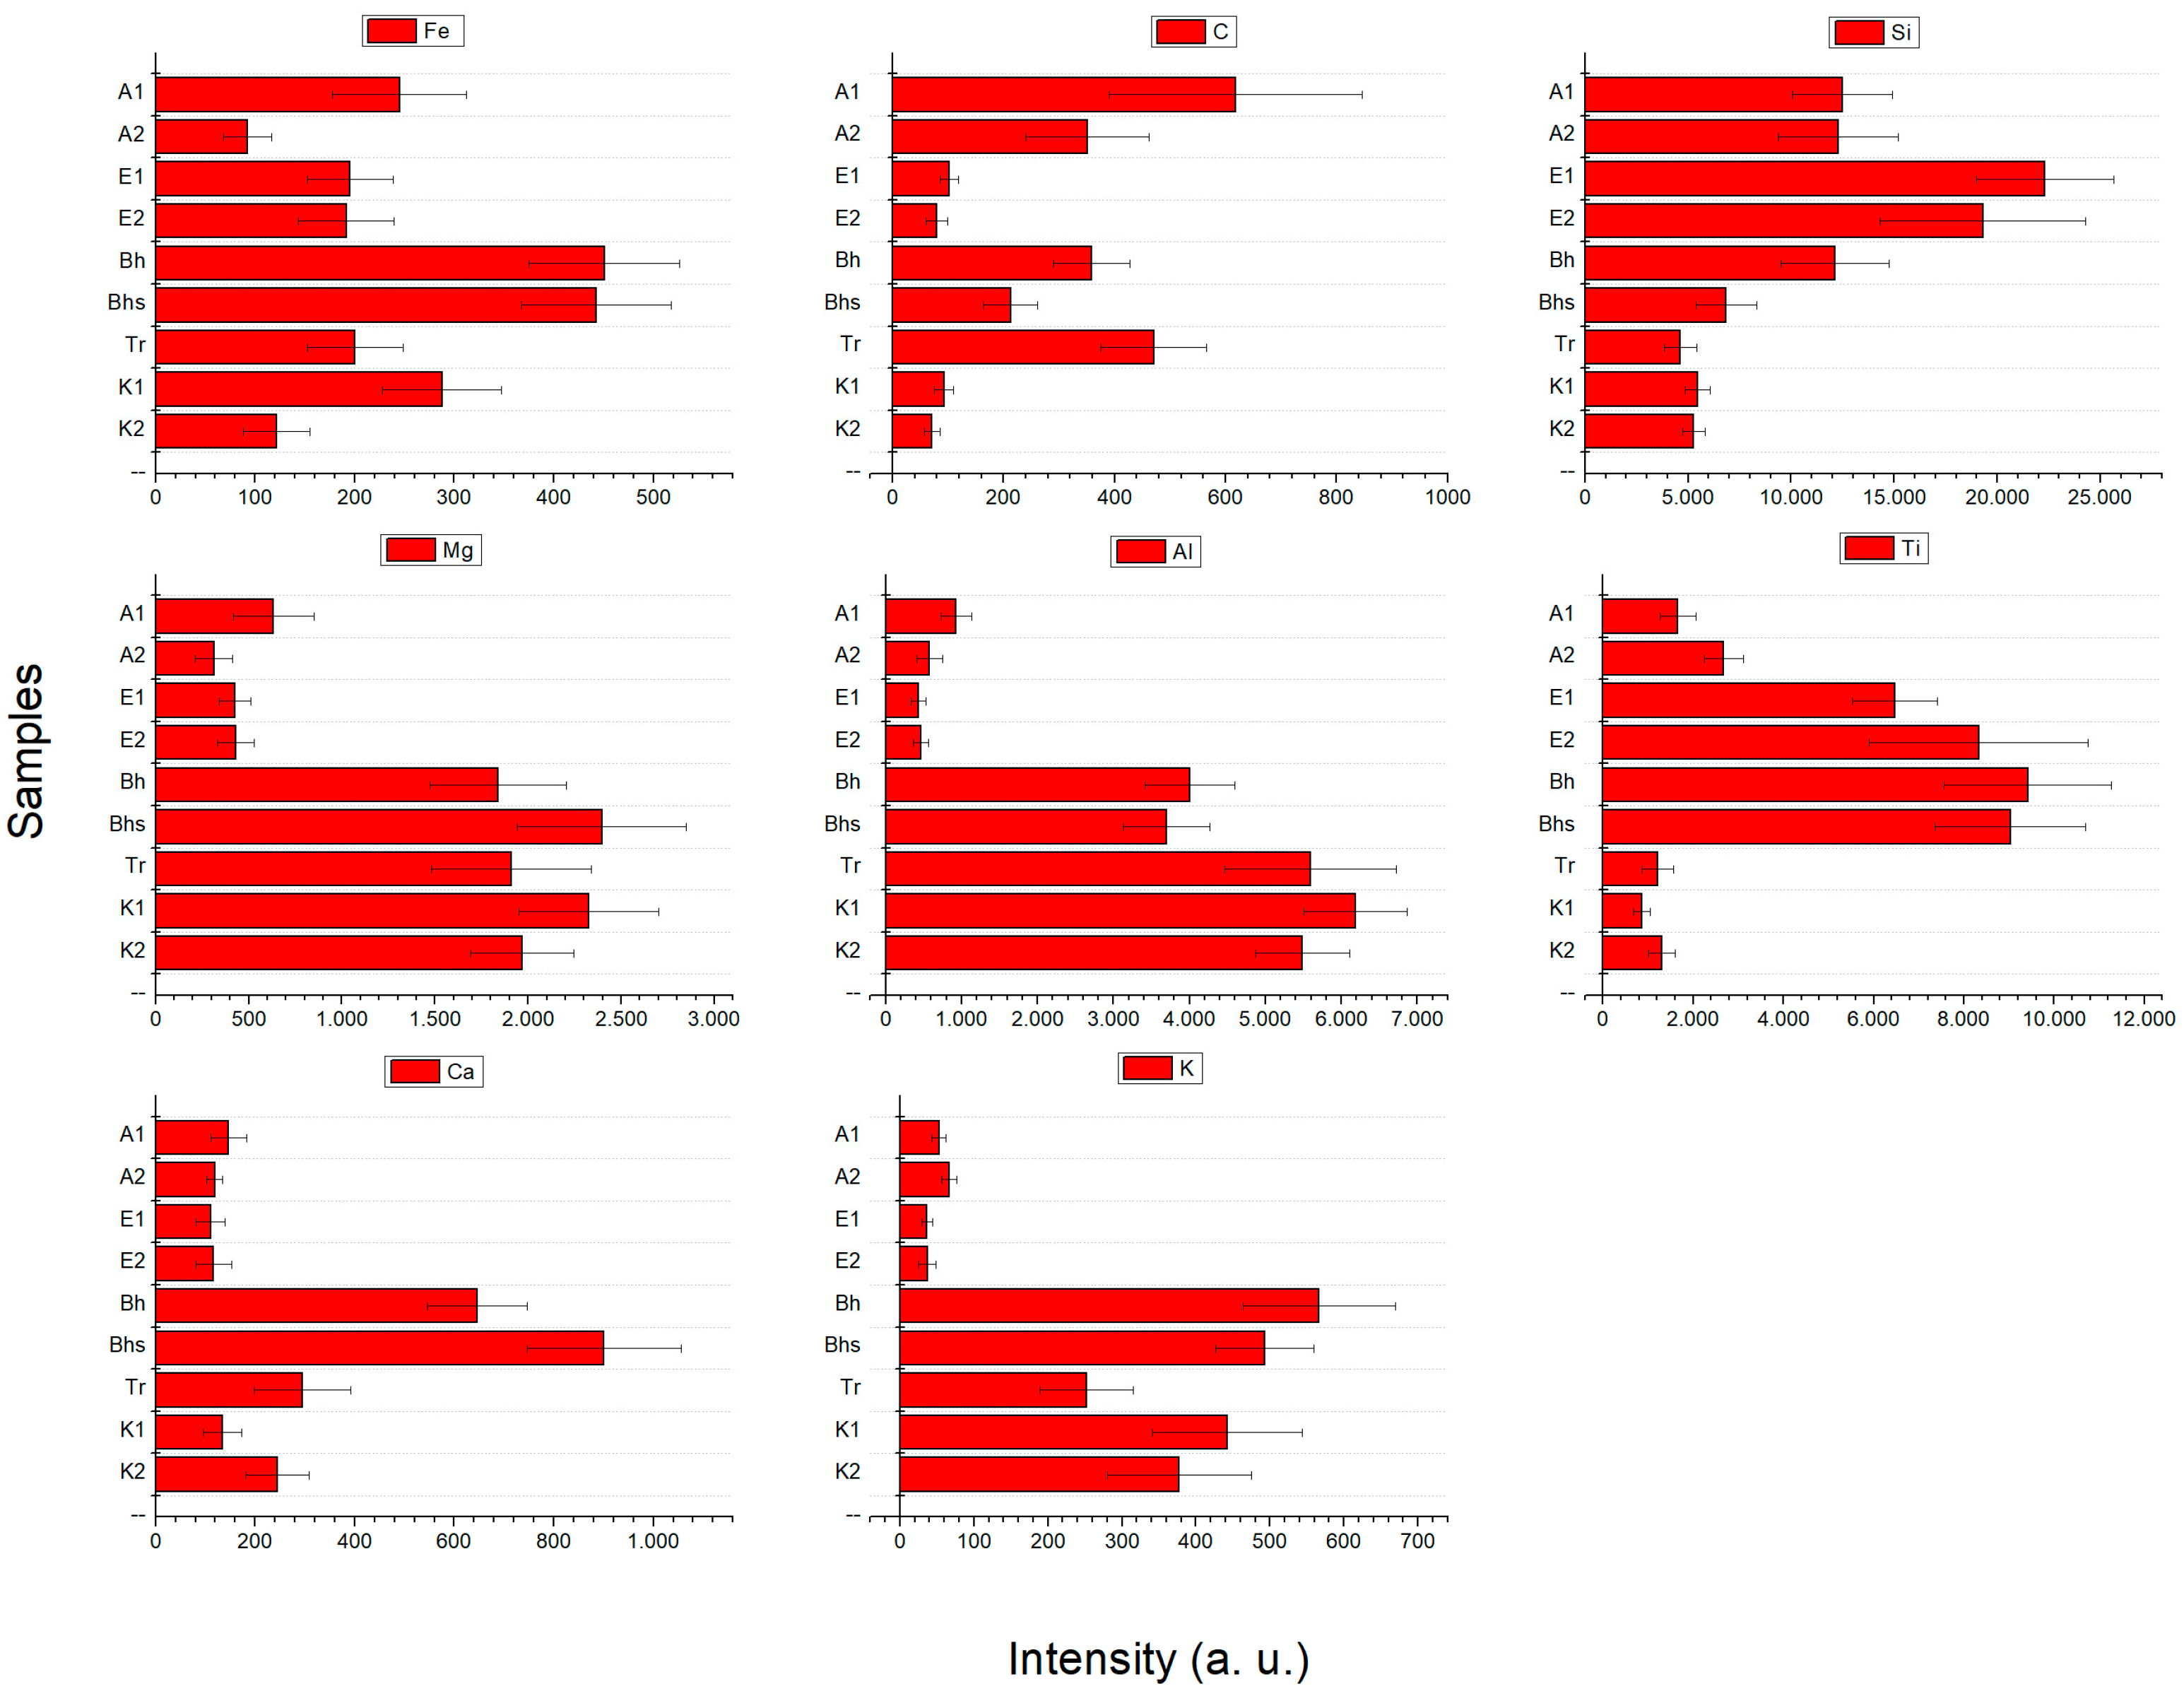
3.1. LIBS Spectra
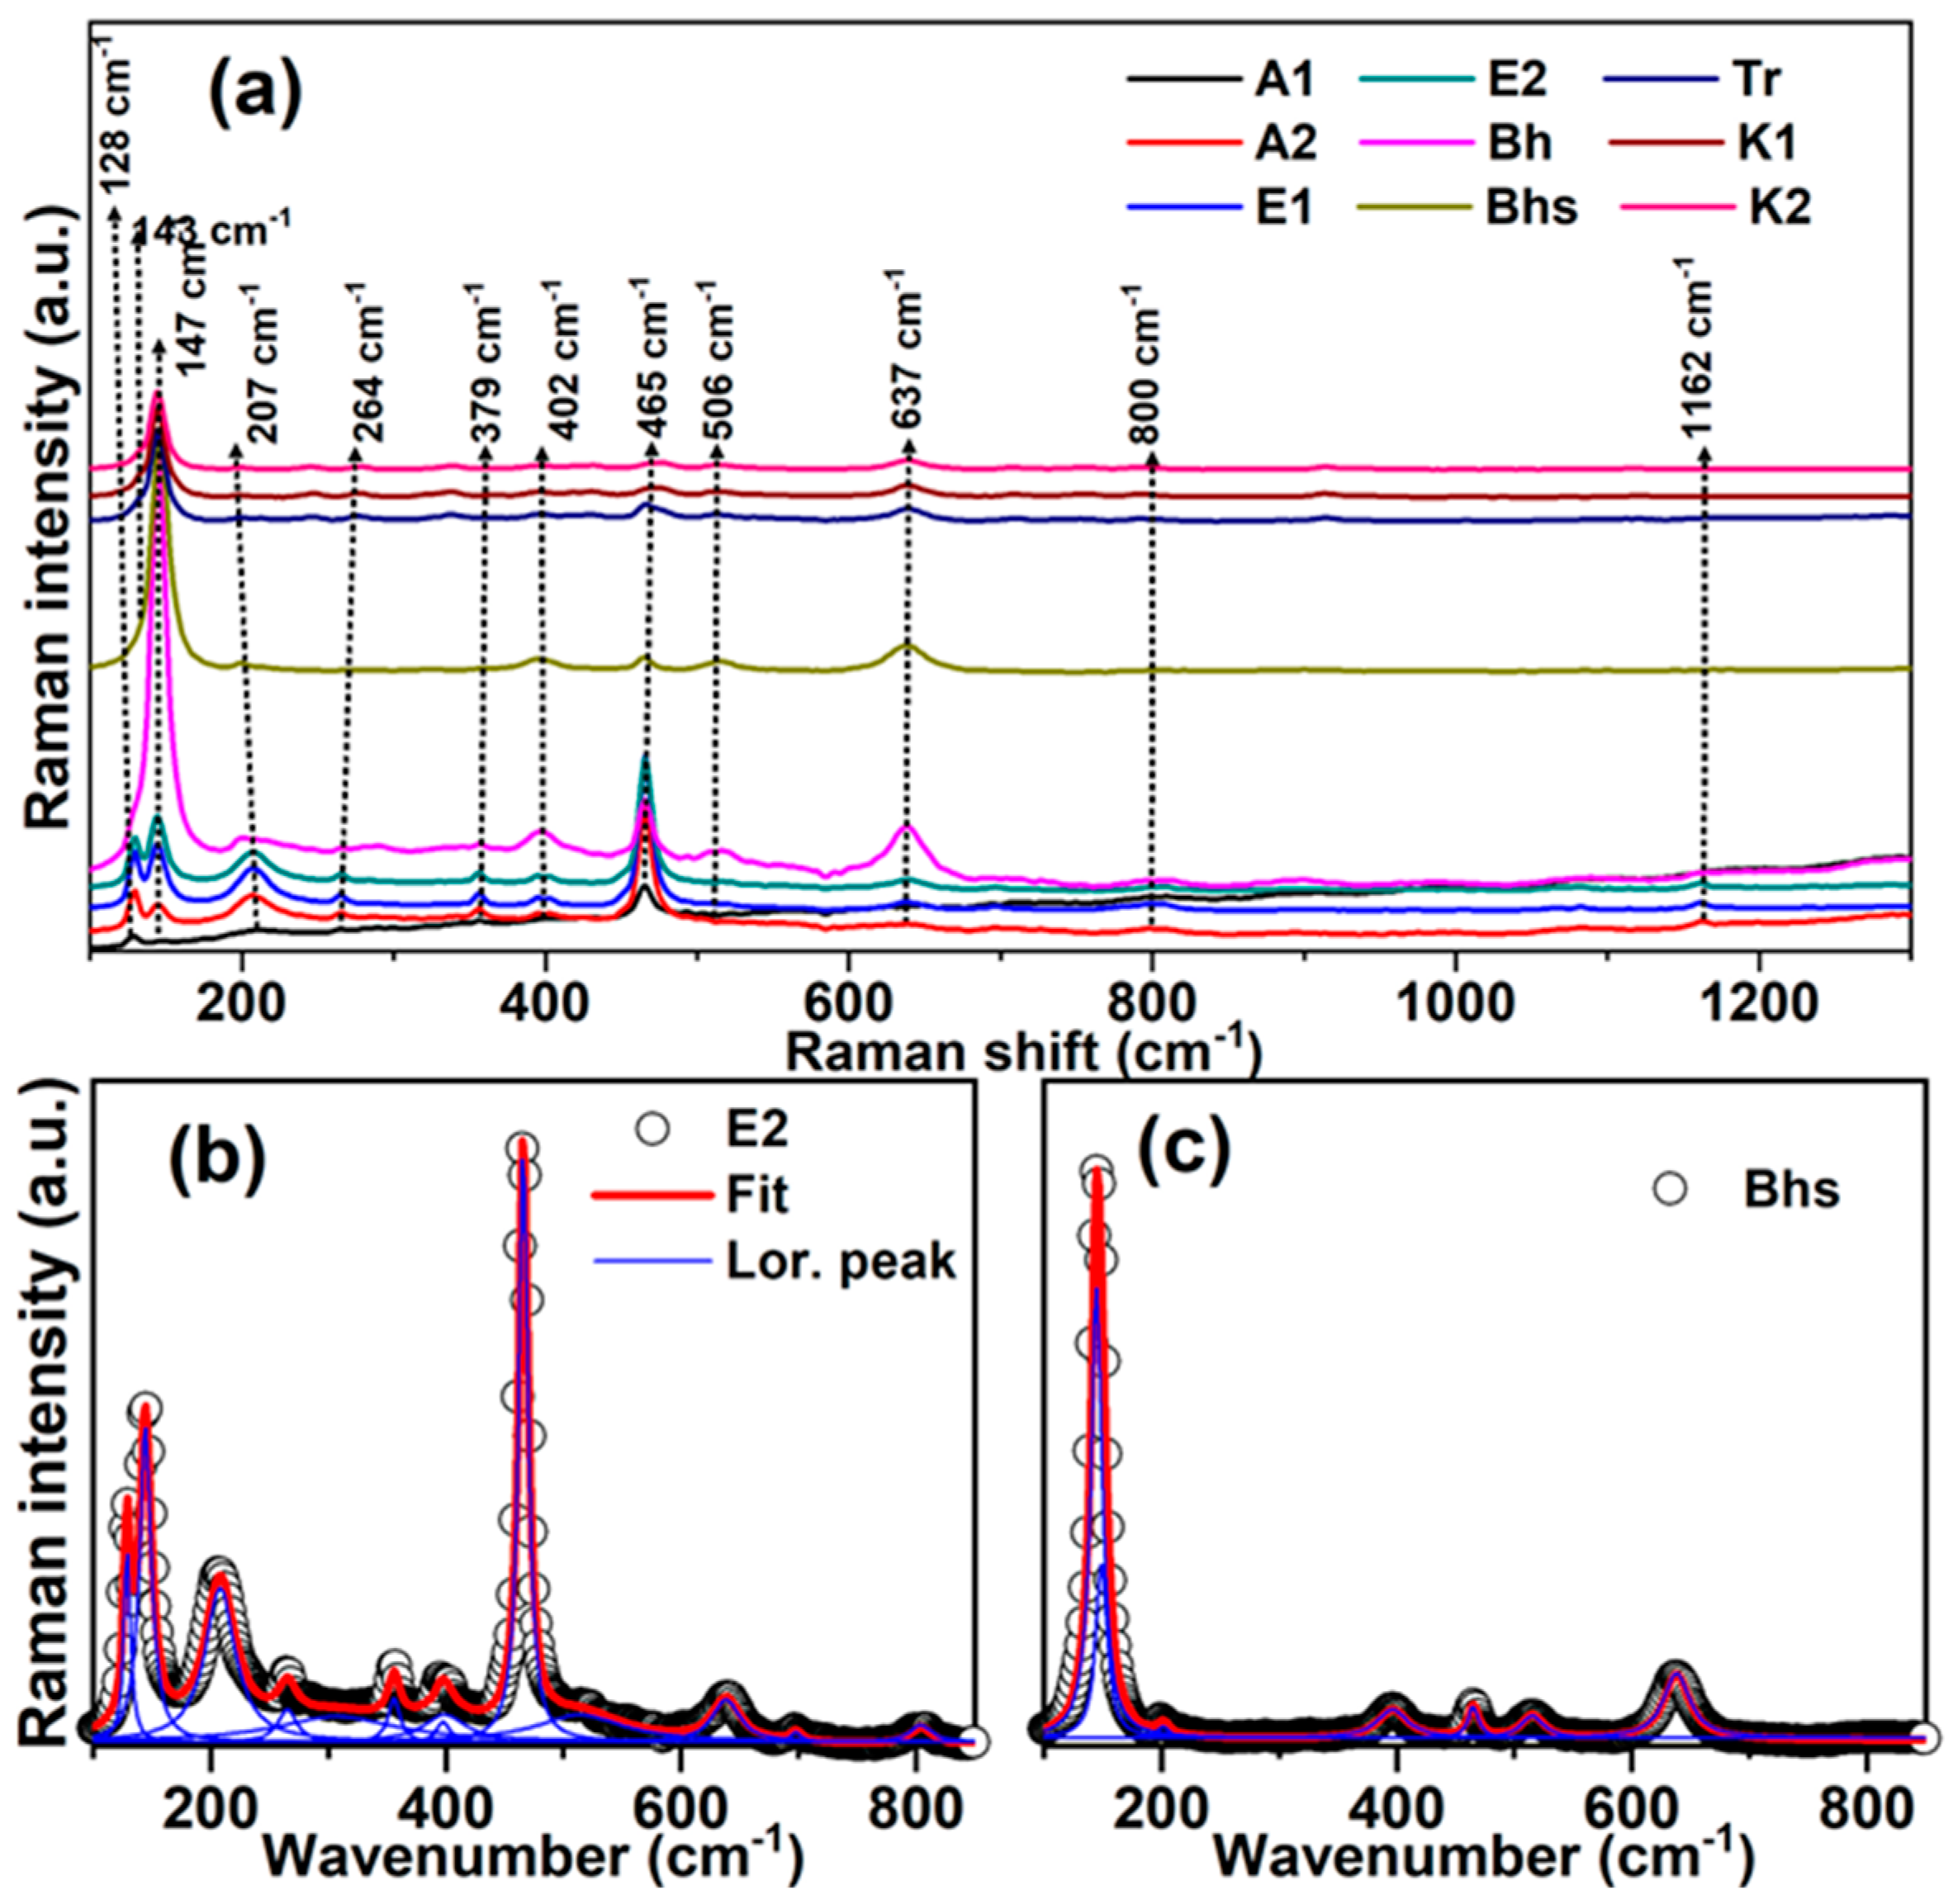
3.2. Raman Spectra
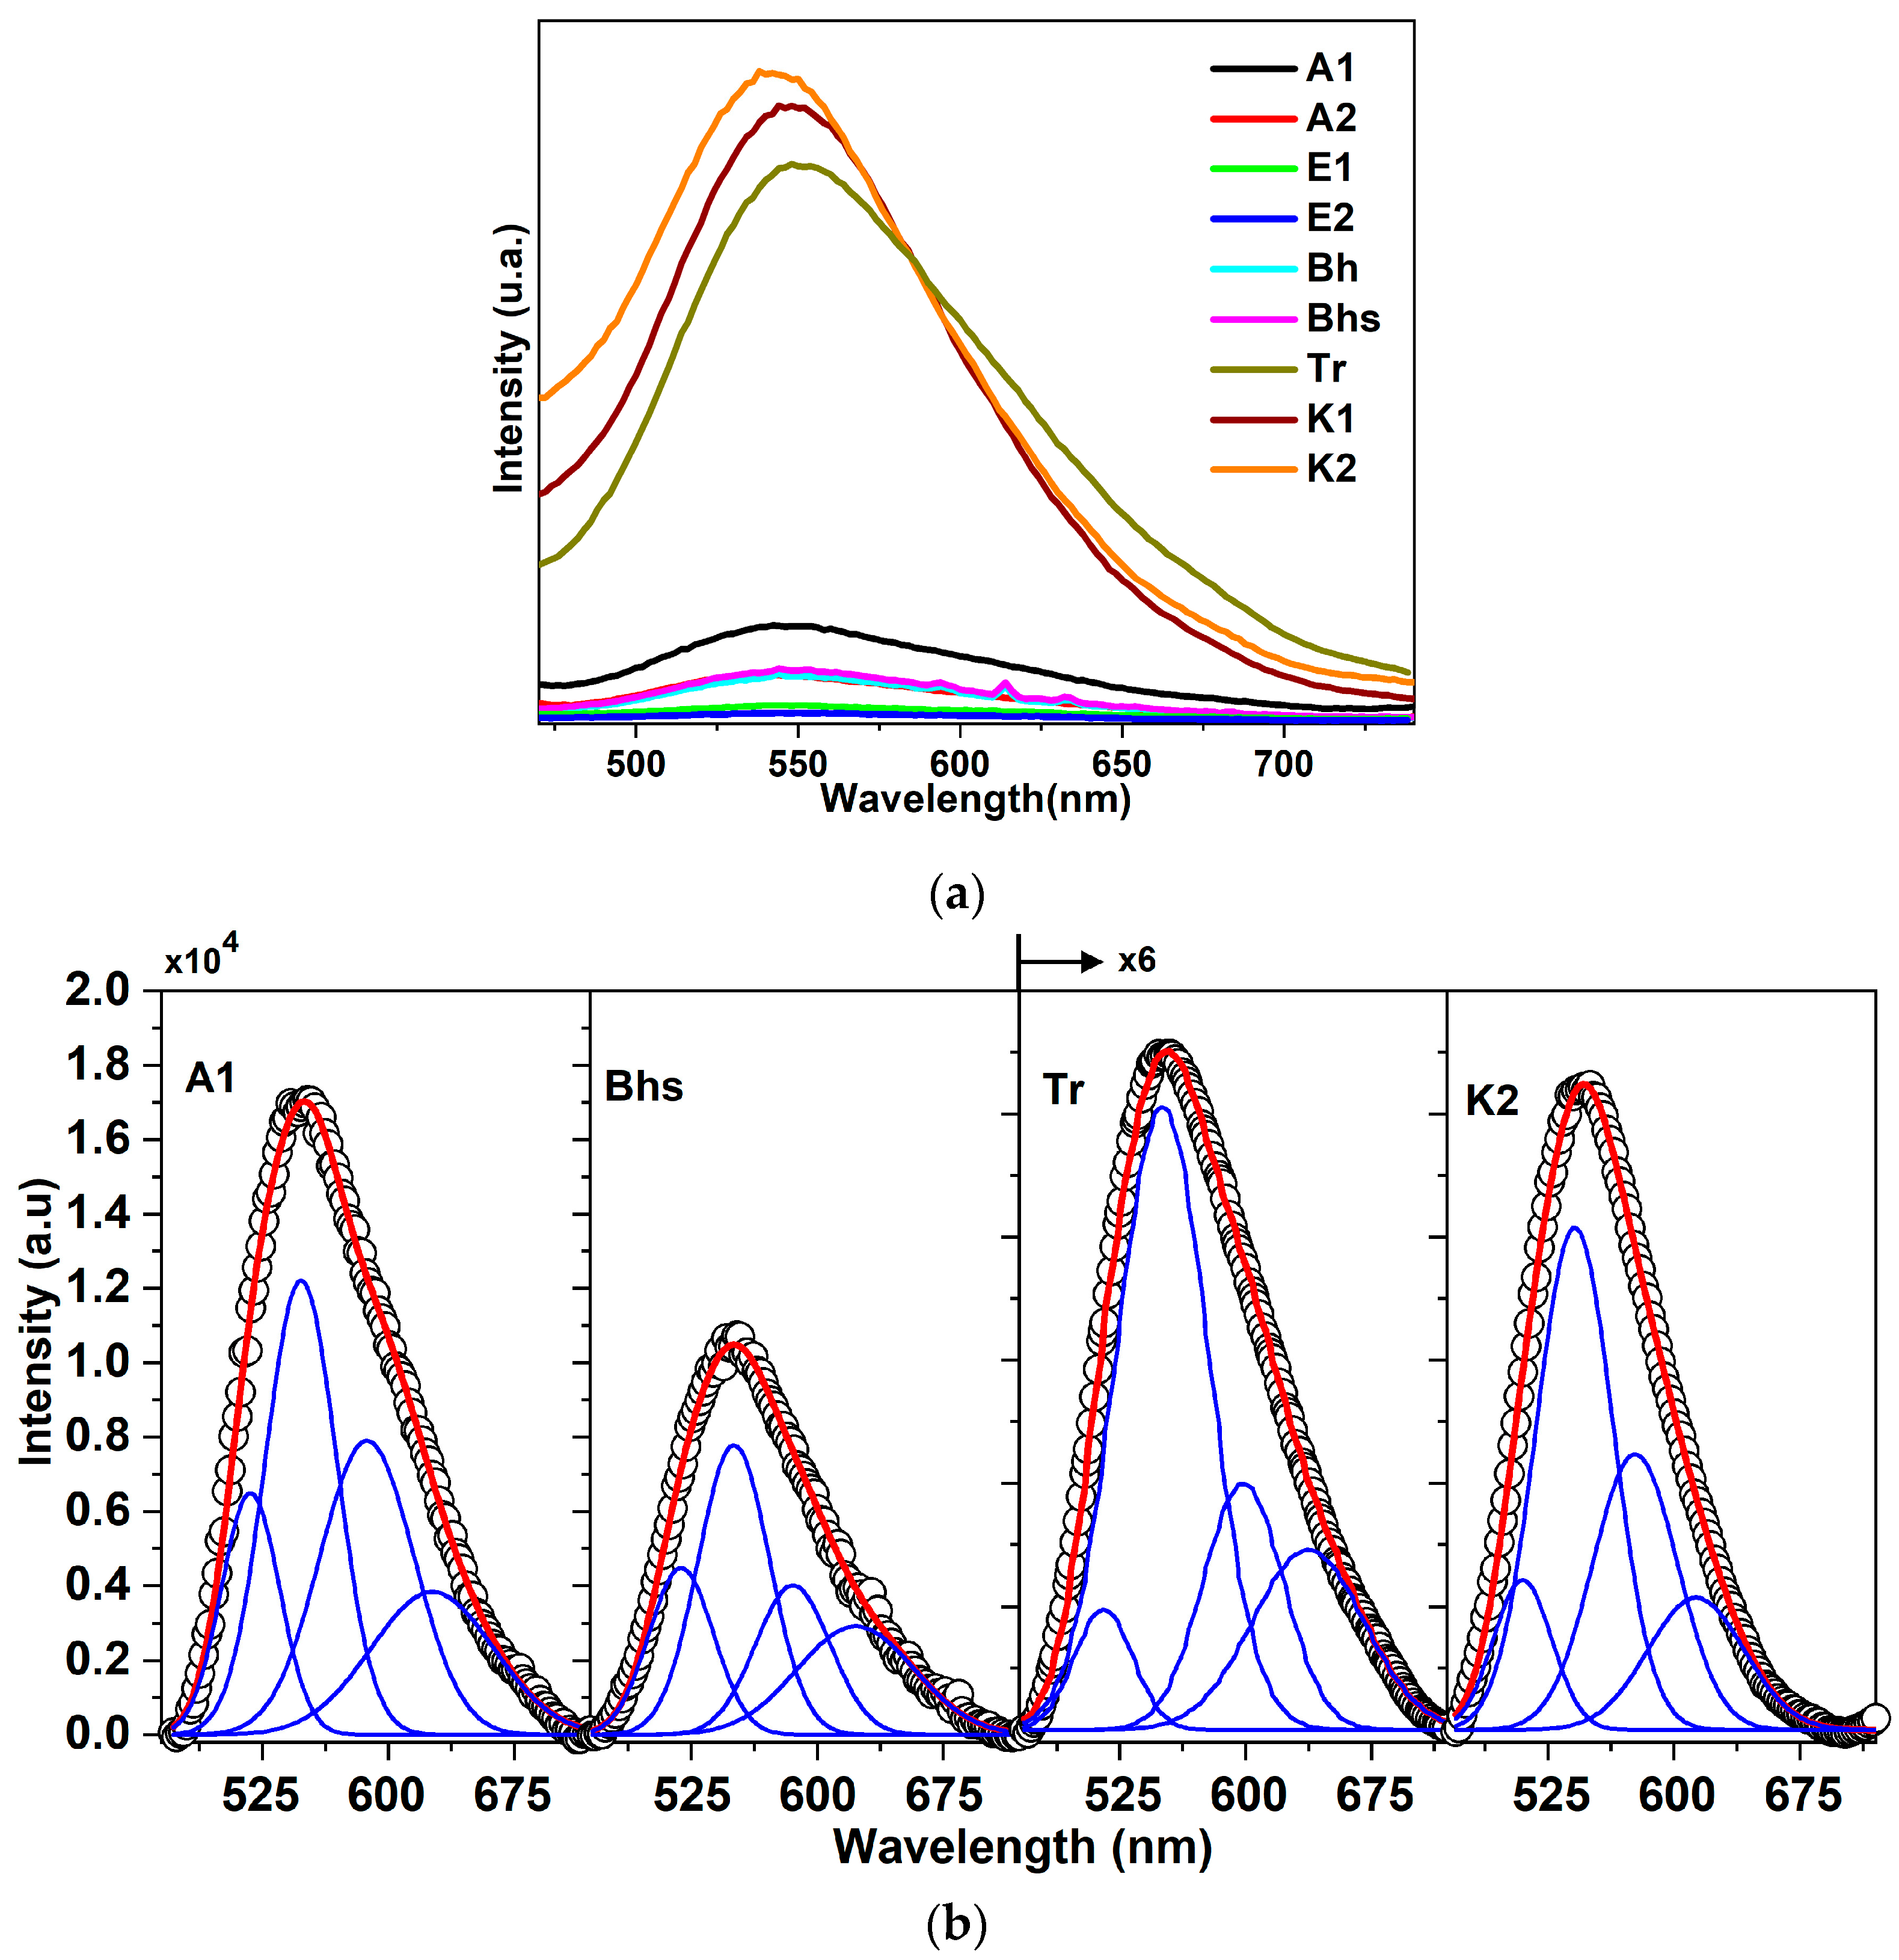
3.3. Fluorescence Spectra and Lifetime Analysis
4. Conclusions
Supplementary Materials
Author Contributions
Funding
Data Availability Statement
Conflicts of Interest
References
- Denning, S. Southeast Amazonia Is No Longer a Carbon Sink. Nature 2021, 595, 354–355. [Google Scholar] [CrossRef] [PubMed]
- Gatti, L.v.; Basso, L.S.; Miller, J.B.; Gloor, M.; Gatti Domingues, L.; Cassol, H.L.G.; Tejada, G.; Aragão, L.E.O.C.; Nobre, C.; Peters, W.; et al. Amazonia as a Carbon Source Linked to Deforestation and Climate Change. Nature 2021, 595, 388–393. [Google Scholar] [CrossRef] [PubMed]
- Montes, C.R.; Lucas, Y.; Pereira, O.J.R.; Achard, R.; Grimaldi, M.; Melfi, A.J. Deep Plant-Derived Carbon Storage in Amazonian Podzols. Biogeosciences 2011, 8, 113–120. [Google Scholar] [CrossRef] [Green Version]
- Clabel Huamán, J.L.; Nicolodelli, G.; Senesi, G.S.; Montes, C.R.; Felicio Perruci, N.A.; Bezzon, V.D.N.; Milori, D.M.B.P. Characterization and Distribution of Mineral Phases in an Amazonian Humiluvic Spodosol Profile by XRPD, HR-TEM, SAED and SEM–EDX. Environ. Earth Sci. 2021, 80, 405. [Google Scholar] [CrossRef]
- Tadini, A.M.; Nicolodelli, G.; Hajjoul, H.; Milori, D.M.B.P.; Mounier, S. Humic Fractions from Amazon Soils: Lifetime Study and Humification Process by Fluorescence Spectroscopy. Appl. Geochem. 2022, 147, 105486. [Google Scholar] [CrossRef]
- Tadini, A.M.; Nicolodelli, G.; Marangoni, B.S.; Mounier, S.; Montes, C.R.; Milori, D.M.B.P. Evaluation of the Roles of Metals and Humic Fractions in the Podzolization of Soils from the Amazon Region Using Two Analytical Spectroscopy Techniques. Microchem. J. 2019, 144, 454–460. [Google Scholar] [CrossRef] [Green Version]
- Gonçalves, D.A.; Senesi, G.S.; Nicolodelli, G. Laser-Induced Breakdown Spectroscopy Applied to Environmental Systems and Their Potential Contaminants. An Overview of Advances Achieved in the Last Few Years. Trends Environ. Anal. Chem. 2021, 30, e00121. [Google Scholar] [CrossRef]
- Nicolodelli, G.; Cabral, J.; Menegatti, C.R.; Marangoni, B.; Senesi, G.S. Recent Advances and Future Trends in LIBS Applications to Agricultural Materials and Their Food Derivatives: An Overview of Developments in the Last Decade (2010–2019). Part I. Soils and Fertilizers. TrAC Trends Anal. Chem. 2019, 115, 70–82. [Google Scholar] [CrossRef]
- Krüger, A.L.; Nicolodelli, G.; Villas-Boas, P.R.; Watanabe, A.; Milori, D.M.B.P. Quantitative Multi-Element Analysis in Soil Using 532 Nm and 1064 Nm Lasers in LIBS Technique. Plasma Chem. Plasma Process. 2020, 40, 1417–1427. [Google Scholar] [CrossRef]
- de Morais, C.P.; Nicolodelli, G.; Mitsuyuki, M.C.; Mounier, S.; Milori, D.M.B.P. Optimization of Laser-Induced Breakdown Spectroscopy Parameters from the Design of Experiments for Multi-Element Qualitative Analysis in River Sediment. Spectrochim. Acta Part B Spectrosc. 2021, 177, 106066. [Google Scholar] [CrossRef]
- Hahn, D.W.; Omenetto, N. Laser-Induced Breakdown Spectroscopy (LIBS), Part I: Review of Basic Diagnostics and Plasma—Particle Interactions: Still-Challenging Issues within the Analytical Plasma Community. Appl. Spectrosc. 2010, 64, 335A–336A. [Google Scholar] [CrossRef] [PubMed] [Green Version]
- Yeturu, S.; Vargas Jentzsch, P.; Ciobotă, V.; Guerrero, R.; Garrido, P.; Ramos, L.A. Handheld Raman Spectroscopy for the Early Detection of Plant Diseases: Abutilon Mosaic Virus Infecting Abutilon sp. Anal. Methods 2016, 8, 3450–3457. [Google Scholar] [CrossRef]
- Xing, Z.; Du, C.; Zeng, Y.; Ma, F.; Zhou, J. Characterizing Typical Farmland Soils in China Using Raman Spectroscopy. Geoderma 2016, 268, 147–155. [Google Scholar] [CrossRef]
- Xing, Z.; Du, C.; Tian, K.; Ma, F.; Shen, Y.; Zhou, J. Application of FTIR-PAS and Raman Spectroscopies for the Determination of Organic Matter in Farmland Soils. Talanta 2016, 158, 262–269. [Google Scholar] [CrossRef] [PubMed]
- Giannetta, B.; Cassetta, M.; Oliveira de Souza, D.; Mariotto, G.; Aquilanti, G.; Zaccone, C. Coupling X-Ray Absorption and Raman Spectroscopies to Characterize Iron Species in a Karst Pedosedimentary Record. Soil Syst. 2022, 6, 24. [Google Scholar] [CrossRef]
- Nicolodelli, G.; Tadini, A.M.; Nogueira, M.S.; Pratavieira, S.; Mounier, S.; Huaman, J.L.C.; dos Santos, C.H.; Montes, C.R.; Milori, D.M.B.P. Fluorescence Lifetime Evaluation of Whole Soils from the Amazon Rainforest. Appl. Opt. 2017, 56, 6936–6941. [Google Scholar] [CrossRef] [Green Version]
- Tadini, A.M.; Nicolodelli, G.; Mounier, S.; Montes, C.R.; Milori, D.M.B.P. The Importance of Humin in Soil Characterisation: A Study on Amazonian Soils Using Different Fluorescence Techniques. Sci. Total Environ. 2015, 537, 152–158. [Google Scholar] [CrossRef]
- Tadini, A.M.; Mounier, S.; Milori, D.M.B.P. Modeling the Quenching of Fluorescence from Organic Matter in Amazonian Soils. Sci. Total Environ. 2020, 698, 134067. [Google Scholar] [CrossRef]
- Santos, C.H.; Nicolodelli, G.; Romano, R.A.; Tadini, A.M.; Villas-Boas, P.R.; Montes, C.R.; Mounier, S.; Milori, D.M.B.P. Structure of Humic Substances from Some Regions of the Amazon Assessed Coupling 3D Fluorescence Spectroscopy and CP/PARAFAC. J. Braz. Chem. Soc. 2015, 26, 1136–1142. [Google Scholar] [CrossRef]
- Ishida, D.A.; Vieira-Coelho, A.C.; Melfi, A.J.; Lucas, Y.; Camargo, J.P.B.; Montes, C.R. Influence of Pedogenetic Processes on the Validity of Kaolinite Crystallinity Indices: A Case Study of an Amazonian Ferralsol-Podzol Soil System with White Kaolin. Appl. Clay. Sci. 2018, 162, 435–442. [Google Scholar] [CrossRef]
- Nicolodelli, G.; Marangoni, B.S.; Cabral, J.S.; Villas-Boas, P.R.; Senesi, G.S.; dos Santos, C.H.; Romano, R.A.; Segnini, A.; Lucas, Y.; Montes, C.R.; et al. Quantification of Total Carbon in Soil Using Laser-Induced Breakdown Spectroscopy: A Method to Correct Interference Lines. Appl. Opt. 2014, 53, 2170–2176. [Google Scholar] [CrossRef]
- Clabel, H.J.L.; Nicolodelli, G.; Senesi, G.S.; Montes, C.R.; Perruci, N.A.F.; Bezzon, V.D.N.; Balogh, D.T.; Milori, D.M.B.P. Organo-Mineral Associations in a Spodosol from Northern Brazil. Geoderma Reg. 2020, 22, e00303. [Google Scholar] [CrossRef]
- Fang, F.; Min, F.; Liu, L.; Chen, J.; Ren, B.; Liu, C. Adsorption of Al(OH)(3-+ (n = 2–4) on Kaolinite (001) Surfaces: A DFT Study. Appl. Clay. Sci. 2020, 187, 105455. [Google Scholar] [CrossRef]
- Murad, E. Identification of Minor Amounts of Anatase in Kaolins by Raman Spectroscopy. Am. Mineral. 1997, 82, 203–206. [Google Scholar] [CrossRef]
- Mineralogical Analysis by Infra-Red Spectrometry. In Handbook of Soil Analysis; Springer: Berlin/Heidelberg, Germany, 2006; pp. 133–165.
- Kingma, K.J.; Hemley, R.J. Raman Spectroscopic Study of Microcrystalline Silica. Am. Mineral. 1994, 79, 269–273. [Google Scholar]
- Michaelian, K.H. The Raman Spectrum of Kaolinite 9 at 21 °C. Can. J. Chem. 1986, 64, 285–294. [Google Scholar] [CrossRef] [Green Version]
- Ruan, H.D.; Frost, R.L.; Kloprogge, J.T. Comparison of Raman Spectra in Characterizing Gibbsite, Bayerite, Diaspore and Boehmite. J. Raman Spectrosc. 2001, 32, 745–750. [Google Scholar] [CrossRef] [Green Version]
- Milori, D.M.B.P.; Martin-Neto, L.; Bayer, C.; Mielniczuk, J.; Bagnato, V.S. Humification Degree of Soil Humic Acids Determined by Fluorescence Spectroscopy. Soil Sci. 2002, 167, 739–749. [Google Scholar] [CrossRef]
- Tadini, A.M.; Nicolodelli, G.; Senesi, G.S.; Ishida, D.A.; Montes, C.R.; Lucas, Y.; Mounier, S.; Guimarães, F.E.G.; Milori, D.M.B.P. Soil Organic Matter in Podzol Horizons of the Amazon Region: Humification, Recalcitrance, and Dating. Sci. Total Environ. 2018, 613–614, 160–167. [Google Scholar] [CrossRef] [Green Version]


| Emission Lines | Wavelength (nm) |
|---|---|
| C I | 247.86 |
| Mg II | 279.55; 280.27 |
| Mg I | 285.21 |
| Fe II | 238.20; 239.56; 259.94; 274.91; 275.57 |
| Si I | 288.16 |
| Al I | 308.21; 394.40 |
| Ti II | 375.93 |
| Ca I | 393.36 |
| Ca II | 422.67 |
| K I | 766.49; 769.90 |
Disclaimer/Publisher’s Note: The statements, opinions and data contained in all publications are solely those of the individual author(s) and contributor(s) and not of MDPI and/or the editor(s). MDPI and/or the editor(s) disclaim responsibility for any injury to people or property resulting from any ideas, methods, instructions or products referred to in the content. |
© 2023 by the authors. Licensee MDPI, Basel, Switzerland. This article is an open access article distributed under the terms and conditions of the Creative Commons Attribution (CC BY) license (https://creativecommons.org/licenses/by/4.0/).
Share and Cite
Huamán, J.L.C.; Tadini, A.M.; Senesi, G.S.; Mounier, S.; Milori, D.M.B.P.; Nicolodelli, G. Characterization of an Amazon Soil Profile by Laser-Induced Breakdown, Raman, and Fluorescence Spectroscopies. Minerals 2023, 13, 553. https://doi.org/10.3390/min13040553
Huamán JLC, Tadini AM, Senesi GS, Mounier S, Milori DMBP, Nicolodelli G. Characterization of an Amazon Soil Profile by Laser-Induced Breakdown, Raman, and Fluorescence Spectroscopies. Minerals. 2023; 13(4):553. https://doi.org/10.3390/min13040553
Chicago/Turabian StyleHuamán, José L. Clabel, Amanda Maria Tadini, Giorgio Saverio Senesi, Stéphane Mounier, Débora M. B. P. Milori, and Gustavo Nicolodelli. 2023. "Characterization of an Amazon Soil Profile by Laser-Induced Breakdown, Raman, and Fluorescence Spectroscopies" Minerals 13, no. 4: 553. https://doi.org/10.3390/min13040553