

Indium Recovery from Jarosite Pb–Ag Tailings Waste (Part 1)
 , ,
, ,
Abstract
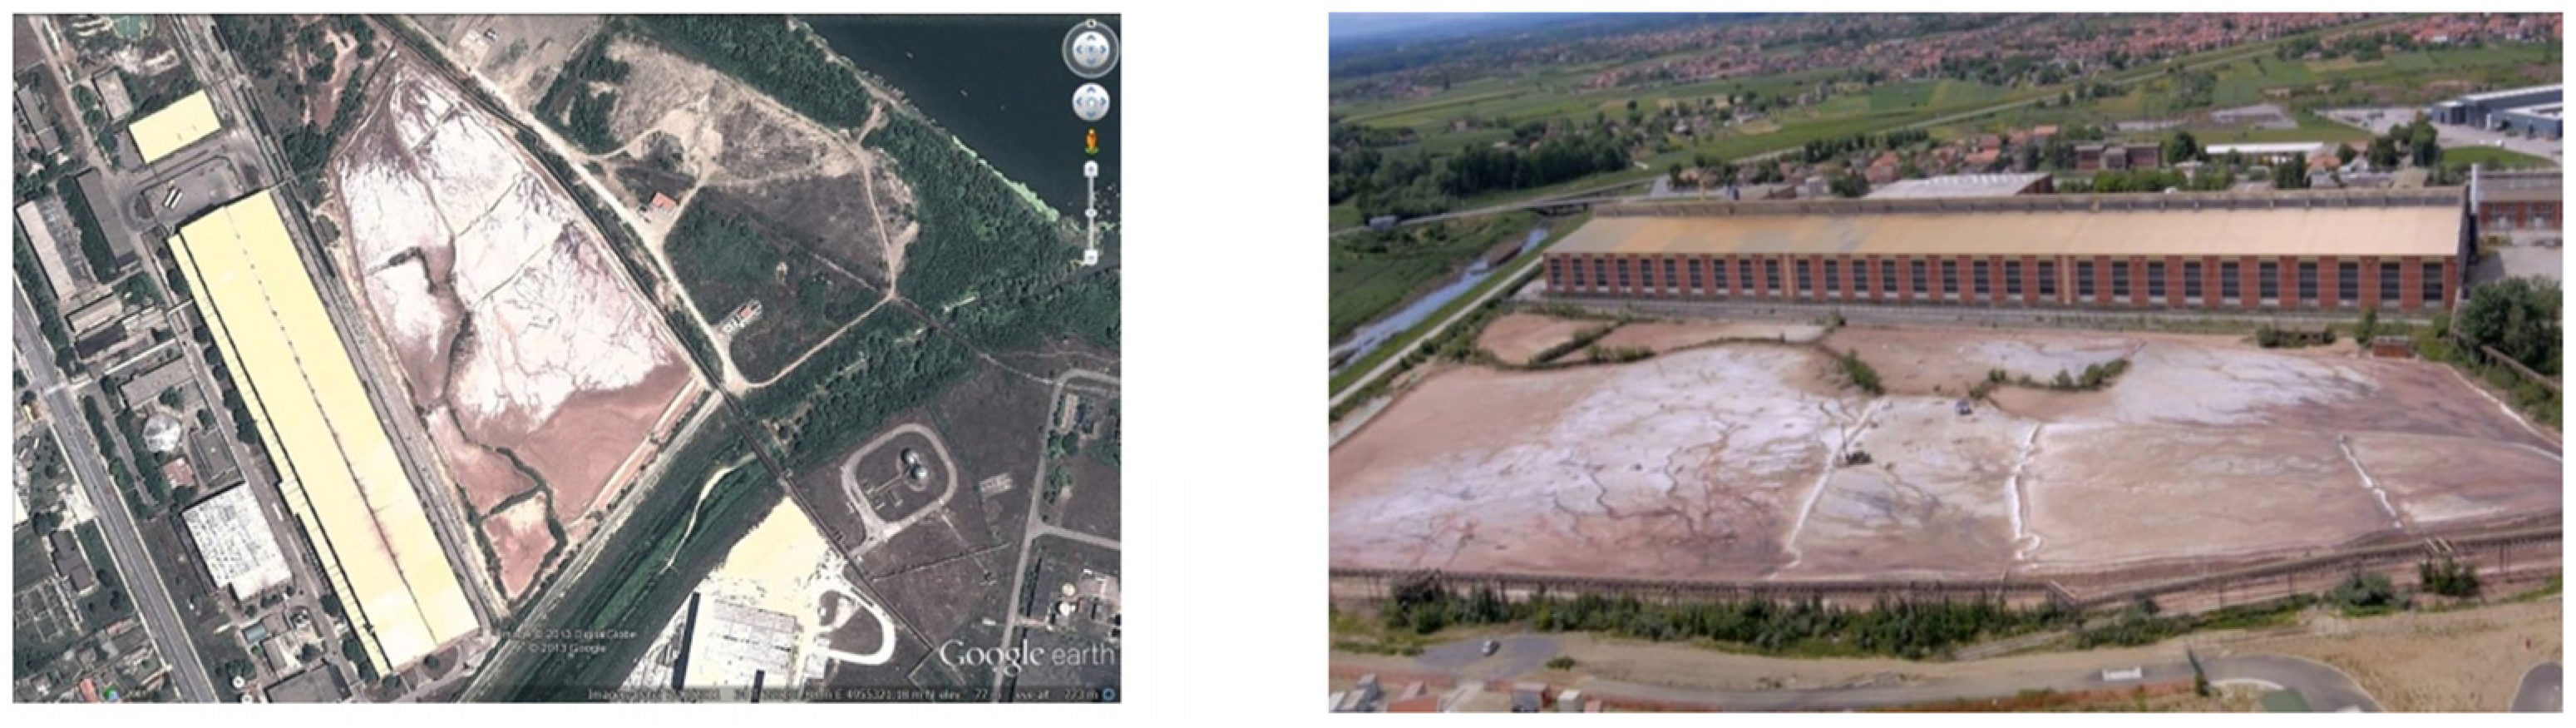
:1. Introduction
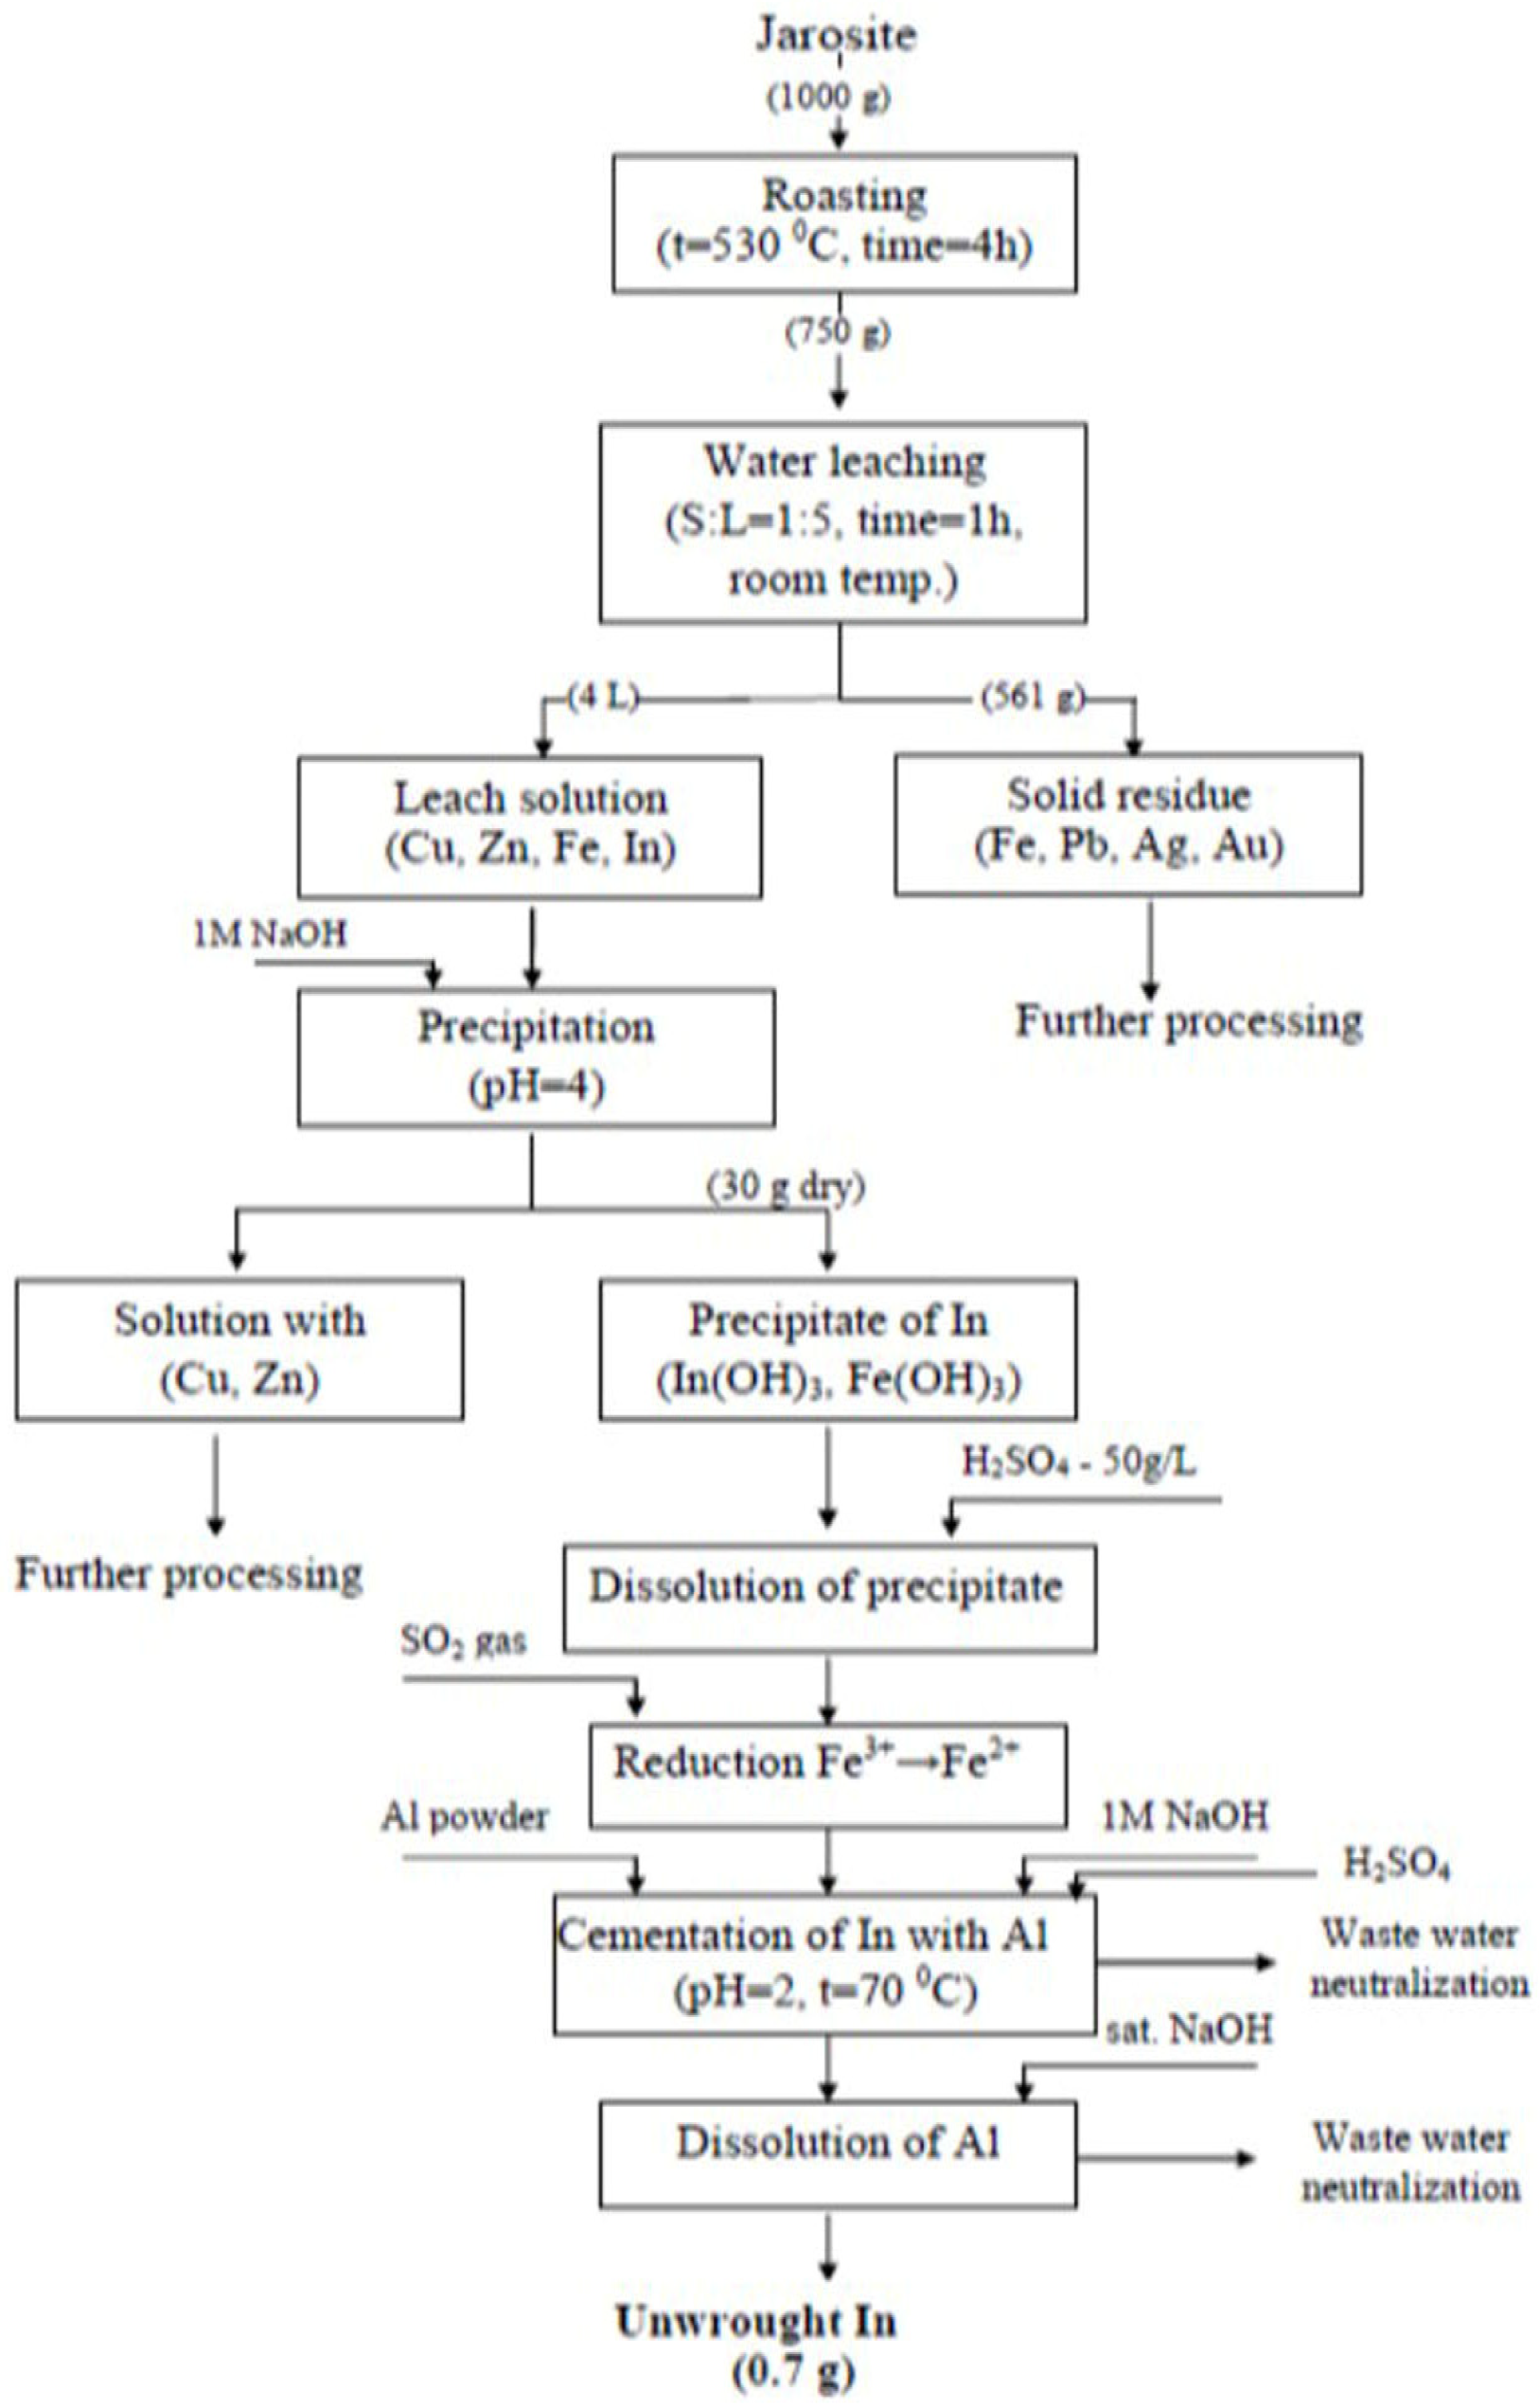
2. Materials and Methods
Analytical Determinations
3. Results and Discussion
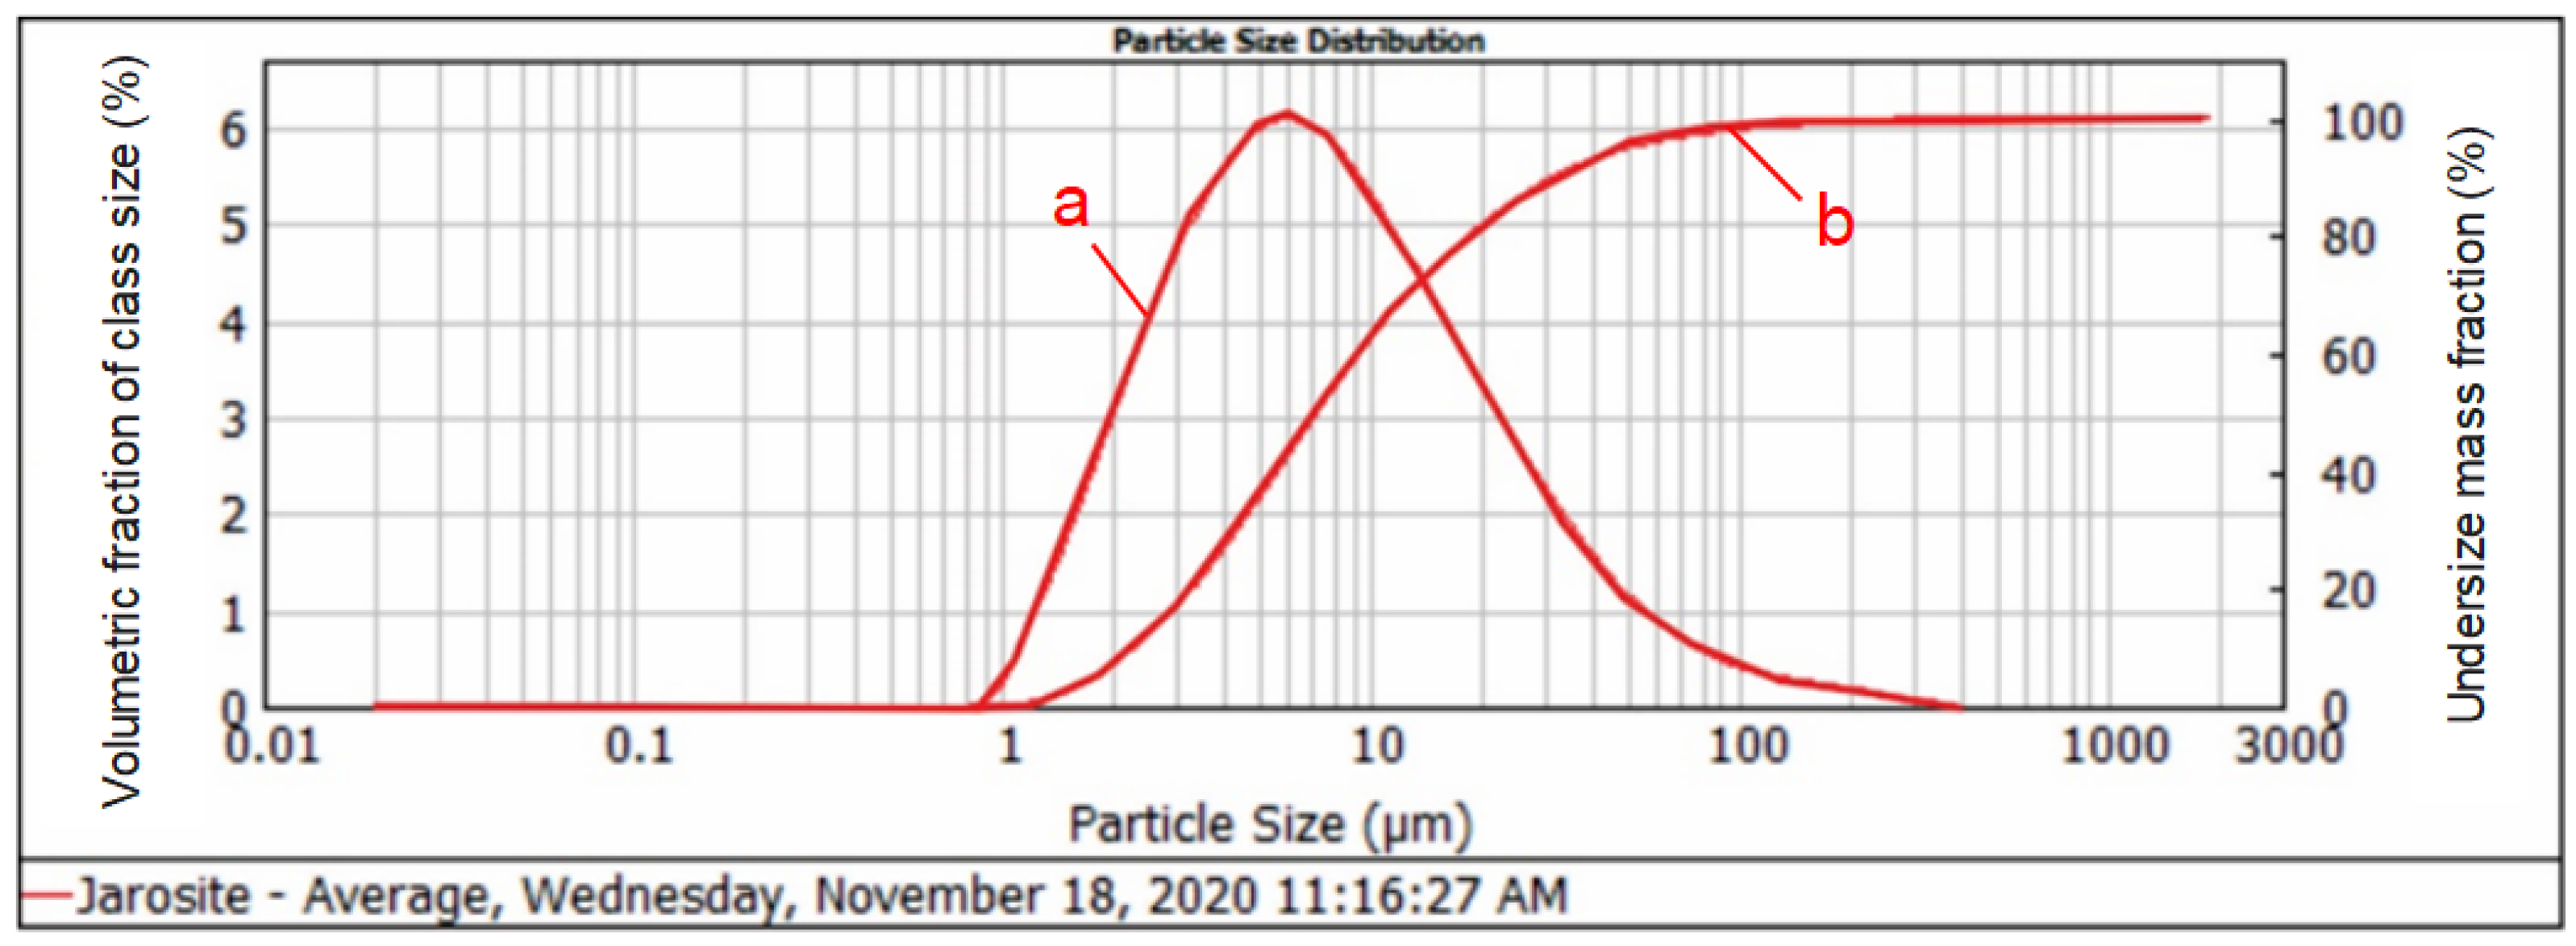
3.1. Grain Size Distribution of the Jarosite Sample
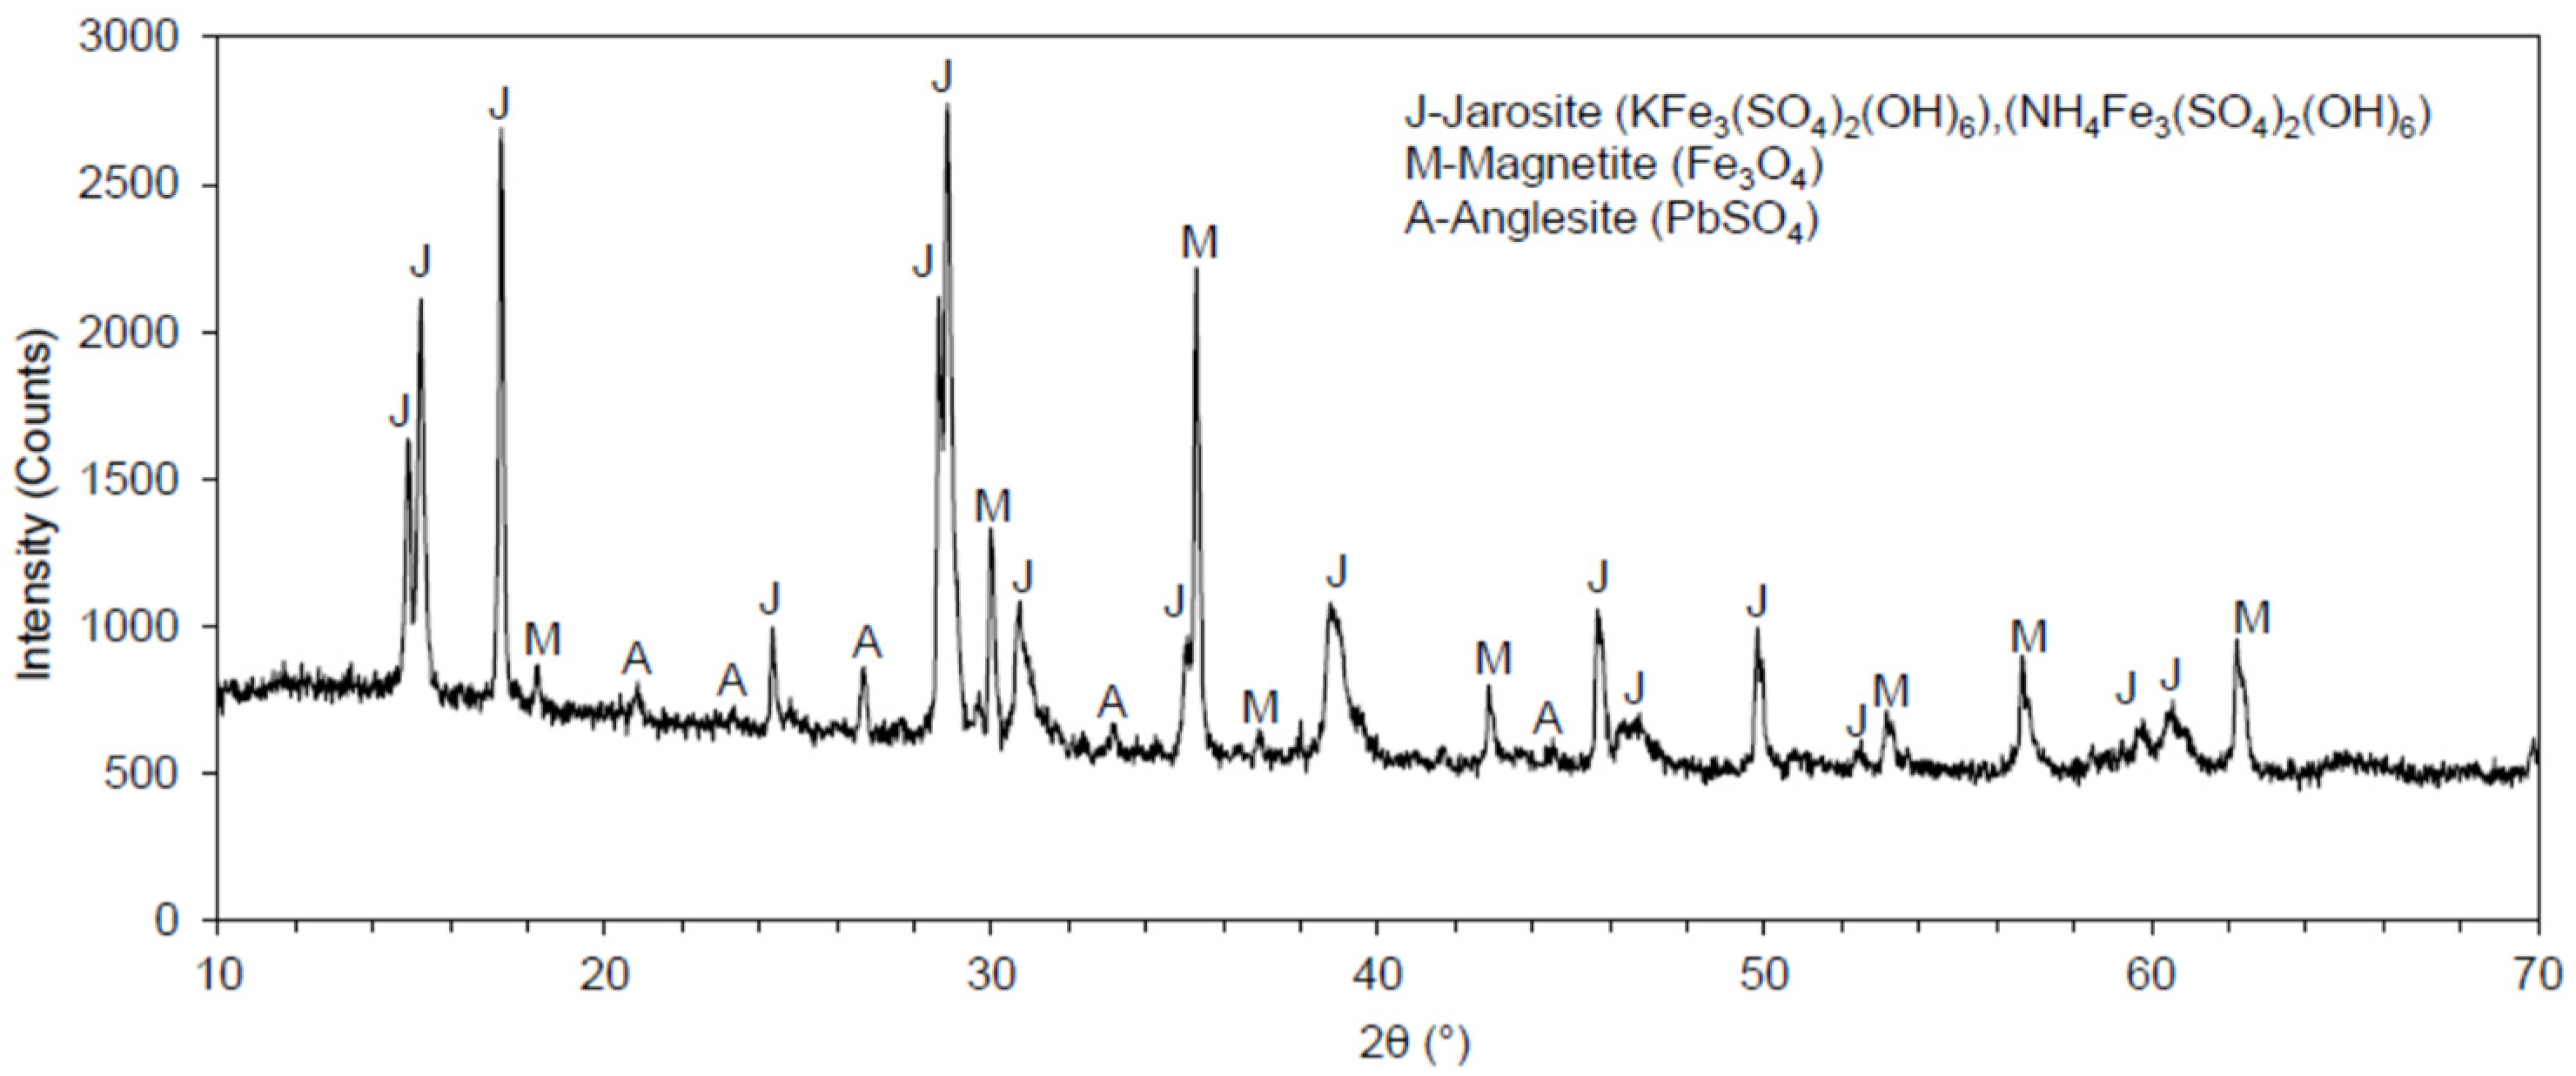
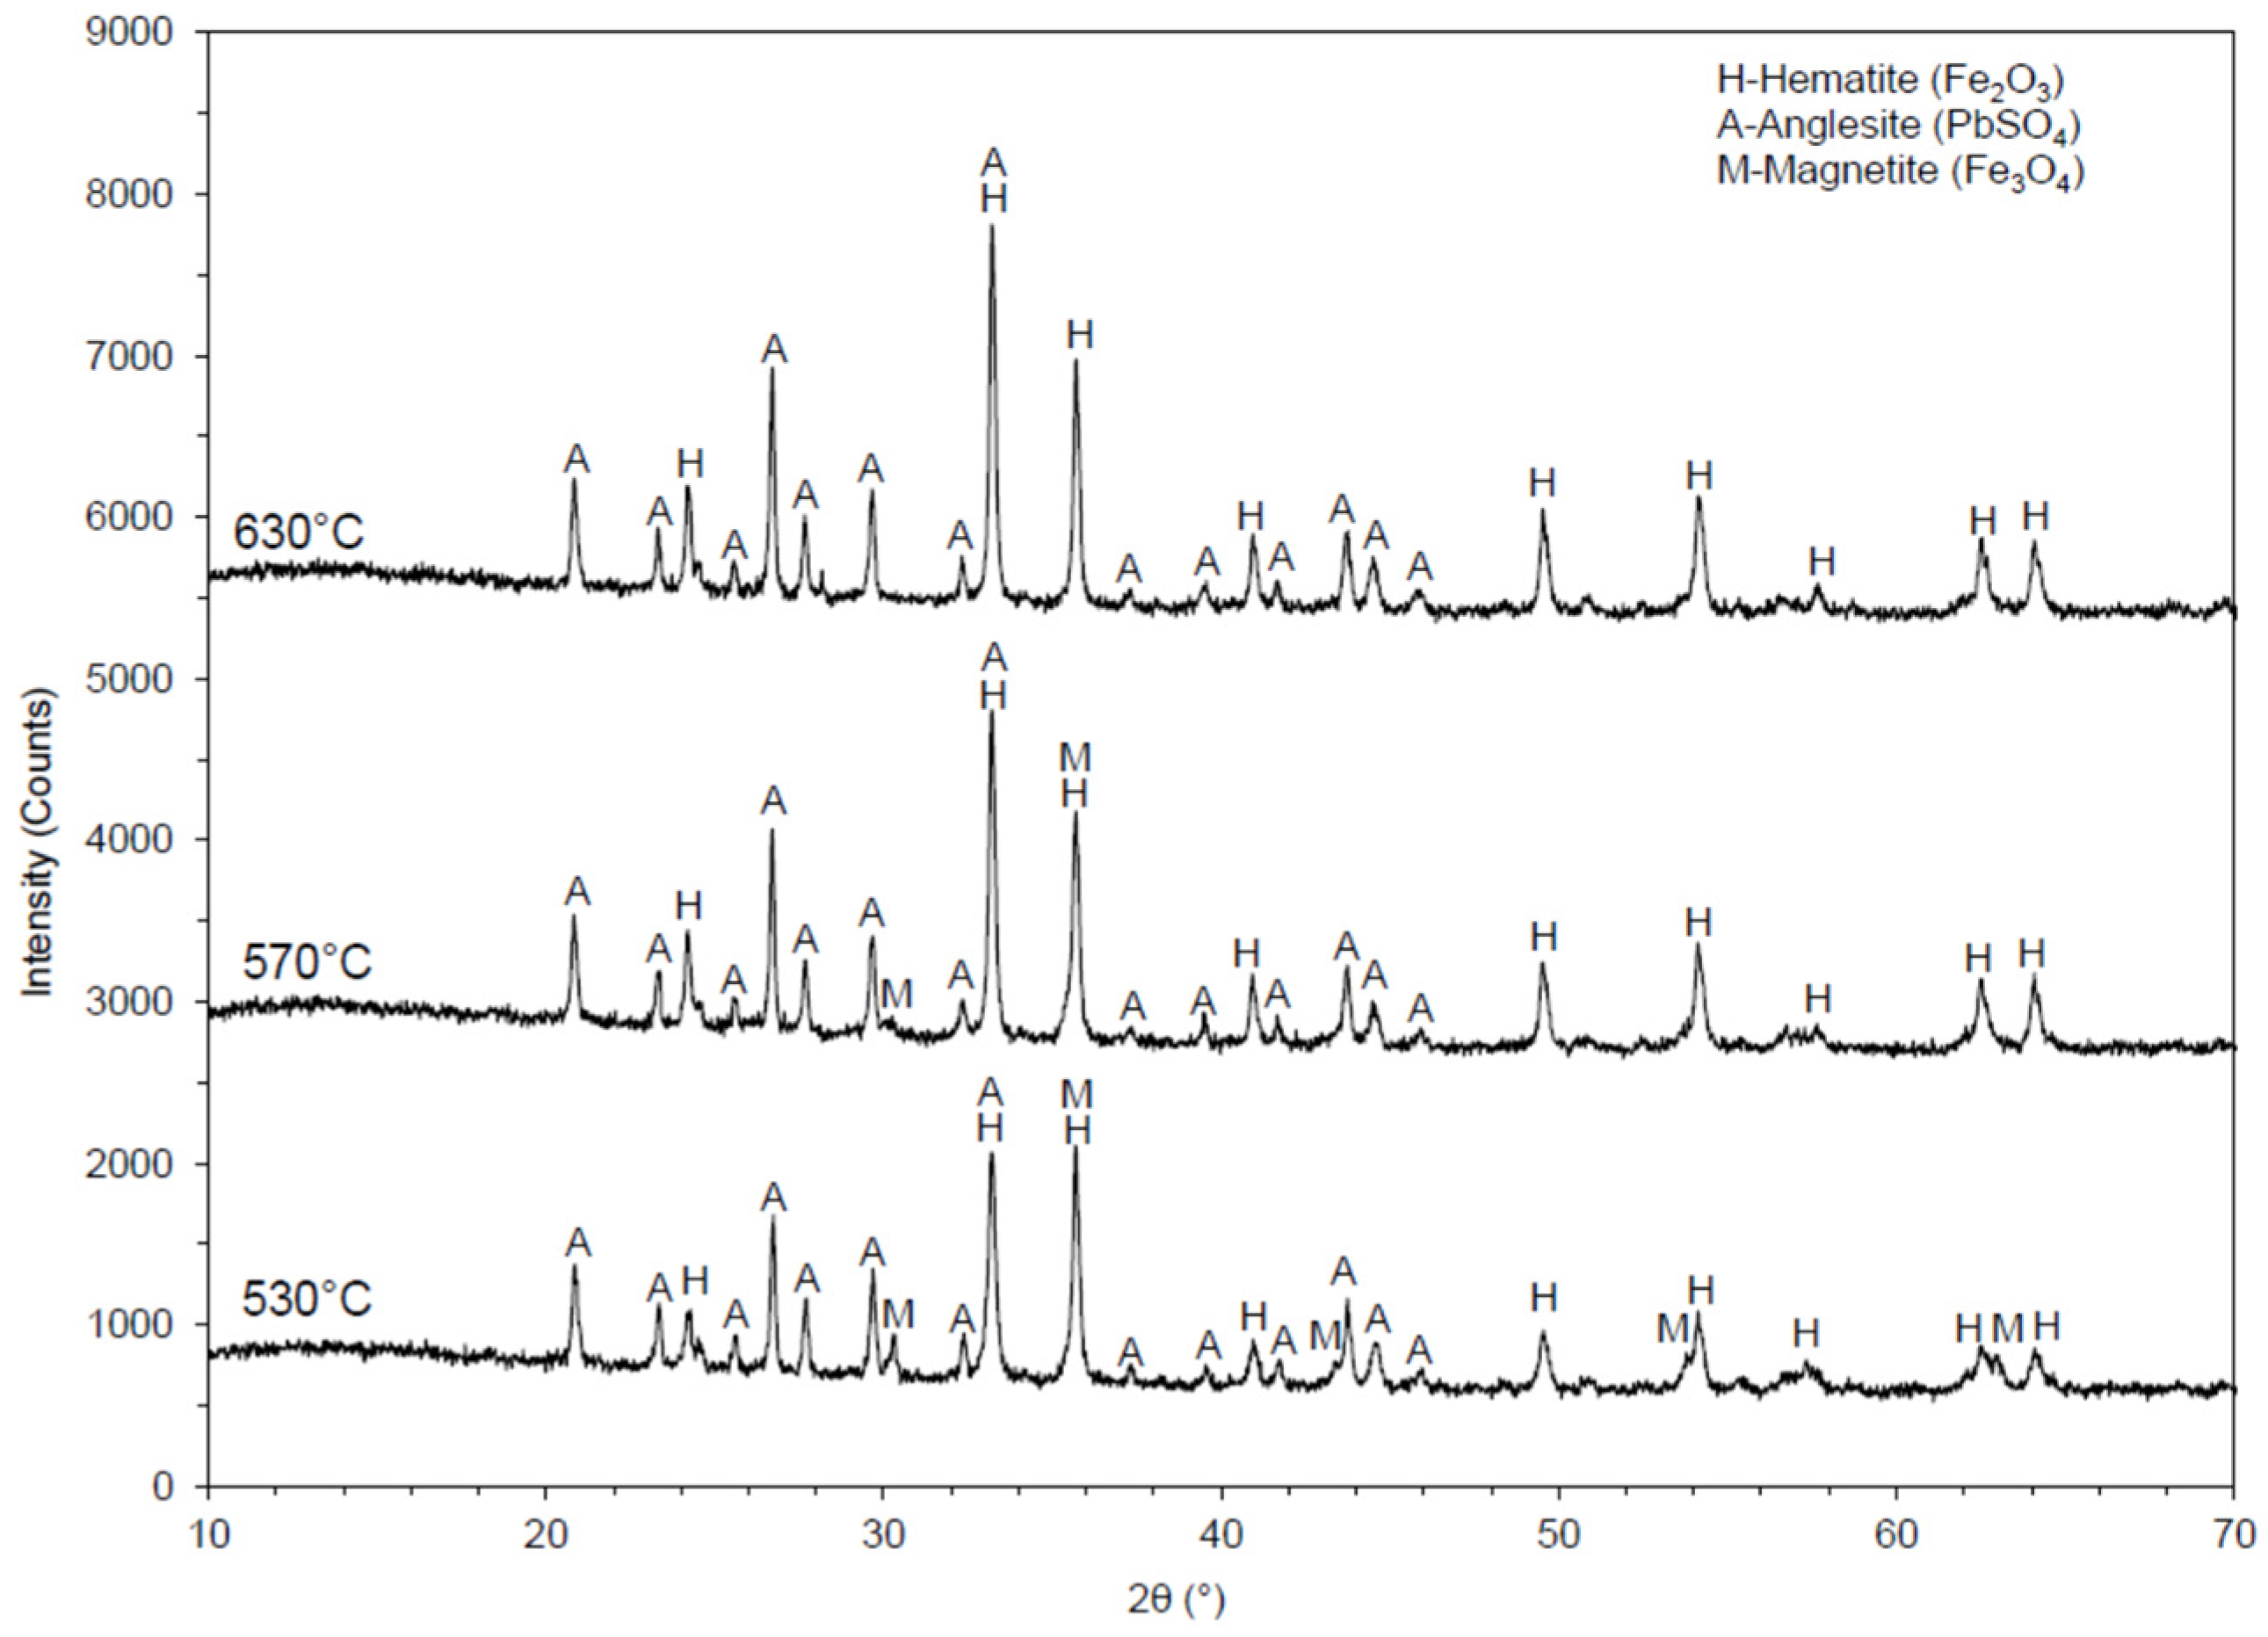
3.2. Mineralogical Composition of the Jarosite Sample
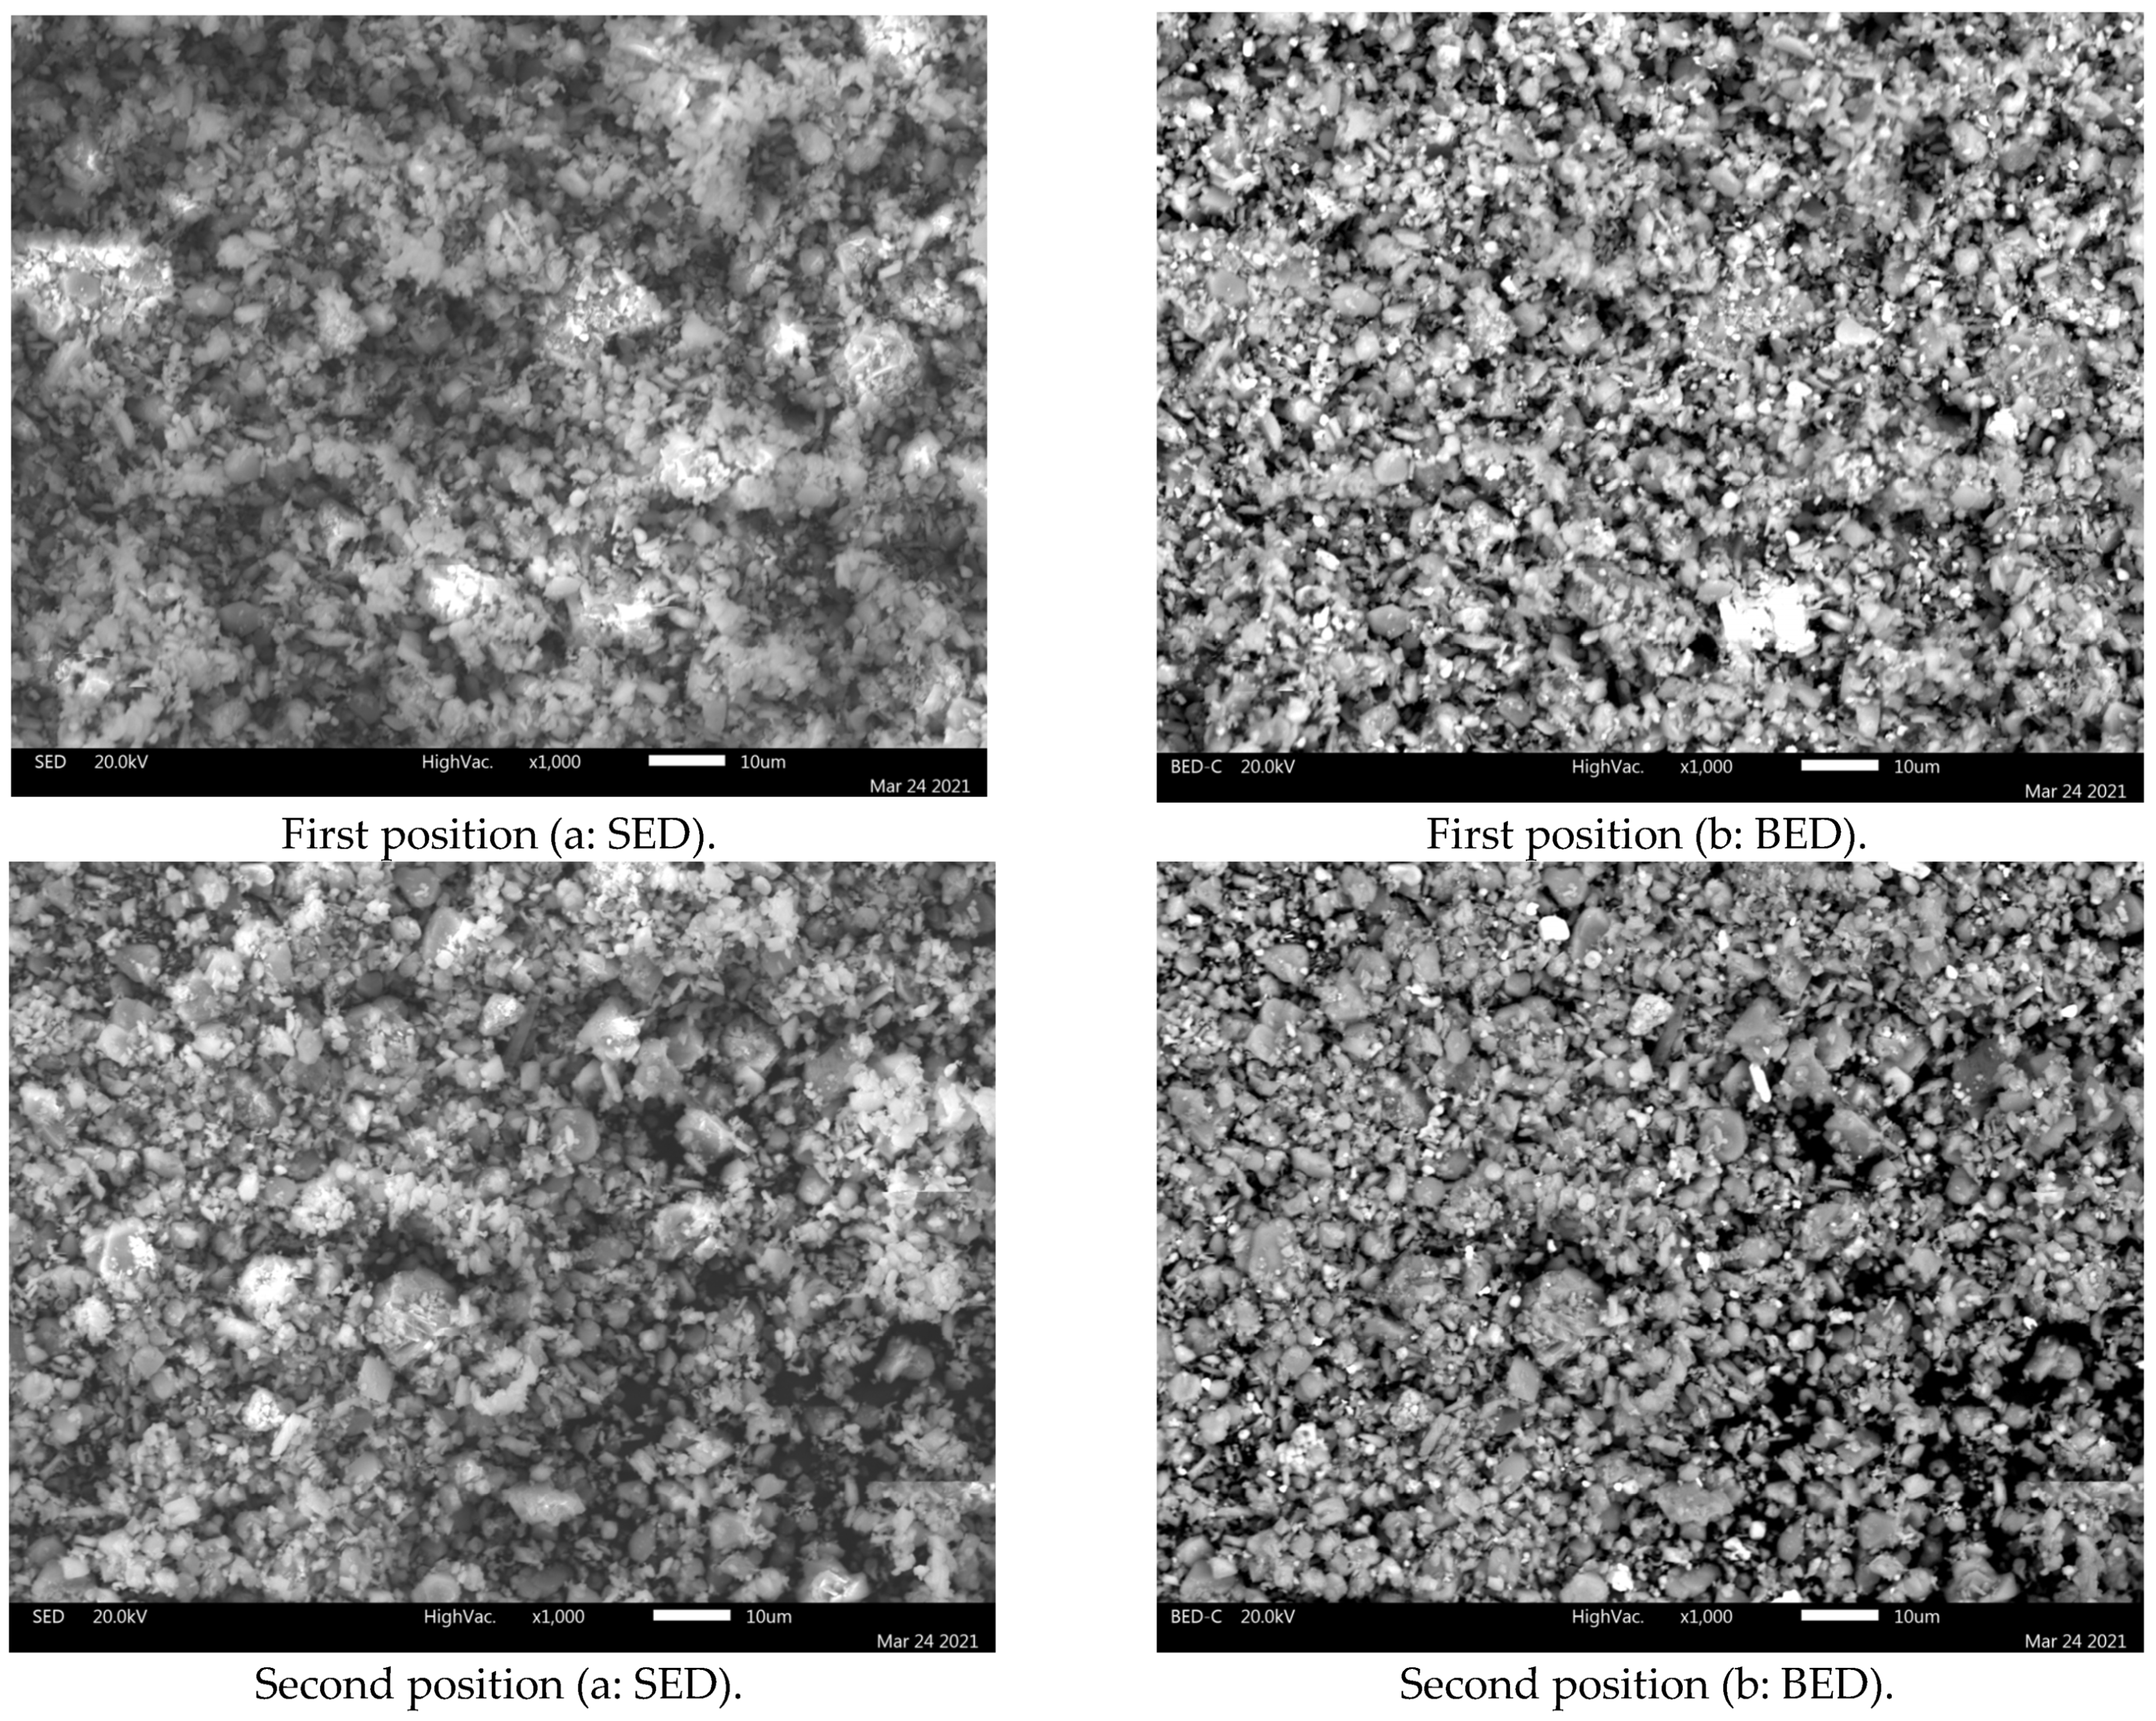
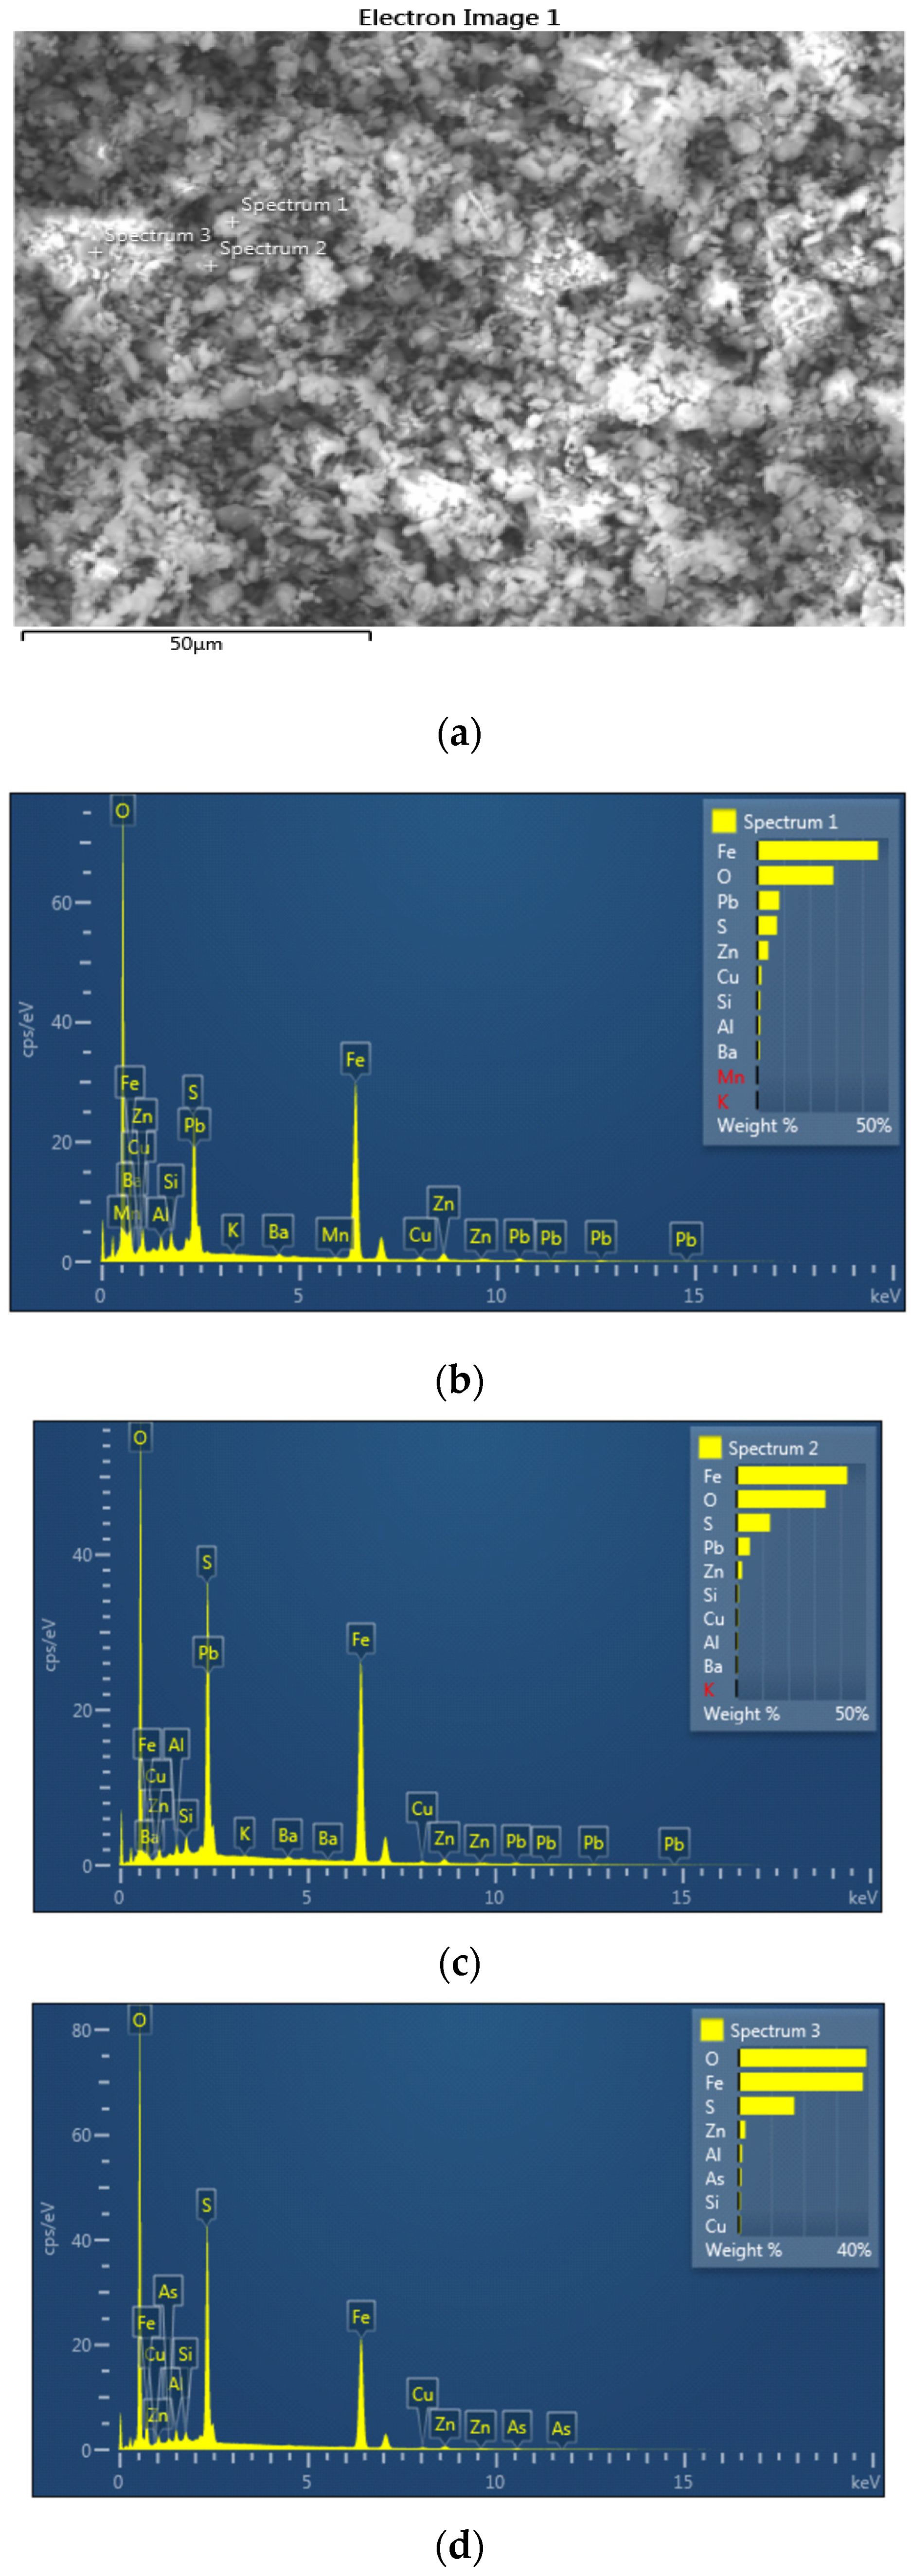
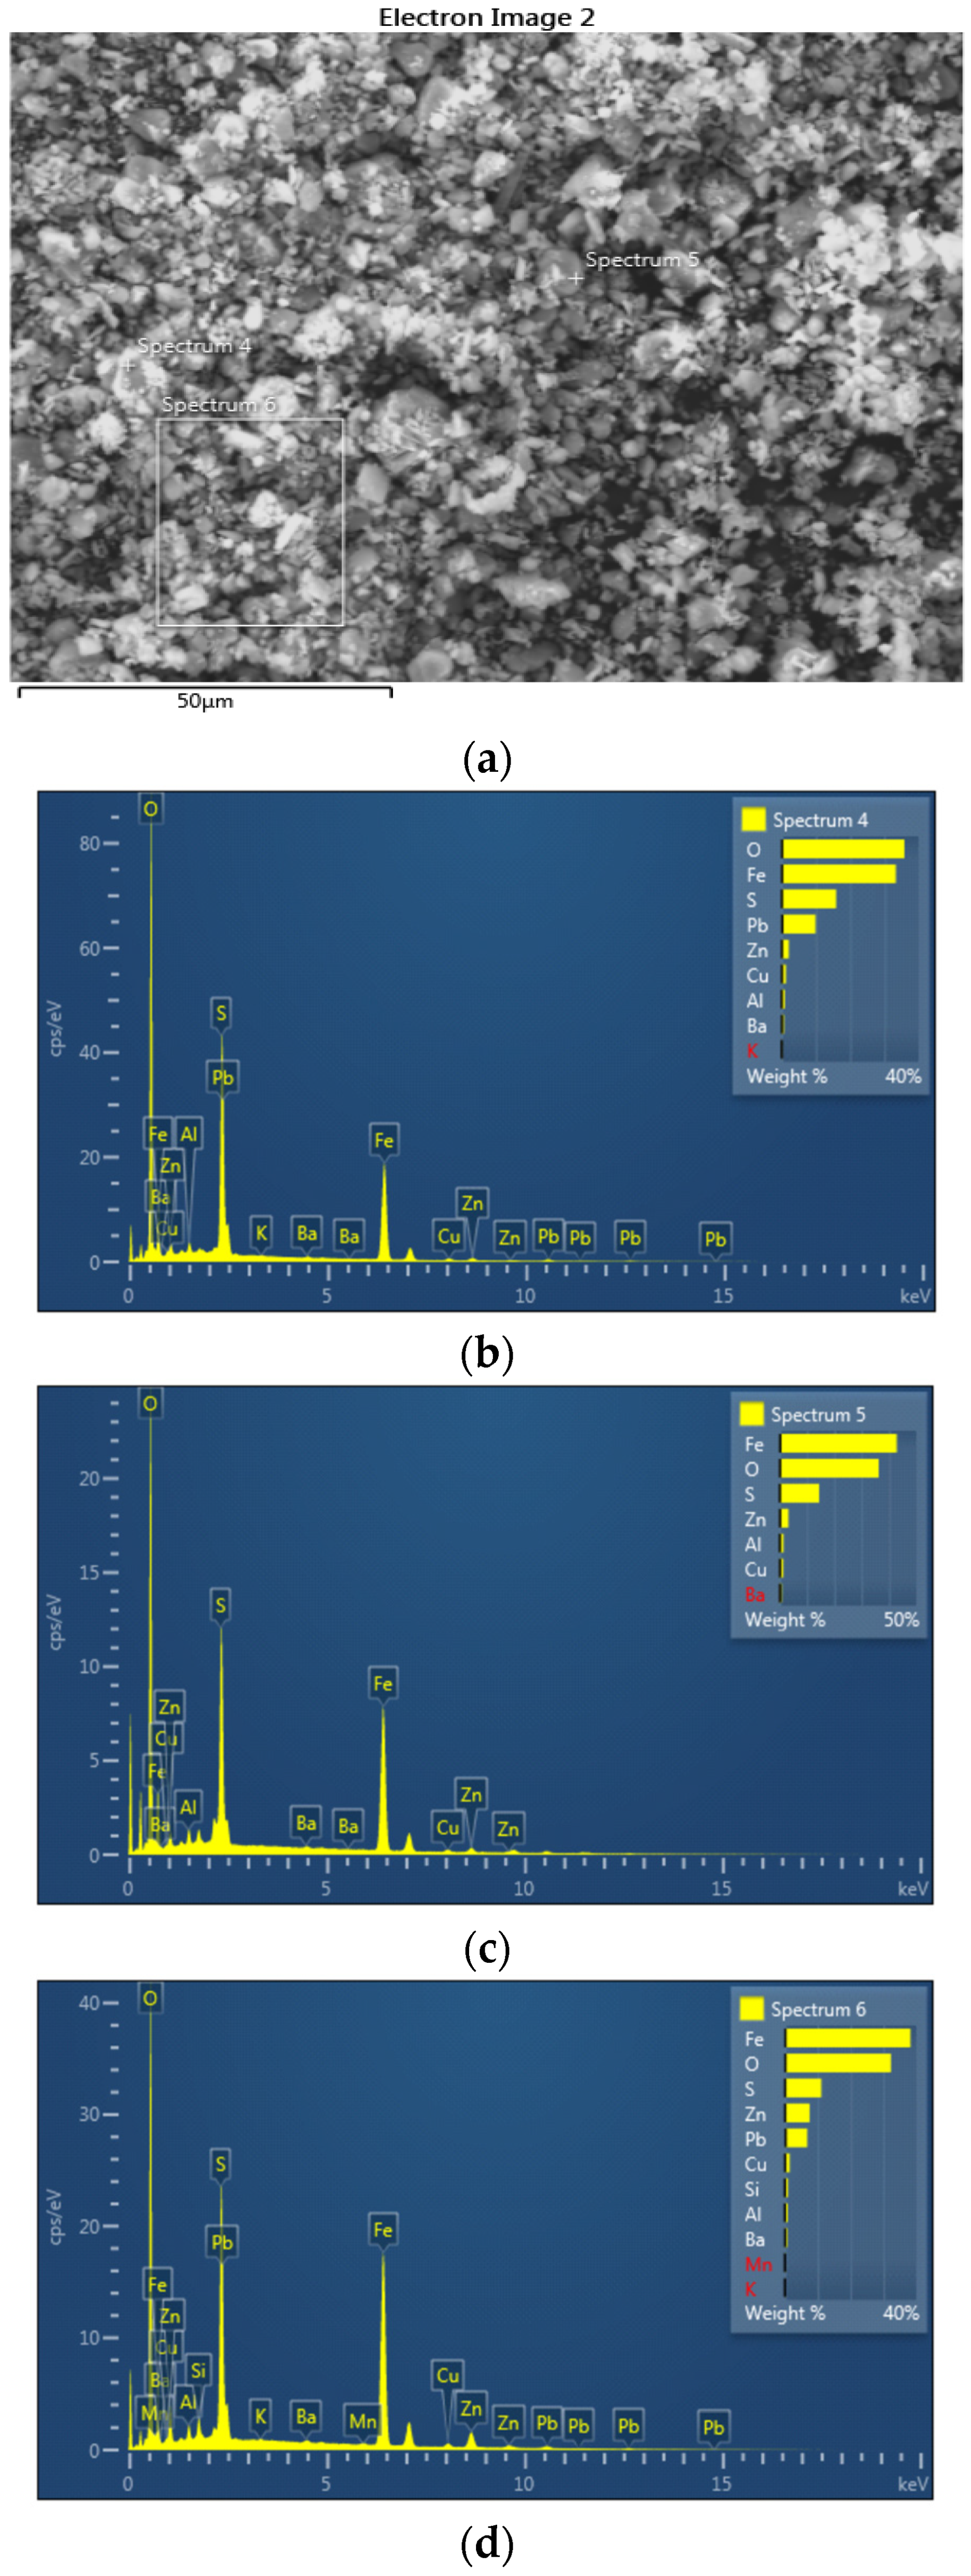
3.3. SEM-EDS Analysis
3.4. Chemical Analyses
3.5. Jarosite Roasting
3.5.1. Roasting Pb–Ag Jarosite Sludge
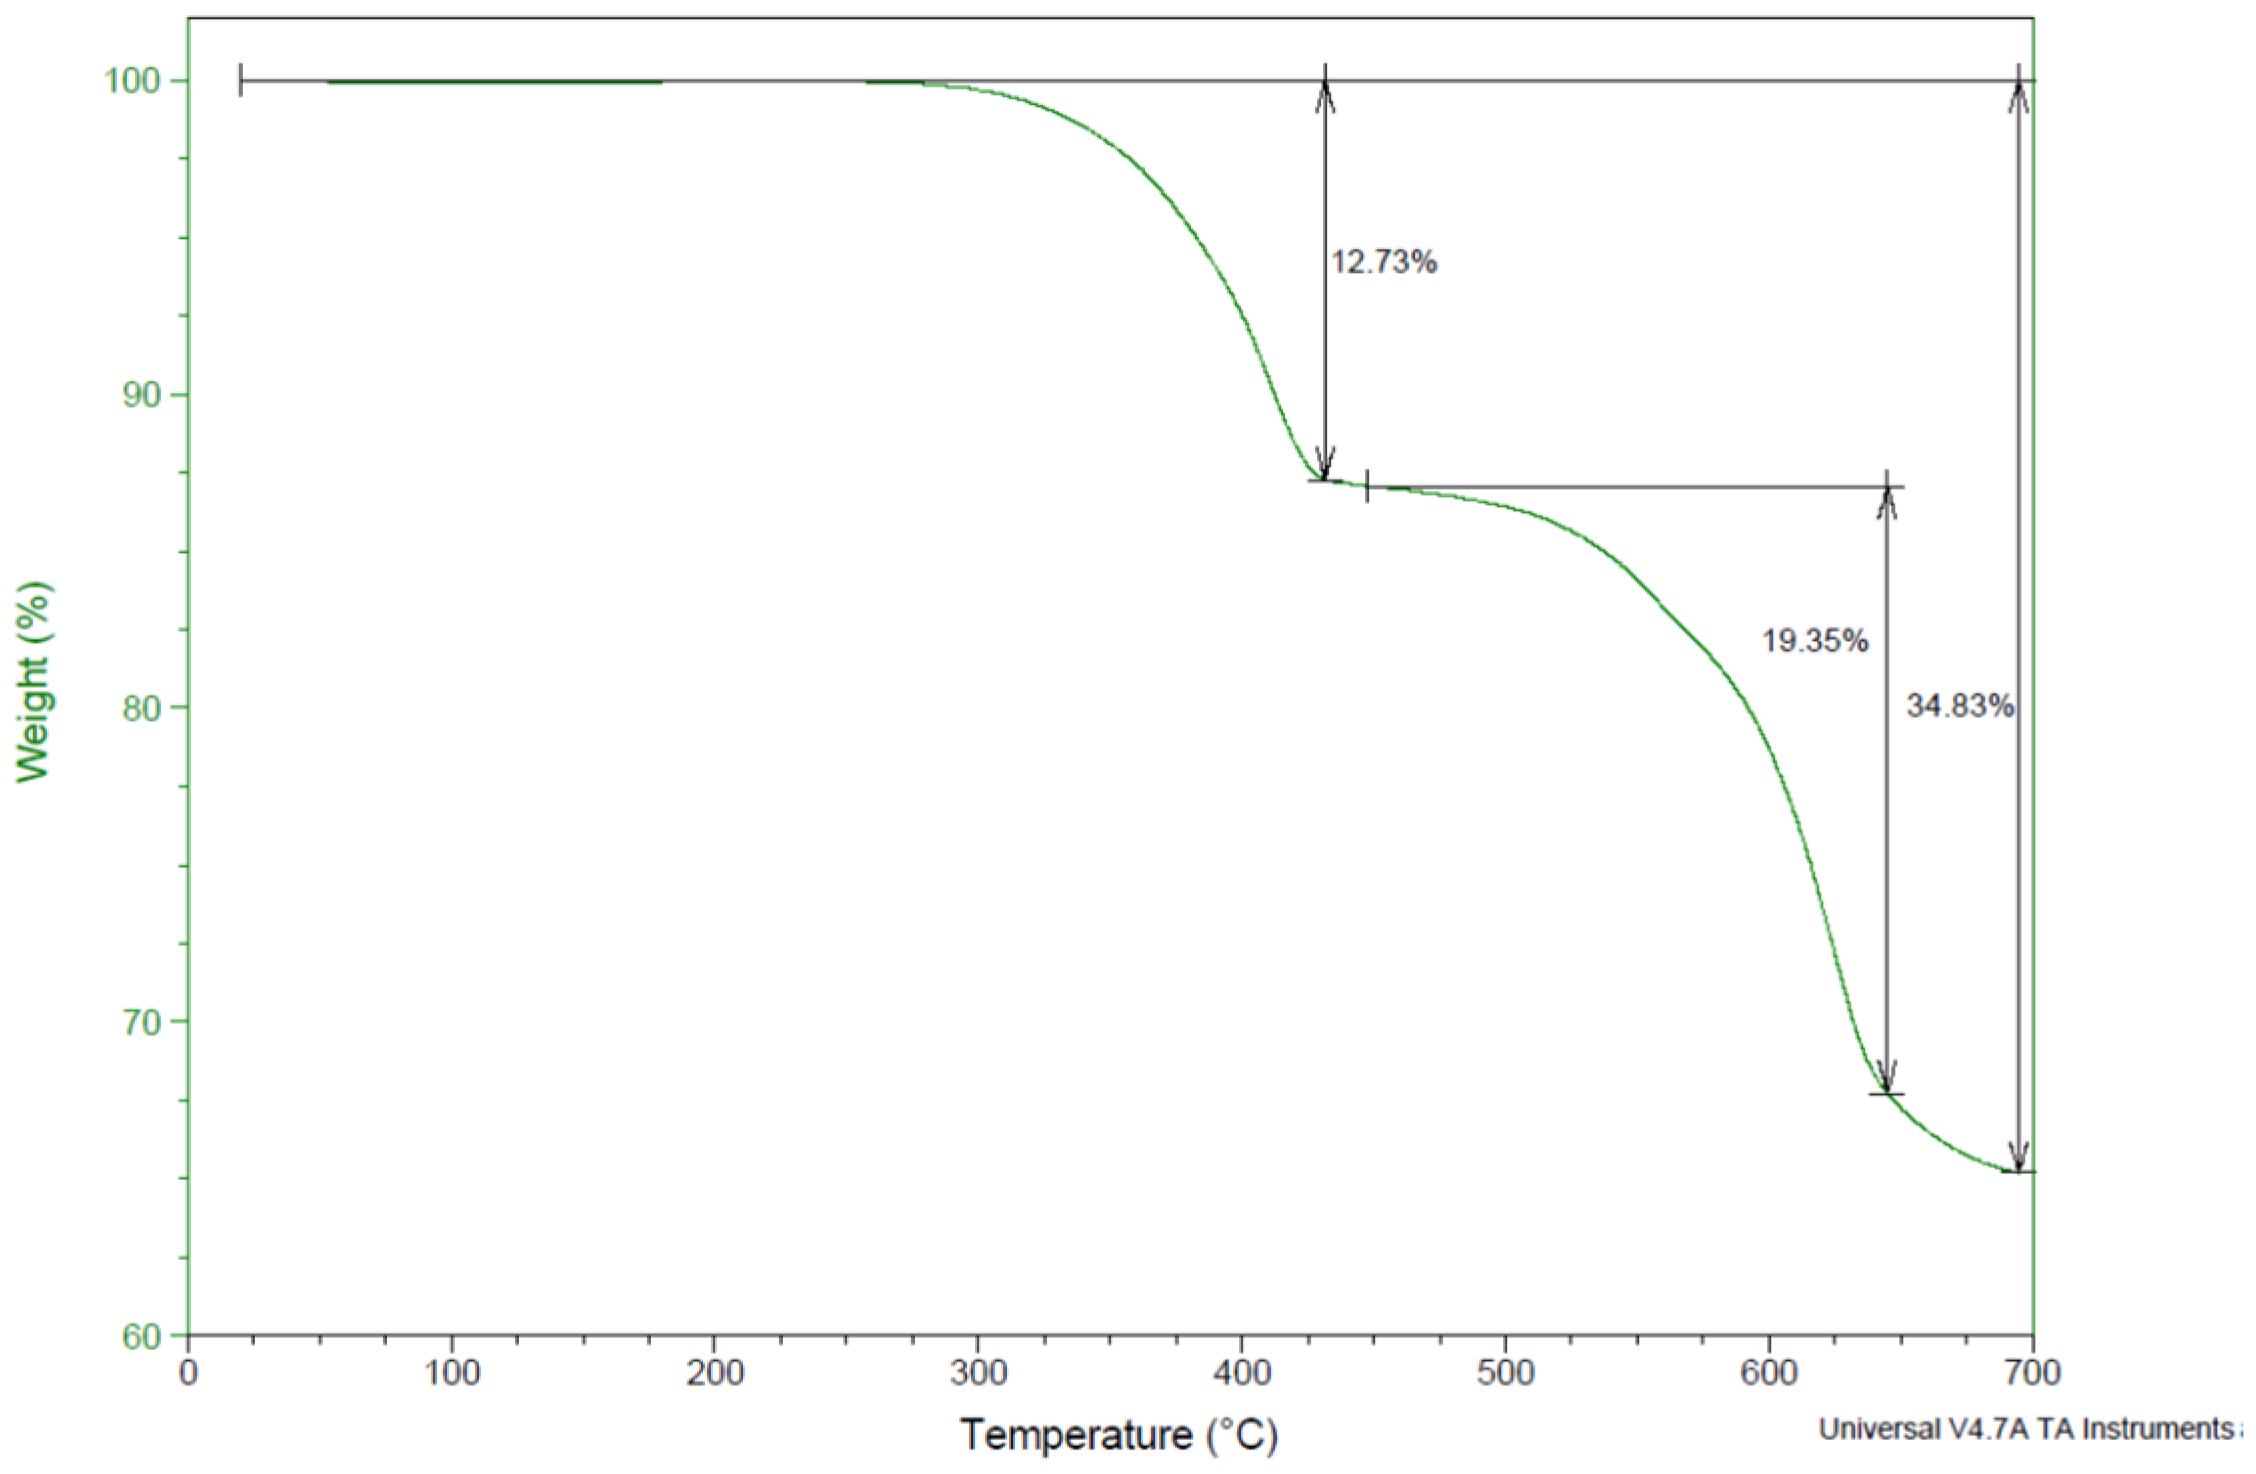
3.5.2. TGA Analyses of Jarosite Pb–Ag Sludge
- Up to 120 °C (loss of absorbed water)
- 2.
- At 120–260 °C (dihydroxylation, loss of OH−)(M) present in jarosite can be NH4, K, Na, Pb.
- 3.
- At 260–389 °C (loss of ammonia and water)
- 4.
- At 465–610 °C (loss SO2)
3.6. Leaching of the Roasted Jarosite Sample
3.7. Treatment of the Sulfate Solution
3.8. Indium Recovery Procedure
4. Conclusions
- Jarosite roasting to convert iron sulfate into insoluble hematite;
- Leaching in water in order to leach In;
- The precipitation of In from the leaching solution, 1 M NaOH;
- The dissolution of precipitate with dilute sulfuric acid and the cementation of In from solution with Al;
- The dissolution of Al with saturated NaOH, in which In was isolated as unwrought In.
Author Contributions
Funding
Data Availability Statement
Acknowledgments
Conflicts of Interest
References
- Reyes, A.I.; Patiño, F.; Flores, U.M.; Pandiyan, T.; Cruz, R.; Gutiérrez, J.E.; Reyes, M.; Flores, H.V. Dissolution rates of jarosite-type compounds in H2SO4 medium: A kinetic analysis and its importance on the recovery of metal values from hydrometallurgical wastes. Hydrometallurgy 2017, 167, 16–29. [Google Scholar] [CrossRef]
- Conić, V.; Rajčić Vujasinović, M.; Trujić, V.; Cvetkovski, V. Copper, Zinc, and Iron Bioleaching from a Polymetallic Sulphide Concentrate. Trans. Nonferrous Met. Soc. China 2014, 24, 3688–3695. [Google Scholar] [CrossRef]
- Zheng, Y.-X.; Lv, J.F.; Liu, W.; Qin, W.-Q.; Wen, S.-M. An innovative technology for recovery of zinc, lead and silver from zinc leaching residue. Physicochem. Probl. Miner. Process. 2016, 52, 943–954. [Google Scholar]
- Wang, Y.; Yang, H.; Zhang, W.; Song, R.; Jiang, B. Study on recovery of lead, zinc, iron from jarosite residues and simultaneous sulfur fixation by direct reduction. Physicochem. Probl. Miner. Process. 2018, 54, 517–526. [Google Scholar]
- Rashchi, F.; Dashti, A.; Arabpour-Yazdi, M.; Abdizadeh, H. Anglesite flotation: A study for lead recovery from zinc leach residue. Miner. Eng. 2005, 18, 205–212. [Google Scholar] [CrossRef]
- Lutandula, M.S.; Maloba, B. Recovery of cobalt and copper through reprocessing of tailings from flotation of oxidized ores. J. Environ. Chem. Eng. 2013, 1, 1085–1090. [Google Scholar] [CrossRef]
- Stanojević, D.; Filipović-Petrović, L. Doprinos integrisanoj valorizaciji metala u hidrometalurgiji cinka. Zaštita Mater. 2014, 55, 11–25. [Google Scholar]
- Sinadinović, D.; Kamberović, Ž.; Šutić, A. Leaching Kinetics of lead from Lead(II) Sulphate in Aqueous Calcium and Magnesium Chloride Solution. Hydrometallurgy 1997, 47, 137–147. [Google Scholar] [CrossRef]
- Kerolli-Mustafa, M.; Ćurković, L.; Fajković, H.; Rončević, S. Ecological Risk Assessment of Jarosite Waste Disposal. Croat. Chem. Acta 2015, 88, 189–196. [Google Scholar] [CrossRef]
- Creedy, S.; Glinin, A.; Matusewics, R.; Hughes, S.; Reuter, M. Outotec Ausmelt Technology for Treating Zinc Residues. World Metall.-Erzmetall 2013, 66, 230–235. [Google Scholar]
- Hughes, S.; Reuter, M.A.; Baxter, R.; Kaye, A.; Hughes, S.; Reuter, M.A.; Baxter, R.; Kaye, A. Ausmelt Technology for Lead and Zinc Processing. Lead Zinc 2008, 2008, 147–162. [Google Scholar]
- Kamberović, Ž.; Gajić, N.; Korać, M.; Jevtić, S.; Sokić, M.; Stojanović, J. Technologically Sustainable Route for Metals Valorization from Jarosite-PbAg Sludge. Minerals 2021, 11, 255. [Google Scholar] [CrossRef]
- Rus, A.; en Sunkar, A.S.; Topkaya, Y.A. Zinc and lead extraction from Cinkur leach residues hydrometallurgical method. Hydrometallurgy 2008, 93, 45–50. [Google Scholar]
- Turan, M.D.; Altundoğan, H.S.; Tümen, F. Recovery of zinc and lead from zinc plant residue. Hydrometallurgy 2004, 75, 169–176. [Google Scholar] [CrossRef]
- Asokan, P.; Saxena, M.; Asolekar, S.R. Hazardous jarosite use in developing nonhazardous product for engineering application. J. Hazard. Mater. 2006, 137, 1589–1599. [Google Scholar] [CrossRef]
- Asokan, P.; Saxena, M.; Asolekar, S.R. Recycling hazardous jarosite waste using coal combustion residues. Mater. Charact. 2010, 61, 1342–1355. [Google Scholar] [CrossRef]
- Pelino, M. Recycling of zinc-hydrometallurgy wastes in glass and glass ceramic materials. Waste Manag. 2000, 20, 561–568. [Google Scholar] [CrossRef]
- Pisciella, P.; Crisucci, S.; Karamanov, A. Chemical durability of glasses obtained by vitrification of industrial wastes. Waste Manag. 2001, 21, 1–9. [Google Scholar] [CrossRef]
- Guler, E.; Seyrankaya, A.; Cöcen, I. Extraction of Lead and Silver from Zinc Leach Residue by Brine Leaching. In Proceedings of the XIIth International Mineral Processing Symposium, Cappadocia Nevsehir, Turkey, 6–8 October 2010. [Google Scholar]
- Yudaev, P.; Chistyakov, E. Chelating Extractants for Metals. Metals 2022, 12, 1275. [Google Scholar] [CrossRef]
- James, S.E.; Watson, J.L.; Peter, J. Zinc Production-a Survey of Existing Smelters and Refineries. Lead-Zinc 2000, 2000, 205–225. [Google Scholar]
- Xu, S.; Wang, G.; Fan, J.; Wang, Z.; Zhang, J.; Chen, J.; Zheng, L.; Pan, J.; Wang, R. Preparation of high purity indium by chemical purification: Focus on removal of Cd, Pb, Sn and removal mechanism. Hydrometallurgy 2020, 200, 105551. [Google Scholar] [CrossRef]
- Burkitbayeva, B.; Argimbayeva, A.; Rakhymbay, G.; Avchukir, K.; Tassibekov, K.; Nauryzbayev, M. Refining of Rough Indium by Method of Reactionary Electrolysis. In Proceedings of the MATEC Web of Conferences REE-2016, Amsterdam, The Netherlands, 23–25 March 2016. [Google Scholar]
- Zelem, J. Application of Amalgam Metallurgy to the Extraction of Indium, Bachelors Theses and Reports, 1928–1970, Summer 6-4-1954, Montana Tech Library, Digital Commons @ Montana Tech. Available online: https://digitalcommons.mtech.edu/bach_theses (accessed on 1 January 2020).
- Li, D.-S.; Dai, Y.-N.; Yang, B.; Liu, D.-C. Purification of indium by vacuum distillation and its analysis. J. Cent. South Univ. 2013, 20, 337–341. [Google Scholar] [CrossRef]
- Alfantazi, A.M.; Moskalyk, R.R. Processing of indium: A review. Miner. Eng. 2003, 16, 687–694. [Google Scholar] [CrossRef]
- Conić, V.; Božić, D.; Dragulović, S.; Avramović, L.J.; Jonović, R.; Bugarin, M. Research on acid leaching of Cu, Zn and In from Jarosite waste. In Proceedings of the XIV International Mineral Processing and Recycling Conference, Belgrade, Serbia, 12–14 May 2021. [Google Scholar]
- Frost, R.; Wills, A.; Kloprogge, J.; Martens, W. Thermal decomposition of ammonium jarosite (NH4)Fe3(SO4)2(OH)6. J. Therm. Anal. Calorim. 2006, 84, 489–496. [Google Scholar] [CrossRef] [Green Version]
- Hu, B.; Richeys, R.; Baird, J. Chemical Equilibrium and Critical Phenomena: Solubility of Indium Oxide in Isobutyric Acid Water Near the Consolute Point. J. Chem. Eng. 2009, 54, 1537–1540. [Google Scholar] [CrossRef]
- Lokanc, M.; Eggert, R.; Redlinger, M. The Availability of Indium: The Present, Medium Term, and Long Term; National Renewable Energy Laboratory: Golden, CO, USA, 2015; pp. 1–79. Available online: https://www.nrel.gov/docs/fy16osti/62409.pdf (accessed on 7 April 2023).
- Kangas, P.; Lundström, M.; Orko, I.; Koukkari, P. The Jarogain Process for Metals Recovery from Jarosite and Electric Arc Furnace Dust; VTT Technical Research Centre of Finland Ltd.: Espoo, Finland, 2017; ISBN 978-951-38-8596-0. ISSN 2242-1211. [Google Scholar]
- Rocchetti, L.; Amato, A.; Beolchini, F. Recovery of indium from liquid crystal displays. J. Clean. Prod. 2016, 116, 299–305. [Google Scholar] [CrossRef]


| Spectrum 1 | Spectrum 2 | Spectrum 3 | Spectrum 4 | Spectrum 5 | Spectrum 6 | |
|---|---|---|---|---|---|---|
| O (%) | 28.95 | 34.25 | 39.29 | 35.88 | 36.21 | 32.22 |
| Al (%) | 1.14 | 0.66 | 1.11 | 0.94 | 1.38 | 0.86 |
| Si (%) | 1.14 | 0.81 | 0.65 | - | - | 0.93 |
| S (%) | 7.50 | 12.91 | 17.15 | 15.92 | 14.39 | 11.07 |
| K (%) | 0.11 | 0.07 | - | 0.12 | - | 0.10 |
| Mn (%) | 0.22 | - | - | - | - | 0.29 |
| Fe (%) | 45.97 | 42.72 | 38.24 | 33.35 | 42.81 | 38.19 |
| Cu (%) | 1.48 | 0.74 | 0.65 | 1.19 | 1.31 | 1.43 |
| Zn (%) | 4.22 | 2.09 | 2.08 | 2.04 | 3.15 | 7.44 |
| As (%) | - | - | 0.83 | - | - | - |
| Ba (%) | 0.90 | 0.64 | - | 0.71 | 0.75 | 0.71 |
| Pb (%) | 8.37 | 5.11 | - | 9.85 | - | 6.76 |
| Σ | 100.00 | 100.00 | 100.00 | 100.00 | 100.00 | 100.00 |
| Element | Cu % | Zn % | Fe % | Ag % | Pb % | In % | S % |
|---|---|---|---|---|---|---|---|
| Content | 0.7 | 5.39 | 30.61 | 0.034 | 5.68 | 0.034 | 9.61 |
| Roasting Time 4 h | Leaching with H2O (S:L = 1:5), t = 1 h and pH after Leaching | Extent of Leaching | |||||
|---|---|---|---|---|---|---|---|
| Sample Mass (g) | Roasting Temperature (°C) | pH | Cu % | Zn % | Fe % | In % | |
| 1. | 100 | 530 | 2.25 | 91.07 | 91.97 | 9.60 | 100.00 |
| 2. | 100 | 570 | 2.73 | 72.74 | 74.23 | 1.30 | 37.91 |
| 3. | 100 | 630 | 4.97 | 42.87 | 71.10 | 0.51 | 0.08 |
| Cu (g/L) | Zn (g/L) | Fe (g/L) | In (g/L) |
|---|---|---|---|
| 0.63 | 4.95 | 2.93 | 0.034 |
| Metals | Fe | In |
|---|---|---|
| Leaching degree, % | 9.60 | 100.00 |
| Percentage of metal content in solution after precipitation, % | 0.61 | 2.10 |
| Concentration in solution, g/L | 2.93 | 0.034 |
| Concentration of metal content in solution after precipitation, g/L | 0.018 | 0.00071 |
Disclaimer/Publisher’s Note: The statements, opinions and data contained in all publications are solely those of the individual author(s) and contributor(s) and not of MDPI and/or the editor(s). MDPI and/or the editor(s) disclaim responsibility for any injury to people or property resulting from any ideas, methods, instructions or products referred to in the content. |
© 2023 by the authors. Licensee MDPI, Basel, Switzerland. This article is an open access article distributed under the terms and conditions of the Creative Commons Attribution (CC BY) license (https://creativecommons.org/licenses/by/4.0/).
Share and Cite
Janošević, M.; Conić, V.; Božić, D.; Avramović, L.; Jovanović, I.; Kamberović, Ž.; Marjanović, S. Indium Recovery from Jarosite Pb–Ag Tailings Waste (Part 1). Minerals 2023, 13, 540. https://doi.org/10.3390/min13040540
Janošević M, Conić V, Božić D, Avramović L, Jovanović I, Kamberović Ž, Marjanović S. Indium Recovery from Jarosite Pb–Ag Tailings Waste (Part 1). Minerals. 2023; 13(4):540. https://doi.org/10.3390/min13040540
Chicago/Turabian StyleJanošević, Miloš, Vesna Conić, Dragana Božić, Ljiljana Avramović, Ivana Jovanović, Željko Kamberović, and Saša Marjanović. 2023. "Indium Recovery from Jarosite Pb–Ag Tailings Waste (Part 1)" Minerals 13, no. 4: 540. https://doi.org/10.3390/min13040540