Article

Features of the Physical-Mechanical Properties and Chemical Composition of Chert Gravels

Civil Engineering Department, Ashdod Campus, Sami Shamoon College of Engineering, Jabotinsky 84, Ashdod 77245, Israel
*
Author to whom correspondence should be addressed.
Minerals 2023, 13(4), 455; https://doi.org/10.3390/min13040455
Submission received: 9 February 2023 / Revised: 17 March 2023 / Accepted: 20 March 2023 / Published: 23 March 2023
(This article belongs to the Special Issue Management, Recycling and Reuse of Industrial Waste)

Abstract

:
The chert gravels are a by-product of sand mining in the south of Israel; the reserves amount to tens of millions of tons and continue to grow. The attempts of their comminution for the production of aggregates by conventional mechanical methods have not yet been successful due to the high abrasiveness, as well as the flaky form of their fracturing. This study was motivated by the need to find an alternative method to rock comminution that would ensure aggregate production in line with the requirements of the asphalt and concrete industry. This article deals with the first inevitable stage on the way to this goal, which consists of an extensive laboratory study of the physical and mechanical properties of the chert gravels, as well as the features of their chemical composition. The results show that the chert rock, consisting of quartz micro grains, contains calcium, sulfur, phosphorus, and barium impurities. The rock is characterized by extremely low porosity and water absorption (less than 1%) and high values of tensile strength (10.8 ± 3.3) and electrical resistivity (23.0 ± 11.9 kΩm). The cubic uniaxial compression strength of the rock is relatively not high (37.3 ± 10.4 MPa), which contradicts the assessment made based on the Schmidt hammer and Point Load studies (158 ± 30.4 MPa and 321 ± 118.5 MPa, respectively).

1. Introduction

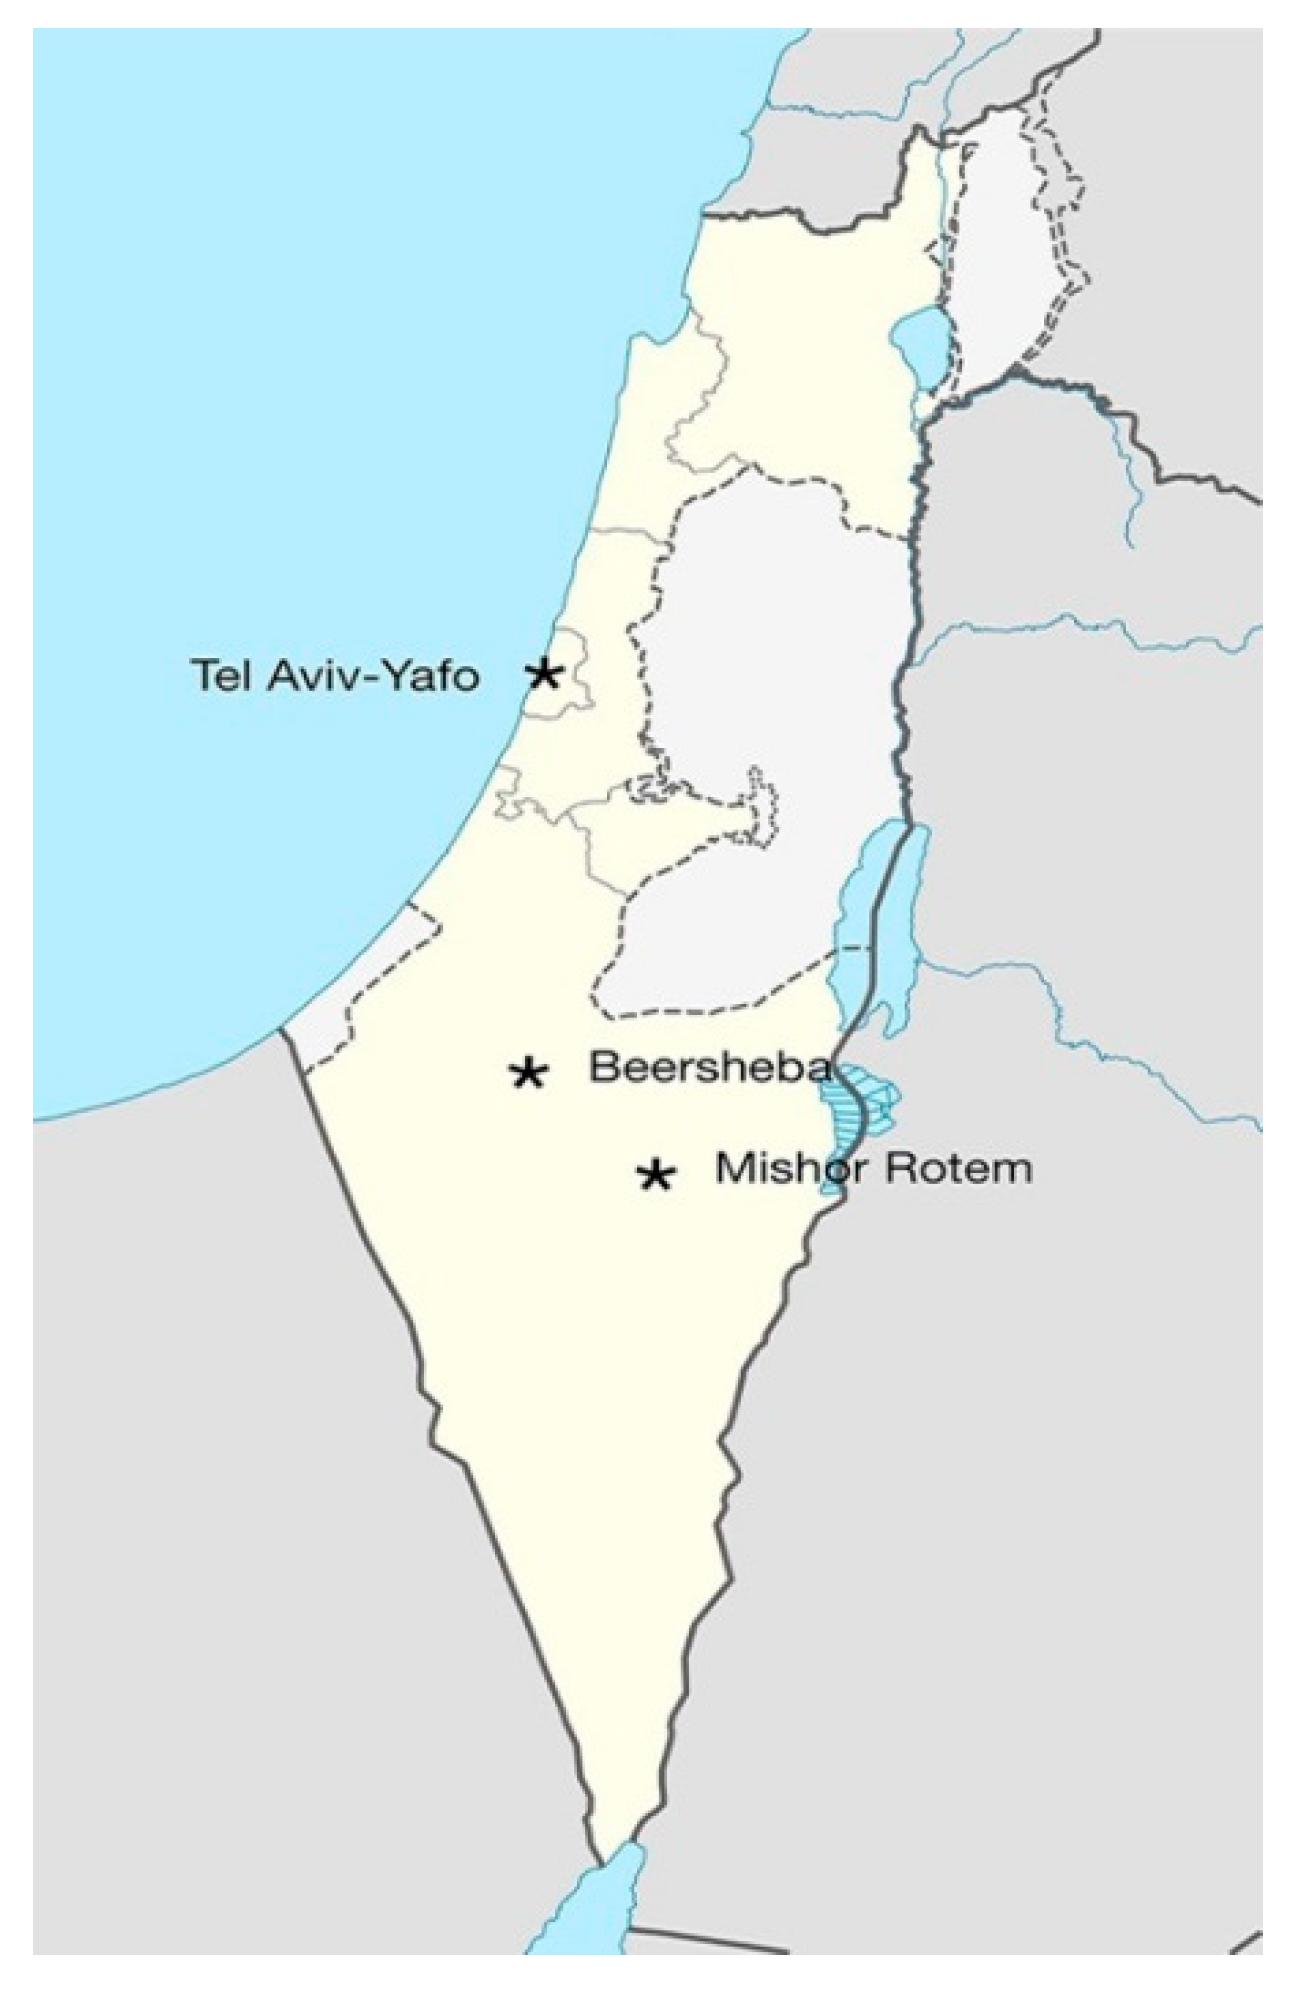
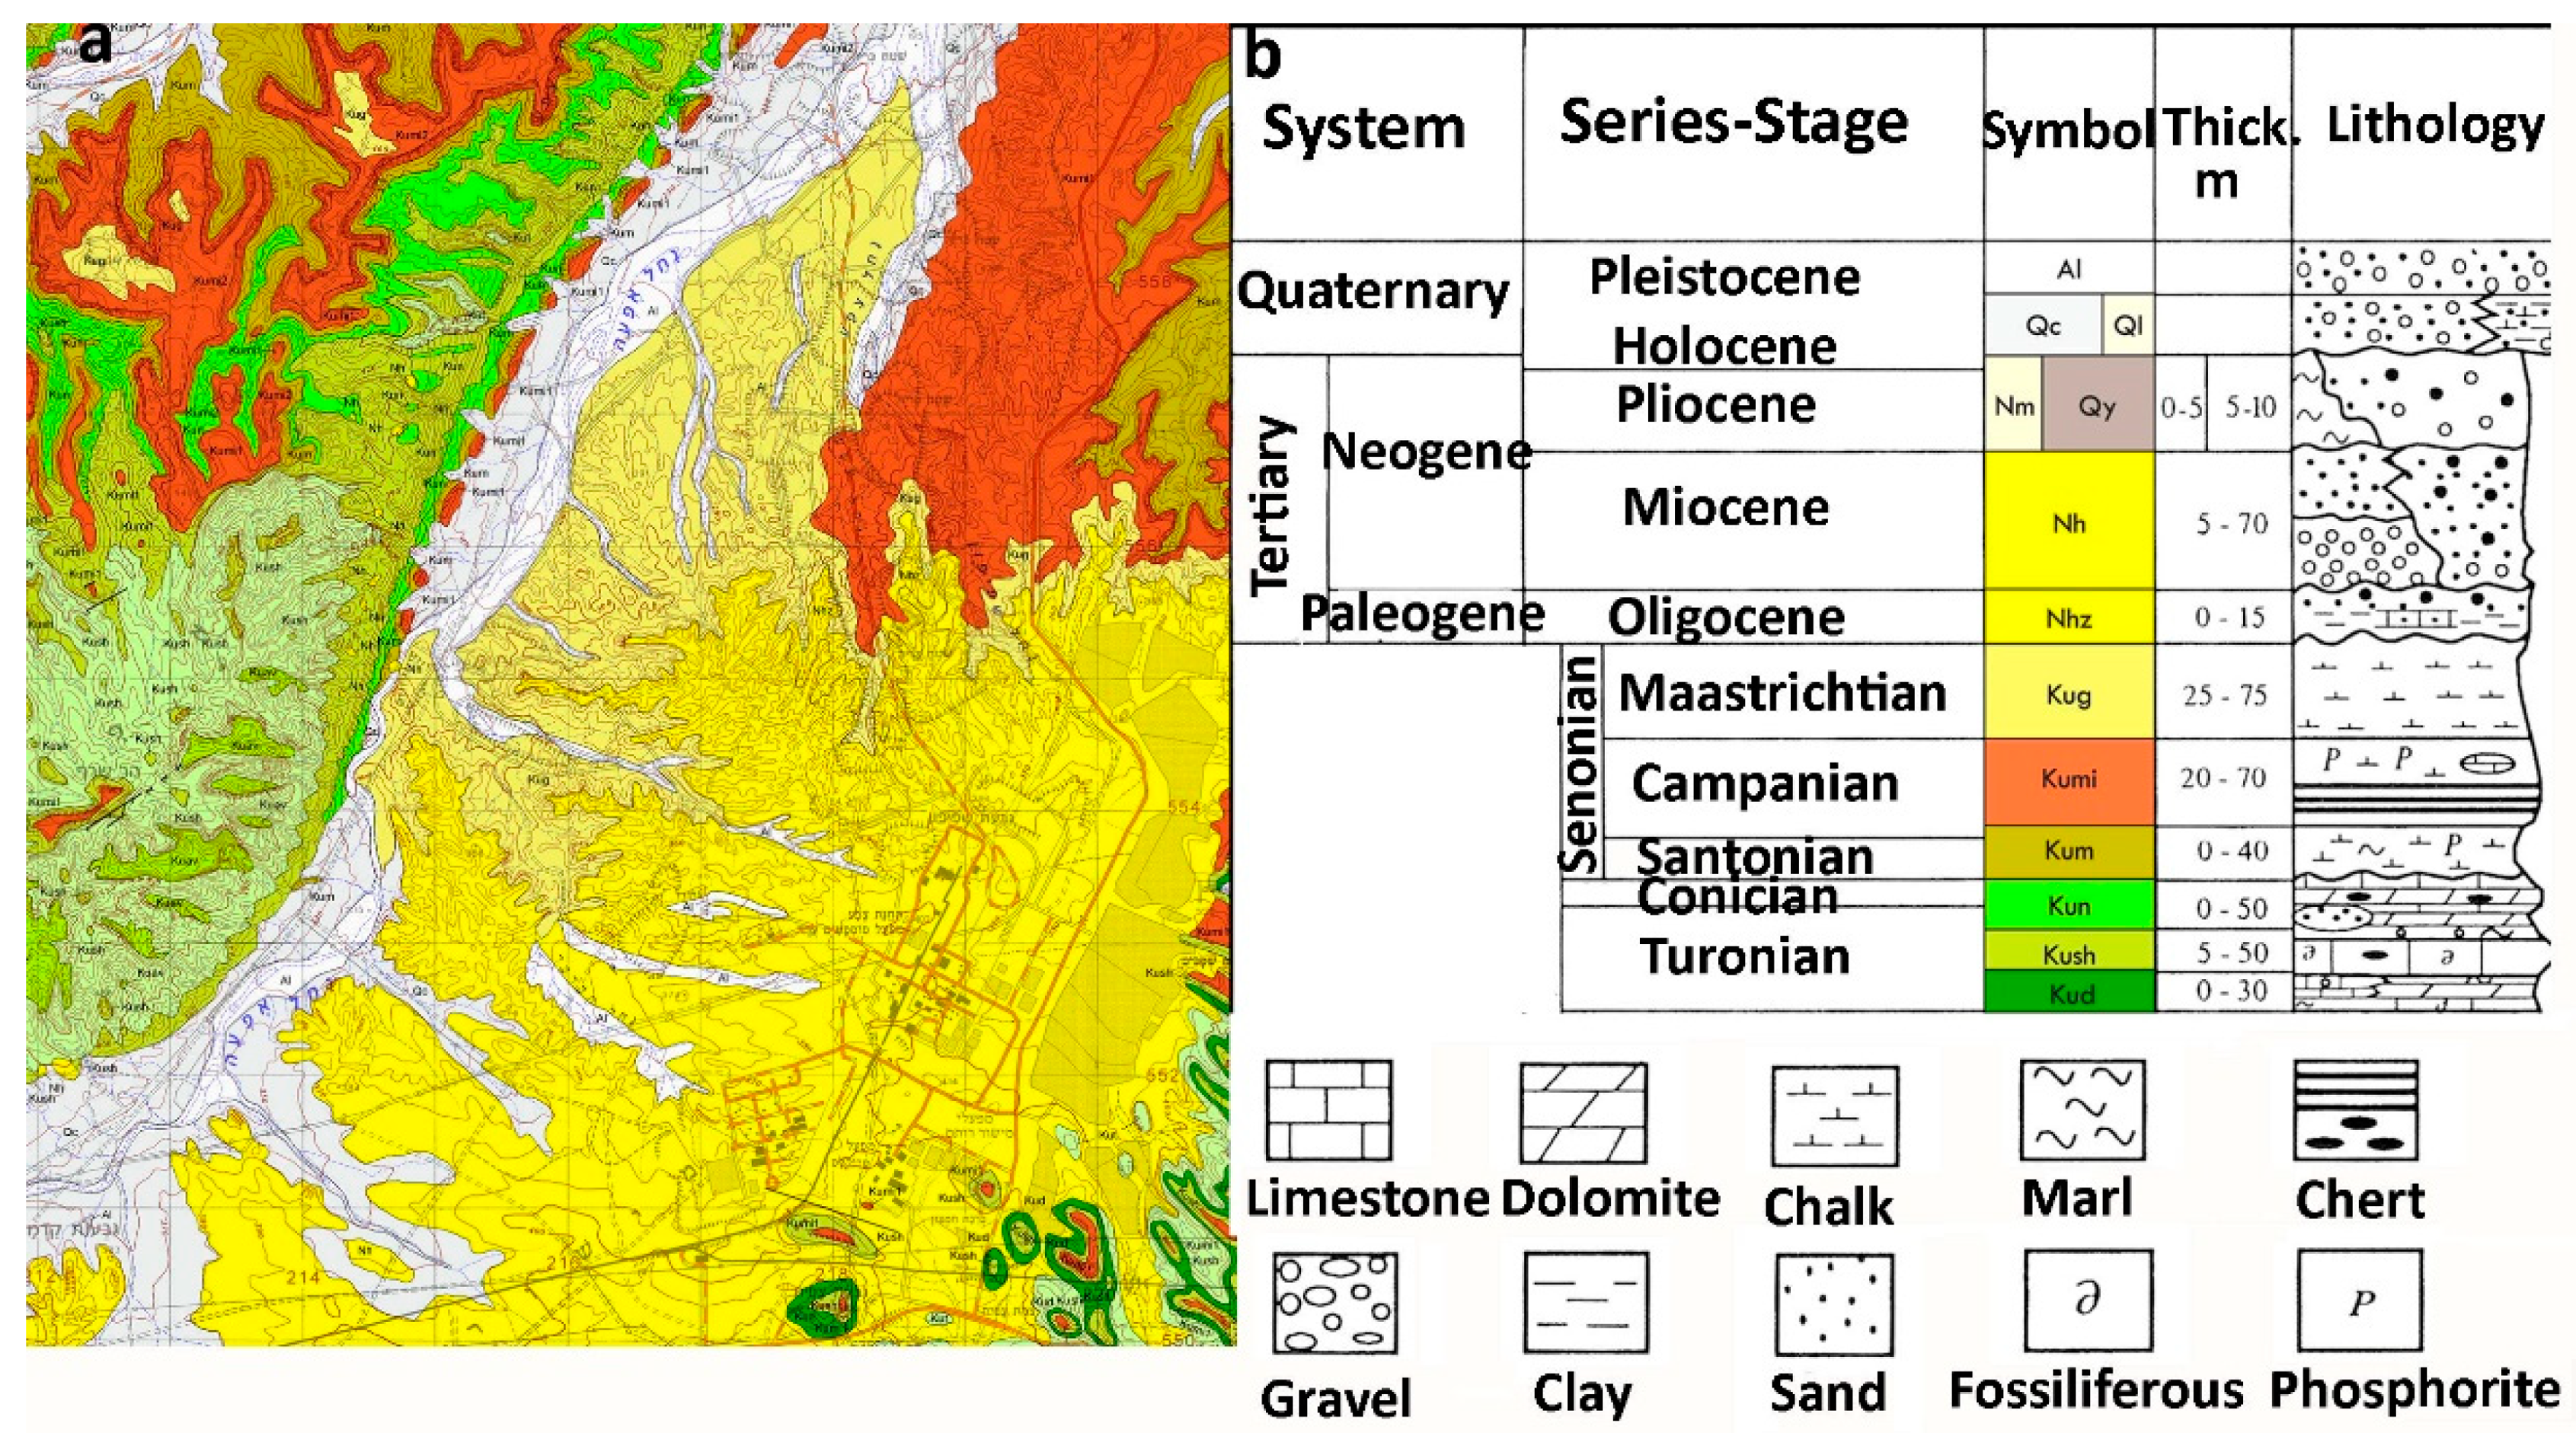
1.1. Geological Background

The site under study is located in the Southern part of Israel (almost 200 km south of Tel Aviv downtown–Figure 1).
The Rotem Formation, first determined by [1] as the Rotem Member in the Rotem basin, is exposed throughout the Arava and in the Negev; it uncomfortably overlies the Zefa Formation (Figure 2a–d) and older units (lower part of the Hazeva Group, as well as Eocene and Cretaceous strata). Detrital fragments are mainly sub-rounded monocrystalline quartz and chert (75%–100%), feldspar (<25%), clays, and heavy minerals. Chert fragments are found in both sand and gravel sizes. Pebbles in the Rotem Formation are mainly “imported chert” [2].
The Mishor-Rotem region was previously studied by [3,4] aiming to estimate the mining potential of the region for the production of economical materials, including oil shale, sand, clay, etc.
Figure 2. Geological information on the Mishor-Rotem region: (a) the map, (b) the stratigraphical elements (modified from [5]).
Minerals 13 00455 g002
The chert rock is a typical and intrinsic by-product in the quarrying of sand in the Mishor-Rotem region (Figure 3a). This is dark, stripped, highly abrasive, and strong gravel (Figure 3b) of rock, sometimes covered with white carbonate material. The typical size of the gravel ranges from 5 cm to 20 cm (Figure 3b), but it appears in horizons to be 0.2 m to 1 m thick; sometimes, it is randomly distributed in the geological section of sand (Figure 3c). The average content of chert rock in the sand deposit, according to a visual assessment, is estimated at 30% of the volume (Figure 3c). The attempts to produce the different types of aggregate using the ordinary technologies of rock fragmentation were economically unsuccessful up to date due to its high abrasiveness and the specific flaky shape of chert fragments after comminution. This situation has led to the concentration of a significant amount of chert “waste” in the quarries (up to 19 million tons) and, as a consequence, to the non-optimal use of natural, economical materials and the area of open pits (Figure 3d). This paper deals with the wide study of mechanical, physical properties and the chemical composition of chert gravels. Its motivation is to understand which of them can assist in developing the methodology of gravel comminution to meet the aggregate requirements in the asphalt and concrete industry.

1.2. Chert/Flint Properties

As noted in [6], chalcedony is the predominant variety in most microcrystalline quartz, including flint and chert. Their crystals are so tiny that chert and flint fracture more like glass than quartz crystals. The difference between chert and flint is color: flint is black or nearly black, and chert tends to be white, gray, or pink and can be either plain, banded, or preserve fossil traces. However, sometimes some differences in the definition of both rocks can be found in the scientific literature. In any case, it cannot be denied that these rocks are very similar. An analysis of the scientific literature indicates an almost complete absence of studies on the mechanical properties of chert gravels, as most research was devoted to flint rock, e.g., [7,8,9]. Since the two rock types are indeed similar, the results of the study are considered in comparison with those for flint rocks [7,8,9]. Analysis of the mechanical properties of flint rock [9] shows that this rock is indeed strong (the values of uniaxial compressive and tensile strength range between 112–395 MPa and 7–46 MPa), highly brittle (the value of its elastic modulus changes in the range of 74–85 GPa) and significantly abrasive (Cerchar abrasivity index—3.3–3.9). Such results may explain why the conventional methods for flint/chert crushing have been unsatisfactory up to date.
Our analysis shows that no methodology suggests an effective comminution of chert gravels, as well as recommendations for using this rock in any alternative way. As a result, the chert gravels are practically not used, and the accumulation of significant reserves of chert “waste” reduces the quarrying efficiency in the Mishor-Rotem area and the use of quarry areas. A comprehensive understanding of the properties of chert gravel is a new and inevitable step towards the development of an efficient comminution methodology and is, therefore, of great importance from an environmental climate point of view.

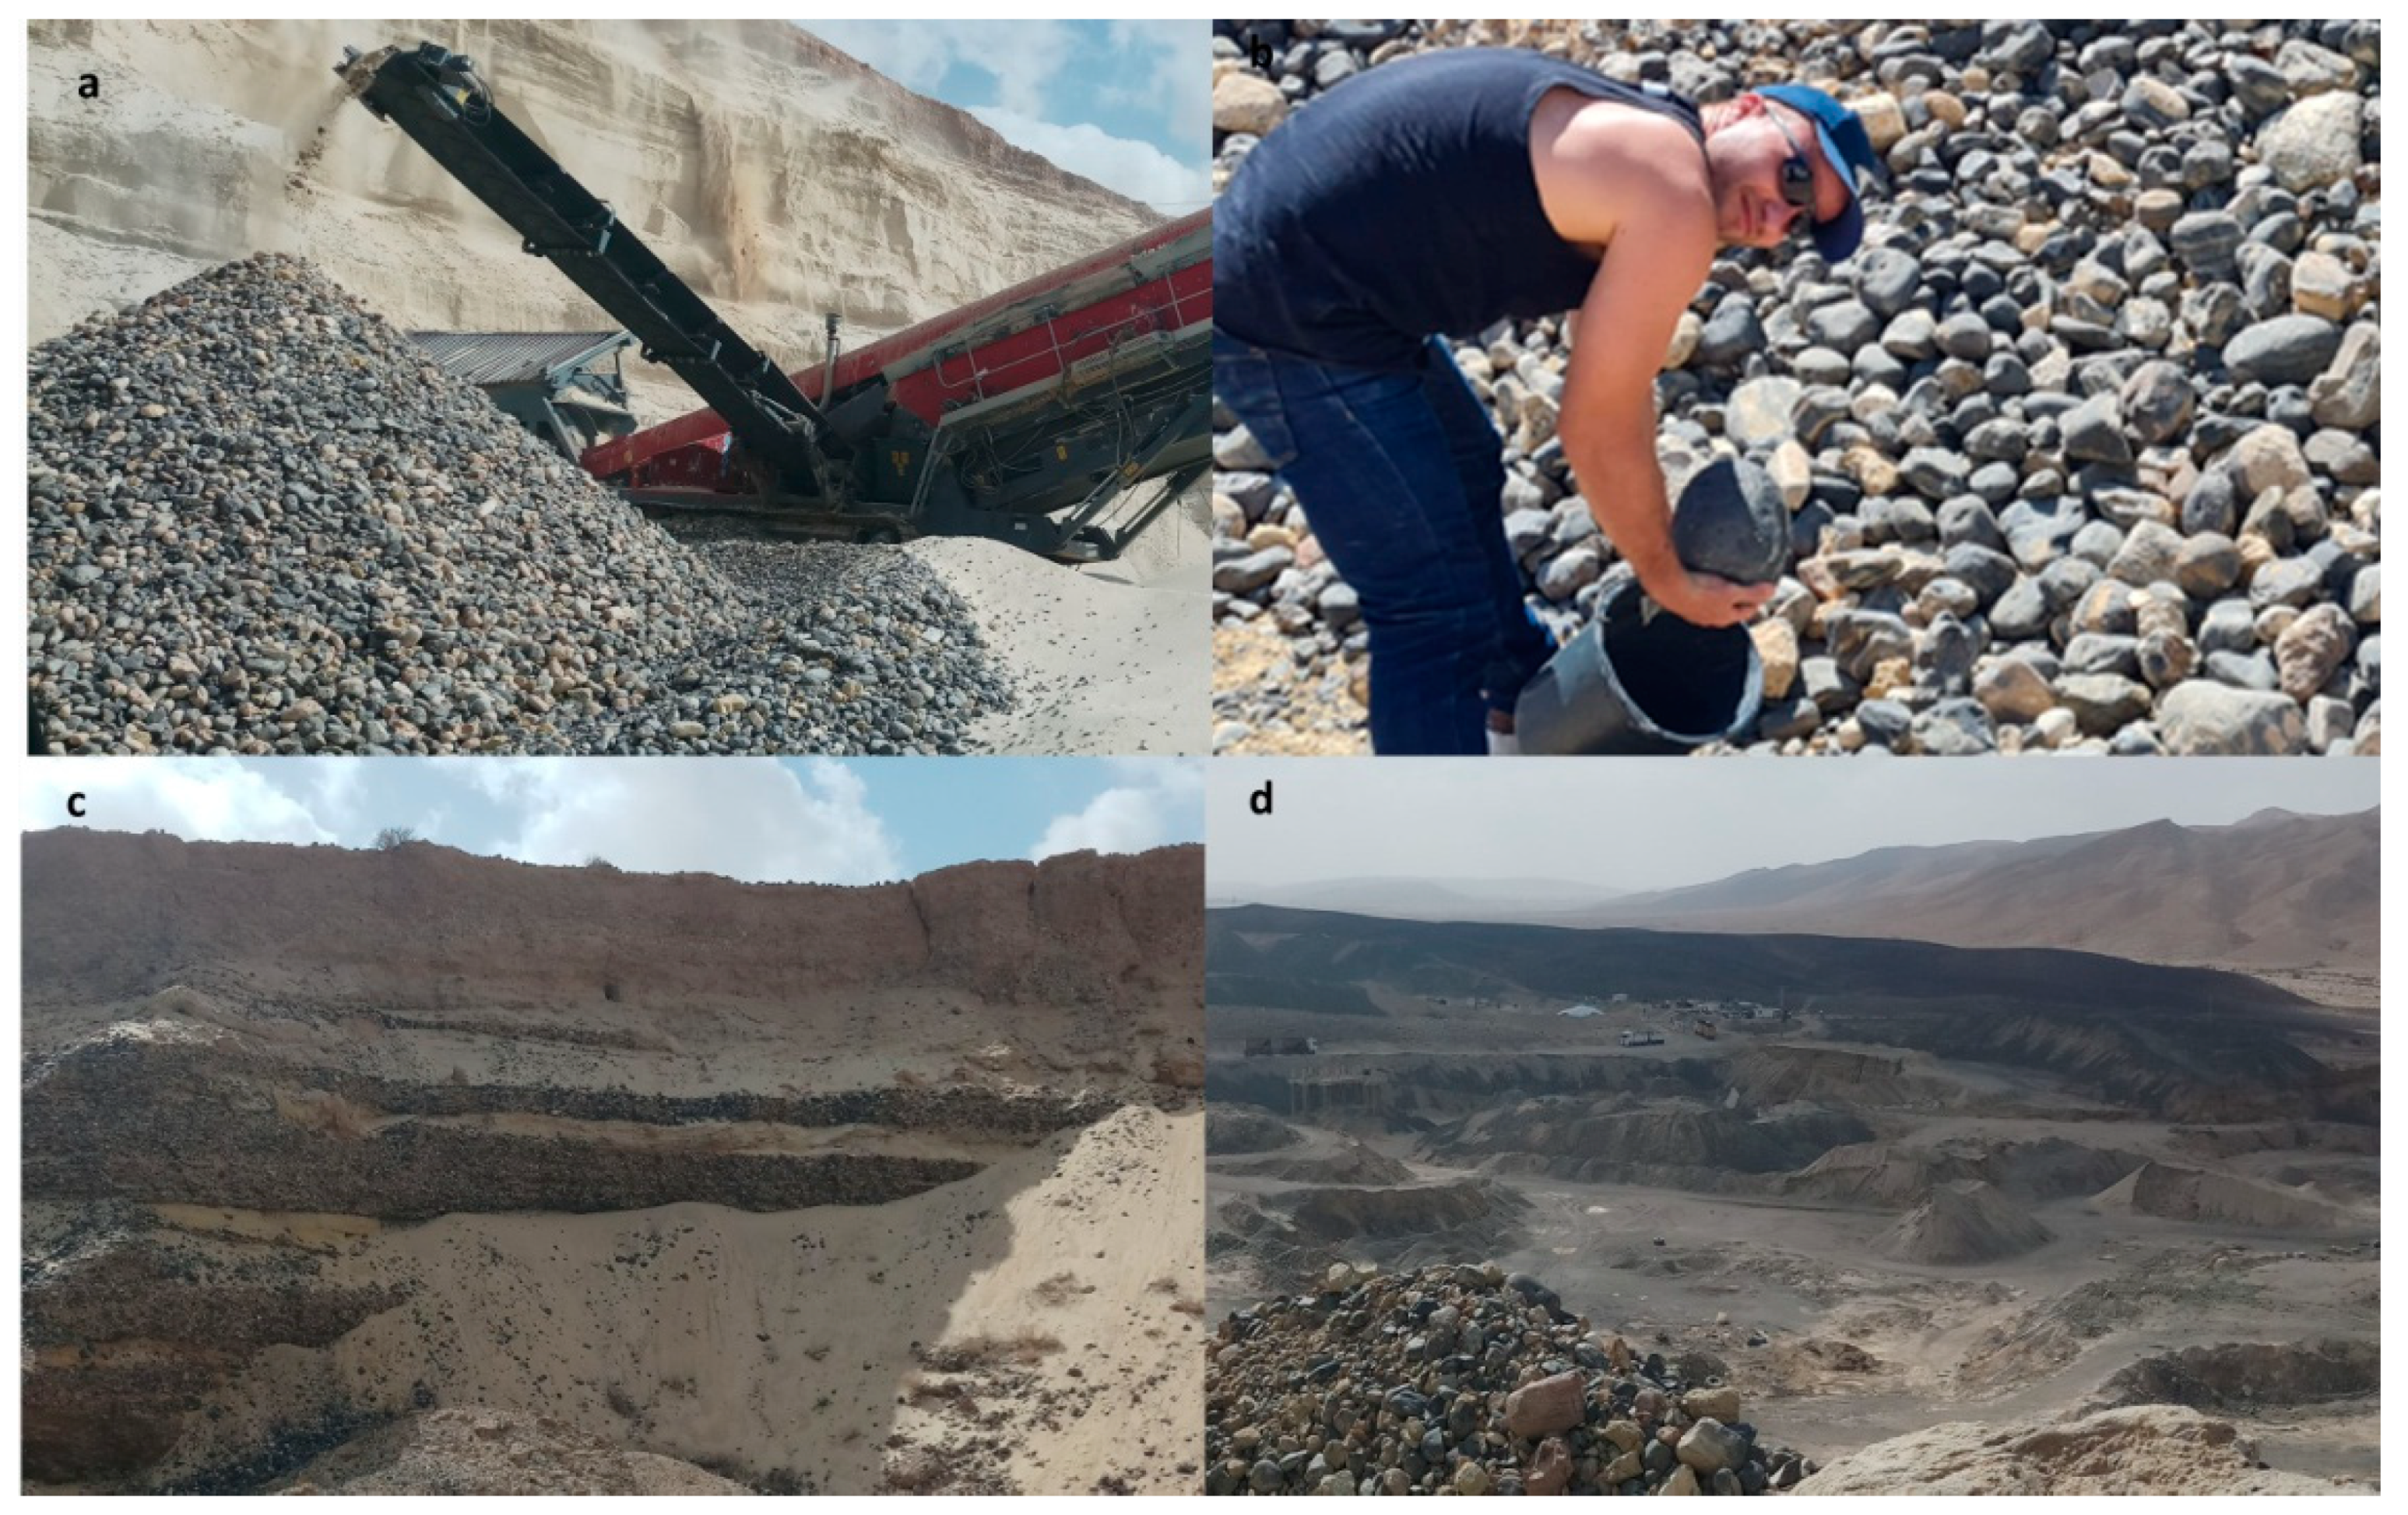
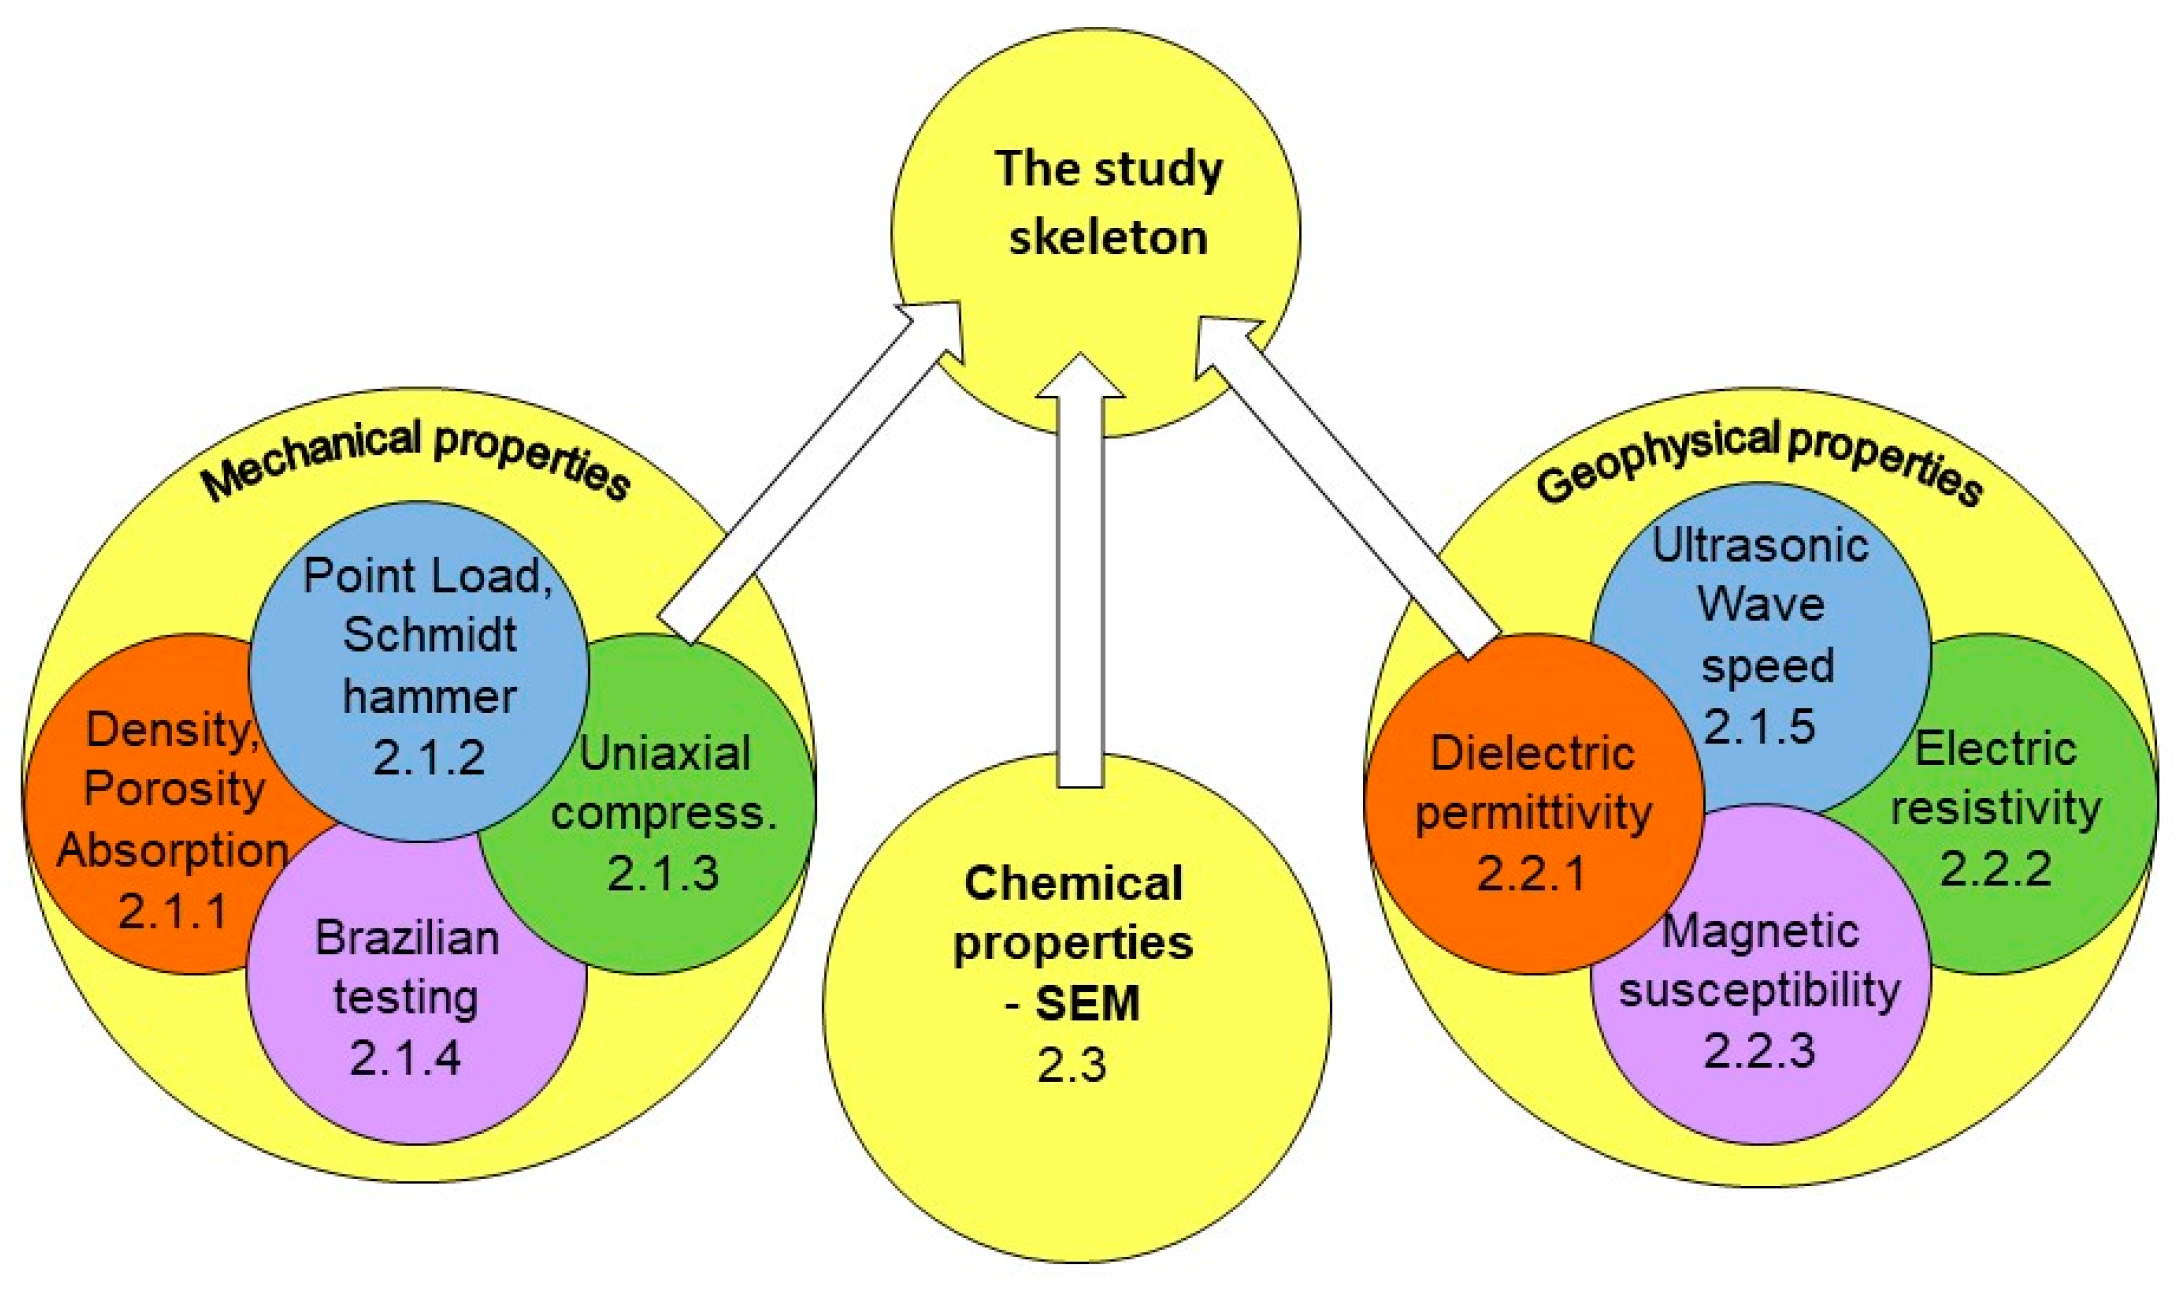
2. Methods, Instruments, and Results

The physical-mechanical properties of the chert gravels were studied on more than 306 specimens collected at the Mishor-Rotem area.
The research skeleton is shown in Figure 4. It is seen that the study was designed to consist of three main phases: a. the phase of the study of mechanical properties (Section 2.1.1, Section 2.1.2, Section 2.1.3 and Section 2.1.4); b. the phase of the study of geophysical properties (Section 2.1.5, Section 2.2.1, Section 2.2.2 and Section 2.2.3); c. the phase of the study of chemical properties (Section 2.3).

2.1. Mechanical Properties

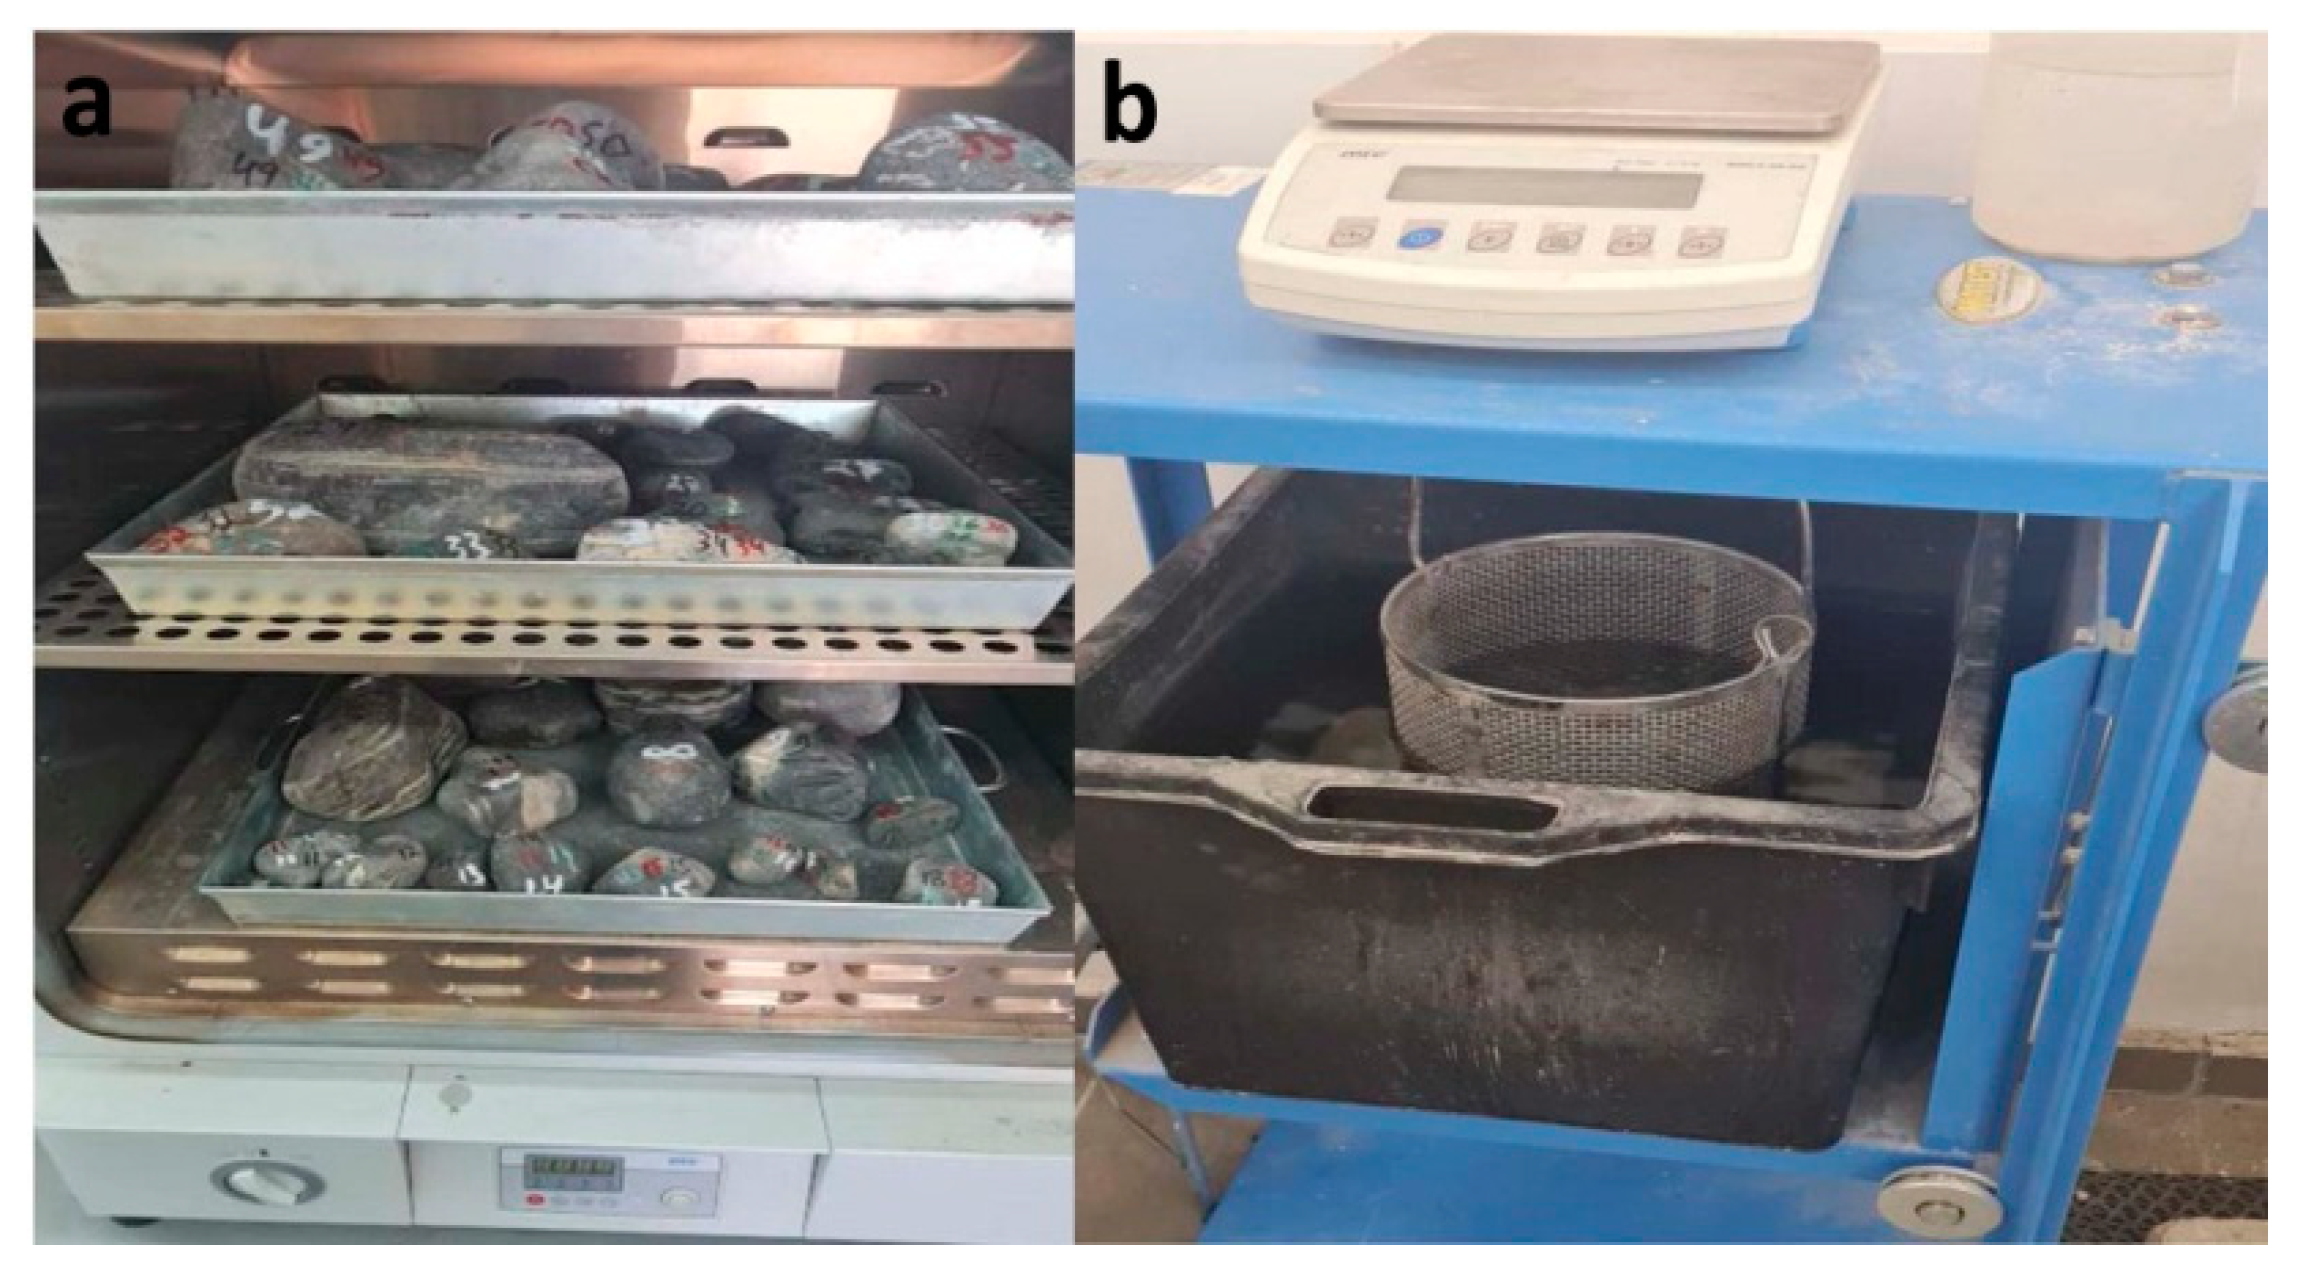
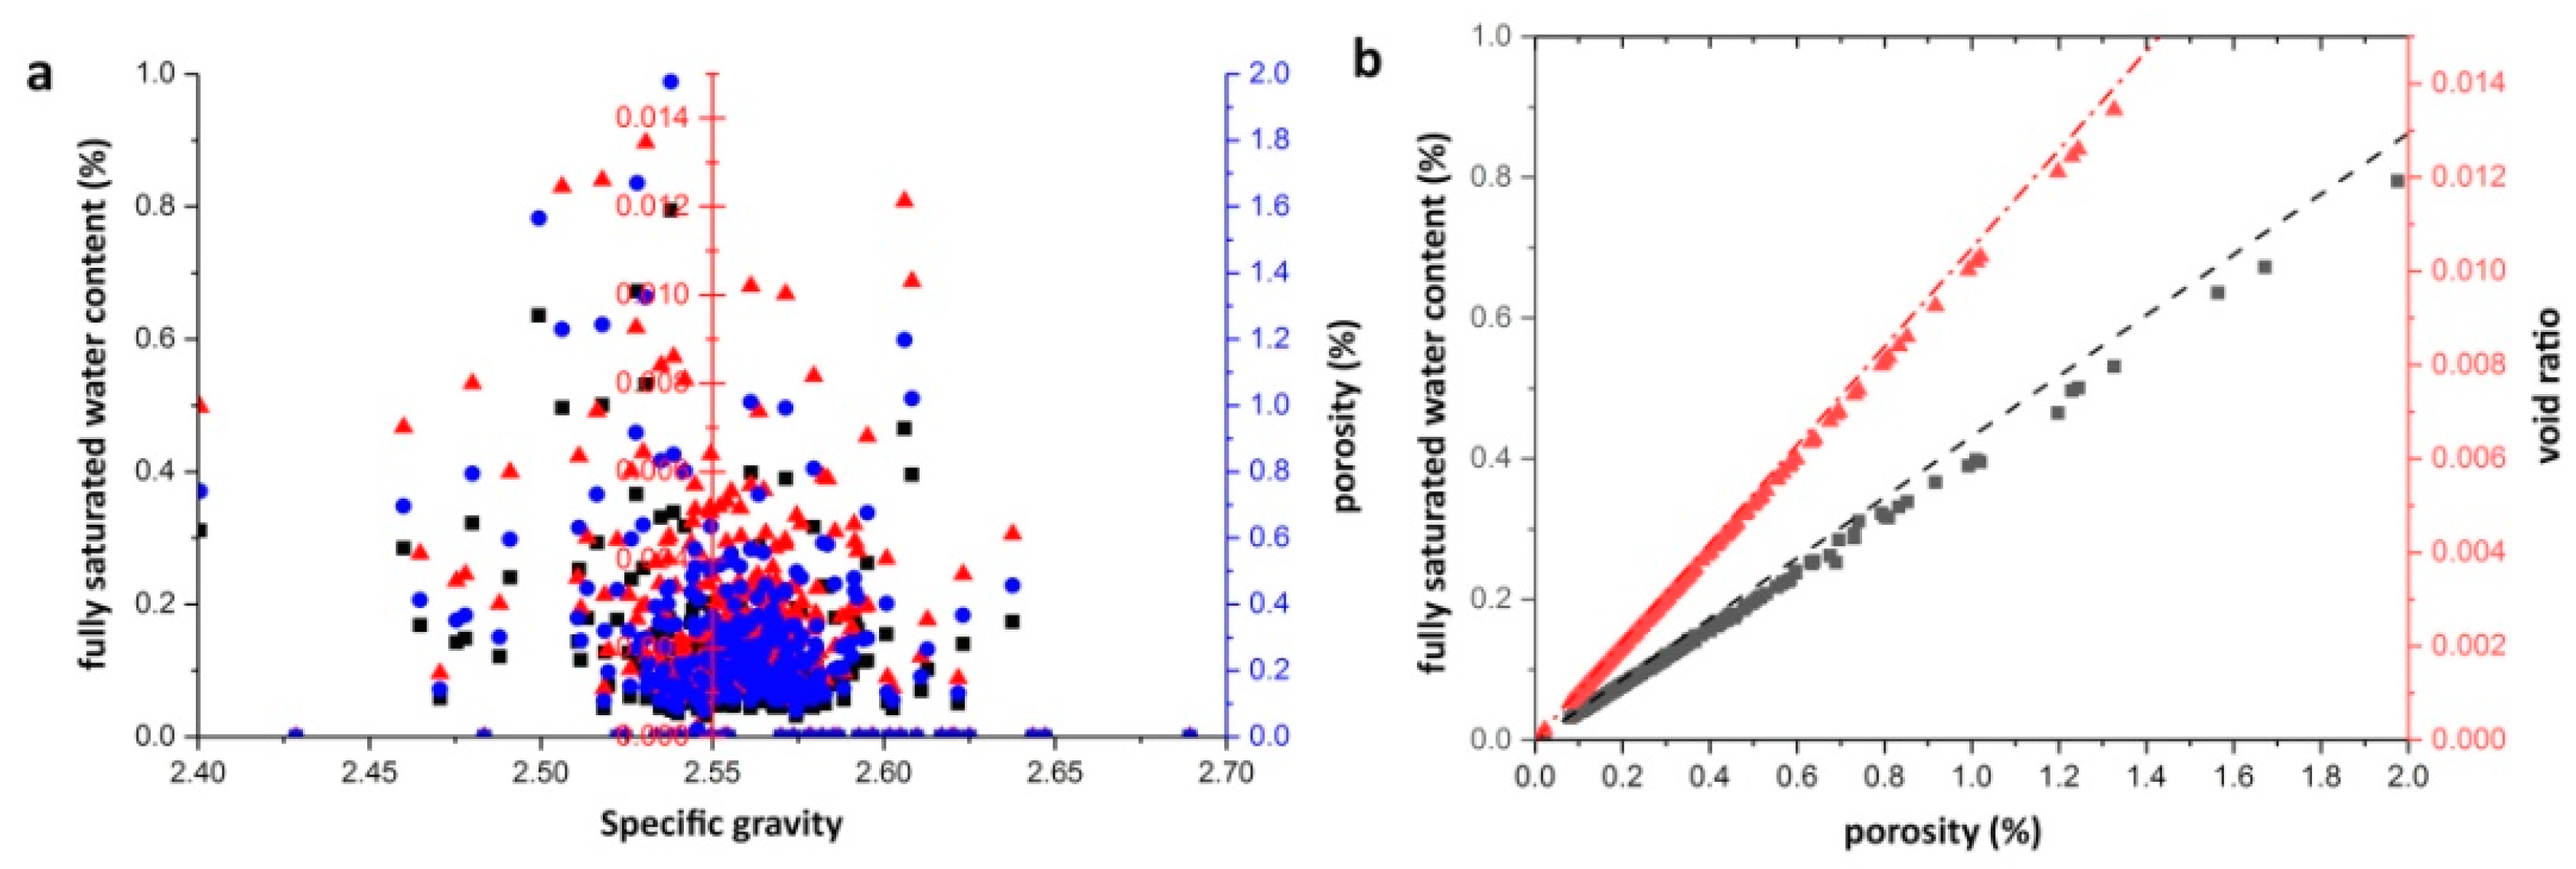
2.1.1. The Study of Rock Density, Porosity, and Water Absorption

The study was carried out using a standard ASTM D2216–10 test [10]. All chert specimens were dried for 24 h in an oven at 110 °C to exclude free water from their pore space (Figure 5a), and the values of oven-dry weight ‘A’ for all samples were measured. The measurements were carried out using the Archimedes method [11,12], with the specific gravity frame instrument shown in Figure 5b (Buoyancy balance system, Matest, Treviolo (BG), Italy); all specimens were previously immersed in water for two weeks to reach their full saturation.
The values of the three types of density were obtained as follows: oven-dry density (OD), saturated surface-dry density (SSD), and apparent density (AD). These three parameters can be calculated as follows [13,14]:
ρ O D = A B C × 1 gr / cm 3 ρ S S D = B B C × 1 gr / cm 3 ρ A D = A A C × 1 gr / cm 3
where ‘B’ and ‘C’ are the values of the surface-dry weight and weight in water, respectively. Table 1 shows the mean values of the three densities. It can be seen that they are quite similar in terms of low values of porosity and water absorption. The expressions for the values of full saturated water content ω , void ratio e ,  and porosity n can be calculated as follows [15]:
ω = M w A e = G s × ω n = e 1 + e
where G s  and M w  are the values of Specific Gravity G s = ρ O D / 1 ( gr cm 3 ) and mass value of water absorbed in the rock pores for two weeks.
Table 1 shows the mean values of the degree of water content in fully saturated specimens and porosity, the analysis of which implies consistency with the measurements noted above, while Figure 6 shows the interdependences between the value of specific gravity, fully saturated water content, void ratio, and porosity. The analysis of Figure 6 indicates a lack of relationship between the specific gravity of chert gravels (on one side) and water content, void ratio, and porosity (on the other side). The relationship between the void ratio and porosity is obvious (Equation (2)), and the same is seen for the relationship between porosity and volumetric water content.
The values of mass water absorption K m [11] and volume water absorption K V [14] were calculated as follows:
K m = B A A × 100 % K V = B A B C × 100 %
Table 1 shows the mean values for all chert specimens.

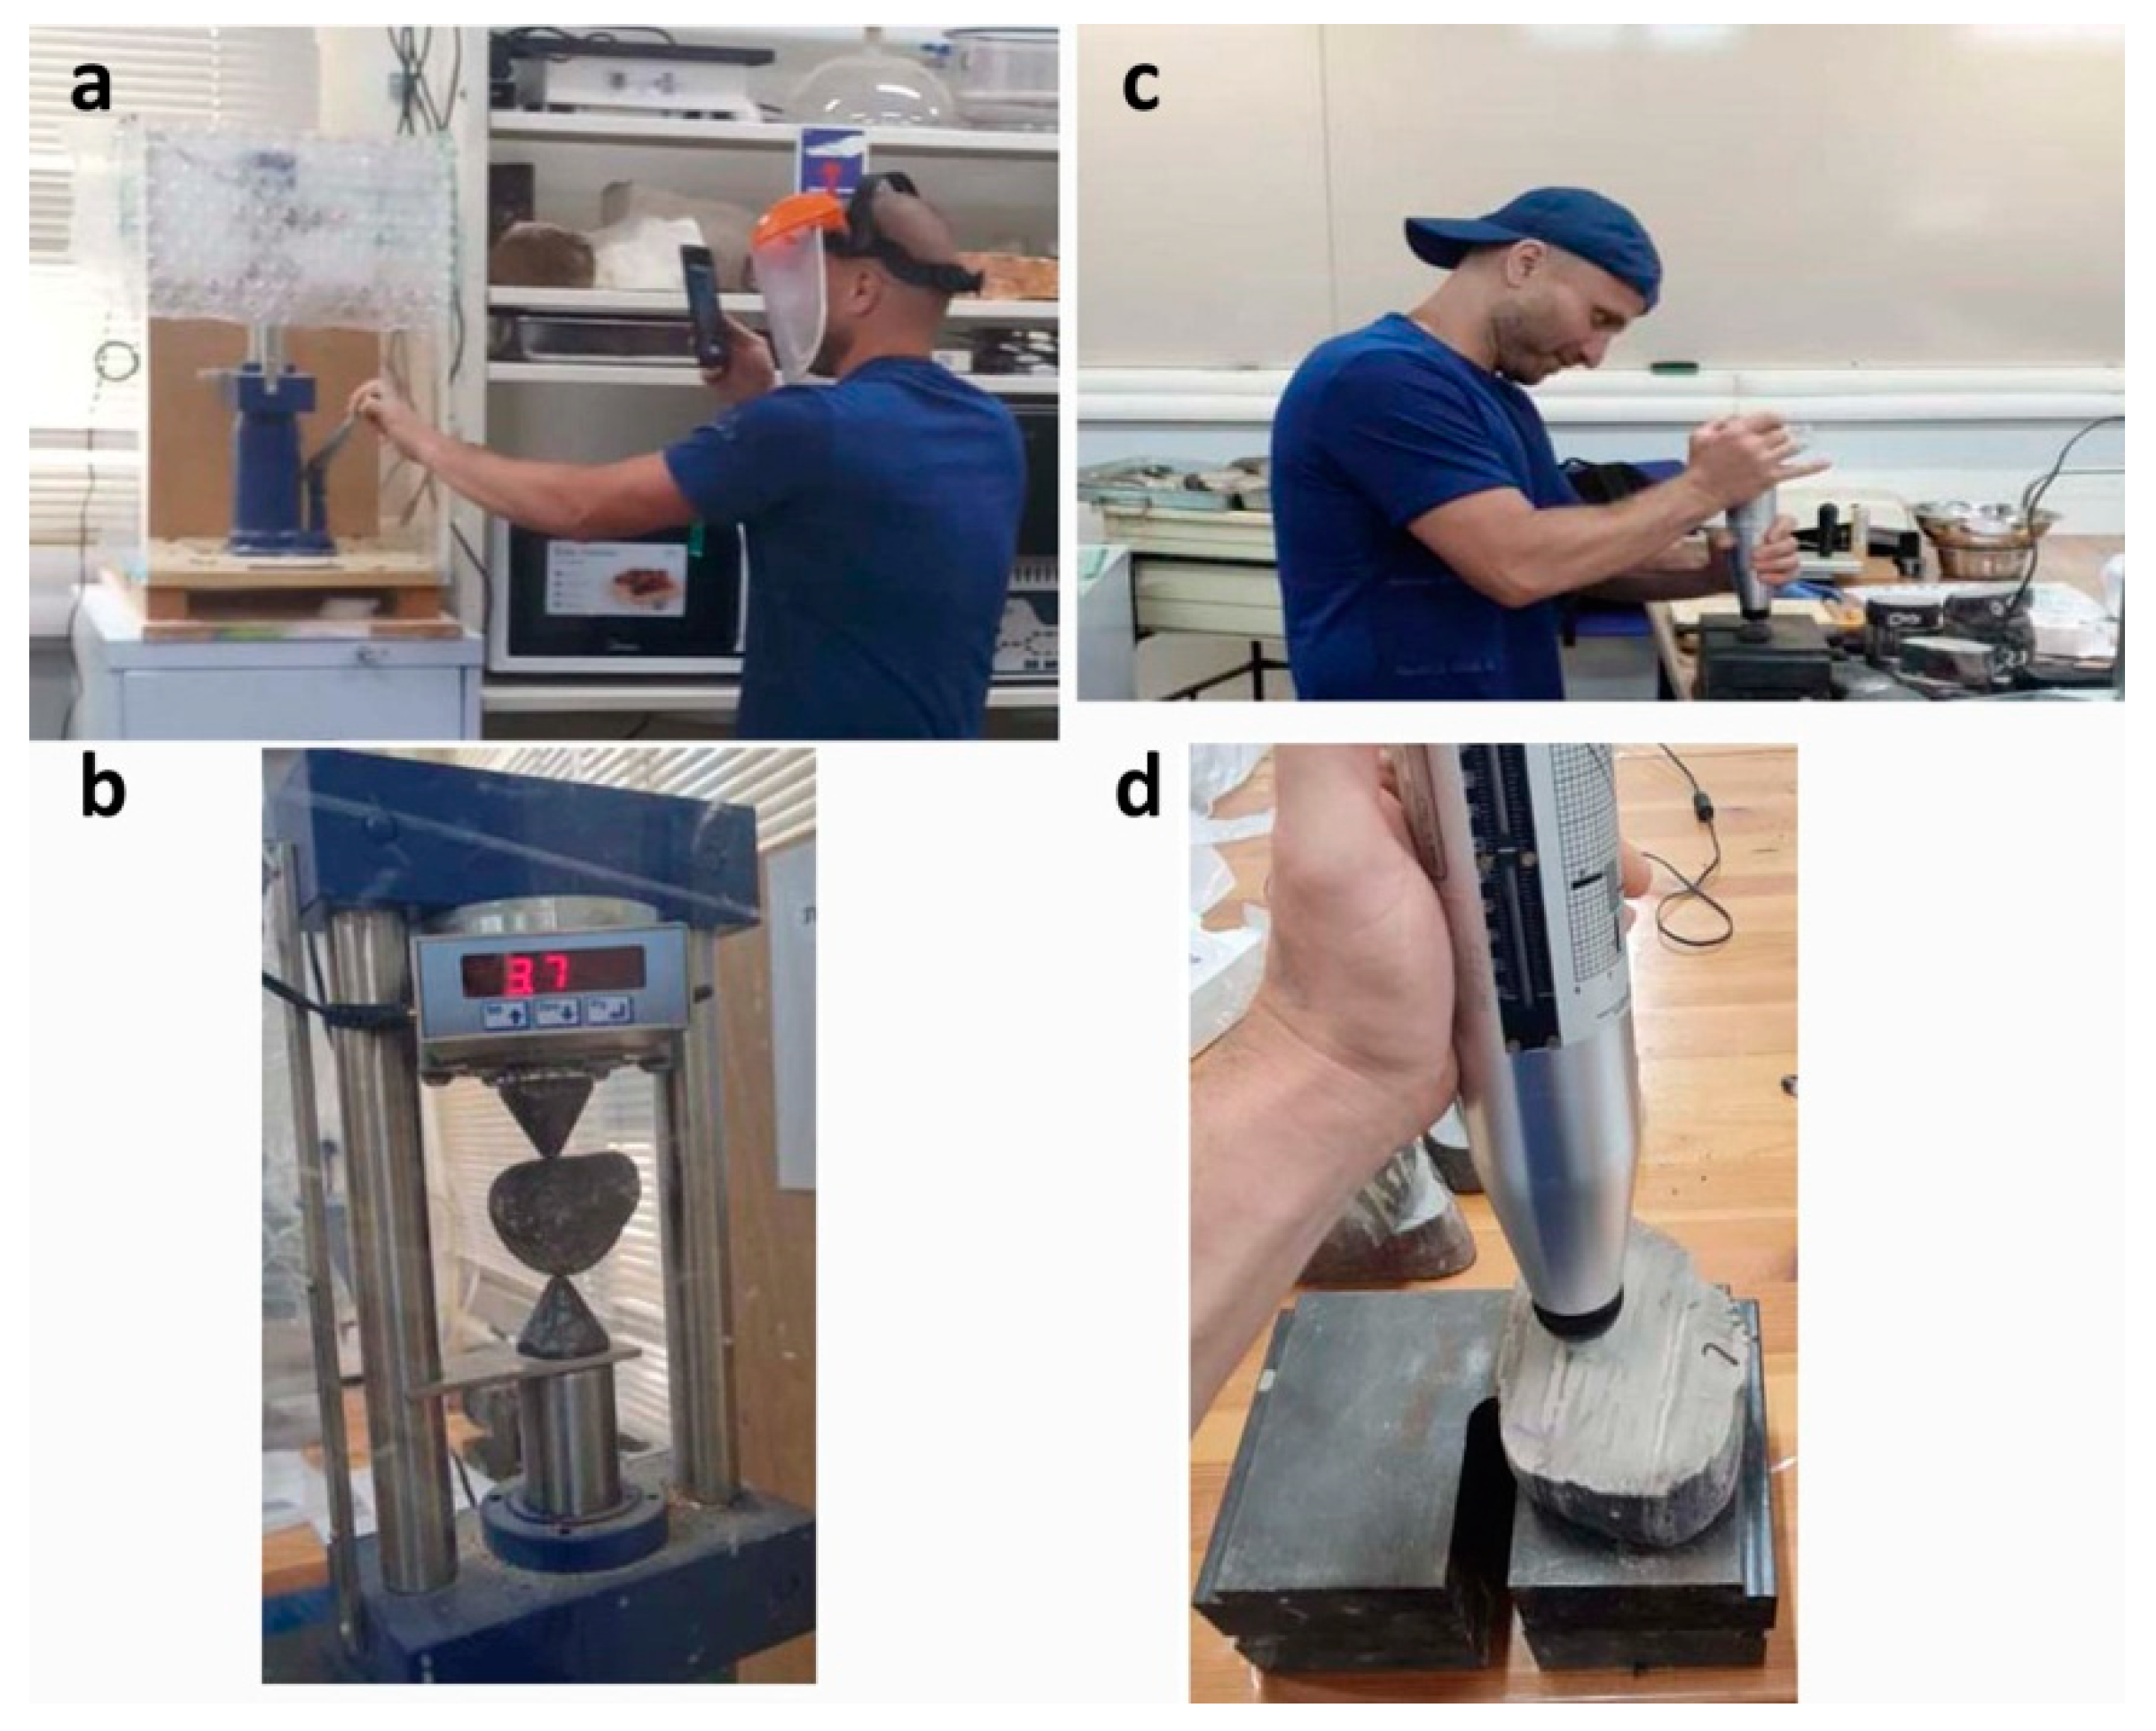
2.1.2. The Point Load and Schmidt Hammer Studies

The Point Load method and Schmidt hammer method being indirect, cheap, fast, and convenient for laboratory and in the field rock strength assessment, are described in detail in pertinent scientific literature, e.g., [16,17,18,19,20,21].
Figure 7 exhibits the instruments used for the experimentation as follows: Figure 7a,b for the Point Load (Digital Point Load tester 100 kN, Matest, Treviolo (BG), Italy) while Figure 7c,d for the Schmidt hammer (Rock classification hammer, Matest, Treviolo (BG), Italy) studies, respectively.
The results of the measurements are presented in Table 1. Note the essential difference in the values of uniaxial compression strength estimated based on the results of the Point Load and the Schmidt hammer studies.

2.1.3. The Study of Uniaxial Compression Strength

Following the recommendations of the International Society of Rock Mechanics (ISRM) and the standard of the American Society for Testing and Materials (ASTM) [16,22] for uniaxial compression strength of rocks, the samples have to be prepared in the form of cylinders with a ratio of their length to width of at least 2–2.5. However, the attempts to prepare rock cylinders from the chert samples were unsuccessful due to intensive warming and abrasion/ware of the diamond crown of the drilling instrument (Matest, Treviolo (BG), Italy, Figure 8a) despite its cooling by water during the drilling. To overcome the drilling issue, it was decided to use the cubic shape of the samples generally used, e.g., for the uniaxial compression tests of concrete samples [23]. The Matest compression machine (5MN) was used for the study. The cubic samples (40 mm in linear size) were prepared using a Shattal Diamond Disk Saw (Figure 8b) and dried in an oven as described above. Figure 8 shows the process of sample preparation (b), the chert sample within the compression machine (c), and the typical strain-stress diagram of sample compression (d). The results of the study of uniaxial compression strength are presented in Table 1.

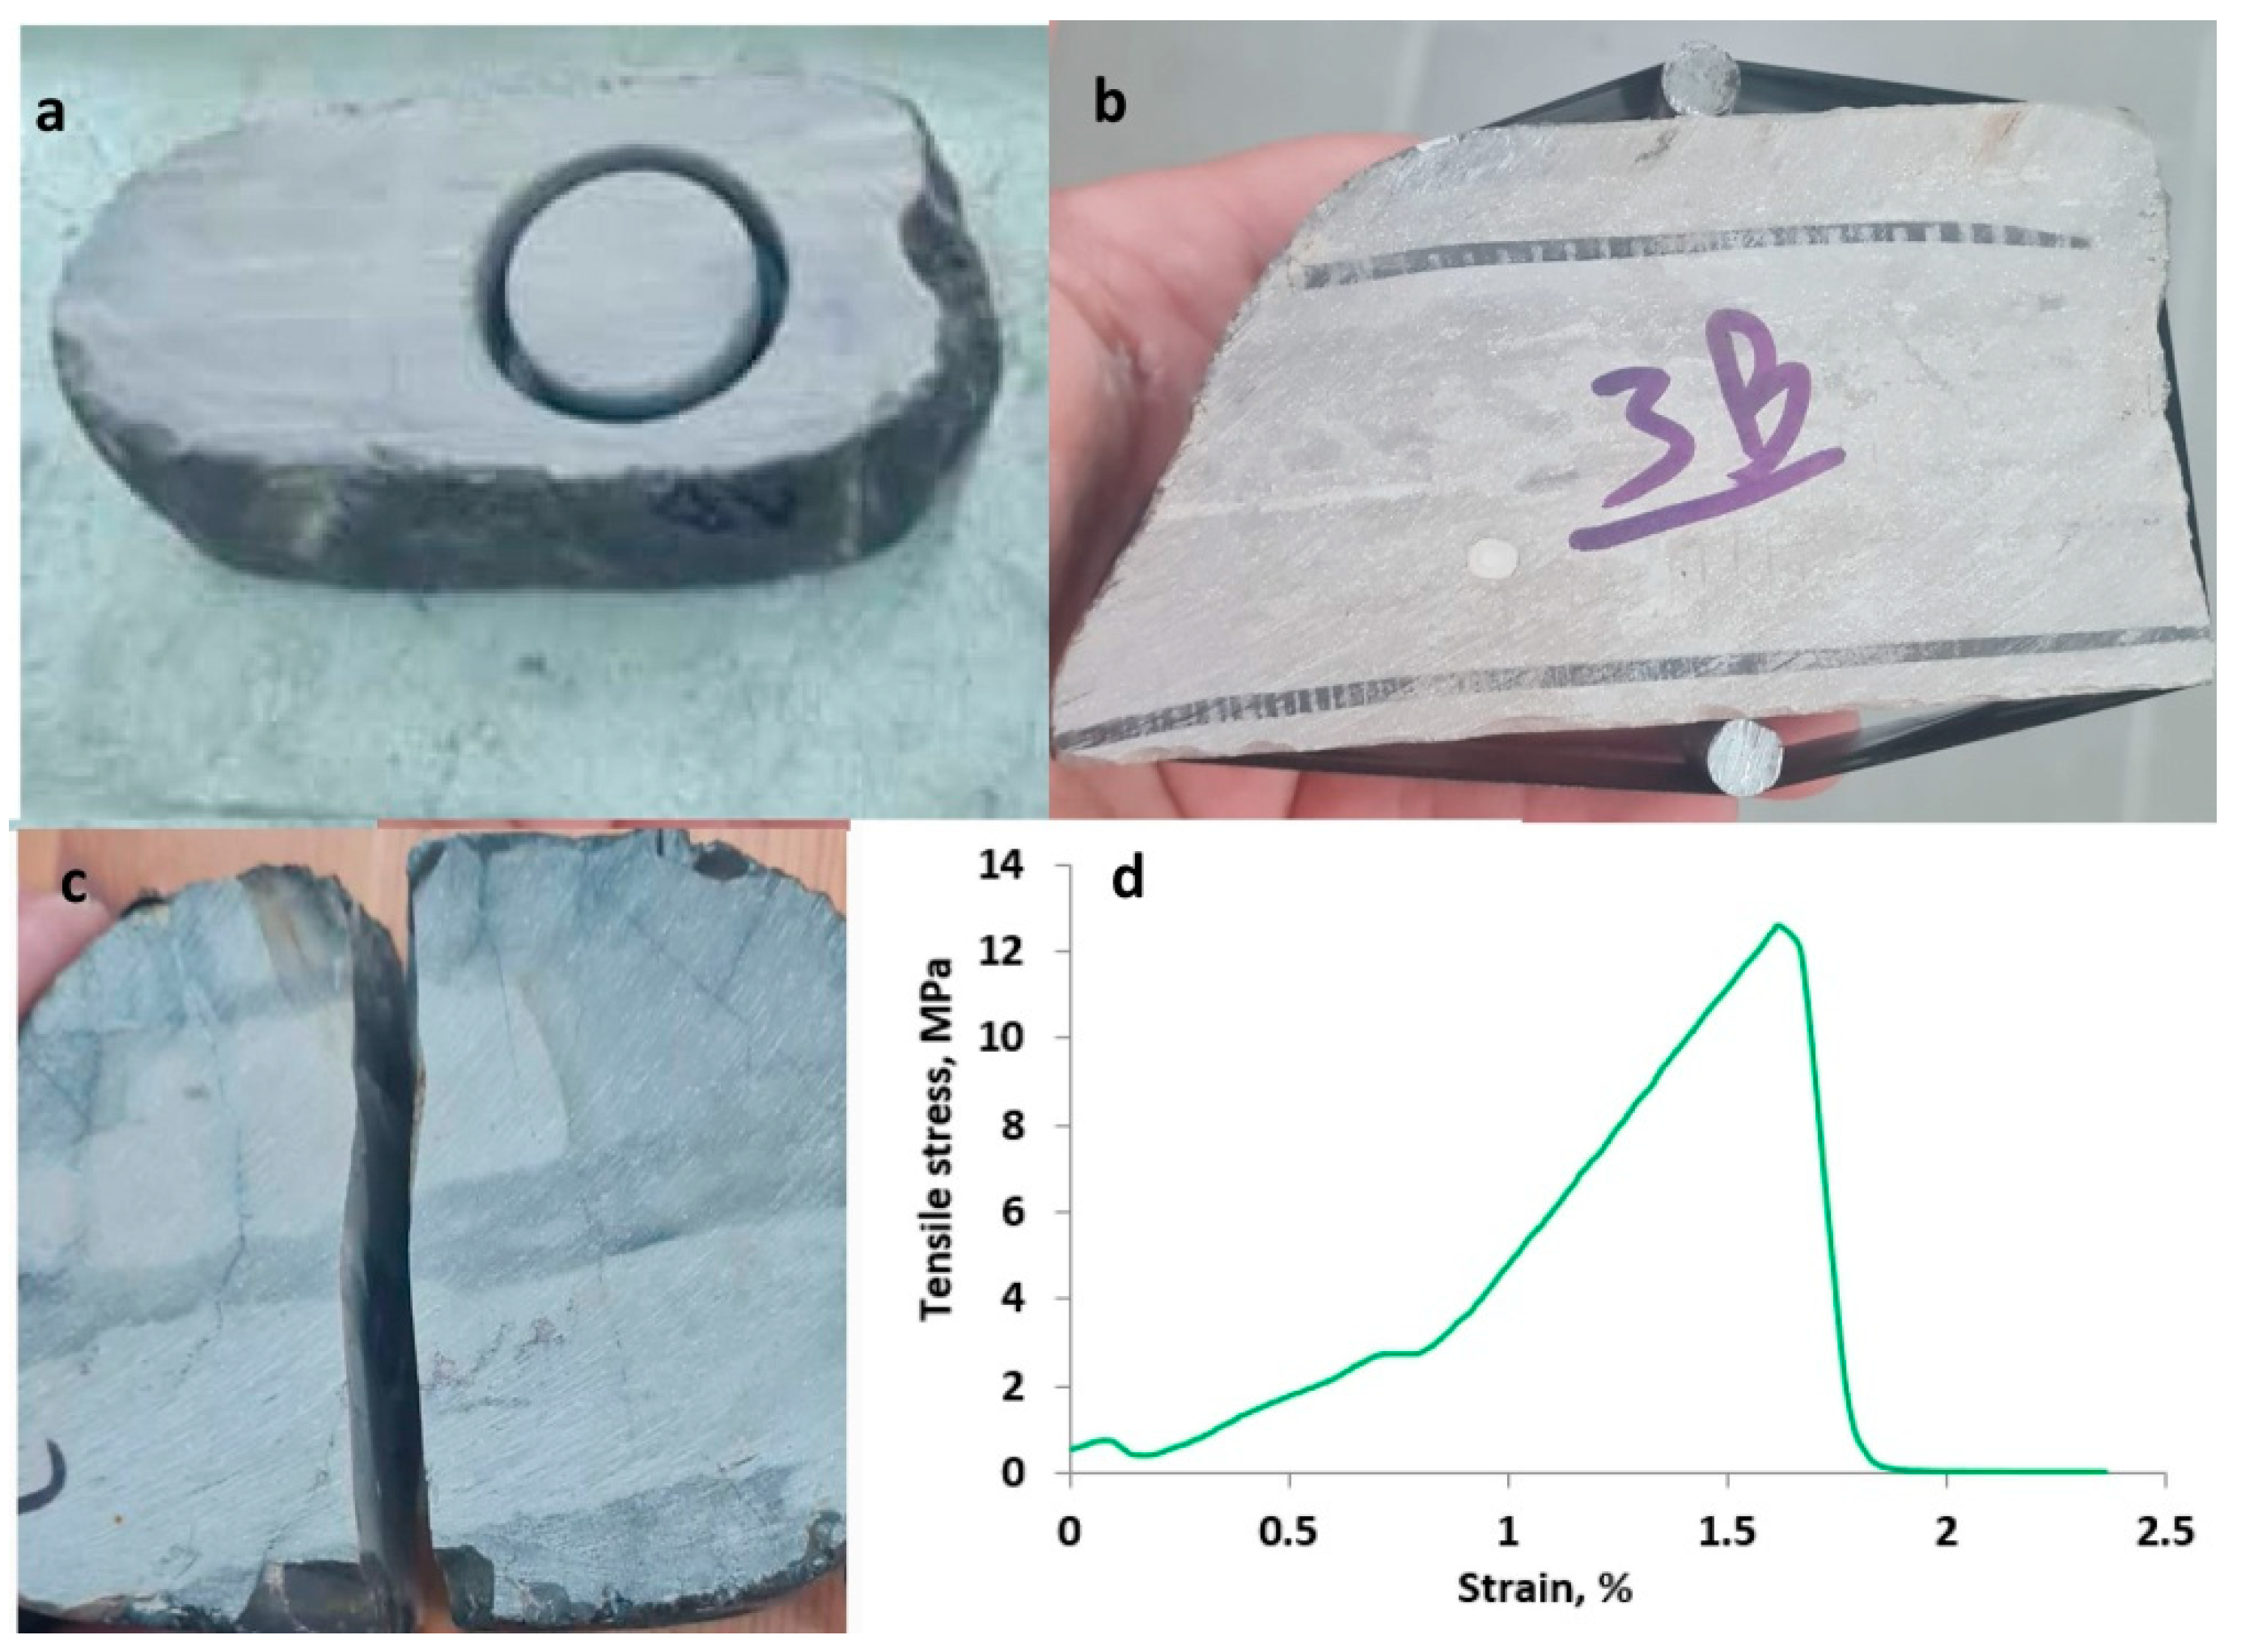
2.1.4. The Tension Strength Study (by Brazilian Method)

Following the requirements set in [24], the tension strength of the rock samples can be determined while the samples are being prepared in the disk shape and while the disk diameter is at least its width. As we noted above, the drilling of chert rock is a hard procedure. Figure 9a shows the results of sample drilling after one hour. The drilling depth was about 1.5 cm, and the diamond crown of the drilling instrument was badly worn. To get an indication of the tensile strength of the chert rock, the study was carried out using the non-standard shape of the samples with two parallel surfaces (created by the Diamond Disk Saw–Figure 8b) while the stress concentration was created by two steel pins located at the top and bottom of the samples (Figure 9b). The test was considered correct if the specimen failed (split) in only one fracture directly between the two pins (Figure 9c). The Matest Inc. compression machine (5MN) was used for the study (Figure 7c). The typical strain-stress chart resulting from the Brazilian test is shown in Figure 9d.

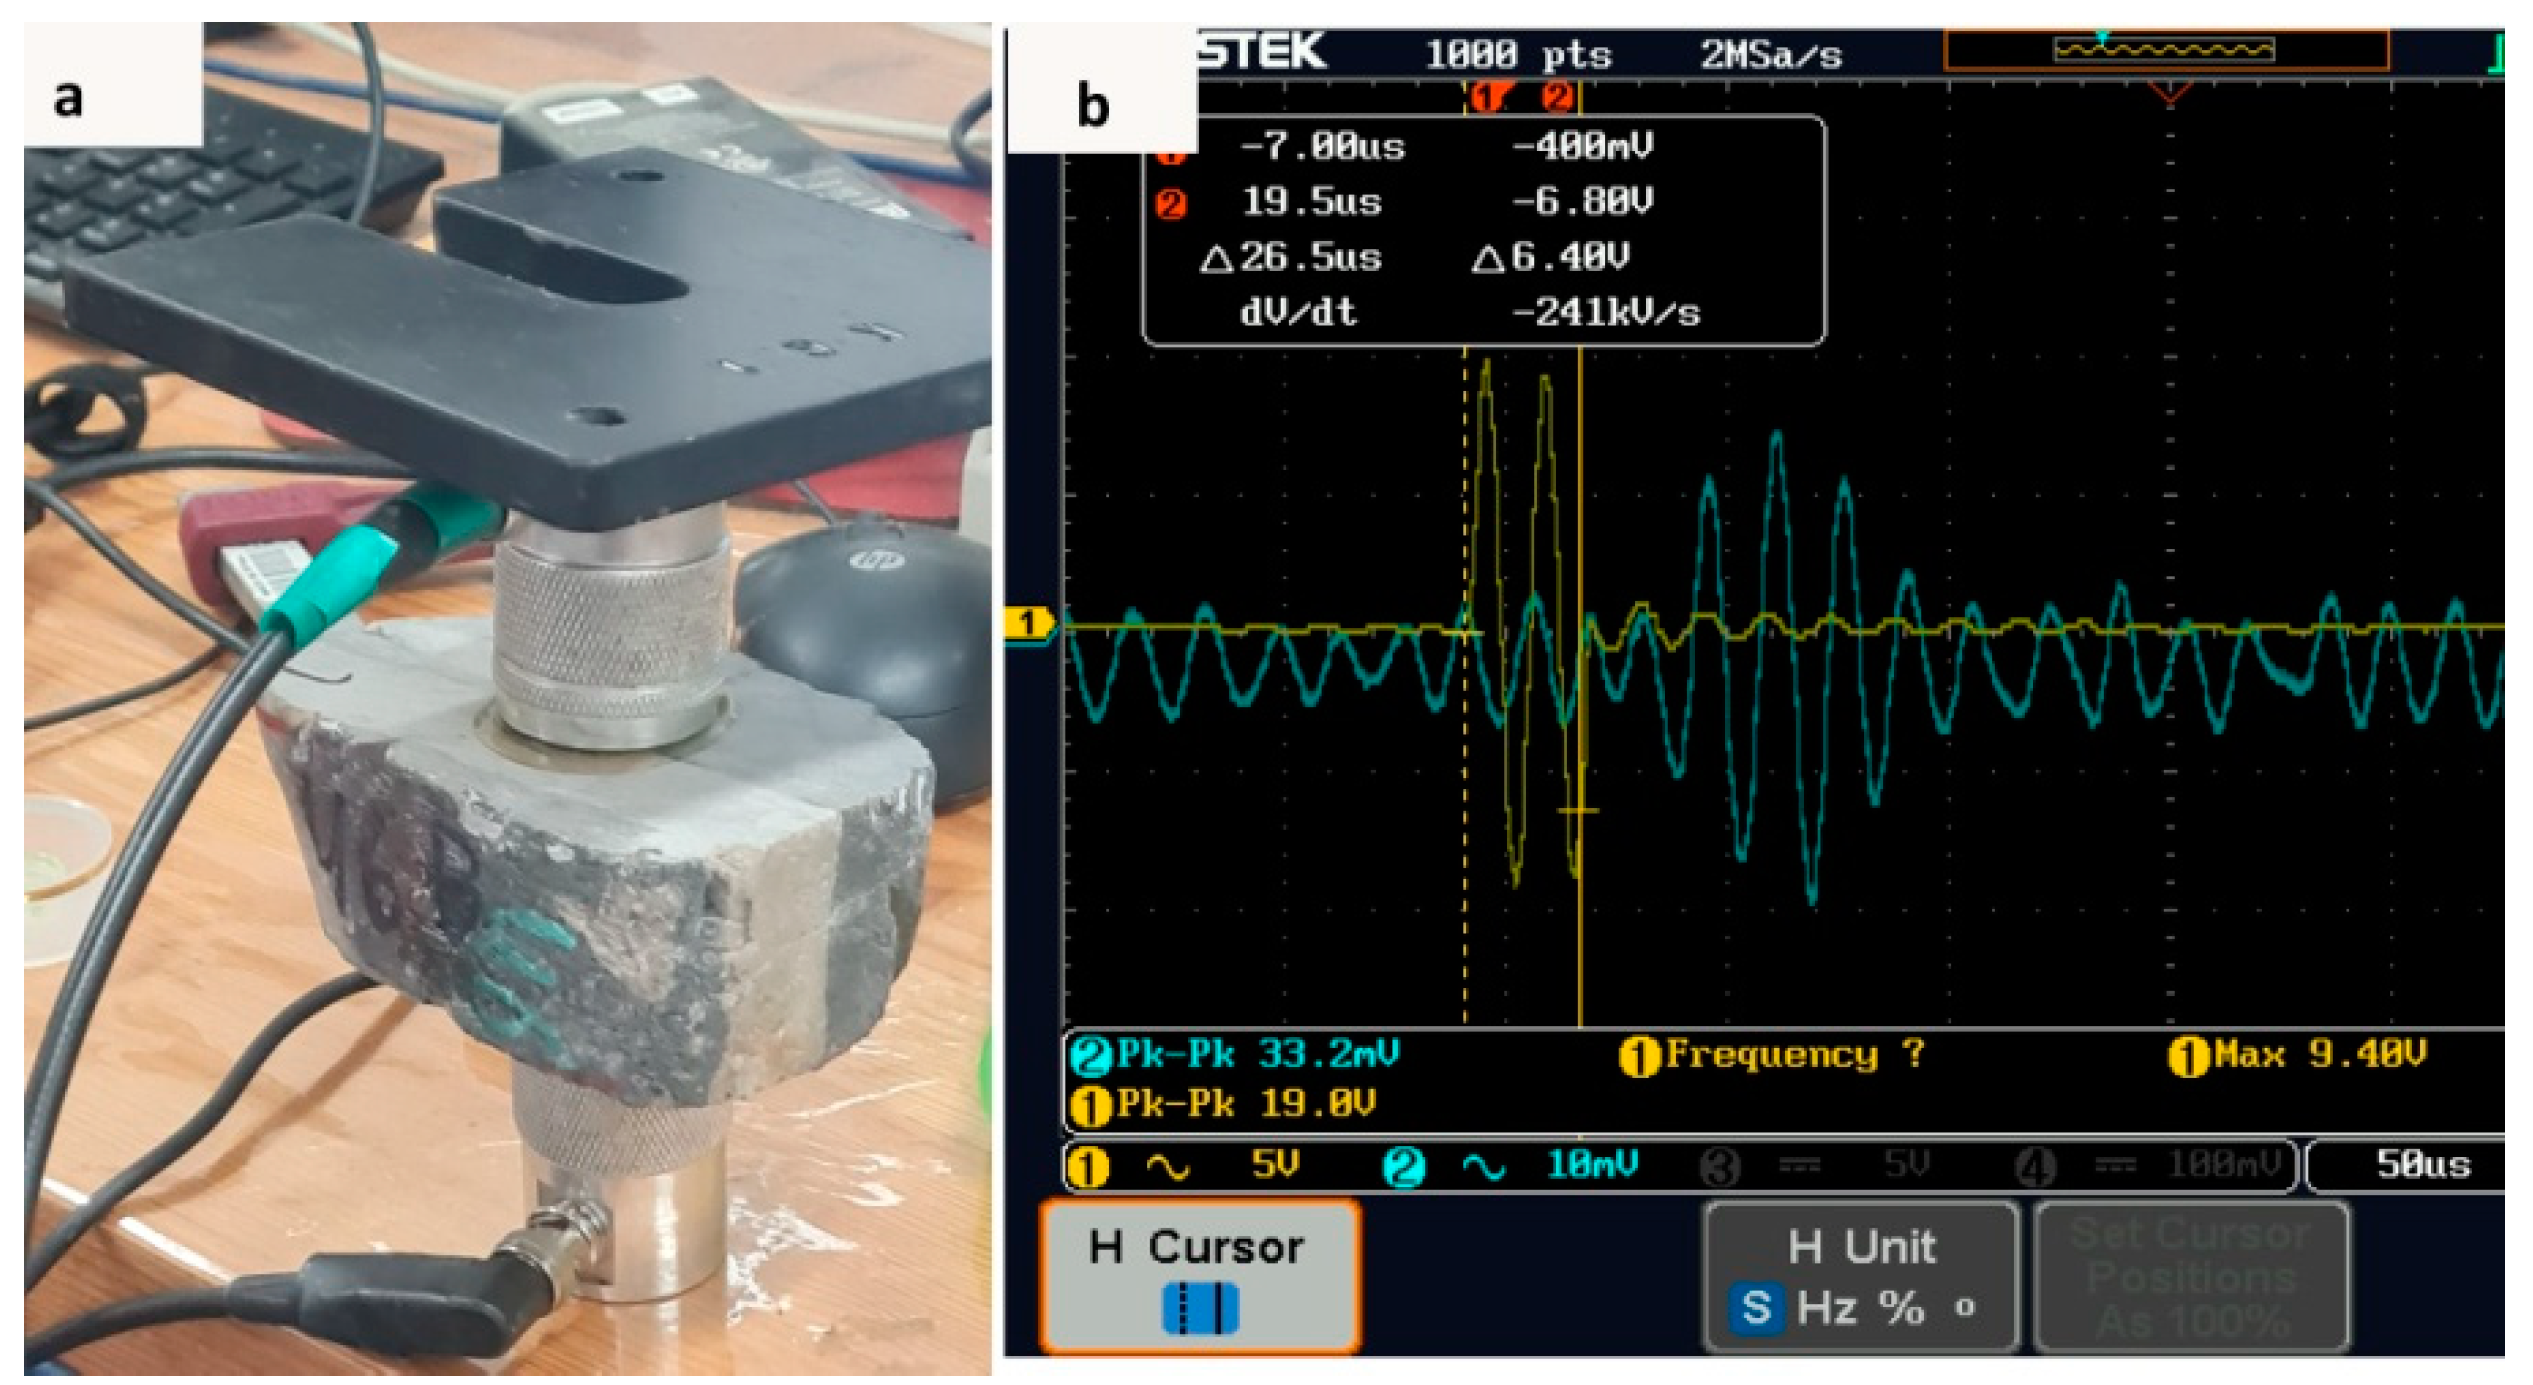
2.1.5. The Study of Ultrasonic Velocity

Elastic dynamic properties were studied by the first arrivals method [25,26] using a US pulse generator (TG5011A), a digital oscilloscope (GDS1054B), and two US sensors- (75 kHz resonance frequency). The Open Wave software will be used for data recording. Figure 10a shows the sample assemblage for the US study, while Figure 10b exhibits the typical result of measurements. For the mean value, see Table 1.

2.2. Electromagnetic Properties

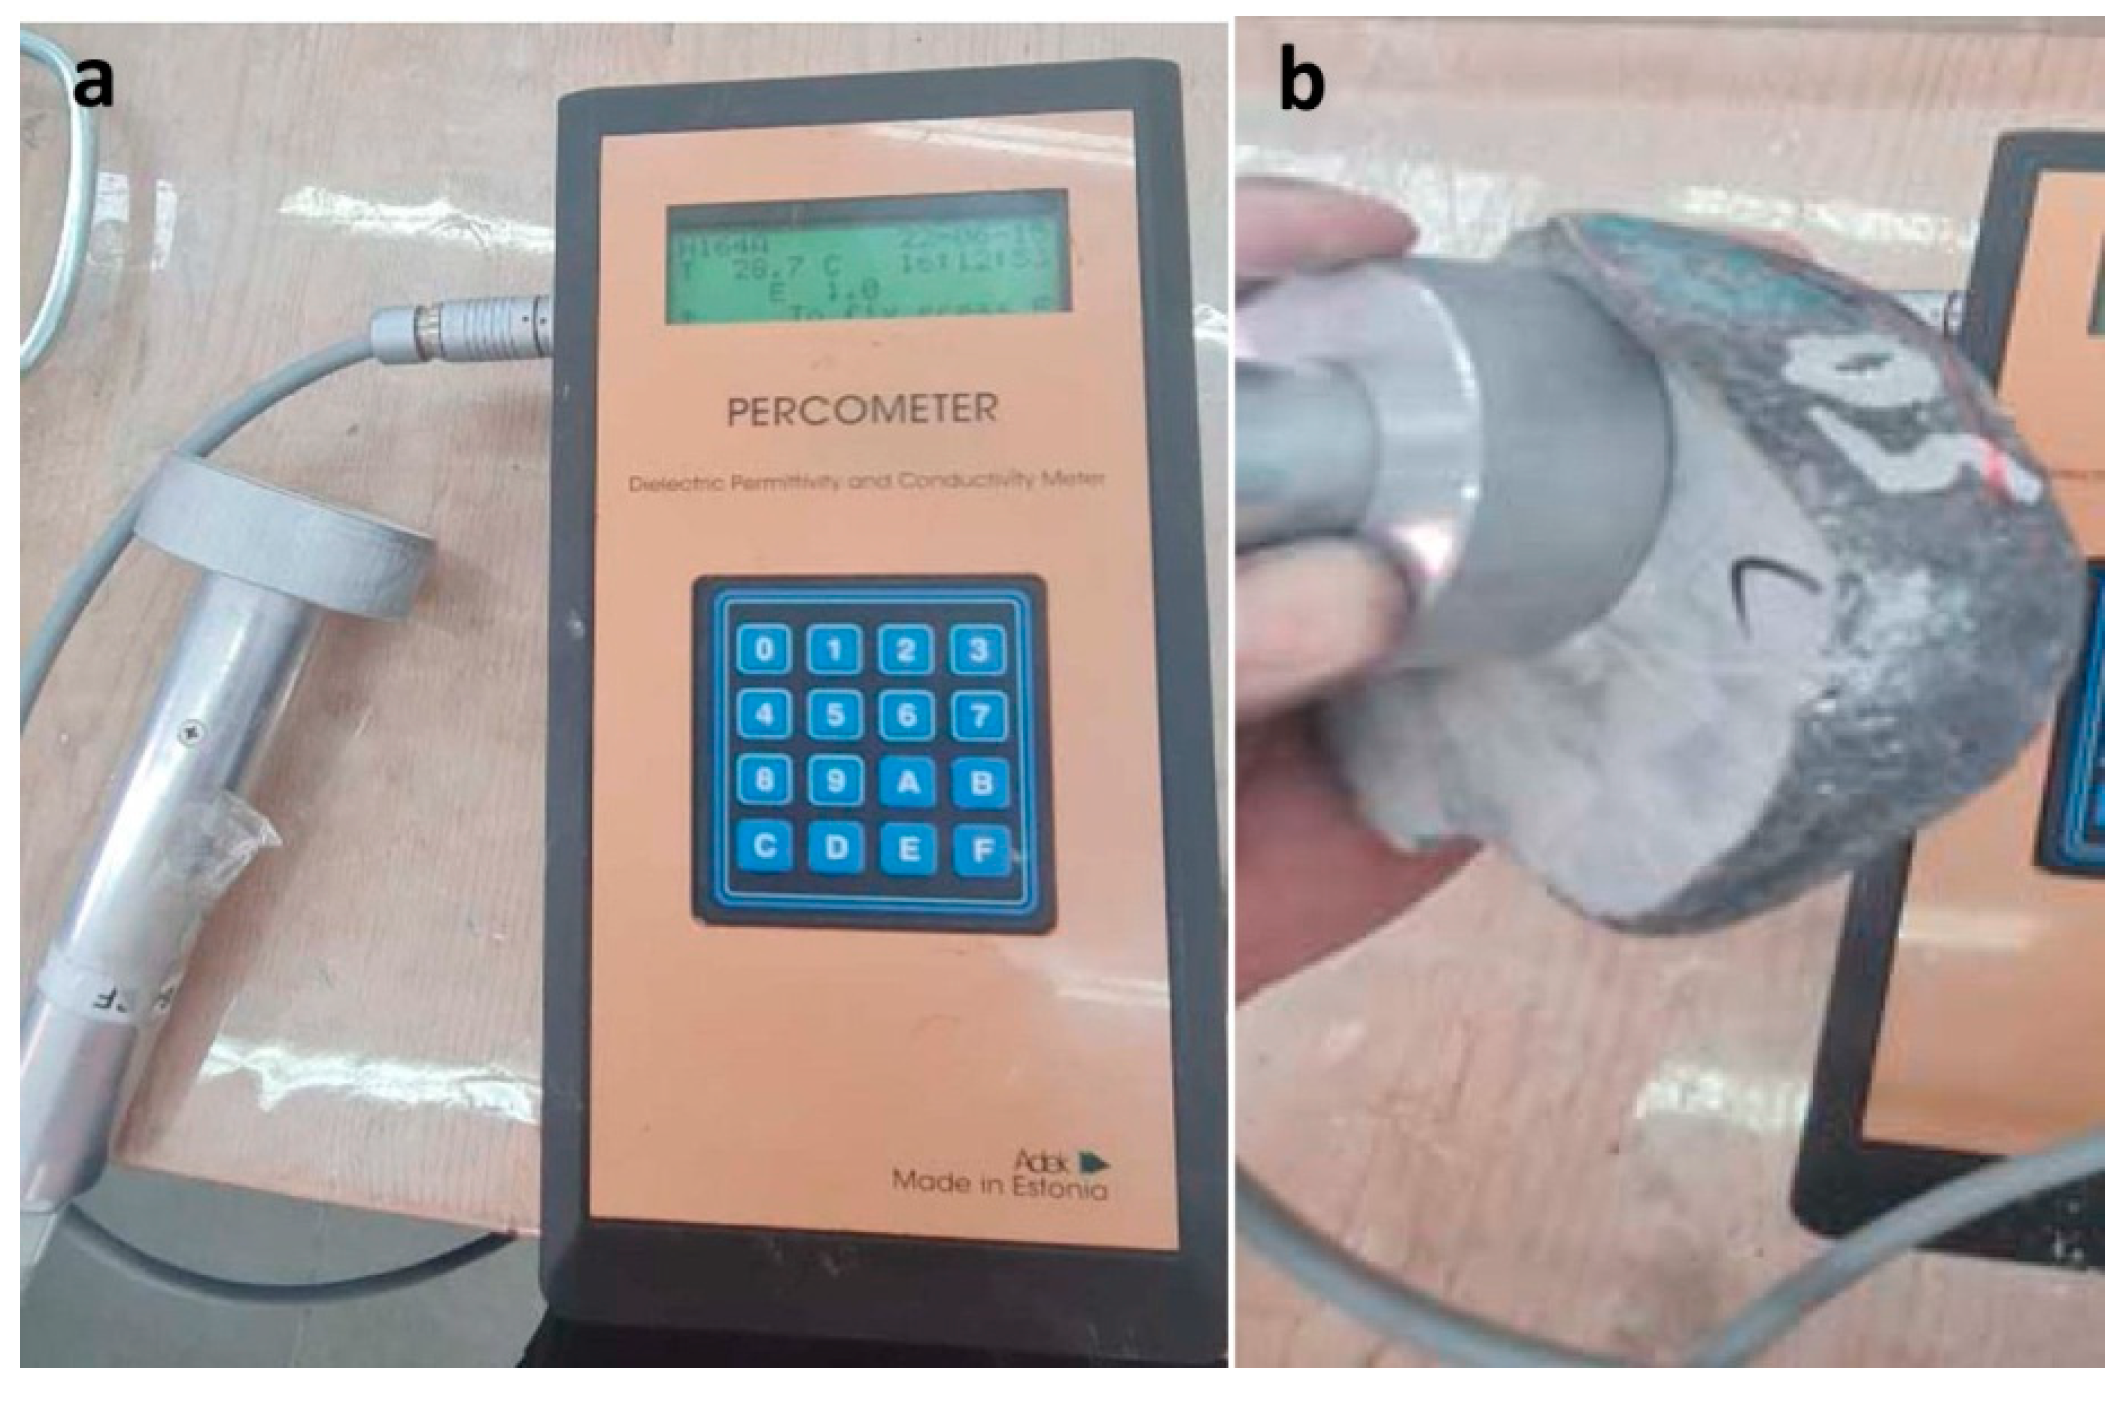
2.2.1. Dielectric Permittivity

The dielectric permittivity studies were carried out using the Percometer instrument (Figure 11a), which measures the real part of the relative permittivity based on the change in capacitance caused by the material at the end of the probe in the frequency range of 40–50 MHz [27]. Figure 11b shows the measurement procedure.

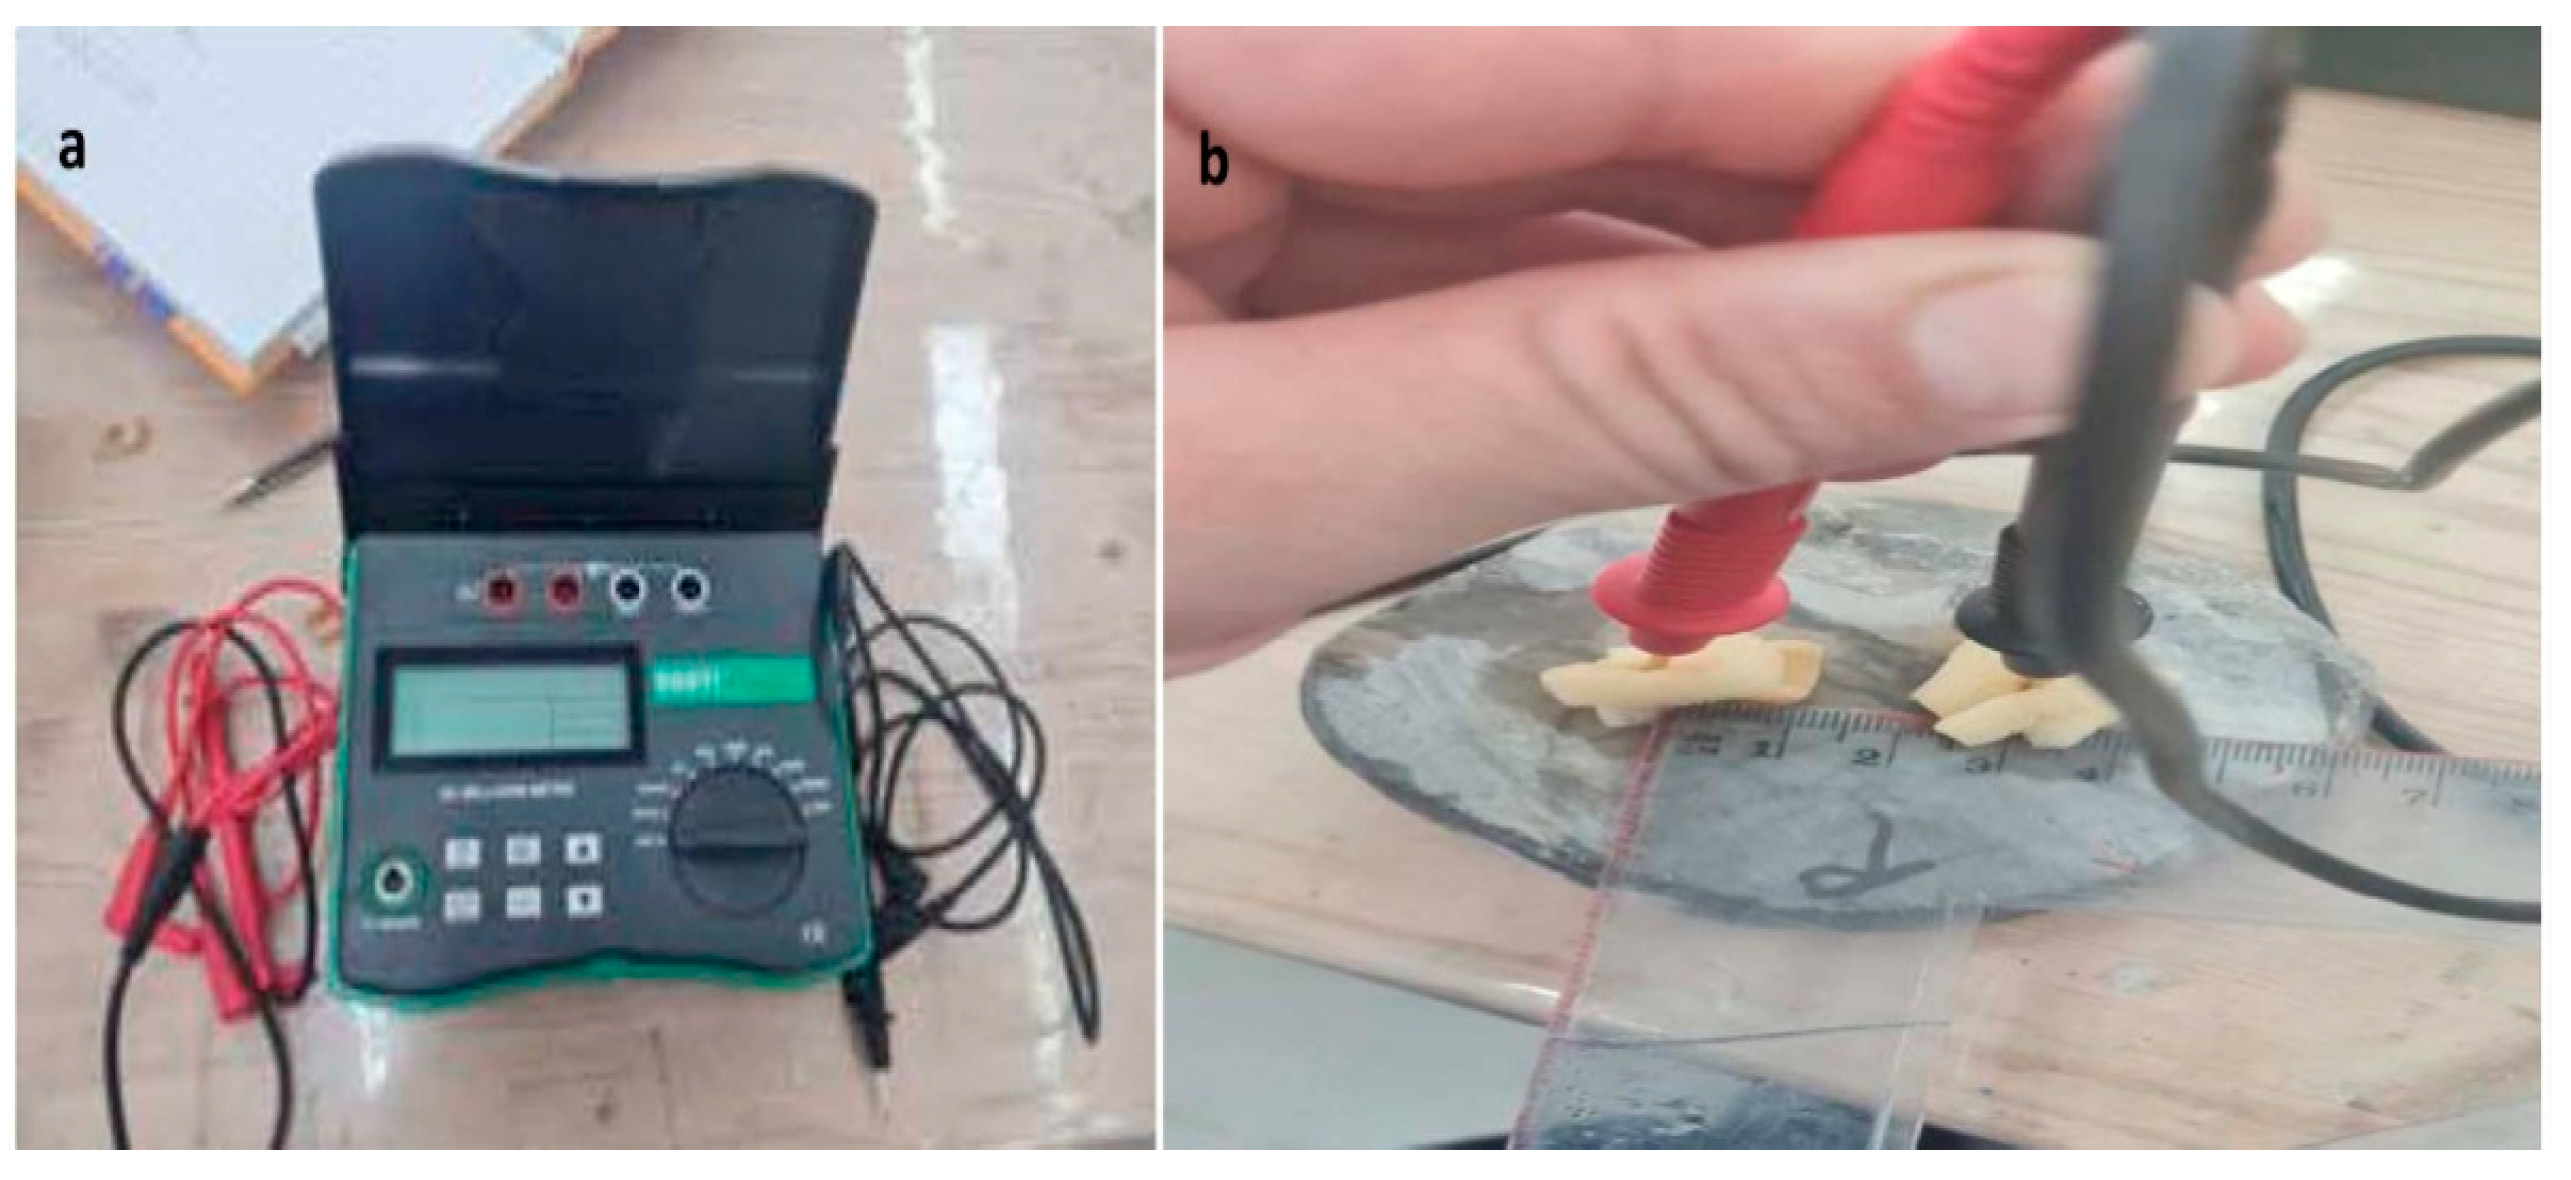
2.2.2. Electric Resistivity

The measurements were conducted using a DY4106DUOYI resistivity meter (Figure 12a) with two electrodes (Pole-Pole array [28]). To ensure accurate measurements, two pieces of sponge saturated with a 15% salt-water mixture were used (Figure 12b) while the distance between two pins (electrodes) was 3 cm. The electrical resistivity of the chert samples was calculated using the expression for the Pole-Pole array [28]:
ρ a = 2 π a V I
where a-is the distance between two electrodes (m), and V and I are the values of measured voltage (V) and electric current (A), respectively. The results of the measurements are presented in Table 1.

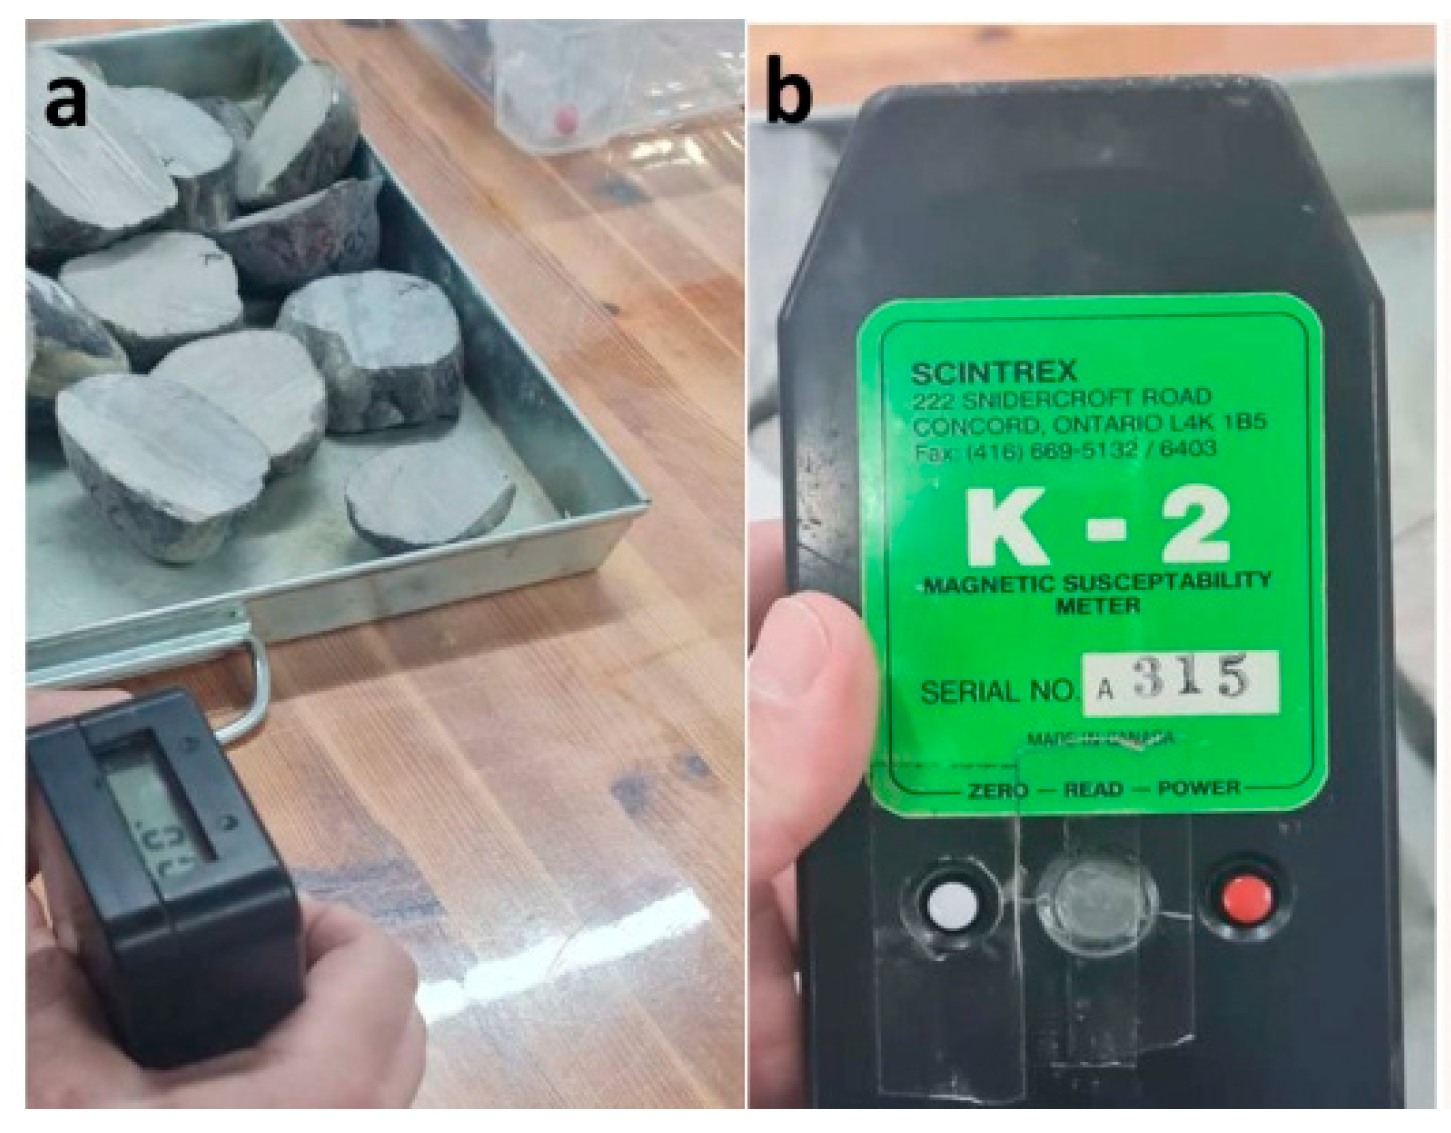
2.2.3. Magnetic Susceptibility

The magnetic susceptibility was studied with the Scintrex K2 instrument (Figure 13). The measurements showed a lack of magnetic minerals in the chert rock.

2.3. The Chemical Properties

2.3.1. Bulk Chemical Composition

To understand the chemical composition of the chert gravels, the study was conducted using SEM (Quanta 200) at the Ilse Katz Institute for Nanoscale Science & Technology of the Ben Gurion University of the Negev (Beer Sheva, Israel). Figure 14a shows a typical SEM picture of the chert rock while Figure 14b its chemical composition. It can be seen that chert rock is composed of silica, oxygen, and a small amount of calcium. As we noted above, the chert rock of the Rotem region is characterized by a banded structure, where black bands are replaced by white bands (See, e.g., Figure 10a). Surprisingly, this structure was unseen in SEM pictures. To understand the feature, the black and white bands were marked before the SEM study (dark strips in Figure 14c, one denotes the black band while two denotes the white band). Figure 14d,e portray the SEM diagram of the chemical composition of the black and white bands (Figure 14d and Figure 14e, respectively). It can be seen that both diagrams are quite identical and remarkably similar in general chemical composition (Figure 14b).
The weight percentage of chemical elements is presented in Table 2.

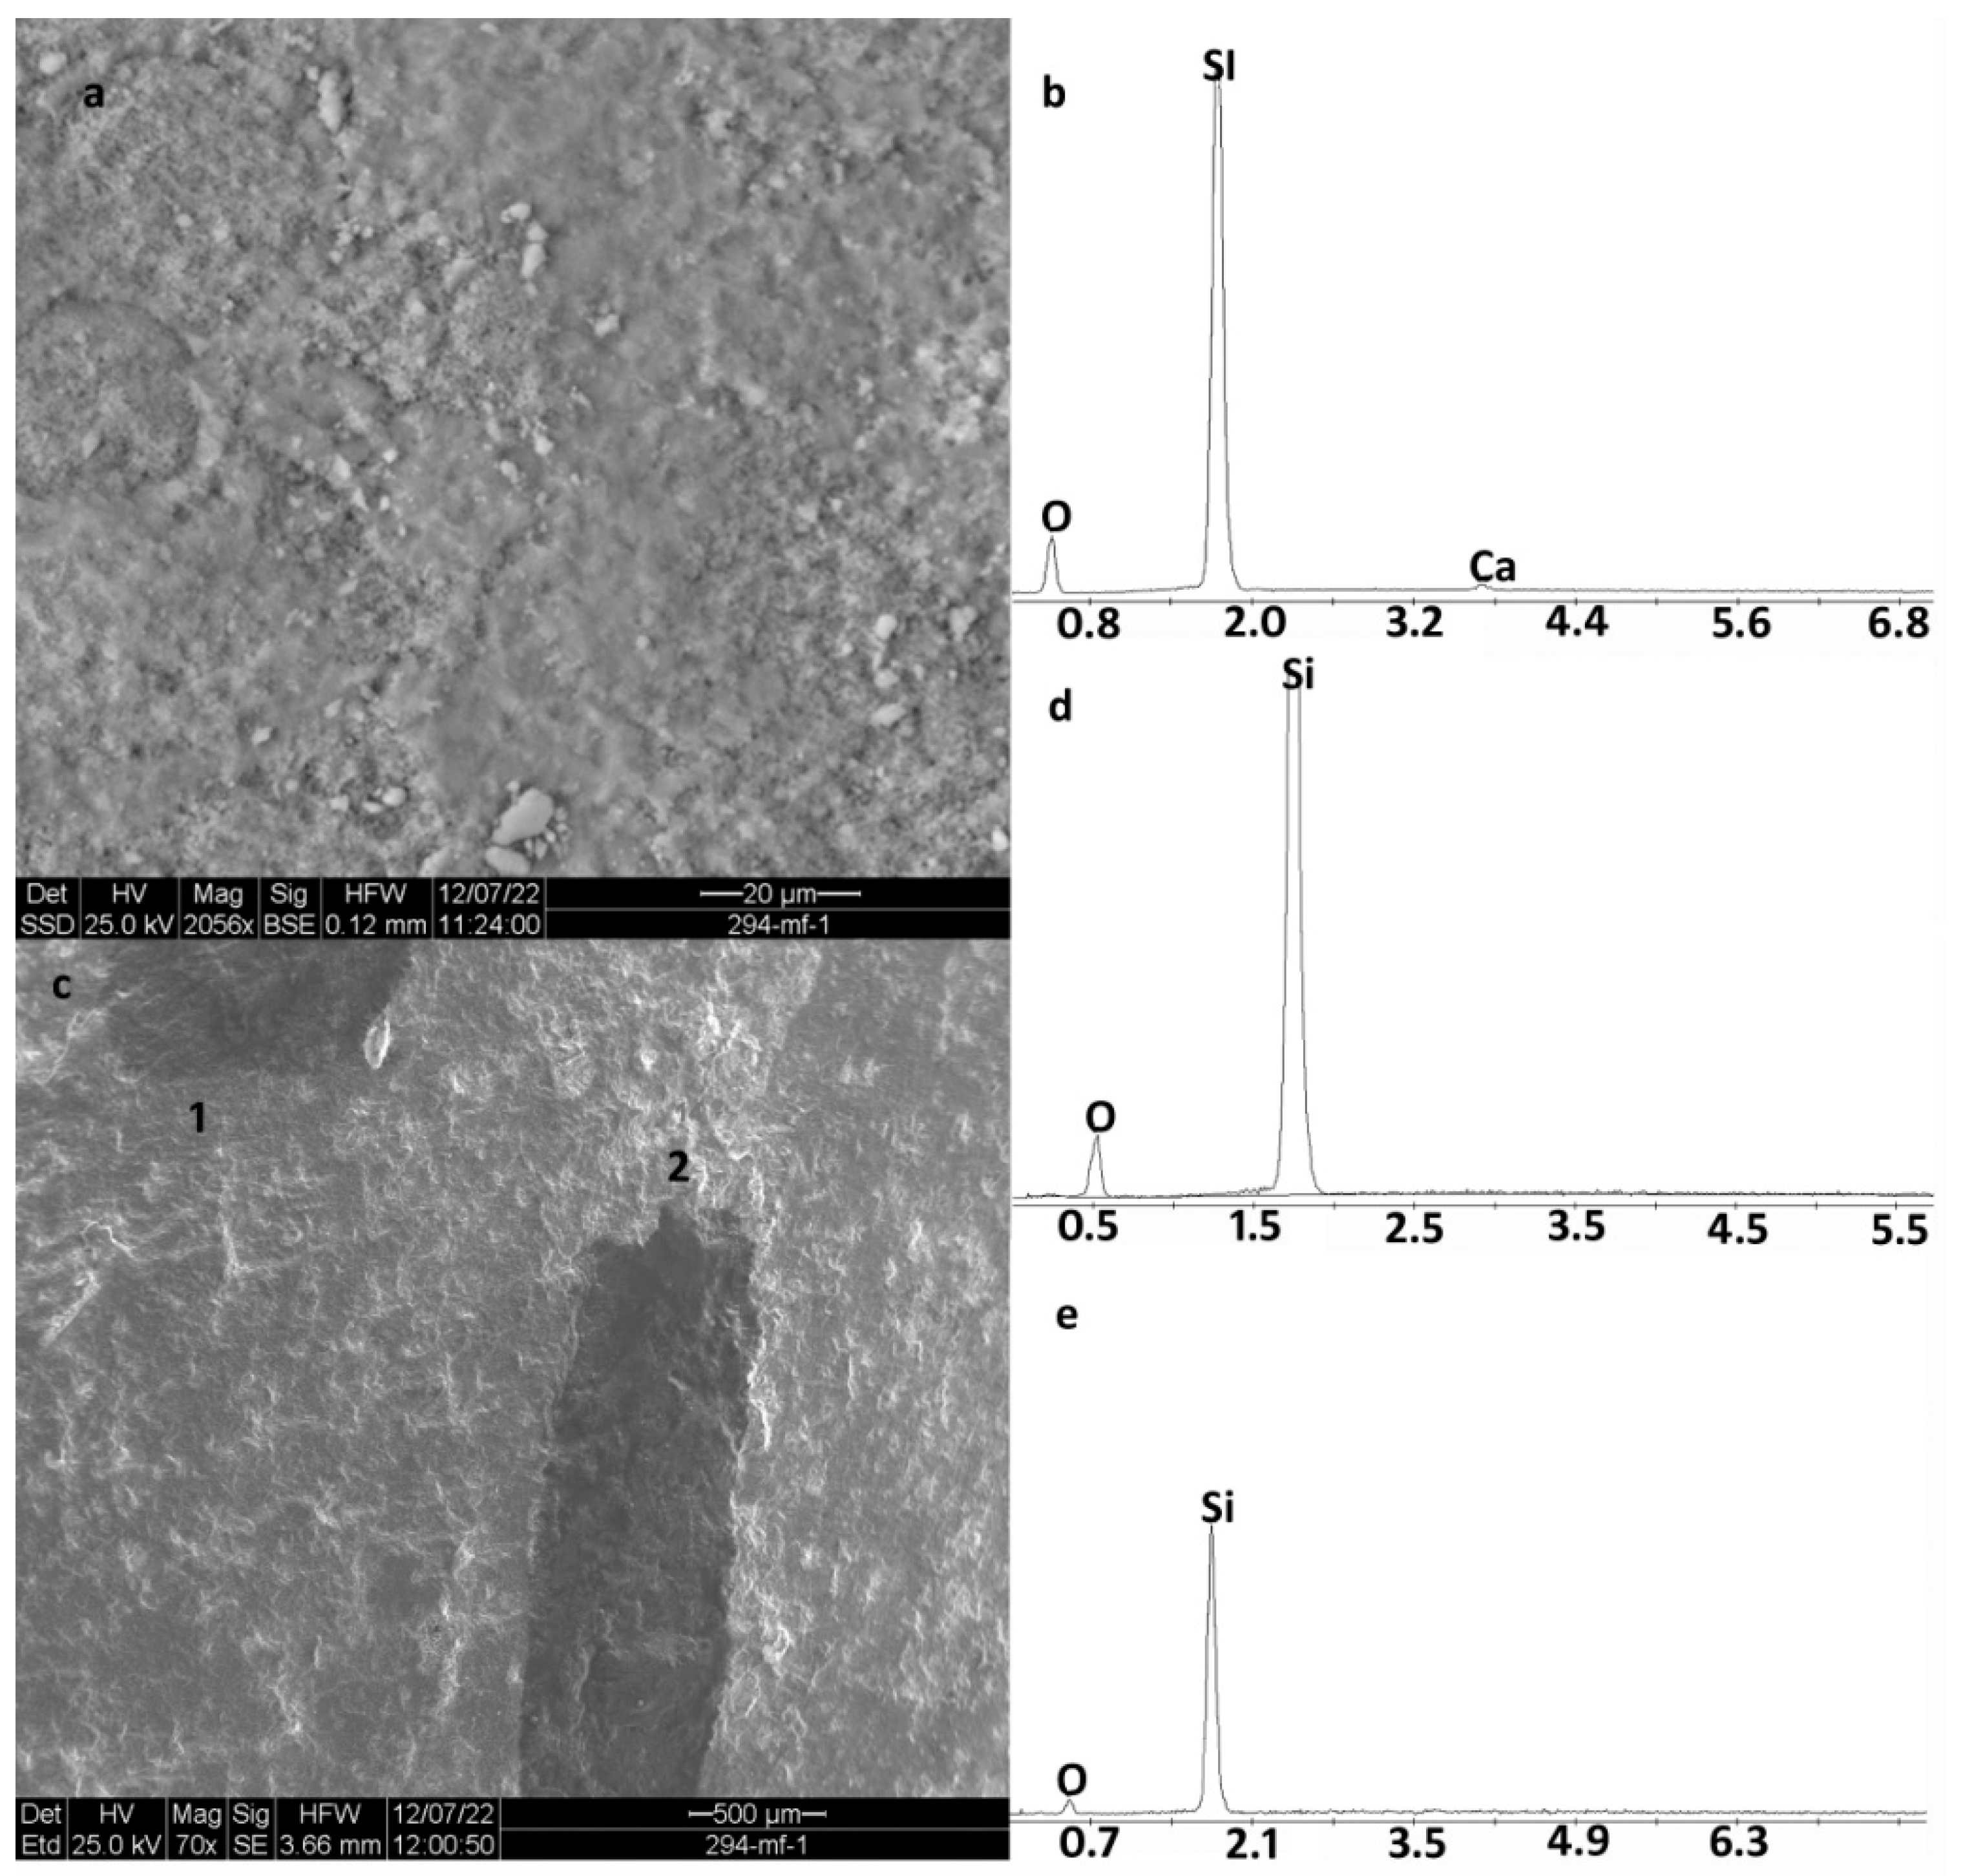
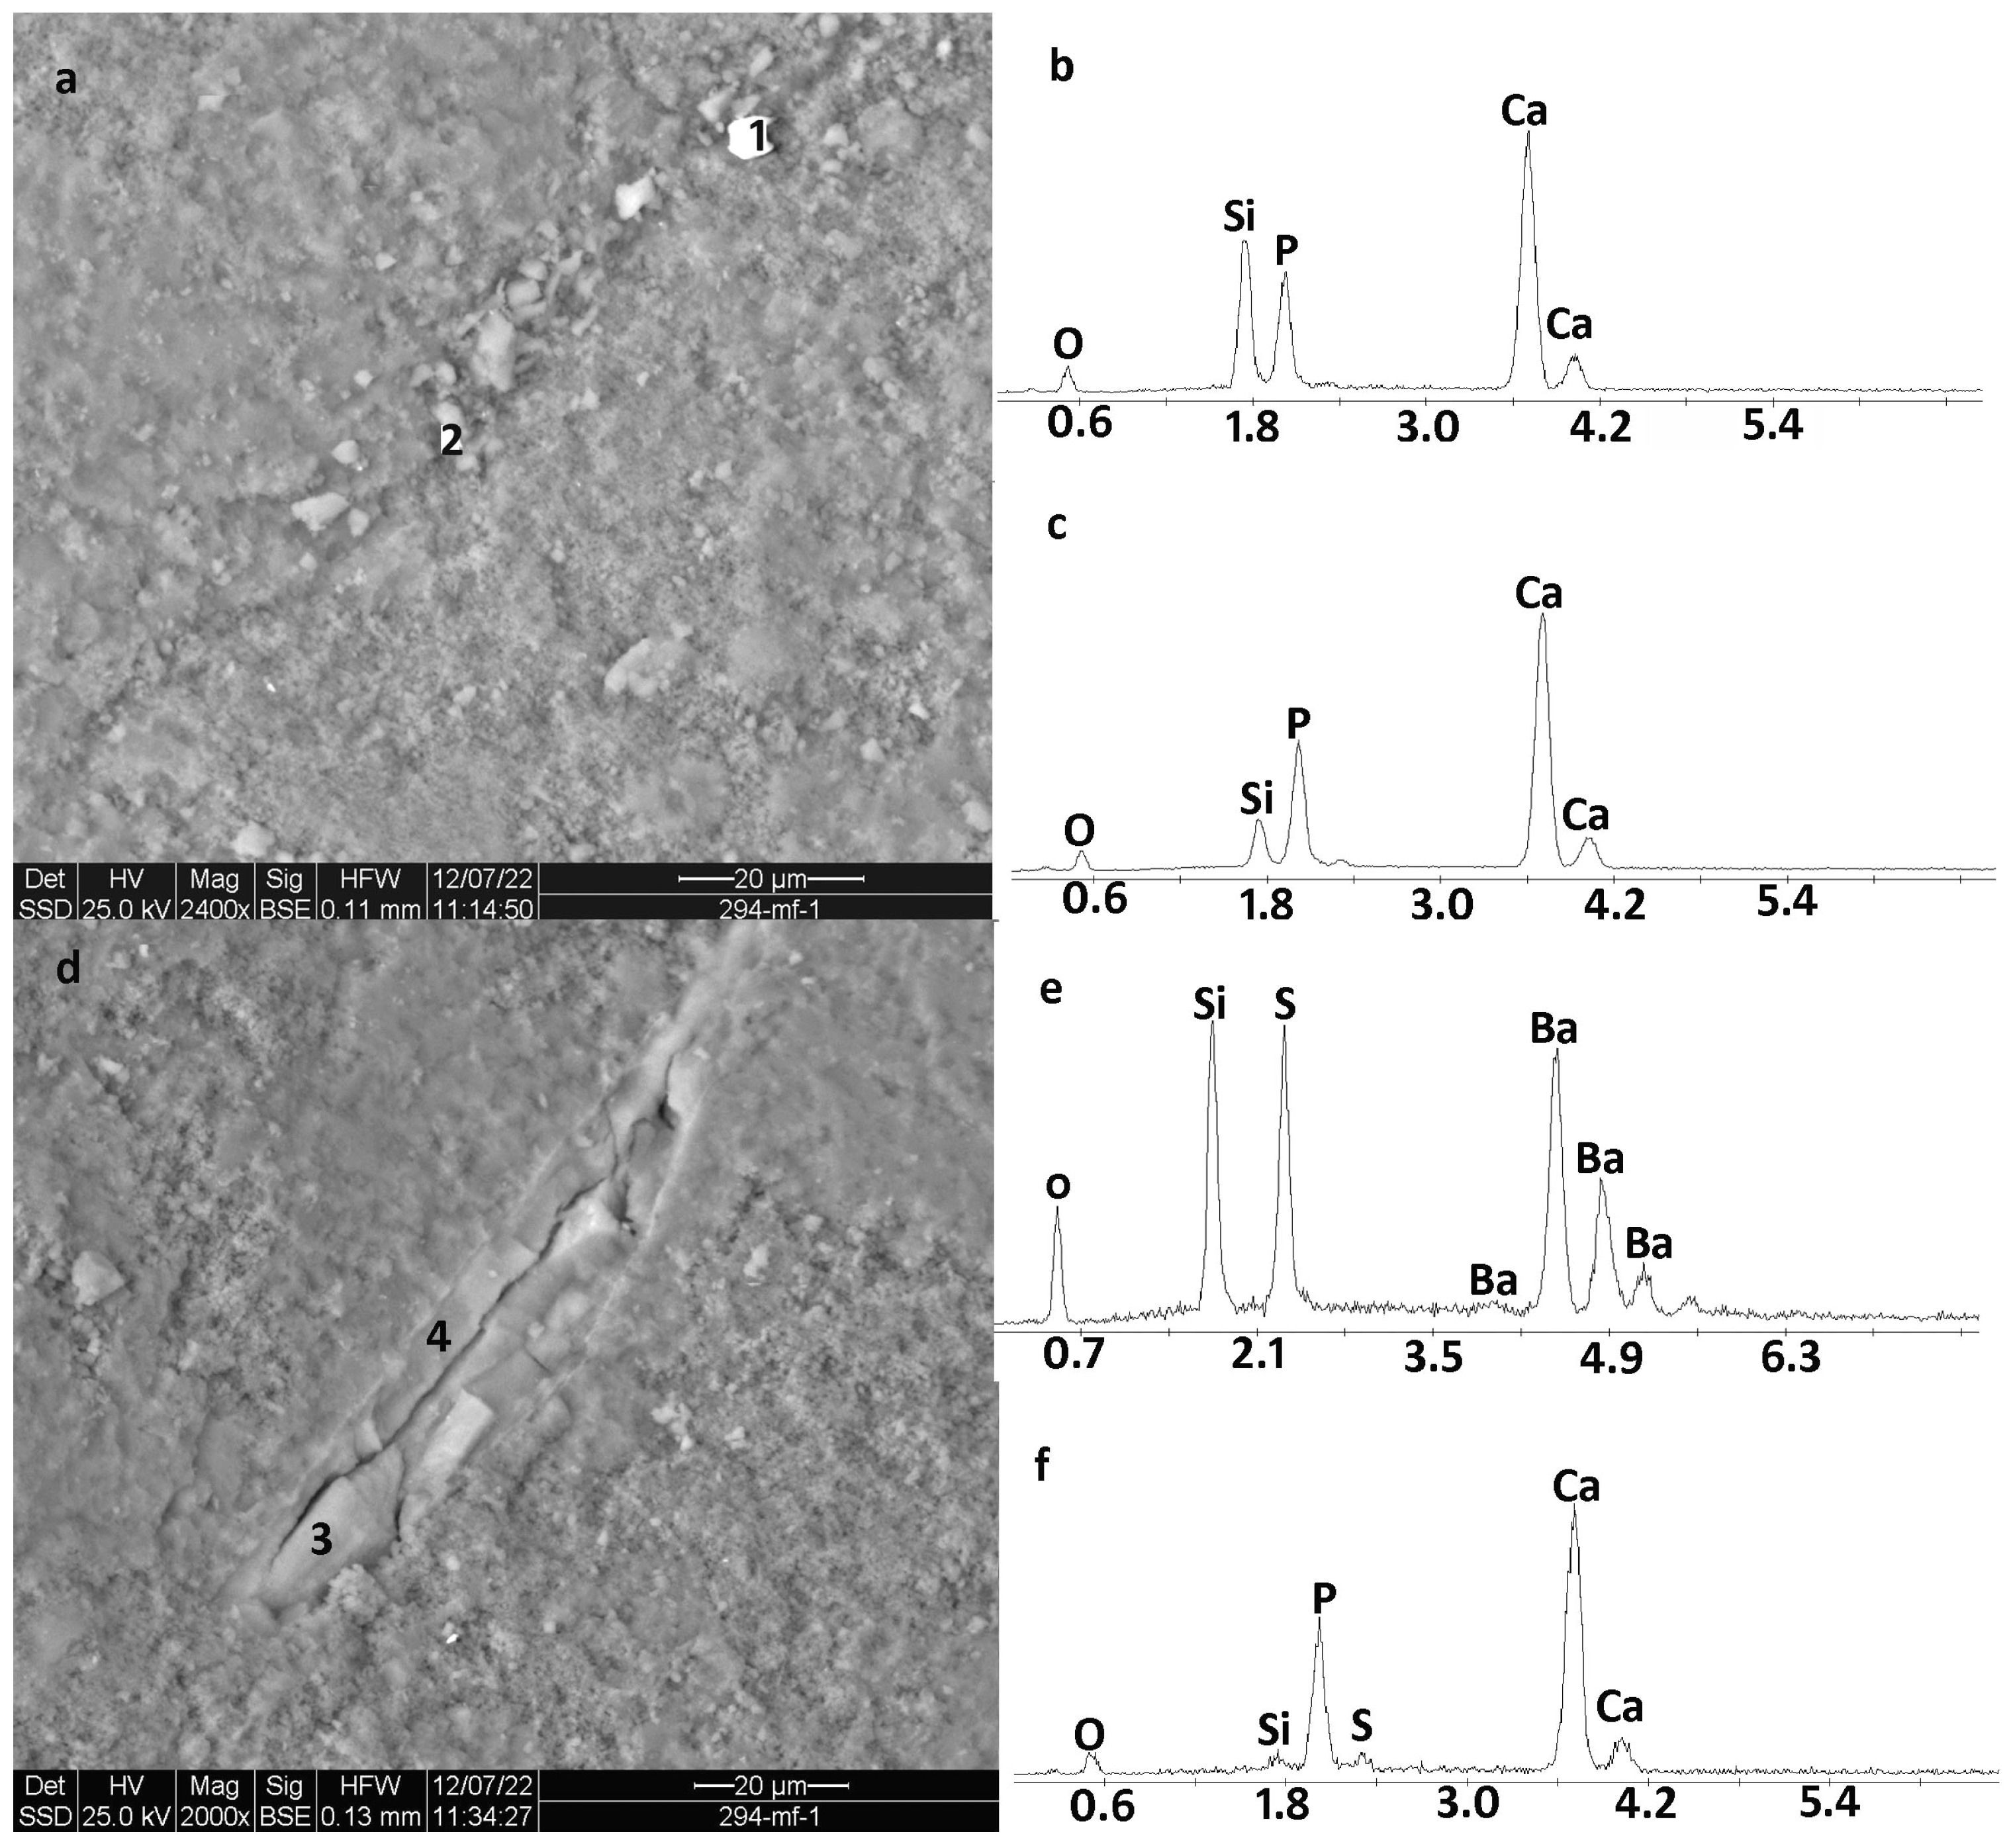
2.3.2. The Chemical Composition of Inclusions in the Bulk of Chert Rock

Figure 15 exhibits the typical composition of the inclusions in the bulk of chert gravels. It can be seen that in addition to silica and oxygen, several other chemical elements were found, as follows: Phosphor, Sulfur, Barium, and Calcium.
The weight percentage of the chemical elements is presented in Table 2.

3. Discussion

Analysis of Table 1 indicates that the density of chert rock obtained in the study is consistent with the values obtained in [8,9] for the flint rocks 2.58 gr/cm3. Note the similarity between the values of the Point Load index and tensile strength obtained in the study (Table 1) and those in [8,9] (22.9 MPa and 38.1 MPa, respectively). The values of uniaxial compression strength provided in [8,9] are similar to the estimated values based on Schmidt hammer and Point Load tests (see above). However, the uniaxial compressive strength of cubic samples is much lower than the value of uniaxial compression strength presented in [8,9]—495 MPa. Note that our results indicate a lack of essential difference in the values of cubic uniaxial compression strength obtained along the black/white bands as well as those perpendicular to them (not more than 3%–5%). Such a result is consistent with those of the SEM analysis, which showed similarity in the chemical composition of black and white bands and hence the lack of rock structurization. The results of the SEM analysis as well as the measurement of magnetic susceptibility, show the lack of magnetic minerals in general and iron in particular, even a minor amount of which could color the rocks. An accurate understanding of the reasons for dissimilarity in the color of the bands of chert rock is the object of future study.
The difference in the values of uniaxial compression strength can probably be explained by the effect of the point, contact/dynamic, and bulk properties of the chert rock (a phenomenon which is well known in rock mechanics, e.g., [29,30,31]); where the maximum values were obtained for the Point Load and the minimal values for the bulk (cubic) strength. The significant difference in point, dynamic, and cubic strength of the chert rock implies that the preferable comminution method of the rock is quasi-static (low rate) compression using the compression plates, the size of which is at least not less than the maximal size of chert gravels, and not dynamic or point like crushing.
The obtained values of porosity and water absorption are extremely low (less than a percent), which indicates that the aggregate made from this rock can be promising from this point of view for the requirements of the asphalt and concrete industries. Note that the study of the properties of chert for the concrete industry is mainstream in this field, especially to avoid ASR expansion in concrete [31,32,33,34,35,36,37]. For example, it was noted that concrete performed with both coarse and fine chert aggregates was non-expansive [31]. The chert studies in the field of the asphalt industry are much rare [38].
The values of ultrasonic wave speed are consistent with the estimation presented in [39,40,41] while slightly lower than those provided in [8,9]—5.4 km/s.
The high values of electrical resistivity and the value of dielectric permittivity of the chert rock as well as the existence of inhomogeneities (impurities) of additional minerals in the quartz bulk, can probably be the basis for future development of a methodology of their weakening before comminution or even for the comminution itself, e.g., using the methods high voltage breakage and/or microwaves heating [42].

4. Conclusions

An extensive laboratory study of chert gravels using more than 300 samples demonstrates the similarity of the results in density, Point Load index, hammer rebound index, ultrasonic wave speed, low porosity, etc., with the results provided for the flint rocks [8,9].
The intriguing new result of the study is the relatively low value of the cubic strength of the chert gravel (37.3 ± 10.4 MPa), which is much lower than the strength estimated on the Point Load and Schmidt hammer tests (321.0 ± 118.5 and 158.3 ± 30.4 MPa, respectively). This dissimilarity can be the basis for the development of milling machines, in which the chert gravels comminution is preferable to be carried out by the method of low-rate compression using big-size compression surfaces.
The high value of electrical resistivity (23 ± 1.9 kOhm × m), as well as the presence of impurities in calcium, phosphorus, sulfur, and barium, can be the basis for the softening of the gravels by the high-voltage breakage method, while the value of dielectric permittivity (2.53 ± 0.25) can be used to soften the rock by the microwave heating method [42].
The utilization of both ways or/and their integration will be extensively studied during future research.
As shown, the newly obtained properties of chert gravel open up the possibility for new avenues to improve the efficiency of sand mining by reducing/preventing the accumulation of waste by-products and therefore using natural resources in a climate-friendly manner.

Author Contributions

Conceptualization, M.T. and V.F.; methodology, M.T. and V.F.; software, M.T.; validation, M.T. and V.F.; formal analysis, M.T.; investigation, M.T. and V.F; resources, V.F.; data curation, V.F.; writing—original draft preparation, M.T. and V.F.; writing—review and editing, V.F.; visualization, M.T.; supervision, V.F.; project administration, V.F. All authors have read and agreed to the published version of the manuscript.

Funding

This research was funded by the Ministry of Energy of Israel. Grant number 3-18116/221-17-21.

Data Availability Statement

All data generated and analyzed during this study are included in the article.

Conflicts of Interest

The authors declare no conflict of interest.

References

  1. Shahar, Y. The Hazeva Formation in the Oron-Ef’e syncline. Israel Isr. J. Earth Sci. 1973, 22, 31–49. [Google Scholar]
  2. Calvo, R.; Bartov, Y. Hazeva Group, southern Israel: New observations, and their implications for its stratigraphy, paleogeography, and tectono-sedimentary regime. Isr. J. Earth Sci. 2001, 50, 71–99. [Google Scholar] [CrossRef]
  3. Shirav, M.; Shiloni, I.; Minster, Z. Sands from Mishor Rotem Region; Report GSI 11/97.
  4. Shahar, J. Note on stratigraphic relations of Zefa, Hazeva, and Hufeira formations in southern Israel. Isr. J. Earth Sci. 2008, 57, 33–44. [Google Scholar] [CrossRef]
  5. Roded, R. Geological Map of Israel, Dimona, Sheet 19-I, 1:50,000; Israel Geological Survey: Jerusalem, Israel, 2009. [Google Scholar]
  6. Graetsch, H.A.; Grünberg, J.M. Microstructure of flint and other chert raw materials. Archaeometry 2012, 54, 18–36. [Google Scholar] [CrossRef]
  7. Mainprice, D.; Paterson, M. Experimental deformation of flint in axial compression. In High-Strain Zones: Structure and Physical Properties; Bruhn, D., Burlini, L., Eds.; Geological Society: London, UK, 2005; Volume 245, pp. 251–276. [Google Scholar]
  8. Aliyu, M.M.; Shang, J.; Murphy, W.; Lawrence, J.A.; Collier, R.; Kong, F.; Zhao, Z. Assessing the uniaxial compressive strength of extremely hard cryptocrystalline flint. Int. J. Rock Mech. Min. Sci. 2019, 113, 310–321. [Google Scholar] [CrossRef]
  9. Aliyu, M.M.; Shang, J.; Murphy, W.; Lawrence, J.A.; Collier, R. Engineering Geological Characterization of Flints. Q. J. Eng. Geol. Hydrogeol. 2017, 50, 133–147. [Google Scholar] [CrossRef]
  10. ASTM D2216-10; Standard Test Method for Laboratory Determination of Water (Moisture) Content of Soil and Rock by Mass. ASTM International: West Conshohocken, PA, USA, 2010.
  11. ASTM C127–04; Standard Test Method for Density, Relative Density (Specific Gravity), and Absorption of Coarse Aggregate. ASTM International: West Conshohocken, PA, USA, 2004.
  12. ASTM D854–92; Standard Test Methods for Specific Gravity of Soils. ASTM International: West Conshohocken, PA, USA, 2016.
  13. ASTM C97-96; Standard Test Method for Absorption and Bulk Specific Gravity of Dimension Stone. ASTM International: West Conshohocken, PA, USA, 1996.
  14. ASTM D2726-11; Standard Test Method for Bulk Specific Gravity and Density of Non-Absorptive Compacted Bituminous Mixtures. ASTM International: West Conshohocken, PA, USA, 2011.
  15. Craig, R.F. Craig’s Soil Mechanics, 7th ed.; Spon Press: London, UK; New York, NY, USA, 2004. [Google Scholar]
  16. Ulusay, R. The ISRM Suggested Methods for Rock Characterization, Testing and Monitoring: 2007–2014. International Society for Rock Mechanics Commission on Testing Methods; Springer: Cham, Switzerland; Heidelberg, Germany; New York, NY, USA; Dordrecht, The Netherland; London, UK, 2015. [Google Scholar] [CrossRef]
  17. Masoumi, H.; Roshan, H.; Hedayat, A.; Hagan, P.C. Scale-Size Dependency of Intact Rock under Point-Load and Indirect Tensile Brazilian Testing. Int. J. Geomech. 2018, 18, 04018006. [Google Scholar] [CrossRef]
  18. Wang, M.; Xu, W.; Chen, D.; Li, J.; Mu, H.; Mi, J.; Wu, Y. Summary of the Transformational Relationship between Point Load Strength Index and Uniaxial Compressive Strength of Rocks. Sustainability 2022, 14, 12456. [Google Scholar] [CrossRef]
  19. Zhang, L. Engineering Properties of Rocks; Elsevier Ltd.: Amsterdam, The Netherlands, 2017. [Google Scholar] [CrossRef]
  20. ASTM D5731; Standard Test Method for Determination of the Point Load Strength Index of Rock and Application to Rock Strength Classifications. ASTM International: West Conshohocken, PA, USA, 2016.
  21. Deere, D.U.; Miller, R.P. Engineering Classification and Index Properties for Intact Rock; Tech. Rep. No. AFWL-TR-65-116; Air Force Weapons Lab: Albuquerque, NM, USA, 1966. [Google Scholar]
  22. ASTM D4543-85; Standard Practice for Preparing Rock Core Specimens and Determining Dimensional and Shape. ASTM International: West Conshohocken, PA, USA, 1985.
  23. Hughes, B.P.; Bahramian, B. Cube tests and the uniaxial compressive strength of concrete. Mag. Concr. Res. 1965, 17, 177–182. [Google Scholar] [CrossRef]
  24. ASTM D3967; Standard Test Method for Splitting Tensile Strength of Intact Rock Core Specimens. ASTM International: West Conshohocken, PA, USA, 2004.
  25. Frid, V.; Potirakis, S.M.; Shulov, S. Study of Static and Dynamic Properties of Sand under Low Stress Compression. Appl. Sci. 2021, 11, 3311. [Google Scholar] [CrossRef]
  26. Frid, V.; Shulov, S. Acoustic emission induced by sand liquefaction during vibration loading. Sci. Rep. 2022, 12, 16881. [Google Scholar] [CrossRef]
  27. Frid, A.; Frid, V. Moisture effect on asphalt dielectric permittivity: Simulating, sensitivity analysis and experimental validation. Int. J. Pavement Res. Technol. 2023. [Google Scholar] [CrossRef]
  28. Loke, M.H. Tutorial: 2-D and 3-D Electrical Imaging Surveys. 2004. Available online: www.geoelectrical.com (accessed on 1 May 2015).
  29. Thuro, K.; Plinninger, R.J. Scale effects in rock strength properties. Part 1: Unconfined compressive test and Brazilian test. In Rock Mechanics—A Challenge for Society; Särkkä, P., Eloranta, P., Eds.; Swets & Zeitlinger Lisse: Lisse, The Netherlands, 2001; ISBN 9026518218. [Google Scholar]
  30. Cundall, P.A.; Pierce, M.E.; Mas Ivars, D. Quantifying the Size Effect of Rock Mass Strength. In SHIRMS 2008: Proceedings of the First Southern Hemisphere International Rock Mechanics Symposium; Potvin, Y., Carter, J., Dyskin, A., Jeffrey, R., Eds.; Australian Centre for Geomechanics: Perth, Australia, 2008; pp. 3–15. [Google Scholar] [CrossRef]
  31. Moundoungou, I.; Bulteel, D.; Garcia-Diaz, E.; Thiéry, V.; Dégrugilliers, P.; Hammerschlag, J.G. Reduction of ASR expansion in concretes based on reactive chert aggregates: Effect of alkali neutralization capacity. Constr. Build. Mater. 2014, 54, 147–162. [Google Scholar] [CrossRef]
  32. Kamani, M.; Ajalloeian, R. Investigation of the effect of petrological contents on the engineering properties of carbonates aggregates. Eng. Geol. 2022, 298, 106507. [Google Scholar] [CrossRef]
  33. Rivard, P.; Ballivy, G. Assessment of the expansion related to alkali-silica reaction by the Damage Rating Index method. Constr. Build. Mater. 2005, 19, 83–90. [Google Scholar] [CrossRef]
  34. Abd-Allah, A.M.A.; Baghdady, A.R.; Dawood, Y.H. Adequacy of carbonate aggregates as an alternative for chert aggregates in concrete manufacture. Constr. Build. Mater. 2018, 181, 94–105. [Google Scholar] [CrossRef]
  35. Abd-Elssamd, A.; Maa, Z.J.; Hou, H.; Le Pape, Y. Influence of mineralogical and chemical compositions on alkali-silicareaction of Tennessee limestones. Constr. Build. Mater. 2020, 261, 119916. [Google Scholar] [CrossRef]
  36. Broekmans, M.A.T.M. Structural properties of quartz and their potential role for ASR. Mater. Charact. 2004, 53, 129–140. [Google Scholar] [CrossRef]
  37. Hansen, B.S.; Carey, A.S.; Howard, I.L. Effects of Aggregate Shape and Mineralogy on Relationships between Concrete Mechanical Properties. ACI Mater. J. 2021, 118, 115–124. [Google Scholar]
  38. Cross, S.A.; Purcell, E.M. Effects of fine aggregate angularity on VMA and rutting of Kansas MIA mixtures. ASTM Spec. Tech. Publ. 2001, 1412, 95–109. [Google Scholar]
  39. Barton, N. The relationship between seismic velocity and density in the continental crust–a useful constraint. Geophys. J. R. Astron. Soc. 1986, 87, 195. [Google Scholar] [CrossRef]
  40. Brocher, T.M. Key elements of regional seismic velocity models for long period ground motion simulations. J. Seismol. 2008, 12, 217. [Google Scholar] [CrossRef]
  41. Frid, V.; Rabinovitch, A.; Bahat, D. Earthquake forecast based on its nucleation stages and the ensuing electromagnetic radiations. Phys. Lett. A 2020, 384, 126102. [Google Scholar] [CrossRef]
  42. Aditya, S.; Nandi Tapas, K.; Pal Samir, K.; Majumder Arun, K. Pre-treatment of rocks prior to comminution–A critical review of present practices. Int. J. Min. Sci. Technol. 2017, 27, 339–348. [Google Scholar]
Figure 1. The Mishor-Rotem region–the location of the area under study.
Minerals 13 00455 g001
Figure 3. (a) The chert rock as a by-product of sand mining; (b) the typical sizes and shape of chert gravels; (c) the example of the sand section including chert “layers”; (d) the view of the retained area of the former open pit.
Minerals 13 00455 g003
Figure 4. The study skeleton consists of three main phases.
Minerals 13 00455 g004
Figure 5. (a) The oven-drying; (b) the tool for the density measurement by Archimedes method.
Minerals 13 00455 g005
Figure 6. (a) The relationship between the values of specific gravity, fully saturated water content (in black), void ratio (in red), and porosity (in blue); (b) the relationship between the values of porosity, fully saturated water content (in black), and void ratio (in red).
Minerals 13 00455 g006
Figure 7. (a) The utilization of the Point Load test; (b) zoom-in of the Point Load instrument and the chert sample; (c) the use of the Schmidt hammer; (d) zoom-in of the Schmidt hammer and the chert sample during the test.
Minerals 13 00455 g007
Figure 8. (a) The drilling machine used in attempts to prepare cylindrical samples for the strength study; (b) the Shattal Diamond Disk Saw used for the cubic samples’ preparation; (c) the typical cubic sample within the compression machine; (d) The typical strain-stress diagram.
Minerals 13 00455 g008
Figure 9. (a) The ~1.5 cm deep borehole in chert rock sample after one-hour drilling; (b) the typical assemblage of the chert rock samples prepared for modified Brazilian test; (c) the typical shape of the chert sample split between two steel pins; (d) the typical strain-stress diagram.
Minerals 13 00455 g009
Figure 10. (a) The assemblage of chert sample and two ultrasonic sensors; (b) the typical shape of transmitted (yellow) and received (blue) ultrasonic pulses.
Minerals 13 00455 g010
Figure 11. (a) The Percometer instrument; (b) the measurement of dielectric permittivity.
Minerals 13 00455 g011
Figure 12. (a) The tool for electric resistivity measurements; (b) the measurement of electric resistivity of chert sample.
Minerals 13 00455 g012
Figure 13. (a) The measurement of magnetic susceptibility; (b) The Scintrex instrument for magnetic susceptibility study.
Minerals 13 00455 g013
Figure 14. (a) The SEM photograph of the chert surface; (b) the typical chemical composition of the chert rock; (c) the study of the difference in chemical composition between black and white bands (both denoted by dark color), digits 1 and 2 indicate the location of the measurement points; (d) the typical chemical composition of the chert rock within the black band; (e) the typical chemical composition of the chert rock within the white band.
Minerals 13 00455 g014
Figure 15. (a) The SEM picture of the inclusions in the chert rock, 1 and 2 denote the location of the measurements; (b) the results of measurements in point 1; (c) the results of measurements in point 2; (d) the second example of the SEM picture of the inclusions in the chert rock, 3 and 4 denote the location of the measurements; (e) the results of measurements in point 3; (f) the results of measurements in point 4.
Minerals 13 00455 g015
Table 1. The value of physical-mechanical parameters of chert gravels.
ParameterValueParameterValue
OD * (gr/cm3) 2.56 ± 0.02The mean value of UCS, MPa
(based on Is(50) value)
321.0 ± 118.5
SSD ** (gr/cm3) 2.56 ± 0.04The mean value of UCS, MPa, (based on the Schmidt hammer test)158.3 ± 30.4
AD *** (gr/cm3) 2.57 ± 0.04Uniaxial compression strength (cubic samples), MPa37.3 ± 10.4
Porosity (%)0.34 ± 0.3Tension strength, MPa
(based on Brazilian test)
10.8 ± 3.3
Mass water absorption (%)0.13 ± 0.13The value of US speed, km/s4.38 ± 0.72
Vol. water absorption (%)0.32 ± 0.32Electrical resistivity, kOhm × m23 ± 1.9
Point Load index–Is(50), MPa12.5 ± 5.2Dielectric permittivity2.53 ± 0.25
Magnetic susceptibility0
* OD—Oven-dry density, ** SSD—Saturated surface-dry density, *** AD—Apparent density—see Equation (1).
Table 2. The weight percentage of chemical elements.
FigureO, %Si, %Ca, %P, %Ba, %S, %
Figure 14b50.6748.540.79
Figure 14d53.0949.91
Figure 14e53.9647.04
Figure 15b39.3213.7734.8712.04
Figure 15c42.0212.8914.2130.87
Figure 15e32.5612.6 39.7515.09
Figure 15f33.1220.7229.3415.98 0.85
Disclaimer/Publisher’s Note: The statements, opinions and data contained in all publications are solely those of the individual author(s) and contributor(s) and not of MDPI and/or the editor(s). MDPI and/or the editor(s) disclaim responsibility for any injury to people or property resulting from any ideas, methods, instructions or products referred to in the content.

