Article

Ultrahigh-Pressure Metamorphism and P-T-t Paths for the Eclogites from the Central Areas of Sulu Orogen, Eastern China

1
College of Earth Sciences, Jilin University, Changchun 130061, China
2
Key Laboratory of Mineral Resources Evaluation in Northeast Asia, Ministry of Natural Resources of China, Changchun 130026, China
3
Department of Earth Sciences, Kunming University of Science and Technology, Kunming 650093, China
4
School of Resources and Environmental Engineering, Shandong University of Technology, Zibo 255000, China
5
College of Earth Sciences, Northeast Petroleum University, Daqing 163318, China
*
Author to whom correspondence should be addressed.
Minerals 2023, 13(3), 362; https://doi.org/10.3390/min13030362
Submission received: 27 January 2023 / Revised: 27 February 2023 / Accepted: 2 March 2023 / Published: 4 March 2023

Abstract

:
Eclogites from the Guanshan and Yangkou areas of the Sulu orogen consist of garnet, omphacite, phengite, amphibole, quartz/coesite, rutile, and ilmenite. Garnet exhibits weak compositional zoning where Xgr decreases from the core to the mantle and then increases towards the rim, coupled with an increase in Xpy from the core to the mantle and then decrease towards the rim. Phase equilibria modelling with pseudosections calculated using THERMOCALC in the NCKFMASHTO system for the Guanshan and Yangkou eclogites records two stages of metamorphism: (I) prograde associated with quick subduction (Stage-I) and (II) retrograde associated with quick exhumation (Stage-II). Stage-I is recorded in the core-mantle zoning of garnet and Si content in phengite in the Guanshan and Yangkou eclogites with a mineral assemblage of Grt-Omp-Amp-Phg-Qtz-Rt ± Lws, and the P-T conditions are constrained at 22–26 kbar and 600–615 °C in Guanshan, while 24–26 kbar and 595–600 °C in Yangkou. The peak P-T conditions (Pmax = 33 kbar; T = 685 °C) of Guanshan eclogites are revealed by the maximum Si content in phengite and the minimum Xgr in the garnet mantle with the mineral assemblage of Grt-Omp-Phg-Coe-Rt ± Lws. The value of Pmax suggests that the subduction depth of the Guanshan eclogites exceeds 110 km. Stage-II is recorded in the mantle-rim zoning of garnet, and its P-T conditions are estimated to be 12–15 kbar and 780–820 °C for the Guanshan eclogites reflected by the assemblage of Grt-Omp-Amp-Pl-LL-Qtz-Rt ± ilm, and 13–14 kbar and 770–790 °C for the Yangkou eclogites by the assemblage of Grt-Omp-Amp-Pl-LL-Qtz-Rt. The two stages of metamorphism in the study areas are overall consistent with the regional metamorphic events, from ultra-high-pressure eclogite facies, through high pressure eclogite facies, to amphibole eclogite facies, with the ages of 245, 227 and 195 Ma, respectively.

1. Introduction

The formation and evolution of ultra-high-pressure (UHP) mineral assemblages (e.g., garnet, omphacite, phengite, and coesite) have important implications, not only for the generation and differentiation of continental crust through the operation of plate tectonics but also for mountain building along both converging and converged plate boundaries [1]. Since coesite-bearing eclogite breccia was first reported in the Yangkou area, great progress has been made in the study of the Sulu UHP metamorphic belt [2,3,4,5]. P-T conditions during the prograde metamorphic stage were estimated by Graham and Powell [6] at 10 kbar and 550–600 °C using garnet–amphibole geothermobarometry. Peak P-T conditions were estimated by Zhang et al. [7] at 30–39 kbar and 740–830 °C using the Grt–Omp–Coe–Phg geothermobarometry of Ravna and Terry [8]. Much higher peak P-T conditions obtained by Ye et al. [9] based on clinopyroxene, rutile, and apatite exsolution in garnet are up to 70 kbar and 1000 °C. We recently achieved retrograde P-T conditions of 21.4–23 kbar and 869–924 °C for the Xiaoxinzhuang eclogites in the central part of the Sulu UHP belt using the pseudosection approach in the NCKFMASHTO system [10]. The discrepancies between the P-T-t path style and peak P-T conditions might reflect differential subduction processes of rock slices in the Sulu metamorphic belt [10,11,12,13].
Evaluation of metamorphic P-T evolution using THERMOCALC by Powell et al. [14] has proven to be a powerful approach to elucidate phase relations in metamorphic rocks [15,16,17,18,19]. This method has also proven useful in the study of UHP eclogites, because it could quantify the evolution of mineral assemblages and constrain a robust P-T path [20].
Guanshan and Yangkou are located in the southern and northern Sulu UHP terranes, respectively. To evaluate spatial variations of metamorphic P-T conditions in the whole Sulu HP/UHP belt, this study is an important addition. In addition, modal variations of major minerals in the rock system along the P-T paths for the Guanshan and Yangkou eclogites are also examined and illustrated in this study.

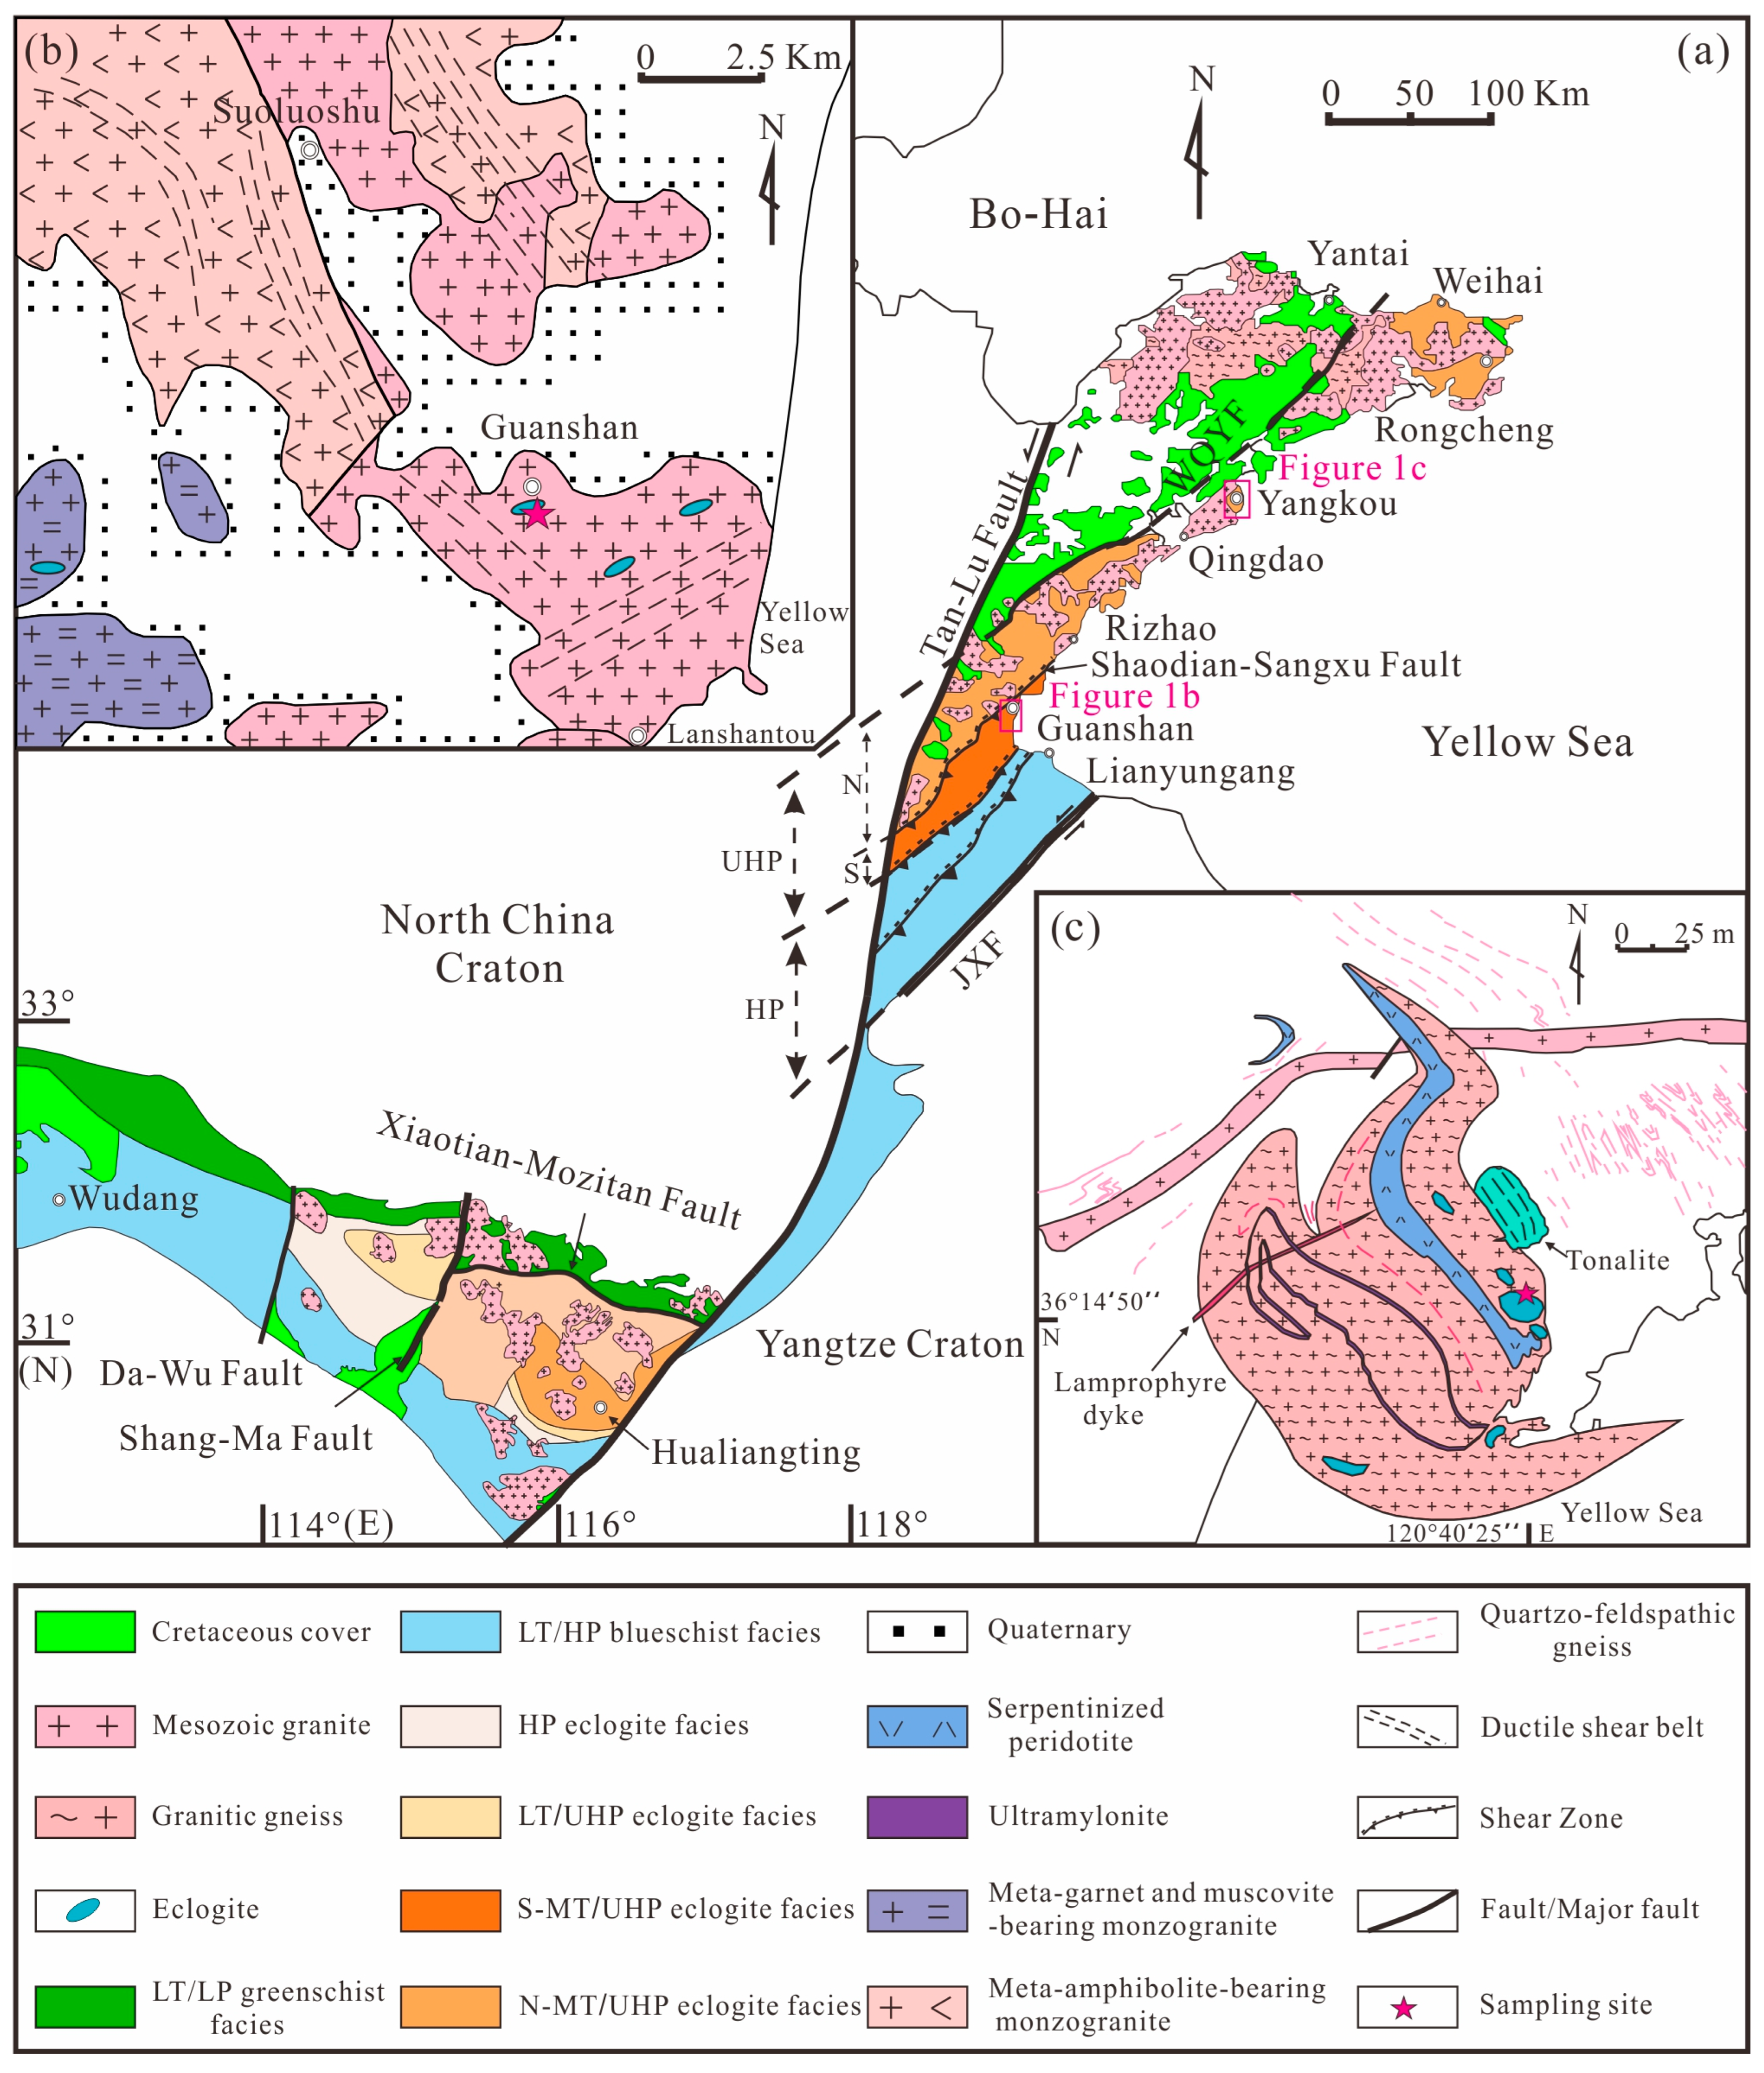
2. Geological Setting

The Sulu orogenic belt is the eastern extension of the Sulu-Dabie orogenic belt. The sinistral strike-slip of the NNE-striking Tan-Lu fault displaced the orogen for about 500 km in length, forming the present NE-SW Sulu orogenic belt (Figure 1a). The Sulu orogenic belt is bounded by the Wulian–Qingdao–Yantai Fault (WQYF) in the northwest and the Jiashan–Xiangshui Fault (JXF) in the southeast and overlain by the Cretaceous cover (Figure 1a; [21,22]). It is further divided into a HP sector (Sulu HP terrane) in the south and an UHP sector (Sulu UHP terrane) in the north, respectively (Figure 1a; [23,24,25,26,27]). The Sulu HP terrane predominantly consists of kyanite- and phengite-bearing quartzites, phengite-bearing quartz schists, albite gneisses, phengite-bearing marbles, and blueschists [5,21,23,28,29]. The Sulu UHP terrane can be further subdivided into the southern Sulu UHP terrane (S-UHP) and the northern Sulu UHP terrane (N-UHP), separated by the Shaodian-Sangxu fault (Figure 1a; [30]). The S-UHP terrane is mainly composed of coesite-bearing ultrahigh pressure metamorphic supracrustal rocks, eclogites, and ultramafic rock lenses [31], while the N-UHP terrane consists mainly of granitic gneisses and metasedimentary rocks. Many isolated bodies of garnet peridotite, amphibolite, garnet pyroxenite, and coesite-bearing eclogites are present in these granitic gneisses [5,32,33,34]. Metasedimentary rocks (such as marble) are lenticular in the granitic gneisses [35].
Eclogite, granite, metamorphic garnet- and muscovite-bearing monzogranite, and amphibolite-bearing monzogranite commonly exist in the outcrop of Guanshan (Figure 1b; [36]), while granitic gneiss, coesite-bearing eclogites, ultramylonite, and serpentinized peridotite are found in the outcrop of Yangkou (Figure 1c; [9,37,38]). Yangkou UHP units were cut and intruded by a lamprophyre dyke (Figure 1c). Eclogites in both Guanshan and Yangkou sporadically occur as lenticular bodies in the granites and granitic gneisses (Figure 1b,c).
Figure 1. (a) Geological sketch map of the Dabie-Sulu orogenic belt in eastern China (modified after [19,38]). Geological map of the Guanshan area (b) and Yangkou area (c) (modified after [5,36,38]), showing lithological distribution and sampling locations.
Minerals 13 00362 g001

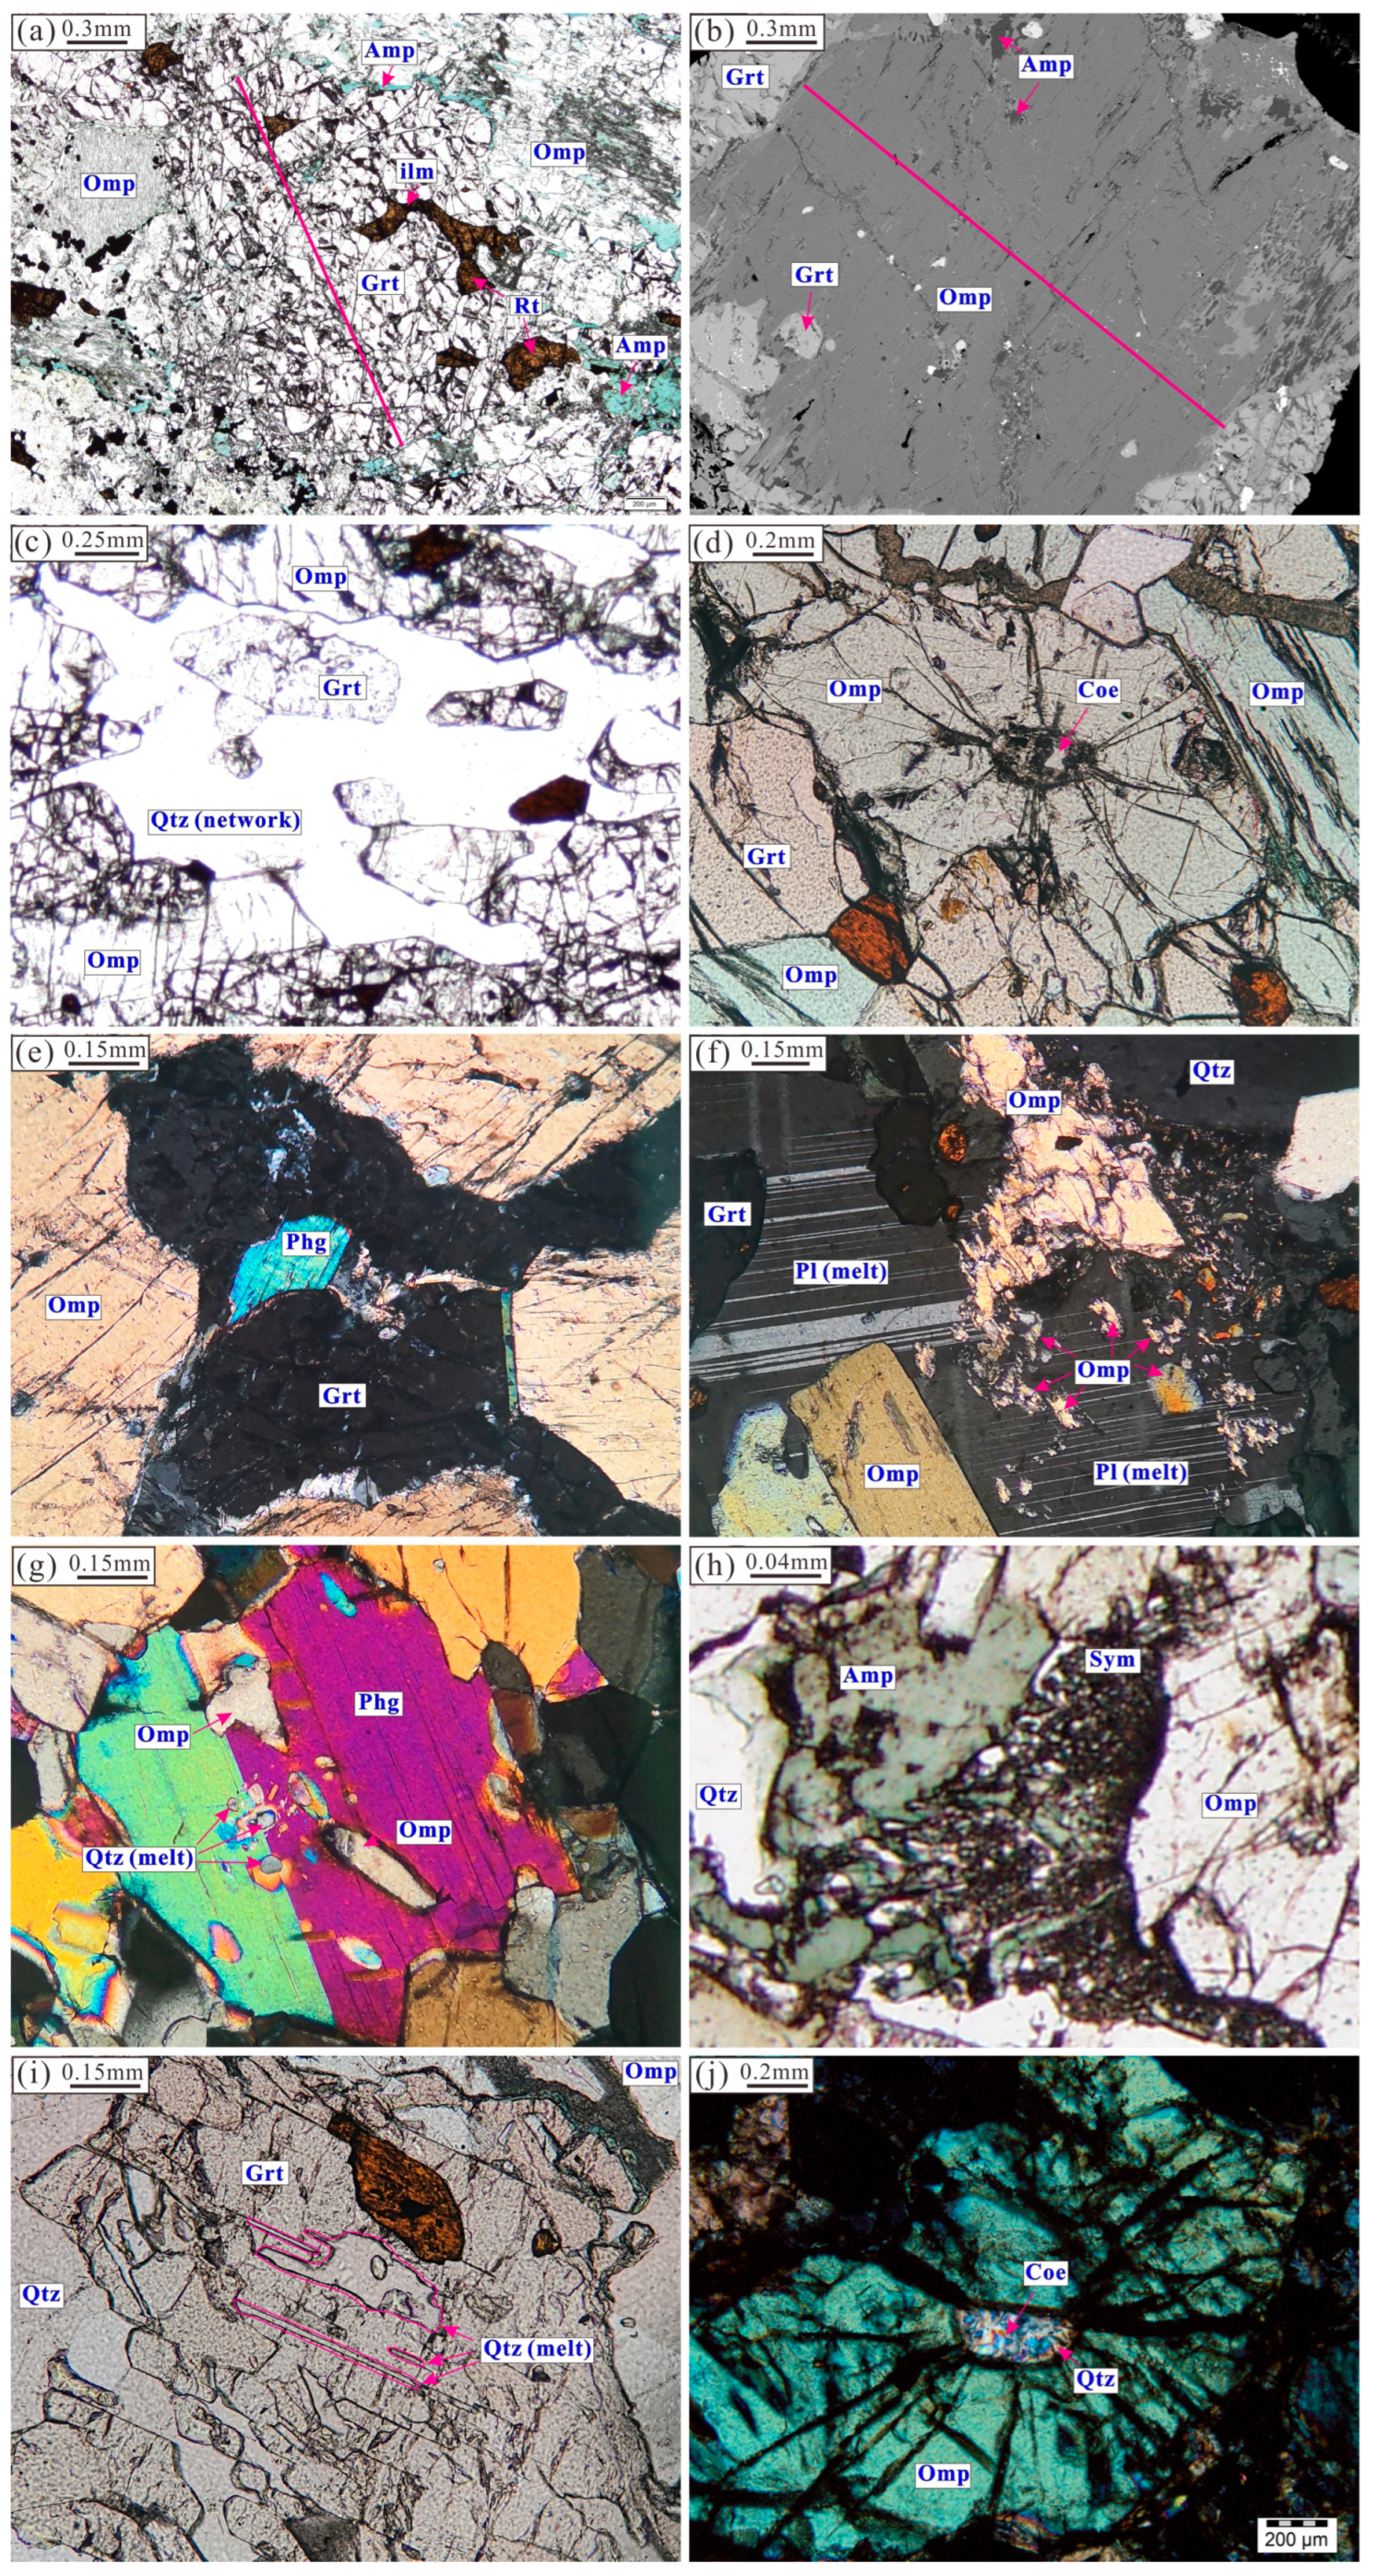
3. Sampling and Sample Petrography

The eclogite samples used in this study were collected in the Guanshan and Yangkou areas, and sampling locations are presented in Figure 1b and Figure 1c, respectively.
The Guanshan eclogites are hypidiomorphic granular and composed of garnet (40–45 vol.%; 0.3–2.5 mm), omphacite (45–50 vol.%; 0.3–1.2 mm), phengite (3–5 vol.%; 0.02–0.1 mm), amphibole (2–3 vol.%; 0.1–0.5 mm), rutile (1–2 vol.%; 0.05–0.25 mm), epidote (<1 vol.%; 1.0–2.0 mm) and quartz (2–3 vol.%; 0.05–0.5 mm) (Figure 2a–f). In sample G-10, garnet is subhedral to anhedral, with inclusions of omphacite, quartz, rutile, and phengite (Figure 2a). It also occurs as inclusions in omphacite (Figure 2b). Garnet shows obvious fissures and inconspicuous core-edge structure. Omphacite is subhedral-anhedral granular and also shows core-edge structure (Figure 2b). Amphiboles form during retrograde metamorphism. It occurs in two forms: matrix and corona. Amphiboles in the matrix are anhedral and flaky in texture and occur as veinlets in between garnet and omphacite grains (Figure 2h). The textures of amphibole formed from omphacite due to decompression are common (Figure 2h). Coronal amphibole occurs along microfractures within garnet grains and the coating of garnet, which formed from the breakdown of garnet (Figure 2a). Epidote is subhedral to anhedral. Rutile broke down to form ilmenite via the reaction Rt → Rt + Ilm intergrowth during exhumation (Figure 2a). In sample G-11, fractures in the host omphacite radiate out from the enclosed quartz (pseudomorph after coesite) towards the outer boundaries (Figure 2d). Phengite occurs as an inclusion in garnet (Figure 2e).
Two types of melts can be identified in the Guanshan eclogites: (1) the melt phase (quartz) forms “strings of beads” and “network vein” along grain boundaries between garnet and omphacite in sample G-10 (Figure 2c), indicating that partial melting occurred during subduction and/or exhumation; (2) melt pseudomorph of plagioclase with a clear polysynthetic twin probably crystallized from a pool of melt in sample G-11 (Figure 2f). The occurrence of clastic omphacite inclusions in plagioclase may indicate that they are residues of partial melting (Figure 2f).
The Yangkou eclogites (sample Y-32) contain garnet (25–30 vol.%; 0.1–0.7 mm), omphacite (35–50 vol.%; 0.1–0.5 mm), phengite (10–15 vol.%; 0.2–0.5 mm), amphibole (2–3 vol.%; 0.1–0.2 mm), rutile (2–3 vol.%; 0.05–0.1 mm), epidote (<1 vol.%; 1.0–2.0 mm) and quartz (3–5 vol.%; 0.1–0.3 mm) (Figure 2g–j). Omphacite is anhedral and granular, and it retrograded to form a symplectitic mixture of Amp + albite + Fe-oxide through the reaction of Omp + (Pl) → Amp + (Pl) (Figure 2h), and then further to form amphibole during exhumation (Figure 2h). Inclusion of pseudomorphic coesite is found in a host omphacite (Figure 2j).
Two types of melts can be identified in Yangkou eclogites: (1) clusters of quartz and feldspar melt inclusions at the core of phengite (Figure 2g); (2) quartz melt filled in the fractures of garnet in the form of veinlets (Figure 2i). The type and occurrence of melts indicate that they represent initial in-situ melting.
Based on the textures and mineralogy of the Guanshan and Yangkou eclogites in the study areas, four stages of mineral paragenesis were identified: Paragenesis-1 is characterized by Grt-core + Omp + Phg. Omp and Phg occur as inclusions in garnet porphyroblast (Figure 2a,e), representing the products of prograde metamorphism. Paragenesis-2 is composed of Grt + Omp + Coe + Phg (Figure 2d,j), representing peak metamorphism. Paragenesis-3 is composed of Grt + Omp + Phg + melt, in which melt formed from quartz and feldspar occurs as “clusters” and “veinlets” in the phengite and garnet, respectively, representing the initial exhumation stage (Figure 2g,i). Paragenesis-4 is characterized by Grt-rim + Amp + Omp + Ilm + Pl + melt, representing the retrograde metamorphism stage. At this stage, Omp and Rt broke down to form Amp and Ilm, respectively (Figure 2a,h), Pl formed from a pool of melt (Figure 2f), and quartz melt occurred as a “network vein” along boundaries of garnet and omphacite (Figure 2c).

4. Analytical Methods

The analyses of major and trace elements for the bulk rock samples were carried out at the Yanduzhongshi Geological Analysis Laboratories Ltd., Beijing, China. Fresh samples were first broken into centimeter-sized pieces; only the fresh pieces were selected, washed with deionized water, dried, and then ground to less than 200 mesh (0.5200 ± 0.0001 g) for geochemical analyses. Sample powders were fluxed with Li2B4O7 (1:8) to make homogeneous glass disks at 1250 °C using a V8C automatic fusion machine produced by the Analymate Company in China.
The major elements in bulk rocks were analyzed using X-ray fluorescence spectrometry techniques with analytical errors better than 1%.
For trace element analysis, sample powders were first dissolved using distilled HF + HNO3 in a screw-top Teflon beaker for 4 days at 190 °C and then analyzed by inductively coupled mass spectrometry (ICP-MS) at the Yanduzhongshi Geological Analysis Laboratories Ltd. The analytical uncertainties of most elements are better than 5%, except for a few elements that are low in abundance and have uncertainties better than 10%. The obtained values of trace elements in the GSR-2 standard are all consistent with their recommended values.
The analyses of mineral compositions were carried out at the Key Laboratory of Mineral Resources Evaluation in Northeast Asia, Ministry of Natural Resources, Jilin University, using a JEOL JXA-8230 electron microprobe. Acceleration voltage is 15 kV, beam current is 10 nA, and beam diameter is 1 μm (phengite is 5 μm). PRZ correction procedure is used to obtain raw data, and 53 standard minerals from the SPI Company are used for standardization. AX program (Holland; http://www.esc.cam.ac.uk/astaff/holland/ax.html accessed on 25 October 2021). was used to calculate the mineral compositions.

5. Bulk Rock and Mineral Composition

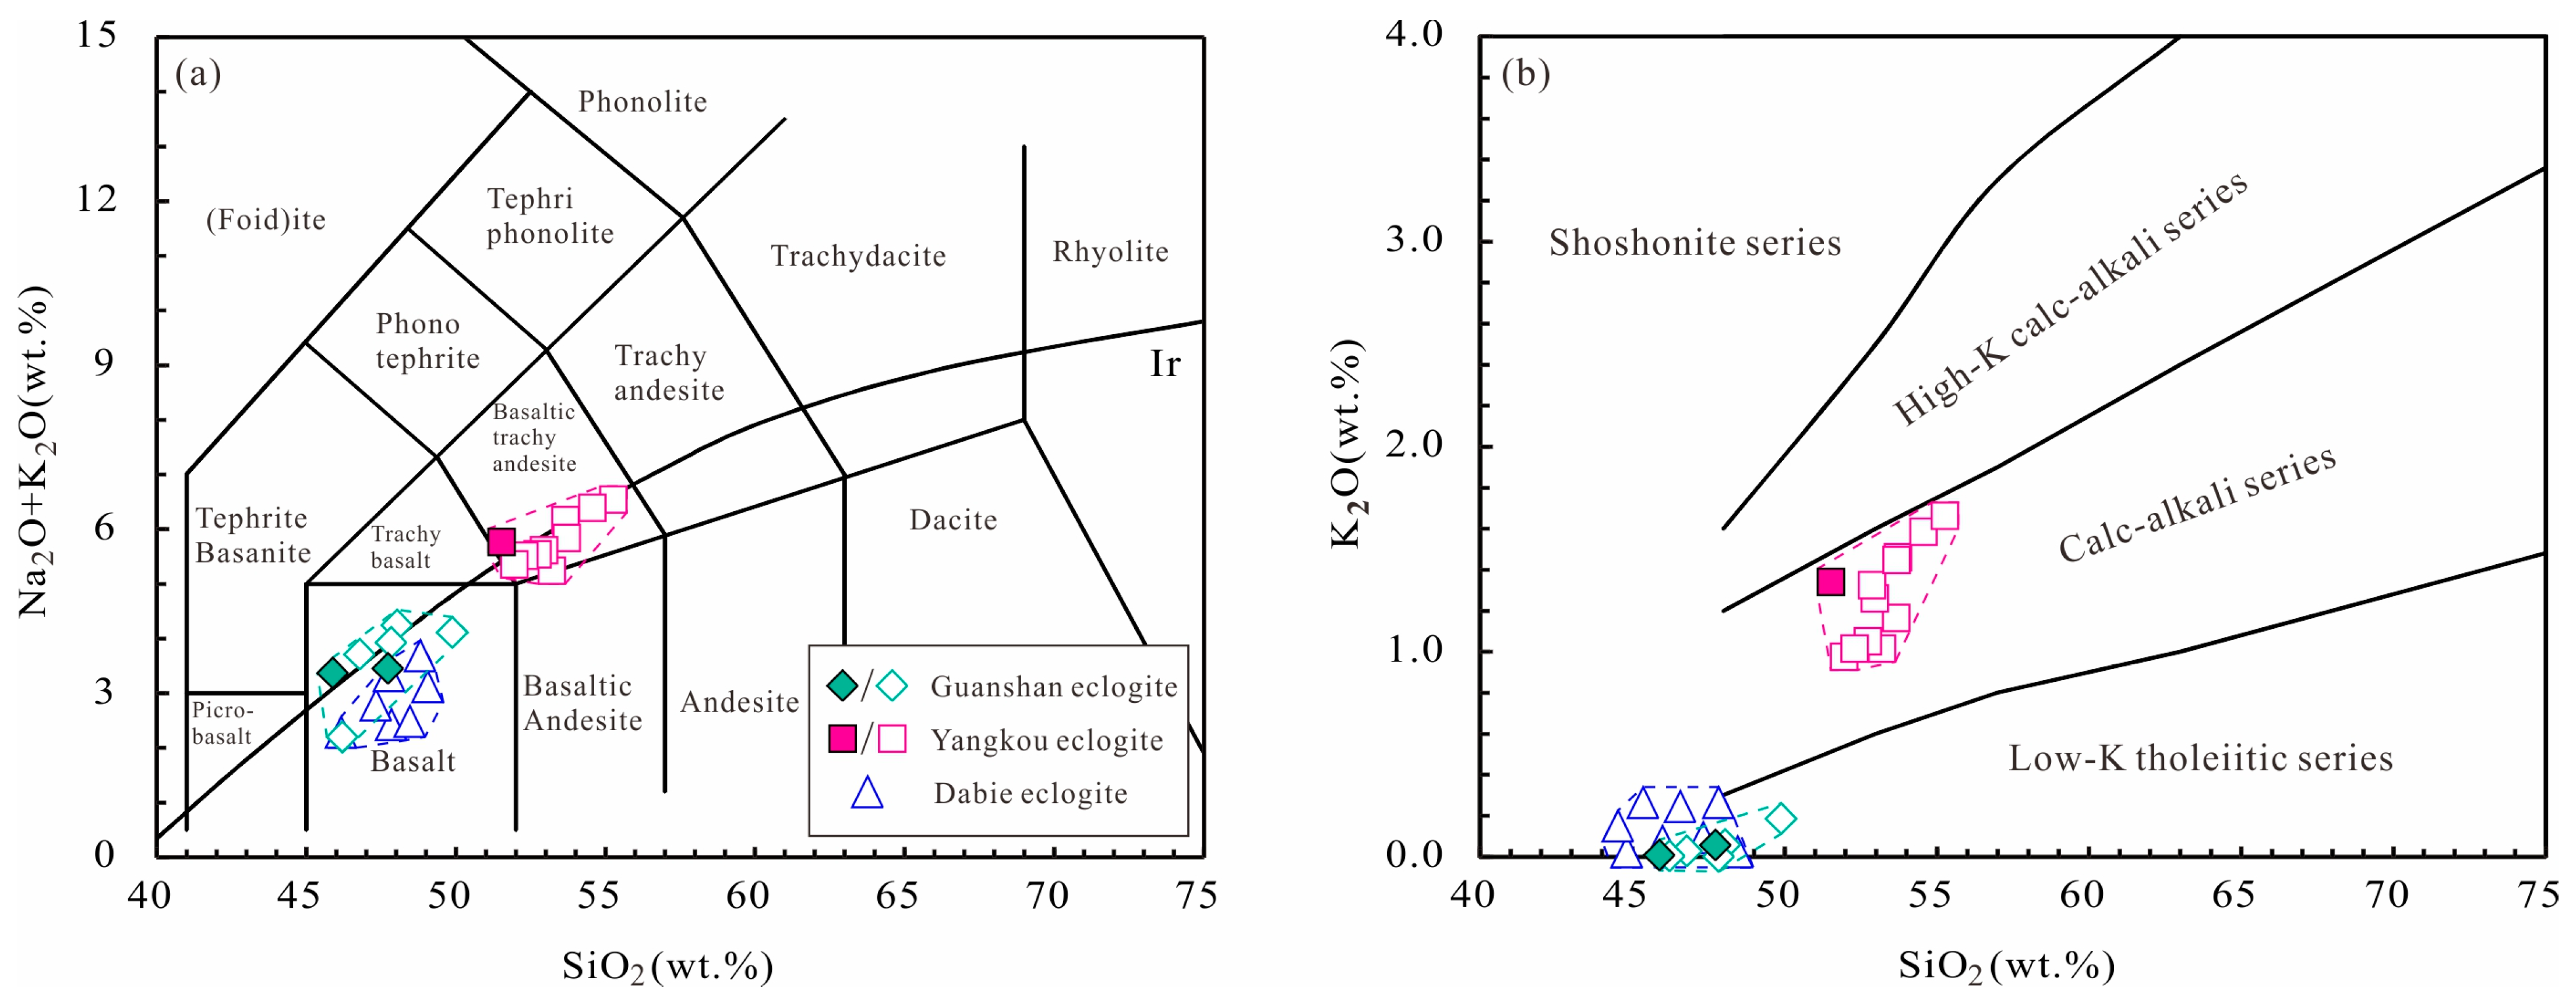
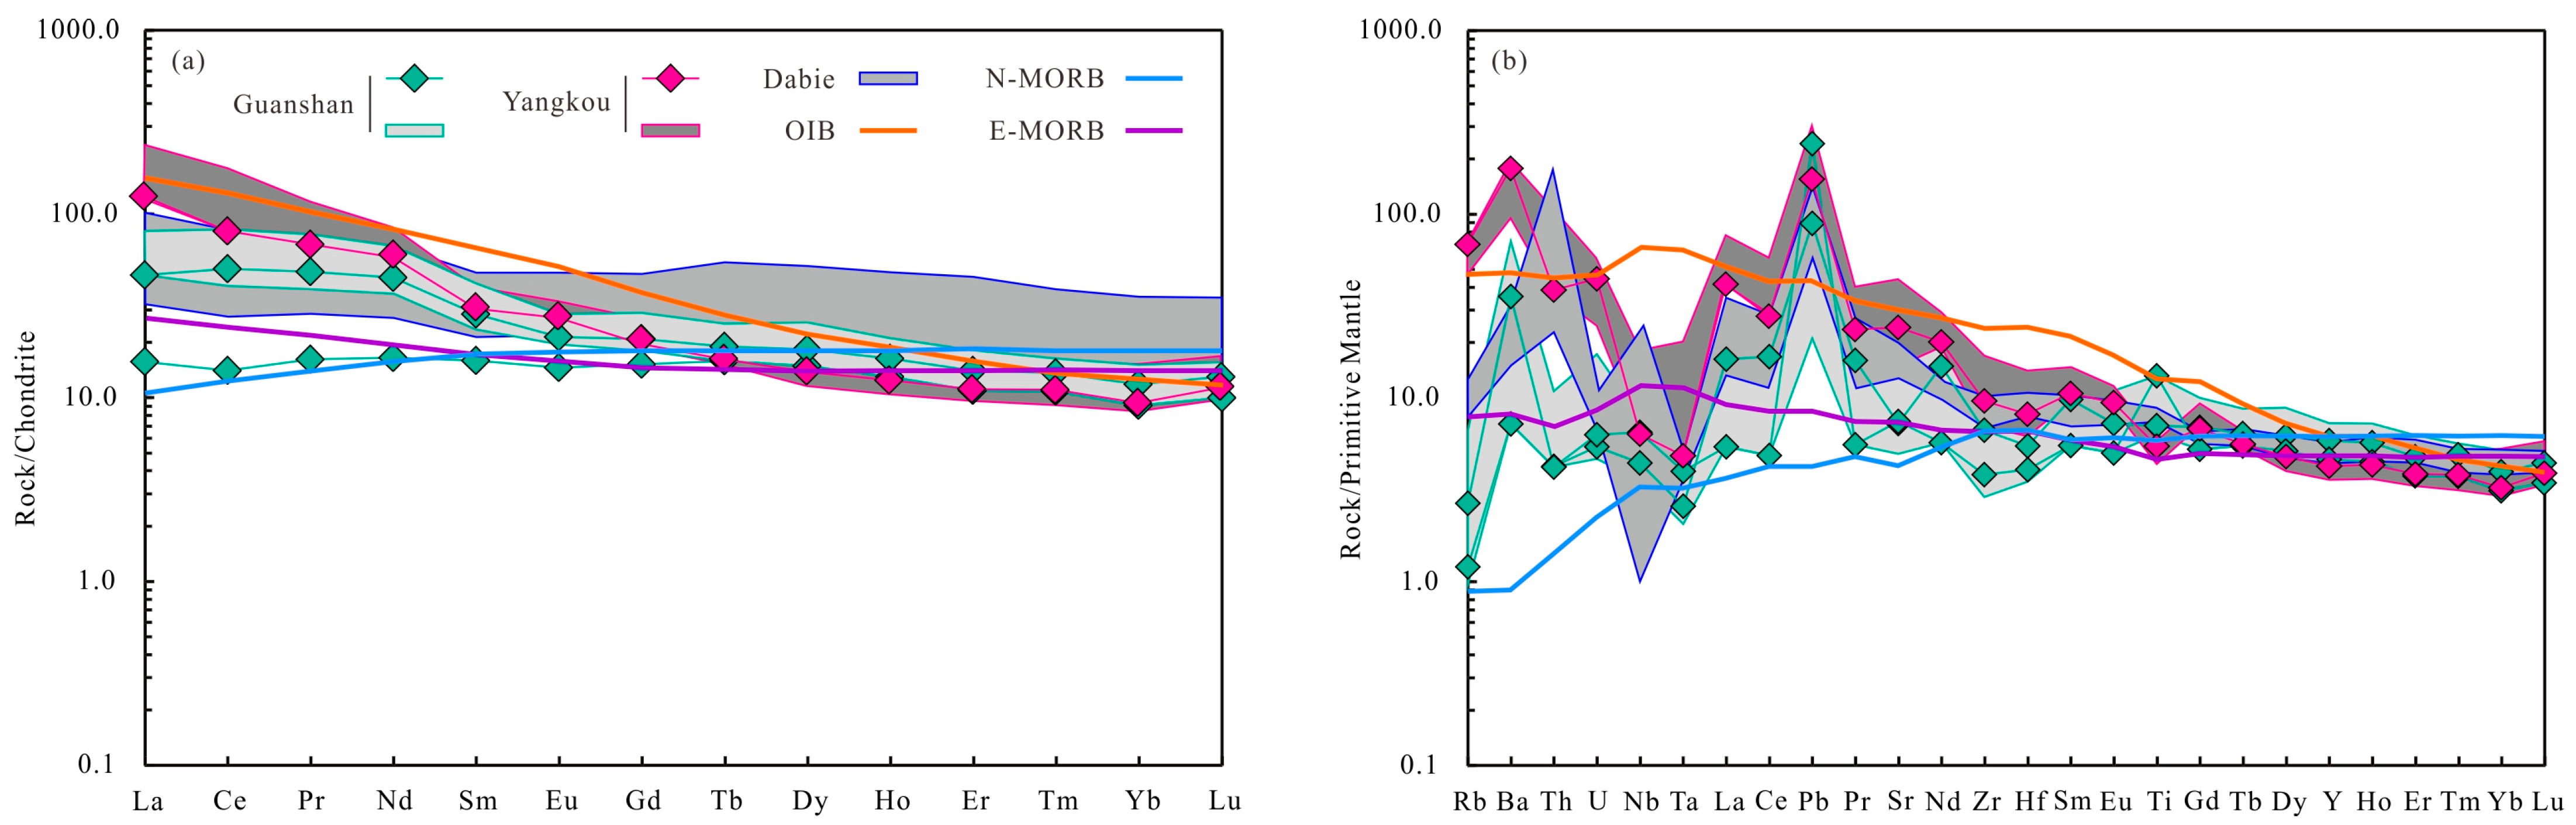
5.1. Bulk-Rock Compositions

Guanshan eclogites have higher CaO (10.2–10.5 wt.%) and Mg# [=MgO/(MgO + FeO) × 100 in mole; 0.44–0.54] than that of Yangkou eclogites (CaO = 7.49 wt.%; 0.46), whereas, they have lower SiO2 (45.9–47.7 wt.%), Al2O3 (13.3–15.5 wt.%) and K2O + Na2O (3.37–3.45 wt.%) than Yangkou eclogites with SiO2 of 51.5 wt.%, Al2O3 of 18.2 wt.% and K2O + Na2O of 5.76 wt.%, respectively (Table 1).
Guanshan eclogites plot in the field of basalt, while Yangkou eclogites plot in the field of basaltic trachy andesite in the SiO2 vs. (K2O + Na2O) diagram for the classification of volcanic rocks by Middlemost et al. [39] (Figure 3a). Guanshan eclogites plot in the “Low-K tholeiitic series” field, while Yangkou eclogites plot in the field of the “calc-alkali series” in the K2O vs. SiO2 diagram by Peccerillo and Taylor [40] (Figure 3b). Guanshan eclogites are similar in composition to the eclogites in Dabie (e.g., Hualiangting; [41,42]) (Figure 3a,b).
In the chondrite-normalized REE spider diagram, both Guanshan and Yangkou eclogites are enriched in light rare earth elements (LREEs), with (La/Yb)N ratios of 12.9 and 1.73–4.09, respectively (Figure 4a; Table S1). Overall, they show negatively sloped patterns with weak negative Eu anomalies (Eu/Eu* = 0.88–0.93) in Guanshan and weak positive Eu anomalies (Eu/Eu* = 1.11) in Yangkou. The total REE contents (∑REE = 37–86 ppm) of Guanshan eclogites are much lower than those of Yangkou eclogites (∑REE = 130 ppm). Both Guanshan and Yangkou eclogites are similar to the REE patterns of E-MORB and OIB, respectively (Figure 4a).
The patterns of trace elements in Yangkou and Guanshan are similar (Figure 4b). Overall, they show weak enrichment of large ion lithophile elements (LILEs) and depletion of high field strength elements (HFSEs), with obvious negative Nb, Ta, and Ti anomalies. The abundance of trace elements in Yangkou is higher than that in Guanshan. Dabie eclogites show certain similarities with Guanshan and Yangkou eclogites in patterns of REE and trace elements (Figure 4a,b).

5.2. Mineral Compositions
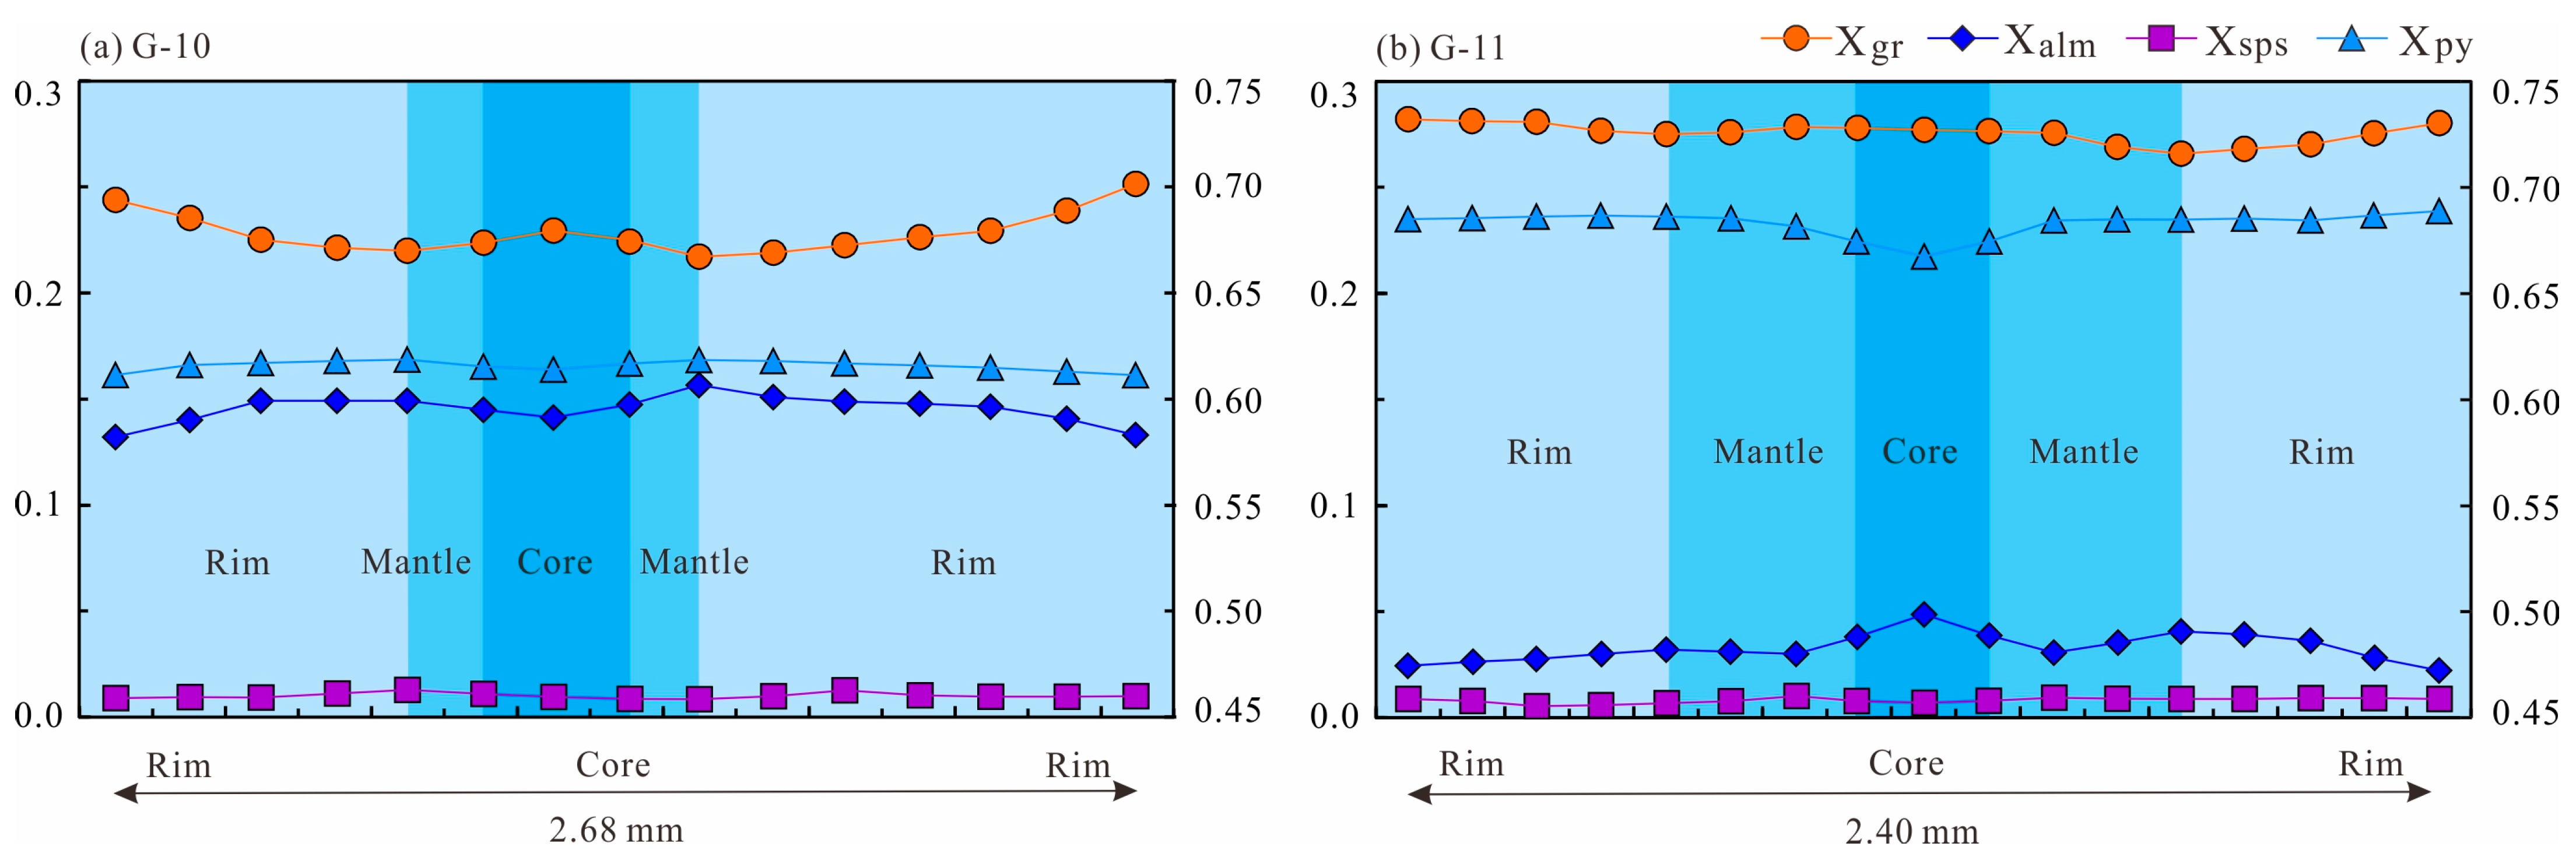
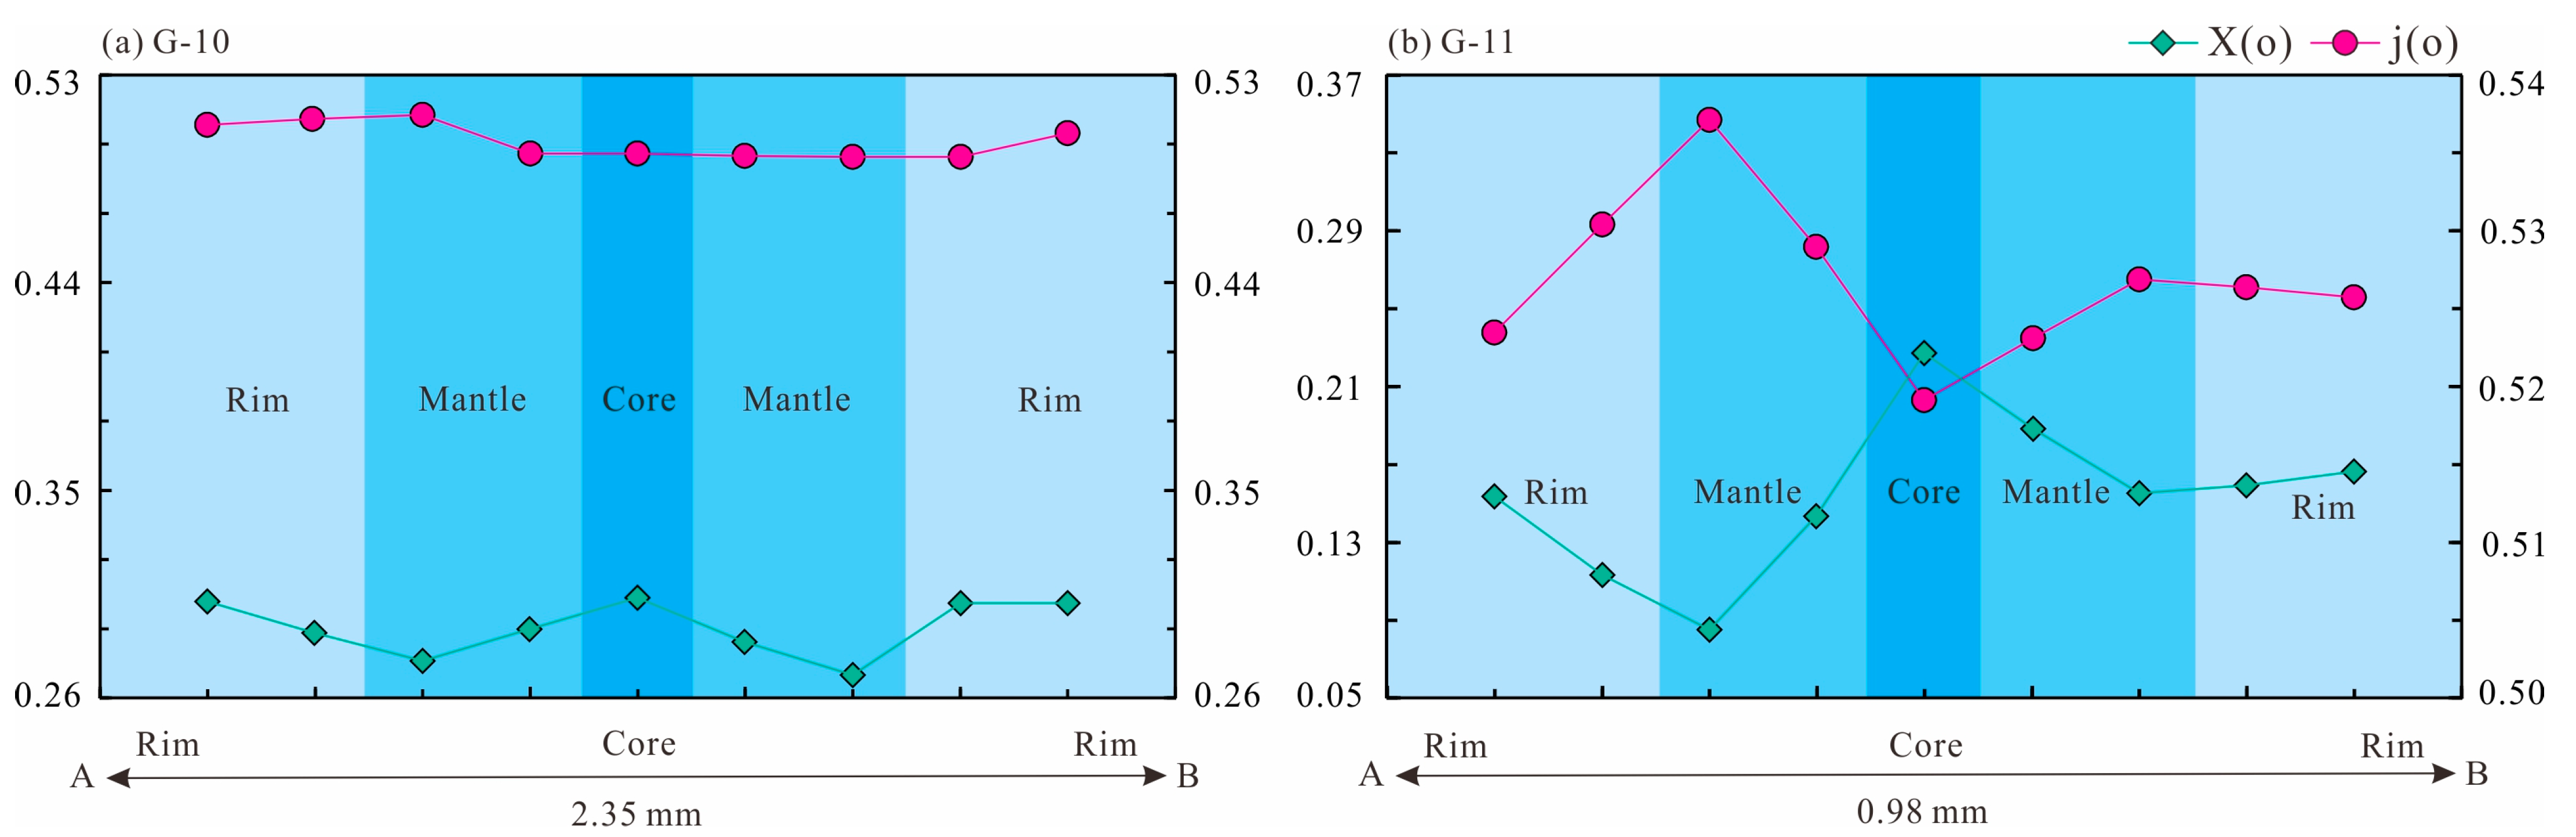
5.2.1. Garnet

Garnet is mainly composed of four end members: almandine (Alm), pyrope (Py), grossularite (Grs), and spessartite (Sps). Garnet in Guanshan eclogites shows a composition variation with Xalm (Fe2+/(Fe2+ +Mg + Ca + Mn)) from 0.48 to 0.61, Xgr (Ca/(Fe2+ +Mg + Ca + Mn)) from 0.22 to 0.28, and Xpy (Mg/(Fe2+ +Mg + Ca + Mn)) from 0.16 to 0.24 (Table 2). Compared with Guanshan eclogites, garnet in Yangkou eclogites shows low Xalm from 0.46 to 0.48, Xpy of 0.23, and high Xgr from 0.31 to 0.35 (Tables S2 and S3). In addition, all samples have very low Xsps (Mn/(Fe2+ +Mg + Ca + Mn)) value (about 0.01) (Table 2, Tables S2 and S3). Garnet in Guanshan and Yangkou display weak zonation with Xgr decreasing from the core to mantle and then increasing towards the rim, coupled with an increase in Xpy from the core to mantle and then decrease towards the rim (Figure 5; Table 2, Tables S2 and S3).

5.2.2. Omphacite

Omphacite in Guanshan eclogites shows lower X(o) [= Fe2+/(Fe2+ + Mg)] values of 0.27–0.30 and j(o) [= Na/(Na + Ca)] values of 0.49–0.51 than that in Yangkou eclogites, with X(o) values of 0.35–0.36 and j(o) values of 0.69–0.76, respectively (Table 2, Tables S2 and S3). Omphacite exhibits zoning in samples G-10 and G-11. From core, through mantle, to rim, X(o) decreases first, followed by an increase, while j(o) increases, followed by a slight decrease (Figure 6).
Table 1. Bulk-rock compositions (wt.%) of eclogites from the Guanshan and Yangkou area.
SampleAl2O3SiO2CaOK2OTFe2O3 aMgOMnONa2OP2O5TiO2LOI bTotal
XRF analyses (wt.%)
G-1013.3 45.9 10.2 0.01 17.2 5.80 0.21 3.36 0.25 2.84 1.22 100.4
G-1115.5 47.7 10.5 0.06 13.6 6.83 0.20 3.39 0.33 1.59 0.74 100.5
Y-3218.2 51.5 7.49 1.34 10.9 4.06 0.18 4.42 0.32 1.27 0.65 100.4
Normalized on the basis of mole per cent (mol%)
Sample Figures H2OAl2O3SiO2CaOK2OFeOMgONa2OTiO2O
G-10Figure 7a, P-Texcess8.50 49.7 11.4 0.01 14.0 9.36 3.52 2.31 0.96
Figure 7a, P-T (supra-solidus fields)58.50 49.7 11.4 0.01 14.0 9.36 3.52 2.31 0.96
Figure 7b, P-T c58.2950.211.70.0113.59.583.382.370.96
G-11Figure 8a, P-Texcess9.78 51.1 11.5 0.04 11.0 10.9 3.51 1.28 0.68
Figure 8a, P-T (supra-solidus fields)59.78 51.1 11.5 0.04 11.0 10.9 3.51 1.28 0.68
Figure 8b, P-T c510.151.212.00.0410.810.53.461.300.68
Figure S1a, P-X(CaO)excess9.78 51.1 0.00 0.04 11.0 10.9 15.0 1.28 0.68
9.78 51.1 15.0 0.04 11.0 10.9 0.00 1.28 0.68
Figure S1b, T-X(MgO)excess9.78 51.1 11.5 0.04 21.9 0.00 3.51 1.28 0.68
9.78 51.1 11.5 0.04 0.00 21.9 3.51 1.28 0.68
Y-32Figure 9a, P-Texcess11.8 56.5 8.30 0.94 9.00 6.63 4.70 1.04 0.95
Figure 9a, P-T (supra-solidus fields)711.8 56.5 8.30 0.94 9.00 6.63 4.70 1.04 0.95
Figure 9b, P-T c711.358.88.010.968.946.384.511.070.95
Figure S2a, P-X(CaO)excess11.8 56.5 0.00 0.94 9.00 6.63 13.0 1.04 0.95
11.8 56.5 13.0 0.94 9.00 6.63 0.00 1.04 0.95
Figure S2b, T-X(MgO)excess11.8 56.5 8.30 0.94 15.6 0.00 4.70 1.04 0.95
11.8 56.5 8.30 0.94 0.00 15.6 4.70 1.04 0.95
Note: a LOI, loss on ignition. b TFe2O3 represents total iron. Sample G-10 and G-11 are from the Guanshan and Y-32 is from the Yangkou area. c Effective bulk-rock compositions.
Figure 7. (a) P-T pseudosection for sample G-10 calculated with the bulk-rock composition. (b) P-T pseudosection for sample G-10 calculated with an effective bulk composition generated according to mass-balance constraints from garnet rim and other relevant minerals. The pseudosection is contoured with isopleths of Xgr (i.e., gr25 is Xgr = 0.25 in Grt) and Xpy (i.e., py17 is Xpy = 0.17 in Grt) of garnet and Si contents in phengite (i.e., Si3.44 is Si = 3.44 p.f.u. in Phg). The location of the boundary between omphacite and diopside is defined on the basis of j(o) = 0.30 [45]. The mineral abbreviations are as follows: Lws = lawsonite; Di = diopside; LL = melt; “-Qtz/Coe”, denotes quartz/coesite -absent assemblages. The compositions used for modelling are listed in Table 1. Other details are the same as Figure 2.
Minerals 13 00362 g007
Figure 8. (a) P-T pseudosection for sample G-11 calculated with the bulk-rock composition. (b) P-T pseudosection for sample G-11 calculated with an effective bulk composition generated according to mass balance constraints from garnet rim and other relevant minerals. The compositions used for modelling are listed in Table 1. Other details are the same as Figure 7.
Minerals 13 00362 g008
Figure 9. (a) P-T pseudosection for sample Y-32 calculated with the bulk-rock composition. (b) P-T pseudosection for sample Y-32 calculated with an effective bulk composition generated according to mass balance constraints from garnet rim and other relevant minerals. The compositions used for modelling are listed in Table 1. The pseudosection is contoured with isopleths of j(o) (i.e., j(o)35 is j(o) = 0.35 in Omp). Other details are the same as in Figure 7.
Minerals 13 00362 g009

5.2.3. Phengite

Phengite in sample G-10 has Si = 3.44–3.49 p.f.u. and Mg/(Mg + Fe2+) = 0.80–0.84, higher than that in Yangkou eclogites with Si of 3.36–3.40 p.f.u. and Mg/(Mg + Fe2+) of 0.76–0.77, respectively (Table 2, Tables S2 and S3). In addition, Si shows a decrease from the core, through the mantle, towards the rim in G-10. Phengite inclusions in garnet show higher Si (=3.51) than those in the matrix in G-11 (Figure 2e).

5.2.4. Accessory Minerals

Amphibole in Guanshan eclogites contains lower Si of 7.21 p.f.u. and Mg/(Mg + Fe2+) of 0.59 than that in Yangkou eclogites with Si of 7.70–8.05 and Mg/(Mg + Fe2+) of 0.62–0.66, respectively (Table 2, Tables S2 and S3). The pistacite (Ps) (= Fe3+/(Fe3+ + AlVI)) contents for epidote in Guanshan eclogites are 0.28–0.32, similar to that in Yangkou eclogites with Ps of 0.31. Plagioclase in Yangkou eclogites shows XAn (= Ca/(Ca + Na + K)) values of 0.03–0.08 and Xor (= K/(Ca + Na + K)) values of 0.01, respectively (Table 2, Tables S2 and S3).
Table 2. Representative microprobe analyses for sample G-10 from the Guanshan eclogites.
MineralGrtOmpPhgAmpEp
RimRimMidCoreMidMidRimRimRimMidCoreMidRimRimMidCoreRimGrainGrainGrainGrain
SiO238.1 38.2 38.3 38.2 37.7 38.1 38.0 37.5 55.2 54.7 54.6 54.5 55.5 51.2 51.0 51.8 50.5 48.0 37.1 37.1 37.1
TiO20.12 0.00 0.07 0.07 0.06 0.12 0.06 0.10 0.13 0.11 0.17 0.07 0.08 0.53 0.44 0.52 0.42 0.22 0.11 0.13 0.16
Al2O320.7 20.9 20.8 20.8 20.8 20.7 20.8 20.2 8.18 8.09 7.91 7.50 7.88 24.0 23.2 22.9 24.2 6.8 20.8 21.6 22.1
Cr2O30.01 0.01 0.04 0.01 0.01 0.00 0.02 0.00 0.02 0.02 0.02 0.00 0.00 0.00 0.00 0.04 0.00 0.03 0.00 0.03 0.08
FeO0.12 0.00 0.00 0.00 0.00 0.00 0.00 0.20 3.35 3.99 3.26 4.67 3.22 0.00 0.00 0.00 0.00 2.10 15.4 14.1 13.6
Fe2O326.4 26.5 26.8 26.4 26.7 26.3 26.9 26.1 5.49 5.01 5.67 4.82 5.60 1.90 1.90 1.65 1.74 14.3 0.14 0.13 0.12
MnO0.45 0.41 0.57 0.43 0.36 0.54 0.43 0.38 0.03 0.00 0.00 0.03 0.05 0.00 0.03 0.00 0.05 0.16 0.09 0.18 0.27
MgO4.13 4.15 4.23 4.24 4.16 4.11 4.18 4.02 7.16 7.38 7.30 7.39 7.29 4.19 4.34 4.86 4.20 11.5 0.05 0.04 0.05
CaO8.65 7.77 7.68 8.00 7.45 7.64 8.08 8.75 12.2 11.9 12.2 12.5 12.2 0.10 0.08 0.02 0.07 10.6 22.4 21.6 22.0
Na2O0.07 0.06 0.04 0.05 0.06 0.05 0.02 0.01 6.95 6.91 6.65 6.74 6.90 0.33 0.48 0.16 0.43 1.87 0.01 0.01 0.00
K2O0.02 0.00 0.00 0.01 0.02 0.00 0.00 0.00 0.00 0.03 0.08 0.00 0.03 14.4 14.2 15.1 13.9 0.07 0.03 0.04 0.00
Totals98.9 98.0 98.5 98.2 97.2 97.6 98.4 97.2 98.3 97.8 97.6 97.8 98.4 96.6 95.6 97.1 95.5 95.4 96.1 95.0 95.5
Cations
Si3.03 3.05 3.04 3.04 3.03 3.05 3.03 3.03 2.02 2.01 2.02 2.01 2.03 3.46 3.48 3.49 3.44 7.21 3.03 3.05 3.04
Ti0.01 0.00 0.00 0.00 0.00 0.01 0.00 0.01 0.00 0.00 0.01 0.00 0.00 0.03 0.02 0.03 0.02 0.02 0.01 0.01 0.01
Al1.94 1.97 1.95 1.95 1.97 1.96 1.95 1.92 0.35 0.35 0.34 0.33 0.34 1.91 1.87 1.82 1.95 1.20 2.01 2.10 2.13
Cr0.00 0.00 0.00 0.00 0.00 0.00 0.00 0.00 0.00 0.00 0.00 0.00 0.00 0.00 0.00 0.00 0.00 0.00 0.00 0.00 0.01
Fe3+0.01 0.00 0.00 0.00 0.00 0.00 0.00 0.01 0.09 0.11 0.09 0.13 0.09 0.00 0.00 0.00 0.00 0.24 0.95 0.87 0.84
Fe2+1.75 1.77 1.78 1.76 1.80 1.76 1.80 1.76 0.17 0.15 0.18 0.15 0.17 0.11 0.11 0.09 0.10 1.79 0.01 0.01 0.01
Mn0.03 0.03 0.04 0.03 0.03 0.04 0.03 0.03 0.00 0.00 0.00 0.00 0.00 0.00 0.00 0.00 0.00 0.02 0.01 0.01 0.02
Mg0.49 0.49 0.50 0.50 0.50 0.49 0.50 0.48 0.39 0.40 0.40 0.41 0.40 0.42 0.44 0.49 0.43 2.58 0.01 0.01 0.01
Ca0.74 0.66 0.65 0.68 0.64 0.66 0.69 0.76 0.48 0.47 0.48 0.49 0.48 0.01 0.01 0.00 0.01 1.70 1.96 1.90 1.92
Na0.01 0.01 0.01 0.01 0.01 0.01 0.00 0.00 0.49 0.49 0.48 0.48 0.49 0.04 0.06 0.02 0.06 0.55 0.00 0.00 0.00
K0.00 0.00 0.00 0.00 0.00 0.00 0.00 0.00 0.00 0.00 0.00 0.00 0.00 1.24 1.23 1.30 1.21 0.01 0.00 0.00 0.00
X (phase)0.16 0.17 0.17 0.17 0.17 0.17 0.16 0.16 0.30 0.28 0.30 0.27 0.30 0.80 0.80 0.84 0.81 0.59
Y (phase)0.24 0.22 0.22 0.23 0.22 0.22 0.23 0.25 0.51 0.51 0.50 0.49 0.50 0.32 0.29 0.28
Note: X(g) = Xpy = Mg⁄(Mn + Fe2+ + Ca + Mg), Y(g) = Xgr = Ca/(Mn + Fe2+ + Ca + Mg), X(o) = Fe2+⁄(Mg + Fe2+), Y(o) = j(o) = Na⁄(Ca + Na), X(Phg, Amp) = Mg/(Mg + Fe2+), Y(ep) = Fe3+⁄(AlVI + Fe3+). The mineral formulae were calculated -by the program AX.

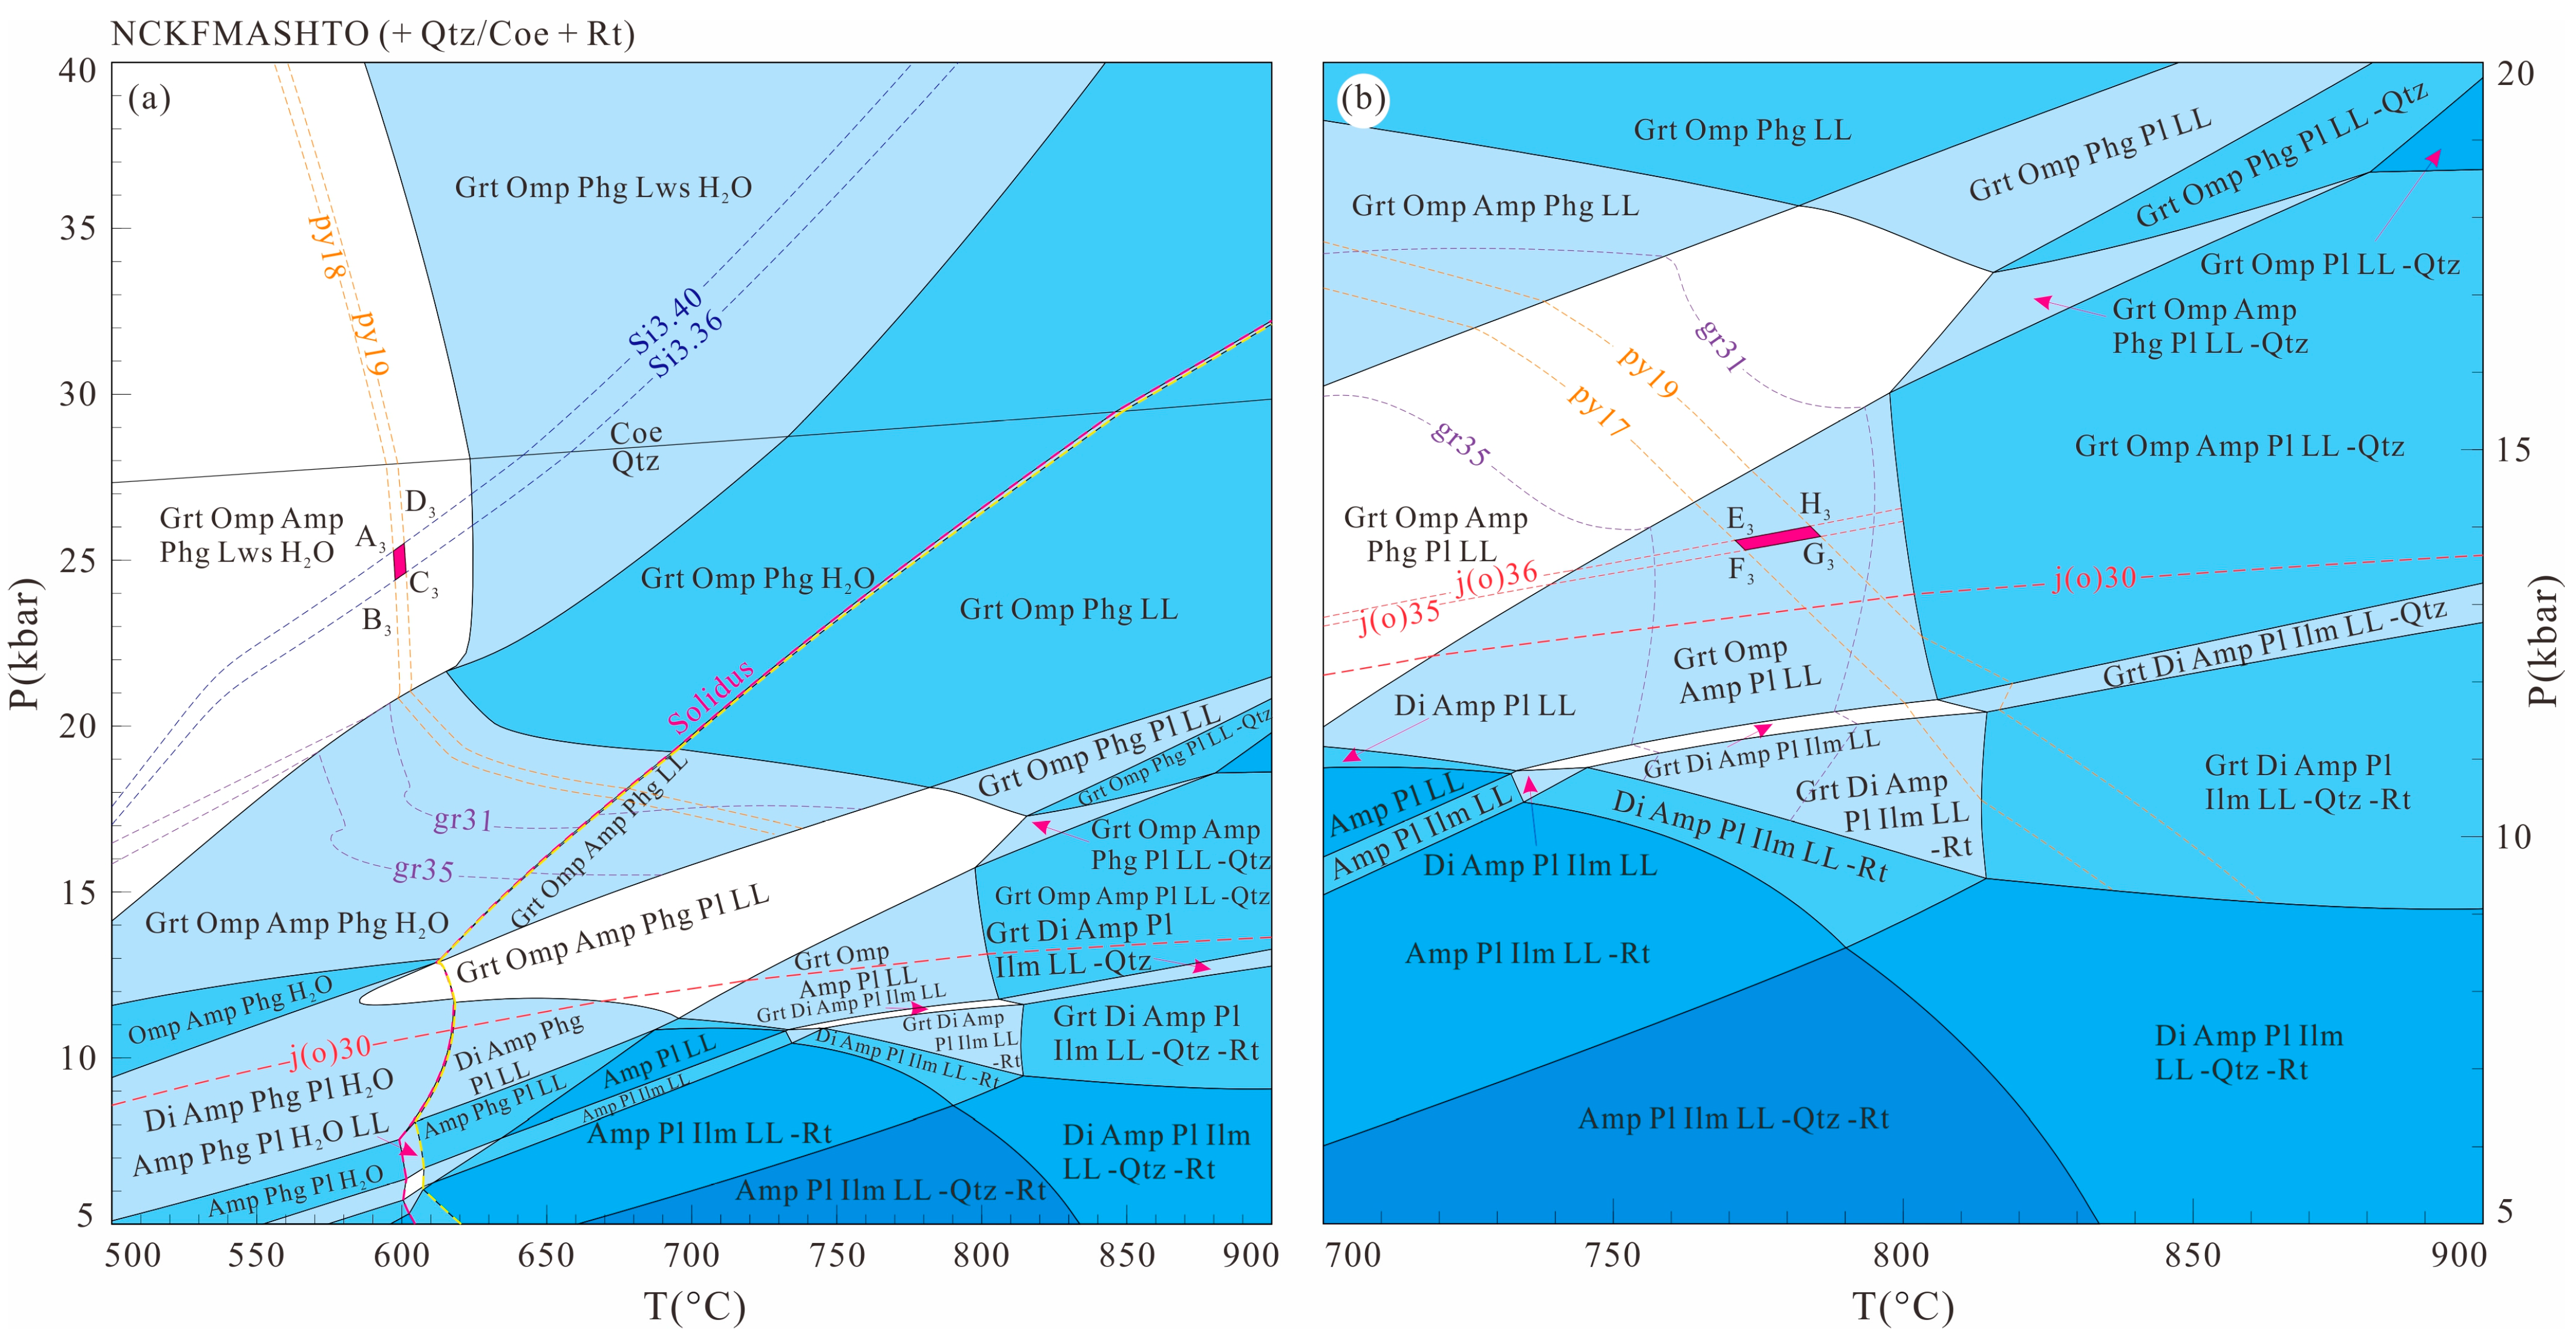
6. Phase Equilibrium Modelling

We performed pseudosection modelling in the system (Na2O-CaO-K2O-FeO-MgO-Al2O3-SiO2-H2O-TiO2-Fe2O3 (NCKFMASHTO) using THERMOCALC version 3.45) based on Powell et al. [46] (updated 2016) with the internally consistent thermodynamic dataset of Holland and Powell [47] update (ds62). The set of activity–composition models includes: metabasite melt [48], garnet [49], clinopyroxene [50], amphibole [48,50], phengite [49], talc [51], plagioclase [52], and ilmenite [53]. Quartz/coesite, rutile, lawsonite, and aqueous fluid (H2O) are assumed to be pure endmember phases.
Bulk-rock compositions used for modelling are calculated by modifying the whole-rock XRF analysis with the weight percentage for each oxide (Table 1). All P2O5 was removed, and the total CaO was proportionally adjusted to account for the chemical contribution of apatite. Mn content was not included as a component due to its very low concentration (0.18–0.21 wt.%) and the fact that it mainly occurs as spessartine within garnets. The O content is determined according to mass balance constraints by adding up the Fe3+ content in each mineral calculated from charge balance. As fractional crystallization processes, including cumulate, can appreciably affect the MgO and CaO content of portions of the crust, the effects of varying MgO and CaO content also needs to be evaluated for the chosen rock composition [54,55,56]. An overall uncertainty of ± 50 °C and ± 1 kbar (2σ) is generally accepted for isopleth thermobarometry in pseudosections [57].

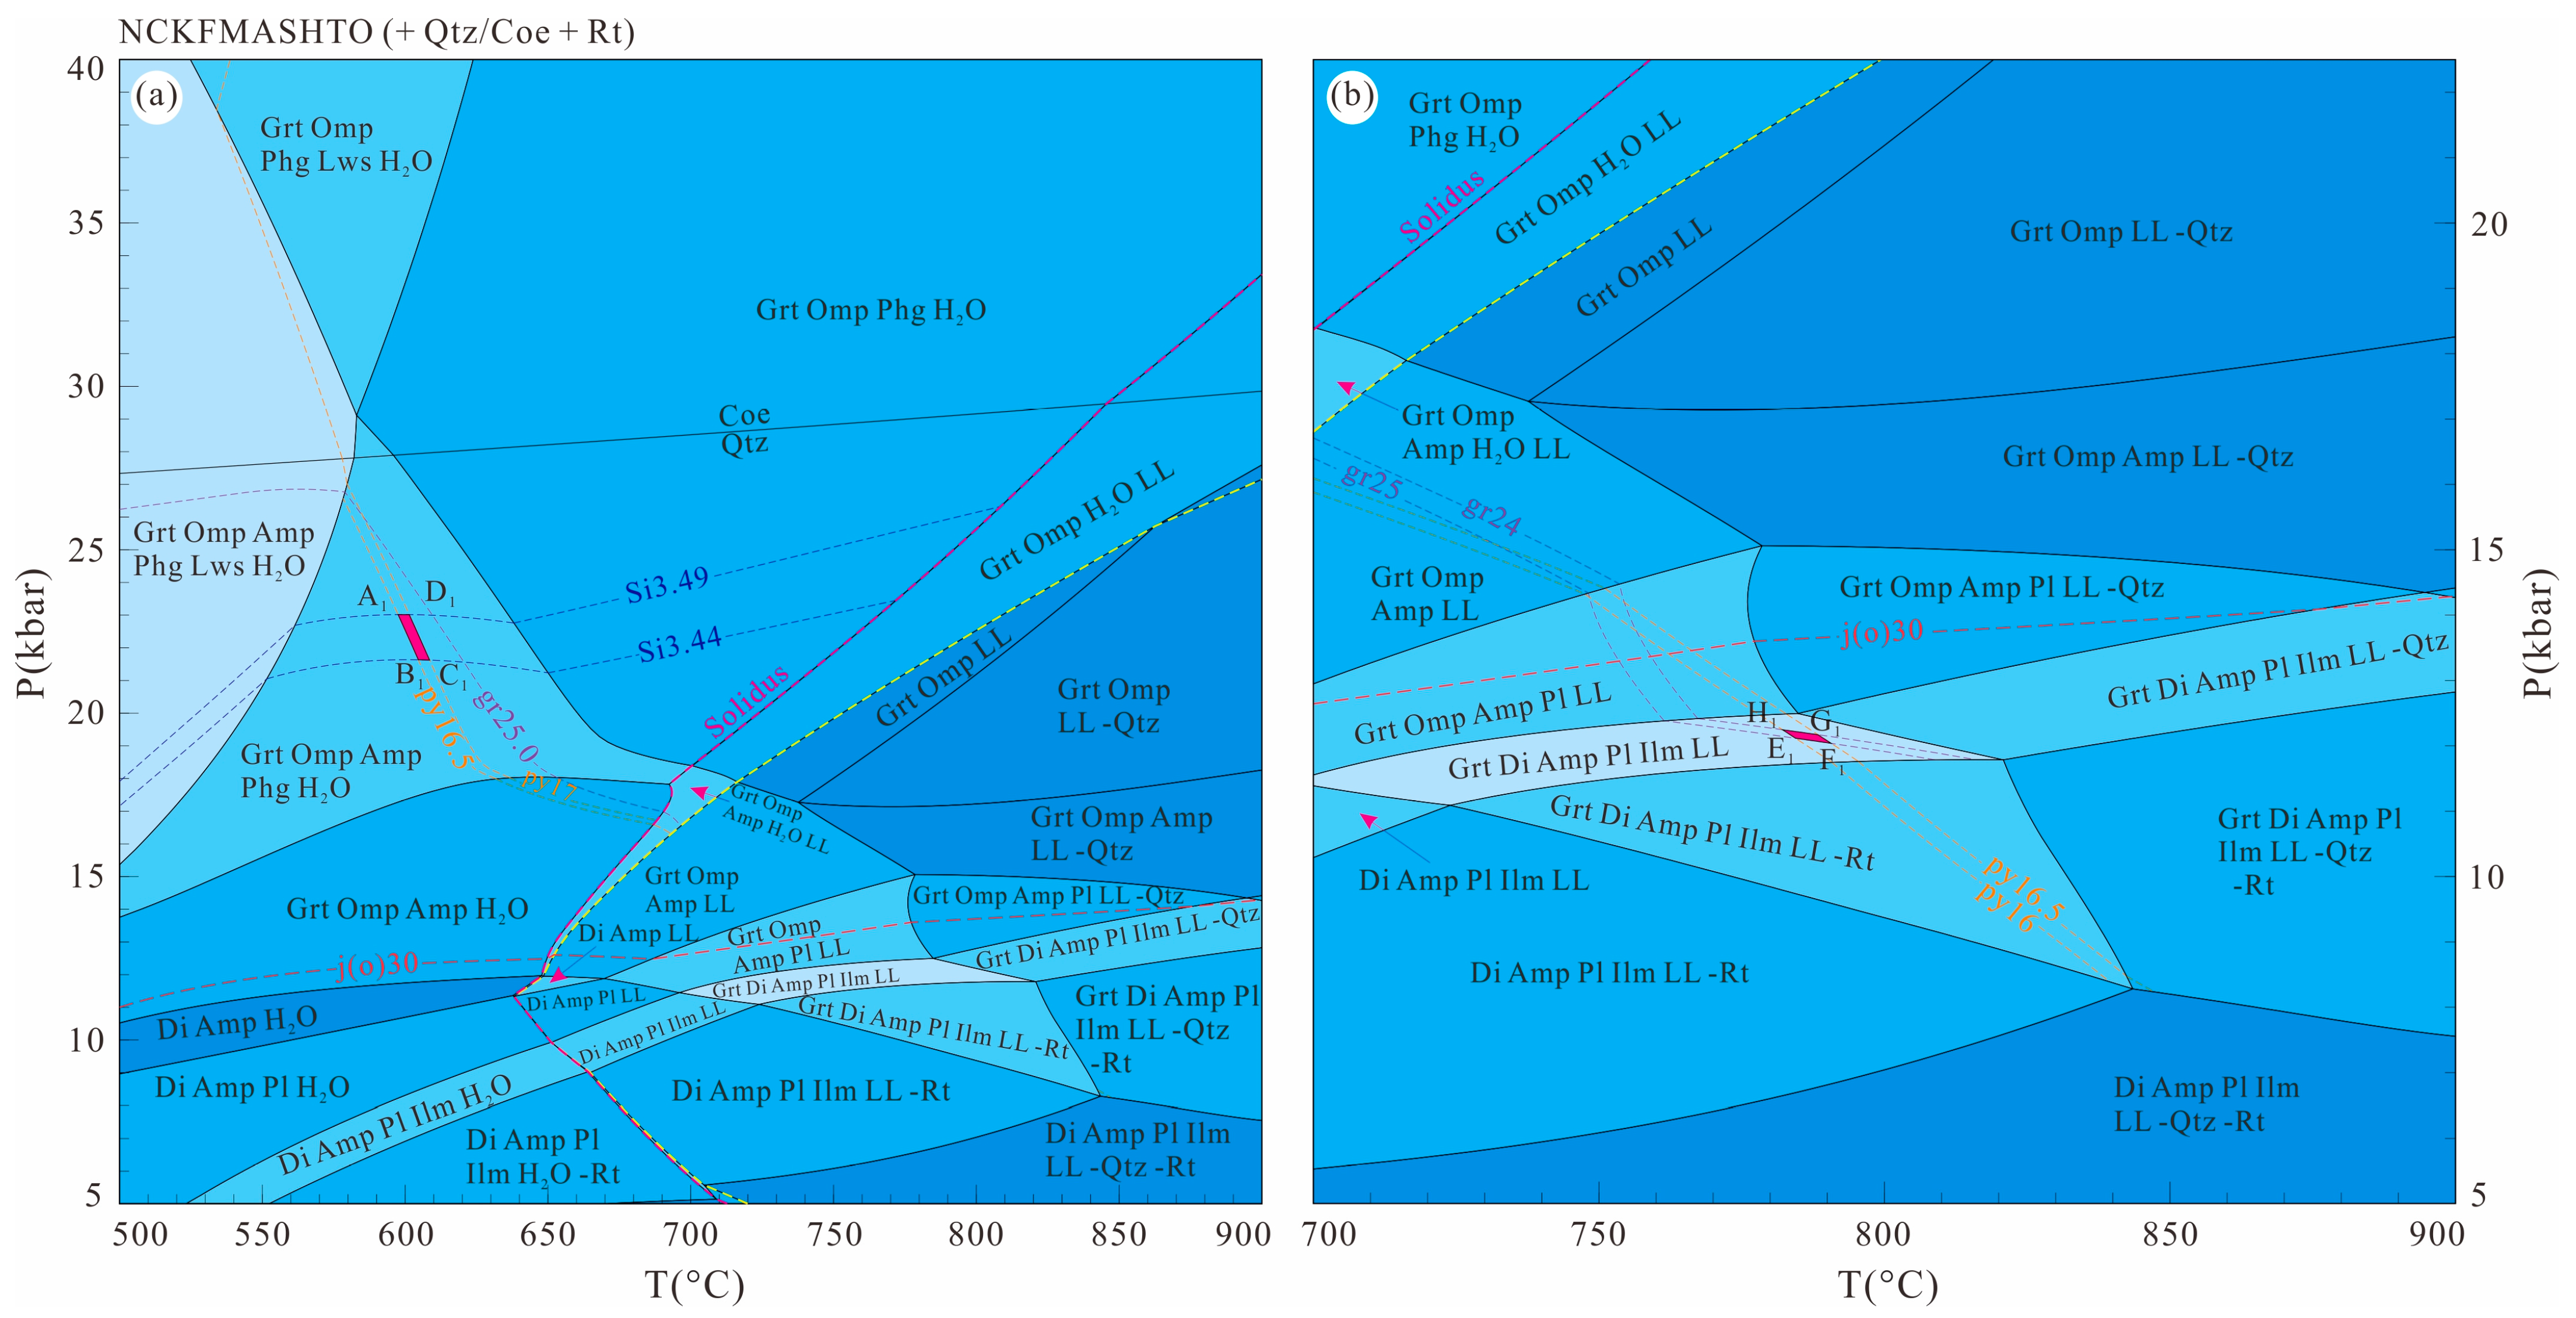
6.1. Pseudosections for the Guanshan Eclogites

The P-T pseudosection calculated for samples G-10 and G-11 is presented in Figure 7 and Figure 8, respectively. It is contoured with isopleths of Xgr and Xpy in garnet and Si content in phengite.
In Figure 7a, the Xgr isopleths show moderate slopes in the stability field of the assemblage Grt + Omp + Amp + Phg + H2O (+ Qtz + Rt) with the rise of temperature associated by an increase in Xgr, while the Si isopleths show flat slopes with the increase in pressure associated with an increase in Si. This indicates that Si isopleth could be considered a good barometer.
Field A1-B1-C1-D1 is constrained at P = 22–23 kbar and T = 600–610 °C in the penta-variant field of the assemblage Grt + Omp + Amp + Phg + H2O (+ Qtz + Rt) by the contours of Xpy (0.165–0.17) from core to mantle in garnet and Si content (3.44–3.49) in phengite (Table 2), representing a temperature-pressure condition of the prograde stage (Figure 7a). Since the garnet grain in our sample has a well-defined zonation, we calculated an effective bulk composition for modelling the retrograde conditions. The effective bulk-rock composition was generated following mass balance by integrating the mineral compositions of microprobe analyses and the modal abundance of the phases present, and the calculated P-T pseudosection using the effective bulk composition is presented in Figure 7b. In the assemblage field Grt + Di + Amp + Pl + Ilm +LL (+ Qtz + Rt), Xpy and Xgr contours have moderate and flat slopes, respectively, with Xgr decreasing as pressure rises. Based on the isopleths for Xgr (0.24–0.25) from mantle to rim and Xpy (0.16–0.165) from mantle to rim in garnet (Table 2), field E1-F1-G1-H1 in the assemblage Grt + Di + Amp + Pl + Ilm +LL (+ Qtz + Rt) is constrained at 12 kbar and 780–790 °C, which represents a process of decompression (Figure 7b; Table 3).
The P-T pseudosection of sample G-11 is dominated by penta- and hexa-variant fields (Figure 8a). In the stability field of assemblages such as Grt + Omp + Amp + Phg + Lws + H2O (+ Qtz + Rt) and Grt + Omp + Amp + Phg + Tlc + Lws + H2O (+ Qtz/Coe + Rt), etc. of low-T/high-P conditions, Xgr contours have flat slopes with the rise of pressure associated by decrease in Xgr; Xpy contours have steeply negative slopes with the increase in temperature associated by increase in Xpy (a good temperature indicator) (Figure 8a). In the assemblages such as Grt + Omp + Amp + Phg + H2O (+ Qtz + Rt) and Grt + Omp + Amp + LL (+ Qtz + Rt) etc. of lower pressure conditions, Xgr and Xpy isopleths show similar and moderately negative slopes, with Xgr decreasing and Xpy increasing as pressure rises (Figure 8a). In the stability field of assemblage Grt + Omp + Phg + Lws + H2O (+ Coe + Rt), Xgr contours show steep slopes with the rise in temperature associated with increases. The Si contents in phengite in most assemblages increase as pressure rises (Figure 8a).
Based on the contours of Xpy (0.22–0.24) and Xgr (0.27–0.28) from core to mantle in garnet (Table 2), field A2-B2-C2-D2 is constrained at P = 25–26 kbar and T = 605–615 °C in the field of the assemblage Grt + Omp + Amp + Phg + Lws + H2O (+ Qtz + Rt) (Figure 8a; Table 3). According to Xgr decreasing and the Xpy content increasing from the core to the mantle, it is possible that the P-T conditions represent the prograde stage. The contours of the maximum Si content measured (= 3.51) in phengite inclusions in garnet (Figure 2e) and the minimum Xgr (= 0.27) of garnet mantle (Table 2) constrain the peak condition point (R’) at P = 33 kbar and T = 685 °C in the penta-variant field of the assemblage Grt + Omp + Phg + Lws + H2O (+Coe + Rt). We calculated an effective bulk composition for modelling the retrograde conditions, and the calculated P-T pseudosection using the effective bulk composition is presented in Figure 8b. Field E2-F2-G2-H2 is constrained at P = 14–15 kbar and T = 805–820 °C in the penta-variant field of the assemblage Grt + Omp/Di + Amp + Pl + LL (+Qtz + Rt) by the contours of Xpy (0.23–0.24) and Xgr (0.27–0.28) from mantle to rim in garnet (Table 2). Based on Xgr increasing from the mantle to rim, it is possible that the P-T conditions represent a process of decompression.
The P–X(CaO) = [CaO/(CaO + Na2O) in mol.%] pseudosection illustrates the dependence of phase equilibria on pressure with respect to bulk-rock X(CaO) at a fixed 685 °C (Figure S1a). Increasing X(CaO) extends the stability of phengite-bearing assemblages at lower pressures (Figure S1a). The T–X(MgO) = [MgO/(MgO + FeO) in mol.%] at a fixed 33 kbar (Figure S1b) are constructed to illustrate the dependence of phase equilibria on temperature with respect to bulk-rock X(MgO). It shows that increasing X(MgO) extends their stability to higher pressures (Figure S1b).
In the assemblage Grt-Omp-Phg-Lws (+ Coe + Rt + H2O), the Si contents in phengite are slightly affected by the bulk X(CaO) and X(MgO), and the Xgr isopleths are more dependent on temperature than bulk X(MgO). It indicates that the P-T condition of R’ in Figure 8a is reasonable and reliable.

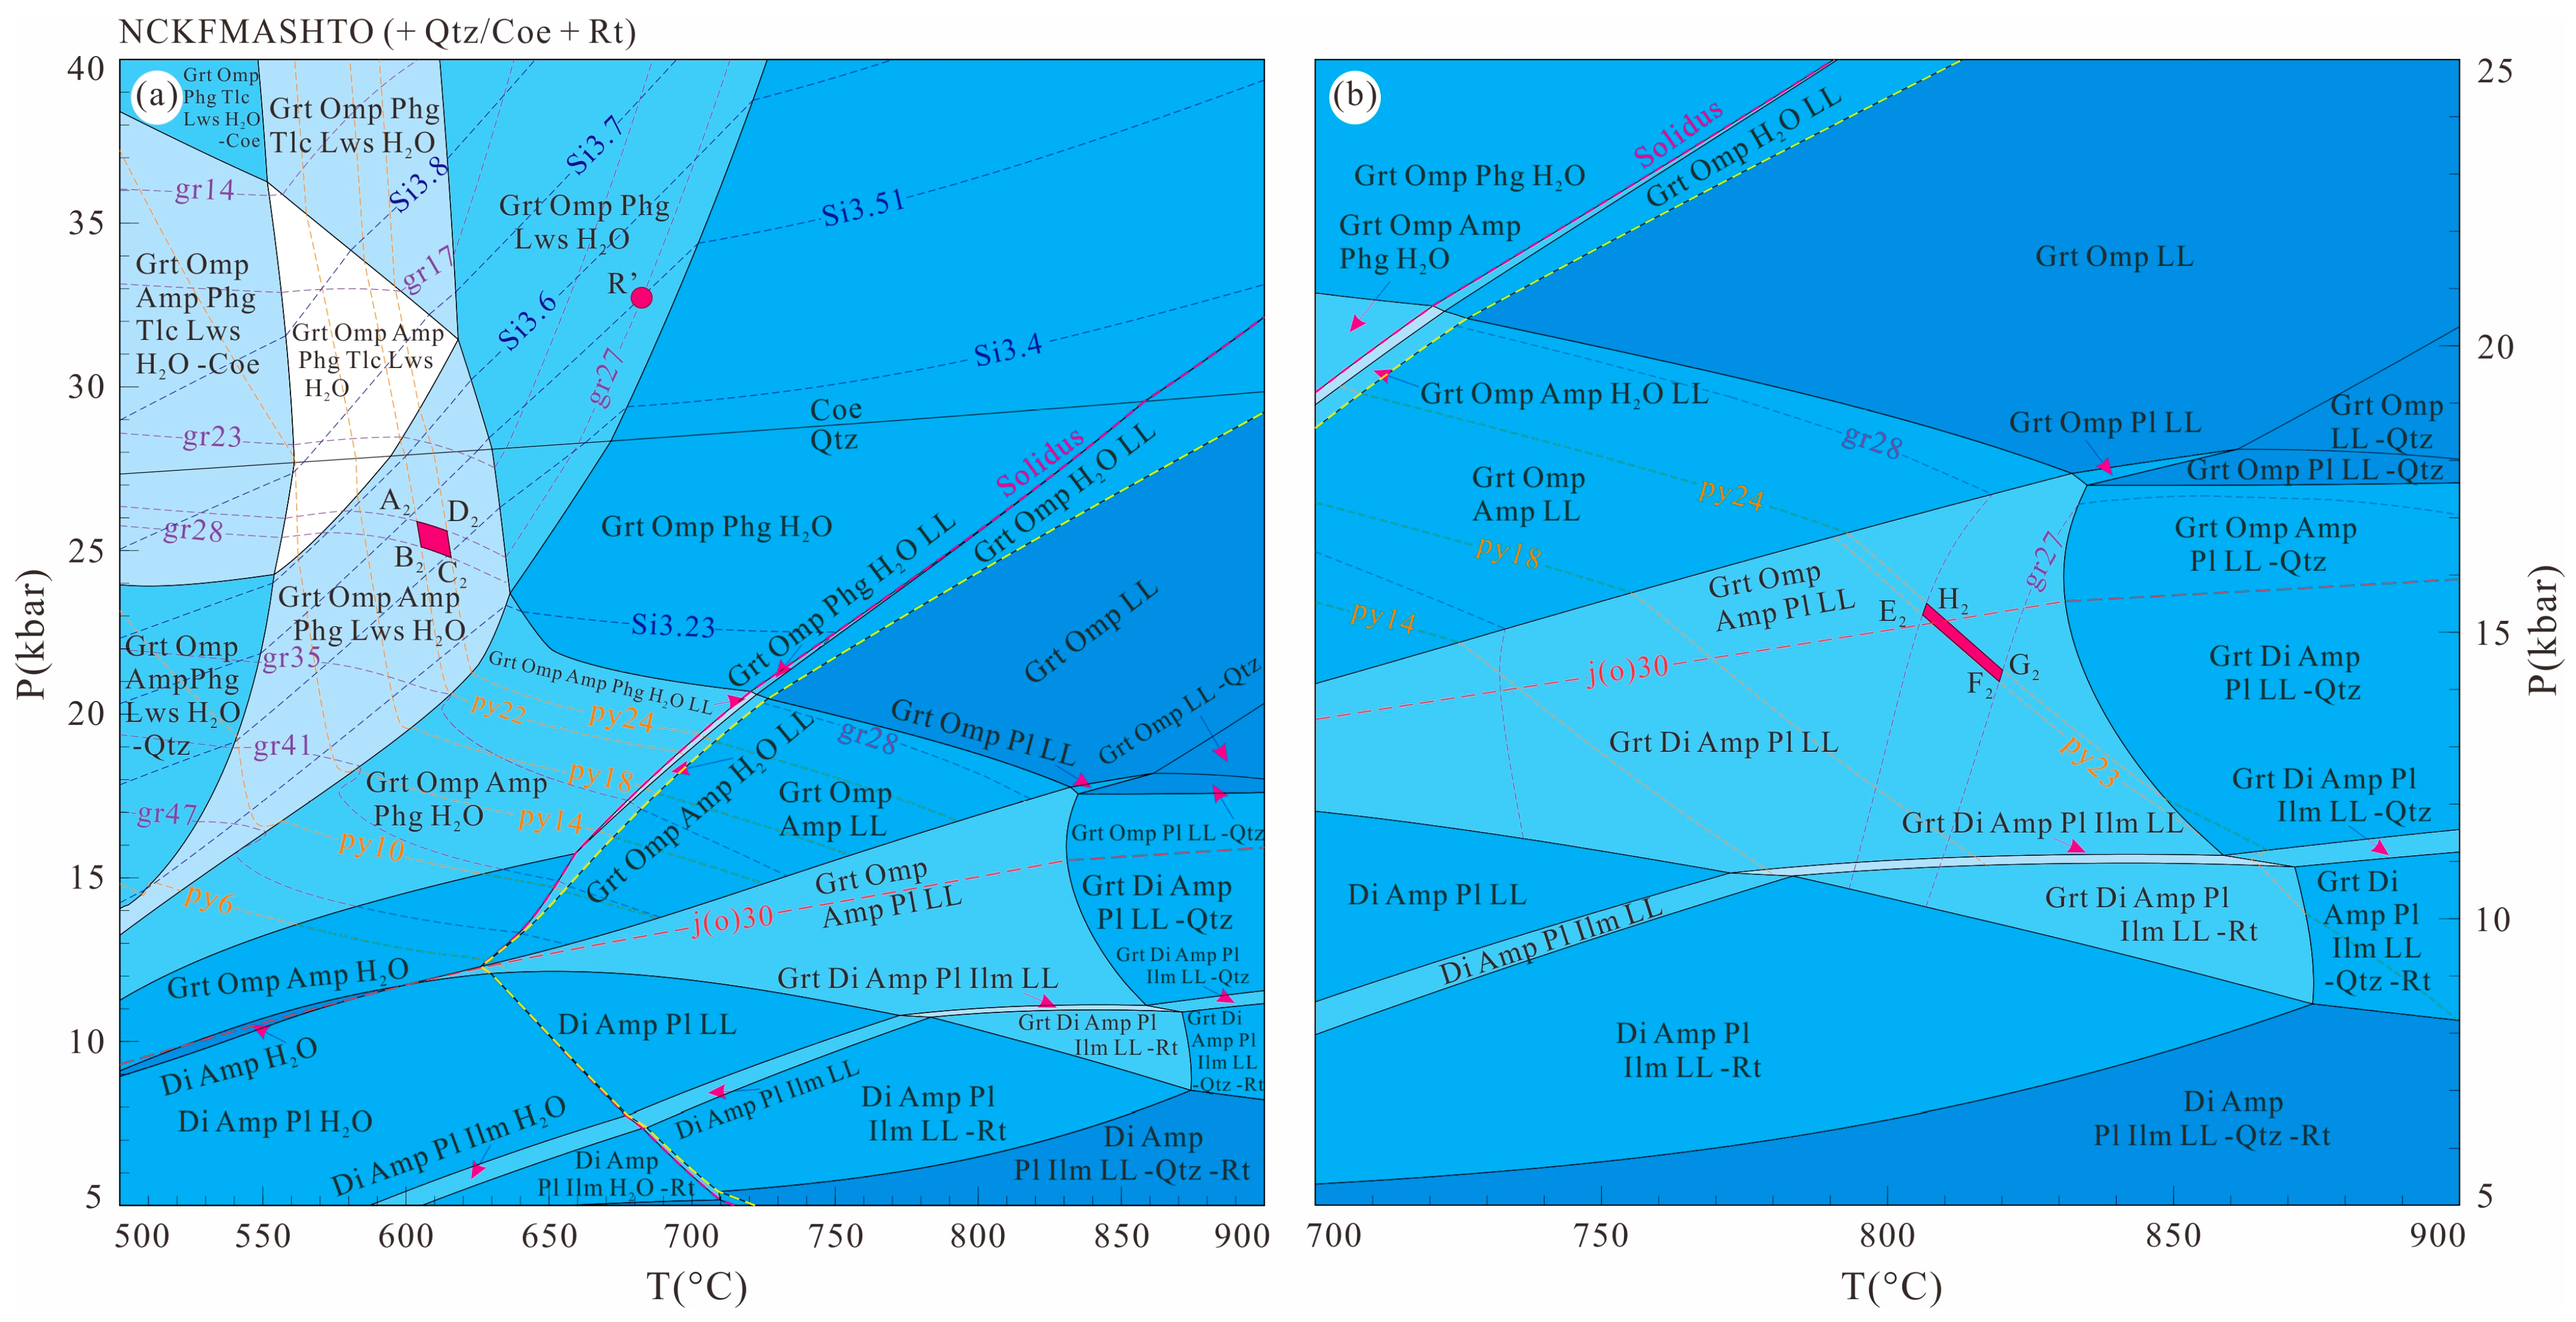
6.2. Pseudosections for the Yangkou Eclogites

The P-T pseudosection calculated for sample Y-32 is presented in Figure 9. The observed mineral assemblage of garnet, omphacite, amphibole, phengite, plagioclase, rutile, and quartz under the microscope constitutes a quadri-variant assemblage: Grt + Omp + Amp + Phg + Pl + LL (+ Qtz + Rt) with P = 11–18 kbar and T = 610–820 °C. In the stability field of the assemblage, Grt + Omp + Amp + Phg + Lws + H2O (+ Qtz + Rt), Xpy contours have steeply negative slopes with Xpy increasing as temperature rises, while Xpy shows flat slopes in Grt + Omp + Amp + Phg + H2O (+ Qtz + Rt) and Grt + Omp + Amp + Phg + LL (+ Qtz + Rt), with Xpy increasing as pressure rises. The Xgr isopleths show flat slopes in Grt + Omp + Amp + Phg + H2O (+ Qtz + Rt) and show moderate slopes in Grt + Omp + Amp + Phg + LL (+ Qtz + Rt) with the rise in pressure associated with a decrease in Xgr.
Based on the Xpy isopleths (0.18–0.19) in garnet and Si content (3.36–3.40) in phengite (Table S2), field A3-B3-C3-D3 in the assemblage Grt-Omp-Amp-Phg-Lws-H2O (+ Qtz + Rt) is constrained at 24–26 kbar and 595–600 °C, which represents a P-T condition of the prograde stage (Figure 9a; Table 3). We calculated an effective bulk composition for modelling the retrograde conditions, and the calculated P-T pseudosection using the effective bulk composition is presented in Figure 9b. Field E3-F3-G3-H3 is constrained at a P-T condition of 13–14 kbar and 770–790 °C in the penta-variant field of the assemblage Grt-Omp/Di-Amp-Pl-LL (+ Qtz + Rt) by Xpy (0.17–0.19) and Xgr (0.31–0.35) contours in garnet and j(o) (0.35–0.36) contours in omphacite (Table S2), representing a P-T condition during the decompression process (Figure 9b).
The pseudosections of P–X(CaO) at a fixed 600 °C and T–X(MgO) at a fixed 25 kbar are presented in Figure S2a,b, respectively. Increasing X(CaO) extends the stability of assemblages to lower pressures (Figure S2a), while increasing X(MgO) extends the stability of assemblages to higher temperatures (Figure S2b). In the field of assemblage Grt + Omp + Amp + Phg + Lws (+ Qtz + Rt + H2O), Si content in phengite, and Xpy contours of garnet are slightly affected by the bulk-rock X(CaO) and bulk-rock X(MgO), respectively. The rise of pressure and temperature is associated with an increase in Si and Xpy, respectively, which indicates that the P-T condition of A3-B3-C3-D3 in Figure 9a is reliable.

7. Discussion

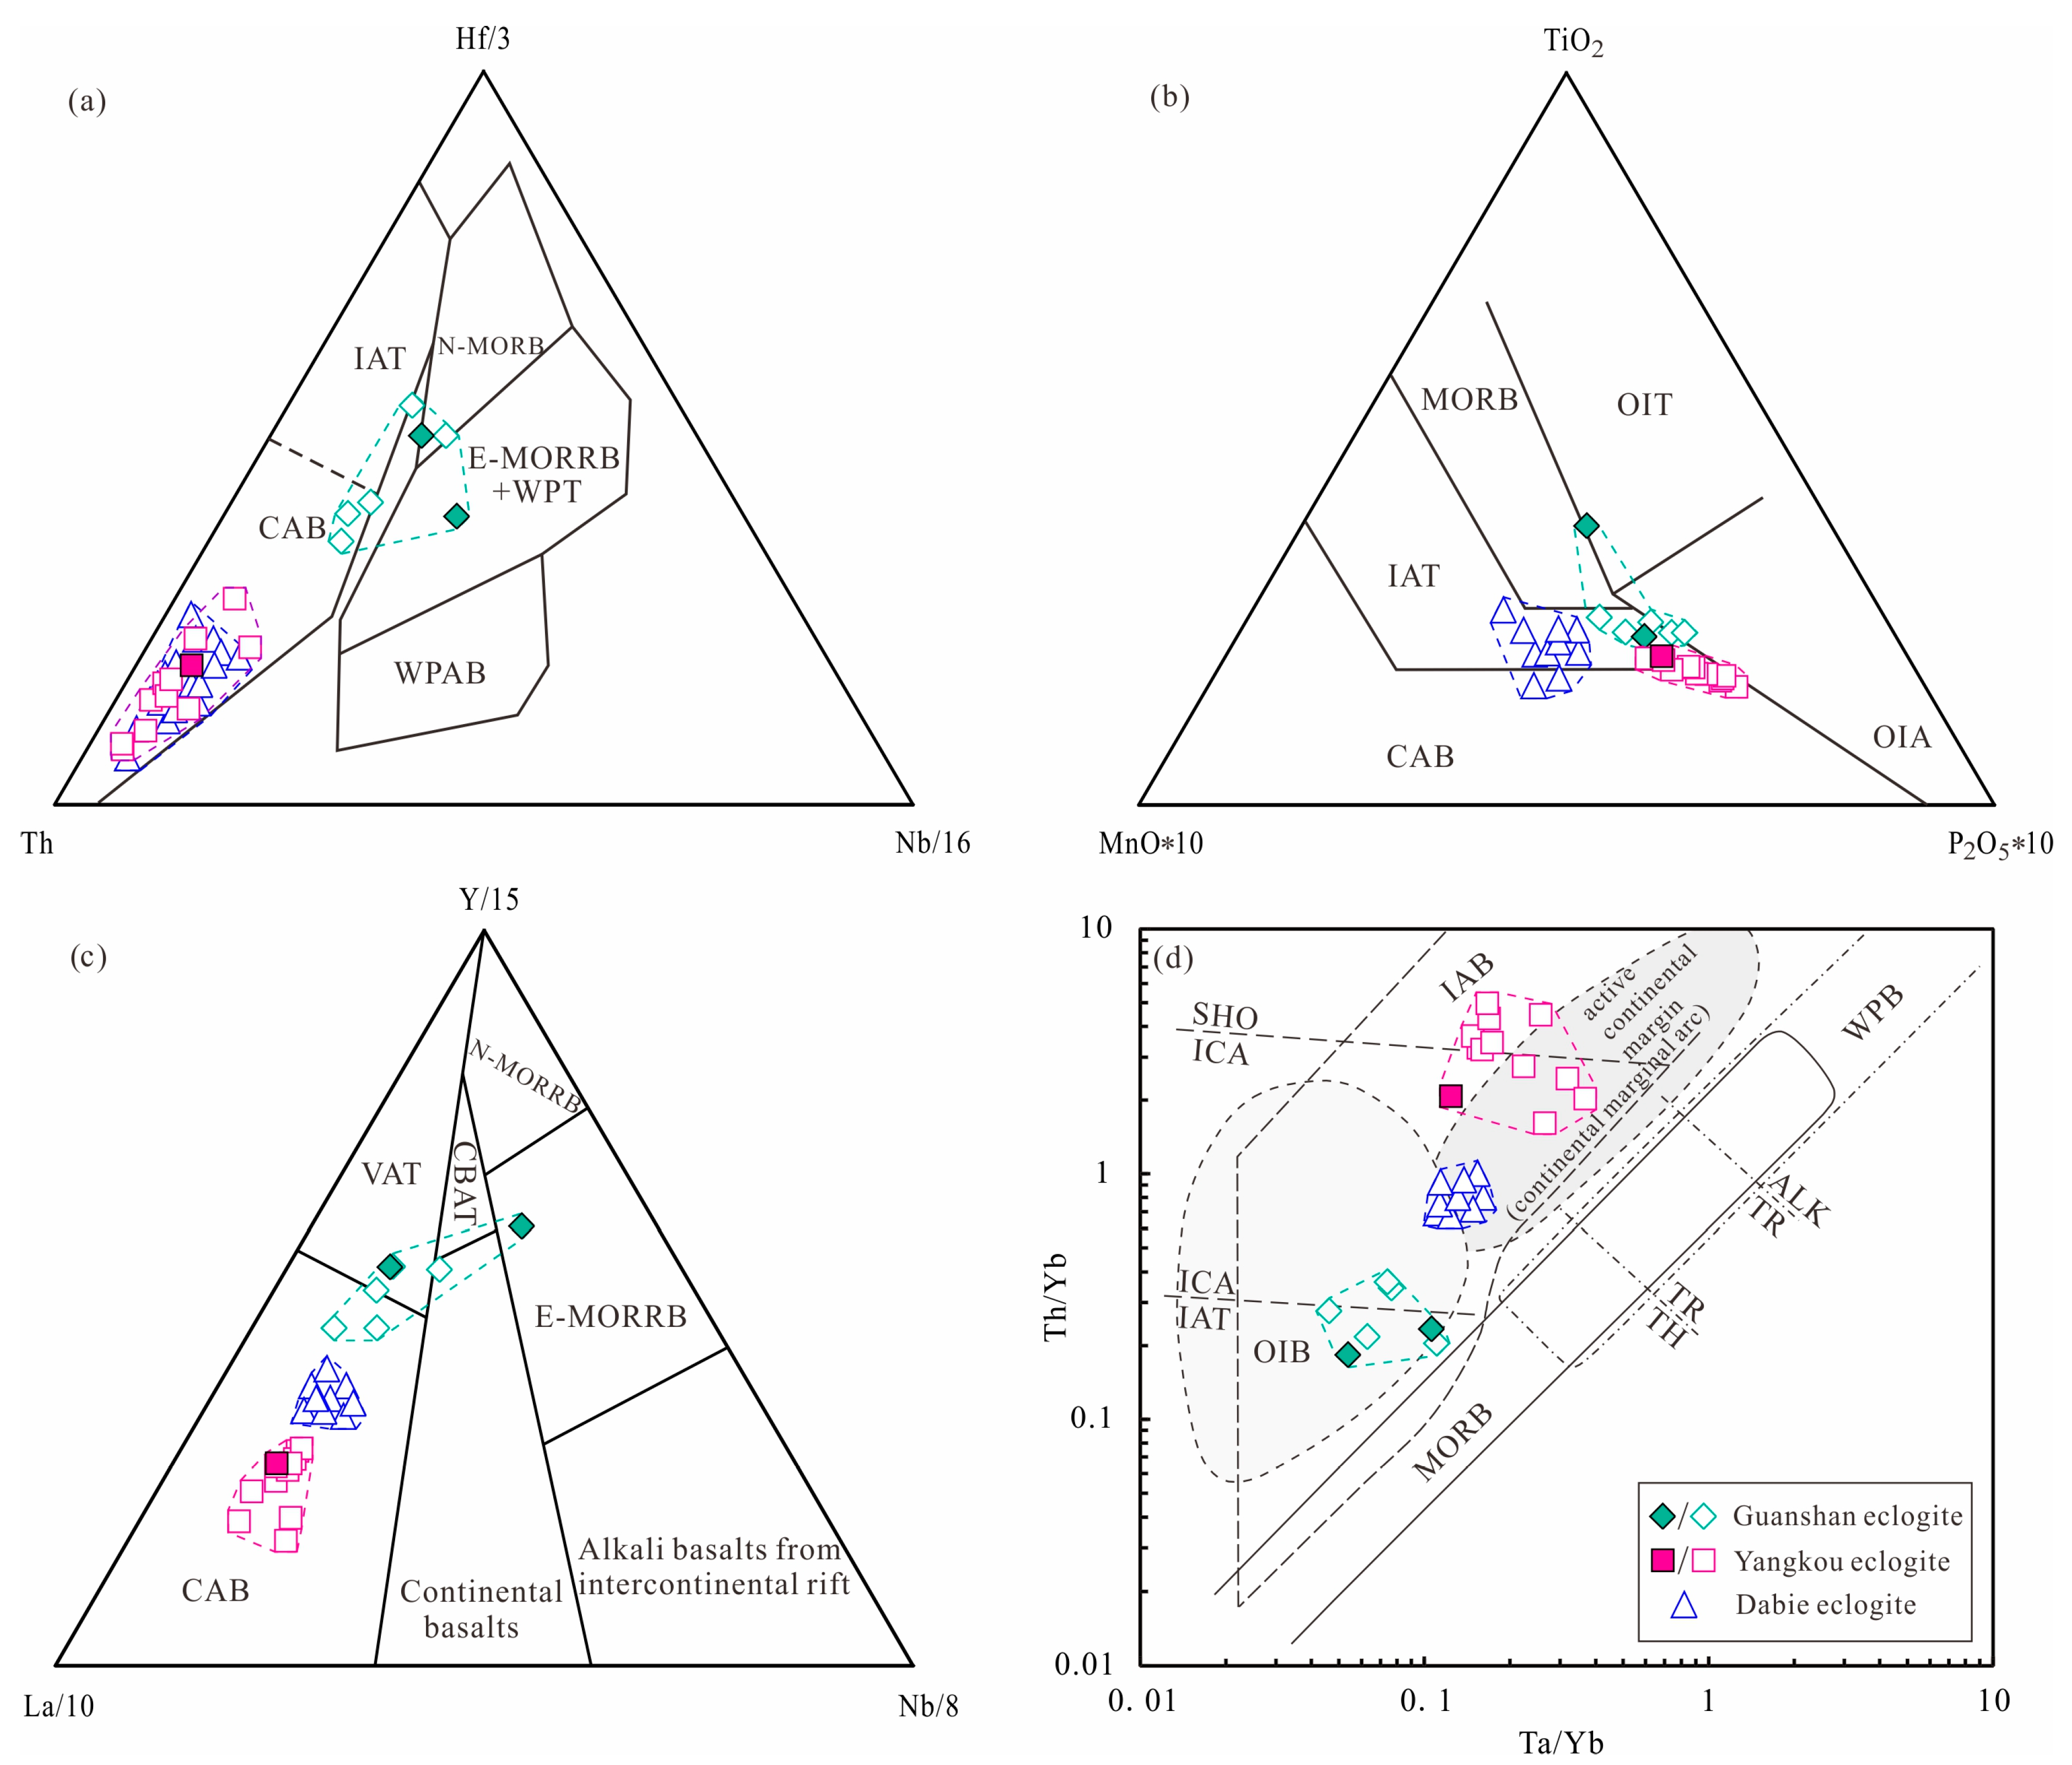
7.1. Discrimination of Tectonic Settings for the Protolith of Ecologites from Guanshan and Yangkou Areas

HFSE and their elemental ratios are used to investigate the tectonic settings for the protolith of eclogites in the study areas. In the diagrams of Hf/3-Th-Nb/16 (Figure 10a) and TiO2-MnO-P2O5×10 (Figure 10b), samples of Guanshan eclogites basically plot into the area of island arc tholeiites (IAT) (Figure 10b) with several into calc-alkaline basalts (CAB) and MORB (Figure 10a,b). However, all samples of Yangkou eclogites plot into the area of CAB (Figure 10a,b). In the diagram of Y/15-La/10-Nb/8 (Figure 10c), samples of Guanshan eclogites plot into the transitional area of volcanic arc tholeiites (VAT) and CAB. Considering the geochemical similarities of Th, Ta and Yb, and the small influence of partial melting and fractional crystallization to ratios of Th/Yb and Ta/Yb, these elements or ratios are used to further classify oceanic basalts and to discriminate tectonic settings of subduction zones [58]. In the diagram of Th/Yb-Ta/Yb (Figure 10d), samples of Guanshan eclogites plot into the transitional area of IAT and island arc calc-alkaline basalts (ICA), while samples of Yangkou eclogites plot into the field of island arc alkalic basalts (IAB), consistent with their plotting in Figure 10c.
To compare Sulu with Dabie, we collected data on Hualiangting eclogites in the Dabie orogenic belt [41,42] and found that the data on Hualiangting eclogites basically plotted into the transitional area between Guanshan and Yangkou (Figure 10a–d). Considering that Hualiangting is geographically located in-between Guanshan and Yangkou before being displaced by the Tan-Lu fault (Figure 1a), we found that the tectonic settings of eclogites from the three sites are different with the changing trend of IAT → ICA → IAB → CAB from south to north.

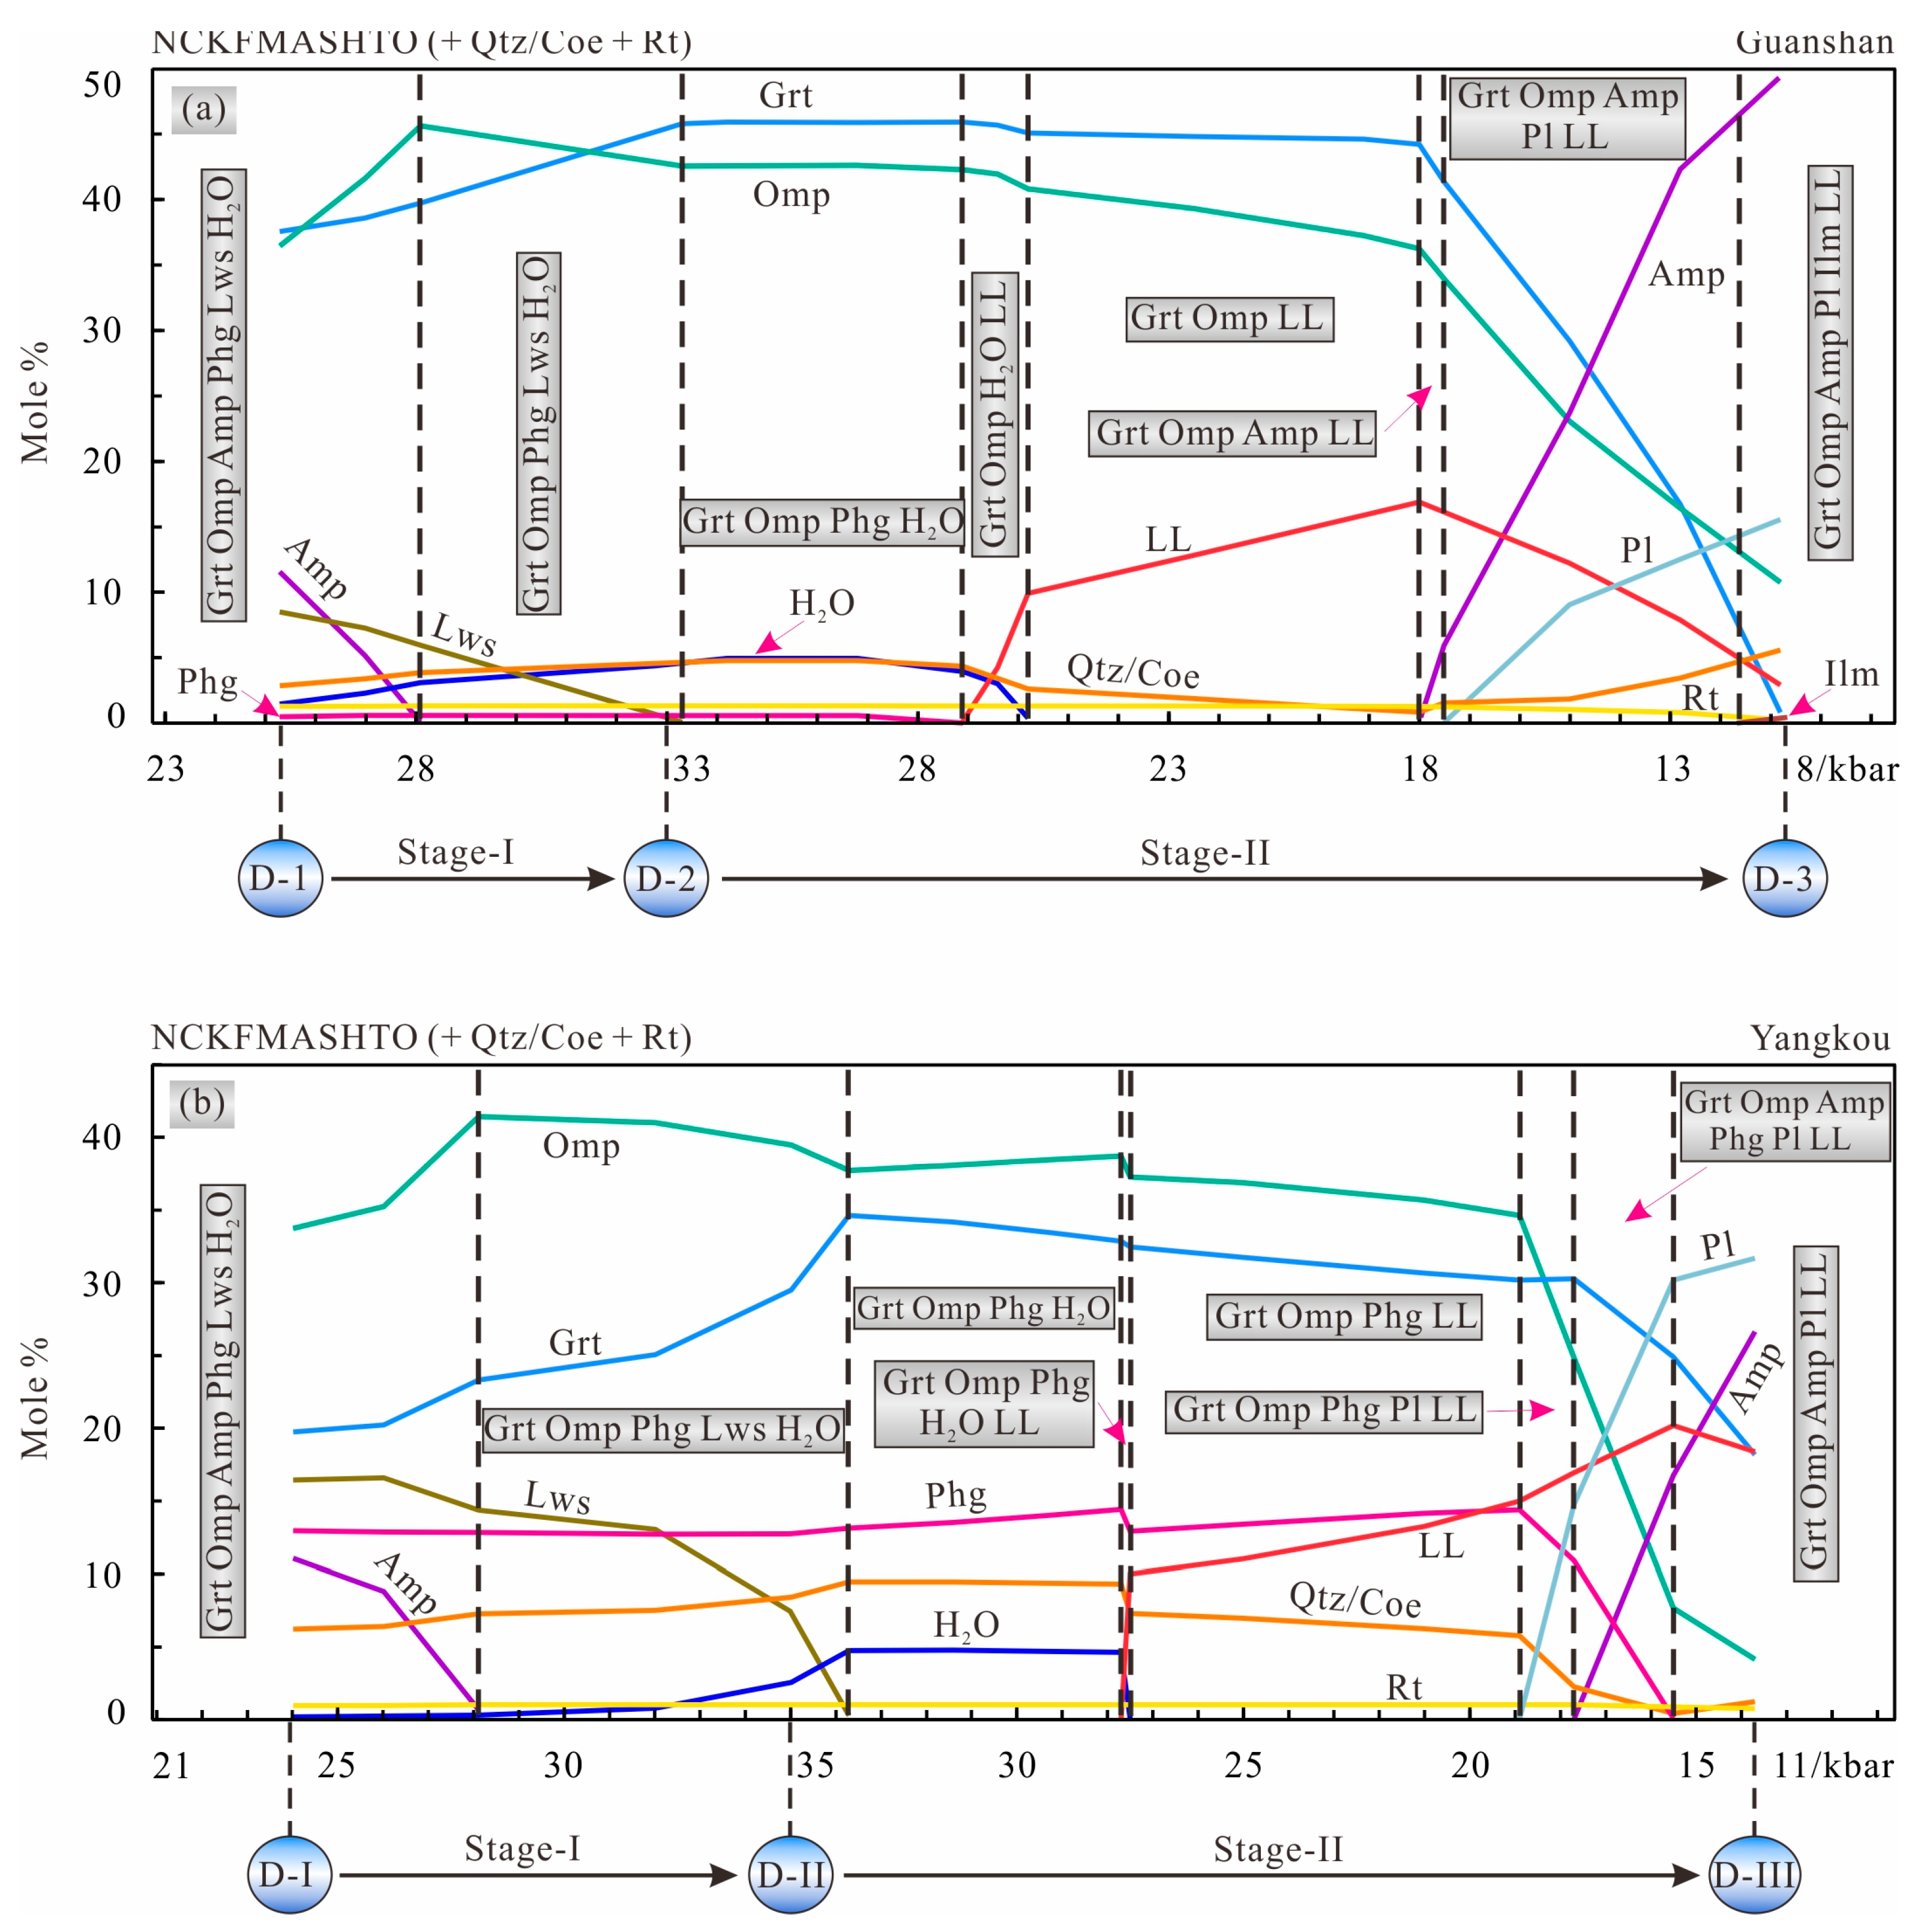
7.2. Metamorphic Evolution of the Guanshan and Yangkou Eclogites during Subduction and Exhumation

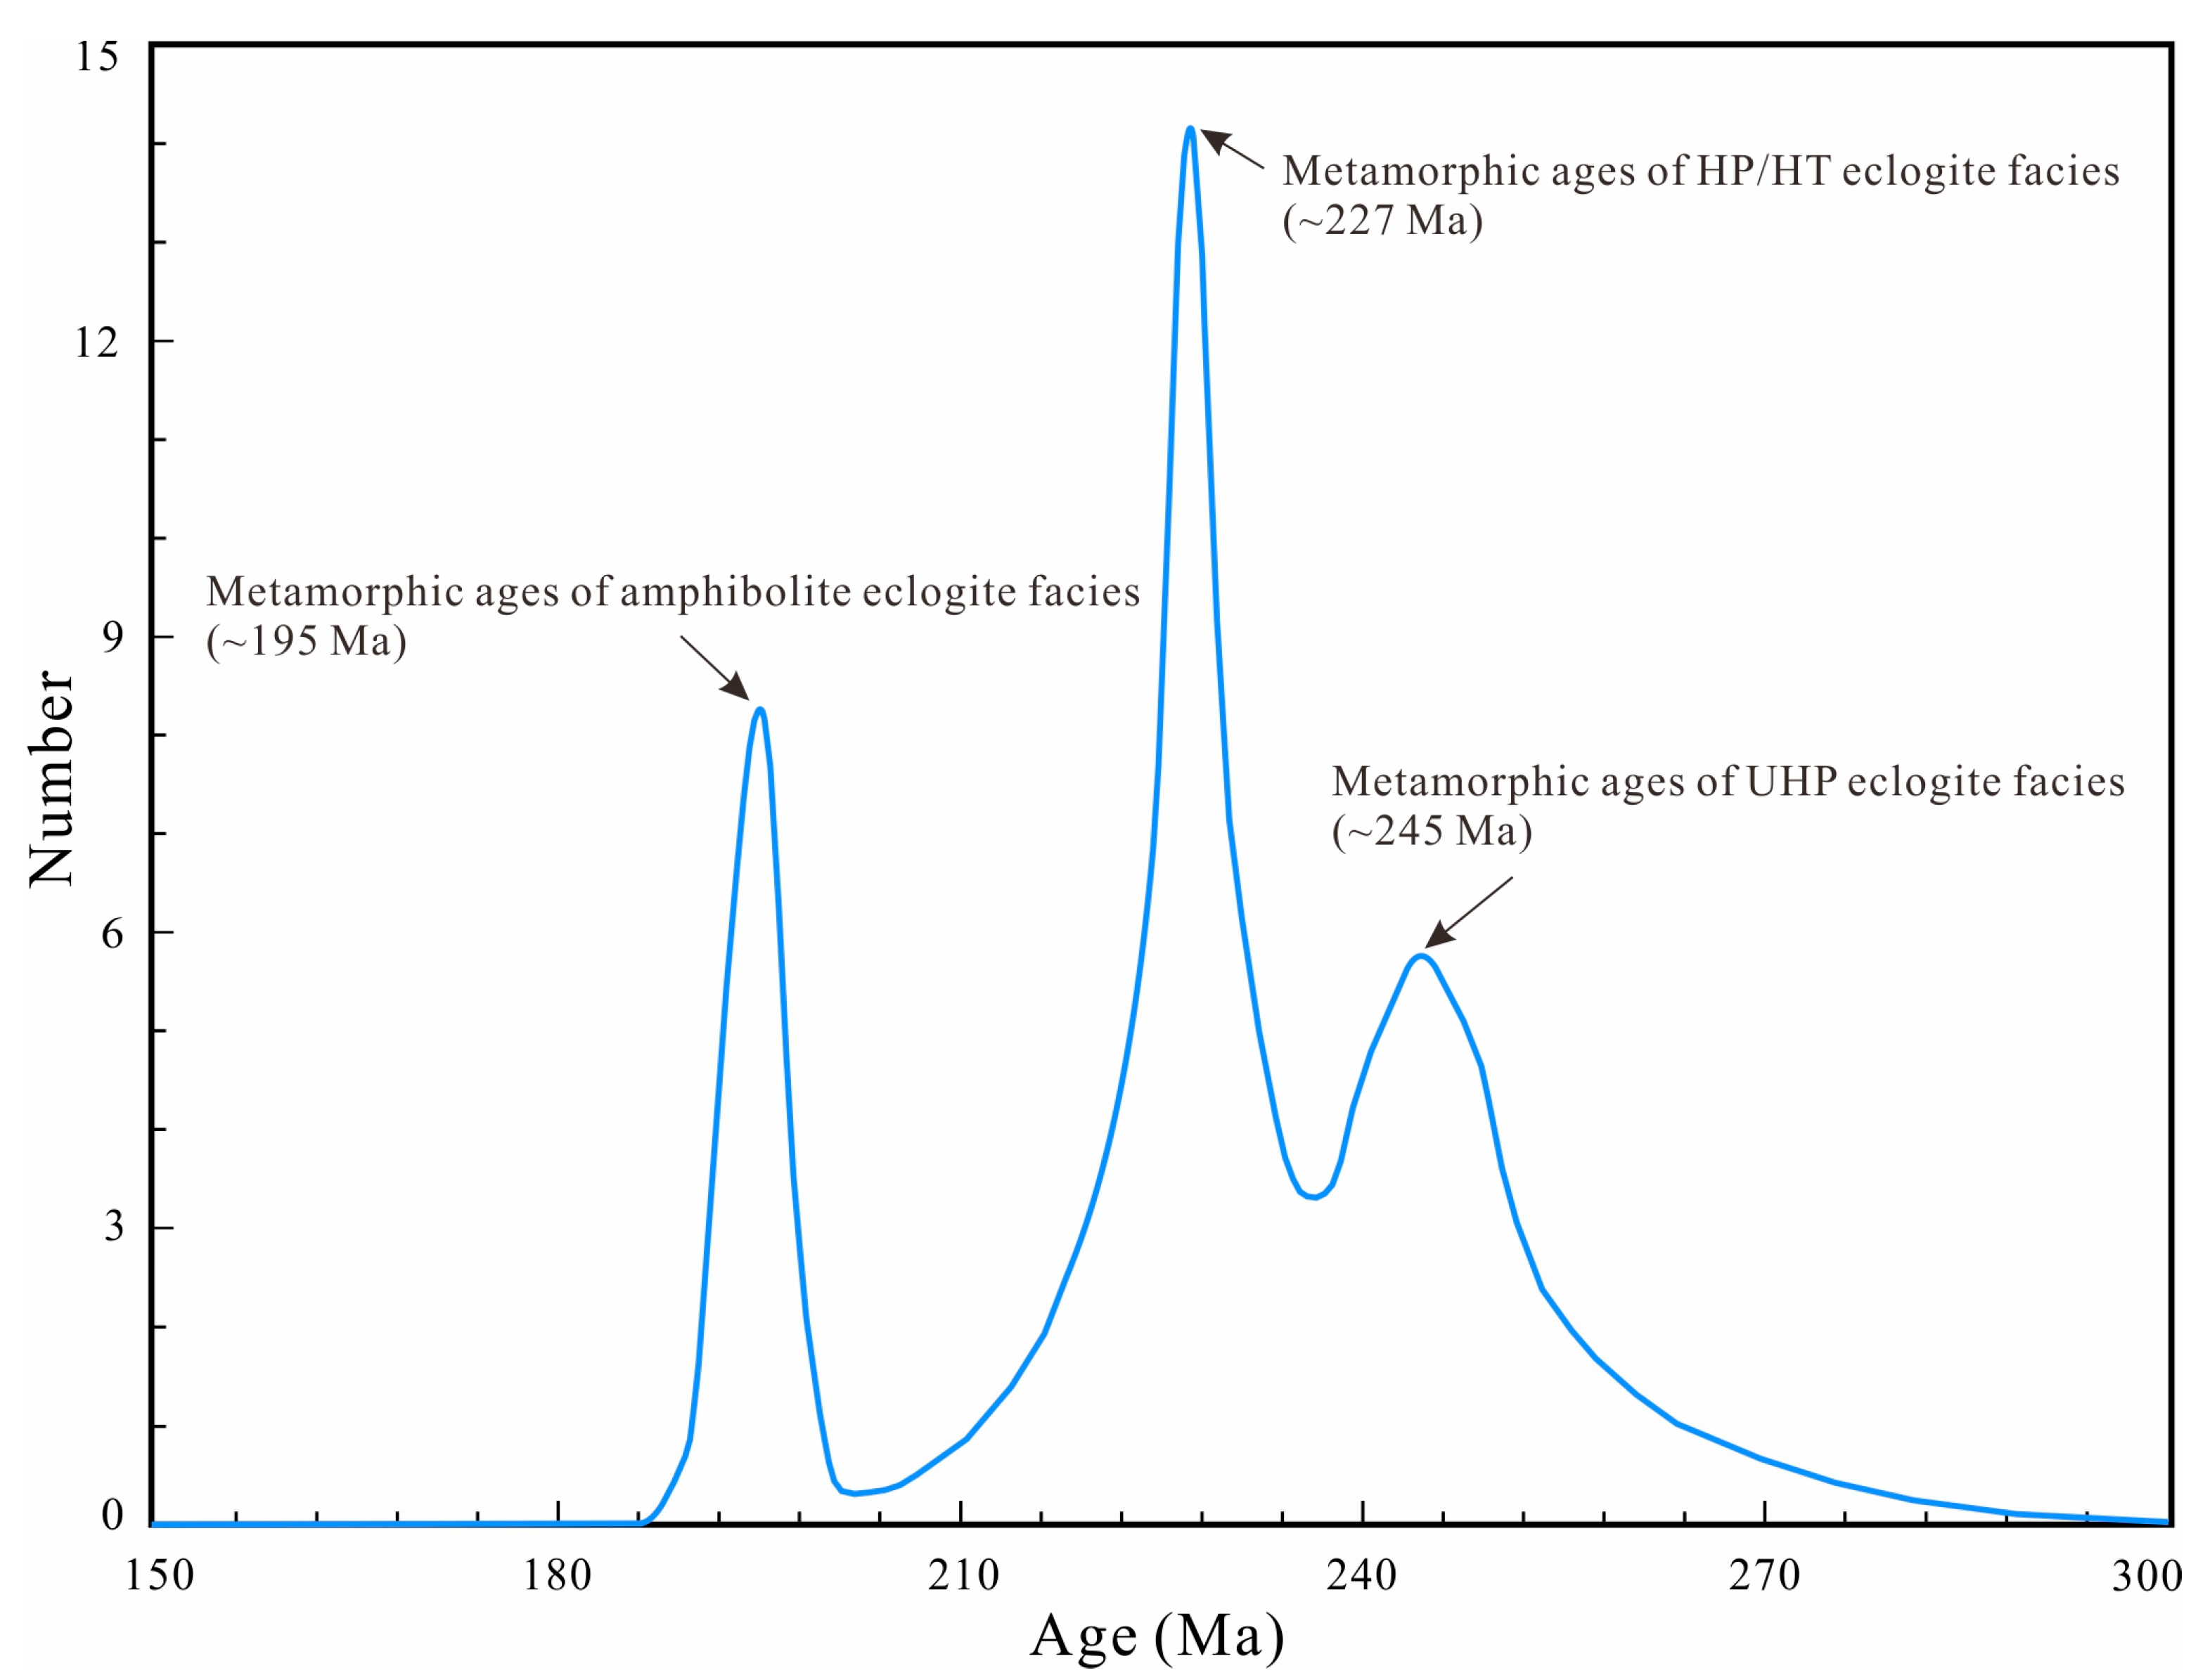
7.2.1. Intensity and Timing of Metamorphism in the Sulu UHP Terrane Based on Literature Data

We have compiled the literature data of the Sulu UHP eclogites [63,64,65,66] to better understand the variation of metamorphic intensity with time during subduction and exhumation of the Yangtze plate and identified three metamorphic events, with metamorphic events at 245, 227, and 195 Ma, respectively. According to metamorphic zircon analysis, the timings of 245 and 227 Ma are interpreted as ages of eclogite facies peak metamorphism and granulite facies metamorphism, respectively [63,65,66]. Based on Rb–Sr isotopic analysis of garnet and phengite, 195 Ma is considered to be the age of amphibole facies retrograde metamorphism [64].

7.2.2. Metamorphic Stages of Guanshan Eclogites and Their Evolution History

(1)
Prograde associated by quick subduction
The pre-peak conditions during subduction are constrained by the core-mantle zoning of Grt and Si in Phg. The P-T conditions are constrained at 22–23 kbar and 600–610 °C by the Xpy contours (0.165–0.17) and Si content (3.44–3.49) in Phg in sample G-10 (D-1 in Figure 11). Mineral assemblage for this pre-peak stage is Grt-Omp-Amp-Phg-Qtz-Rt-H2O. Subsequent prograde metamorphic P-T conditions are constrained at 25–26 kbar and 605–615 °C in the field of assemblage Grt-Omp-Amp-Phg-Lws-Qtz-Rt-H2O based on the contours of Xpy (0.22–0.24) and Xgr (0.27–0.28) from core to mantle in sample G-11 (D-1 in Figure 11). The P-T values estimated are similar to the pressures (21–22 kbars in sample G-10 and 23–27 kbars in sample G-11 with the core composition of garnet) estimated using the Grt-Cpx-Pl-Qz barometer [67] and the temperatures (595–610 °C) estimated using Cpx thermobarometers [68]. The peak P-T conditions (Pmax = 33 kbar; T = 685 °C) are constrained by the maximum Si content in phengite inclusions in garnet (Figure 2e) and the minimum Xgr of garnet mantle with the mineral assemblage of Grt + Omp + Phg + Lws + H2O (+ Coe + Rt) in sample G-11 (D-2 in Figure 11).
In the early stage of subduction, the modal abundance of amphibole decreased with the increase in pressure and disappeared completely at P = 28 kbar, while the modal abundance of omphacite increased (Figure 12a). This explains why amphibole was stable in the field of Grt + Omp + Amp + Phg + Lws + H2O (+ Qtz + Rt) at this stage but could not be seen under a microscope because amphibole formed earlier and would convert into omphacite [71]. When the pressure reached 28 kbar, quartz started to transform into coesite (Figure 11). Inclusion of pseudomorphic coesite in host garnet (Figure 2d) further confirms that eclogites had reached and crossed the quartz/coesite transformation line. In the following prograde stage, with the increasing modal abundances of garnet, quartz, and aqueous fluid (H2O), the amounts of omphacite and lawsonite gradually decreased. Lawsonite was consumed through dehydration reactions until its complete disappearance during the subduction process, and this is why lawsonite was not observed under a microscope (Figure 12a; [19,72,73]). Based on the estimated P-T conditions and peak mineral assemblage (Grt + Omp + Phg ± Lws + Coe), we consider this prograde stage to be an UHP eclogite-facies metamorphism, likely corresponding to the regional peak metamorphic event of ~245 Ma (Figure 13; Table 4; [63,65].
(2)
Retrograde associated by quick exhumation
The P-T conditions during exhumation are revealed by the mantle-rim zoning of garnet and are estimated to be 14–15 kbar and 805–820 °C. The P-T values are constrained by the isopleths for Xpy (0.23–0.24) and Xgr (0.27–0.28) of garnet mantle-rim in the stability field of Grt-Omp/Di-Amp-Pl-LL-Qtz-Rt in sample G-11. Subsequent retrograde metamorphic P-T conditions are constrained at 12 kbar and 780–790 °C in the stability field of Grt-Di-Amp-Pl-Ilm- LL-Qtz-Rt based on the isopleths for Xpy (0.16–0.165) and Xgr (0.24–0.25) of garnet mantle-rim in sample G-10 (D-3 in Figure 11). The result (780–790 °C) is well consistent with the calculated temperature (783–793 °C) using the Grt–Cpx thermometer of Ravna [8] for sample G-10. The UHP rocks could be exhumed at low temperatures and subsequently heated at lower pressures. The heat is supplied by mantle melt penetrating the subduction zone. Mantle upwelling as a result of slab breakoff and heating of partially exhumed rocks to granulite facies conditions [74].
In the initial stage of exhumation, modal abundance for each mineral basically remained stable, and only the transformation between mineral endmembers occurred. When the pressure dropped to 27.1 kbar, phengite disappeared and melt appeared (Figure 12a). The observed clusters of melt inclusions (quartz and feldspar) at the core of phengite (Figure 2g) and quartz melt filling in the fractures of garnet in the form of veinlets (Figure 2i) represent initial in-situ melting. Subsequently, with the decreasing of modal abundance of omphacite and quartz, the amount of melt generated rapidly through the reaction of Omp + Qtz → LL. Quartz melt converged to form the “Network vein” along grain boundaries between garnet and omphacite (Figure 2c). The P-T conditions and mineral assemblage (Grt + Omp ± Phg + LL + Qtz) indicate that this is a HP/HT eclogite-facies retrograde metamorphism, corresponding to the regional granulite-facies metamorphic event of ~227 Ma (Figure 13; Table 4; [65,66]).
In the late stage of exhumation, amphibole started to appear when the pressure decreased to 18 kbar, followed by appearance of plagioclase when the pressure dropped to 17.5 kbar. The appearances of amphibole and plagioclase were coupled with the reduction of garnet and omphacite. At this stage, omphacite gradually broke down to form green amphibole (Figure 2h) with plagioclase (melt pseudomorph) crystallization from a pool of melt (Figure 2f). In addition, rutile gradually decreased due to the transformation from rutile to ilmenite (Figure 2a). Based on the calculated P-T conditions and mineral assemblage (Grt + Omp + Amp + Pl + Ilm + LL + Qtz), we consider this to be an amphibole eclogite-facies retrograde metamorphism, corresponding to the regional amphibolite-facies metamorphic event of ~195 Ma (Figure 13; [64]).

7.2.3. Metamorphic Stages of Yangkou Eclogites and Their Evolution History

(1)
Prograde associated by quick subduction
The prograde P-T conditions during subduction are constrained by the Xpy isopleths (0.18–0.19) in garnet and Si content (3.36–3.40) in Phg to be 24–26 kbar and 595–600 °C in the field of Grt + Omp + Amp + Phg + Lws + H2O (+ Qtz + Rt) (D-I in Figure 11). The P-T values are similar to the pressure (23–25 kbars with the core composition of garnet) estimated using the Grt-Cpx-Pl-Qz barometer [67] and the temperature (590–610 °C) estimated using Cpx thermobarometers [68]. The peak P-T conditions are estimated to 35 kbar and 735 °C using the barometer of Waters and Martin [75] and thermometer of Green and Hellman [76] by Wang et al. [69] (D-II in Figure 11).
In the early stage of subduction, with the increase in pressure, the modal abundances of garnet, omphacite, and quartz were gradually increasing, while the modal abundances of amphibole and lawsonite were reducing by the reaction of Lws + Amp → Grt + Omp + Qtz (Figure 12b). When the pressure increased to 28 kbar, amphibole disappeared completely, and quartz started to transform into coesite (Figure 2j). With further increase in pressure, modal abundance of garnet increased, followed by a slight increase in quartz and free water, while modal abundance of omphacite decreased slightly, followed by rapid reduction of lawsonite through the reaction of Lws + Omp → Grt + Qtz + H2O. Based on P-T conditions and peak mineral assemblage (Grt + Omp + Phg ± Lws + Coe), we consider this stage to be an UHP eclogite-facies prograde metamorphism, and the peak metamorphic age is ~245 Ma, the same as that of Guanshan eclogite (Figure 13; Table 4; [63,65]).
(2)
Retrograde associated by quick exhumation
In the initial stage of exhumation, with the dropping of pressure, modal abundances of garnet, amphibole, quartz, and free water were increasing, and the modal amounts of omphacite and lawsonite were reducing (Figure 12b), until the complete disappearance of lawsonite when the pressure dropped to 33.7 kbar. Melt appeared when the pressure dropped to 27.7 kbar. In the following exhumation stage, modal abundances of garnet, omphacite, and quartz gradually decreased, while melt and phengite increased through the reaction of Grt + Omp + Qtz → Phg + LL. The P-T conditions and mineral assemblage (Grt + Omp + Phg + LL+ Qtz) indicate this is a HP/HT eclogite-facies retrograde metamorphism, consistent with the regional metamorphic event of ~227 Ma (Figure 13; Table 4; [65,66]). In the late stage of exhumation, plagioclase started to appear when the pressure dropped to 19.8 kbar, and amphibole started to appear when the pressure dropped to 17.7 kbar. With the continuous dropping of pressure, the amounts of garnet, omphacite, phengite, and quartz reduced, while the amounts of plagioclase and melt increased through reactions of Grt + Omp + Phg + Qtz → LL + Pl.
The P-T conditions in the late stage of exhumation are preserved in garnet. Isopleths for Xpy (0.17–0.19) and Xgr (0.31–0.35) in garnet and j(o) (0.35–0.36) contours in omphacite constrain a P-T range of 13–14 kbar and 770–790 °C in the stability field of Grt + Omp + Amp + Pl + LL (+ Qtz + Rt) (D-III in Figure 11).
The estimated temperature from the pseudosection approach is consistent with the result (T = 765–785 °C) calculated by the Grt-Cpx-Pl-Qz thermobarometers [77] with the rim of garnet and the result (T = 780 °C) by the Grt-Cpx thermometer [78] (Table S3).
Based on the P-T conditions and mineral assemblage (Grt + Omp + Amp + Pl + LL + Qtz), we consider that this is an amphibole eclogite-facies retrograde metamorphic event of ~195 Ma (Figure 13; [64]).

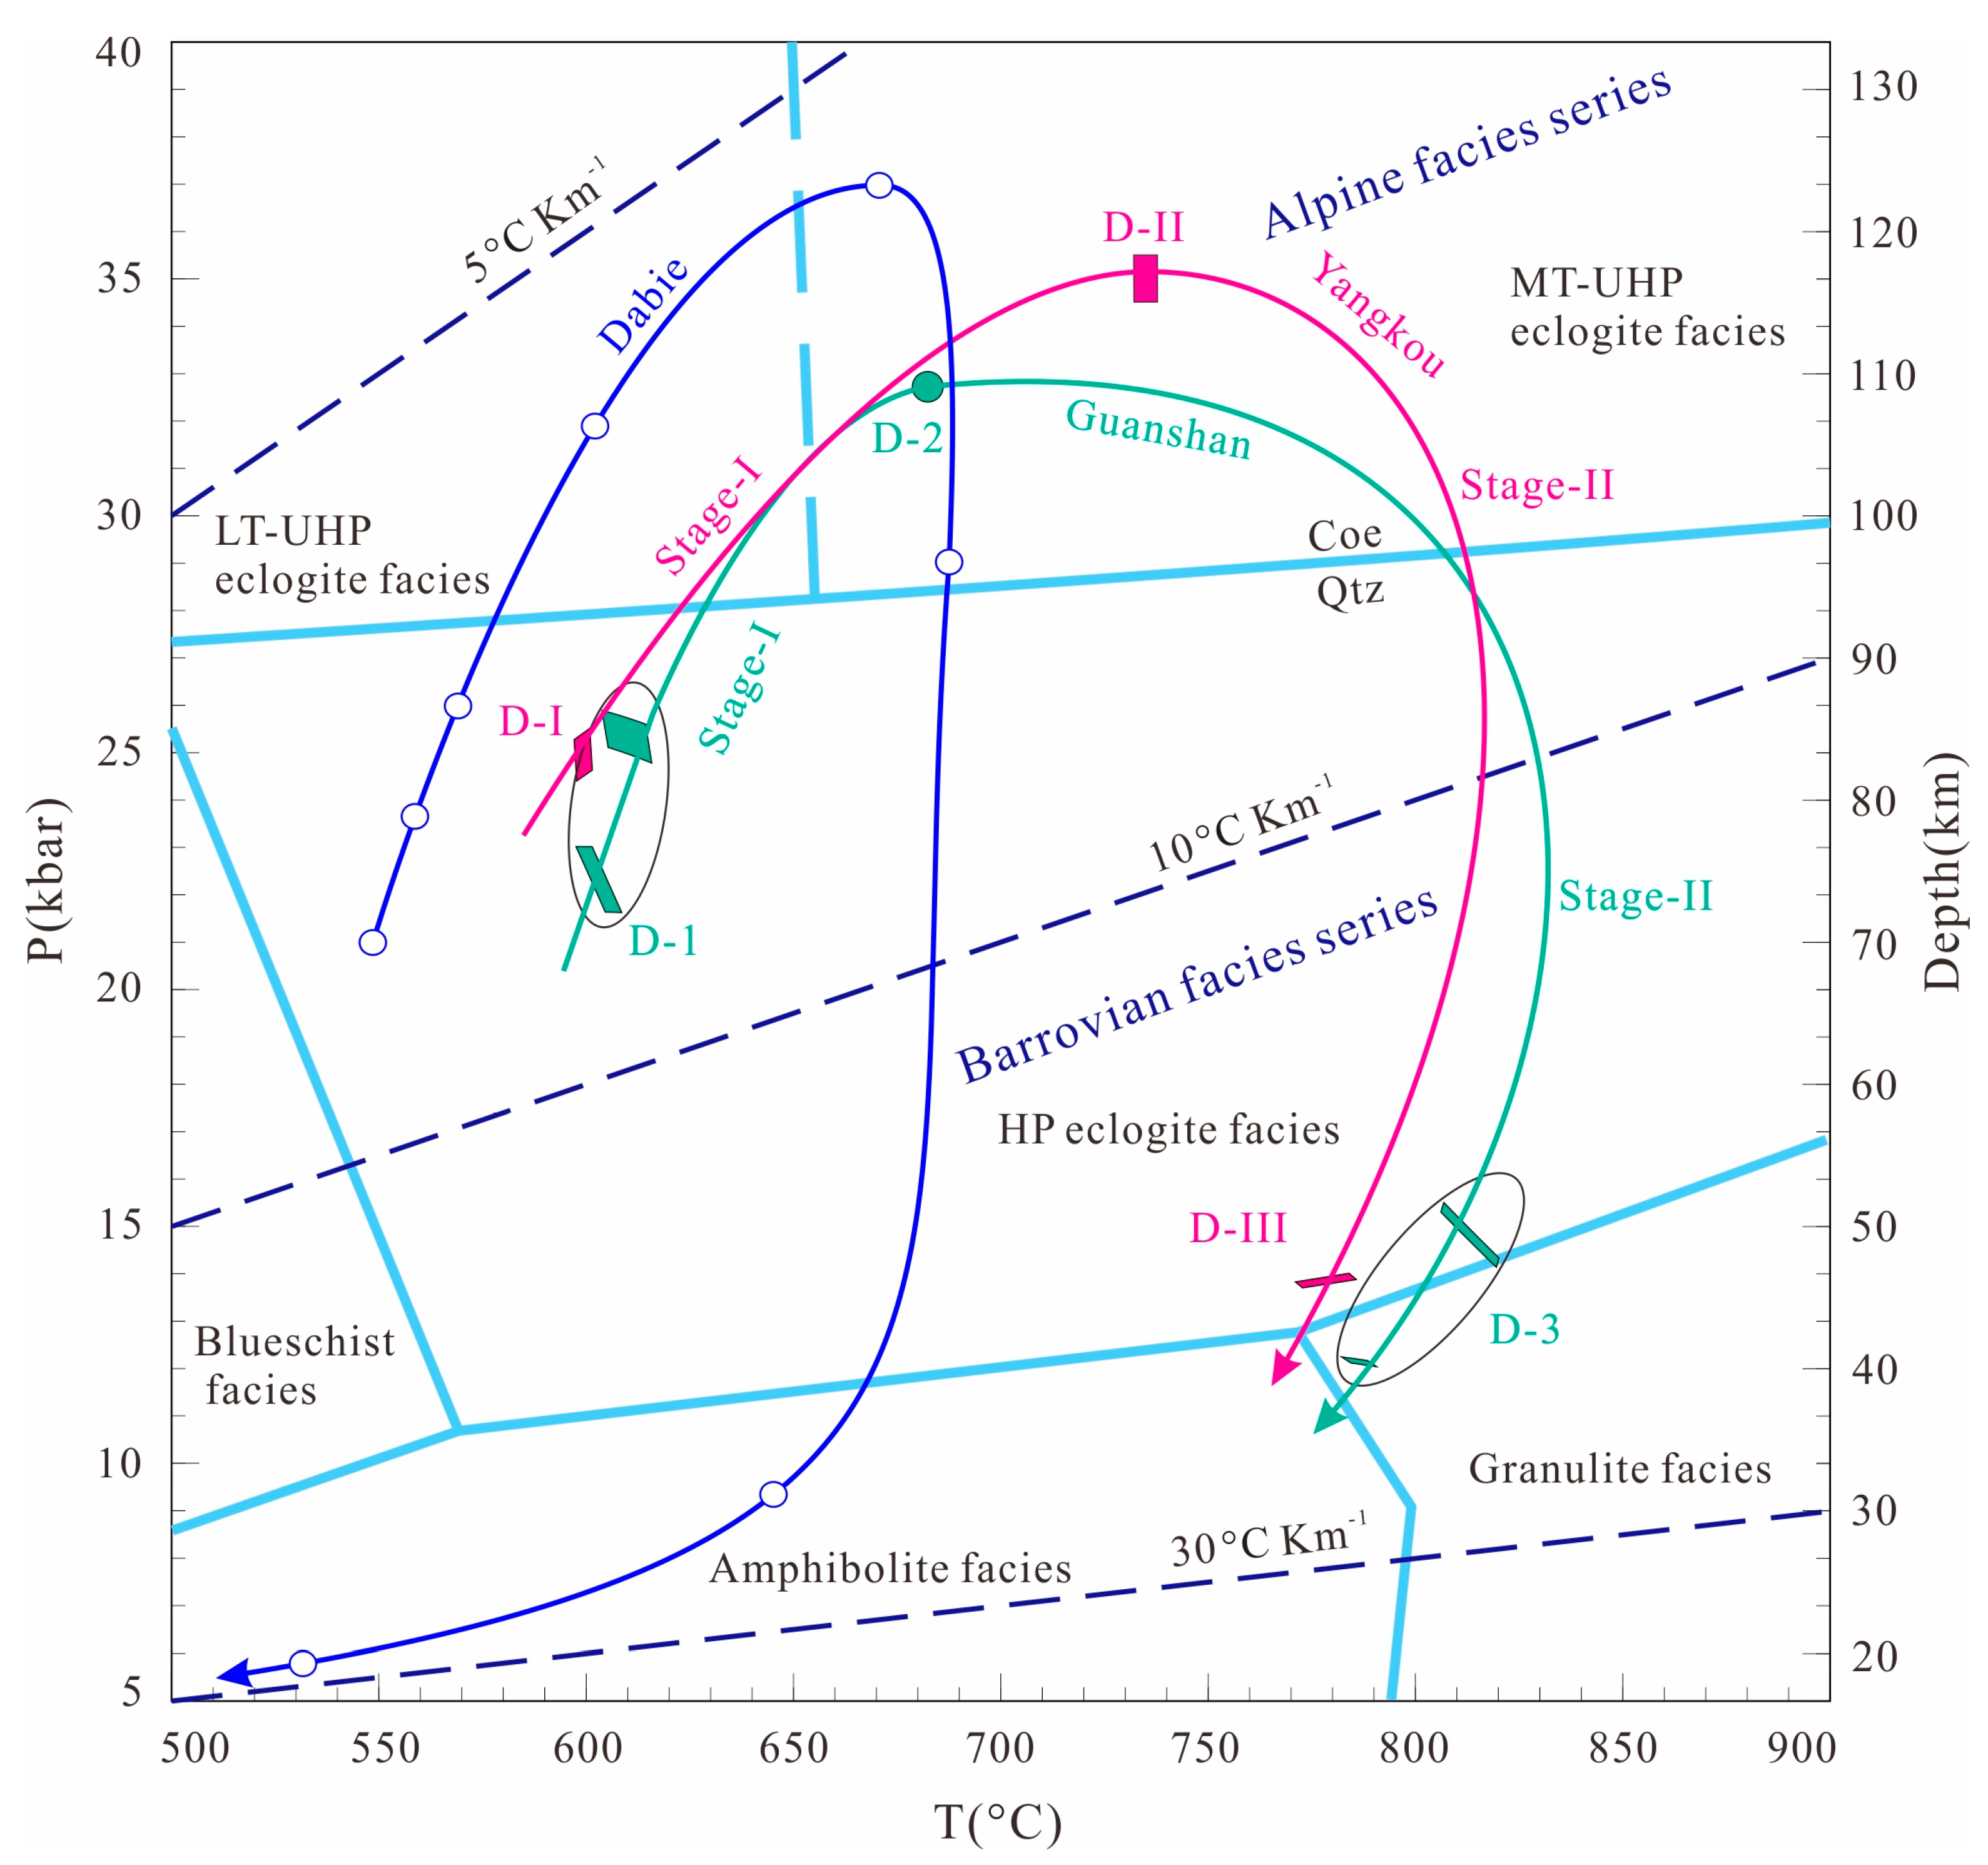
7.3. Comparison of P-T Paths in the Sulu-Dabie UHP Metamorphic Belt

The P-T paths for almost all UHP eclogites in the world are clockwise [73]. The P-T paths of Sulu UHP terrane (e.g., Guanshan and Yangkou) are also clockwise [10,13], similar to that observed in Dabie UHP terrane (e.g., Hualiangting; [42,70]). The eclogites from Guanshan and Yangkou are different in ranges of temperature and pressure as well as in style of P-T path when compared with the eclogites from the Dabie UHP terrane.
Comparing the P-T paths of eclogites from the Sulu-Dabie UHP terrane (Figure 11), it can be found that: (1) In the stage of subduction, the dP/dT value and Pmax of the Dabie eclogites are similar to those of the Sulu (Guanshan and Yangkou) eclogites, indicating that the subduction depth of the Dabie eclogites may be similar to that of the Sulu eclogites. (2) In the stage of exhumation, the Sulu UHP eclogites show increasing temperature with decompression, while the Dabie eclogites show a near-isothermal decompression process, and the Tmax of the Sulu eclogites is much higher than that of the Dabie eclogites, indicating that the exhumation rate of the Dabie eclogites is higher than that of the Sulu (Figure 11). (3) Guanshan and Yangkou eclogites are similar in terms of Pmax, Tmax, and patterns of P-T path, indicating that they have the similar subduction depth and exhumation rate although they may represent different rock slices and variable tectonic settings (Figure 11). Eclogites in different areas of Sulu UHP terrane show similar styles of P-T paths, indicating that their protolithes have undergone similar dynamic processes during the subduction and exhumation processes.

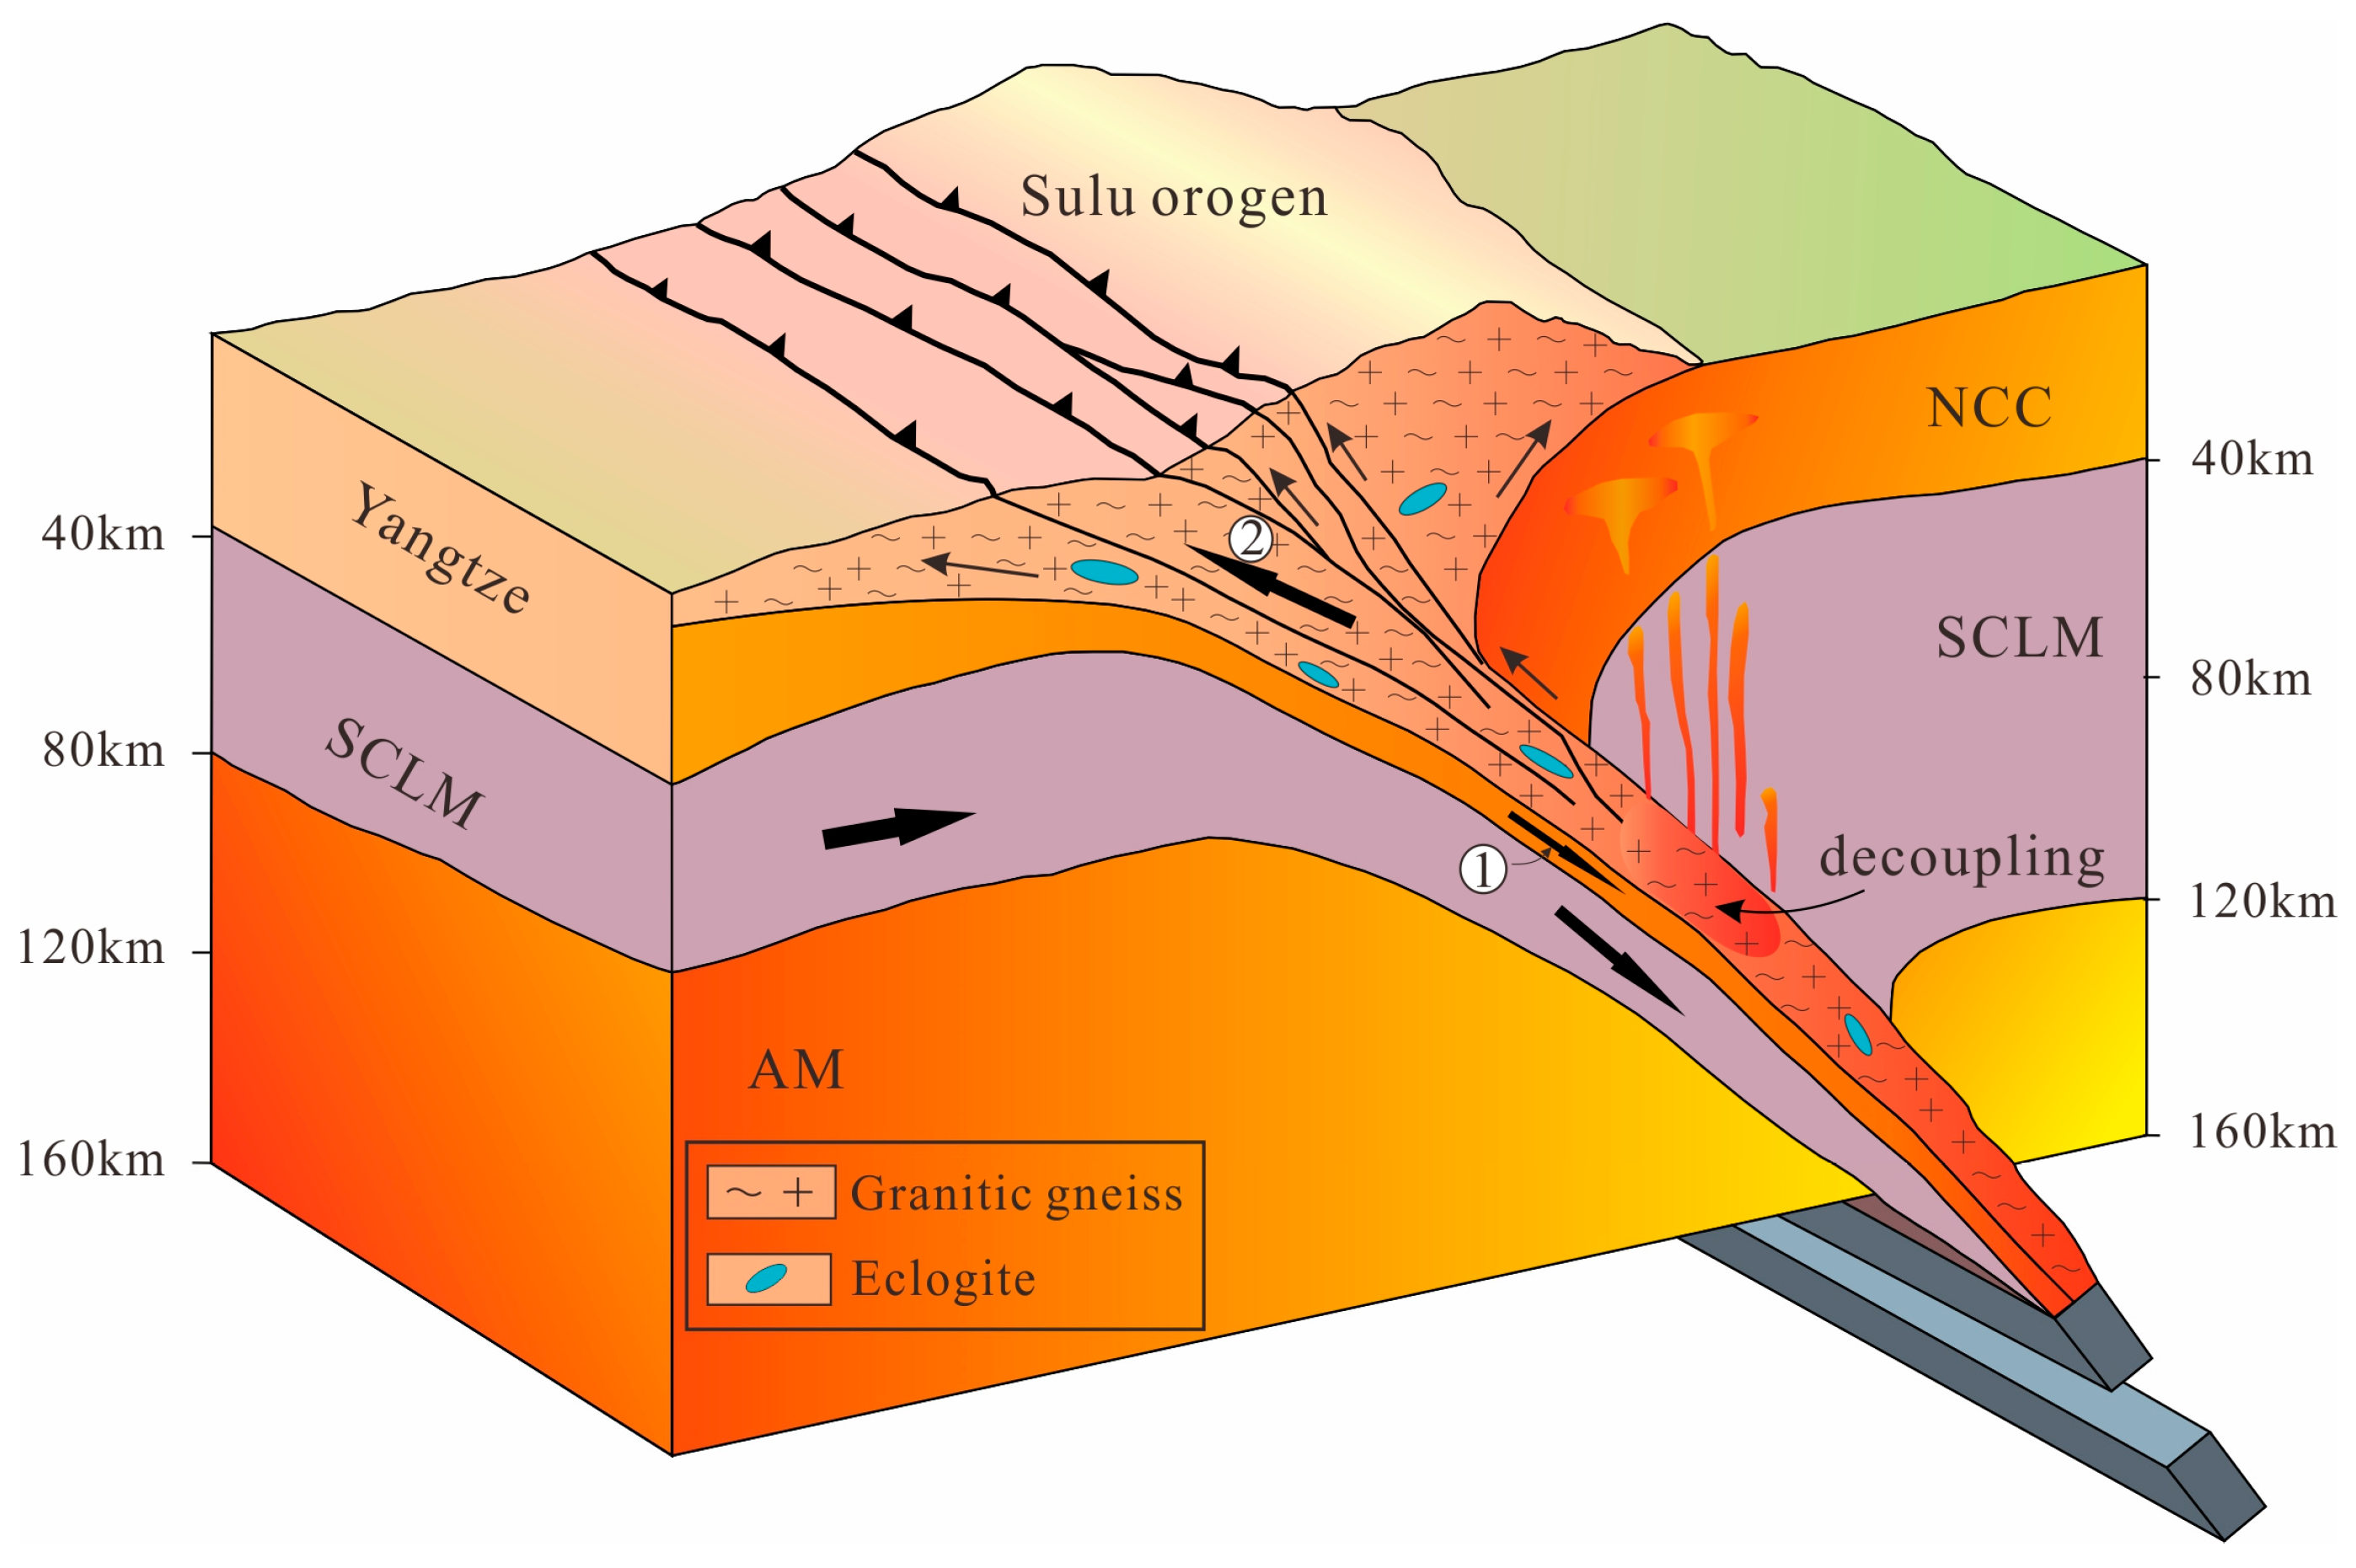
7.4. Tectonic Implications

The subduction stage is estimated to proceed under P-T conditions of 22–23 kbar and 600–610 °C and 25–26 kbar and 605–615 °C in Guanshan and 24–26 kbar and 595–600 °C in Yangkou, corresponding to thermobaric ratios of 265–272 °C/GPa, 236–242 °C/GPa and 230–247 °C/GPa, respectively (Figure 11). The peak metamorphic stage is estimated to proceed under P-T conditions of 33 kbar and 685 °C in Guanshan and 35 kbar and 735 °C in Yangkou, corresponding to thermobaric ratio of 207 °C/GPa and 210 °C/GPa, respectively. The exhumation stage is estimated to proceed under P-T conditions of 12 kbar and 780–790 °C and 14–15 kbar and 805–820 °C in Guanshan, corresponding to thermobaric ratios of 650–658 °C/GPa and 546–575 °C/GPa. Similarly, the estimated P-T conditions are 13–14 kbar and 770–790 °C in Yangkou, corresponding to thermobaric ratios of 530–637 °C/GPa (Figure 11). The difference in metamorphic thermobaric ratios provides us with an excellent opportunity to decipher the tectonic evolution not only for continental collision but also for plate boundaries from convergent to divergent [1]. By converting the thermobaric ratios to thermal gradients [1], the three metamorphic stages as illustrated in the P-T-t path are mainly confined to the Alpine facies series, with a minor part in the Barrovian facies series (in Figure 11). In detail, the prograde to peak stage proceeded along low thermal gradients from 8.0–8.2 °C/km to 7.0–7.2 °C/km then to 6.2 °C/km in Guandshan and from 6.9–7.4 °C/km to 6.3° C/km in Yangkou, representing a depth from 70–85 km to more than 110 km (① in Figure 14), and the metamorphism is marked by HP-UHP eclogite facies (in Figure 13). The exhumation stage proceeded at moderate thermal gradients from 16.3–17.2 °C/km to 19.5–19.7 °C/km in Guanshan and 15.9–19.1 °C/km in Yangkou, corresponding to depths from 110 to 40–50 km (② in Figure 14). Exhumation has resulted in the elevation of thermal gradients and the change of metamorphism from UHP eclogite facies to HP eclogite facies (in Figure 11). During exhumation, the mantle melt generated by slab break-off or slab rollback heats the plate. Because of the short duration, the central part of the slice is not deformed; the rocks tend to undergo only partial recrystallization and can preserve prograde zoning in minerals such as garnet.

8. Conclusions

(1)
The protoliths of eclogites from Guanshan and Yangkou are basalt and basaltic trachy andesite, respectively. From south to north, before the formation of the Talu fault, the tectonic settings of eclogites from the Dabie/Sulu orogenic belt were changing with a trend of IAT → ICA → IAB → CAB.
(2)
The Guanshan and Yangkou eclogites show two metamorphic stages: (I) prograde associated with quick subduction, and (II) retrograde associated with quick exhumation. Peak metamorphism and the middle and late stage of exhumation coincide with the regional metamorphic events, which occurred in 245, 227, and 195 Ma, respectively.
(3)
The peak P-T conditions for eclogites from Guanshan are constrained at 33 kbar and 685 °C. The values of Pmax suggest that both the Guanshan and Yangkou eclogites have reached a depth of over 110 km.

Supplementary Materials

The following supporting information can be downloaded at: https://www.mdpi.com/article/10.3390/min13030362/s1, Figure S1: (a) P–X(CaO) [CaO/(CaO + Na2O), mol.%] and (b) T–X(MgO) [MgO/(MgO + FeO total), mol.%] pseudosections in the system NCKFMASHTO (+ Qtz + Rt + H2O) for sample G-11 composition with X(CaO) = 0.766 and X(MgO) = 0.50 in Figure 8a calculated at 685 °C and 33 kbar, respectively, showing the dependence of mineral assemblage on bulk-rock X(CaO) and X(MgO). The compositions used for modelling are listed in Table 1. Other details are the same as in Figure 7. Figure S2: (a) P–X(CaO) [CaO/(CaO + Na2O), mol.%] pseudosections in the system NCKFMASHTO (+ Qtz + Rt + H2O) for sample Y-32 composition with X(CaO) = 0.64 in Figure 9a calculated at 600 °C showing the dependence of mineral assemblage on bulk-rock X(CaO). (b) T–X(MgO) [MgO/(MgO + FeO total), mol.%] pseudosections in the system NCKFMASHTO (+ Qtz + Rt + H2O) for sample Y-32 composition with X(MgO) = 0.42 in Figure 9a calculated at 25 kbar illustrating the dependence of mineral assemblage on bulk-rock X(MgO). The compositions used for modelling are listed in Table 1. Other details are the same as in Figure 7; Table S1: Trace element contents (ppm) of eclogites from the Guanshan and Yangkou area. Table S2: Representative microprobe analyses for sample G-11 from the Guanshan eclogites. Table S3: Representative microprobe analyses for sample Y-32 from the Yangkou eclogites.

Author Contributions

Conceptualization, J.W.; data curation, H.Y. and J.W.; laboratory analysis, H.Y., J.W., Z.X., J.L. (Jianguo Liu) and J.L. (Jinlin Liu); funding acquisition, J.W.; investigation, H.Y. and J.W.; methodology, J.W.; resources, J.W.; writing—original draft, H.Y.; writing—review & editing, J.W. All authors have read and agreed to the published version of the manuscript.

Funding

This research was funded by the National Natural Science Foundation of China (NSFC), grant number 41472051, to J.W.

Data Availability Statement

Not applicable.

Acknowledgments

We gratefully acknowledge the constructive suggestions and comments by three anonymous reviewers that helped improve the manuscript.

Conflicts of Interest

The authors declare no conflict of interest.

References

  1. Zheng, Y.F.; Chen, R.X. Extreme metamorphism and metamorphic facies series at convergent plate boundaries: Implications for supercontinent dynamics. Geosphere 2021, 17, 1647–1685. [Google Scholar] [CrossRef]
  2. Liou, J.G.; Tsujimori, T.; Zhang, R.Y.; Katayama, I.; Maruyama, S. Global UHP metamorphism and continental subduction/collision: The Himalayan model. Int. Geol. Rev. 2004, 46, 1–27. [Google Scholar] [CrossRef]
  3. Brown, M.; Johnson, T. Secular change in metamorphism and the onset of global plate tectonics. Am. Mineral. 2018, 103, 181–196. [Google Scholar] [CrossRef]
  4. Li, Z.; Li, Y.; Wijbrans, J.R. Metamorphic P-T Path Differences between the Two UHP Terranes of Sulu Orogen, Eastern China: Petrologic Comparison between Eclogites from Donghai and Rongcheng. J. Earth Sci. 2018, 29, 1151–1166. [Google Scholar] [CrossRef]
  5. Xia, B.; Brown, M.; Wang, L.; Wang, S.J.; Piccoli, P. Phase equilibrium modeling of MT–UHP eclogite: A case study of coesite eclogite at Yangkou Bay, Sulu belt, Eastern China. J. Petrol. 2018, 59, 1253–1280. [Google Scholar] [CrossRef]
  6. Graham, C.M.; Powell, R. A garnet–hornblende geothermometer: Calibration, testing and application to the Pelona Schist, Southern California. J. Metamorph. Geol. 1984, 2, 13–31. [Google Scholar] [CrossRef]
  7. Zhang, Z.M.; Zhang, J.F.; You, Z.D.; Shen, K. Ultrahigh-pressure metamorphic P-T-t path of the Sulu orogenic belt, eastern central China. Acta Petrol. Sin. 2005, 21, 257–270. [Google Scholar]
  8. Ravna, E.K.; Terry, M.P. Geothermobarometry of phengite–kyanite–quartz/coesite eclogites. In Proceedings of the Eleventh Annual VM Goldschmidt Conference, Hot Springs, VA, USA, 20–24 May 2001. [Google Scholar]
  9. Ye, K.; Cong, B.L.; Ye, D.N. The possible subduction of continental material to depths greater than 200 km. Nature 2000, 407, 734–736. [Google Scholar] [CrossRef] [PubMed]
  10. Yuan, H.Q.; Wang, J.; Hattori, K. Ultrahigh-Pressure Metamorphism and P-T Path of Xiaoxinzhuang Eclogites from the Southern Sulu Orogenic Belt, Eastern China, Based on Phase Equilibria Modelling. Minerals 2022, 12, 216. [Google Scholar] [CrossRef]
  11. Liu, F.L.; Gerdes, A.; Xue, A.M. Differential subduction and exhumation of crustal slices in the Sulu HP-UHP metamorphic terrane: Insights from mineral inclusions, trace elements, U-Pb and Lu-Hf isotope analyses of zircon in orthogneiss. J. Metamorph. Geol. 2009, 27, 805–825. [Google Scholar] [CrossRef]
  12. Stepanov, A.S.; Rubatto, D.; Hermann, J.; Korsakov, A.V. Contrasting P-T paths within the Barchi-Kol UHP terrain (Kokchetav Complex): Implications for subduction and exhumation of continental crust. Am. Mineral. 2016, 101, 788–807. [Google Scholar] [CrossRef]
  13. Yuan, H.Q.; Wang, J.; Hattori, K.; Yang, Y.C.; Liu, J.L.; Xie, Z.P. Ultrahigh-pressure metamorphism and P-T-t path of the Yangkou eclogites and granitic gneisses from the central Sulu orogenic belt, eastern China, based on phase equilibria modelling. Int. Geol. Rev. 2022, 1–18. [Google Scholar] [CrossRef]
  14. Powell, R. Constraining the P-T path of a MORB-type eclogite using pseudosections, garnet zoning and garnet-clinopyroxene thermometry: An example from the Bohemian Massif. J. Metamorph. Geol. 2005, 23, 725–743. [Google Scholar]
  15. Carson, C.J.; Powell, R.; Clarke, G.L. Calculated mineral equilibria for eclogites in CaO-Na2O-FeO-MgO-Al2O3-SiO2-H2O: Application to the Poue´bo Terrane, Pam Peninsula, New Caledonia. J. Metamorph. Geol. 1999, 17, 9–24. [Google Scholar] [CrossRef]
  16. White, R.W.; Powell, R.; Holland, T.J.B. Calculation of partial melting equilibria in the system Na2O–CaO–K2O–FeO–MgO–Al2O3–SiO2–H2O (NCKFMASH). J. Metamorph. Geol. 2001, 19, 139–153. [Google Scholar] [CrossRef]
  17. Wei, C.J.; Powell, R.; Zhang, L.F. Eclogites from the south Tianshan, NW China: Petrologic characteristic and calculated mineral equilibria in the Na2O–CaO–FeO–MgO–Al2O3–SiO2–H2O system. J. Metamorph. Geol. 2003, 21, 163–179. [Google Scholar] [CrossRef]
  18. Yang, J.J.; Powell, R. Calculated phase relations in the system Na2O-CaO-K2O-FeO-MgO-Al2O3-SiO2-H2O with applications to UHP eclogites and whiteschists. J. Petrol. 2006, 47, 2047–2071. [Google Scholar] [CrossRef] [Green Version]
  19. Wei, C.J.; Qian, J.H.; Tian, Z.L. Metamorphic evolution of medium-temperature ultra-high pressure (MT-UHP) eclogites from the South Dabie orogen, Central China: An insight from phase equilibria modelling. J. Metamorph. Geol. 2013, 31, 755–774. [Google Scholar] [CrossRef]
  20. Pan, R.; Macris, C.A.; Menold, C.A. Thermodynamic modeling of high-grade metabasites: A case study using the Tso Morari UHP eclogite. Contrib. Mineral. Petrol. 2020, 175, 78. [Google Scholar] [CrossRef]
  21. Zhang, R.Y.; Hirajima, T.; Banno, S.; Cong, B.; Liou, J.G. Petrology of ultrahigh–pressure rocks from the southern Sulu region, eastern China. J. Metamorph. Geol. 1995, 13, 659–675. [Google Scholar] [CrossRef]
  22. Wu, Y.N.; Wang, Y.F. An FTIR study of kyanite in the Maobei kyanite-bearing eclogites from the Sulu orogenic belt, eastern China. J. Earth Sci. 2017, 29, 21–29. [Google Scholar] [CrossRef]
  23. Liu, F.L.; Xu, Z.Q.; Liou, J.G. Tracing the boundary between UHP and HP metamorphic belts in the southwestern Sulu terrane, eastern China: Evidence from mineral inclusions in zircons from metamorphic rocks. Int. Geol. Rev. 2004, 46, 409–425. [Google Scholar] [CrossRef]
  24. Xu, Z.Q.; Zeng, L.S.; Liu, F.L.; Yang, J.S.; Zhang, Z.M.; McWilliams, M.; Liou, J.G. Polyphase subduction and exhumation of the Sulu high-pressure–ultrahigh-pressure metamorphic terrane. Geol. Soc. Am. Special Pap. 2006, 403, 93–113. [Google Scholar]
  25. Ni, J.; Liu, J.; Tang, X.; Yang, H.; Xia, Z.; Guo, Q. The Wulian metamorphic core complex: A newly discovered metamorphic core complex along the Sulu orogenic belt, eastern China. J. Earth Sci. 2013, 24, 297–313. [Google Scholar] [CrossRef]
  26. Ni, J.; Liu, J.; Tang, X.; Yang, H.; Xia, Z.; Zhang, T. Early Cretaceous exhumation of the Sulu orogenic belt as a consequence of the eastern Eurasian tectonic extension: Insights from the newly discovered Wulian metamorphic core complex, eastern China. J. Geol. Soc. 2016, 173, 531–549. [Google Scholar] [CrossRef]
  27. Wang, S.J.; Wang, L.; Brown, M.; Huang, Y. Fluid generation and evolution during exhumation of deeply subducted UHP continental crust: Petrogenesis of composite granite–quartz veins in the Sulu belt, China. J. Metamorph. Geol. 2017, 35, 601–629. [Google Scholar] [CrossRef] [Green Version]
  28. Zhang, R.Y.; Liou, J.G.; Shu, J.F. Hydroxyl-rich topaz in high-pressure and ultrahigh-pressure kyanite quartzites, with retrograde woodhouseite, from the Sulu terrane, eastern China. Am. Mineral. 2002, 87, 445–453. [Google Scholar] [CrossRef]
  29. Liu, F.L.; Liou, J.G. Zircon as the best mineral for P–T–time history of UHP metamorphism: A review on mineral inclusions and U–Pb SHRIMP ages of zircons from the Dabie-Sulu UHP rocks. J. Asian Earth Sci. 2011, 40, 1–39. [Google Scholar] [CrossRef]
  30. Qiu, H.J.; Xu, Z.Q.; Zhang, Z.M.; Yang, J.S.; Yang, T.N.; Zhang, J.X.; Li, H.B. Discovery of aragonite inclusions in garnet in greenschist from high pressure metamorphic belt in northern Jiangsu. Geol. Bull. China 2002, 21, 617–624. [Google Scholar]
  31. Liu, Y.C.; Li, S.G. Detachment in subducted continental crust and multi plate differential exhumation of ultrahigh pressure rocks: A case study of the Dabie Sulu orogenic belt. Chinese Sci. Bull. 2008, 53, 2153–2165. [Google Scholar]
  32. Liu, L.S.; Liu, F.L.; Liu, P.H.; Liu, C.H. Geochemical characteristics and metamorphic evolution of metamafic rocks from Haiyangsuo area, Sulu ultrahigh-pressure metamorphic belt. Acta Petrol. Sin. 2015, 31, 2863–2888. [Google Scholar]
  33. Zhang, R.Y.; Liou, J.G.; Ernst, W. The Dabie-Sulu continental collision zone: A comprehensive review. Gondwana Res. 2009, 16, 1–26. [Google Scholar] [CrossRef]
  34. Zheng, Y.F. Fluid regime in continental subduction zones: Petrological insights from ultrahighpressure metamorphic rocks. J. Geol. Soc. 2009, 166, 763–782. [Google Scholar] [CrossRef]
  35. Liu, L.S.; Liu, F.L.; Wang, W. The polygenetic meta-mafic rocks from the northeast of Sulu ultrahigh-pressure metamorphic belt: Insight from petrology, isotope geochronology and geochemistry. Acta Petrol. Sin. 2017, 33, 2899–2924. [Google Scholar]
  36. Song, C.M.; Jin, Z.M.; Wang, L.M.; Zhang, X.D.; Li, Y.Y. New discovery of the contact between eclogite and country rock in Guanshan, eastern Shandong, and the implications for chronology. Acta Geol. Sin. 2003, 77, 238–243. [Google Scholar]
  37. Liou, J.G.; Zhang, R.Y. Occurrences of intergranular coesite in ultrahigh-P rocks from the Sulu region, eastern China: Implications for lack of fluid during exhumation. Am. Mineral. 1996, 81, 1217–1221. [Google Scholar] [CrossRef]
  38. Wang, L.; Wang, S.J.; Brown, M. On the survival of intergranular coesite in UHP eclogite. J. Metamorph. Geol. 2017, 36, 173–194. [Google Scholar] [CrossRef]
  39. Middlemost, E.A.K. Naming materials in the magma/igneous rock system. Earth Sci. Rev. 1994, 37, 215–224. [Google Scholar] [CrossRef]
  40. Peccerillo, A.; Taylor, S.R. Geochemistry of Eocene calc-alkaline volcanic rocks from the Kastamonu area, Northern Turkey. Contrib. Mineral. Petrol. 1976, 58, 68–81. [Google Scholar] [CrossRef]
  41. Groppo, C.; Rolfo, F.; Liu, Y.C.; Deng, L.P.; Wang, A.D. P-T evolution of elusive UHP eclogites from the Luotian dome (North Dabie Zone, China): How far can the thermodynamic modeling lead us. Lithos 2015, 226, 183–200. [Google Scholar] [CrossRef]
  42. Guo, S.; Chen, Y.; Ye, K.; Su, B.; Yang, Y.H.; Zhang, L.M.; Liu, J.B.; Mao, Q. Formation of multiple high-pressure veins in ultrahigh-pressure eclogite (Hualiangting, Dabie terrane, China): Fluid source, element transfer, and closed-system metamorphic veining. Chem. Geol. 2015, 417, 238–260. [Google Scholar] [CrossRef]
  43. Le Bas, M.J.; Le Maitre, R.W.; Streckeisen, A.; Zanettin, B. A chemical classificatron of volcanic rocks based on the total alkali-silica diagram. J. Petrol. 1986, 27, 745–750. [Google Scholar] [CrossRef] [Green Version]
  44. Sun, S.S.; McDonough, W.F. The composition of the Earth. Chem. Geol. 1995, 120, 223–253. [Google Scholar]
  45. Wei, C.J.; Clarke, G.L. Calculated phase equilibria for MORB compositions: A reappraisal of the metamorphic evolution of lawsonite eclogite. J. Metamorph. Geol. 2011, 29, 939–952. [Google Scholar] [CrossRef]
  46. Powell, R.; Holland, T.; Worley, B. Calculating phase diagram involving solid solutions via non-linear equations, with examples using THERMOCALC. J. Metamorph. Geol. 1998, 16, 577–586. [Google Scholar] [CrossRef]
  47. Holland, T.J.B.; Powell, R. An improved and extended internally consistent thermodynamic dataset for phases of petrological interest, involving a new equation of state for solids. J. Metamorph. Geol. 2011, 29, 333–383. [Google Scholar] [CrossRef]
  48. Green, E.C.R.; White, R.W.; Diener, J.F.A.; Powell, R.; Holland, T.J.B.; Palin, R.M. Activity–composition relations for the calculation of partial melting equilibria in metabasic rocks. J. Metamorph. Geol. 2016, 34, 845–869. [Google Scholar] [CrossRef]
  49. White, R.W.; Powell, R.; Holland, T.J.B.; Johnson, T.E.; Green, E.C.R. New mineral activity- composition relations for thermodynamic calculations in metapelitic systems. J. Metamorph. Geol. 2014, 32, 261–286. [Google Scholar] [CrossRef]
  50. Diener, J.F.A.; Powell, R.; White, R.W.; Holland, T.J.B. A new thermodynamic model for clino- and orthoamphiboles in the system Na2O–CaO–FeO–MgO–Al2O3–SiO2–H2O–O. J. Metamorph. Geol. 2007, 25, 631–656. [Google Scholar] [CrossRef]
  51. Holland, T.J.B.; Powell, R. An internally consistent thermodynamic data set for phases of petrological interest. J. Metamorph. Geol. 1998, 16, 309–343. [Google Scholar] [CrossRef]
  52. Holland, T.J.B.; Powell, R. Activity-composition relations for phases in petrological calculations: An asymmetric multicomponent formulation. Contrib. Mineral. Petrol. 2003, 145, 492–501. [Google Scholar] [CrossRef]
  53. White, R.W.; Powell, R.; Holland, T.J.B.; Worley, B.A. The effect of TiO2 and Fe2O3 on metapelitic assemblages at greenschist and amphibolite facies conditions: Mineral equilibria calculations in the system K2O–FeO–MgO–Al2O3–SiO2–H2O–TiO2–Fe2O3. J. Metamorph. Geol. 2000, 18, 497–511. [Google Scholar] [CrossRef]
  54. Cao, Y.; Song, S.G.; Niu, Y.L.; Jung, H.; Jin, Z.M. Variation of mineral composition, fabric and oxygen fugacity from massive to foliated eclogites during exhumation of subducted ocean crust in the North Qilian suture zone, NW China. J. Metamorph. Geol. 2011, 29, 699–720. [Google Scholar] [CrossRef]
  55. Korhonen, F.J.; Powell, R.; Stout, J.H. Stability of sapphirine plus quartz in the oxidized rocks of the Wilson Lake terrane, Labrador: Calculated equilibria in NCKFMASHTO. J. Metamorph. Geol. 2012, 30, 21–36. [Google Scholar] [CrossRef]
  56. Liu, T.; Wei, C.J. Metamorphic evolution of Archean ultrahigh-temperature mafic granulites from the western margin of Qian’an gneiss dome, eastern Hebei Province, North China Craton: Insights into the Archean tectonic regime. Precambr. Res. 2018, 318, 170–187. [Google Scholar] [CrossRef]
  57. Powell, R.; Holland, T.J.B. On thermobarometry. J Metamorph Geol. 2008, 26, 155–179. [Google Scholar] [CrossRef]
  58. Pearce, J.A. Geochemical fingerprinting of oceanic basalts with applications to ophiolite classification and the search for Archean oceanic crust. Lithos 2008, 100, 14–48. [Google Scholar] [CrossRef]
  59. Wood, D.A. The application of a Th-Hf-Ta diagram to problems of tectonomagmatic classification and to establishing the nature of crustal contamination of basaltic lavas of the British Tertiary Volcanic Province. Earth Planet. Sci. Lett. 1980, 50, 11–30. [Google Scholar] [CrossRef]
  60. Mullen, E.D. MnO/TiO2/P2O5: A minor element discriminant for basaltic rocks of oceanic environments and its implications for petrogenesis. Earth Planet. Sci. Lett. 1983, 62, 53–62. [Google Scholar] [CrossRef]
  61. Cabanis, B.; Lecolle, M. Le diagramme La/10–Y/15–Nb/8: Un outil pour la discrimination des series volcaniques et la mise en evidence des procesus de mélange et/ou de contamination crutale. Comptes Rendus De L’ Acad. Des Sci. Ser. 1989, 309, 2023–2029. [Google Scholar]
  62. Pearce, J.A. Role of the sub-continental lithosphere in the magma genesis at active continental margins. Cont. Basalts Mantle Xenoliths 1983, 20, 230–249. [Google Scholar]
  63. Katsube, A.; Hayasaka, Y.; Santosh, M. SHRIMP zircon U–Pb ages of eclogite and orthogneiss from Sulu ultrahigh-pressure zone in Yangkou area, eastern China. Gondwana Res. 2009, 15, 168–177. [Google Scholar] [CrossRef]
  64. Li, S.G.; Sun, W.D.; Zhang, Z.Q.; Li, Q.L. Nd isotopic disequilibrium between minerals and Rb-Sr age of the secondary phengite in eclogite from the Yangkou area, Qingdao, eastern China. Chinese Sci. Bull. 2001, 46, 252–255. [Google Scholar] [CrossRef]
  65. Zheng, Y.F.; Wu, Y.B.; Chen, F.K.; Gong, B.; Li, L.; Zhao, Z.F. Zircon U–Pb and oxygen isotope evidence for a large-scale 18O depletion event in igneous rocks during the Neoproterozoic. Geochim. Cosmochim. Ac. 2004, 68, 4145–4165. [Google Scholar] [CrossRef]
  66. Zhou, K.; Chen, Y.X.; Ma, H.Z.; Zheng, Y.F.; Xia, X.P. Geochemistry of high-pressure to ultrahigh-pressure granitic melts produced by decompressional melting of deeply subducted continental crust in the Sulu orogen, east-central China. Geochim. Cosmochim. Ac. 2020, 288, 214–247. [Google Scholar] [CrossRef]
  67. Newton, R.C.; Perkins, D. Thermodynamic calibration of geobarometers based on the assemblages garnet–orthopyroxene (clinopyroxene)–plagioclase–quartz. Am. Mineral. 1982, 67, 203–222. [Google Scholar]
  68. Nimis, P.; Taylor, W.R. Single clinopyroxene thermobarometry for garnet peridotites. Part I. Calibration and testing of a Cr-in-Cpx barometer and an enstatite-in-Cpx thermometer. Contrib. Mineral. Petrol. 2000, 139, 541–554. [Google Scholar] [CrossRef]
  69. Wang, L.; Kusky, T.M.; Polat, A.; Wang, S.J.; Jiang, X.F. Partial melting of deeply subducted eclogite from the Sulu orogen in China. Nat. Commun. 2014, 56, 5604. [Google Scholar] [CrossRef] [PubMed] [Green Version]
  70. Guo, S.; Tang, P.; Su, B.; Chen, Y.; Ye, K.; Zhang, L.M.; Gao, Y.J.; Liu, J.B.; Yang, Y.H. Unusual replacement of Fe-Ti oxides by rutile during retrogression in amphibolite-hosted veins (Dabie UHP terrane): A mineralogical record of fluid-induced oxidation processes in exhumed UHP slabs. Am. Mineral. 2017, 102, 2268–2283. [Google Scholar] [CrossRef]
  71. Yang, T.N. Retrograded textures and associated mass transfer: Evidence for aqueous fluid action during exhumation of the Qinglongshan eclogite, Southern Sulu ultrahigh pressure metamorphic terrane, eastern China. J. Metamorph. Geol. 2004, 22, 653–669. [Google Scholar] [CrossRef]
  72. Clarke, G.L.; Powell, R.; Fitsherbert, J.A. The lawsonite paradox: A comparison of field evidence and mineral equilibria modelling. J. Metamorph. Geol. 2006, 24, 716–726. [Google Scholar] [CrossRef]
  73. Pan, R.; Macris, C.A.; Menold, C.A. Fluid evolution during burial and exhumation of the Tso Morari UHP complex, NW India: Constraints from mineralogy, geochemistry, and thermodynamic modeling. Contrib. Mineral. Petrol. 2023, 178, 3. [Google Scholar] [CrossRef]
  74. Faryad, S.W.; Cuthbert, S.J. High-temperature overprint in (U)HPM rocks exhumed from subduction zones; A product of isothermal decompression or a consequence of slab break-off (slab rollback)? Earth-Sci. Rev. 2020, 202, 103108. [Google Scholar] [CrossRef]
  75. Waters, D.J.; Martin, H.N.; The Garnet-Cpx-Phengite Barometer. Recommended Calibration and Calculation Method. 1996. Available online: http://www.earth.ox.ac.uk/Bdavewa/research/eclogites/ecbarcal.html (accessed on 1 January 2021).
  76. Green, T.H.; Hellman, P.L. Fe-Mg partitioning between coexisting garnet and phengite at high pressure, and comments on a garnet-phengite geothermometer. Lithos 1982, 15, 253–266. [Google Scholar] [CrossRef]
  77. Ravna, E.K. The garnet-clinopyroxene geothermometer: An updated calibration. J. Metamorph. Geol. 2000, 18, 211–219. [Google Scholar] [CrossRef] [Green Version]
  78. Eckert, J.O.; Newton, R.C.; Kleppa, O.J. The ∆H of reaction and recalibration of garnet—pyroxene—plagioclase—quartz geobarometers in the CMAS system by solution calorimetry. Am. Mineral. 1991, 76, 148–160. [Google Scholar]
Figure 2. Photomicrographs and BSE images of eclogite samples in the Guanshan and Yangkou. (a) Garnet contain rutile inclusions and rutile breakdown to form ilmenite during the retrograde metamorphism; Sample G-10. (b) Omphacite is subhedral-anhedral granular, with core-rim texture; Sample G-10. (c) The melt phase quartz form ‘strings of beads’ and ‘network vein’ along grain boundaries between garnet and omphacite; sample G-10. (d) Microphotographs of quartz pseudomorphs after coesite; Sample G-11. (e) Phengite occurs as inclusion in garnet; Sample G-11. (f) Melt pseudomorph of plagioclase is located between garnet and omphacite grains with inclusions of omphacite; Sample G-11. (g) Clusters of quartz and feldspar melt inclusions at the core of phengite, and omphacite inclusions in phengite; Sample Y-32. (h) Omphacite breakdown to form amphibole during the retrograde metamorphism; Sample Y-32. (i) Quartz is filled in the fractures of garnet in the form of veinlets which represents initial in-situ melting of quartz; Sample Y-32. (j) Microphotographs of quartz pseudomorphs after coesite; Sample Y-32. The red lines across garnet and omphacite grains show the locations of the zoning profile. Mineral abbreviations: Grt, garnet; Omp, omphacite; Phg, phengite; Amp, amphibole; Pl, plagioclase; Qtz, quartz; Coe, coesite; Rt, rutile; ilm, ilmenite; Sym, symplectite after omphacite.
Minerals 13 00362 g002
Figure 3. Plots of (a) (K2O + Na2O) vs. SiO2 (after [43]) and (b) K2O vs. SiO2 (after [40]). Data of Dabie eclogites are from Groppo et al. [41] and Guo et al. [42]. White diamonds and squares of Yangkou eclogites are from Yuan et al. [13] and Guanshan eclogites are from our unpublished data.
Minerals 13 00362 g003
Figure 4. (a) Chondrite-normalized rare earth element patterns and (b) Primitive mantle-normalized trace element patterns for eclogites from the Guanshan and Yangkou area. Chondrite, primitive mantle, N-MORB, E-MORB and OIB are from Sun and McDonough [44]. Shaded areas of Yangkou are from Yuan et al. [13] and Guanshan are from our unpublished data.
Minerals 13 00362 g004
Figure 5. Compositional profiles of garnet. Xalm = Fe2+/(Fe2++ Mn + Mg + Ca), Xsps = Mn/(Fe2++ Mn + Mg + Ca), Xpy = Mg/(Fe2++ Mn + Mg + Ca) and Xgr = Ca/(Fe2++ Mn + Mg + Ca) across garnet grains from samples (a) G-10 and (b) G-11. Note: Left y-axis shows Xsps, Xpy, and Xgr. Right y-axis shows Xalm.
Minerals 13 00362 g005
Figure 6. The composition zonings of X(o) = Fe2+/(Fe2+ + Mg) and j(o) = Na/(Na + Ca) for omphacite from samples (a) G-10 and (b) G-11. Note: Left y-axis shows X(o). Right y-axis shows j(o).
Minerals 13 00362 g006
Figure 10. (a) Hf/3-Th-Nb/16 diagram [59]. (b) TiO2-MnO ×10-P2O5×10 diagram [60]. (c) Y/15-La/10-Nb/8 diagram [61]. (d) Th/Yb-Ta/Yb diagram [62]. Note: WPT: within plate tholeiites, OIA: ocean island alkalic basalts, WPAB: within plate alkaline basalts,OIT: ocean island tholeiites, VAT: Volcanic arc tholeiites, CBAT: Continental back-arc tholeiites, E-MORB: enriched mid ocean ridge basalts, N-MORB: normal mid-ocean ridge basalts, MORB: mid ocean ridge basalts, OIB: ocean island basalts, SHO: shoshonite, WPB: within plate basalts, IAT: island arc tholeiites, ICA: island calc-alkaline basalts, CAB: calc-alkaline basalts, IAB = island arc alkalic basalts. Symbols of Guanshan and Yangkou ecolgites are the same as in Figure 3.
Minerals 13 00362 g010
Figure 11. The summarized P-T conditions and paths for UHPS (Guanshan) and UHPN (Yangkou) eclogites. Stage-I and Stage-II refer to subduction and exhumation stages, respectively. Domain D-II is from Wang et al. [69] for the Yangkou eclogites. The P-T path labelled with “Dabie” is from Guo et al. [42,70] for the Hualiangting eclogites at Dabie. The boundaries of different metamorphic facies are cited from Wei et al. [19]. The boundary between the Alpine facies series and the Barrovian facies series is defined by the thermal gradients of 10 °C/km. The Alpine facies series is located between the thermal gradients of 5–10 °C/km, corresponding to thermobaric ratios at 165 °C–335 °C/GPa; The Barrovian facies series is located between the thermal gradients of 10–30 °C/km, corresponding to thermobaric ratios at 335 °C–1000 °C/GPa [1].
Minerals 13 00362 g011
Figure 12. Computed modal variations of major minerals and H2O contained in the rock system along the P-T path for the Guanshan eclogites (a) and Yangkou eclogites (b).
Minerals 13 00362 g012
Figure 13. A summary of zircon ages of eclogites in the Sulu area. Metamorphic ages of UHP eclogite facies are from Katsube et al. [63] and Zheng et al. [65], Metamorphic ages of HP/HT eclogite facies retrograde metamorphism are from Zheng et al. [65] and Zhou et al. [66], Metamorphic ages of amphibolite eclogite facies retrograde metamorphism are from Li et al. [64].
Minerals 13 00362 g013
Figure 14. Schematic diagram showing the subduction and decompression process (modified after Wang et al. [69]). Note: NCC = North China Craton; SCLM = subcontinental lithospheric mantle; AM = asthenospheric mantle.
Minerals 13 00362 g014
Table 3. Comparison of the calculated mineral compositions and modal proportions (on one-oxide basis) with those measured in the studied samples.
P (kbar)T (°C)XpyXgrSi (Phg)GrtOmpAmpPhgQtz/CoeLLRtPlIlmLws
Sample G-10 in Figure 7a
A123 600 0.165 0.27 3.49 0.42 0.45 0.08 0.00 0.02 0.02
B122 605 0.165 0.27 3.44 0.42 0.44 0.09 0.00 0.02 0.02
C122 610 0.17 0.27 3.44 0.43 0.45 0.08 0.00 0.02 0.03
D123 600 0.17 0.26 3.49 0.43 0.46 0.07 0.00 0.02 0.03
Sample G-10 in Figure 7b
E112 785 0.16 0.25 0.18 0.24 0.33 0.01 0.10 0.01 0.10 0.02
F112 790 0.165 0.25 0.19 0.24 0.32 0.01 0.11 <0.010.11 0.02
G112 790 0.165 0.24 0.20 0.25 0.31 <0.010.11 0.01 0.10 0.01
H112 780 0.16 0.24 0.20 0.25 0.33 <0.010.10 0.01 0.09 0.01
Measured 0.16–0.170.22–0.253.44–3.490.40 0.49 0.03 0.01 0.04 0.03
Sample G-11 in Figure 8a
A226 605 0.22 0.27 3.49 0.36 0.35 0.14 0.01 0.02 0.01 0.10
B225 605 0.22 0.28 3.45 0.37 0.35 0.14 0.01 0.03 0.01 0.10
C225 615 0.24 0.28 3.40 0.39 0.38 0.11 0.01 0.03 0.01 0.07
D226 615 0.24 0.27 3.45 0.38 0.38 0.10 0.01 0.03 0.01 0.08
R’33 685 0.29 0.27 3.51 0.46 0.46 0.01 0.05 0.01 0.02
Sample G-11 in Figure 8b
E215 805 0.23 0.28 0.30 0.24 0.23 0.02 0.12 0.01 0.08
F214 820 0.23 0.27 0.27 0.22 0.25 0.01 0.12 0.01 0.11
G214 820 0.24 0.27 0.27 0.22 0.25 0.01 0.12 0.01 0.11
H215 805 0.24 0.28 0.30 0.24 0.23 0.02 0.12 0.01 0.08
Measured 0.22–0.240.27–0.273.510 0.48 0.45 0.02 0.01 0.04 0.01
Sample Y-32 in Figure 9a
A325 595 0.18 0.23 3.40 0.19 0.33 0.11 0.13 0.06 0.01 0.17
B324 595 0.18 0.24 3.36 0.20 0.33 0.11 0.13 0.06 0.01 0.16
C325 600 0.19 0.24 3.36 0.21 0.35 0.09 0.13 0.06 0.01 0.15
D326 600 0.19 0.23 3.40 0.20 0.35 0.09 0.13 0.06 0.01 0.16
Sample Y-32 in Figure 9b
E314 770 0.17 0.34 0.17 0.04 0.28 0.02 0.17 0.01 0.31
F313 770 0.17 0.34 0.17 0.04 0.28 0.02 0.17 0.01 0.31
G314 790 0.19 0.32 0.19 0.05 0.24 0.01 0.19 0.01 0.31
H314 786 0.19 0.32 0.20 0.05 0.24 0.01 0.19 0.01 0.30
Measured 0.17–0.190.31–0.363.36–3.400.25 0.45 0.05 0.15 0.05 0.05
Note: A1–3-H1–3, and R’ correspond to labels in Figure 7 and Figure 9.
Table 4. Reported geochronological date for eclogites in the Sulu area.
StageSampleLithologyLocalityAge (Ma)MethodReferences
UHP eclogite faciesYKK1EclogiteYangkou240 ± 56SHRIMP U–PbKatsube et al. [63]
245 ± 38
00LS09EclogiteLanshantou258 ± 25SHRIMP U–PbZheng et al. [65]
241 ± 5
247 ± 5
HP/HT eclogite facies00LS09EclogiteLanshantou215 ± 6SHRIMP U–PbZheng et al. [65]
217 ± 3
219 ± 8
15Q07EclogiteYangkou220 ± 3SHRIMP U–PbZhou et al. [66]
227 ± 3
00QL02EclogiteQinglongshan231 ± 7SHRIMP U–PbZheng et al. [65]
226 ± 7
229 ± 7
Amphibolite faciesY-12EclogiteYangkou195.1 ± 3.8Rb-SrLi et al. [64]
195.6 ± 3.8
193.2 ± 3.7
Disclaimer/Publisher’s Note: The statements, opinions and data contained in all publications are solely those of the individual author(s) and contributor(s) and not of MDPI and/or the editor(s). MDPI and/or the editor(s) disclaim responsibility for any injury to people or property resulting from any ideas, methods, instructions or products referred to in the content.

