
Process Mineralogy of Li-Enriched Pegmatite Combining Laboratory Mineral Separations and SEM-Based Automated Image Analysis

Abstract
:1. Introduction
2. Materials and Methods
2.1. Broad Ore Characterization Study
2.2. Detailed Process Mineralogy
2.3. Analytical Techniques
2.3.1. Chemical Analysis
2.3.2. XRD
2.3.3. SEM-Based Automated Mineralogy (SEM-IA)
2.3.4. LA–ICPMS
3. Results and Discussion
3.1. Broad Ore-Characterization Study
3.2. Combined Samples
3.3. Detailed Process Mineralogy
3.3.1. Sample Composition and Distribution by Size Fractions
3.3.2. Mineralogical Composition
3.3.3. Morphology and Microstructure of Spodumene
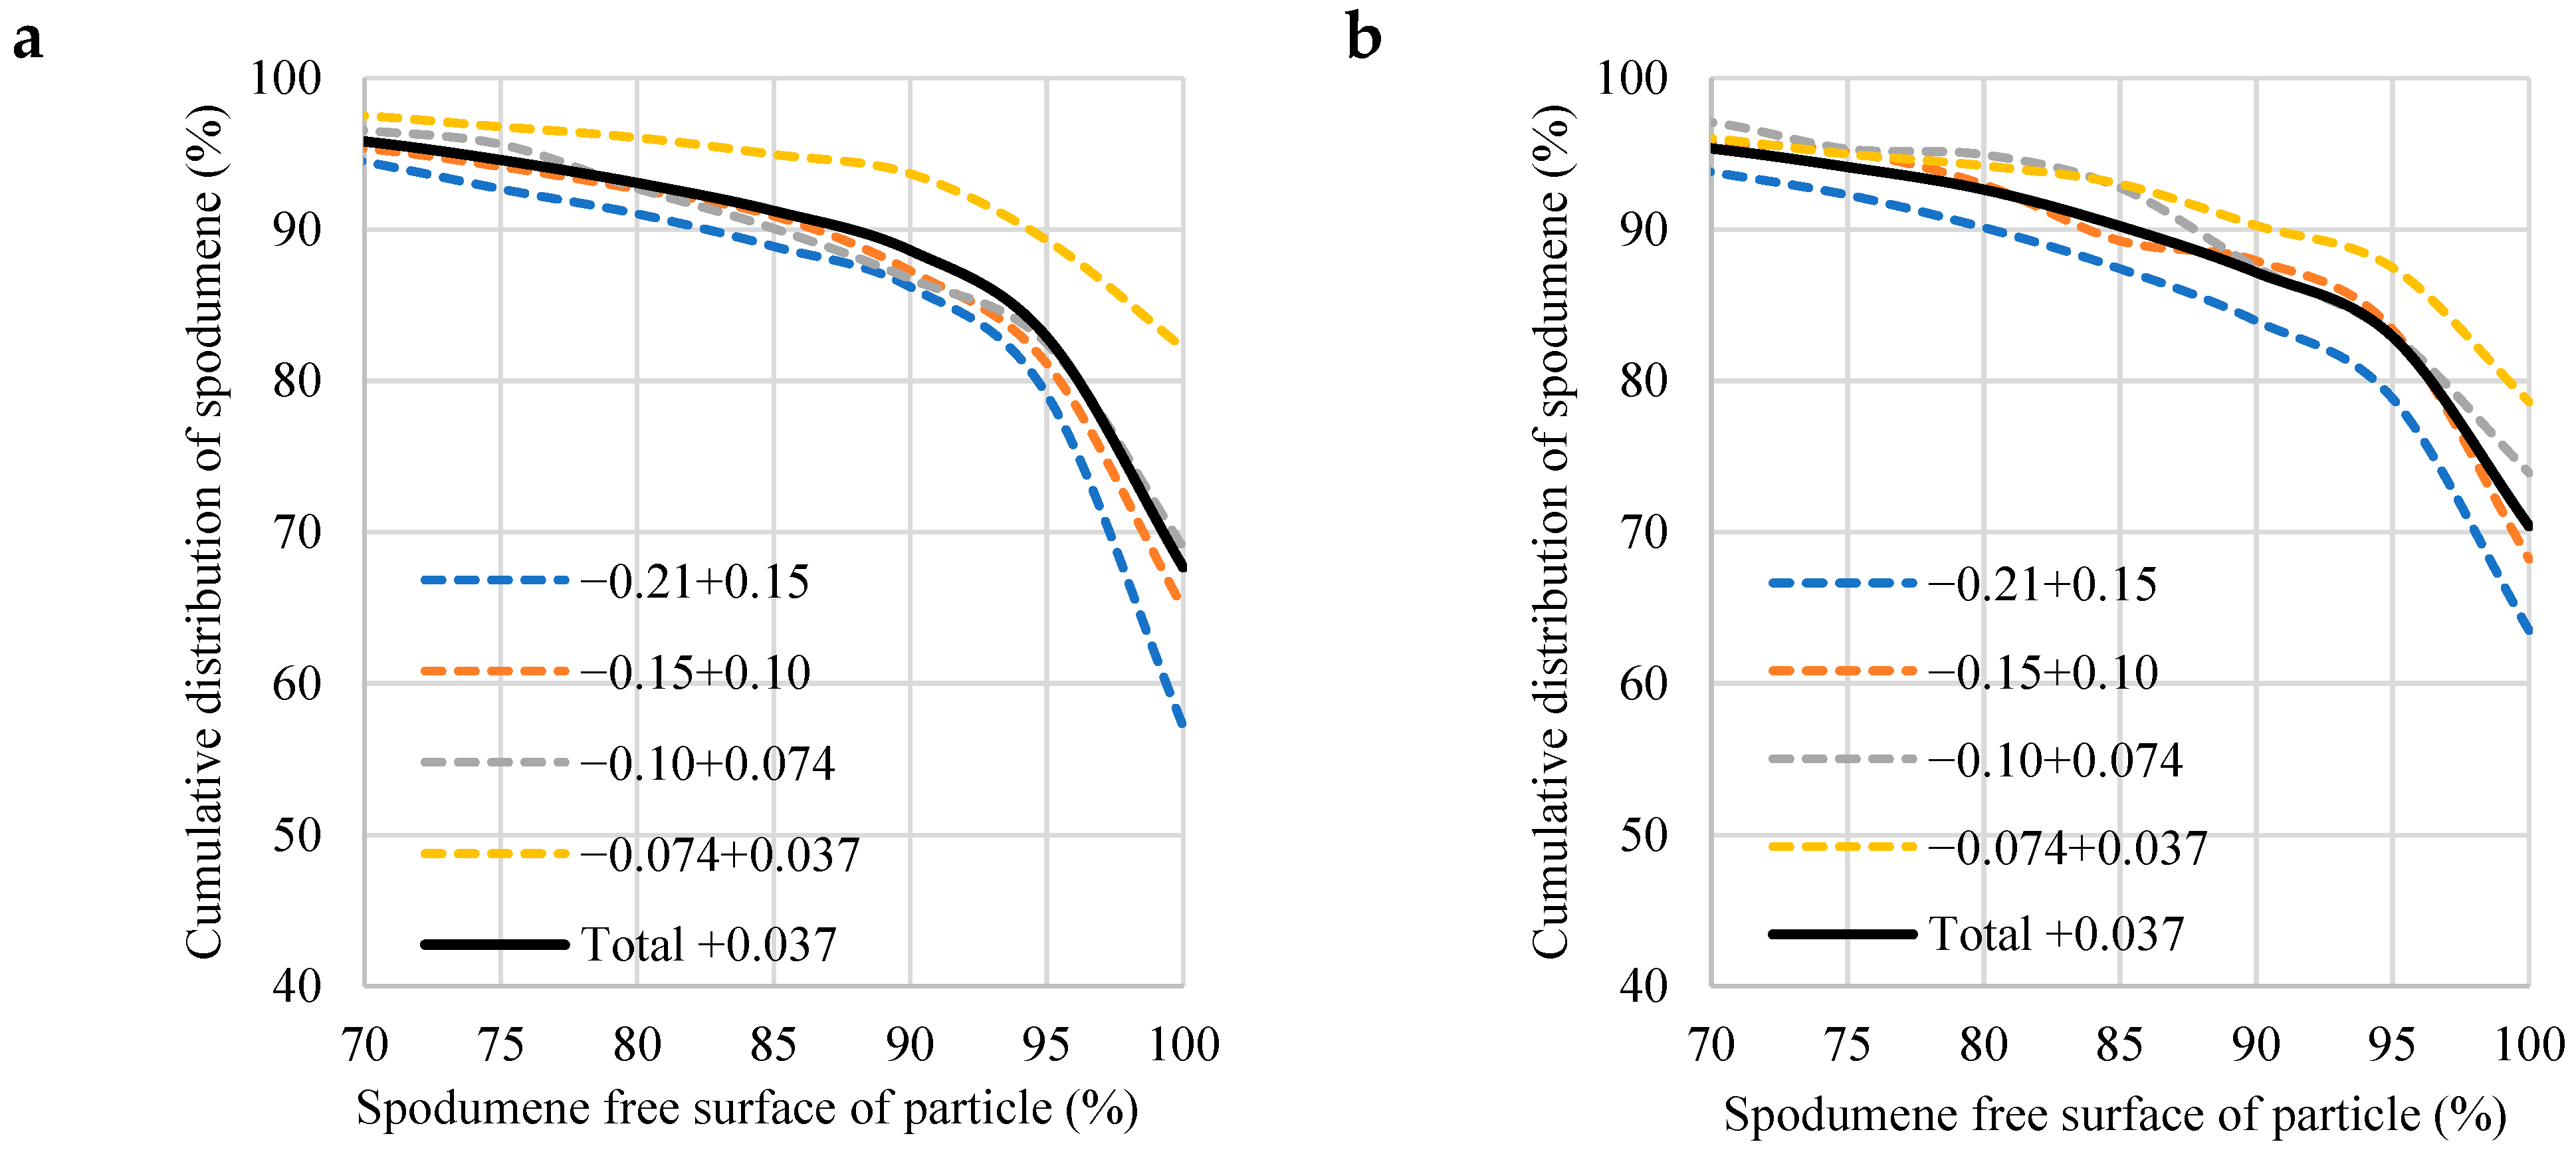
3.3.4. Mineral Liberation and Locking Characteristics
3.3.5. Theoretical Grade Recovery Curve
3.3.6. Mica Composition
3.3.7. Li Deportment in Li-Bearing Minerals
3.3.8. Density Separation
4. Conclusions
Author Contributions
Funding
Data Availability Statement
Acknowledgments
Conflicts of Interest
References
- Kavanagh, L.; Keohane, J.; Cabellos, G.G.; Lloyd, A.; Cleary, J. Global Lithium Sources-Industrial Use and Future in the Electric Vehicle Industry: A Review. Resources 2018, 7, 57. [Google Scholar] [CrossRef] [Green Version]
- Martin, G.; Rentsch, L.; Höck, M.; Bertau, M. Lithium Market Research—Global Supply, Future Demand and Price Development. Energy Storage Mater. 2017, 6, 171–179. [Google Scholar] [CrossRef]
- Paes, V.J.C.; Santos, L.D.; Tedeschi, M.F.; Betiollo, L.M. Avaliação do Potencial do Lítio no Brasil: Área do Médio rio Jequitinhonha, Nordeste de Minas Gerais; CPRM: Belo Horizonte, Brazil, 2016; ISBN 978-85-7499-283-9. [Google Scholar]
- London, D. Ore-Forming Processes within Granitic Pegmatites. Ore Geol. Rev. 2018, 101, 349–383. [Google Scholar] [CrossRef]
- Cerny, P.; Ercit, T.S. The Classification of Granitic Pegmatites Revisited. Can. Mineral. 2005, 43, 2005–2026. [Google Scholar] [CrossRef] [Green Version]
- Ober, A.J. 1994 Minerals Yearbook: Lithium. Available online: https://www.usgs.gov/centers/national-minerals-information-center/lithium-statistics-and-information (accessed on 3 September 2022).
- Bulatovic, S.M. Beneficiation of Lithium Ores. In Handbook of Flotation Reagents: Chemistry, Theory and Practice; Elsevier B.V.: Peterborough, UK, 2014; pp. 41–56. ISBN 9780444530837. [Google Scholar]
- Tadesse, B.; Makuei, F.; Albijanic, B.; Dyer, L. The Beneficiation of Lithium Minerals from Hard Rock Ores: A Review. Min. Eng. 2019, 131, 170–184. [Google Scholar] [CrossRef]
- Bale, M.D.; May, A.V. Processing of Ores to Produce Tantalum and Lithium. Min. Eng. 1989, 2, 299–320. [Google Scholar] [CrossRef]
- Evans, K. Lithium. In Critical Metals Handbook; John Wiley & Sons, Ltd.: Hoboken, NJ, USA, 2014; ISBN 9781118755341. [Google Scholar]
- CBL Produção de Compostos de Lítio No Brasil. Available online: https://www.cetem.gov.br/images/eventos/2016/ii_litio_brasil/apresentacoes/6-producao_de_compostos_de_litio_br.pdf (accessed on 8 June 2020).
- AMG Lithium Project Update. Available online: https://amg-nv.com/wp-content/uploads/AMG-Lithium-FINAL.pdf (accessed on 10 June 2020).
- Brandt, F.; Haus, R. New Concepts for Lithium Minerals Processing. Min. Eng. 2010, 23, 659–661. [Google Scholar] [CrossRef]
- Choubey, P.K.; Kim, M.S.; Srivastava, R.R.; Lee, J.C.; Lee, J.Y. Advance Review on the Exploitation of the Prominent Energy-Storage Element: Lithium. Part I: From Mineral and Brine Resources. Min. Eng. 2016, 89, 119–137. [Google Scholar] [CrossRef]
- Oliazadeh, M.; Aghamirian, M.; Ali, S.; Legault, E.; Gibson, C. Flowsheet Development for Benefication of Lithium Minerals from Hard Rock Deposits. In Global Conference on Extractive Metallurgy the Minerals, Metals & Materials Series; Springer International Publishing: Pittsburgh, PA, USA, 2018; pp. 2293–2307. [Google Scholar]
- Gibson, C.; Aghamirian, M.; Grammatikopoulos, T. The Beneficiation of Lithium Minerals from Hard Rock Deposits. Min Eng. 2017, 69, 18–37. [Google Scholar]
- Jaskula, B.W. 2015 Minerals Yearbook: Lithium. Available online: https://minerals.usgs.gov/minerals/pubs/commodity/lithium/myb1-2015-lithi.pdf (accessed on 25 February 2021).
- Albermale SC7-2 ALBEMARLE. Available online: https://www.albemarle.com/products/spodumene-concentrate-sc-72-premium (accessed on 20 January 2023).
- Garrett, D.E. Handbook of Lithium and Natural Calcium Chloride Uses and Properties; Elsevier B.V.: Peterborough, UK, 2004. [Google Scholar]
- Tran, T.; Luong, V.T. Lithium Production Processes. In Lithium Process Chemistry; Elsevier Inc.: Gwangju, Korea, 2015; pp. 81–124. ISBN 9780128014172. [Google Scholar]
- Rebouças, L.B.; Souza, M.T.; Raupp-Pereira, F.; Novaes De Oliveira, A.P. Characterization of Li2O-Al2O3-SiO2 Glass-Ceramics Produced from a Brazilian Spodumene Concentrate. Ceramica 2019, 65, 366–377. [Google Scholar] [CrossRef] [Green Version]
- Aylmore, M.G. Assessment of Lithium Pegmatite Ore Bodies to Determine Their Amenability to Processing for the Extraction of Lithium. In Global Conference on Extractive Metallurgy the Minerals, Metals & Materials Series; Springer: Cham, Switzerland, 2018; pp. 2261–2279. [Google Scholar]
- Sweetapple, M.T.; Tassios, S. Laser-Induced Breakdown Spectroscopy (LIBS) as a Tool for in Situ Mapping and Textural Interpretation of Lithium in Pegmatite Minerals. Am. Mineral. 2015, 100, 2141–2151. [Google Scholar] [CrossRef]
- Grammatikopoulos, T.; Aghamirian, M.; Fedikow, M.; Mayo, T. Mineralogical Characterization and Preliminary Beneficiation of the Zoro Lithium Project, Manitoba, Canada. Min. Met. Explor. 2021, 38, 329–346. [Google Scholar] [CrossRef]
- Aylmore, M.G.; Merigot, K.; Quadir, Z.; Rickard, W.D.A.; Evans, N.J.; McDonald, B.J.; Catovic, E.; Spitalny, P. Applications of Advanced Analytical and Mass Spectrometry Techniques to the Characterisation of Micaceous Lithium-Bearing Ores. Min. Eng. 2018, 116, 182–195. [Google Scholar] [CrossRef]
- Aylmore, M.G.; Merigot, K.; Rickard, W.D.A.; Evans, N.J.; McDonald, B.J.; Catovic, E.; Spitalny, P. Assessment of a Spodumene Ore by Advanced Analytical and Mass Spectrometry Techniques to Determine Its Amenability to Processing for the Extraction of Lithium. Min. Eng. 2018, 119, 137–148. [Google Scholar] [CrossRef] [Green Version]
- Sandmann, D.; Gutzmer, J. Use of Mineral Liberation Analysis (MLA) in the Characterization of Lithium-Bearing Micas. J. Miner. Mater. Charact. Eng. 2013, 1, 285–292. [Google Scholar] [CrossRef] [Green Version]
- Nascimento, L.S.; Neumann, R.; Ávila, C.A. Mineralogia do Pegmatito da Volta Grande, Região de Nazareno, Minas Gerais: Resultados Preliminares e Inclusões Minerais em Minerais Pesados. In Proceedings of the XXIII—Jornada de Iniciação Cientifica CETEM, Rio de Janeiro, Brazil, 17–21 October 2016. [Google Scholar]
- Leißner, T.; Bachmann, K.; Gutzmer, J.; Peuker, U.A. MLA-Based Partition Curves for Magnetic Separation. Min. Eng. 2016, 94, 94–103. [Google Scholar] [CrossRef]
- Wikedzi, A. Comminution Characteristics of Lithium Bearing Mica Ores From Different Devices. Tanzan. J. Eng. Technol. 2020, 39, 21–31. [Google Scholar] [CrossRef]
- Fandrich, R.; Gu, Y.; Burrows, D.; Moeller, K. Modern SEM-Based Mineral Liberation Analysis. Int. J. Min. Process 2007, 84, 310–320. [Google Scholar] [CrossRef]
- Brown, T.; Walter, A.; Idoine, N.; Gunn, G.; Shaw, R.A.; Rayner, D. Mineral Profile: Lithium. Available online: https://www2.bgs.ac.uk/mineralsuk/download/mineralProfiles/lithium_profile.pdf?_ga=2.71957466.851626622.1677422301-1961346163.1677422282 (accessed on 25 February 2021).
- Munson, G.A.; Clarke, F.F. Heavy-Media Separation Plant and Mine Area Mining and Concentrating Spodumene In the Black Hills, South Dakota. Min. Eng. 1955, 202, 1041–1045. [Google Scholar]
- McIvor, R.E.; Finch, J.A. A Guide to Interfacing of Plant Grinding and Flotation Operations. Min. Eng. 1991, 4, 9–23. [Google Scholar] [CrossRef]
- Gottlieb, P.; Wilkie, G.; Sutherland, D.; Ho-Tun, E.; Suthers, S.; Perera, K.; Jenkins, B.; Spencer, S.; Butcher, A.; Rayner, J. Using Quantitative Electron Microscopy for Process Mineralogy Applications. JOM 2000, 52, 24–25. [Google Scholar] [CrossRef]
- Foster, M.D. Interpretation of the Composition of Lithium Micas. Geol. Surv. Prof. Pap. 1960, 354, 115–146. [Google Scholar]
- Choi, J.; Kim, W.; Chae, W.; Kim, S.B.; Kim, H. Electrostatically Controlled Enrichment of Lepidolite via Flotation. Mater. Trans. 2012, 53, 2191–2194. [Google Scholar] [CrossRef] [Green Version]


| Plant | Main Minerals | Main Gangue | Feed Li2O wt%t | Conc. Li2O wt% | Beneficiation Method | Reference |
|---|---|---|---|---|---|---|
| Greenbushes, Australia | Spodumene, cassiterite, tantalite | Tur | 4.0 | 7.5–7.7 | Flot/MS/ST | [8] |
| Kings Mountain, CA, USA | Spodumene | Alb, qtz, mus | 1.4–1.5 | 6.3 | Flot | [8] |
| Bernic Lake, MB, Canada | Spodumene, amblygonite, tantalite | Alb, qtz | 3.22 | 7.25 | DMS/GS/ Flot/MS | [8] |
| Bikita, Zimbabwe | Petalite, lepidolite, amblygonite, eucryptite | n.d. | 4.2 | 4.5–7.3 | DMS | [8] |
| Bald Hill, Australia | Spodumene, tantalite | Mus | 1.18 | 6.5 | DMS | [8] |
| CBL, Brazil | Spodumene | n.d. | 1.4 | 5.0 | DMS | [11] |
| Mibra, Brazil | Spodumene, cassiterite, tantalite | Alb, qtz, mus | 1.01 | 5.5 | Flot/MS | [12] |
| MT01 | MT02 | MT03 | MT04 | MT05 | MT06 | MT07 | MT08 | MT09 | MT10 | ||
|---|---|---|---|---|---|---|---|---|---|---|---|
| Compounds (%w; XRF / ICP OES) | LiO2 | 1.08 | 1.45 | 1.74 | 1.43 | 0.25 | 1.51 | 0.93 | 0.75 | 0.75 | 0.58 |
| SiO2 | 70.50 | 74.50 | 71.10 | 73.50 | 71.90 | 73.40 | 74.30 | 71.70 | 73.70 | 73.60 | |
| Fe2O3 | 0.28 | 0.20 | 0.43 | 0.28 | 0.51 | 0.45 | 0.65 | 0.65 | 0.81 | 1.10 | |
| Al2O3 | 16.86 | 15.09 | 6.98 | 15.48 | 16.22 | 15.49 | 15.02 | 16.16 | 15.59 | 13.37 | |
| CaO | 0.36 | 0.30 | 0.63 | 0.32 | 0.31 | 0.34 | 0.64 | 0.46 | 0.63 | 1.30 | |
| MgO | <0.01 | <0.01 | <0.01 | <0.01 | <0.01 | <0.01 | <0.01 | <0.01 | 0.36 | 0.34 | |
| Na2O | 4.52 | 3.94 | 3.55 | 4.11 | 4.42 | 3.62 | 4.72 | 5.11 | 4.91 | 4.68 | |
| K2O | 2.66 | 1.63 | 1.78 | 1.68 | 1.23 | 1.85 | 1.64 | 1.90 | 1.71 | 1.14 | |
| F | 1.03 | 0.71 | 0.92 | 0.44 | - | - | - | - | - | - | |
| Rb2O | 1.14 | 0.84 | 0.91 | 0.66 | 0.32 | 0.66 | 0.49 | 0.45 | 0.50 | 0.38 | |
| Minerals (%) | quartz | 30.02 | 37.66 | 31.08 | 34.57 | 40.10 | 33.55 | 33.84 | 31.85 | 32.55 | 39.64 |
| albite | 33.81 | 29.22 | 26.94 | 29.46 | 39.68 | 28.10 | 38.36 | 40.16 | 39.77 | 37.79 | |
| mica | 27.28 | 19.02 | 19.84 | 16.38 | 14.03 | 16.05 | 13.10 | 16.11 | 14.26 | 10.73 | |
| spodumene | 6.83 | 12.94 | 18.77 | 17.90 | 2.88 | 19.30 | 10.38 | 6.89 | 9.14 | 5.02 | |
| K-feldspar | 0.83 | 0.42 | 0.38 | 0.88 | 0.20 | 1.83 | 1.77 | 2.79 | 1.93 | 0.88 | |
| epidote | 0.27 | 0.16 | 2.14 | 0.30 | 0.32 | 0.66 | 1.83 | 1.19 | 0.89 | 4.71 | |
| garnet | 0.09 | 0.03 | 0.05 | 0.11 | 0.10 | 0.06 | 0.18 | 0.24 | 1.03 | 0.66 | |
| apatite | 0.24 | 0.14 | 0.25 | 0.16 | 0.12 | 0.20 | 0.26 | 0.14 | 0.19 | 0.34 | |
| cassiterite | 0.23 | 0.02 | 0.02 | 0.01 | 0.01 | 0.03 | 0.06 | 0.04 | 0.07 | 0.05 | |
| kaolinite | 0.01 | 0.02 | 0.05 | 0.02 | 2.24 | 0.01 | 0.01 | 0.44 | 0.01 | 0.00 | |
| microlite | 0.06 | 0.18 | 0.20 | 0.08 | 0.03 | 0.03 | 0.07 | 0.05 | 0.06 | 0.05 | |
| coltan | 0.01 | 0.00 | 0.13 | 0.01 | 0.06 | 0.01 | 0.02 | 0.02 | 0.04 | 0.02 | |
| Other * | 0.30 | 0.18 | 0.13 | 0.10 | 0.22 | 0.17 | 0.09 | 0.07 | 0.05 | 0.10 |
| Compound (%w; XRF/ICP–OES) | ||||||||
|---|---|---|---|---|---|---|---|---|
| Element | Li2O | Fe2O3 | SiO2 | Al2O3 | CaO | K2O | R2 | |
| MT01 | SEM-IA | 1.14 | 0.07 | 70.86 | 18.19 | 0.41 | 3.00 | 0.99 |
| CA | 1.01 | 0.26 | 70.08 | 16.95 | 0.24 | 2.77 | ||
| MT02 | SEM-IA | 1.48 | 0.06 | 75.03 | 16.14 | 0.23 | 2.10 | 0.99 |
| CA | 1.50 | 0.16 | 74.73 | 15.05 | 0.18 | 1.68 | ||
| MT03 | SEM-IA | 1.94 | 0.29 | 71.77 | 17.99 | 0.79 | 2.14 | 0.99 |
| CA | 1.97 | 0.32 | 71.32 | 16.65 | 0.54 | 1.79 | ||
| MT04 | SEM-IA | 1.78 | 0.10 | 74.53 | 16.61 | 0.21 | 1.85 | 0.99 |
| CA | 1.64 | 0.39 | 75.64 | 14.81 | 0.26 | 1.85 | ||
| MT05 | SEM-IA | 0.40 | 0.18 | 77.00 | 13.89 | 0.24 | 1.30 | 1.00 |
| CA | 0.28 | 0.47 | 77.36 | 13.70 | 0.26 | 1.35 | ||
| MT06 | SEM-IA | 1.90 | 0.22 | 73.96 | 16.88 | 0.35 | 1.98 | 0.99 |
| CA | 1.68 | 0.38 | 76.86 | 14.73 | 0.31 | 1.92 | ||
| MT07 | SEM-IA | 1.07 | 0.32 | 74.52 | 15.59 | 0.68 | 1.59 | 0.99 |
| CA | 0.84 | 0.53 | 76.88 | 13.78 | 0.56 | 1.63 | ||
| MT08 | SEM-IA | 0.85 | 0.29 | 73.57 | 16.17 | 0.43 | 2.07 | 0.99 |
| CA | 0.68 | 0.59 | 75.73 | 14.62 | 0.37 | 2.05 | ||
| MT09 | SEM-IA | 0.97 | 0.25 | 74.09 | 15.80 | 0.48 | 1.72 | 0.99 |
| CA | 0.77 | 0.55 | 76.49 | 14.49 | 0.52 | 1.62 | ||
| MT10 | SEM-IA | 0.58 | 0.56 | 76.03 | 3.95 | 1.54 | 1.18 | 0.99 |
| CA | 0.53 | 0.83 | 77.54 | 12.62 | 1.14 | 1.19 | ||
| Compound (wt%; XRF/ICP–OES) | ||||||||||
|---|---|---|---|---|---|---|---|---|---|---|
| Element | LiO2 | Fe2O3 | SiO2 | Al2O3 | CaO | MgO | MnO | Na2O | K2O | LOI |
| Group 1 | 1.26 | 0.32 | 73.0 | 15.6 | 0.43 | <0.10 | 0.17 | 3.74 | 1.76 | 2.73 |
| Group 2 | 0.62 | 0.74 | 74.0 | 14.5 | 0.76 | 0.20 | 0.11 | 4.56 | 1.55 | 2.36 |
| Fraction (mm) | Mass Retained (%) | Compound (wt%) | Deportment (%) | |||||||||||
|---|---|---|---|---|---|---|---|---|---|---|---|---|---|---|
| Li2O | Fe2O3 | CaO | Li2O | Fe2O3 | CaO | |||||||||
| G1 | G2 | G1 | G2 | G1 | G2 | G1 | G2 | G1 | G2 | G1 | G2 | G1 | G2 | |
| −0.21 + 0.15 | 24.3 | 22.7 | 1.45 | 0.75 | 0.28 | 0.58 | 0.26 | 0.52 | 27.5 | 25.2 | 20.1 | 17.5 | 14.8 | 15.3 |
| −0.15 + 0.105 | 17.3 | 16.3 | 1.38 | 0.66 | 0.26 | 0.50 | 0.30 | 0.57 | 18.6 | 16.0 | 13.3 | 10.8 | 12.2 | 12.1 |
| −0.105 + 0.074 | 11.4 | 12.2 | 1.26 | 0.65 | 0.26 | 0.56 | 0.33 | 0.67 | 11.2 | 11.7 | 8.74 | 9.07 | 8.81 | 10.6 |
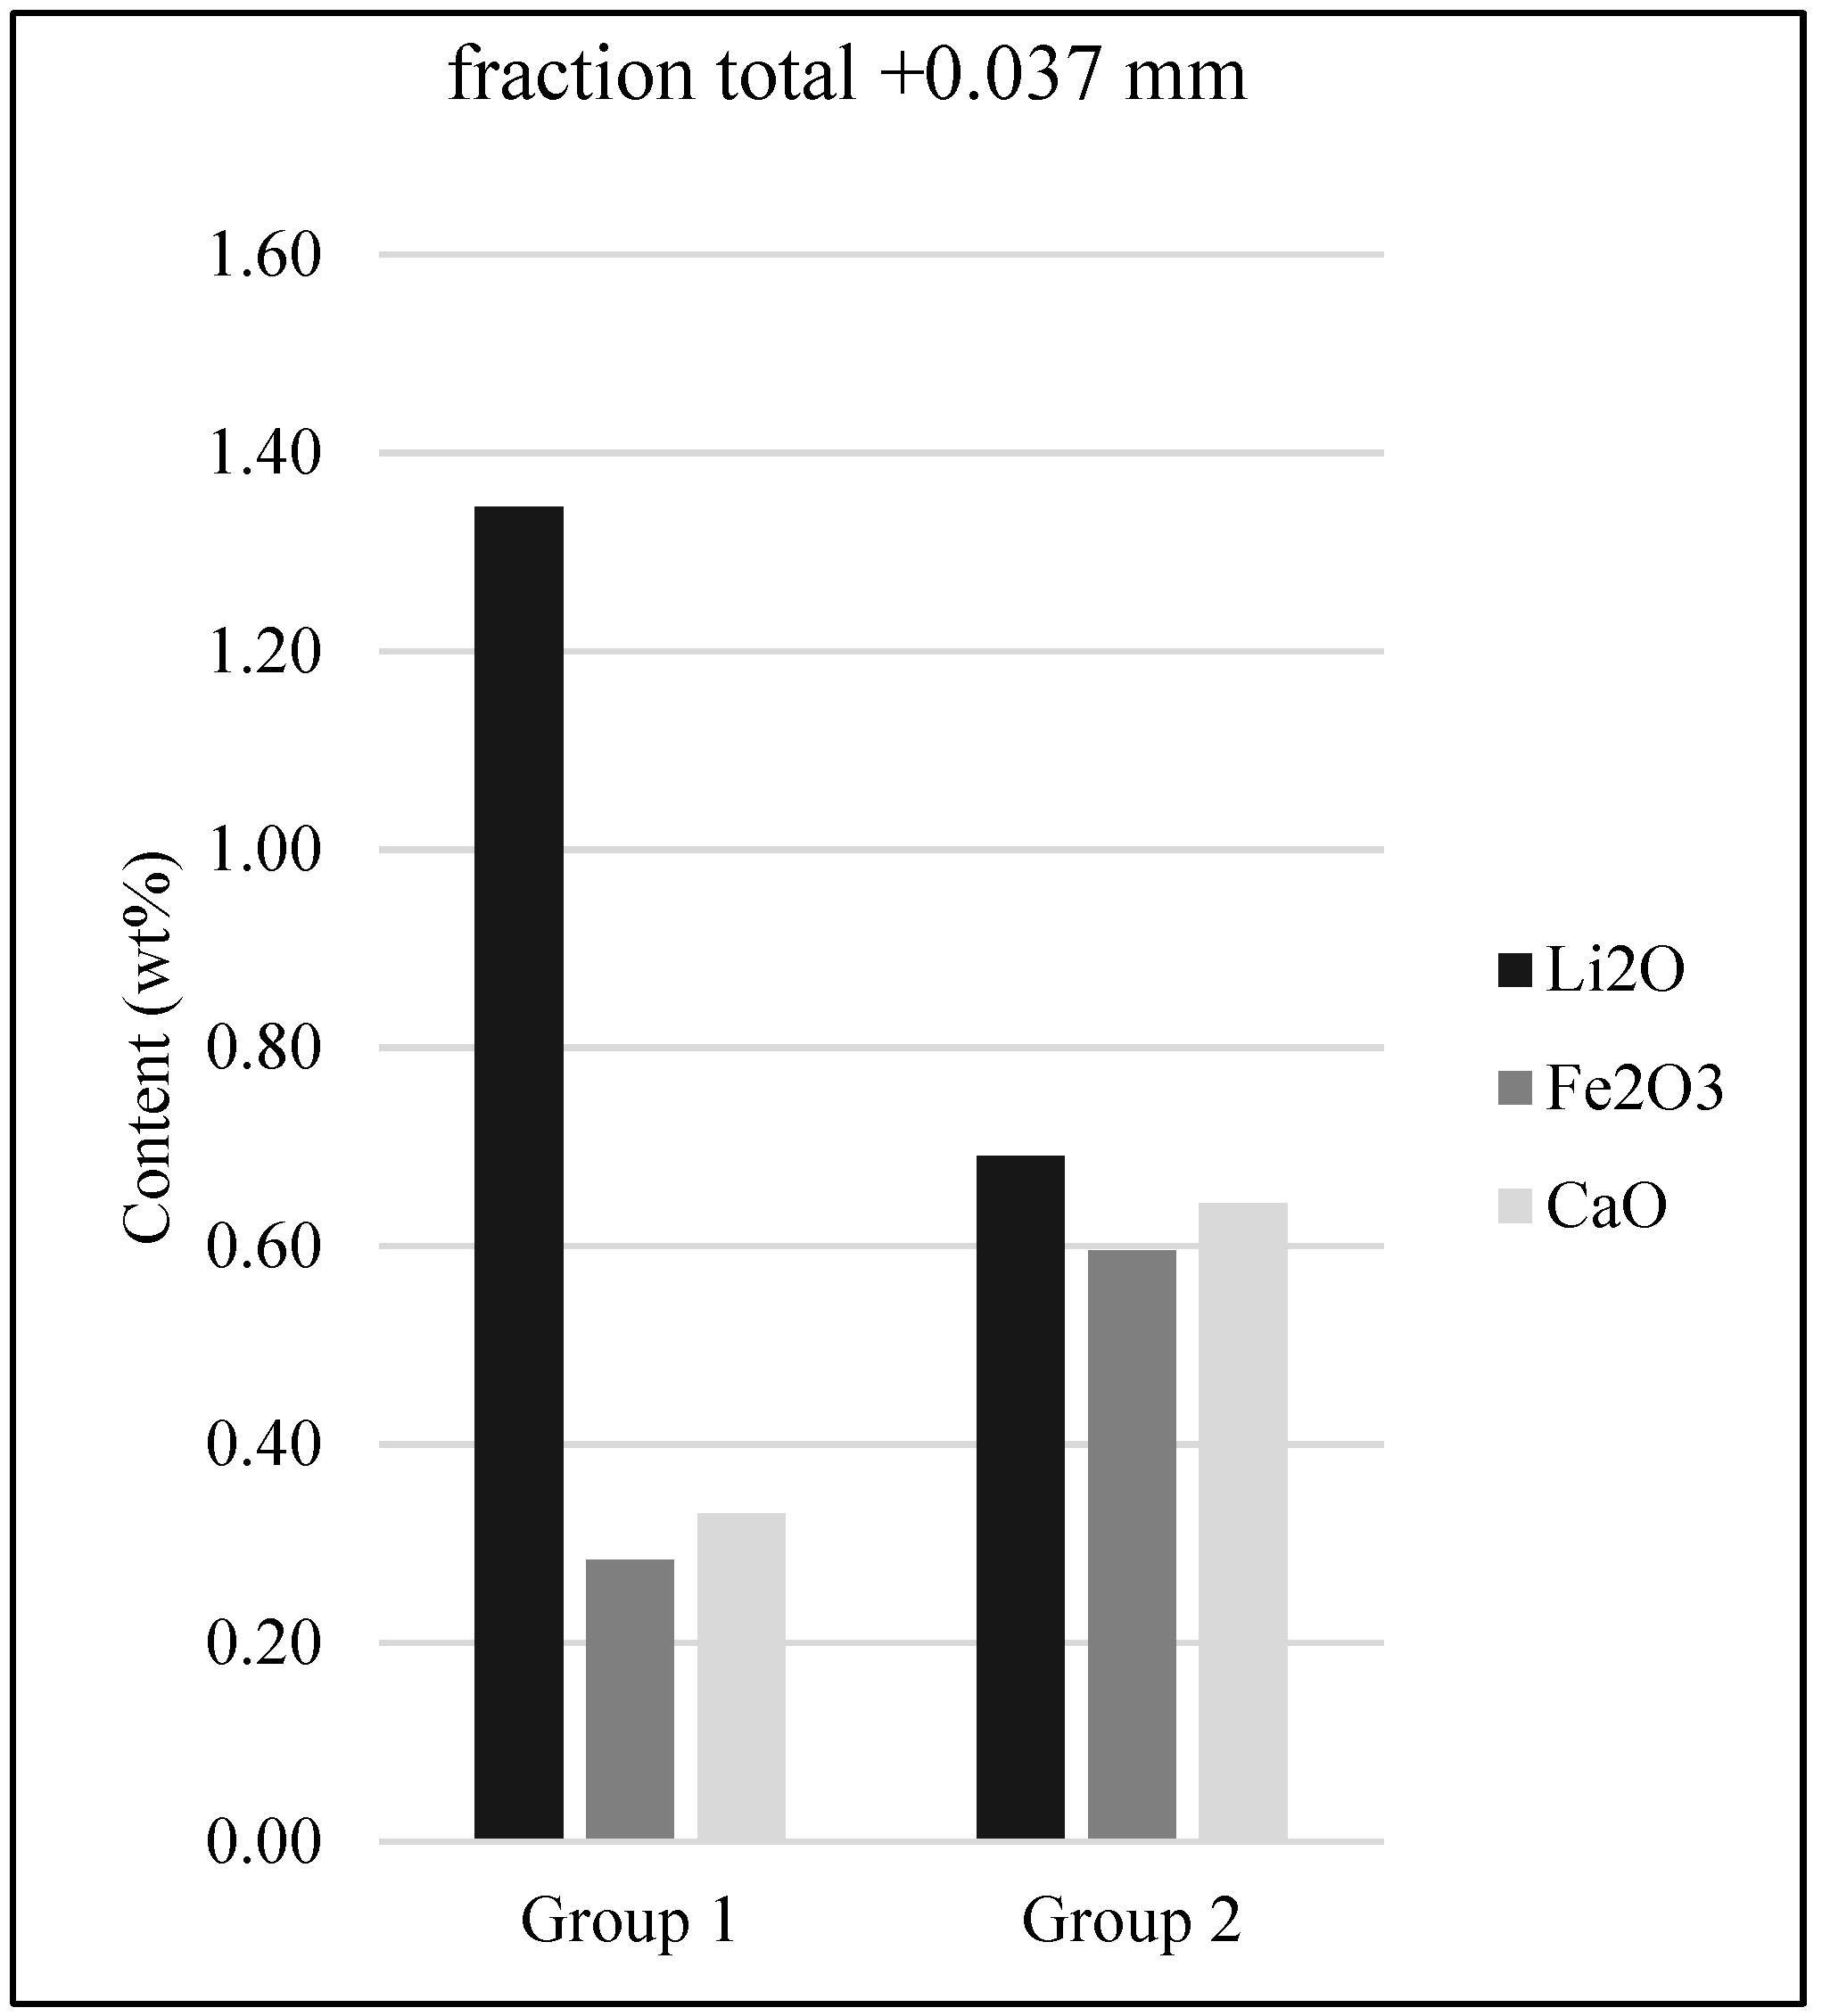
| −0.074 + 0.037 | 20.6 | 22.1 | 1.25 | 0.68 | 0.32 | 0.70 | 0.44 | 0.81 | 20.0 | 22.1 | 19.5 | 20.6 | 21.2 | 23.2 |
| −0.037 | 26.5 | 26.7 | 1.09 | 0.63 | 0.49 | 1.18 | 0.69 | 1.12 | 22.6 | 25.0 | 38.4 | 42.0 | 42.9 | 38.8 |
| Total + 0.037 | 73.5 | 73.3 | 1.34 | 0.69 | 0.28 | 0.60 | 0.33 | 0.64 | 77.4 | 75.0 | 61.6 | 58.0 | 57.1 | 61.2 |
| Total sample | 100 | 100 | 1.28 | 0.68 | 0.34 | 0.75 | 0.43 | 0.77 | 100 | 100 | 100 | 100 | 100 | 100 |
| Content (wt%) | ||||||||
|---|---|---|---|---|---|---|---|---|
| Muscovite | Li2O | F | Al2O3 | SiO2 | K2O | FeO | Fe2O3 | Rb2O |
| Mean | 0.48 | 0.22 | 36.9 | 47.0 | 10.1 | 2.33 | 2.61 | 3.25 |
| SD | 0.20 | 0.69 | 1.88 | 1.27 | 0.46 | 1.21 | 1.32 | 0.70 |
| Maximum | 0.95 | 2.78 | 40.8 | 50.28 | 11.2 | 5.47 | 6.08 | 4.23 |
| Minimum | 0.13 | 0.00 | 31.25 | 44.3 | 8.75 | 0.11 | 0.30 | 1.05 |
| Lepidolite | ||||||||
| Mean | 3.10 | 1.56 | 30.9 | 50.0 | 9.83 | 1.26 | 1.28 | 4.86 |
| SD | 1.34 | 2.83 | 3.47 | 2.81 | 0.60 | 1.89 | 2.15 | 0.95 |
| Maximum | 5.75 | 9.49 | 37.3 | 54.10 | 11.2 | 8.76 | 9.73 | 6.67 |
| Minimum | 1.25 | 0.00 | 24.0 | 44.8 | 8.93 | 0.24 | 0.00 | 2.65 |
Disclaimer/Publisher’s Note: The statements, opinions and data contained in all publications are solely those of the individual author(s) and contributor(s) and not of MDPI and/or the editor(s). MDPI and/or the editor(s) disclaim responsibility for any injury to people or property resulting from any ideas, methods, instructions or products referred to in the content. |
© 2023 by the authors. Licensee MDPI, Basel, Switzerland. This article is an open access article distributed under the terms and conditions of the Creative Commons Attribution (CC BY) license (https://creativecommons.org/licenses/by/4.0/).
Share and Cite
Timich, M.; Contessotto, R.; Ulsen, C. Process Mineralogy of Li-Enriched Pegmatite Combining Laboratory Mineral Separations and SEM-Based Automated Image Analysis. Minerals 2023, 13, 343. https://doi.org/10.3390/min13030343
Timich M, Contessotto R, Ulsen C. Process Mineralogy of Li-Enriched Pegmatite Combining Laboratory Mineral Separations and SEM-Based Automated Image Analysis. Minerals. 2023; 13(3):343. https://doi.org/10.3390/min13030343
Chicago/Turabian StyleTimich, Marco, Renato Contessotto, and Carina Ulsen. 2023. "Process Mineralogy of Li-Enriched Pegmatite Combining Laboratory Mineral Separations and SEM-Based Automated Image Analysis" Minerals 13, no. 3: 343. https://doi.org/10.3390/min13030343