

Geochemistry of Waziristan Ophiolite Complex, Pakistan: Implications for Petrogenesis and Tectonic Setting

 , , ,
, , , 
Abstract
:1. Introduction
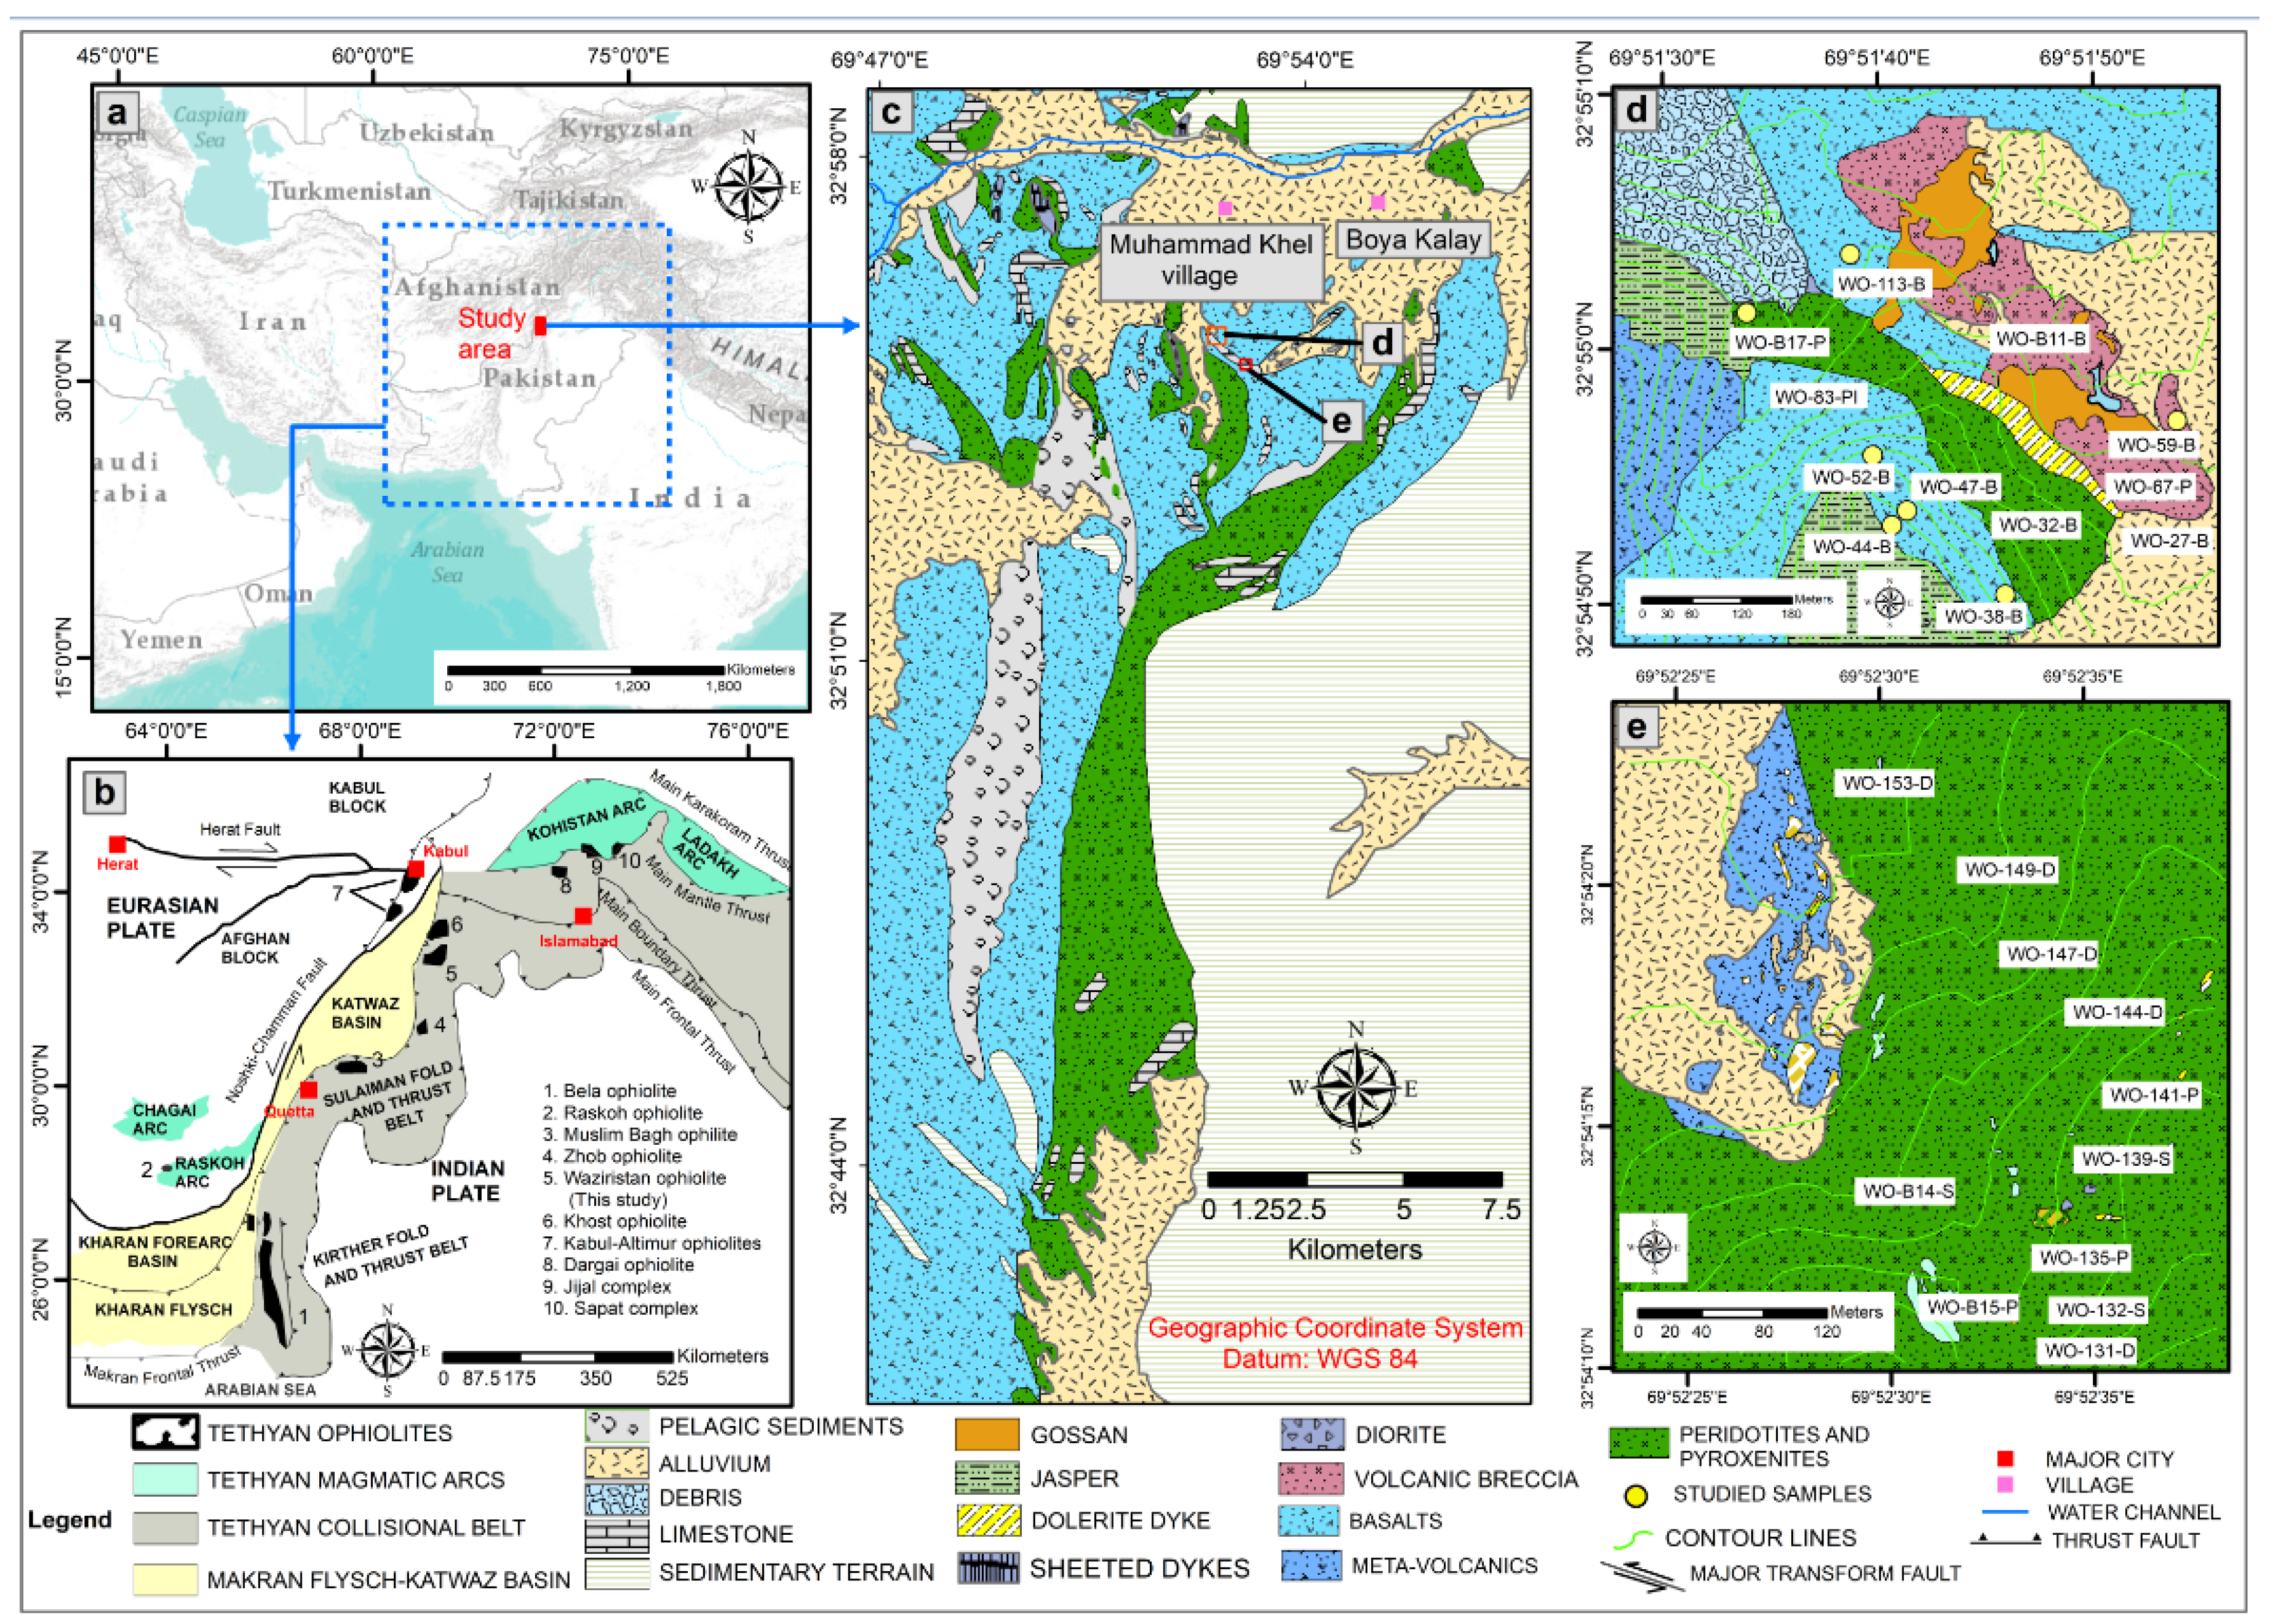
2. Regional Geology

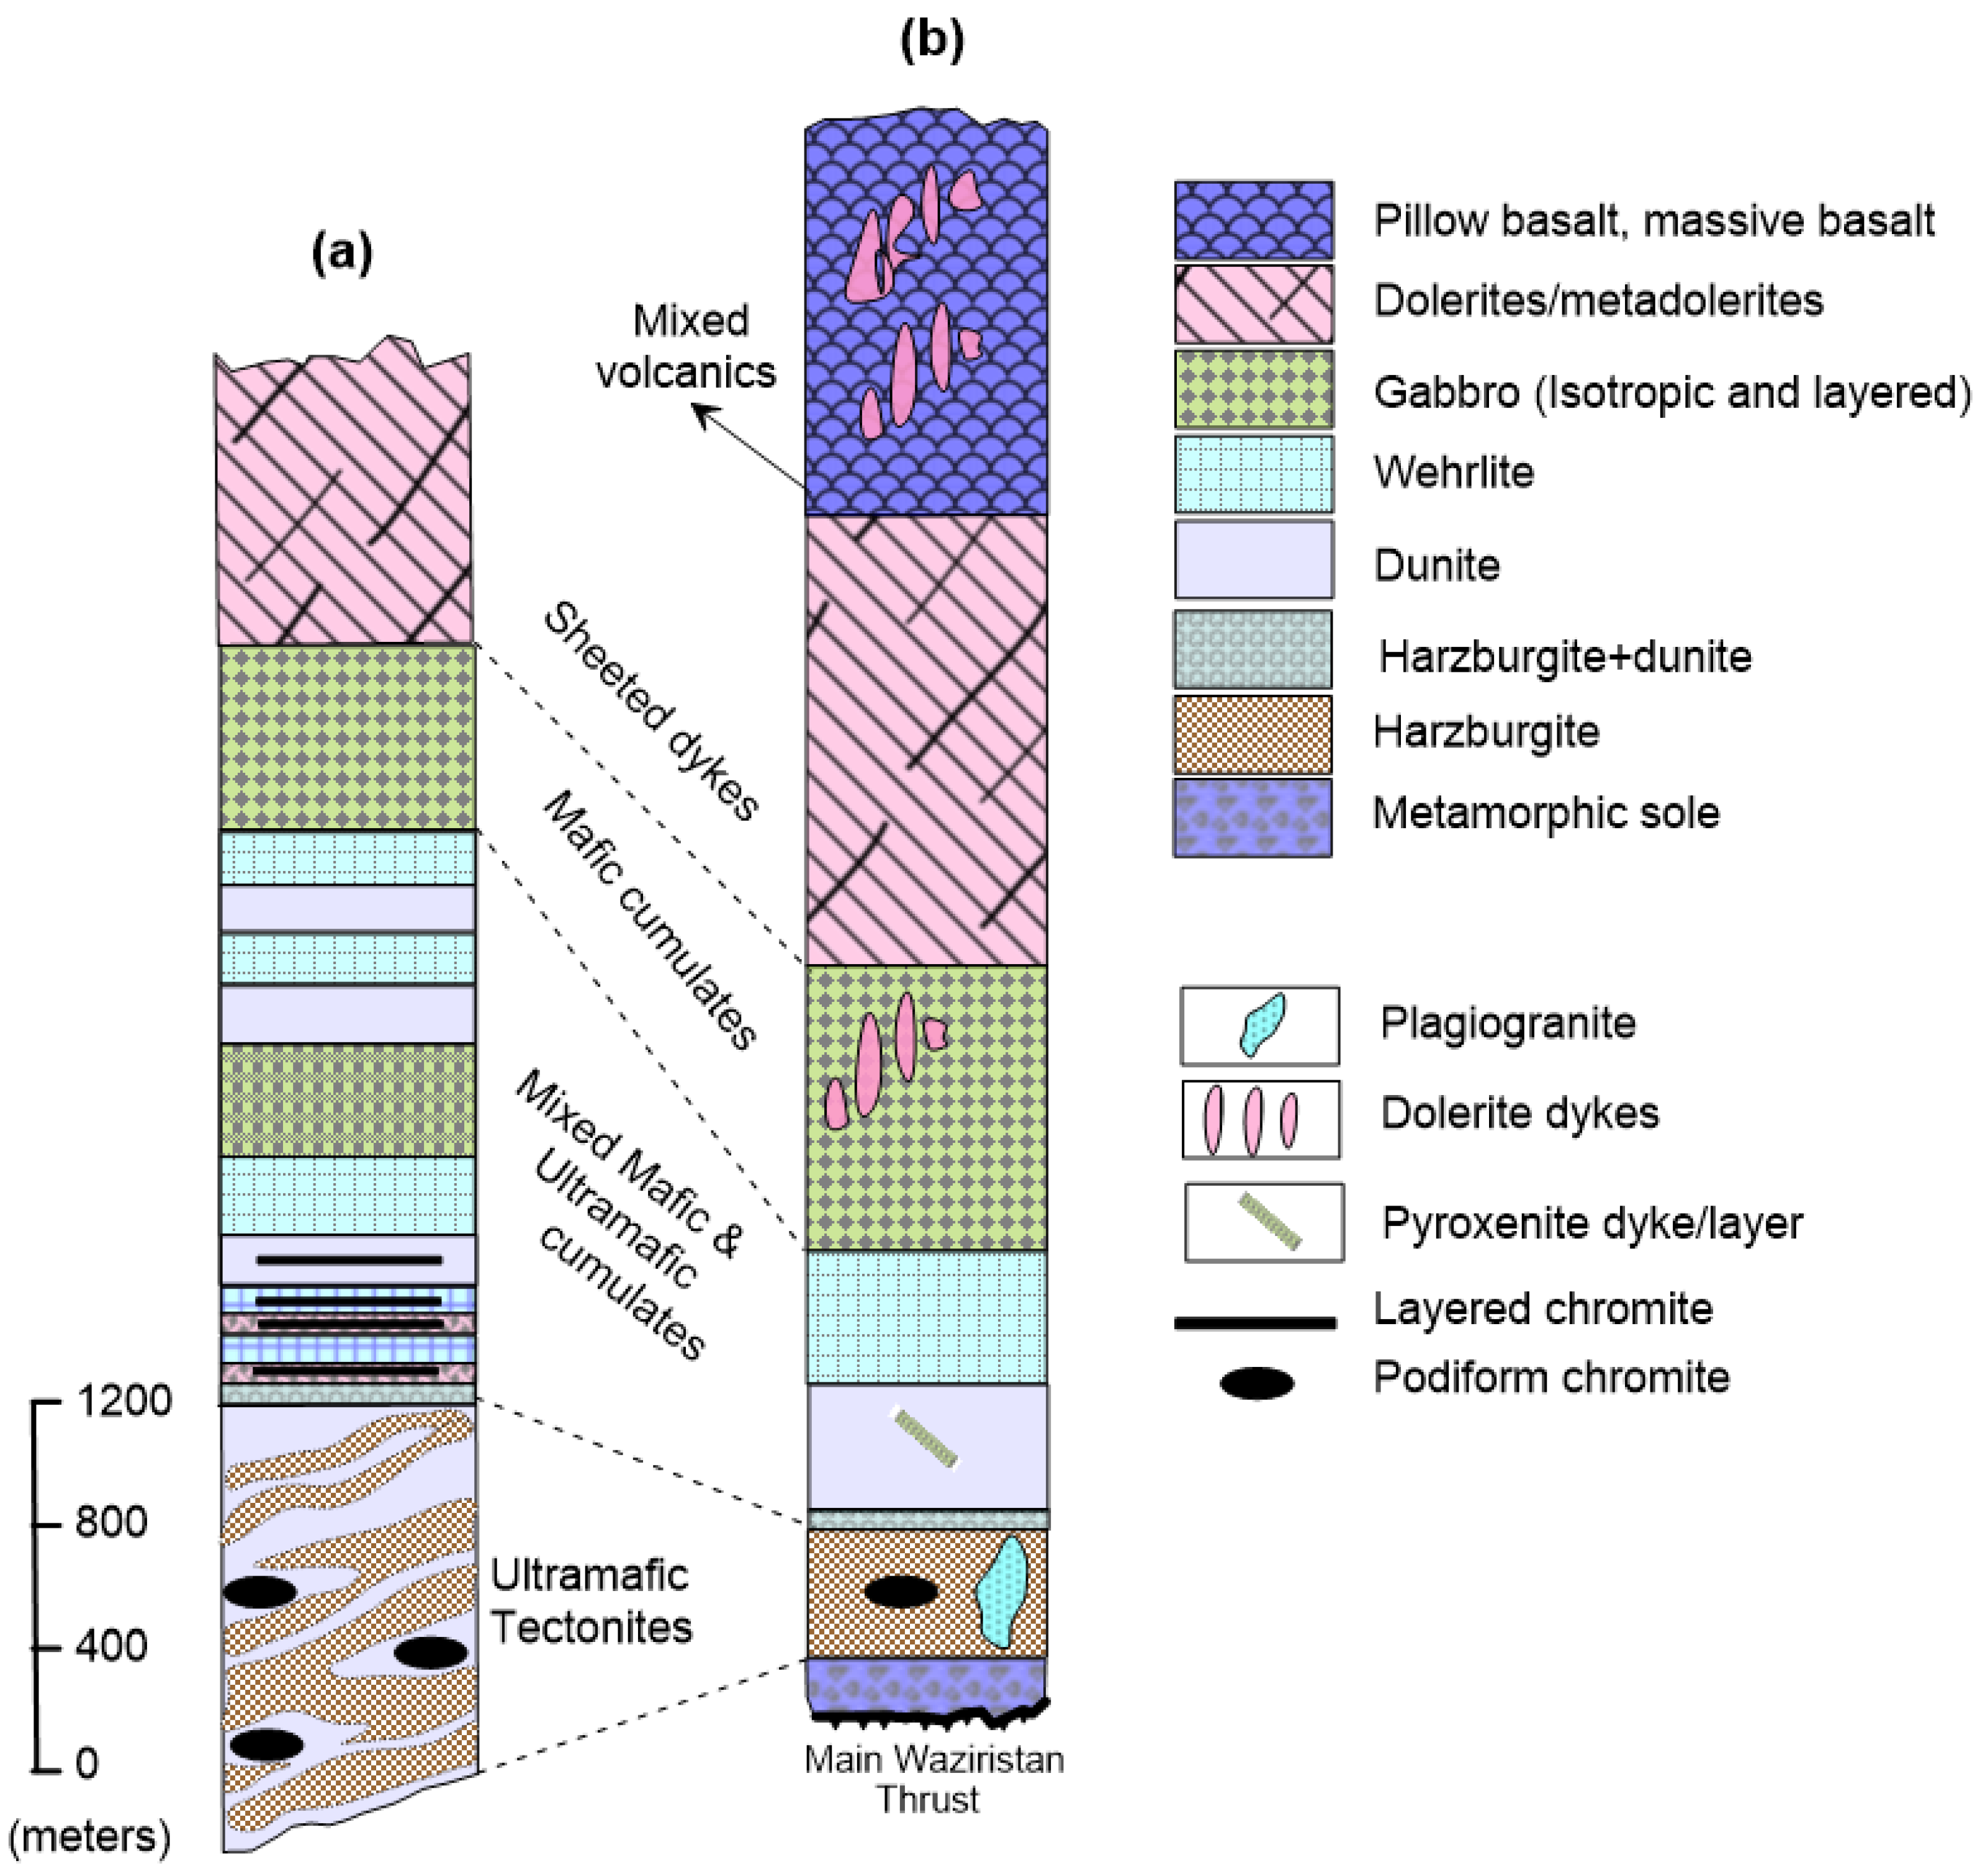
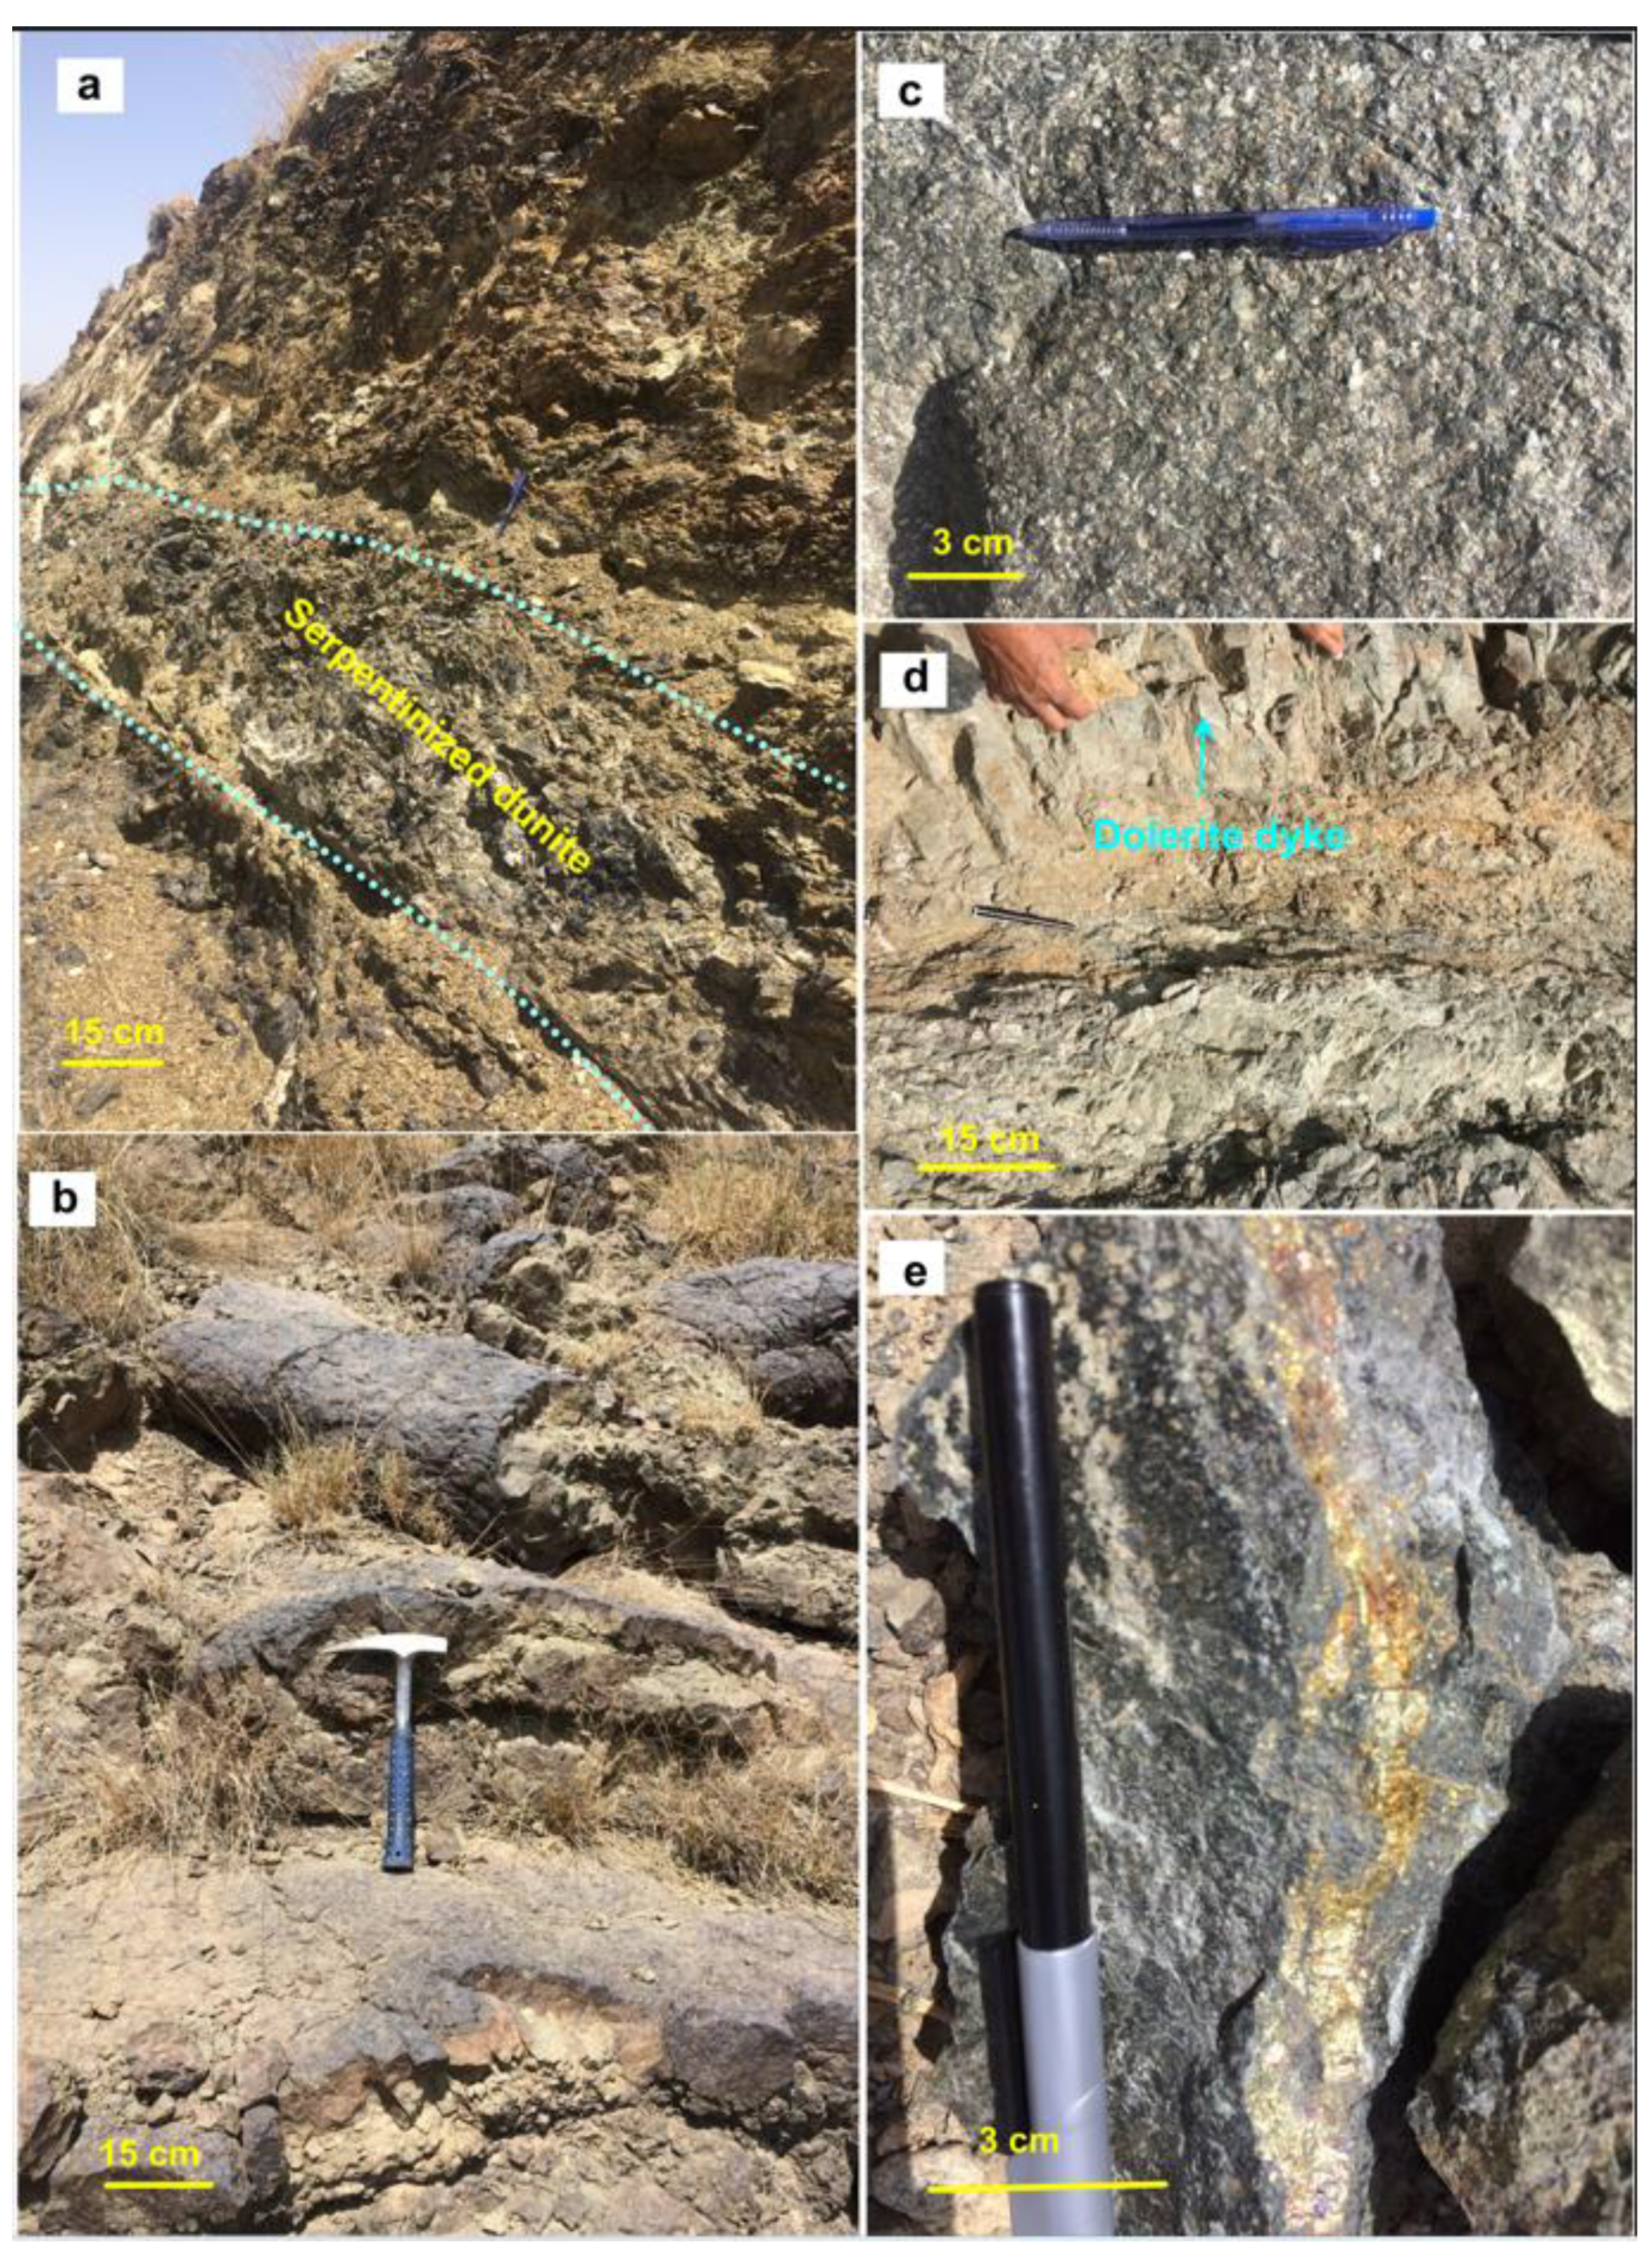
3. Field Observations
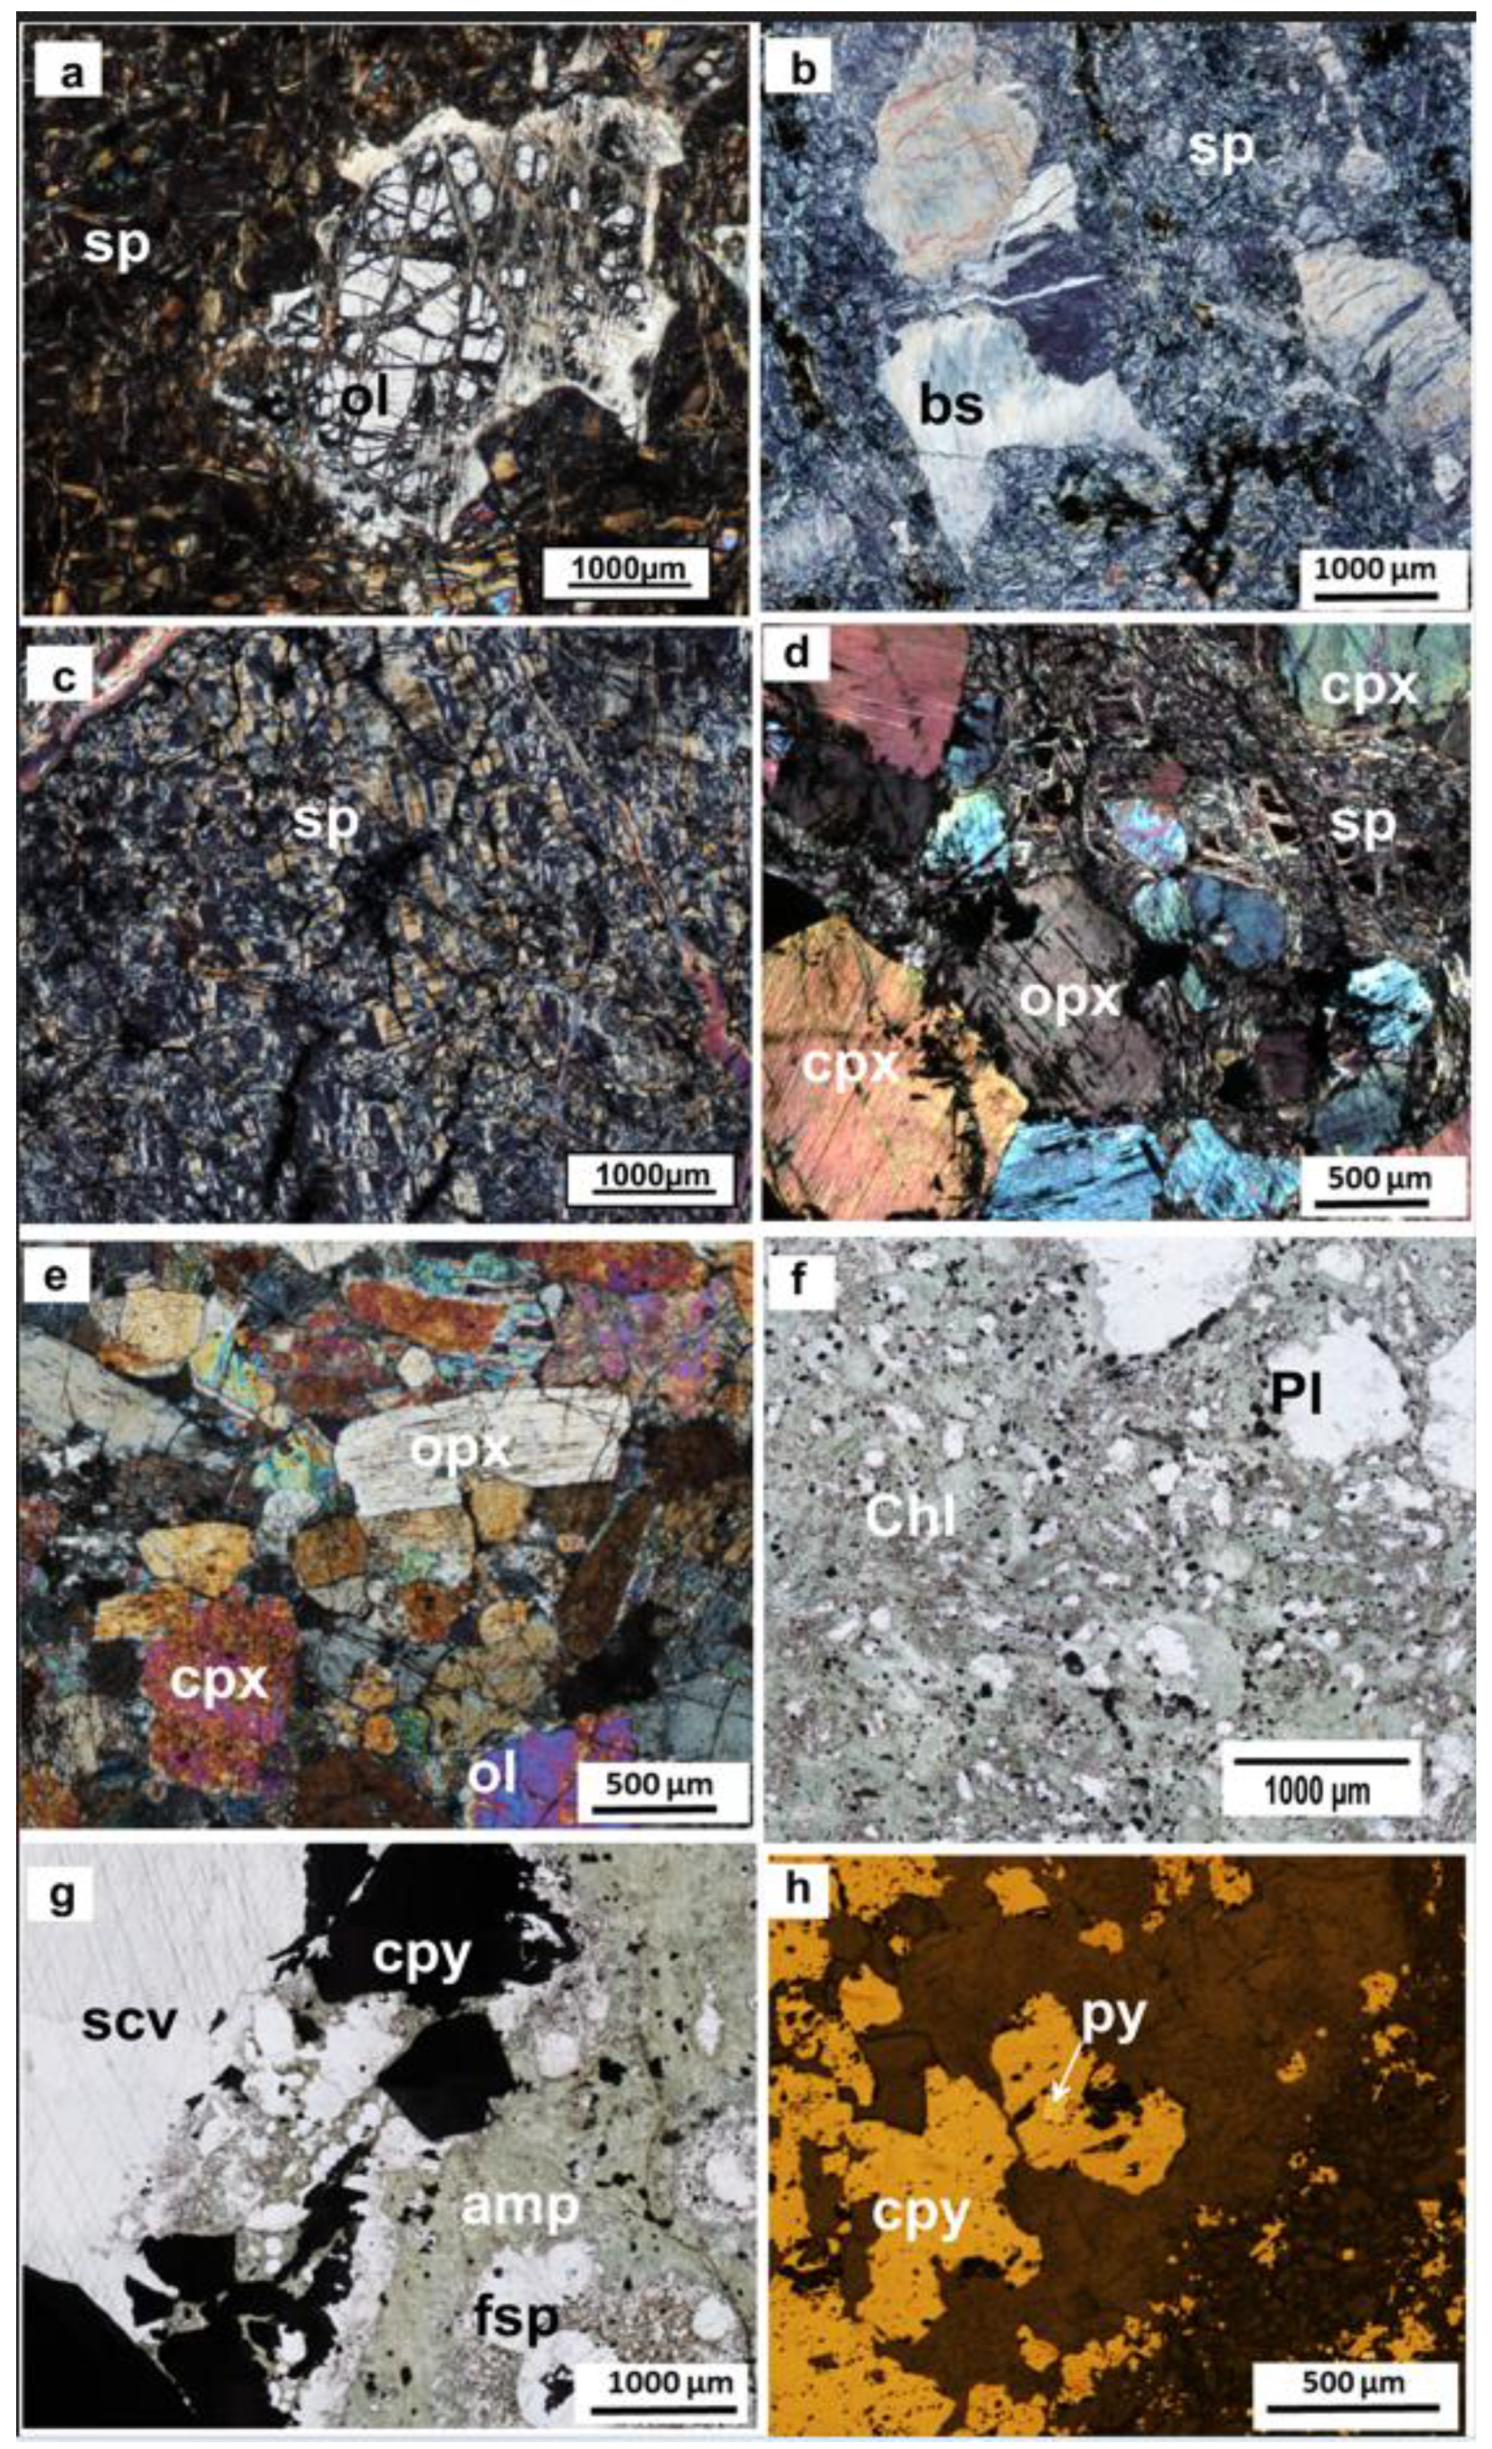
4. Petrography
5. Analytical Methods
6. Results
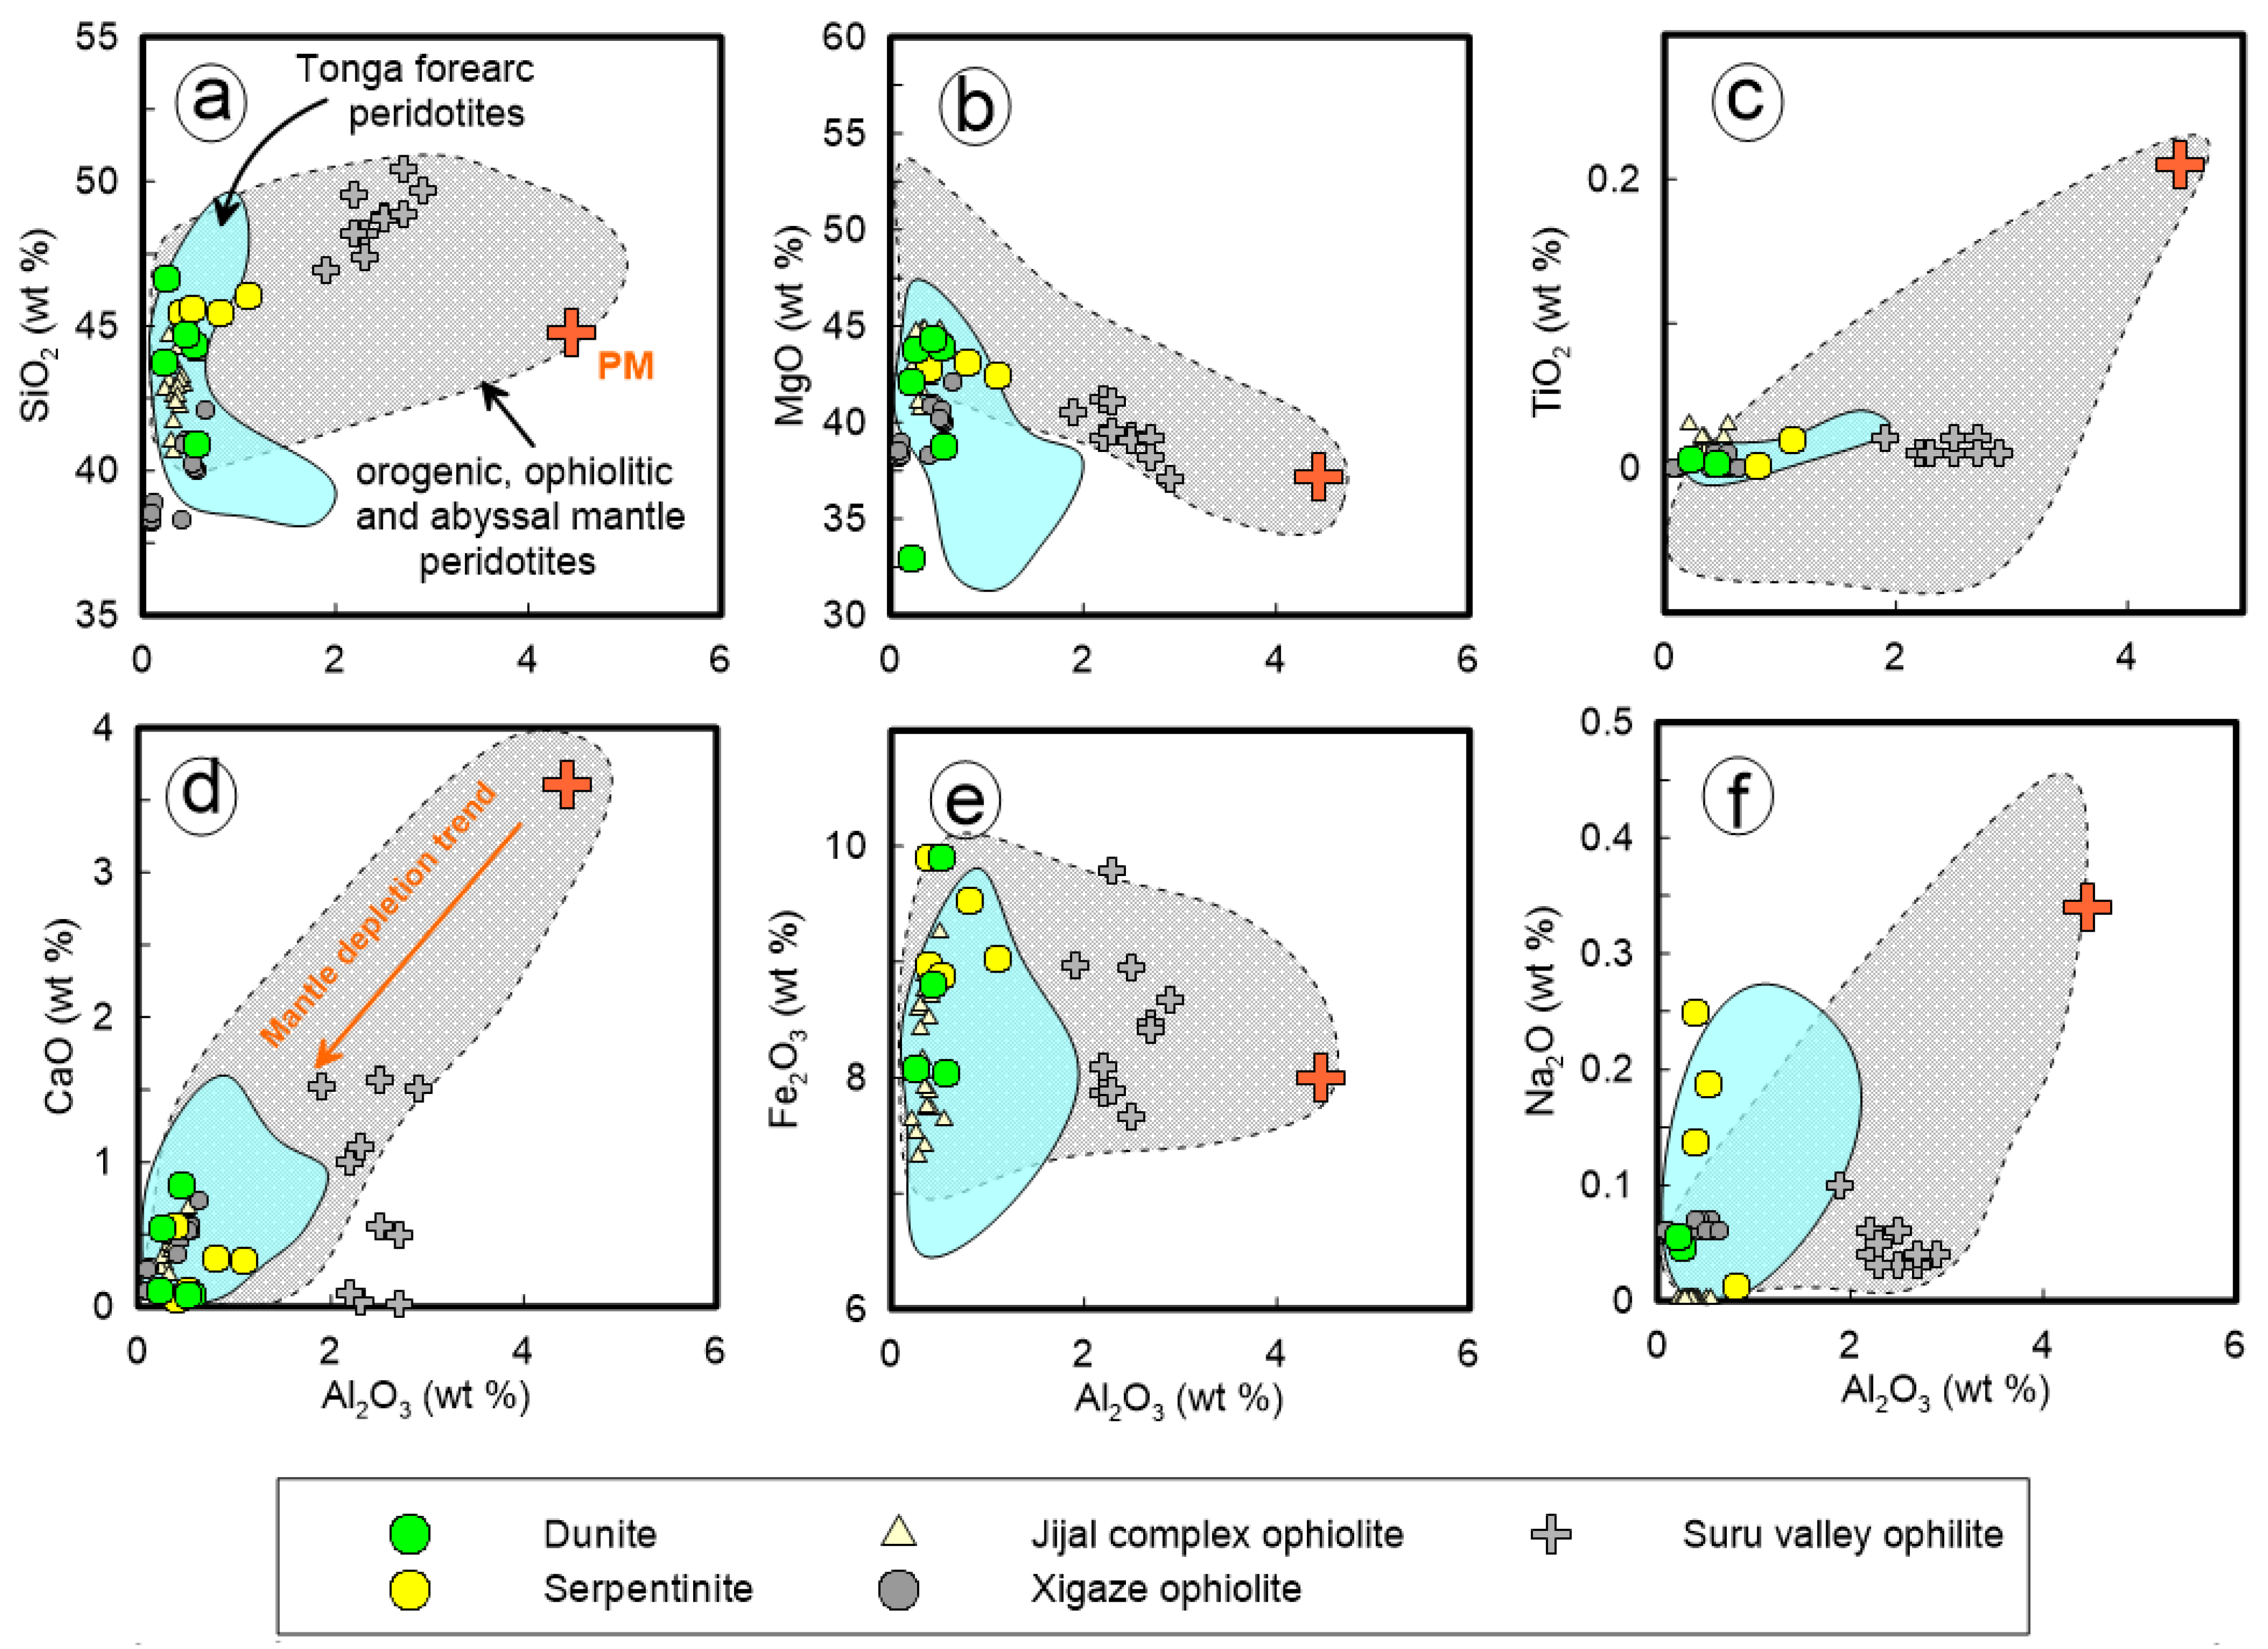
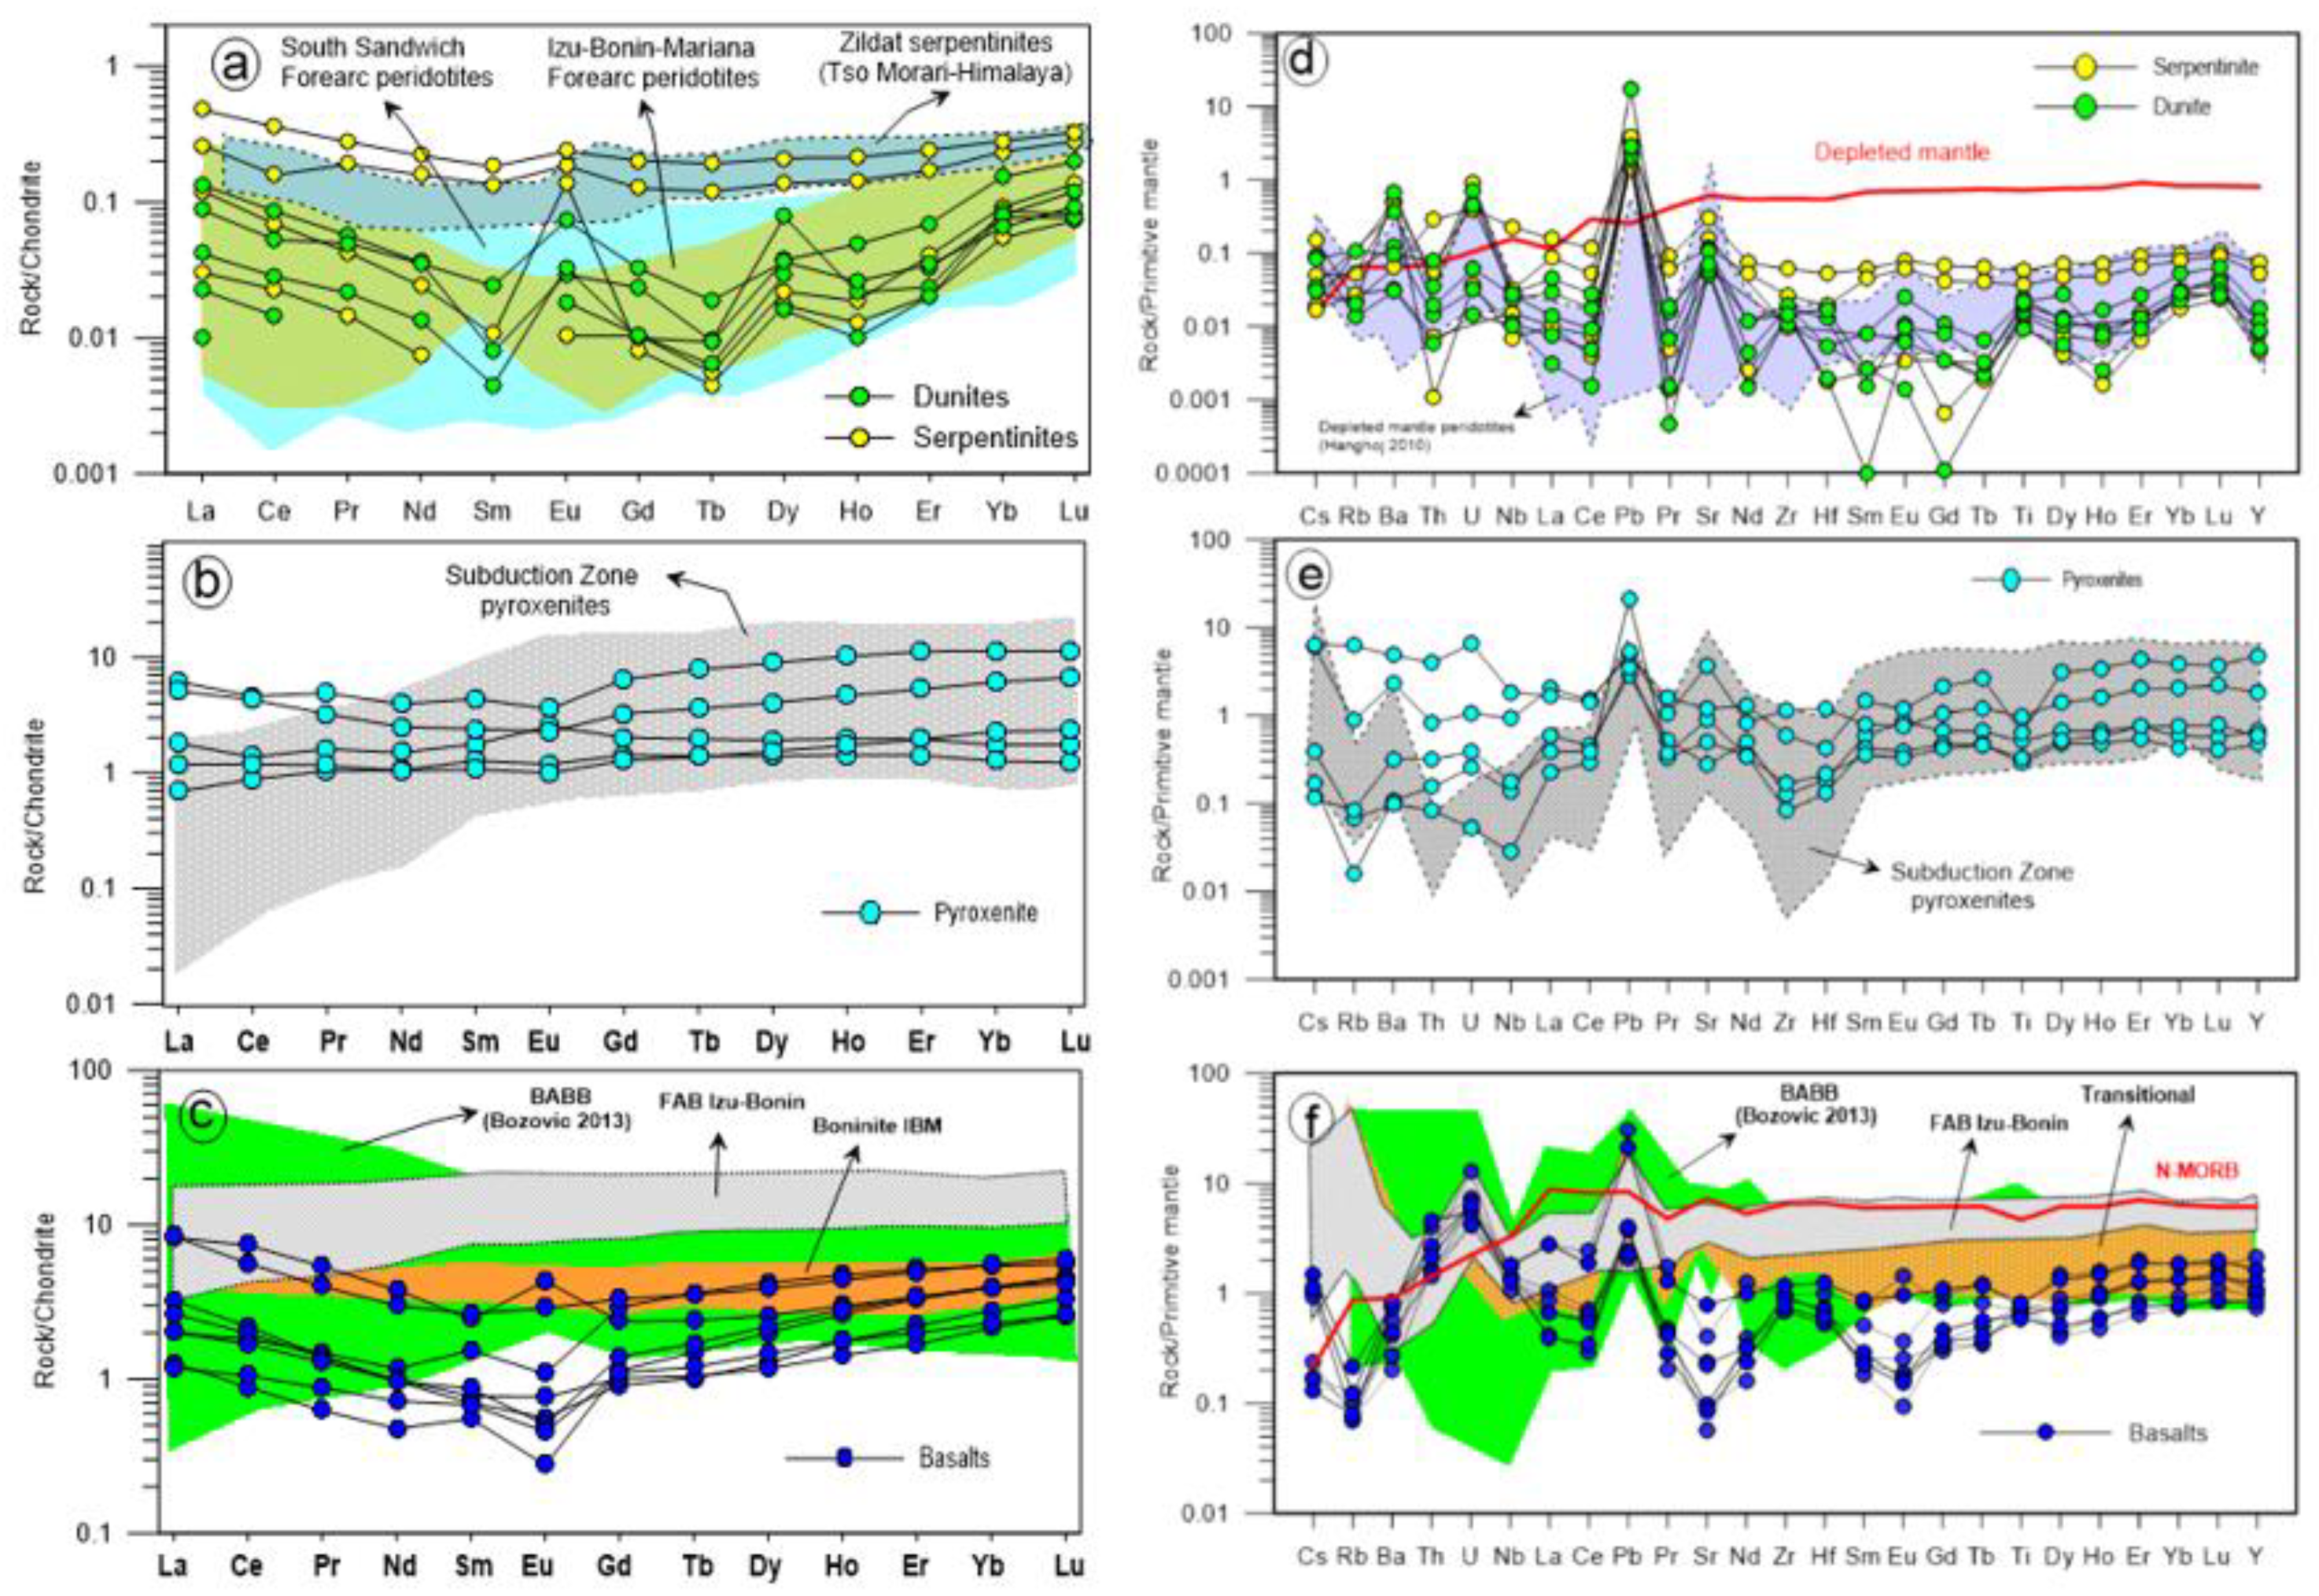
6.1. Geochemical Characteristics of Ultramafic Rocks

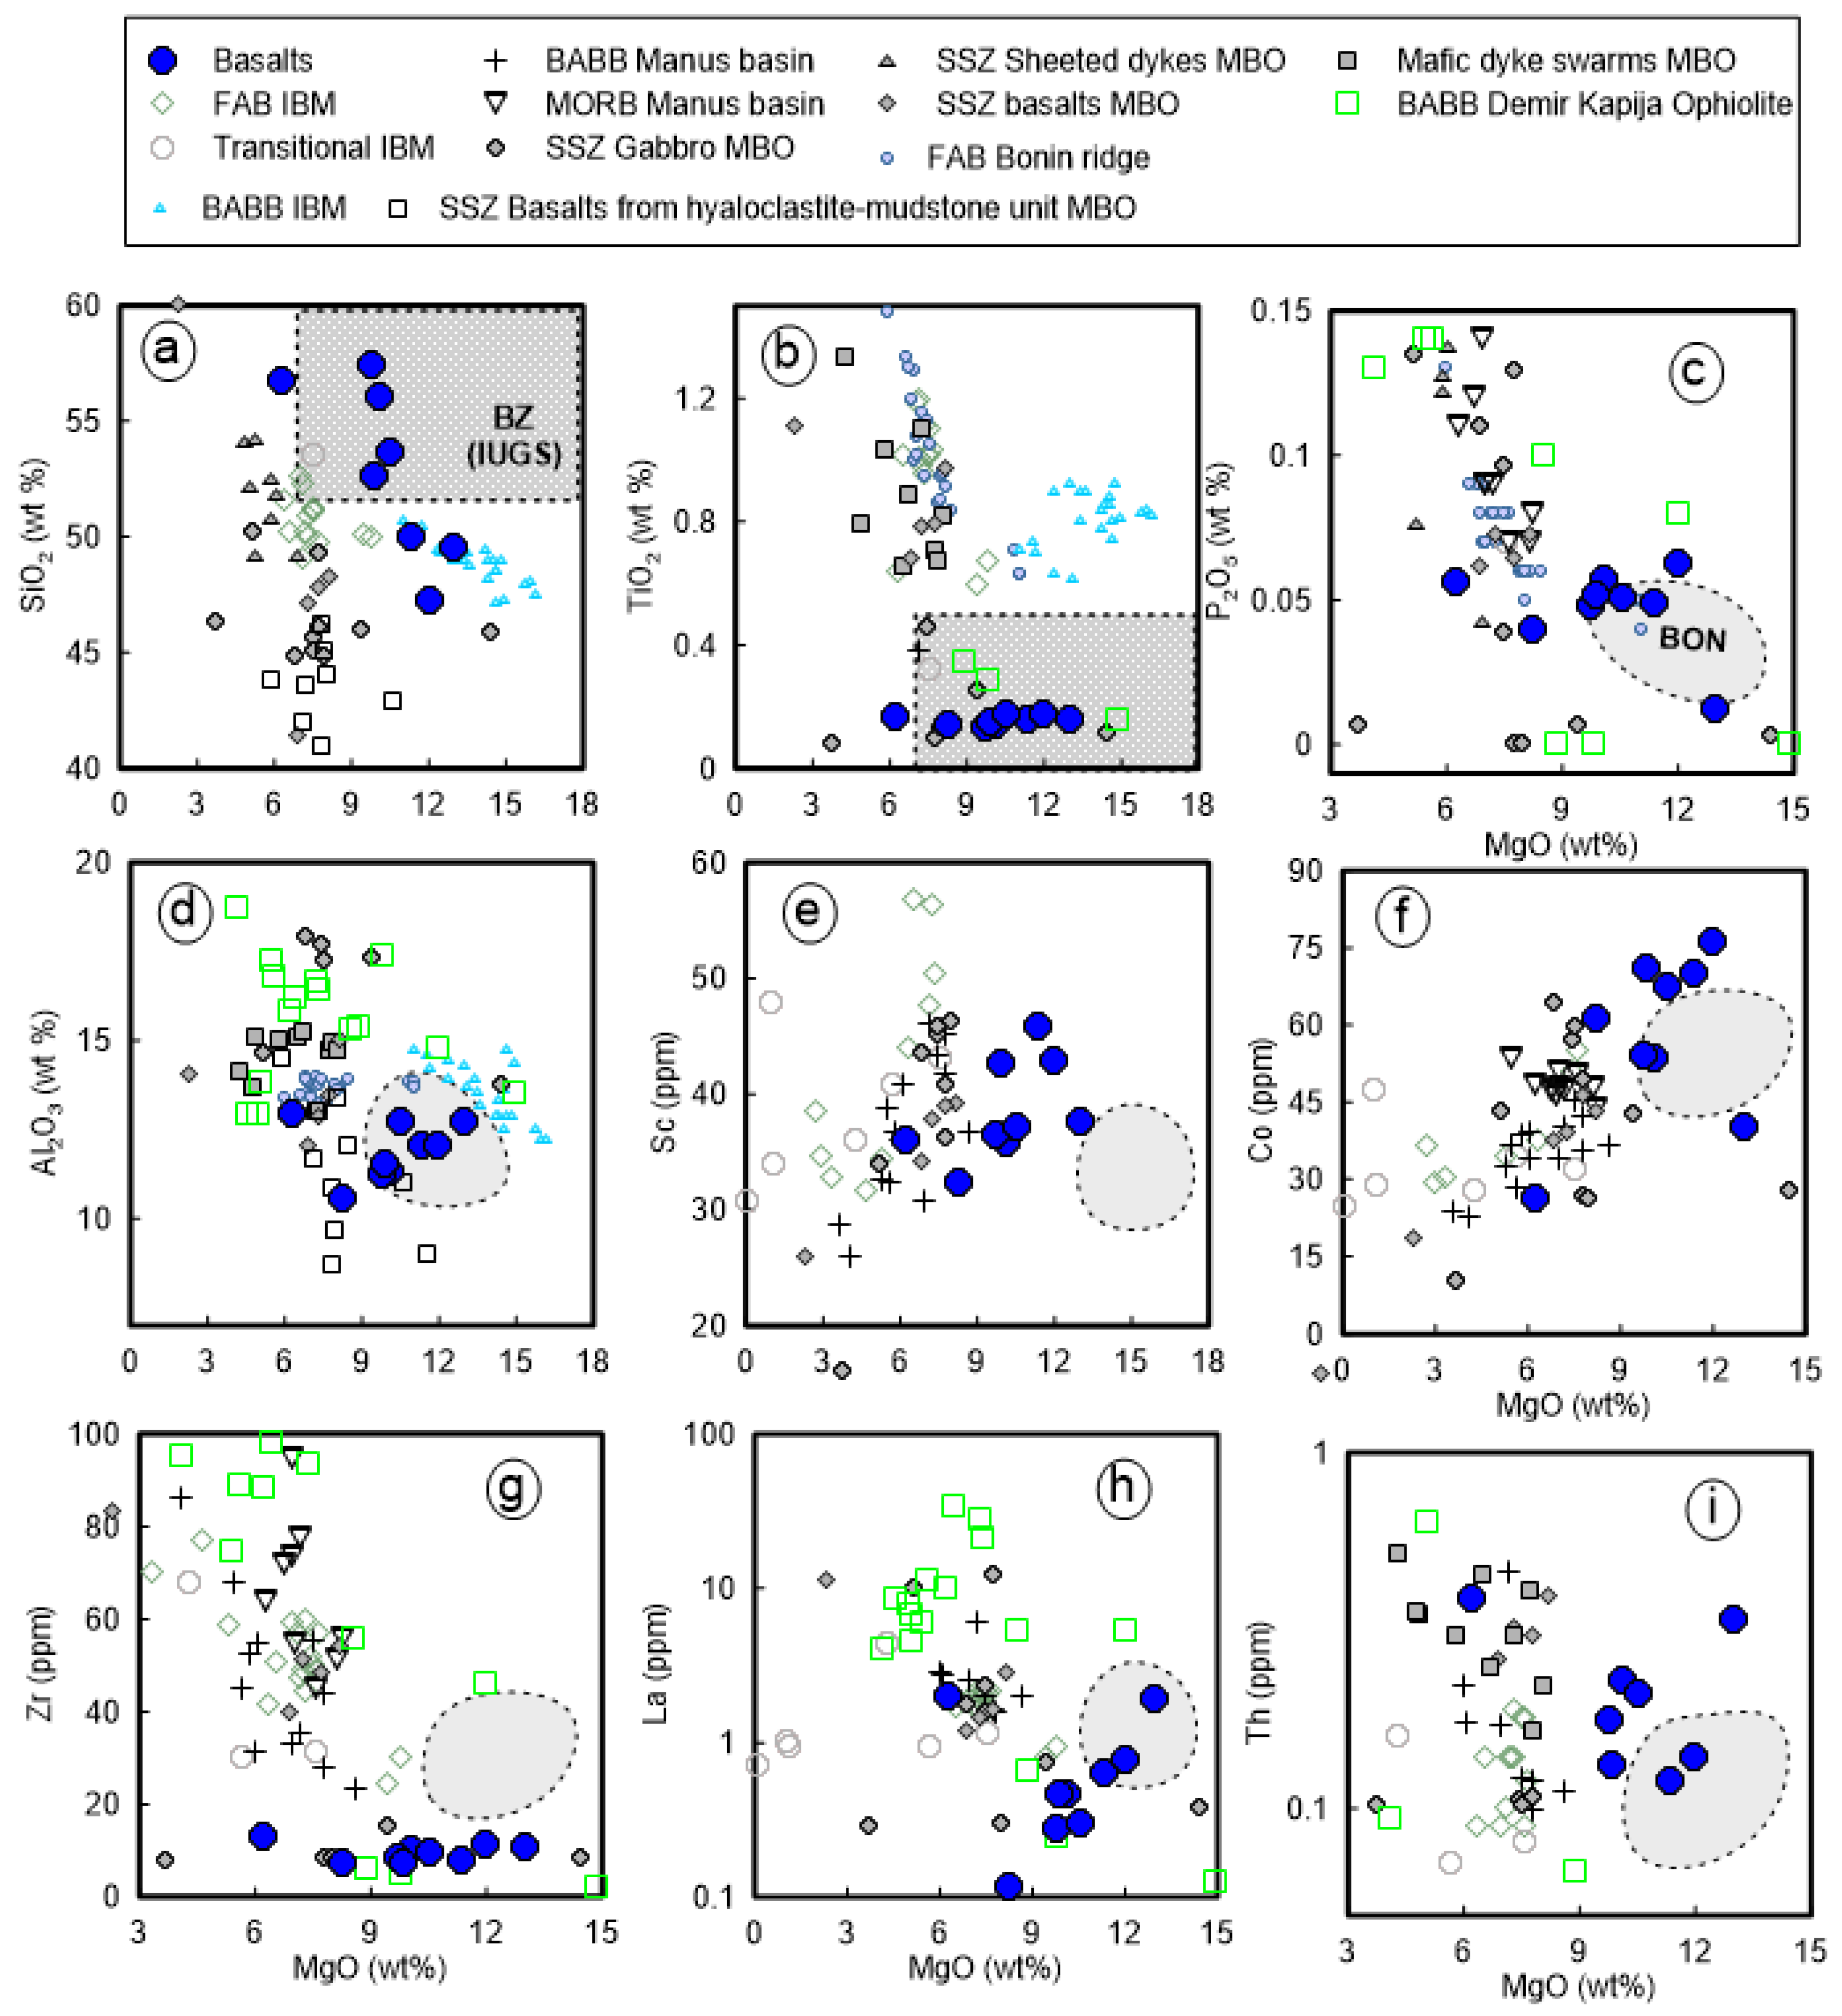
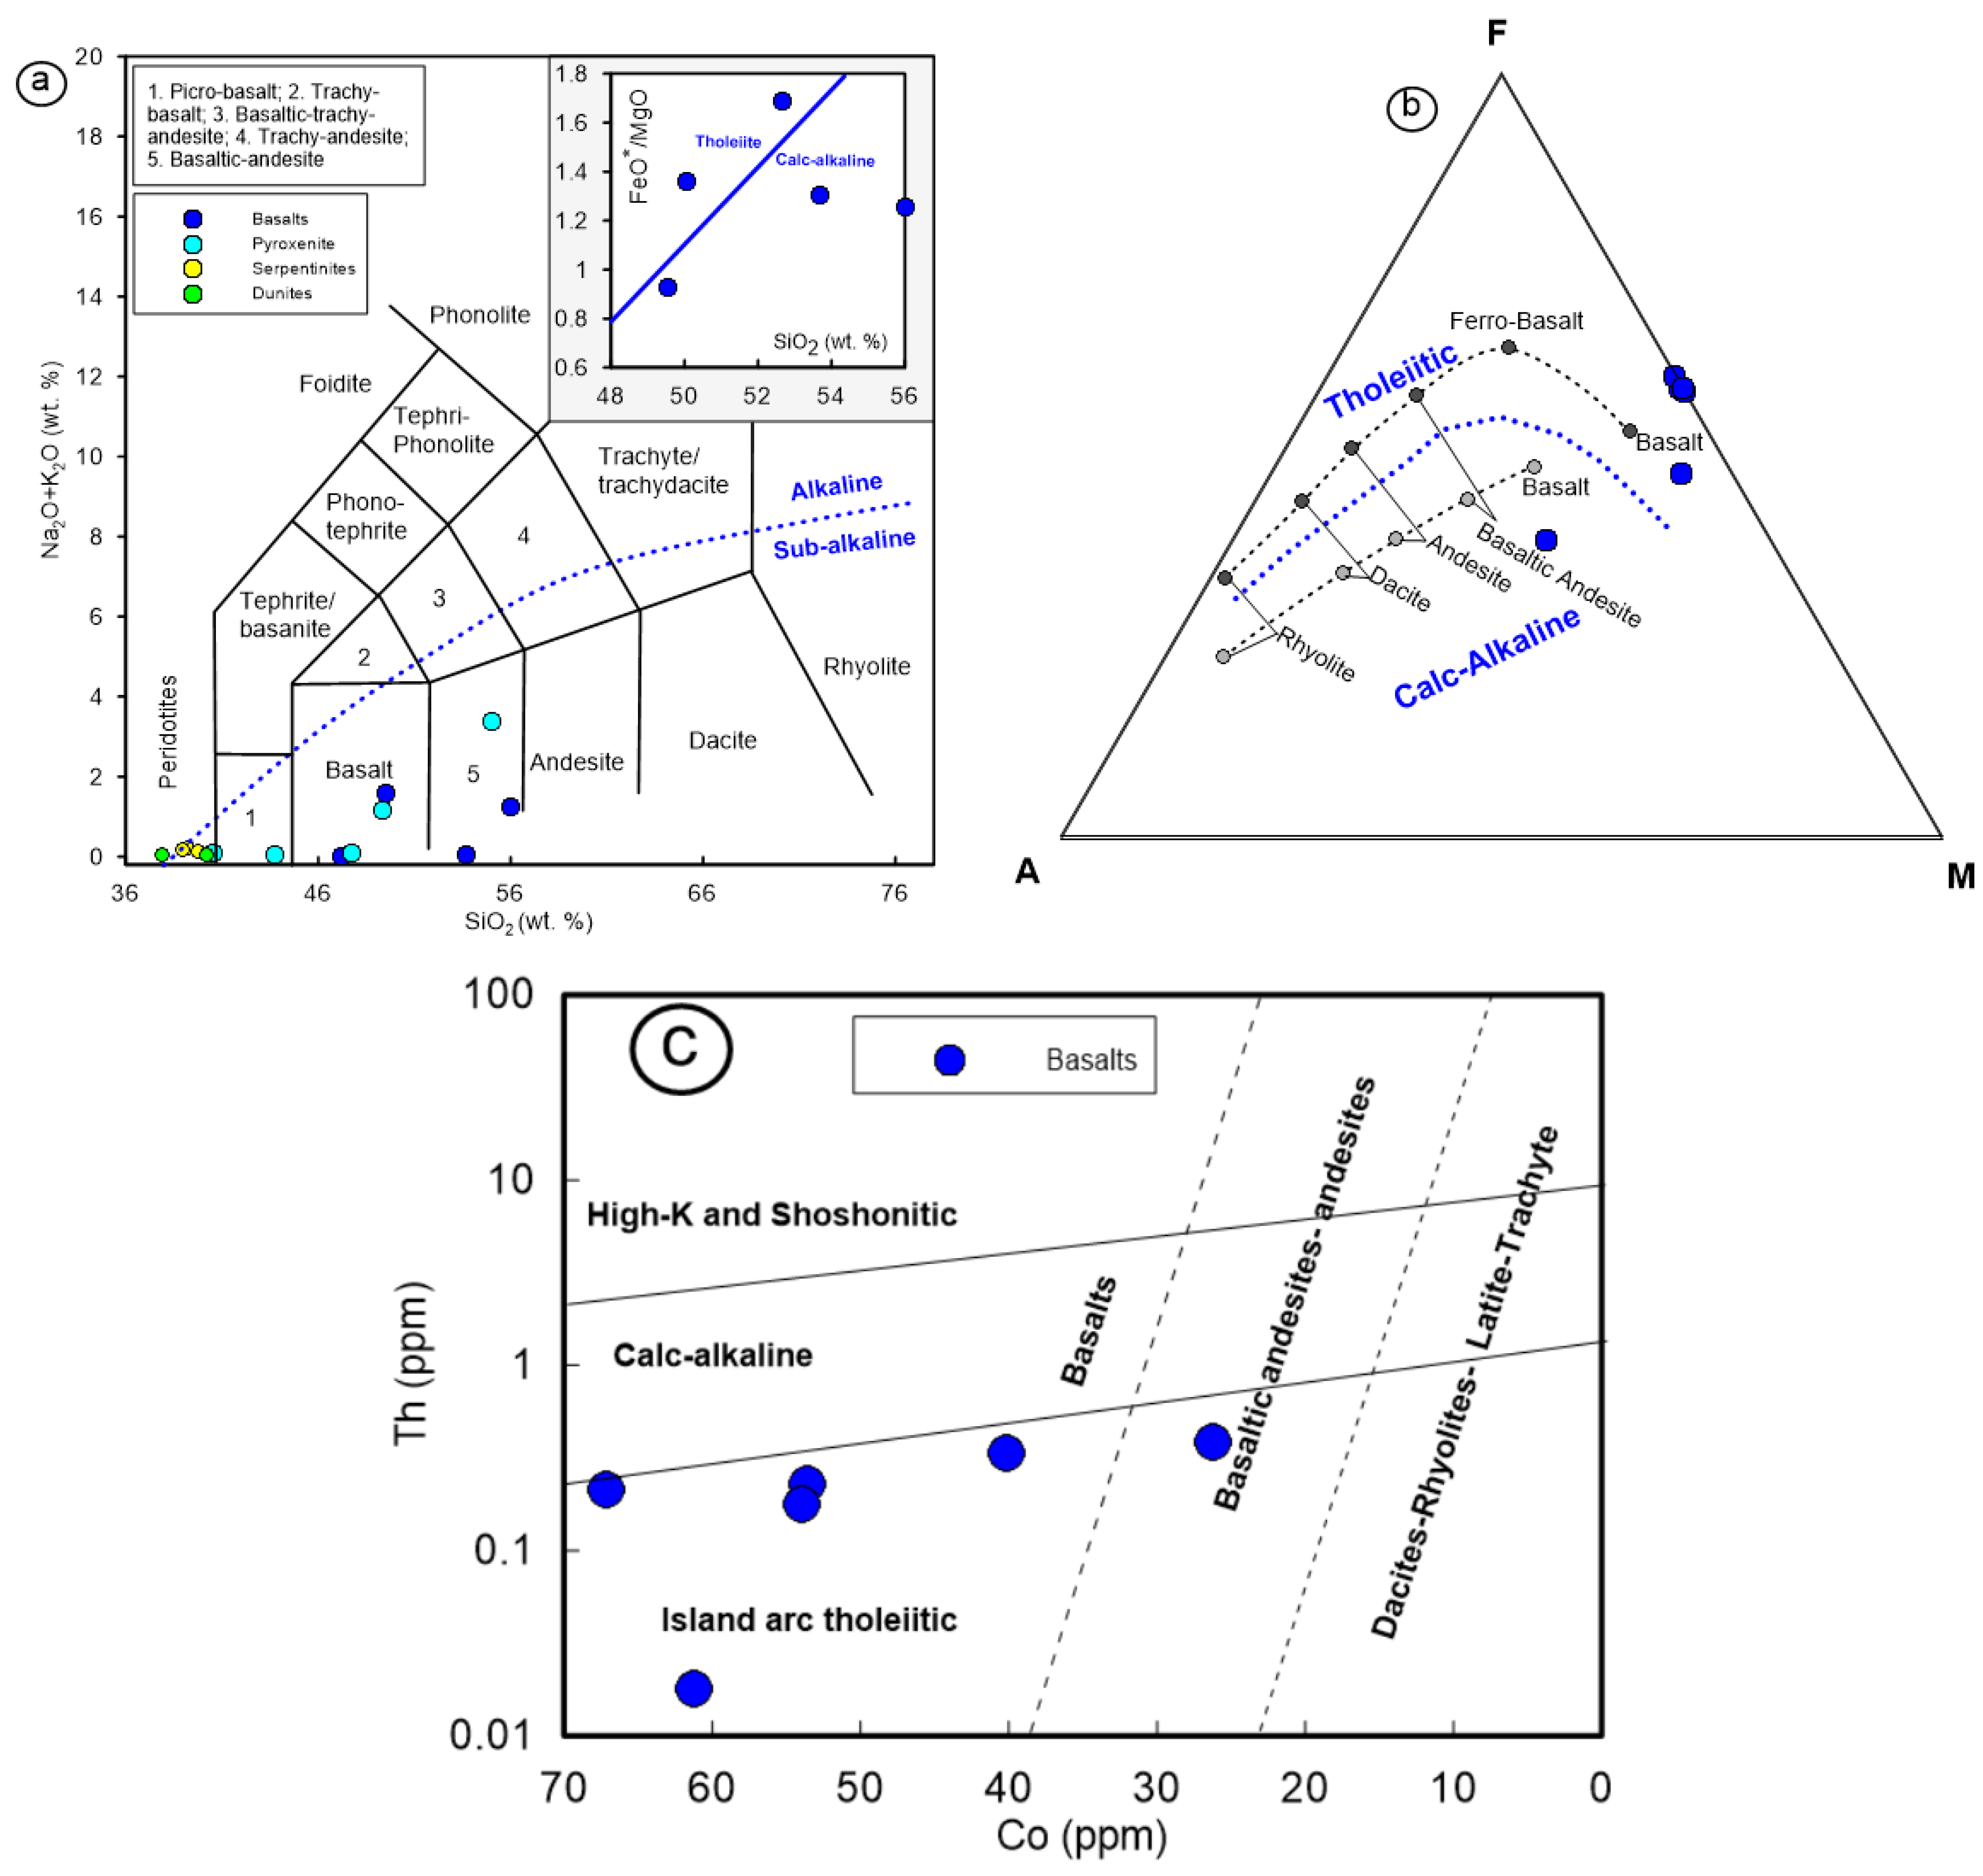
6.2. Geochemical Characteristics of Mafic Rocks


7. Discussion
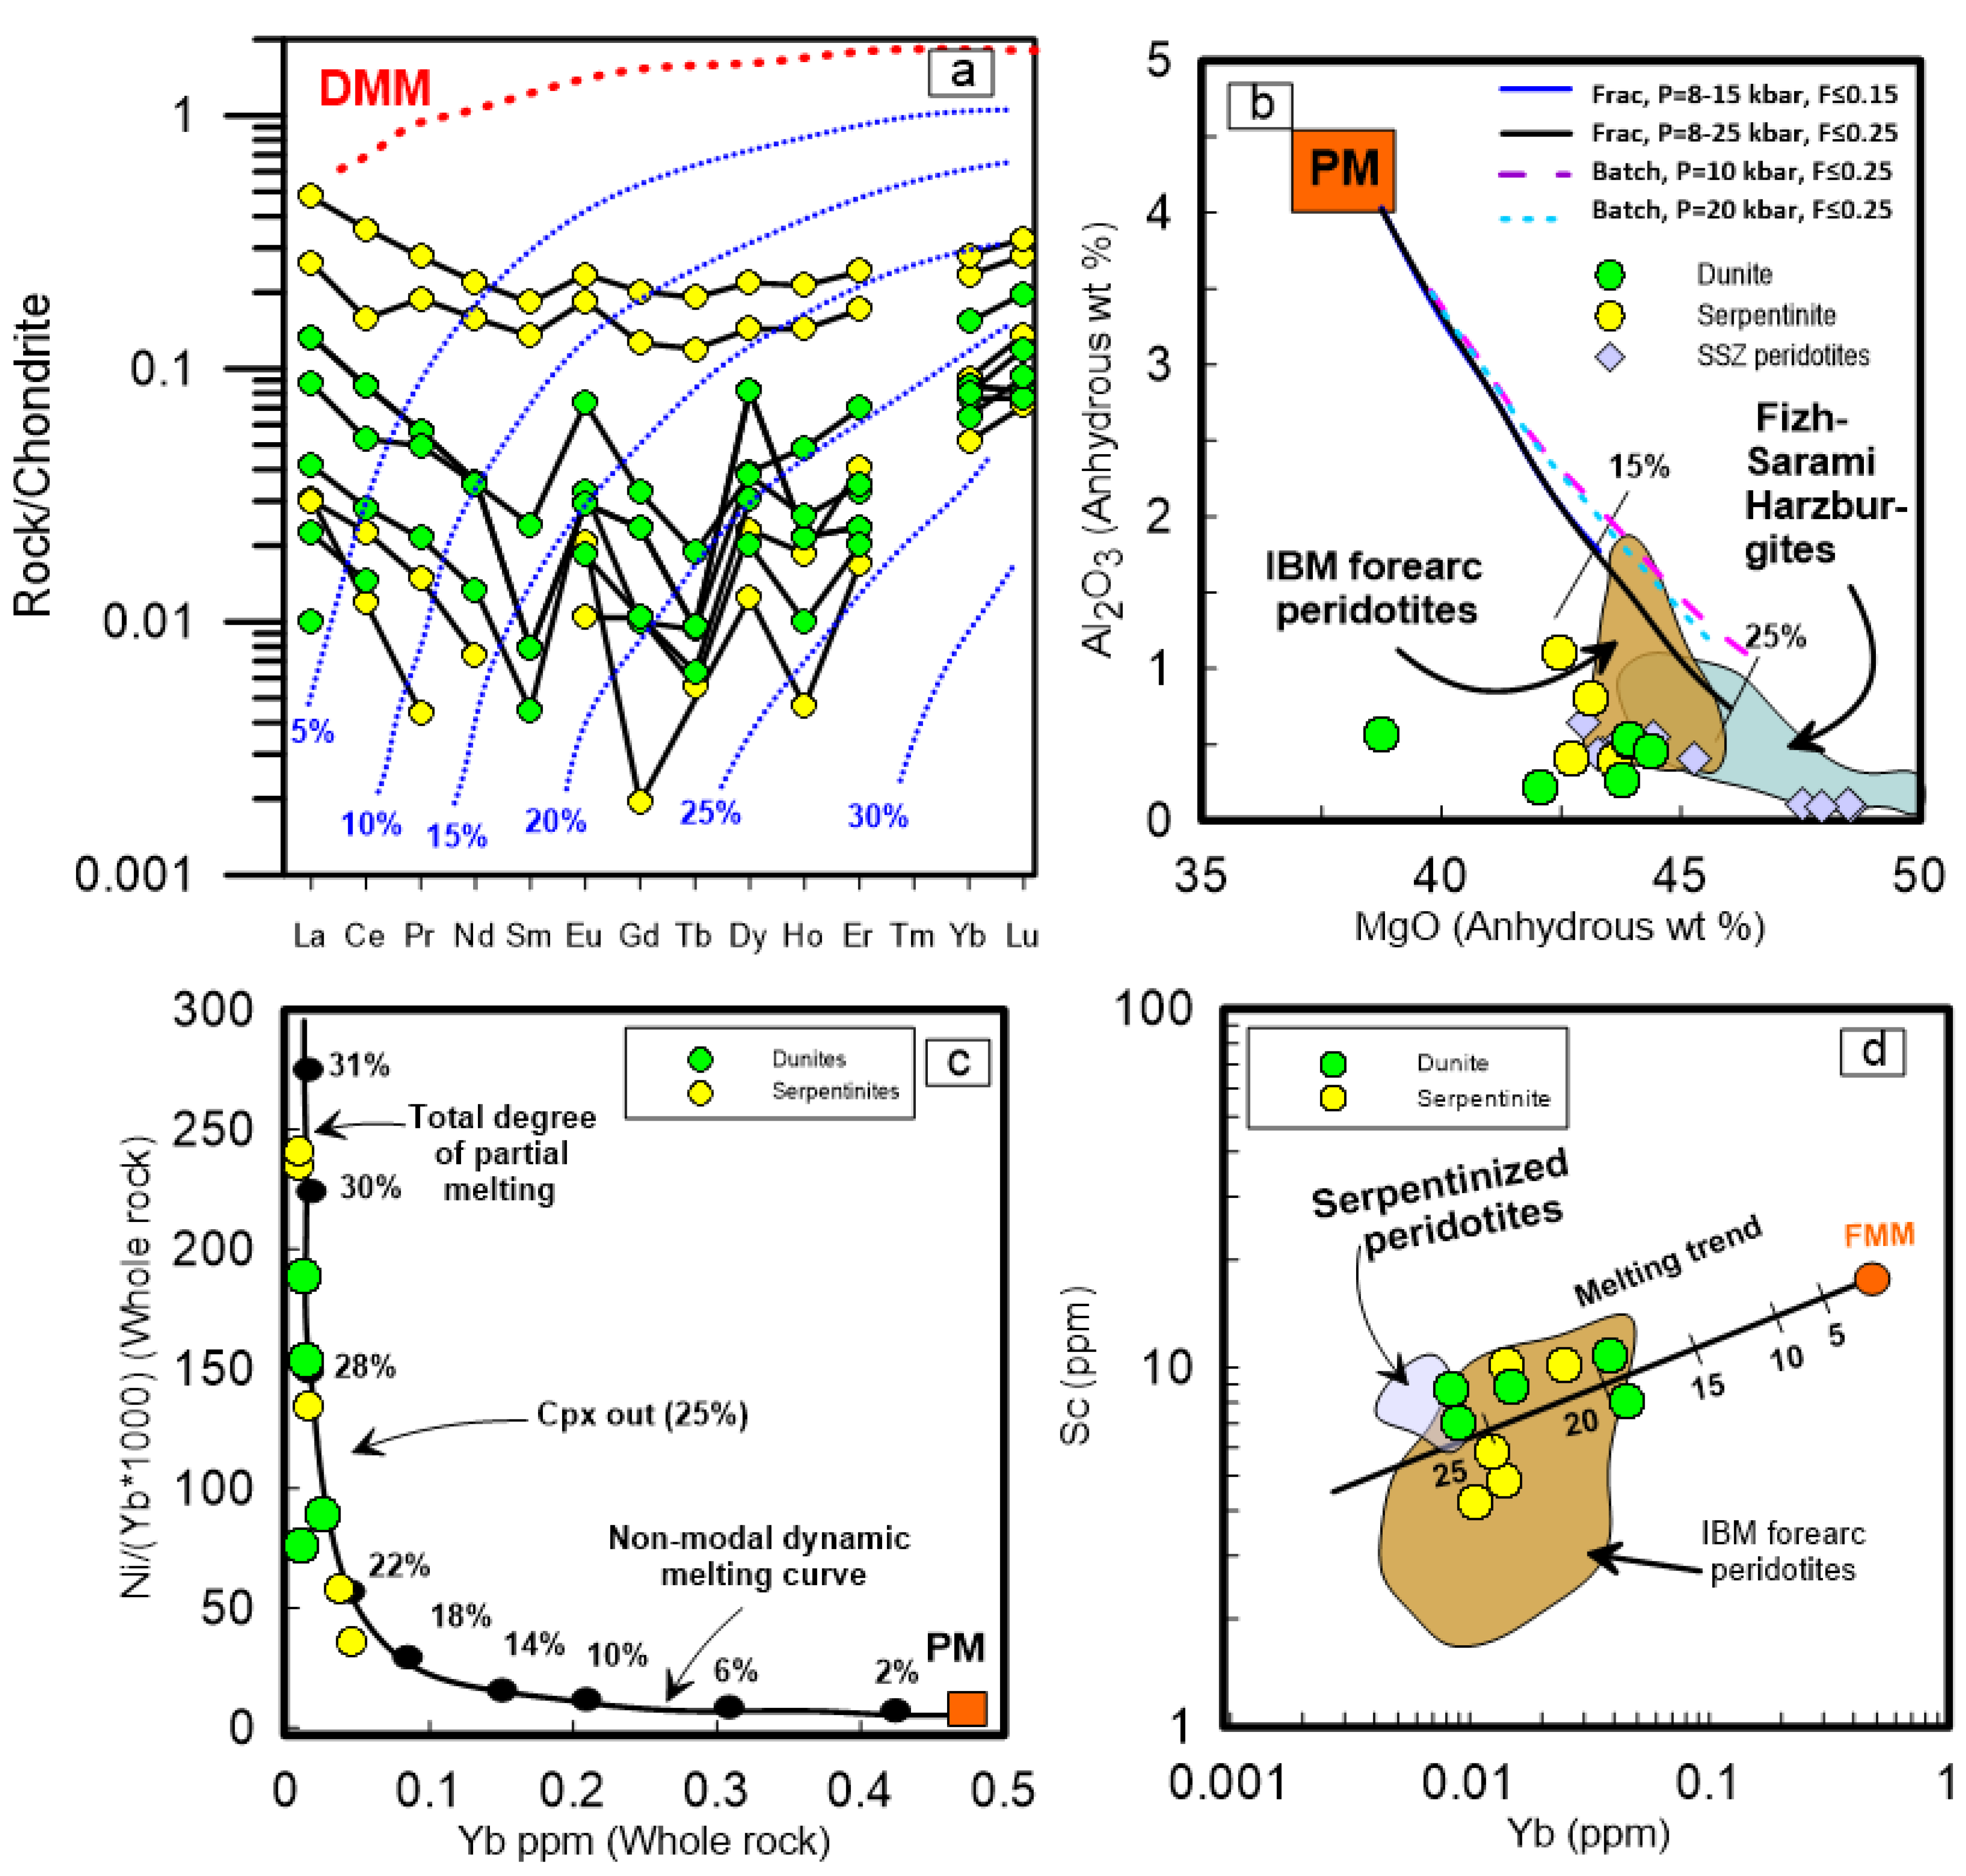
7.1. Partial Melting of the Waziristan Ophiolitic Peridotites
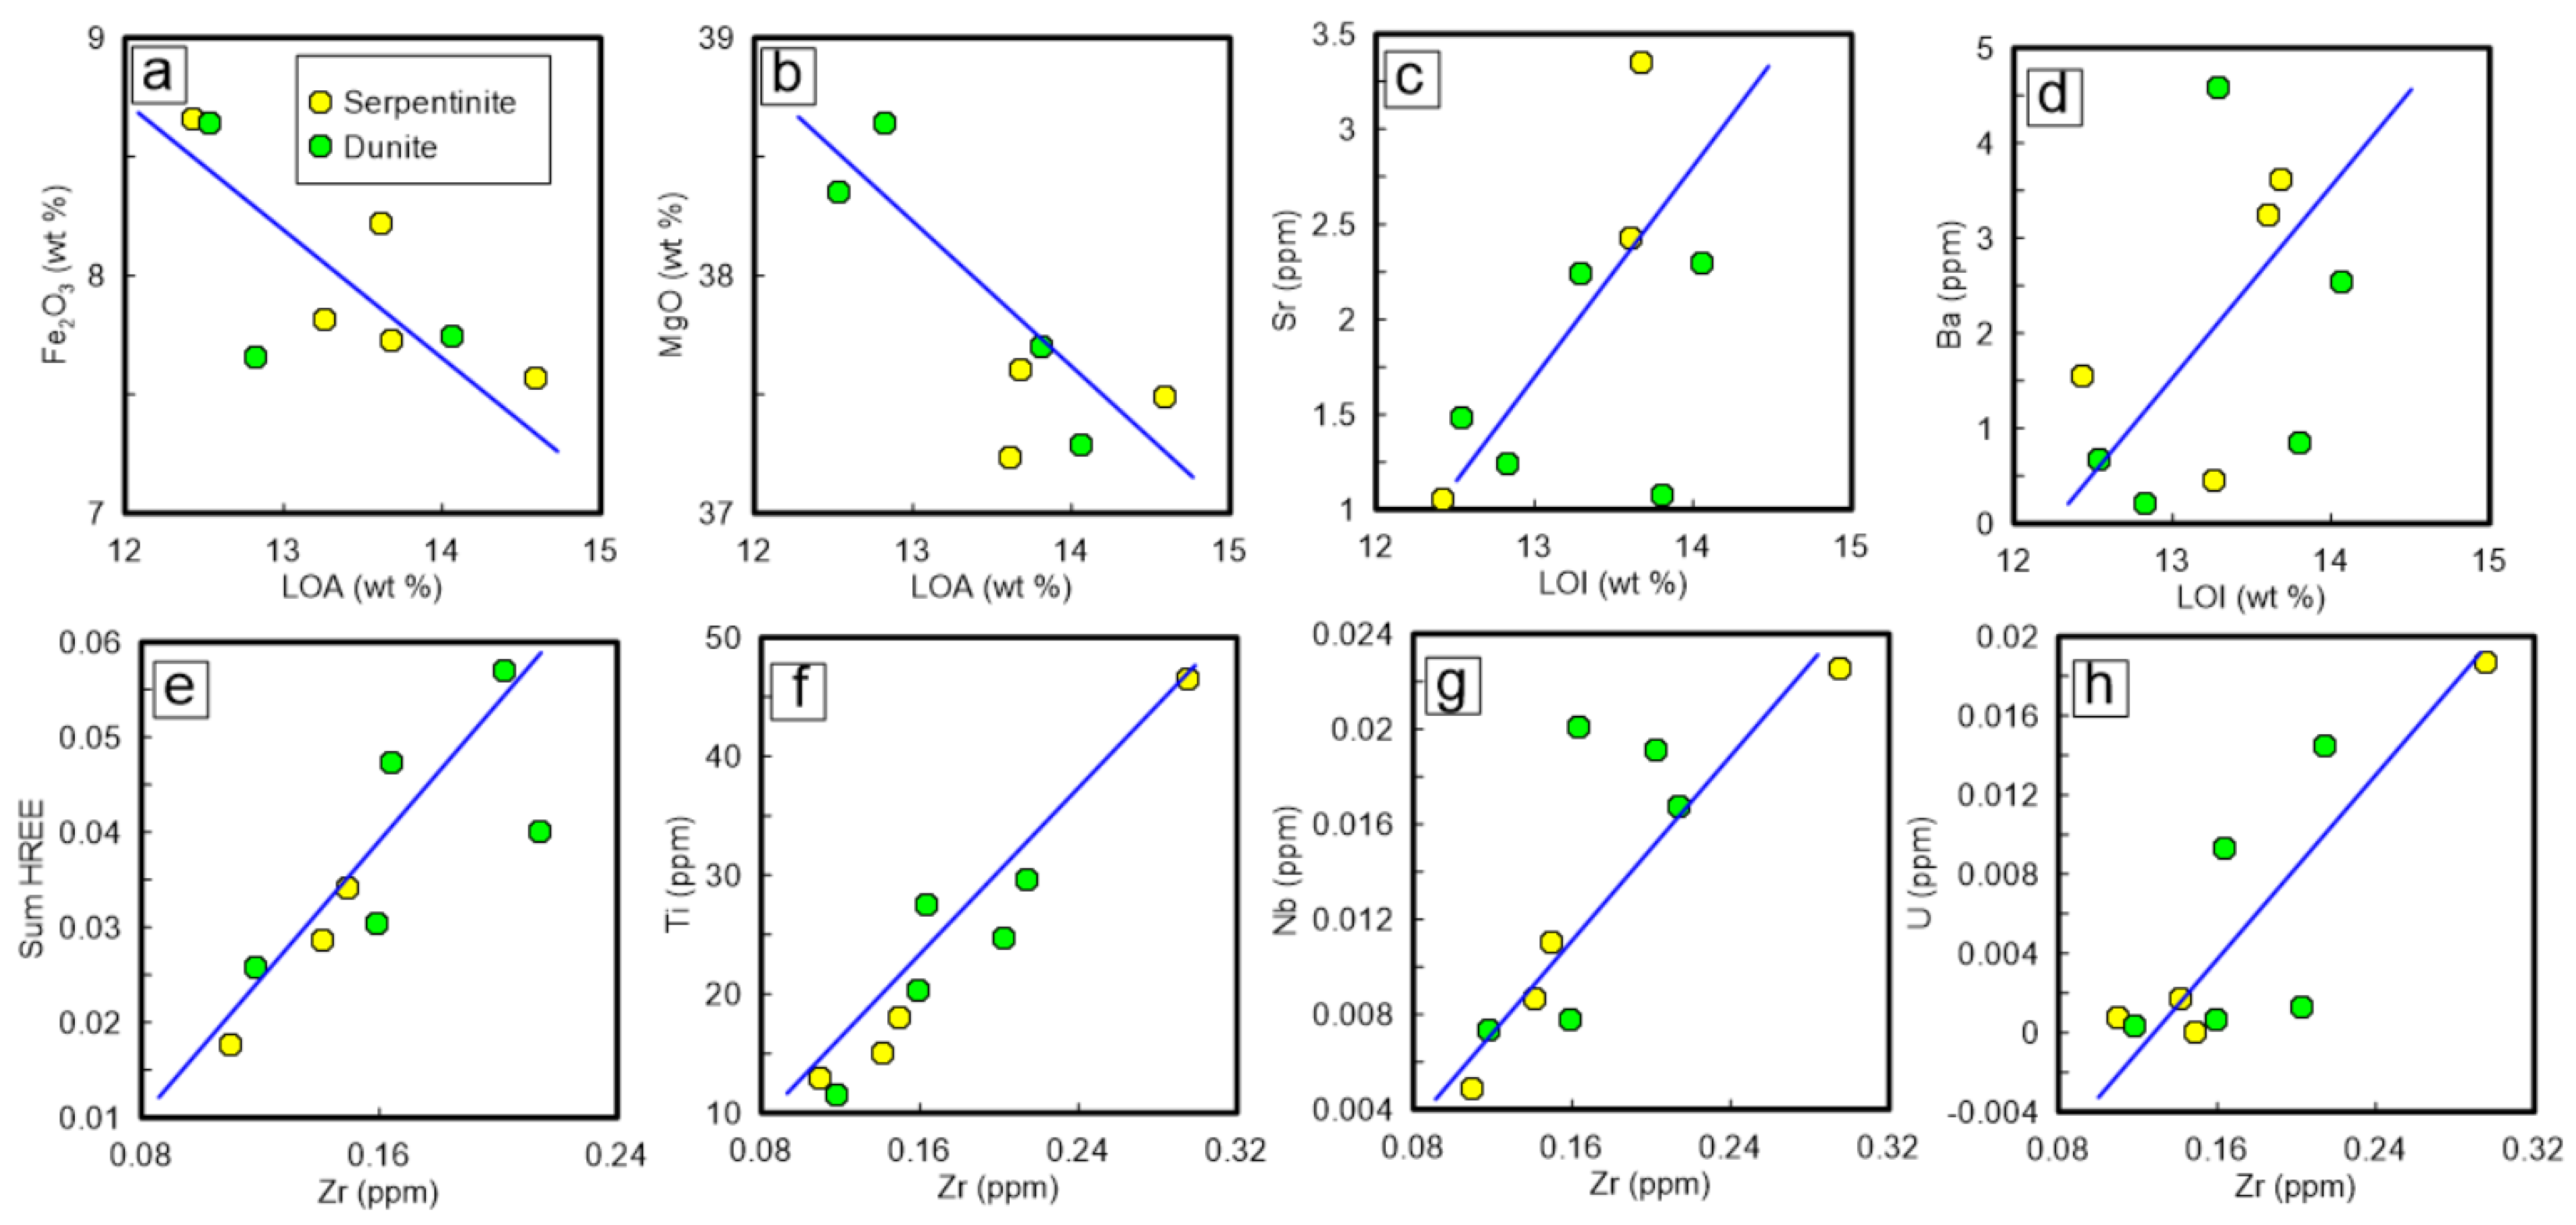
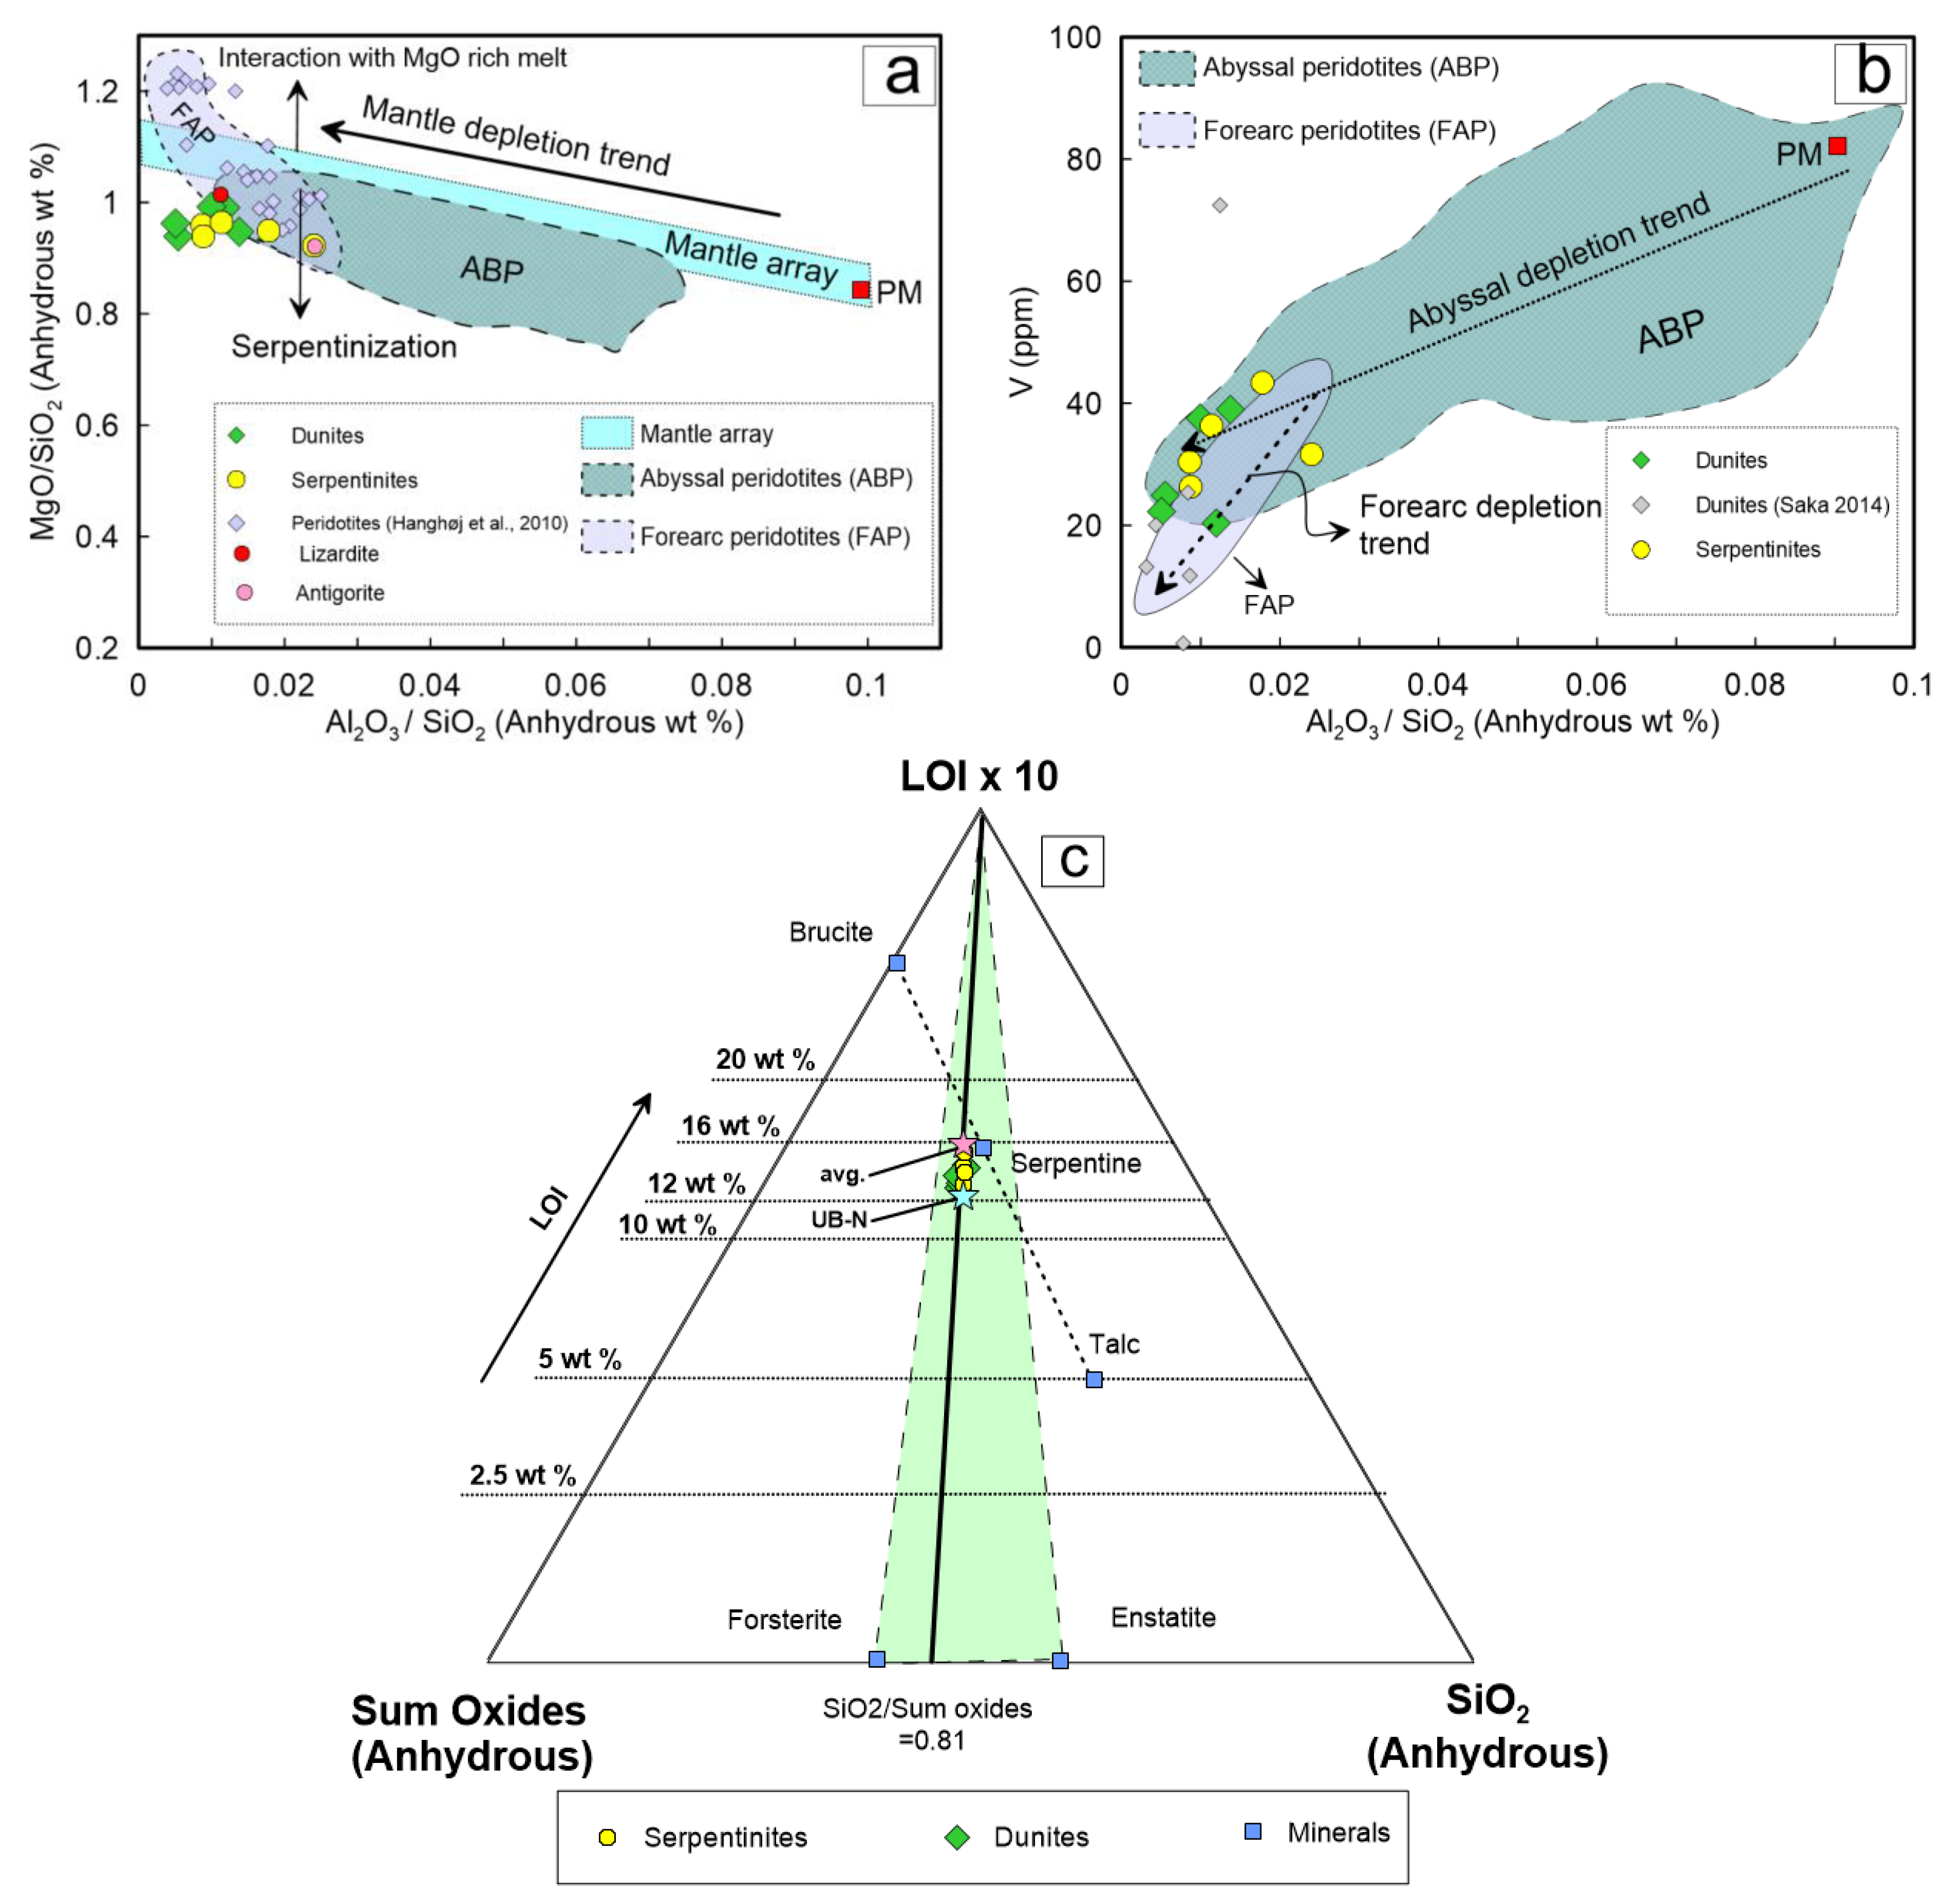
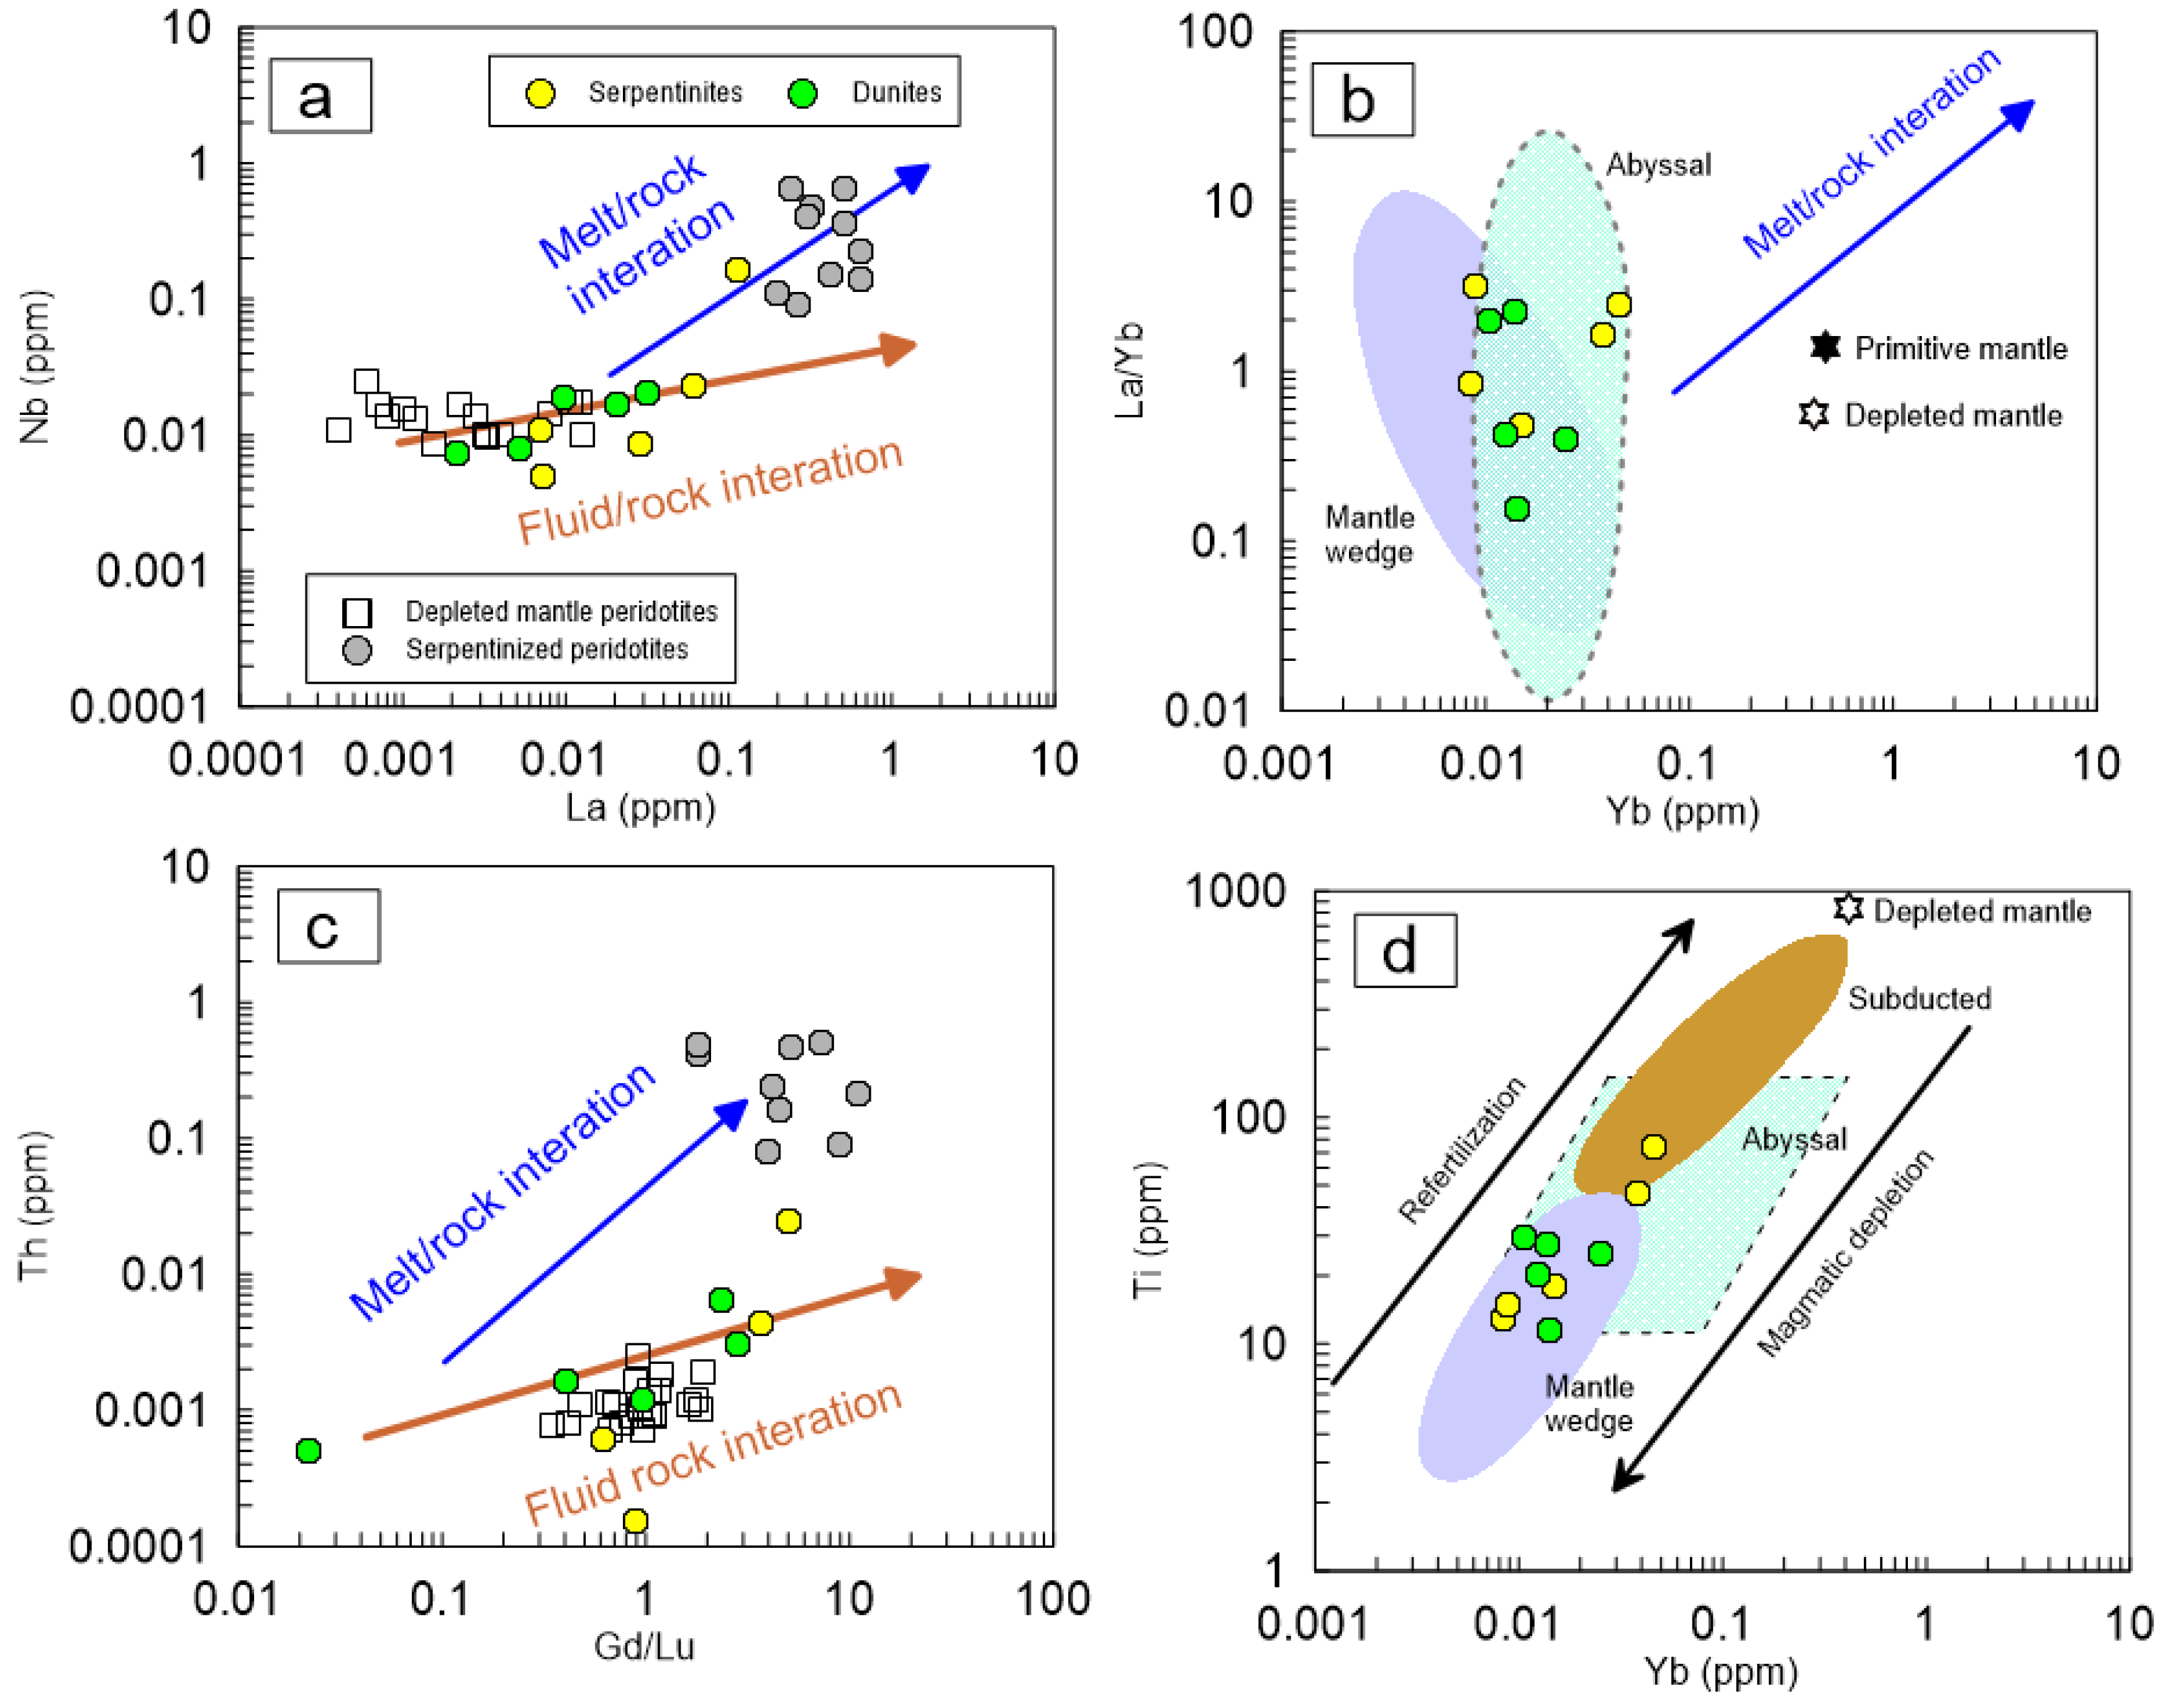
7.2. Fluid–Peridotite Interactions and Behaviour of Elements during Serpentinization Processes

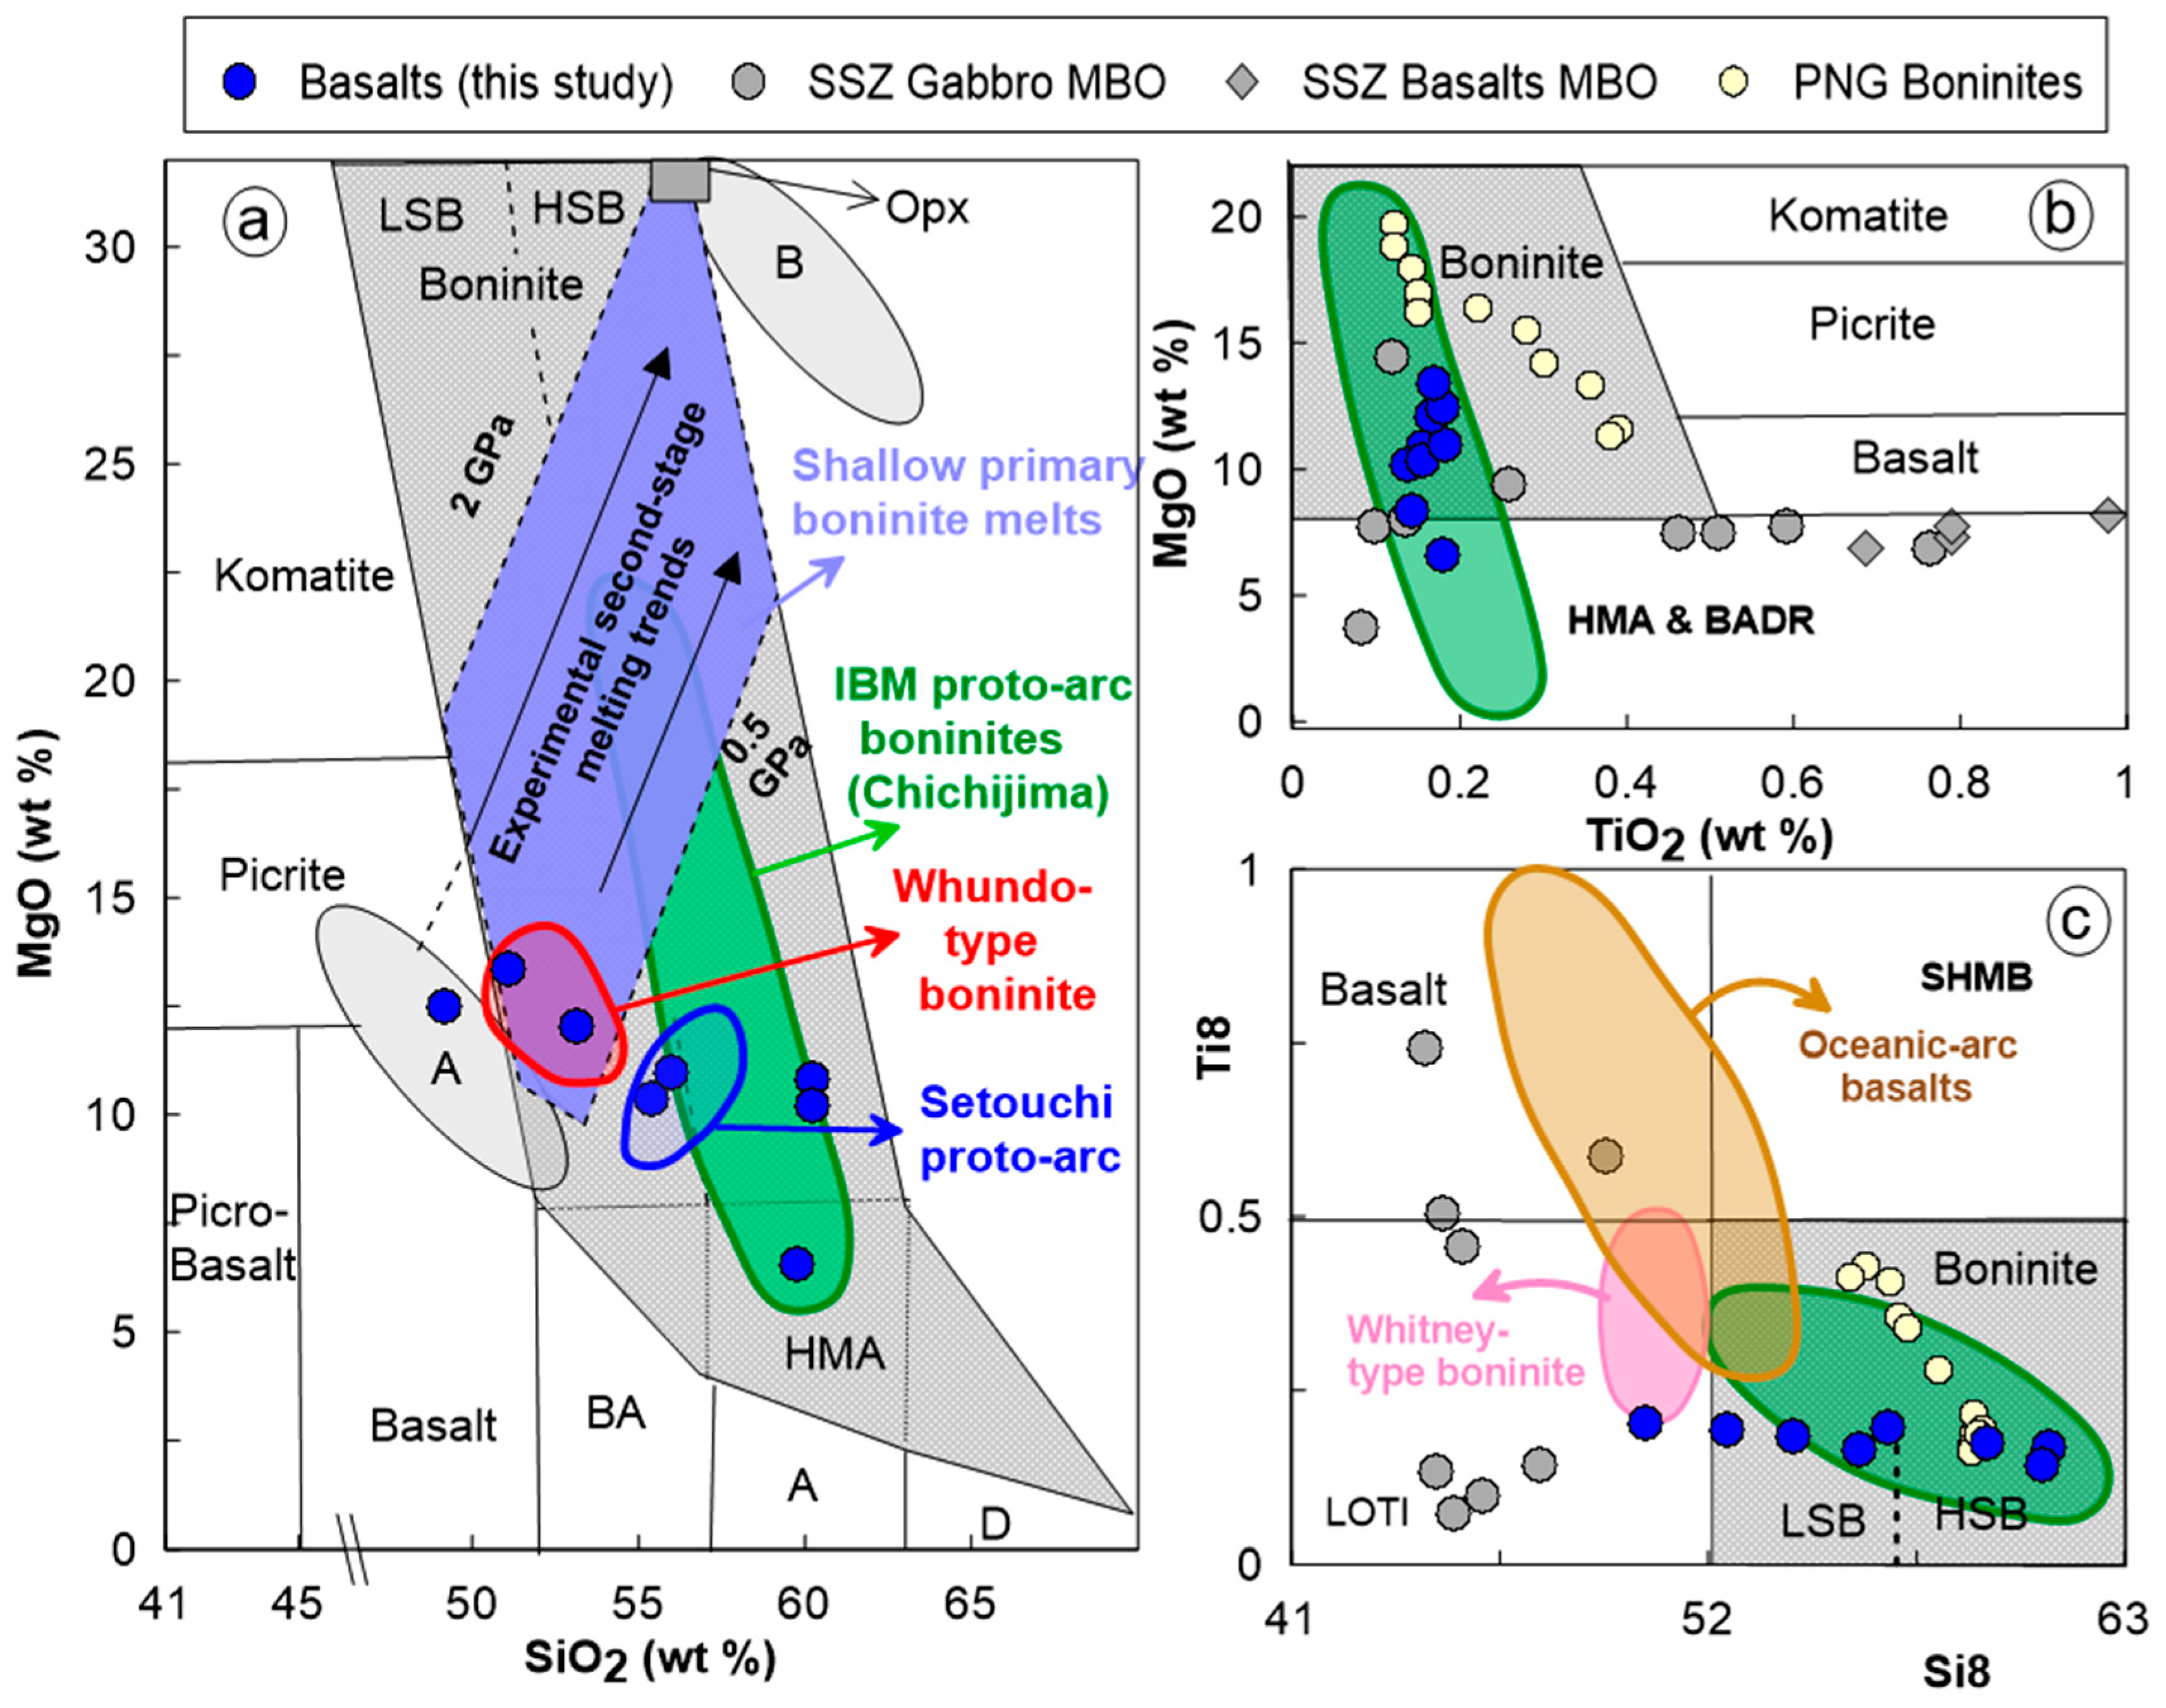
7.3. Formation of Boninitic Magmas during Subduction Initiation

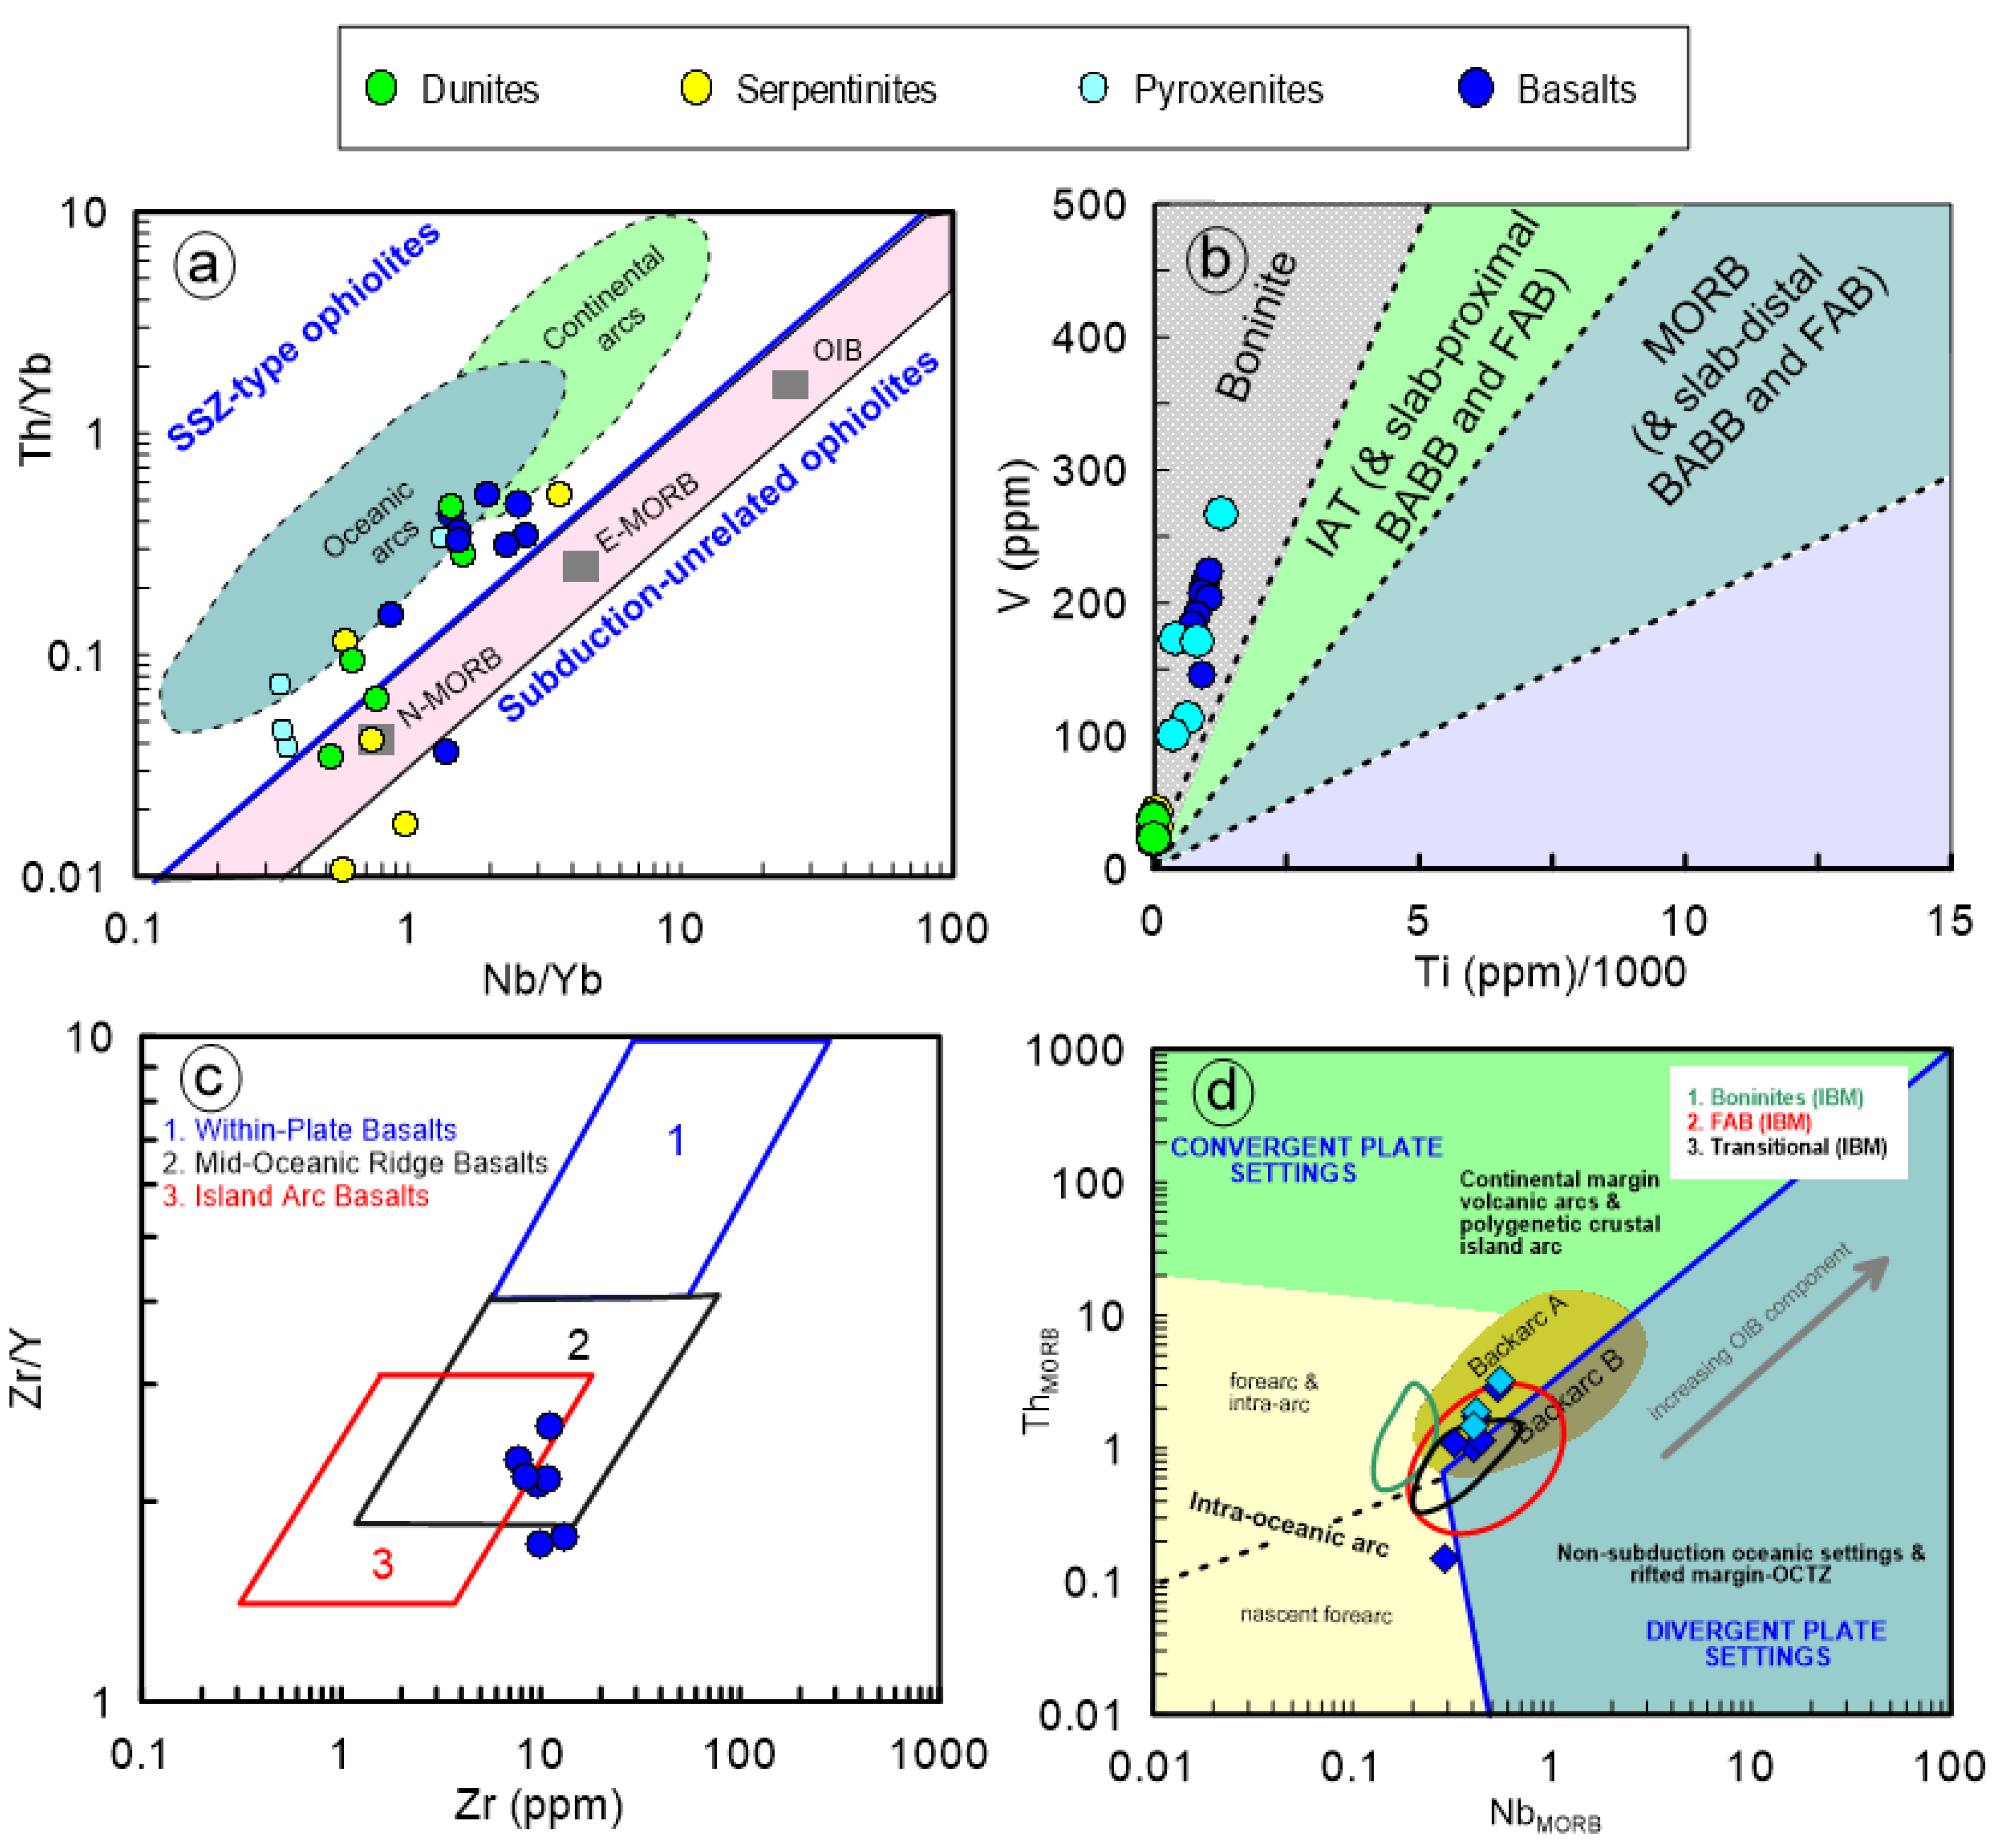
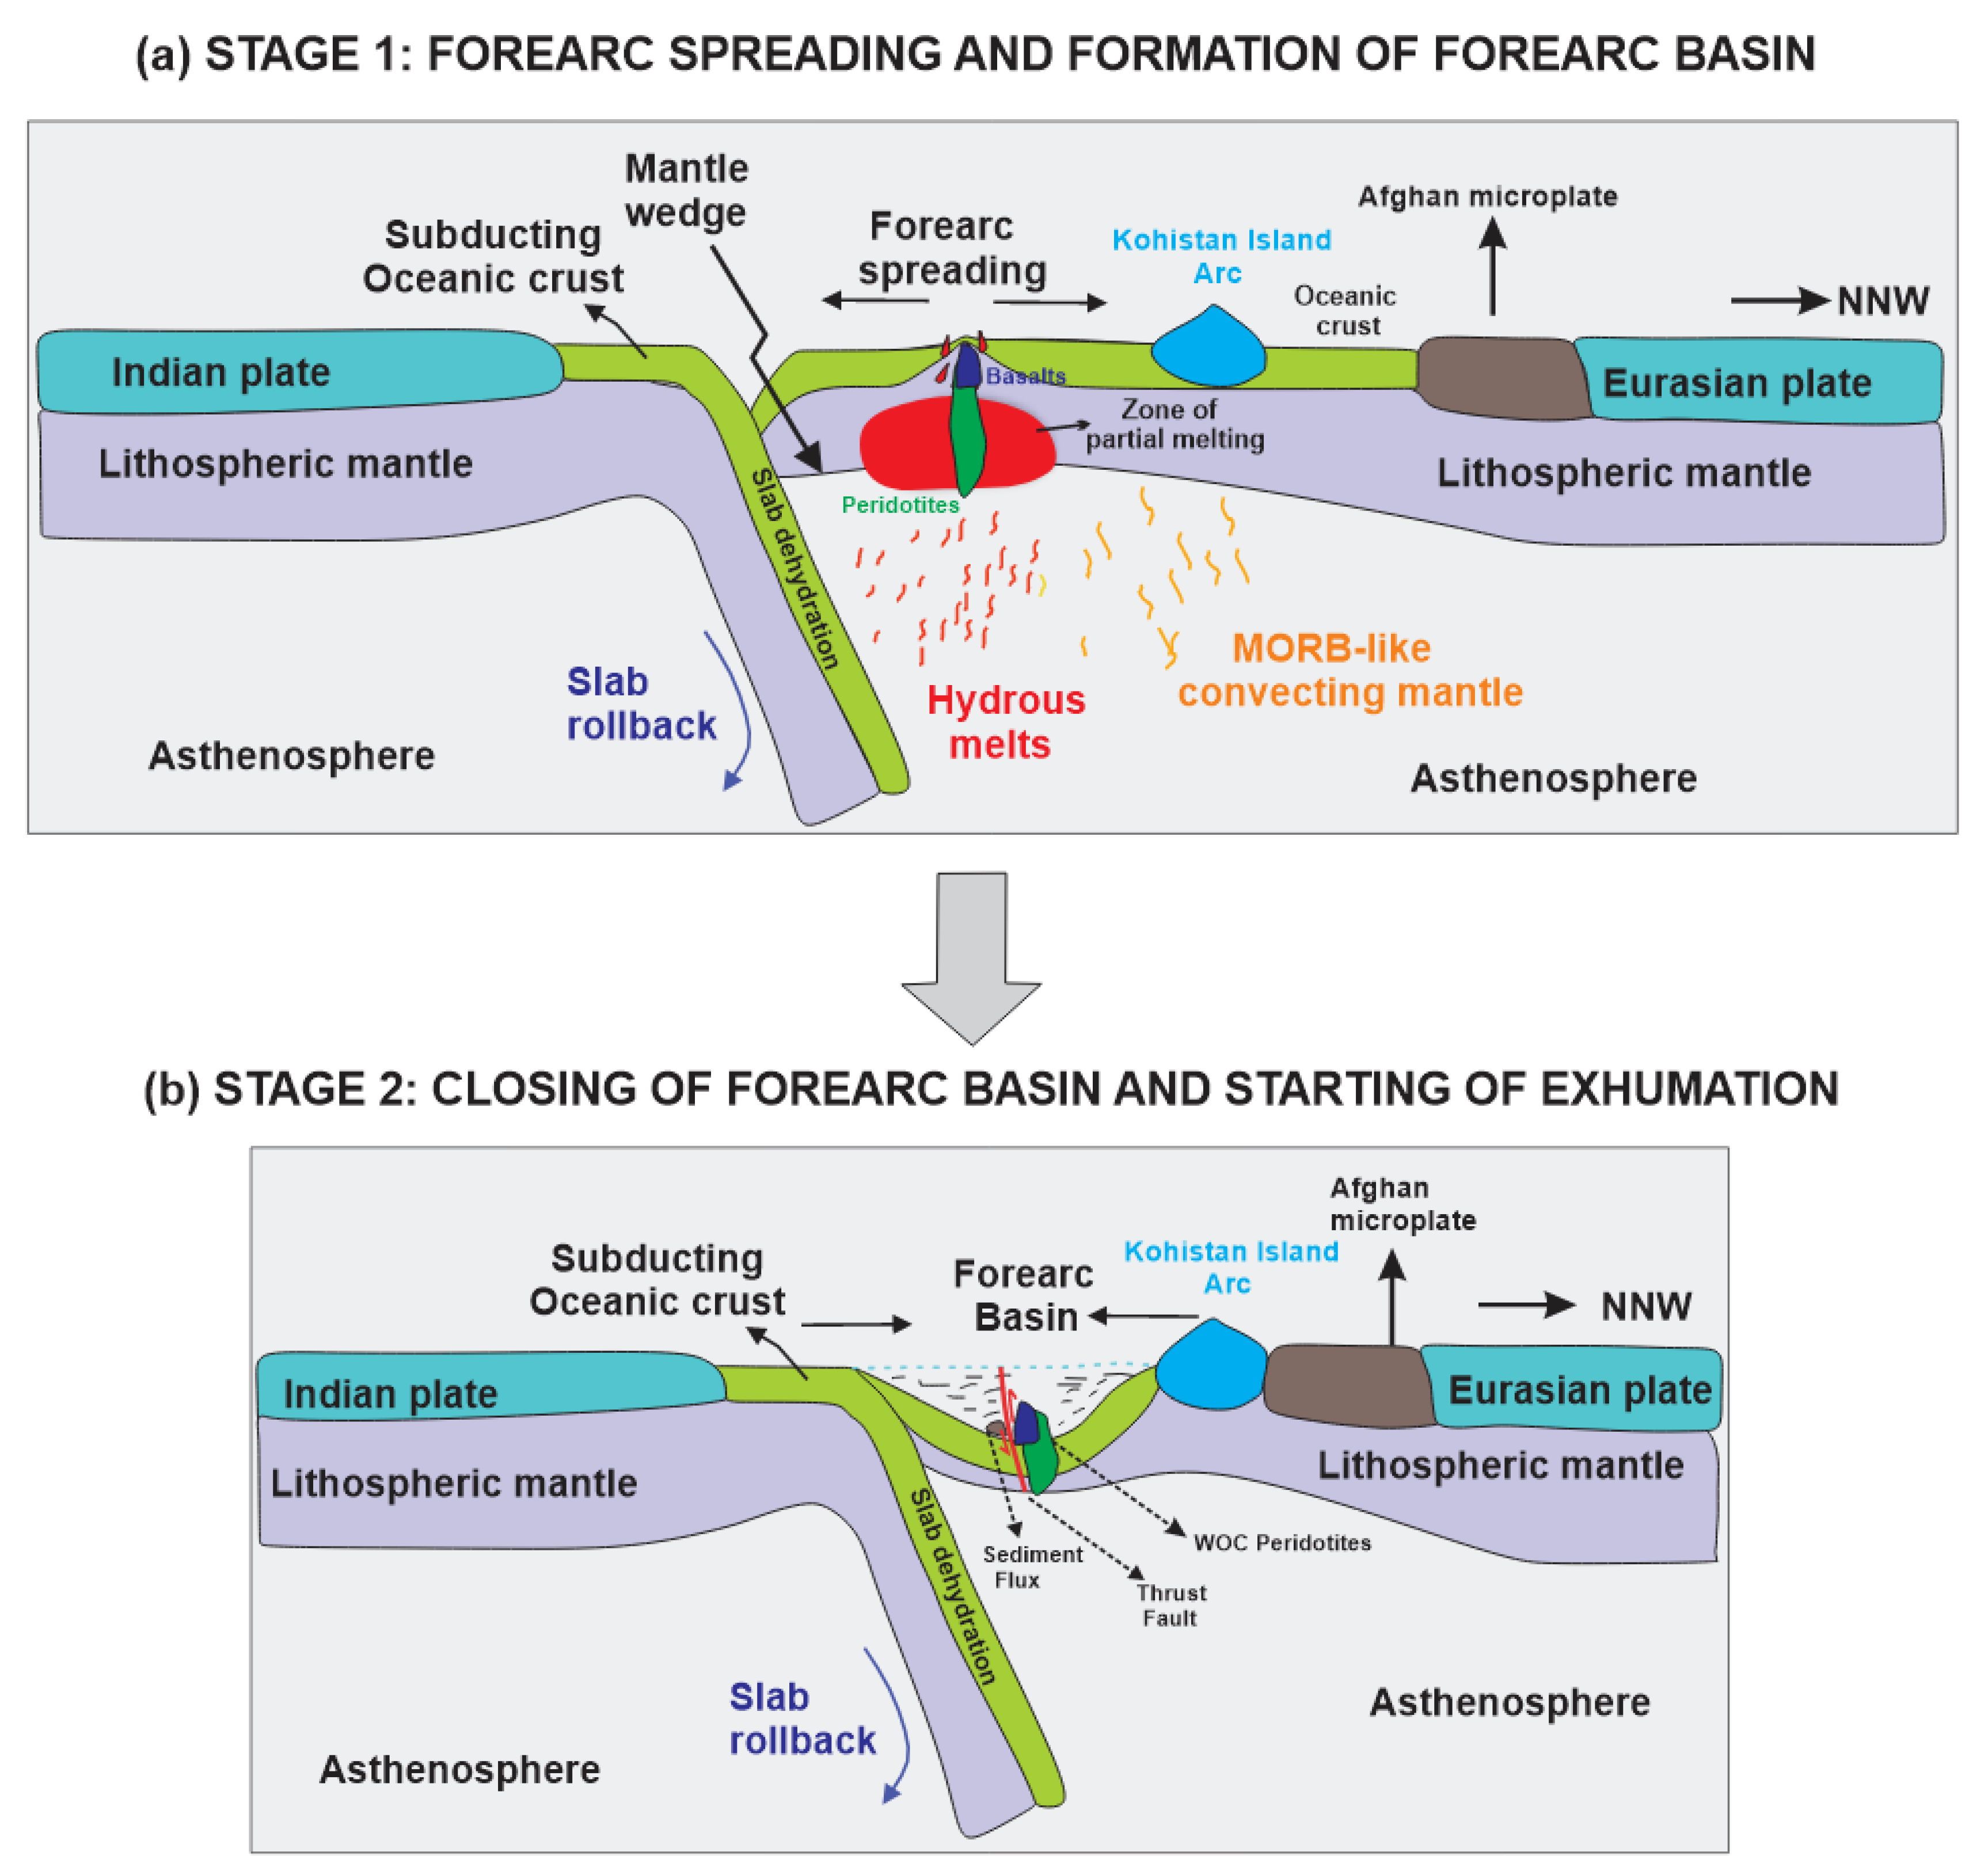
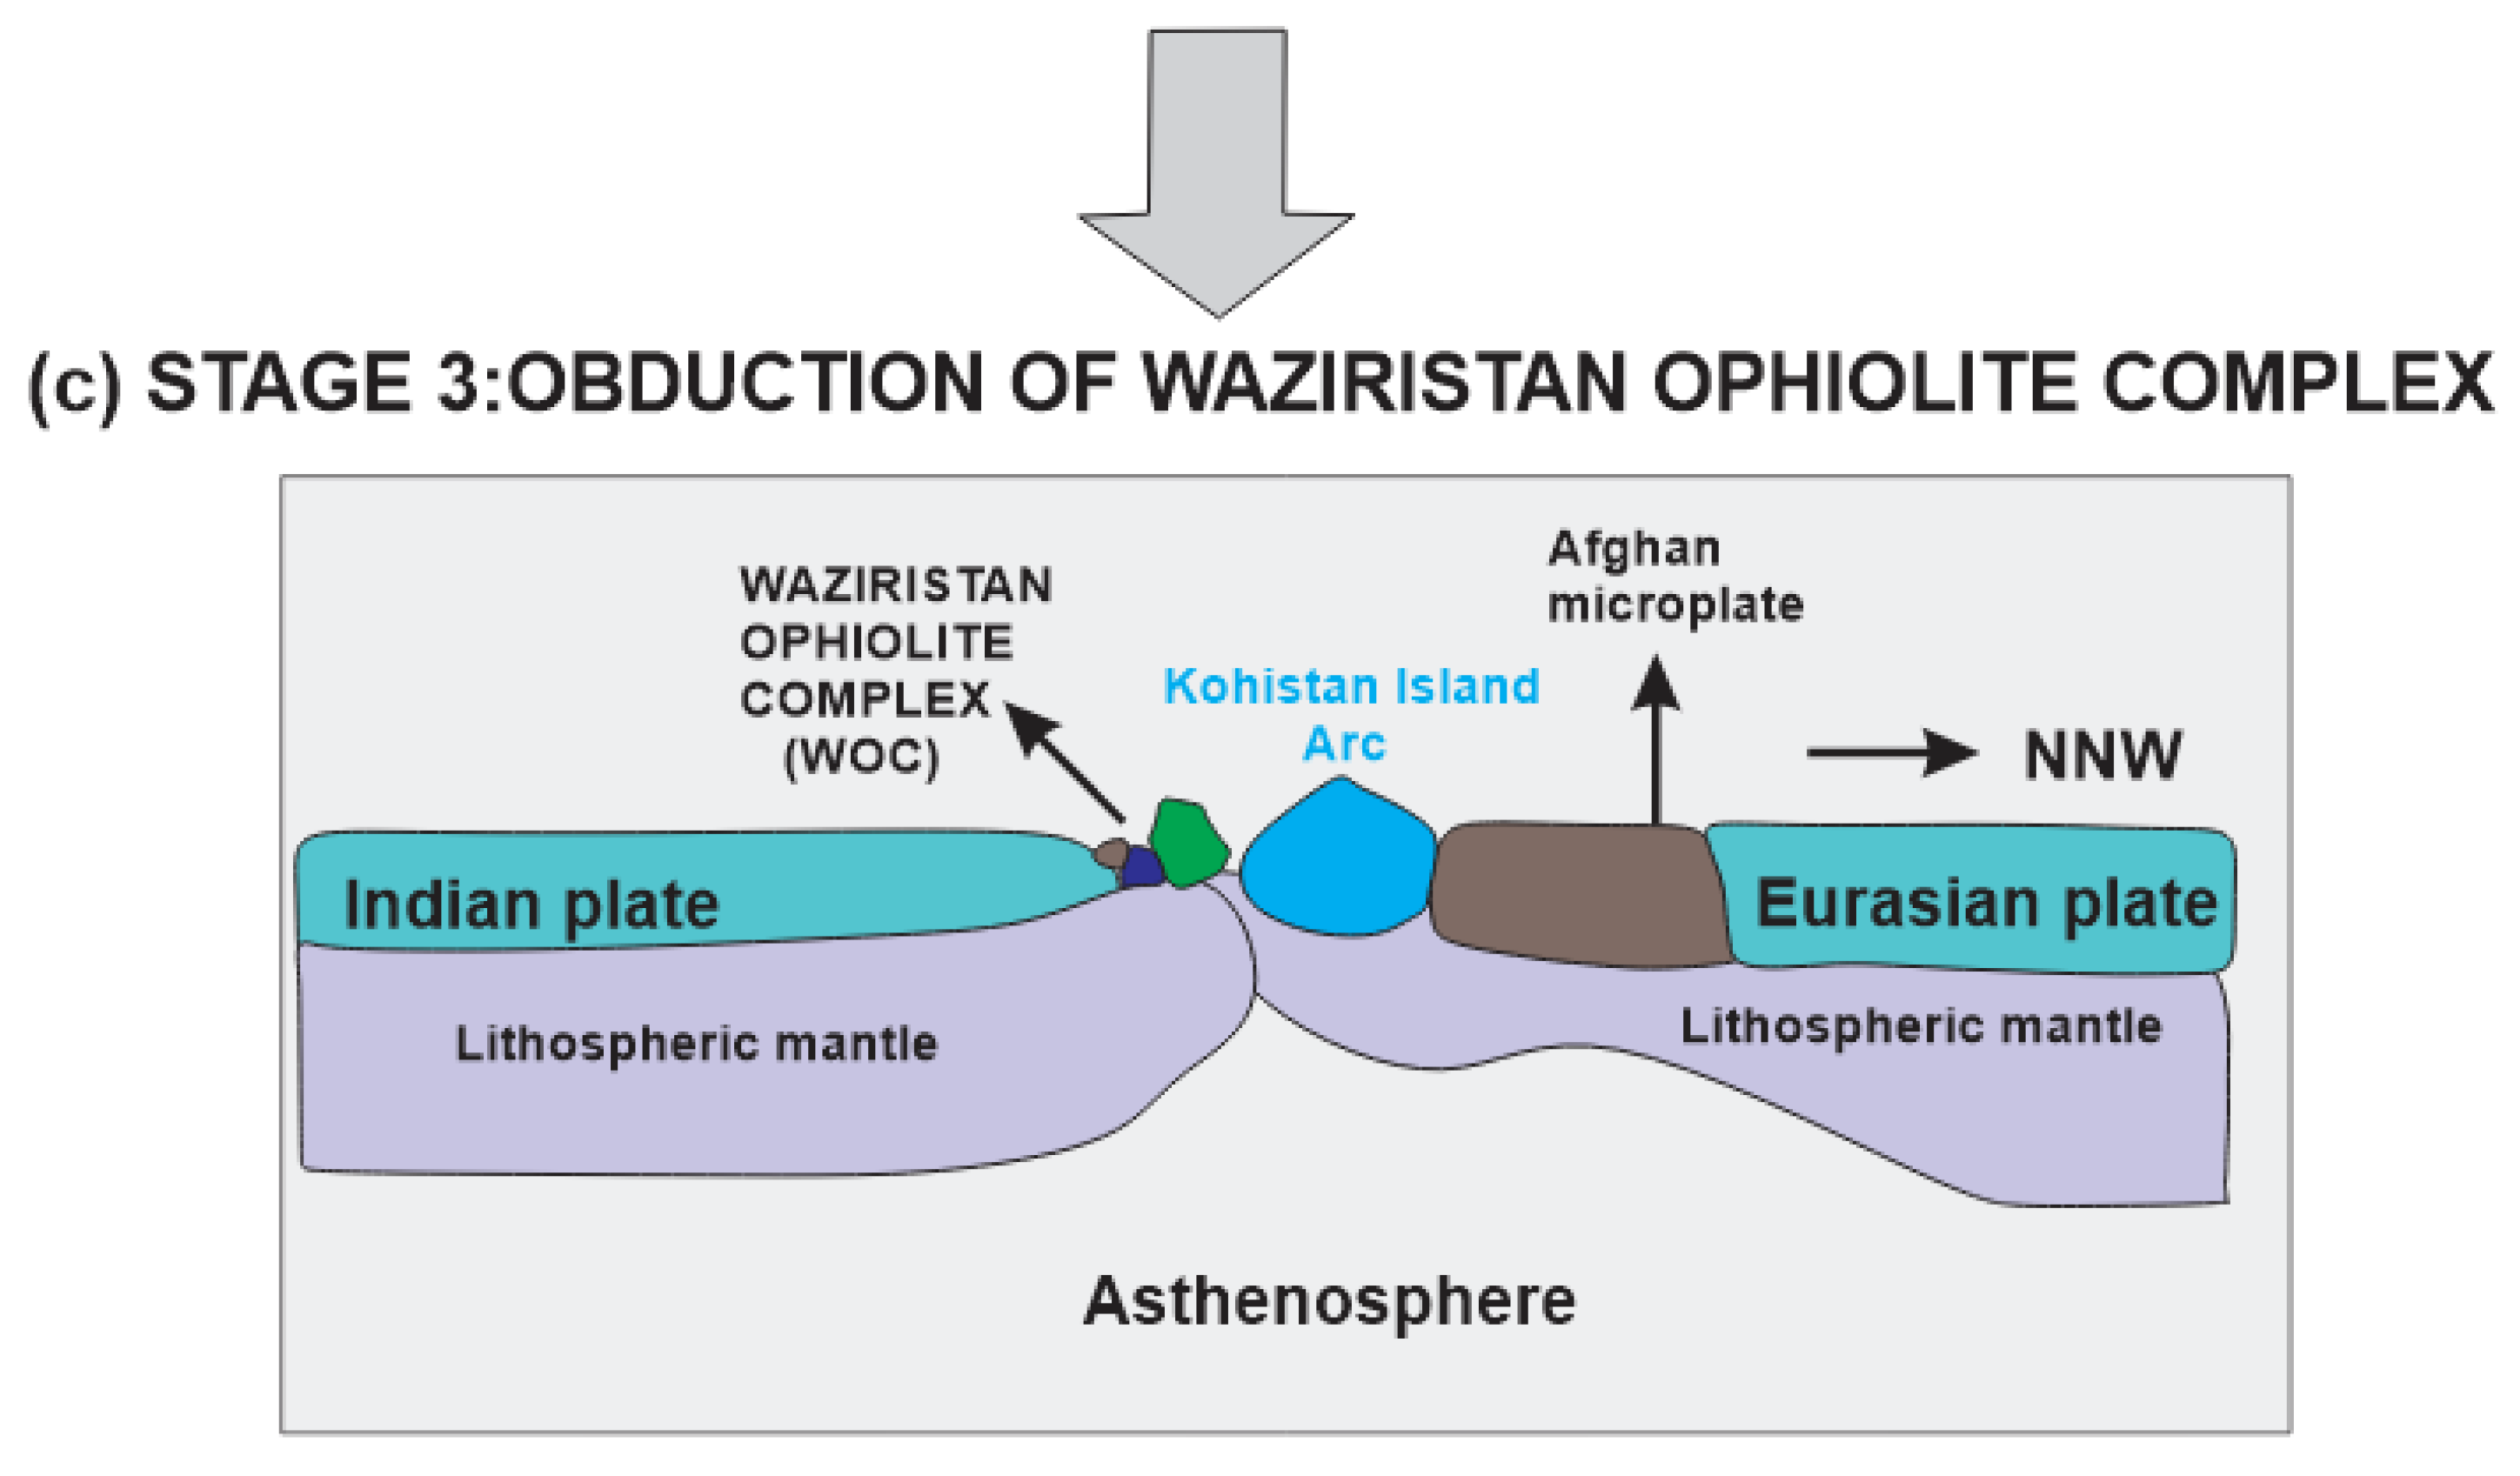
7.4. Tectonic Environment for the Formation of Waziristan Ophiolite
8. Conclusions
Supplementary Materials
Author Contributions
Funding
Data Availability Statement
Acknowledgments
Conflicts of Interest
References
- Molnar, P.; Tapponnier, P. The collision between India and Eurasia. Sci. Am. 1977, 236, 30–41. [Google Scholar] [CrossRef]
- Dilek, Y.; Furnes, H. Ophiolites and their origins. Elements 2014, 10, 93–100. [Google Scholar] [CrossRef]
- Robertson, A.H.F. Overview of the genesis and emplacement of Mesozoic ophiolites in the Eastern Mediterranean Tethyan region. Lithos 2002, 65, 1–67. [Google Scholar] [CrossRef]
- Kakar, M.I.; Kerr, A.C.; Mahmood, K.; Collins, A.S.; Khan, M.; McDonald, I.J.L. Supra-subduction zone tectonic setting of the Muslim Bagh Ophiolite, northwestern Pakistan: Insights from geochemistry and petrology. Lithos 2014, 202, 190–206. [Google Scholar] [CrossRef]
- Cawood, P.A.; Suhr, G. Generation and obduction of ophiolites: Constraints from the Bay of Islands Complex, western Newfoundland. Tectonics 1992, 11, 884–897. [Google Scholar] [CrossRef]
- Searle, M.; Cox, J. Tectonic setting, origin, and obduction of the Oman ophiolite. Geol. Soc. Am. Bull. 1999, 111, 104–122. [Google Scholar] [CrossRef]
- Müntener, O.; Kelemen, P.B.; Grove, T.L. The role of H2O during crystallization of primitive arc magmas under uppermost mantle conditions and genesis of igneous pyroxenites: An experimental study. Contrib. Mineral. Petrol. 2001, 141, 643–658. [Google Scholar] [CrossRef]
- Gruau, G.; Lecuyer, C.; Bernard-Griffiths, J.; Morin, N. Origin and petrogenesis of the Trinity Ophiolite Complex (California): New constraints from REE and Nd isotope data. J. Petrol. 1991, 2, 229–242. [Google Scholar] [CrossRef]
- Miyashiro, A. Classification, characteristics, and origin of ophiolites. J. Geol. 1975, 83, 249–281. [Google Scholar] [CrossRef]
- Parkinson, I.J.; Pearce, J.A. Peridotites from the Izu–Bonin–Mariana forearc (ODP Leg 125): Evidence for mantle melting and melt–mantle interaction in a supra-subduction zone setting. J. Petrol. 1998, 39, 1577–1618. [Google Scholar] [CrossRef]
- Dilek, Y.; Moores, E. Regional tectonics of the eastern Mediterranean ophiolites. In Proceedings of the Troodos 1987; Symposium: Washington, DC, USA, 1990; pp. 295–309. [Google Scholar]
- Khedr, M.Z.; Arai, S.; Python, M.; Tamura, A. Chemical variations of abyssal peridotites in the central Oman ophiolite: Evidence of oceanic mantle heterogeneity. Gondwana Res. 2014, 25, 1242–1262. [Google Scholar] [CrossRef]
- Moores, E.M. Origin and emplacement of ophiolites. Rev. Geophys. 1982, 20, 735–760. [Google Scholar] [CrossRef]
- Ghose, N.C.; Chatterjee, N. Ophiolite Around the Indian Plate Margin. In A Petrographic Atlas of Ophiolite; Springer: New York, NY, USA, 2014; pp. 9–24. [Google Scholar]
- Khan, S.R.; Jan, M.Q.; Khan, T.; Khan, M.A. Petrology of the dykes from the Waziristan Ophiolite, NW Pakistan. J. Asian Earth Sci. 2007, 29, 369–377. [Google Scholar] [CrossRef]
- Shah, M.T.; Khan, A. Geochemistry and origin of Mn-deposits in the Waziristan ophiolite complex, north Waziristan, Pakistan. Miner. Depos. 1999, 34, 697–704. [Google Scholar] [CrossRef]
- Beck, R.A.; Burbank, D.W.; Sercombe, W.J.; Khan, A.M.; Lawrence, R.D. Late Cretaceous ophiolite obduction and Paleocene India-Asia collision in the westernmost Himalaya. Geodin. Acta 1996, 9, 114–144. [Google Scholar] [CrossRef]
- Jan, M.Q.; Windley, B.F.; Khan, A. The Waziristan ophiolite, Pakistan; general geology and chemistry of chromite and associated phases. Econ. Geol. 1985, 80, 294–306. [Google Scholar] [CrossRef]
- Gansser, A. Reconnaissance visit to the ophiolites in Baluchistan and the Himalaya. Geodyn. Pak. 1979, 193–213. [Google Scholar]
- Allemann, F. Time of emplacement of the Zhob Valley ophiolites and Bela ophiolites, Baluchistan (preliminary report). Geodyn. Pakistan. Geol. Surv. Pak. Quetta 1979, 215–242. [Google Scholar]
- Arif, M.; Jan, M.Q. Petrotectonic significance of the chemistry of chromite in the ultramafic–mafic complexes of Pakistan. J. Asian Earth Sci. 2006, 27, 628–646. [Google Scholar] [CrossRef]
- Jones, A.G.; Manistre, B.E.; Oliver, R.L.; Willson, G.S.; Scott, H.S. Reconnaissance Geology of part of West Pakistan (Colombo Plan co-operative project conducted and compiled by Hunting Survey Corporation). Gov. Can. Tor. 1960, 550. [Google Scholar]
- DeJong, K.A.; Subhani, A.M. Note on the Bela ophiolites with special reference to the Kanar area. Geodyn. Pak. 1979, 263–269. [Google Scholar]
- Ullah, Z.; Li, J.-W.; Robinson, P.T.; Wu, W.-W.; Khan, A.; Dac, N.X.; Adam, M.M.A. Mineralogy and geochemistry of peridotites and chromitites in the Jijal Complex ophiolite along the Main Mantle Thrust (MMT or Indus Suture Zone) North Pakistan. Lithos 2020, 366, 105566. [Google Scholar] [CrossRef]
- Khan, S.R. Petrology and Geochemistry of Part of the Waziristan Ophiolite Complex. Ph.D. Thesis, University of Peshawar, Peshawar, Pakistan, 2000. [Google Scholar]
- Khan, S.R.; Khan, M.A. Petrology and Geochemistry of Trondhjemites from The Waziristan Ophiolite, Nw Pakistan. J. Himal. Earth Sci. 2003, 36, 49–63. [Google Scholar]
- Ahmad, W.; Hamidullah, S. Island Arc signatures from the Waziristan Igneous complex, NWFP, Pakistan. Geol. Bull. Univ. Peshawar 1987, 20, 161–180. [Google Scholar]
- Hamidullah, S. The Waziristan complex: Some more chemical data and their interpretation. Geol. Bull. Univ. Peshawar 1994, 27, 69–79. [Google Scholar]
- Asrarullah, A.Z.; Abbas, S.G. Ophiolites in Pakistan: An introduction. Geodyn. Pakistan. Geol. Surv. Pak. Quetta 1979, 181, 192. [Google Scholar]
- Ahsan, S.N.; Akhtar, T.; Khan, Z.A. Petrology of Bela-Khuzdar Ophiolites, Baluchistan. Pak. Geol. Surv. Inf. Release 1988, 307, 24. [Google Scholar]
- Khan, M.; Khan, M.J.; Mahmood, K.; Kakar, M.I. Geology and petrology of crustal section of Bela Ophiolite, Balochistan, Pakistan. Bahria Univ. Res. J. Earth Sci. 2018, 3, 1–5. [Google Scholar]
- Sarwar, G. Tectonic setting of the Bela Ophiolites, southern Pakistan. Tectonophysics 1992, 207, 359–381. [Google Scholar] [CrossRef]
- Salam, A.; Ahmed, Z. Ophiolitic Ultramafic-Mafic Rocks from Bagh Area: Acta Mineralogica Pakistanica; National Centre of Excellence in Mineralogy, University of Balochistan: Balochistan, Pakistan, 1986; Volume 2, pp. 65–73. [Google Scholar]
- Mahmood, K.; Boudier, F.; Gnos, E.; Monié, P.; Nicolas, A.J.T. 40Ar/39Ar dating of the emplacement of the Muslim Bagh ophiolite, Pakistan. Tectonophysics 1995, 250, 169–181. [Google Scholar] [CrossRef]
- Sawada, Y.; Siddiqui, R.; Khan, S.; Aziz, A. Mesozoic igneous activity in the Muslim Bagh area, Pakistan, with special reference to hotspot magmatism related to the break-up of the Gondwanaland. In Proceedings of Geoscience Colloquium Geoscience Laboratory, Geological Survey of Pakistan; National Centre of Excellence in Mineralogy, University of Balochistan: Balochistan, Pakistan, 1992; pp. 21–70. [Google Scholar]
- Siddiqui, R.H.; Aziz, A.; Mengal, J.M.; Hoshino, K.; Sawada, Y. Geology, Petrochemistry and tectonic evolution of Muslim Bagh ophiolite complex, Pakistan. In Proc. Of Geoscience Colloquium, Geoscience Lab.; Geological Survey of Pakistan: Islamabad, Pakistan, 1996; Volume 16, pp. 11–46. [Google Scholar]
- Siddiqui, R.H.; Mengal, J.M.; Hoshino, K.; Sawada, Y.; Brohi, I.A. Back-arc basin signatures represented by the sheeted dykes from the Muslim Bagh Ophiolite Complex, Balochistan, Pakistan. Sindh Univ. Res. J.-SURJ (Sci. Ser.) 2011, 43, 165–178. [Google Scholar]
- Ullah, I.; Xue, C.; Yang, T.; Xie, Z.; Wang, W.; Ghaffar, A. Depleted mantle beneath an oceanic island arc: New insights into peridotites of the RasKoh ophiolite, western Pakistan. Lithos 2022, 408, 106567. [Google Scholar] [CrossRef]
- Gnos, E.; Khan, M.; Mahmood, K.; Khan, A.S.; Shafique, N.A.; Villa, I.M. Bela oceanic lithosphere assemblage and its relation to the Reunion hotspot. Terra Nova-Oxf. 1998, 10, 90–95. [Google Scholar] [CrossRef]
- Siddiqui, R.H.; Aziz, A.; Mengal, J.M.; Hoshino, K.; Sawada, Y. Petrology and mineral chemistry of Muslim Bagh ophiolite complex and its tectonic implications. Proceeding Geosci. Colloq. Geol. Surv. Pak. 1994, 9, 17–50. [Google Scholar]
- Badshah, M.S.; Gnos, E.; Jan, M.Q.; Afridi, M.I. Stratigraphic and tectonic evolution of the northwestern Indian plate and Kabul Block. Geol. Soc. Lond. Spec. Publ. 2000, 170, 467–476. [Google Scholar] [CrossRef]
- Coleman, R.G.; Keith, T.E. A chemical study of serpentinization—Burro Mountain, California. J. Petrol. 1971, 12, 311–328. [Google Scholar] [CrossRef]
- Niu, Y. Mantle melting and melt extraction processes beneath ocean ridges: Evidence from abyssal peridotites. J. Petrol. 1997, 38, 1047–1074. [Google Scholar] [CrossRef]
- Snow, J.E.; Dick, H.J.B. Pervasive magnesium loss by marine weathering of peridotite. Geochim. Cosmochim. Acta 1995, 59, 4219–4235. [Google Scholar] [CrossRef]
- Sun, S.S.; McDonough, W.F. Chemical and isotopic systematics of oceanic basalts: Implications for mantle composition and processes. Geol. Soc. Lond. Spec. Publ. 1989, 42, 313–345. [Google Scholar] [CrossRef]
- Xiong, F.; Yang, J.; Robinson, P.T.; Gao, J.; Chen, Y.; Lai, S. Petrology and geochemistry of peridotites and podiform chromitite in the Xigaze ophiolite, Tibet: Implications for a suprasubduction zone origin. J. Asian Earth Sci. 2017, 146, 56–75. [Google Scholar] [CrossRef]
- Birner, S.K.; Warren, J.M.; Cottrell, E.; Davis, F.A.; Kelley, K.A.; Falloon, T.J. Forearc peridotites from Tonga record heterogeneous oxidation of the mantle following subduction initiation. J. Petrol. 2017, 58, 1755–1780. [Google Scholar] [CrossRef] [Green Version]
- Khedr, M.Z.; Takazawa, E.; Hauzenberger, C.; Tamura, A.; Arai, S.; Stern, R.J.; Morishita, T.; El-Awady, A. Petrogenesis of arc-related serpentinized peridotites (Egypt): Insights into Neoproterozoic mantle evolution beneath the Arabian-Nubian Shield. J. Asian Earth Sci. 2022, 226, 105078. [Google Scholar] [CrossRef]
- McDonough, W.F.; Sun, S.S.; Ringwood, A.E.; Jagoutz, E.; Hofmann, A.W. Potassium, rubidium, and cesium in the Earth and Moon and the evolution of the mantle of the Earth. Geochim. Cosmochim. Acta 1992, 56, 1001–1012. [Google Scholar] [CrossRef]
- Niu, Y. Bulk-rock major and trace element compositions of abyssal peridotites: Implications for mantle melting, melt extraction and post-melting processes beneath mid-ocean ridges. J. Petrol. 2004, 45, 2423–2458. [Google Scholar] [CrossRef] [Green Version]
- Bodinier, J.L.; Godard, M. Orogenic, ophiolitic, and abyssal peridotites. Treatise Geochem. 2003, 2, 568. [Google Scholar]
- Bhat, I.M.; Ahmad, T.; Rao, D.V.S. Origin and evolution of Suru Valley ophiolite peridotite slice along Indus suture zone, Ladakh Himalaya, India: Implications on melt-rock interaction in a subduction-zone environment. Geochemistry 2019, 79, 78–93. [Google Scholar] [CrossRef]
- Çelik, Ö.F.; Marzoli, A.; Marschik, R.; Chiaradia, M.; Mathur, R. Geochemical, mineralogical and Re-Os isotopic constraints on the origin of Tethyan oceanic mantle and crustal rocks from the Central Pontides, northern Turkey. Mineral. Petrol. 2018, 112, 25–44. [Google Scholar] [CrossRef]
- Lyubetskaya, T.; Korenaga, J. Chemical composition of Earth’s primitive mantle and its variance: 1. Method and results. J. Geophys. Res. Solid Earth 2007, 112. [Google Scholar] [CrossRef] [Green Version]
- Khedr, M.Z.; Arai, S.; Tamura, A.; Morishita, T. Clinopyroxenes in high-P metaperidotites from Happo-O’ne, central Japan: Implications for wedge-transversal chemical change of slab-derived fluids. Lithos 2010, 119, 439–456. [Google Scholar] [CrossRef]
- Deschamps, F.; Godard, M.; Guillot, S.; Hattori, K. Geochemistry of subduction zone serpentinites: A review. Lithos 2013, 178, 96–127. [Google Scholar] [CrossRef]
- Pearce, J.A.; Barker, P.F.; Edwards, S.J.; Parkinson, I.J.; Leat, P.T. Geochemistry and tectonic significance of peridotites from the South Sandwich arc–basin system, South Atlantic. Contrib. Mineral. Petrol. 2000, 139, 36–53. [Google Scholar] [CrossRef]
- Deschamps, F.; Guillot, S.; Godard, M.; Chauvel, C.; Andreani, M.; Hattori, K. In situ characterization of serpentinites from forearc mantle wedges: Timing of serpentinization and behavior of fluid-mobile elements in subduction zones. Chem. Geol. 2010, 269, 262–277. [Google Scholar] [CrossRef]
- Hanghøj, K.; Kelemen, P.B.; Hassler, D.; Godard, M. Composition and genesis of depleted mantle peridotites from the Wadi Tayin Massif, Oman Ophiolite; major and trace element geochemistry, and Os isotope and PGE systematics. J. Petrol. 2010, 51, 201–227. [Google Scholar] [CrossRef]
- Garrido, C.J.; Bodinier, J.-L.; Burg, J.-P.; Zeilinger, G.; Hussain, S.S.; Dawood, H.; Chaudhry, M.N.; Gervilla, F. Petrogenesis of mafic garnet granulite in the lower crust of the Kohistan paleo-arc complex (Northern Pakistan): Implications for intra-crustal differentiation of island arcs and generation of continental crust. J. Petrol. 2006, 47, 1873–1914. [Google Scholar] [CrossRef]
- Dhuime, B.; Bosch, D.; Bodinier, J.L.; Garrido, C.J.; Bruguier, O.; Hussain, S.S.; Dawood, H. Multistage evolution of the Jijal ultramafic–mafic complex (Kohistan, N Pakistan): Implications for building the roots of island arcs. Earth Planet. Sci. Lett. 2007, 261, 179–200. [Google Scholar] [CrossRef]
- Božović, M.; Prelević, D.; Romer, R.L.; Barth, M.; Van Den Bogaard, P.; Boev, B. The Demir Kapija Ophiolite, Macedonia (FYROM): A snapshot of subduction initiation within a back-arc. J. Petrol. 2013, 54, 1427–1453. [Google Scholar] [CrossRef] [Green Version]
- Dilek, Y.; Furnes, H.; Shallo, M. Geochemistry of the Jurassic Mirdita Ophiolite (Albania) and the MORB to SSZ evolution of a marginal basin oceanic crust. Lithos 2008, 100, 174–209. [Google Scholar] [CrossRef]
- König, S.; Münker, C.; Schuth, S.; Luguet, A.; Hoffmann, J.E.; Kuduon, J. Boninites as windows into trace element mobility in subduction zones. Geochim. Cosmochim. Acta 2010, 74, 684–704. [Google Scholar] [CrossRef]
- Pearce, J.A.; Peate, D.W. Tectonic implications of the composition of volcanic arc magmas. Annu. Rev. Earth Planet. Sci. 1995, 23, 251–286. [Google Scholar] [CrossRef]
- Münker, C.; Wörner, G.; Yogodzinski, G.; Churikova, T. Behaviour of high field strength elements in subduction zones: Constraints from Kamchatka–Aleutian arc lavas. Earth Planet. Sci. Lett. 2004, 224, 275–293. [Google Scholar] [CrossRef]
- Reagan, M.K.; Ishizuka, O.; Stern, R.J.; Kelley, K.A.; Ohara, Y.; Blichert-Toft, J.; Bloomer, S.H.; Cash, J.; Fryer, P.; Hanan, B.B.J.G. Fore-arc basalts and subduction initiation in the Izu-Bonin-Mariana system. Geochem. Geophys. Geosystems 2010, 11. [Google Scholar] [CrossRef] [Green Version]
- Hickey-Vargas, R.; Yogodzinski, G.M.; Ishizuka, O.; McCarthy, A.; Bizimis, M.; Kusano, Y.; Savov, I.P.; Arculus, R. Origin of depleted basalts during subduction initiation and early development of the Izu-Bonin-Mariana island arc: Evidence from IODP expedition 351 site U1438, Amami-Sankaku basin. Geochim. Cosmochim. Acta 2018, 229, 85–111. [Google Scholar] [CrossRef]
- Ishikawa, T.; Fujisawa, S.; Nagaishi, K.; Masuda, T.J.E.; Letters, P.S. Trace element characteristics of the fluid liberated from amphibolite-facies slab: Inference from the metamorphic sole beneath the Oman ophiolite and implication for boninite genesis. Earth Planet. Sci. Lett. 2005, 240, 355–377. [Google Scholar] [CrossRef]
- Le Bas, M.J. IUGS Reclassification of the High-Mg and Picritic Volcanic Rocks. J. Petrol. 2000, 41, 1467–1470. [Google Scholar] [CrossRef] [Green Version]
- Le Maitre, R.W.; Streckeisen, A.; Zanettin, B.; Le Bas, M.J.; Bonin, B.; Bateman, P. Igneous Rocks: A Classification and Glossary of terms: Recommendations of the International Union of Geological Sciences Subcommission on the Systematics of Igneous Rocks; Cambridge University Press: Cambridge, UK, 2005. [Google Scholar]
- Irvine, T.N.; Baragar, W.R.A. A guide to the chemical classification of the common volcanic rocks. Can. J. Earth Sci. 1971, 8, 523–548. [Google Scholar] [CrossRef]
- Hastie, A.R.; Kerr, A.C.; Pearce, J.A.; Mitchell, S.F. Classification of Altered Volcanic Island Arc Rocks using Immobile Trace Elements: Development of the Th–Co Discrimination Diagram. J. Petrol. 2007, 48, 2341–2357. [Google Scholar] [CrossRef] [Green Version]
- Meffre, S.; Falloon, T.J.; Crawford, T.J.; Hoernle, K.; Hauff, F.; Duncan, R.A.; Bloomer, S.H.; Wright, D.J. Basalts erupted along the Tongan fore arc during subduction initiation: Evidence from geochronology of dredged rocks from the Tonga fore arc and trench. Geochem. Geophys. Geosystems 2012, 13. [Google Scholar] [CrossRef]
- Beier, C.; Turner, S.P.; Sinton, J.M.; Gill, J.B. Influence of subducted components on back-arc melting dynamics in the Manus Basin. Geochem. Geophys. Geosystems 2010, 11. [Google Scholar] [CrossRef] [Green Version]
- Ishizuka, O.; Tani, K.; Reagan, M.K.; Kanayama, K.; Umino, S.; Harigane, Y.; Sakamoto, I.; Miyajima, Y.; Yuasa, M.; Dunkley, D.J.J.E.; et al. The timescales of subduction initiation and subsequent evolution of an oceanic island arc. Earth Planet. Sci. Lett. 2011, 306, 229–240. [Google Scholar] [CrossRef]
- Workman, R.K.; Hart, S.R. Major and trace element composition of the depleted MORB mantle (DMM). Earth Planet. Sci. Lett. 2005, 231, 53–72. [Google Scholar] [CrossRef]
- De Hoog, J.C.M.; Janák, M.; Vrabec, M.; Froitzheim, N. Serpentinised peridotites from an ultrahigh-pressure terrane in the Pohorje Mts. (Eastern Alps, Slovenia): Geochemical constraints on petrogenesis and tectonic setting. Lithos 2009, 109, 209–222. [Google Scholar] [CrossRef] [Green Version]
- Hellebrand, E.; Snow, J.E.; Dick, H.J.B.; Hofmann, A.W. Coupled major and trace elements as indicators of the extent of melting in mid-ocean-ridge peridotites. Nature 2001, 410, 677–681. [Google Scholar] [CrossRef] [PubMed]
- Hirose, K.; Kawamoto, T. Hydrous partial melting of lherzolite at 1 GPa: The effect of H2O on the genesis of basaltic magmas. Earth Planet. Sci. Lett. 1995, 133, 463–473. [Google Scholar] [CrossRef]
- Frey, F.A.; Suen, C.J.; Stockman, H. The Ronda high temperature peridotite: Geochemistry and petrogenesis. Geochim. Cosmochim. Acta 1985, 49, 2469–2491. [Google Scholar] [CrossRef]
- Takazawa, E.; Okayasu, T.; Satoh, K. Geochemistry and origin of the basal lherzolites from the northern Oman ophiolite (northern Fizh block). Geochem. Geophys. Geosystems 2003, 4. [Google Scholar] [CrossRef]
- Niu, Y.; Langmuir, C.H.; Kinzler, R.J. The origin of abyssal peridotites: A new perspective. Earth Planet. Sci. Lett. 1997, 152, 251–265. [Google Scholar] [CrossRef]
- Kapsiotis, A.N. Physiognomy and timing of metasomatism in the southern Vourinos ultramafic suite, NW Greece: A chronicle of consecutive episodes of melt extraction and stagnation in the Neotethyan lithospheric mantle. Int. J. Earth Sci. 2016, 105, 983–1013. [Google Scholar] [CrossRef]
- Suhr, G. Melt migration under oceanic ridges: Inferences from reactive transport modelling of upper mantle hosted dunites. J. Petrol. 1999, 40, 575–599. [Google Scholar] [CrossRef]
- Green, T.H.; Blundy, J.D.; Adam, J.; Yaxley, G.M. SIMS determination of trace element partition coefficients between garnet, clinopyroxene and hydrous basaltic liquids at 2–7.5 GPa and 1080–1200 C. Lithos 2000, 53, 165–187. [Google Scholar] [CrossRef]
- Uysal, İ.; Ersoy, E.Y.; Karslı, O.; Dilek, Y.; Sadıklar, M.B.; Ottley, C.J.; Tiepolo, M.; Meisel, T.J.L. Coexistence of abyssal and ultra-depleted SSZ type mantle peridotites in a Neo-Tethyan Ophiolite in SW Turkey: Constraints from mineral composition, whole-rock geochemistry (major–trace–REE–PGE), and Re–Os isotope systematics. Lithos 2012, 132, 50–69. [Google Scholar] [CrossRef]
- Palme, H.; O’Neill, H. Cosmochemical Estimates of Mantle Composition. Treatise Geochem. 2003, 2, 1–38. [Google Scholar] [CrossRef]
- Pearce, J.A.; Parkinson, I.J. Trace element models for mantle melting: Application to volcanic arc petrogenesis. Geol. Soc. Lond. Spec. Publ. 1993, 76, 373–403. [Google Scholar] [CrossRef]
- McDonough, W.F.; Sun, S.S. The composition of the Earth. Chem. Geol. 1995, 120, 223–253. [Google Scholar] [CrossRef]
- Ranero, C.R.; Phipps Morgan, J.; McIntosh, K.; Reichert, C.J.N. Bending-related faulting and mantle serpentinization at the Middle America trench. Nature 2003, 425, 367–373. [Google Scholar] [CrossRef] [PubMed]
- Evans, C.; Hawkins, J.W. Mariana arc-trench system: Petrology of ‘seamounts’ on the trench-slope break. Eos 1979, 60, 968. [Google Scholar]
- Escartin, J.; Hirth, G.; Evans, B. Effects of serpentinization on the lithospheric strength and the style of normal faulting at slow-spreading ridges. Earth Planet. Sci. Lett. 1997, 151, 181–189. [Google Scholar] [CrossRef]
- Guillot, S.; Schwartz, S.; Reynard, B.; Agard, P.; Prigent, C. Tectonic significance of serpentinites. Tectonophysics 2015, 646, 1–19. [Google Scholar] [CrossRef]
- Malvoisin, B. Mass transfer in the oceanic lithosphere: Serpentinization is not isochemical. Earth Planet. Sci. Lett. 2015, 430, 75–85. [Google Scholar] [CrossRef]
- Monnier, C.; Girardeau, J.; Le Mee, L.; Polve, M.J.G. Along-ridge petrological segmentation of the mantle in the Oman ophiolite. Geochem. Geophys. Geosystems 2006, 7. [Google Scholar] [CrossRef]
- Jagoutz, E.; Palme, H.; Baddenhausen, H.; Blum, K.; Cendales, M.; Dreibus, G.; Spettel, B.; Lorenz, V.; Wänke, H. The abundances of major, minor and trace elements in the earth’s mantle as derived from primitive ultramafic nodules. In Lunar and Planetary Science Conference Proceedings; Pergamon Press Inc.: New York, NY, USA, 1979; pp. 2031–2050. [Google Scholar]
- Hart, S.R.; Zindler, A. In search of a bulk-Earth composition. Chem. Geol. 1986, 57, 247–267. [Google Scholar] [CrossRef]
- Bogolepov, V.G. Problem of serpentinization of ultrabasic rocks. Int. Geol. Rev. 1970, 12, 421–432. [Google Scholar] [CrossRef]
- Jochum, K.P.; Nohl, U.; Herwig, K.; Lammel, E.; Stoll, B.; Hofmann, A.W. GeoReM: A New Geochemical Database for Reference Materials and Isotopic Standards. Geostand. Geoanalytical Res. 2005, 29, 333–338. [Google Scholar] [CrossRef]
- Bebout, G.E. Metamorphic chemical geodynamics of subduction zones. Earth Planet. Sci. Lett. 2007, 260, 373–393. [Google Scholar] [CrossRef]
- Jarrard, R.D. Subduction fluxes of water, carbon dioxide, chlorine, and potassium. Geochem. Geophys. Geosystems 2003, 4. [Google Scholar] [CrossRef]
- Agostini, S.; Ryan, J.G.; Tonarini, S.; Innocenti, F. Drying and dying of a subducted slab: Coupled Li and B isotope variations in Western Anatolia Cenozoic Volcanism. Earth Planet. Sci. Lett. 2008, 272, 139–147. [Google Scholar] [CrossRef]
- Alt, J.C.; Shanks, W.C. Serpentinization of abyssal peridotites from the MARK area, Mid-Atlantic Ridge: Sulfur geochemistry and reaction modeling. Geochim. Cosmochim. Acta 2003, 67, 641–653. [Google Scholar] [CrossRef]
- Vils, F.; Pelletier, L.; Kalt, A.; Müntener, O.; Ludwig, T. The lithium, boron and beryllium content of serpentinized peridotites from ODP Leg 209 (Sites 1272A and 1274A): Implications for lithium and boron budgets of oceanic lithosphere. Geochim. Cosmochim. Acta 2008, 72, 5475–5504. [Google Scholar] [CrossRef] [Green Version]
- Paulick, H.; Bach, W.; Godard, M.; De Hoog, J.C.M.; Suhr, G.; Harvey, J. Geochemistry of abyssal peridotites (Mid-Atlantic Ridge, 15°20′ N, ODP Leg 209): Implications for fluid/rock interaction in slow spreading environments. Chem. Geol. 2006, 234, 179–210. [Google Scholar] [CrossRef] [Green Version]
- Saka, S.; Uysal, I.; Akmaz, R.M.; Kaliwoda, M.; Hochleitner, R.J.L. The effects of partial melting, melt–mantle interaction and fractionation on ophiolite generation: Constraints from the late Cretaceous Pozantı-Karsantı ophiolite, southern Turkey. Lithos 2014, 202, 300–316. [Google Scholar] [CrossRef]
- Lian, D.; Yang, J.; Robinson, P.T.; Liu, F.; Xiong, F.; Zhang, L.; Gao, J.; Wu, W. Tectonic evolution of the western Yarlung Zangbo Ophiolitic Belt, Tibet: Implications from the petrology, mineralogy, and geochemistry of the peridotites. J. Geol. 2016, 124, 353–376. [Google Scholar] [CrossRef]
- Salters, V.J.M.; Stracke, A. Composition of the depleted mantle. Geochem. Geophys. Geosystems 2004, 5. [Google Scholar] [CrossRef]
- Crawford, A.J.; Falloon, T.J.; Green, D.H. Classification, petrogenesis and tectonic setting of Boninites. In Boninites and Related Rocks; Unwin Hyman: London, UK, 1989; pp. 1–49. [Google Scholar]
- Hickey, R.L.; Frey, F.A. Geochemical characteristics of boninite series volcanics: Implications for their source. Geochim. Cosmochim. Acta 1982, 46, 2099–2115. [Google Scholar] [CrossRef]
- Jenner, G.A. Geochemistry of high-Mg andesites from Cape Vogel, Papua New Guinea. Chem. Geol. 1981, 33, 307–332. [Google Scholar] [CrossRef]
- Ringwood, A.E. Origin of the Earth and Moon; Springer Science & Business Media: New York, NY, USA, 2012. [Google Scholar]
- Pearce, J.A.; van der Laan, S.R.; Arculus, R.J.; Murton, B.J.; Ishii, T.; Peate, D.W.; Parkinson, I.J. Boninite and harzburgite from Leg 125 (Bonin-Mariana forearc): A case study of magma genesis during the initial stages of subduction. In Proceedings of the Ocean Drilling Program, Scientific Results; Ocean Drilling Program: College Station, TX, USA, 1992; pp. 623–659. [Google Scholar]
- Pearce, J.A.; Arculus, R.J. Boninites. In Encyclopedia of Geology, 2nd ed.; Alderton, D., Elias, S.A., Eds.; Academic Press: Oxford, UK, 2021; pp. 113–129. [Google Scholar]
- Pearce, J.A.; Robinson, P.J.G.R. The Troodos ophiolitic complex probably formed in a subduction initiation, slab edge setting. Gondwana Res. 2010, 18, 60–81. [Google Scholar] [CrossRef]
- Taylor, R.N.; Nesbitt, R.W.; Vidal, P.; Harmon, R.S.; Auvray, B.; Croudace, I.W. Mineralogy, chemistry, and genesis of the boninite series volcanics, Chichijima, Bonin Islands, Japan. J. Petrol. 1994, 35, 577–617. [Google Scholar] [CrossRef]
- Smithies, R.H.; Champion, D.C.; Sun, S.-S. The case for Archaean boninites. Contrib. Mineral. Petrol. 2004, 147, 705–721. [Google Scholar] [CrossRef]
- Smithies, R.H.; Champion, D.C.; Van Kranendonk, M.J.; Howard, H.M.; Hickman, A.H. Modern-style subduction processes in the Mesoarchaean: Geochemical evidence from the 3.12 Ga Whundo intra-oceanic arc. Earth Planet. Sci. Lett. 2005, 231, 221–237. [Google Scholar] [CrossRef]
- Tatsumi, Y. High-Mg andesites in the Setouchi volcanic belt, southwestern Japan: Analogy to Archean magmatism and continental crust formation? Annu. Rev. Earth. Planet. Sci. 2006, 34, 467–499. [Google Scholar] [CrossRef]
- Kerrich, R.; Wyman, D.; Fan, J.; Bleeker, W. Boninite series: Low Ti-tholeiite associations from the 2.7 Ga Abitibi greenstone belt. Earth Planet. Sci. Lett. 1998, 164, 303–316. [Google Scholar] [CrossRef]
- Sun, S.S. Geochemistry and petrogenesis of Archaean and early Proterozoic siliceous high-magnesian basalts. Boninites Relat. Rocks 1989. Available online: https://cir.nii.ac.jp/crid/1571135650535027584 (accessed on 6 January 2023).
- Falloon, T.J.; Danyushevsky, L.V.; Crawford, A.J.; Meffre, S.; Woodhead, J.D.; Bloomer, S.H. Boninites and adakites from the northern termination of the Tonga Trench: Implications for adakite petrogenesis. J. Petrol. 2008, 49, 697–715. [Google Scholar] [CrossRef] [Green Version]
- Pearce, J.A.; Reagan, M.K. Identification, classification, and interpretation of boninites from Anthropocene to Eoarchean using Si-Mg-Ti systematics. Geosphere 2019, 15, 1008–1037. [Google Scholar] [CrossRef]
- Smithies, R.H. Archaean boninite-like rocks in an intracratonic setting. Earth Planet. Sci. Lett. 2002, 197, 19–34. [Google Scholar] [CrossRef]
- Srivastava, R.K. Global Intracratonic Boninite-Norite Magmatism during the Neoarchean—Paleoproterozoic: Evidence from the Central Indian Bastar Craton. Int. Geol. Rev. 2008, 50, 61–74. [Google Scholar] [CrossRef]
- Duncan, R.A.; Green, D.H. The genesis of refractory melts in the formation of oceanic crust. Contrib. Mineral. Petrol. 1987, 96, 326–342. [Google Scholar] [CrossRef]
- Furnes, H.; Dilek, Y.; Zhao, G.; Safonova, I.; Santosh, M. Geochemical characterization of ophiolites in the Alpine-Himalayan Orogenic Belt: Magmatically and tectonically diverse evolution of the Mesozoic Neotethyan oceanic crust. Earth-Sci. Rev. 2020, 208, 103258. [Google Scholar] [CrossRef]
- Pearce, J.A. Immobile element fingerprinting of ophiolites. Elements 2014, 10, 101–108. [Google Scholar] [CrossRef]
- Shervais, J.W. Ti-V plots and the petrogenesis of modern and ophiolitic lavas. Earth Planet. Sci. Lett. 1982, 59, 101–118. [Google Scholar] [CrossRef]
- Pearce, J.A. Geochemical evidence for the genesis and eruptive setting of lavas from Tethyan ophiolites. In Proceedings of the International Ophiolite Symposium, Cyprus; Ministry of Agriculture and Natural Resources, Cyprus: Nicosia, Cyprus, 1980; pp. 261–272. [Google Scholar]
- Saccani, E. A new method of discriminating different types of post-Archean ophiolitic basalts and their tectonic significance using Th-Nb and Ce-Dy-Yb systematics. Geosci. Front. 2015, 6, 481–501. [Google Scholar] [CrossRef] [Green Version]
- Rollinson, H.; Pease, V. Using Geochemical Data: To Understand Geological Processes, 2nd ed.; Cambridge University Press: Cambridge, UK, 2021. [Google Scholar]


| Serpentinized Dunites | Serpentinites | Pyroxenites | |||||||||||||
|---|---|---|---|---|---|---|---|---|---|---|---|---|---|---|---|
| Sample No | WO- 153D | WO- 131D | WO- 144D | WO- 147D | WO- 149D | WO- 95S | WO- 104S | WO- 132S | WO- 139S | WO- B14S | WO- B17P | WO- 141P | WO- 67P | WO- 135P | WO- B15P |
| SiO2 | 39.39 | 38.74 | 40.16 | 38.93 | 37.85 | 39.21 | 39.75 | 38.91 | 39.21 | 39.9 | 55.06 | 0.065 | 49.34 | 40.56 | 47.74 |
| TiO2 | BD | BD | BD | 0.002 | 0.005 | BD | BD | BD | 0.001 | 0.017 | 0.211 | 4.72 | 0.14 | 0.1 | 0.065 |
| Al2O3 | 0.54 | 0.46 | 0.22 | 0.39 | 0.19 | 0.34 | 0.35 | 0.44 | 0.7 | 0.96 | 13.6 | 9.08 | 10.77 | 14.43 | 2.4 |
| Fe2O3 | 7.74 | 8.64 | 6.95 | 7.66 | 10.81 | 7.73 | 8.65 | 7.57 | 8.22 | 7.81 | 11.53 | 0.173 | 8.56 | 3.96 | 7.78 |
| MnO | 0.109 | 0.063 | 0.093 | 0.115 | 0.102 | 0.108 | 0.072 | 0.09 | 0.102 | 0.086 | 0.152 | 23.27 | 0.207 | 0.083 | 0.132 |
| MgO | 37.29 | 38.35 | 37.7 | 38.64 | 36.42 | 37.6 | 37.35 | 37.49 | 37.23 | 36.78 | 7.74 | 12.3 | 14.24 | 8.64 | 20.6 |
| CaO | 0.08 | 0.07 | 0.47 | 0.73 | 0.09 | 0.48 | 0.04 | 0.09 | 0.28 | 0.28 | 3.86 | 0.042 | 2.73 | 28.82 | 17.25 |
| Na2O | BD | BD | 0.039 | BD | 0.048 | 0.214 | 0.119 | 0.159 | 0.011 | BD | 3.051 | BD | 1.088 | 0.096 | 0.07 |
| K2O | BD | BD | BD | BD | BD | 0.009 | BD | BD | BD | BD | 0.318 | 0.036 | 0.057 | BD | BD |
| P2O5 | 0.043 | 0.046 | BD | 0.002 | BD | BD | BD | 0.006 | BD | BD | 0.055 | 0.086 | 0.055 | BD | 0.04 |
| SO3 | BD | 0.161 | BD | 0.116 | 0.173 | 0.003 | BD | 0.006 | 0.003 | 0.21 | 0.138 | 4.2 | 0.01 | 0.049 | 2.427 |
| LOI | 14.1 | 12.5 | 13.8 | 12.8 | 13.3 | 13.7 | 12.4 | 14.6 | 13.6 | 13.3 | 7.9 | 97.7 | 14.1 | 3.3 | 4.4 |
| Sum | 99.3 | 99.1 | 99.4 | 99.4 | 99 | 99.4 | 98.8 | 99.3 | 99.4 | 99.3 | 104 | 0.85 | 101 | 100 | 103 |
| Mg# | 0.91 | 0.91 | 0.92 | 0.92 | 0.88 | 0.91 | 0.9 | 0.92 | 0.91 | 0.91 | 0.6 | 0.004 | 0.79 | 0.83 | 0.85 |
| Cs | 0.001 | 0.003 | 0.001 | 0.003 | 0.001 | 0.001 | 0.001 | 0.001 | 0.002 | 0.005 | 0.204 | 2.23 | 0.192 | 0.005 | 0.012 |
| Rb | BD | 0.069 | BD | 0.008 | 0.013 | BD | BD | 0.018 | 0.033 | 0.014 | 3.949 | 0.027 | 0.557 | 0.01 | 0.043 |
| Ba | 2.545 | 0.663 | 0.848 | 0.211 | 4.578 | 3.62 | 1.545 | 0.225 | 3.242 | 0.442 | 33.62 | 0.008 | 16.03 | 0.754 | 0.678 |
| Th | 0.002 | 0.006 | 0.001 | BD | 0.003 | BD | BD | 0.001 | 0.004 | 0.024 | 0.336 | 0.125 | 0.07 | 0.013 | 0.007 |
| U | 0.001 | 0.009 | 0.001 | BD | 0.015 | 0.001 | 0.002 | BD | 0.019 | 0.008 | 0.137 | 0.017 | 0.022 | 0.005 | 0.001 |
| Nb | 0.019 | 0.02 | 0.008 | 0.007 | 0.017 | 0.005 | 0.009 | 0.011 | 0.023 | 0.162 | 1.313 | 19.16 | 0.655 | 0.097 | 0.02 |
| Ta | 0.12 | 0.069 | 0.004 | 0.055 | 0.03 | 0.007 | BD | 0.008 | 0.196 | 0.01 | 0.073 | 1.87 | 0.033 | 0.043 | 0.068 |
| Sr | 2.29 | 1.478 | 1.08 | 1.234 | 2.234 | 3.346 | 1.056 | 1.145 | 2.421 | 6.338 | 78.14 | 421 | 25.25 | 5.885 | 10.45 |
| Zr | 0.202 | 0.164 | 0.159 | 0.118 | 0.214 | 0.11 | 0.141 | 0.149 | 0.296 | 0.68 | 13.01 | 2.656 | 6.671 | 1.398 | 0.921 |
| Ti | 24.7 | 27.41 | 20.19 | 11.51 | 29.58 | 12.94 | 15 | 17.98 | 46.45 | 73.88 | 1264 | 0.245 | 813 | 650 | 367 |
| Y | 0.08 | 0.039 | 0.038 | 0.022 | 0.054 | 0.021 | 0.044 | 0.053 | 0.24 | 0.335 | 8.215 | 0.275 | 21.73 | 3.015 | 2.132 |
| Pb | 0.142 | 0.203 | 0.167 | 0.155 | 1.251 | 0.15 | 0.166 | 0.103 | 0.273 | 0.231 | 0.375 | 0.72 | 0.348 | 0.198 | 1.462 |
| La | 0.01 | 0.031 | 0.005 | 0.002 | 0.02 | 0.007 | 0.028 | 0.007 | 0.062 | 0.112 | 1.193 | 0.103 | 1.435 | 0.421 | 0.161 |
| Ce | 0.017 | 0.052 | 0.009 | 0.003 | 0.032 | 0.007 | 0.042 | 0.014 | 0.095 | 0.216 | 2.576 | 0.472 | 2.775 | 0.828 | 0.531 |
| Pr | 0.002 | 0.005 | BD | BD | 0.004 | BD | 0.004 | 0.001 | 0.017 | 0.025 | 0.288 | 0.157 | 0.436 | 0.143 | 0.092 |
| Nd | 0.006 | 0.016 | 0.002 | BD | 0.016 | BD | 0.011 | 0.003 | 0.071 | 0.1 | 1.125 | 0.056 | 1.777 | 0.677 | 0.477 |
| Sm | 0.001 | 0.001 | BD | BD | 0.004 | BD | 0.002 | BD | 0.02 | 0.027 | 0.353 | 0.251 | 0.642 | 0.261 | 0.187 |
| Eu | 0.002 | 0.002 | 0.001 | BD | 0.004 | 0.001 | 0.008 | 0.001 | 0.01 | 0.013 | 0.127 | 0.05 | 0.199 | 0.141 | 0.066 |
| Gd | 0.002 | 0.005 | 0.002 | BD | 0.006 | BD | 0.002 | 0.002 | 0.025 | 0.04 | 0.64 | 0.389 | 1.264 | 0.397 | 0.28 |
| Tb | BD | BD | BD | BD | 0.001 | BD | BD | BD | 0.004 | 0.007 | 0.13 | 0.096 | 0.283 | 0.071 | 0.051 |
| Dy | 0.009 | 0.02 | 0.007 | 0.004 | 0.009 | 0.003 | 0.004 | 0.006 | 0.035 | 0.053 | 1.027 | 0.31 | 2.263 | 0.488 | 0.353 |
| Ho | 0.003 | 0.001 | BD | BD | 0.001 | BD | 0.001 | 0.001 | 0.008 | 0.012 | 0.258 | 0.368 | 0.563 | 0.11 | 0.079 |
| Er | 0.011 | 0.004 | 0.005 | 0.004 | 0.005 | 0.003 | 0.003 | 0.006 | 0.027 | 0.038 | 0.84 | 0.057 | 1.78 | 0.311 | 0.225 |
| Yb | 0.025 | 0.014 | 0.012 | 0.014 | 0.011 | 0.008 | 0.009 | 0.015 | 0.038 | 0.046 | 0.987 | 0.066 | 1.837 | 0.283 | 0.205 |
| Lu | 0.005 | 0.002 | 0.002 | 0.003 | 0.002 | 0.002 | 0.002 | 0.003 | 0.007 | 0.008 | 0.162 | 172.7 | 0.276 | 0.042 | 0.03 |
| Hf | 0.004 | 0.005 | 0.001 | BD | 0.002 | BD | BD | 0.001 | 0.006 | 0.016 | 0.369 | 46.86 | 0.13 | 0.058 | 0.04 |
| V | 39.02 | 20.37 | 24.86 | 37.64 | 22.18 | 30.44 | 26.28 | 36.36 | 43.41 | 31.64 | 267.5 | 1478 | 171.8 | 112.6 | 100.7 |
| Sc | 10.11 | 4.862 | 5.816 | 10.17 | 4.203 | 8.757 | 7.001 | 8.882 | 10.767 | 8.118 | 44.0 | 3.02 | 34.72 | 47.04 | 58.36 |
| Cr | 2317 | 3489 | 1337 | 1642 | 3551 | 1042 | 1167 | 1614 | 1504 | 1876 | 178 | 20.54 | 489 | 67 | 1946 |
| Ga | 0.728 | 1.411 | 0.431 | 0.501 | 0.662 | 0.351 | 0.334 | 0.454 | 0.828 | 1.313 | 10.82 | 39.86 | 7.214 | 5.65 | 3.051 |
| Cu | 17.08 | 9.054 | 5.831 | 5.679 | 657 | 3.53 | 3309 | 6.245 | 13.35 | 9.321 | 111.2 | 599 | 29195 | 24.09 | 1348 |
| Zn | 26.29 | 40.07 | 37.93 | 38.52 | 38.639 | 29.22 | 54.16 | 34.80 | 35.336 | 33.59 | 37.76 | 60.36 | 117.4 | 16.84 | 19.13 |
| Ni | 2217 | 2128 | 2341 | 2181 | 804 | 1986 | 2140 | 2011 | 2227 | 1633 | 57.50 | BD | 447 | 57 | 985 |
| Co | 97.81 | 119.7 | 94.34 | 95.31 | 157.13 | 86.47 | 102.6 | 87.03 | 96.56 | 86.99 | 30.8 | 7.171 | 113.2 | 31.62 | 98.3 |
| Mo | BD | BD | 0.09 | 0.02 | 0.05 | 0.074 | 0.053 | 0.049 | 0.071 | 0.023 | 0.664 | 0.045 | 0.067 | 0.055 | 0.019 |
| Li | 0.376 | 0.113 | 0.822 | 1.246 | 2.321 | 1.136 | 0.765 | 1.399 | 1.707 | 1.343 | 2.934 | 7.171 | 5.999 | 5.146 | 1.267 |
| Be | BD | 0.006 | 0.001 | BD | BD | 0.002 | 0.016 | 0.001 | 0.007 | 0.023 | 0.22 | 0.045 | 0.299 | 0.055 | BD |
| Rock | Basalts | ||||||||
|---|---|---|---|---|---|---|---|---|---|
| Sample No | WO- 38-B | WO- 44-B | WO- 47B | WO- 52-B | WO- 59-B | WO- B11B | WO- 113-B | WO- 27-B | WO- 32-B |
| SiO2 | 50.05 | 52.66 | 53.71 | 37.61 | 47.22 | 49.55 | 56.79 | 56.01 | 57.46 |
| TiO2 | 0.155 | 0.148 | 0.174 | 0.14 | 0.173 | 0.163 | 0.171 | 0.145 | 0.13 |
| Al2O3 | 12.04 | 11.55 | 12.75 | 10.53 | 12.07 | 12.7 | 12.93 | 11.32 | 11.25 |
| Fe2O3 | 17.17 | 18.52 | 15.24 | 19.72 | 18.5 | 13.39 | 6.74 | 14.08 | 13.79 |
| MnO | 0.093 | 0.075 | 0.079 | 0.065 | 0.074 | 0.338 | 0.163 | 0.064 | 0.064 |
| MgO | 11.35 | 9.87 | 10.52 | 8.24 | 11.99 | 12.98 | 6.23 | 10.08 | 9.74 |
| CaO | 0.29 | 0.16 | 0.34 | 0.49 | 0.23 | 0.32 | 8.95 | 0.19 | 0.16 |
| Na2O | BD | BD | 0.056 | BD | 0.014 | 1.582 | 4.433 | 0.024 | 0.01 |
| K2O | BD | BD | BD | BD | BD | BD | 0.014 | BD | BD |
| P2O5 | 0.049 | 0.052 | 0.051 | 0.04 | 0.063 | 0.012 | 0.056 | 0.057 | 0.048 |
| SO3 | 2.908 | 1.49 | 1.456 | 8.96 | 4.074 | 5.789 | 0.019 | 1.955 | 1.857 |
| LOI | 5.9 | 4.8 | 4 | 0.7 | 3.9 | 3 | 5.1 | 7.1 | 4.5 |
| Sum | 100 | 99.4 | 98.4 | 86.5 | 98.3 | 99.8 | 102 | 101 | 99 |
| Mg# | 0.59 | 0.54 | 0.6 | 0.48 | 0.59 | 0.68 | 0.67 | 0.61 | 0.61 |
| Cs | 0.03 | 0.005 | 0.008 | 0.003 | 0.032 | 0.005 | 0.004 | 0.047 | 0.037 |
| Rb | 0.043 | 0.063 | 0.047 | 0.031 | 0.045 | 0.078 | 0.05 | 0.135 | 0.077 |
| Ba | 3.072 | 2.87 | 3.932 | 2.094 | 1.409 | 1.901 | 5.057 | 5.634 | 5.867 |
| Th | 0.119 | 0.133 | 0.212 | 0.018 | 0.139 | 0.337 | 0.386 | 0.227 | 0.177 |
| U | 0.086 | 0.124 | 0.269 | 0.013 | 0.089 | 0.155 | 0.115 | 0.14 | 0.133 |
| Nb | 0.935 | 0.76 | 0.97 | 0.677 | 1.036 | 1.256 | 1.292 | 0.969 | 0.937 |
| Ta | 0.047 | 0.042 | 0.089 | 0.018 | 0.06 | 0.107 | 0.077 | 0.062 | 0.044 |
| Sr | 4.634 | 1.181 | 2.037 | 1.627 | 4.968 | 8.465 | 16.71 | 2.051 | 1.767 |
| Zr | 7.823 | 7.57 | 9.8 | 7.522 | 11.14 | 10.74 | 13.25 | 9.964 | 8.401 |
| Ti | 918 | 961 | 997 | 892 | 1037 | 898 | 1053 | 811 | 748 |
| Y | 3.386 | 9.564 | 4.61 | 8.314 | 4.293 | 4.959 | 7.519 | 5.792 | 3.844 |
| Pb | 0.16 | 0.147 | 0.28 | 0.12 | 0.173 | 2.133 | 1.496 | 0.27 | 0.282 |
| La | 0.623 | 0.47 | 0.30 | 0.116 | 0.76 | 1.938 | 1.975 | 0.471 | 0.278 |
| Ce | 1.189 | 1.092 | 0.54 | 0.184 | 1.319 | 4.441 | 3.388 | 1.012 | 0.631 |
| Pr | 0.123 | 0.132 | 0.056 | 0.019 | 0.125 | 0.479 | 0.355 | 0.115 | 0.078 |
| Nd | 0.444 | 0.527 | 0.215 | 0.075 | 0.435 | 1.709 | 1.354 | 0.44 | 0.325 |
| Sm | 0.114 | 0.226 | 0.081 | 0.032 | 0.103 | 0.358 | 0.39 | 0.127 | 0.1 |
| Eu | 0.043 | 0.061 | 0.015 | 0.01 | 0.031 | 0.241 | 0.161 | 0.028 | 0.025 |
| Gd | 0.199 | 0.574 | 0.224 | 0.149 | 0.179 | 0.465 | 0.646 | 0.275 | 0.216 |
| Tb | 0.038 | 0.13 | 0.054 | 0.04 | 0.037 | 0.087 | 0.128 | 0.061 | 0.043 |
| Dy | 0.297 | 1.073 | 0.506 | 0.417 | 0.325 | 0.654 | 0.979 | 0.56 | 0.37 |
| Ho | 0.079 | 0.262 | 0.146 | 0.13 | 0.097 | 0.166 | 0.243 | 0.157 | 0.098 |
| Er | 0.266 | 0.818 | 0.523 | 0.462 | 0.351 | 0.539 | 0.782 | 0.54 | 0.318 |
| Yb | 0.348 | 0.881 | 0.637 | 0.488 | 0.449 | 0.644 | 0.9 | 0.634 | 0.372 |
| Lu | 0.062 | 0.135 | 0.109 | 0.075 | 0.081 | 0.111 | 0.146 | 0.102 | 0.063 |
| Hf | 0.16 | 0.17 | 0.224 | 0.087 | 0.201 | 0.309 | 0.385 | 0.22 | 0.183 |
| V | 200.2 | 214.7 | 219 | 146.3 | 222.8 | 207.2 | 204 | 191.1 | 183 |
| Sc | 45.78 | 42.53 | 37.24 | 32.37 | 42.84 | 37.63 | 36.10 | 35.84 | 36.46 |
| Cr | 338 | 442 | 143 | 190 | 525 | 289 | 176 | 110 | 156 |
| Ga | 9.5 | 10.90 | 7.794 | 5.741 | 10.32 | 8.962 | 14.33 | 7.595 | 7.451 |
| Cu | 11717 | 8584 | 5886 | 67680 | 15450 | 516 | 116 | 7370 | 7354 |
| Zn | 23.50 | 23.8 | 23.10 | 26.58 | 25.98 | 141.0 | 39.14 | 20.49 | 21.67 |
| Ni | 150 | 143 | 91.02 | 93.34 | 175 | 143.8 | 60.22 | 78.41 | 75.65 |
| Co | 69.92 | 70.92 | 67.21 | 61.22 | 76.2 | 40.18 | 26.18 | 53.64 | 53.96 |
| Mo | 4.054 | 0.204 | 4.227 | 10.02 | 0.575 | 0.556 | BD | 8.512 | 6.627 |
| Li | 4.137 | 4.877 | 19.64 | 6.539 | 3.116 | 4.047 | 2.689 | 9.292 | 12.89 |
| Be | 0.06 | 0.081 | 0.054 | 0.089 | 0.065 | 0.185 | 0.205 | 0.072 | 0.069 |
Disclaimer/Publisher’s Note: The statements, opinions and data contained in all publications are solely those of the individual author(s) and contributor(s) and not of MDPI and/or the editor(s). MDPI and/or the editor(s) disclaim responsibility for any injury to people or property resulting from any ideas, methods, instructions or products referred to in the content. |
© 2023 by the authors. Licensee MDPI, Basel, Switzerland. This article is an open access article distributed under the terms and conditions of the Creative Commons Attribution (CC BY) license (https://creativecommons.org/licenses/by/4.0/).
Share and Cite
Jalil, R.; Alard, O.; Schaefer, B.; Ali, L.; Sajid, M.; Khedr, M.Z.; Shah, M.T.; Anjum, M.N. Geochemistry of Waziristan Ophiolite Complex, Pakistan: Implications for Petrogenesis and Tectonic Setting. Minerals 2023, 13, 311. https://doi.org/10.3390/min13030311
Jalil R, Alard O, Schaefer B, Ali L, Sajid M, Khedr MZ, Shah MT, Anjum MN. Geochemistry of Waziristan Ophiolite Complex, Pakistan: Implications for Petrogenesis and Tectonic Setting. Minerals. 2023; 13(3):311. https://doi.org/10.3390/min13030311
Chicago/Turabian StyleJalil, Raham, Olivier Alard, Bruce Schaefer, Liaqat Ali, Muhammad Sajid, Mohamed Zaki Khedr, Mohammad Tahir Shah, and Muhammad Naveed Anjum. 2023. "Geochemistry of Waziristan Ophiolite Complex, Pakistan: Implications for Petrogenesis and Tectonic Setting" Minerals 13, no. 3: 311. https://doi.org/10.3390/min13030311