
Mapping Leachate Pathways in Aging Mining Tailings Pond Using Electrical Resistivity Tomography
 , , ,
, , ,
Abstract
:1. Introduction
2. Materials and Methods
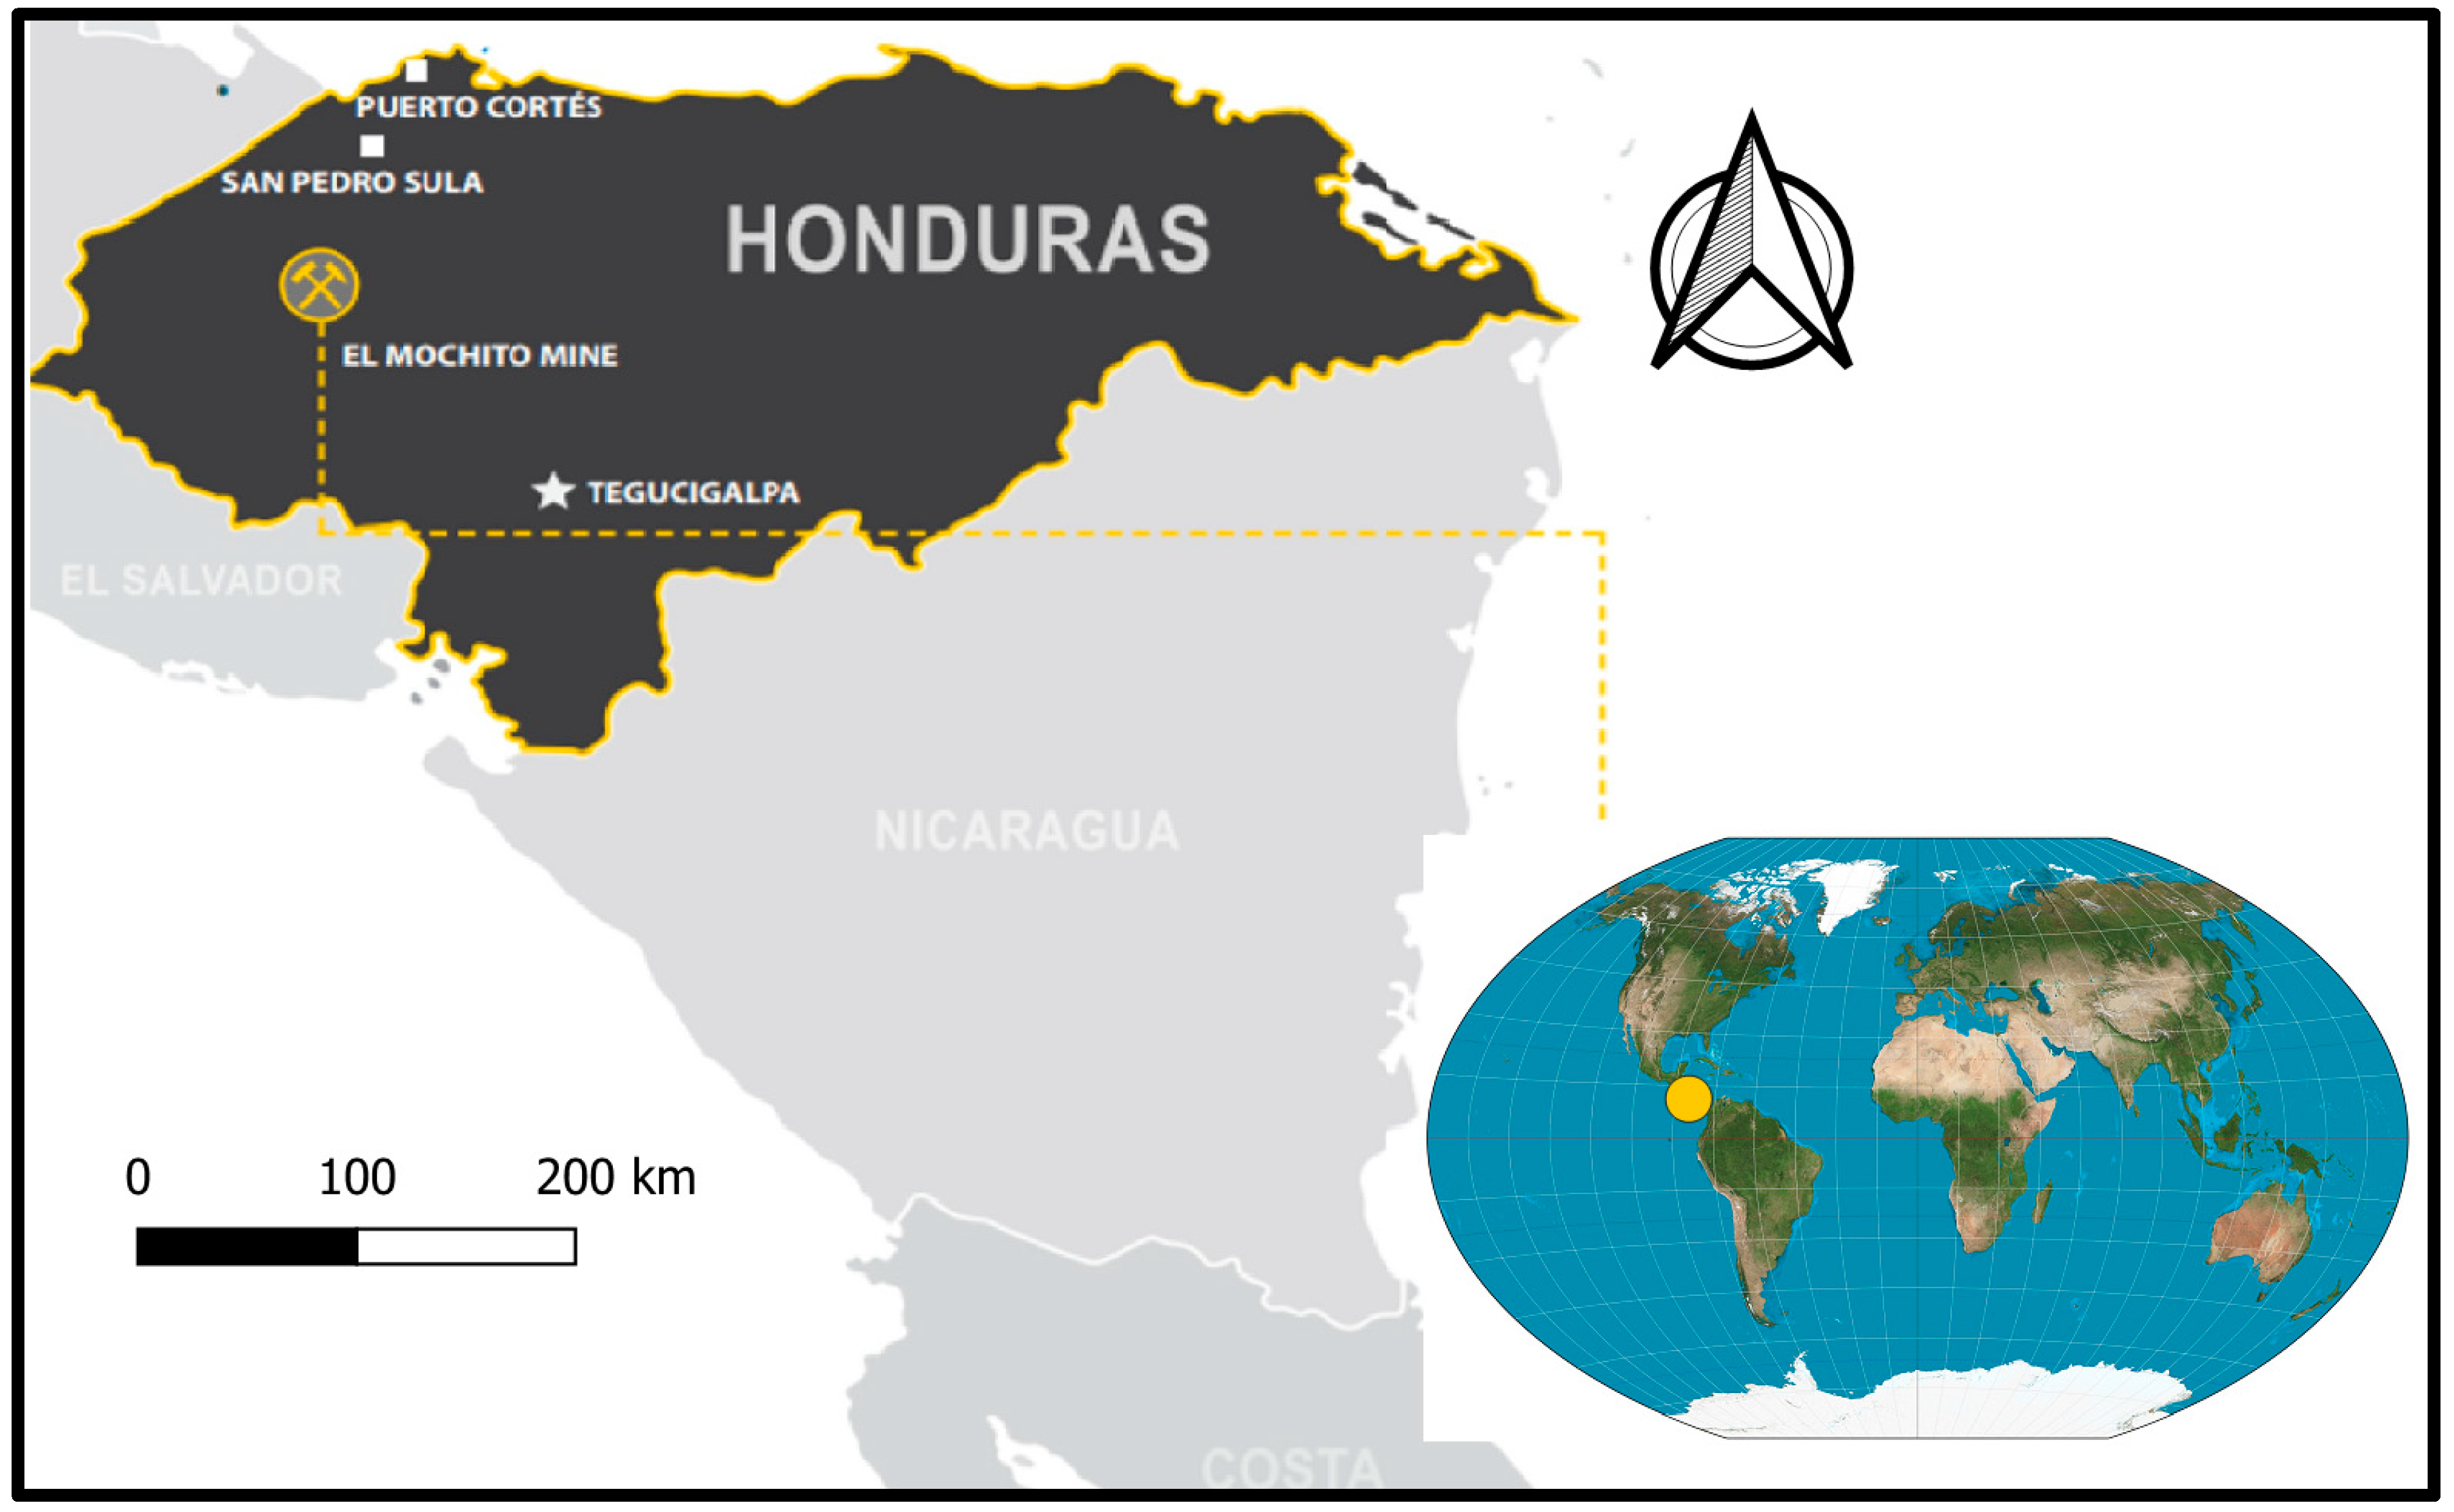
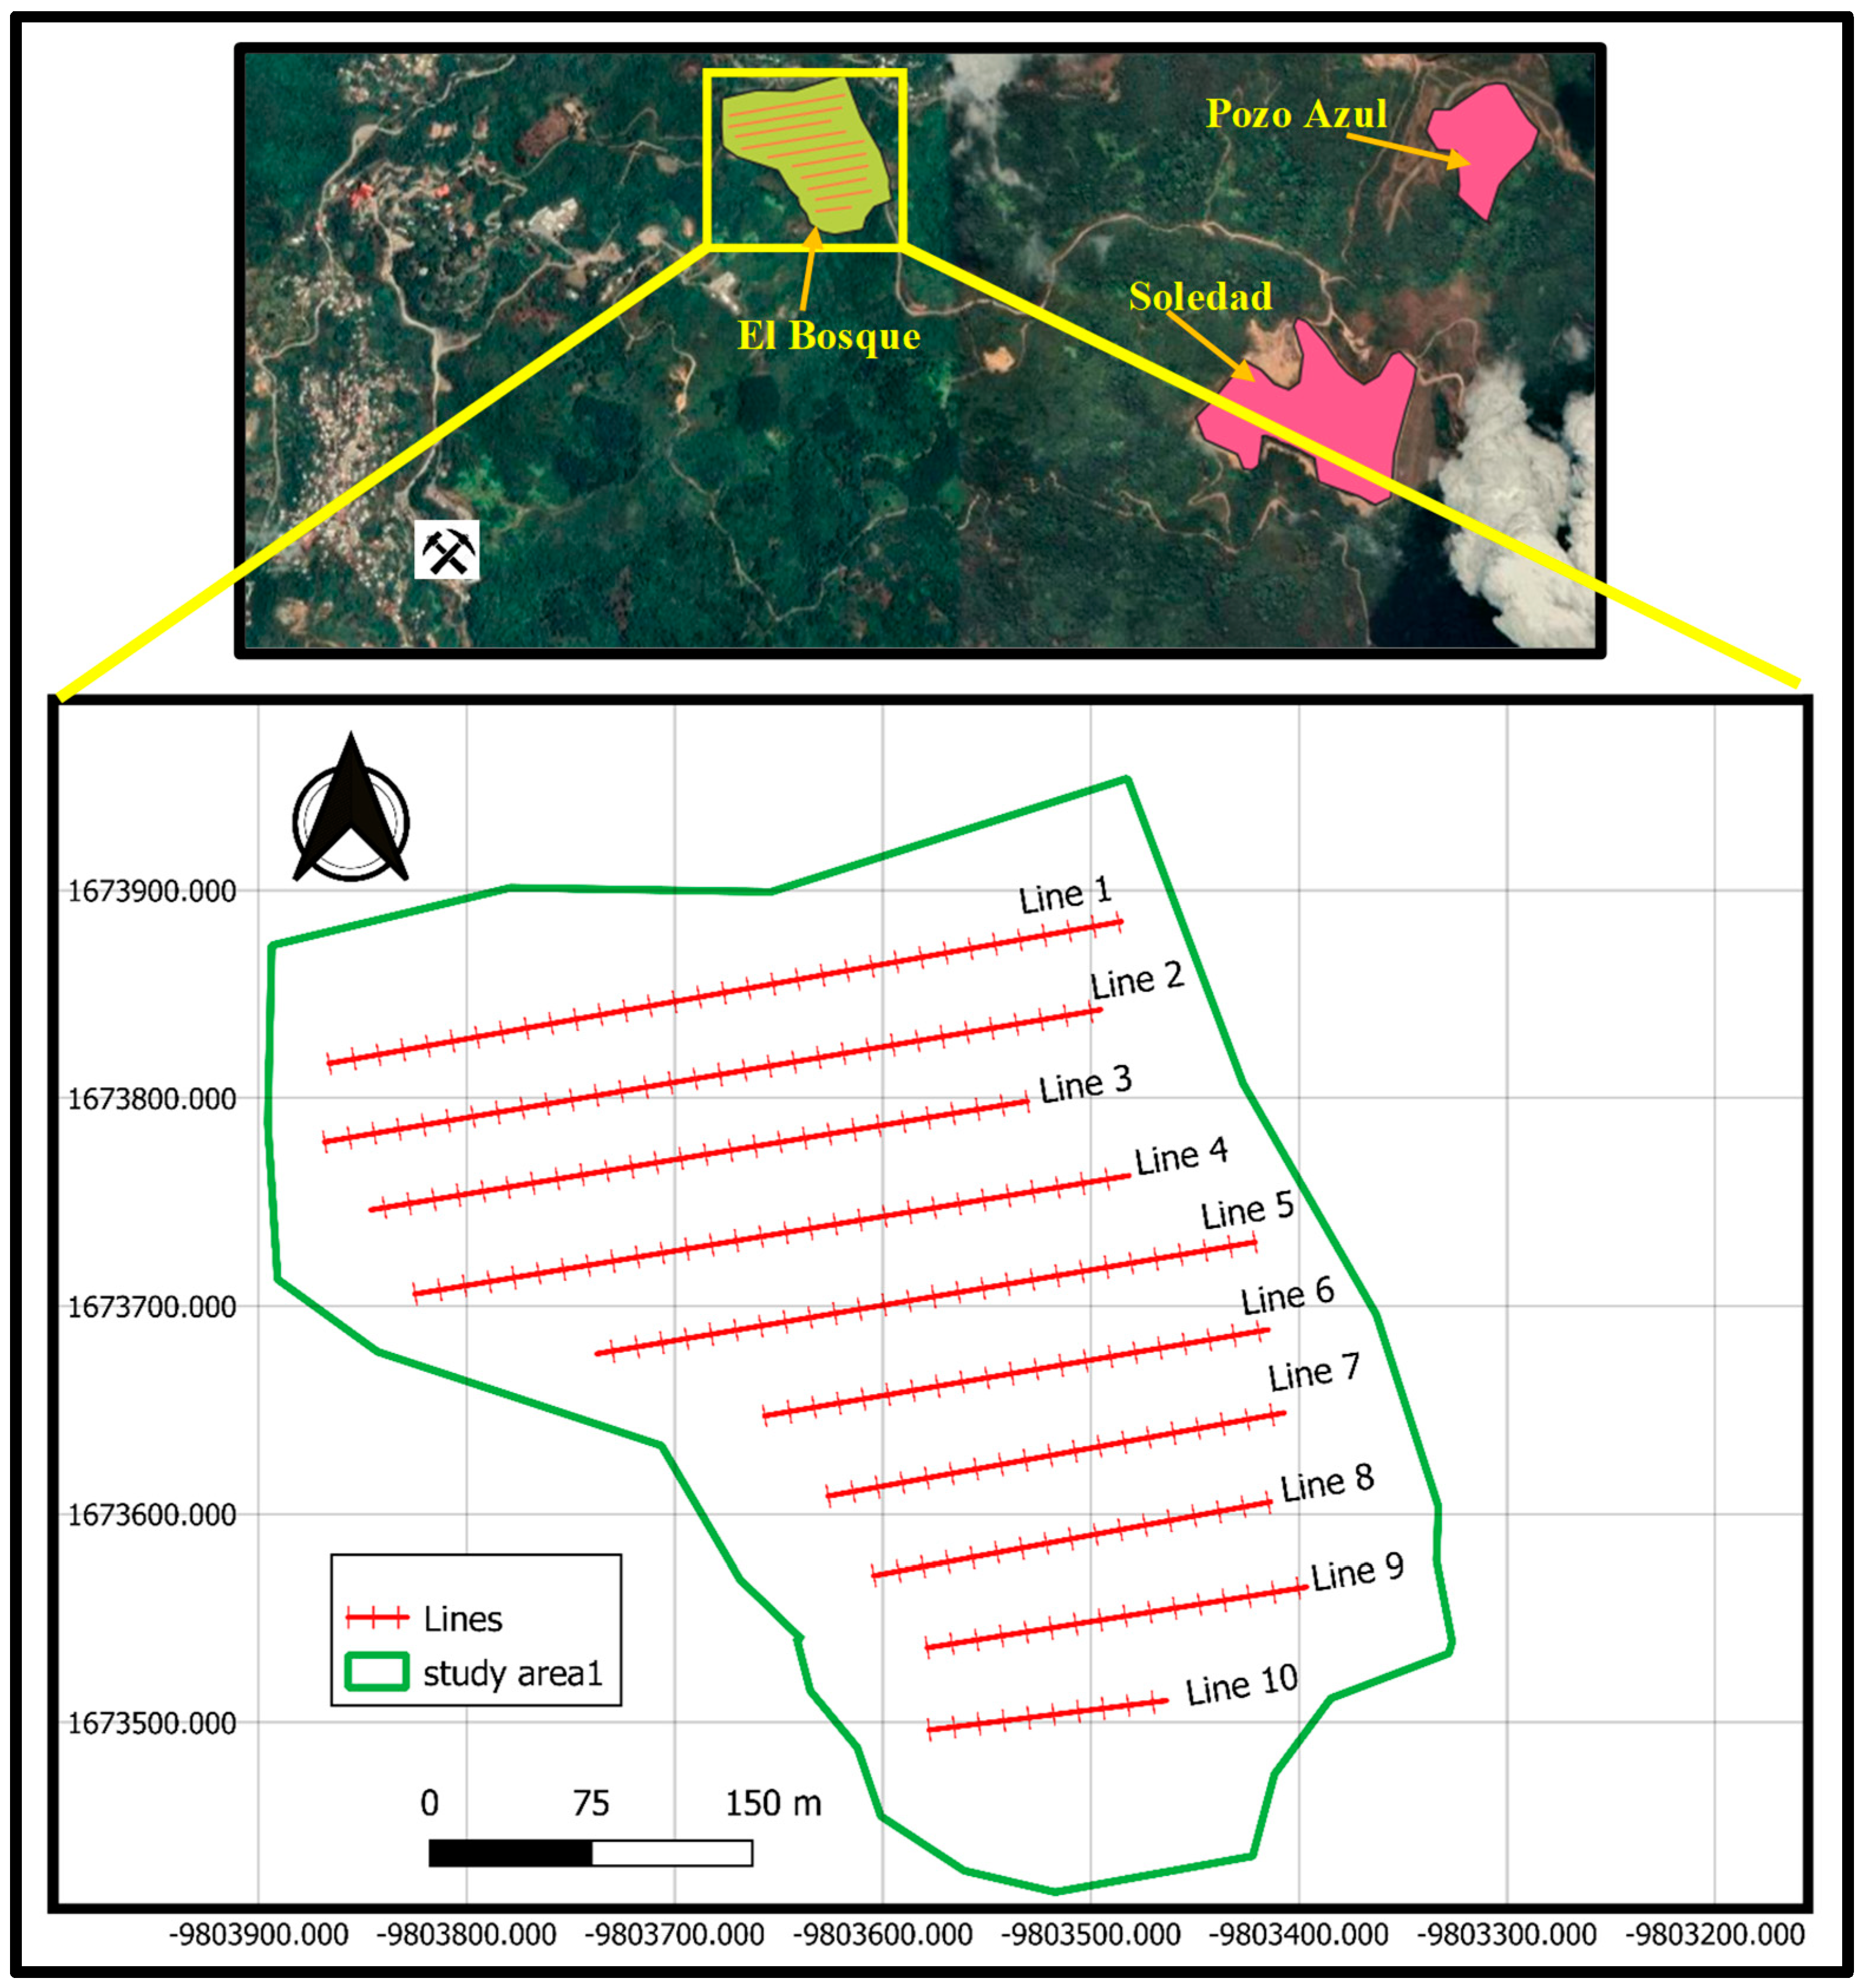
2.1. Site Location and Description
2.2. Electrical Resistivity Tomography (ERT) Technique
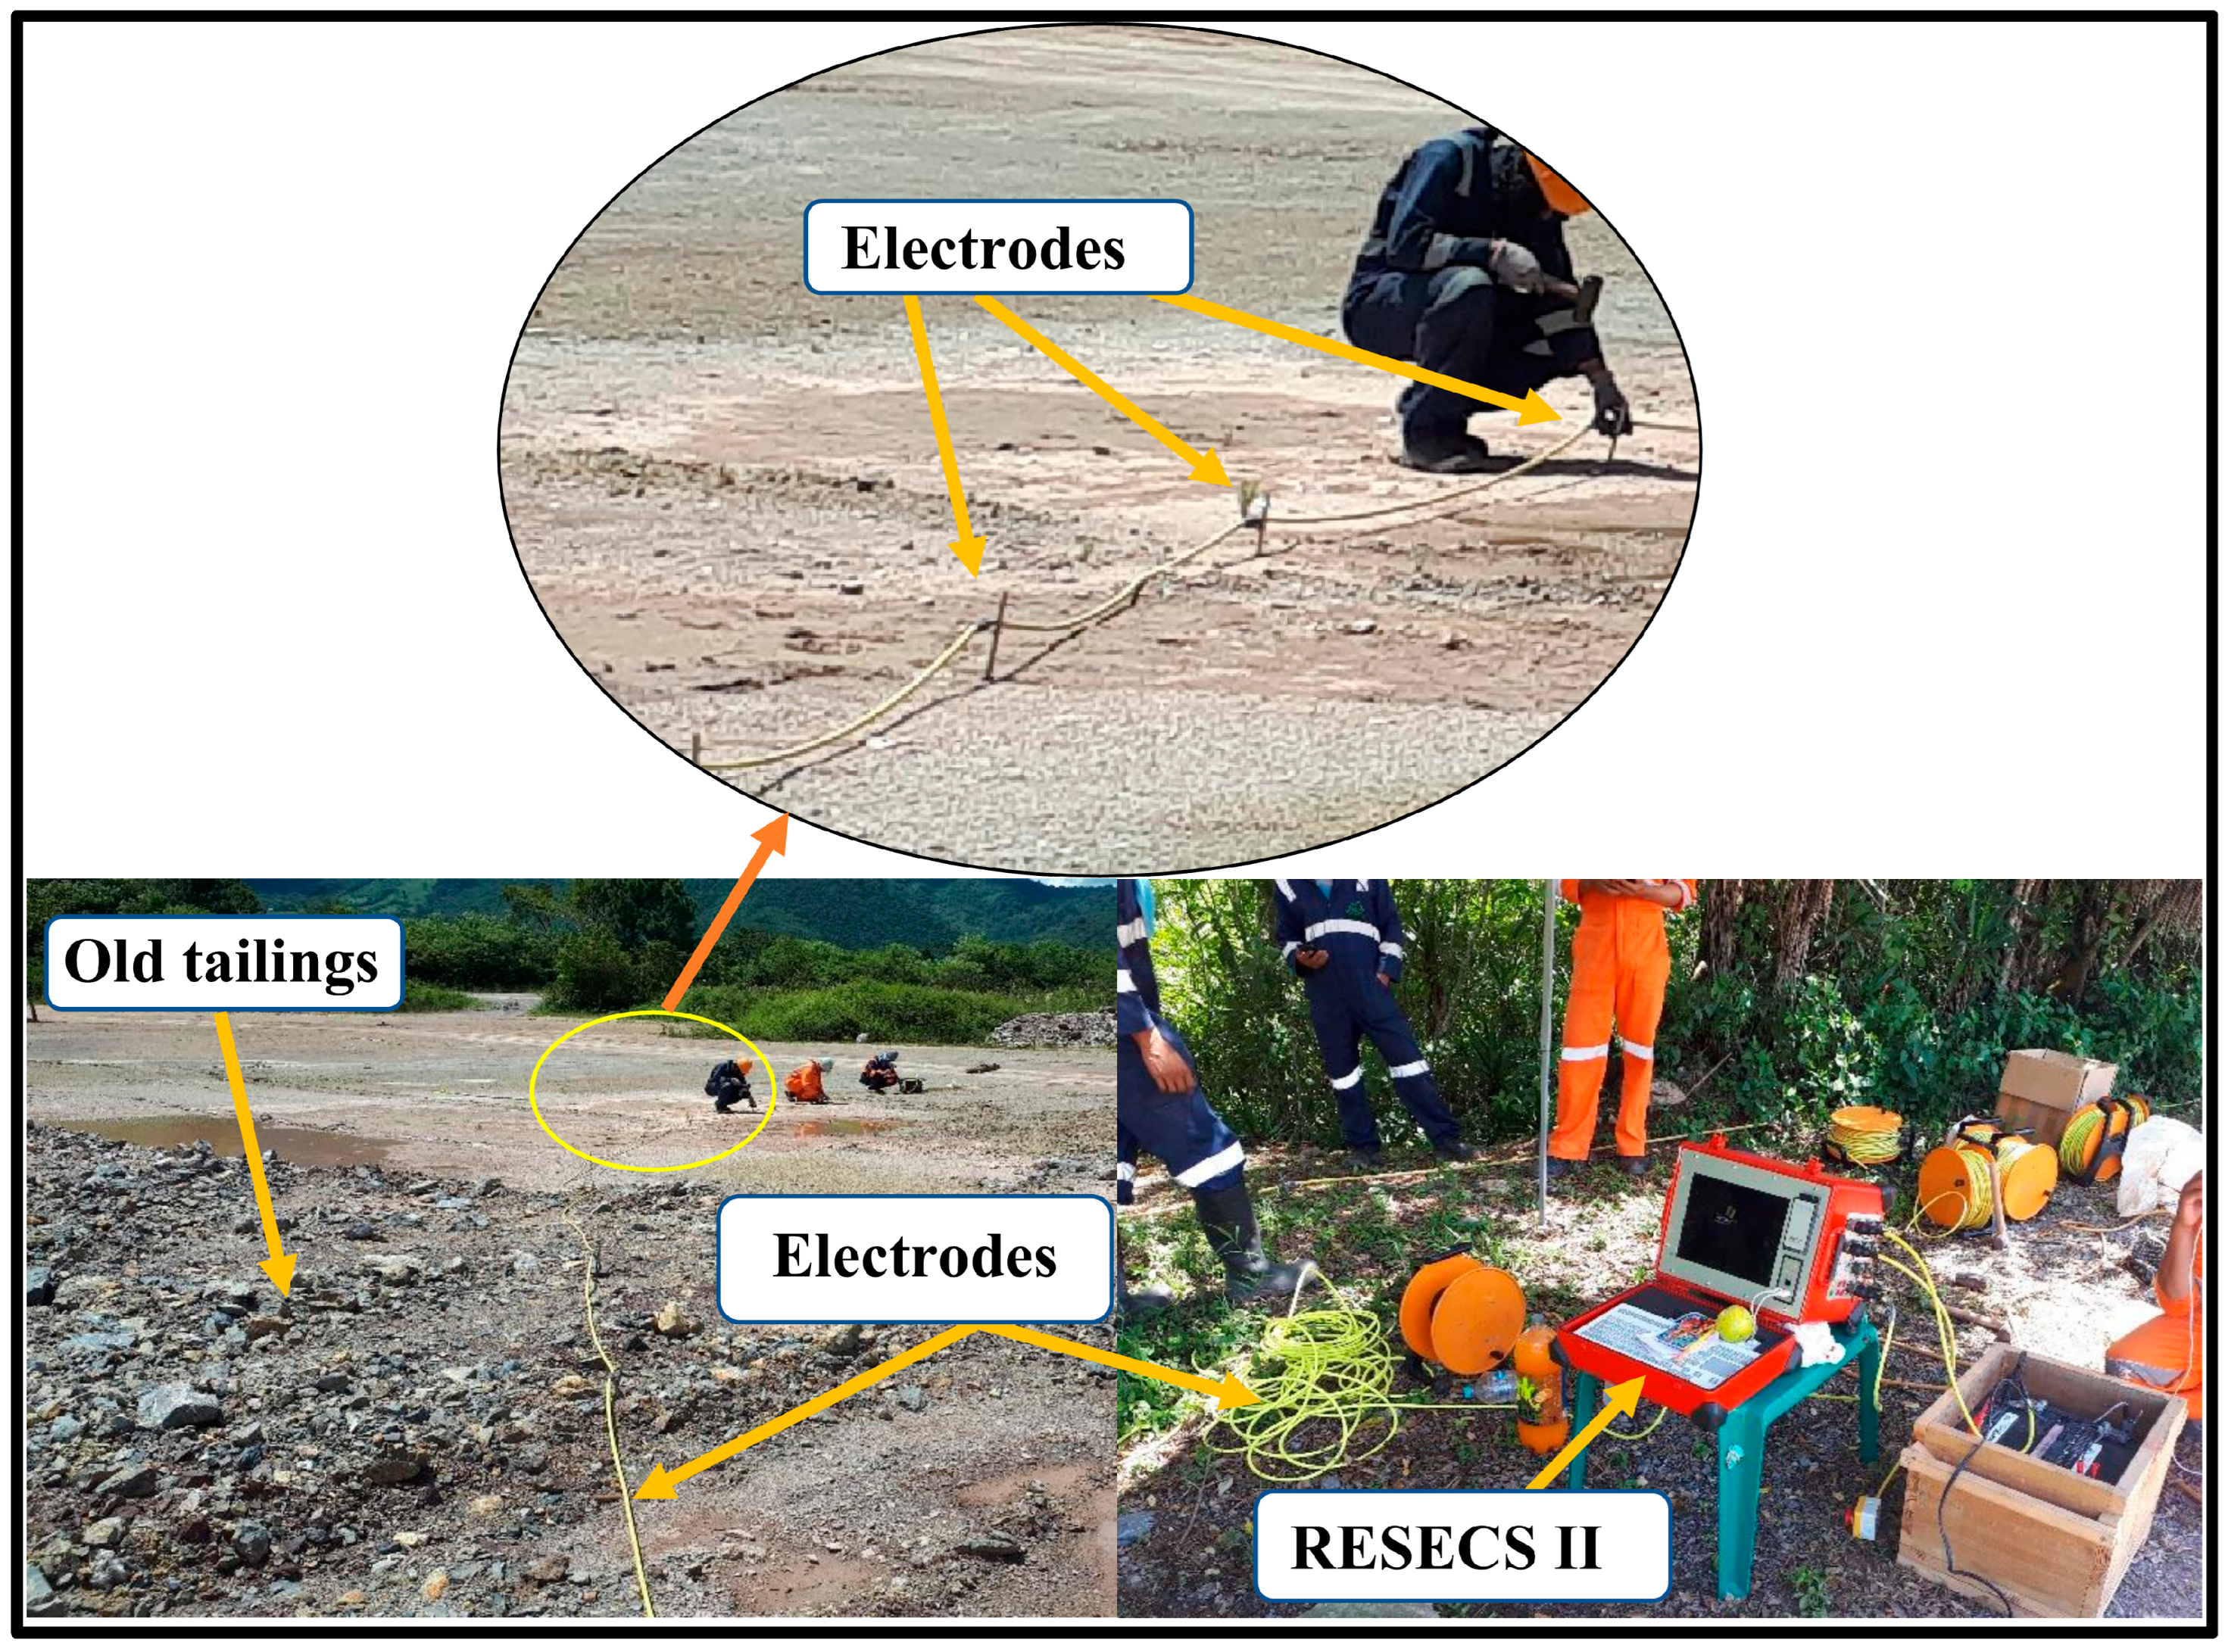
2.3. Equipment and Data Acquisition
2.4. Data Processing
- Importing Raw Data: Begin by launching the Res2DInv software and import the raw ERT data collected during the field survey.
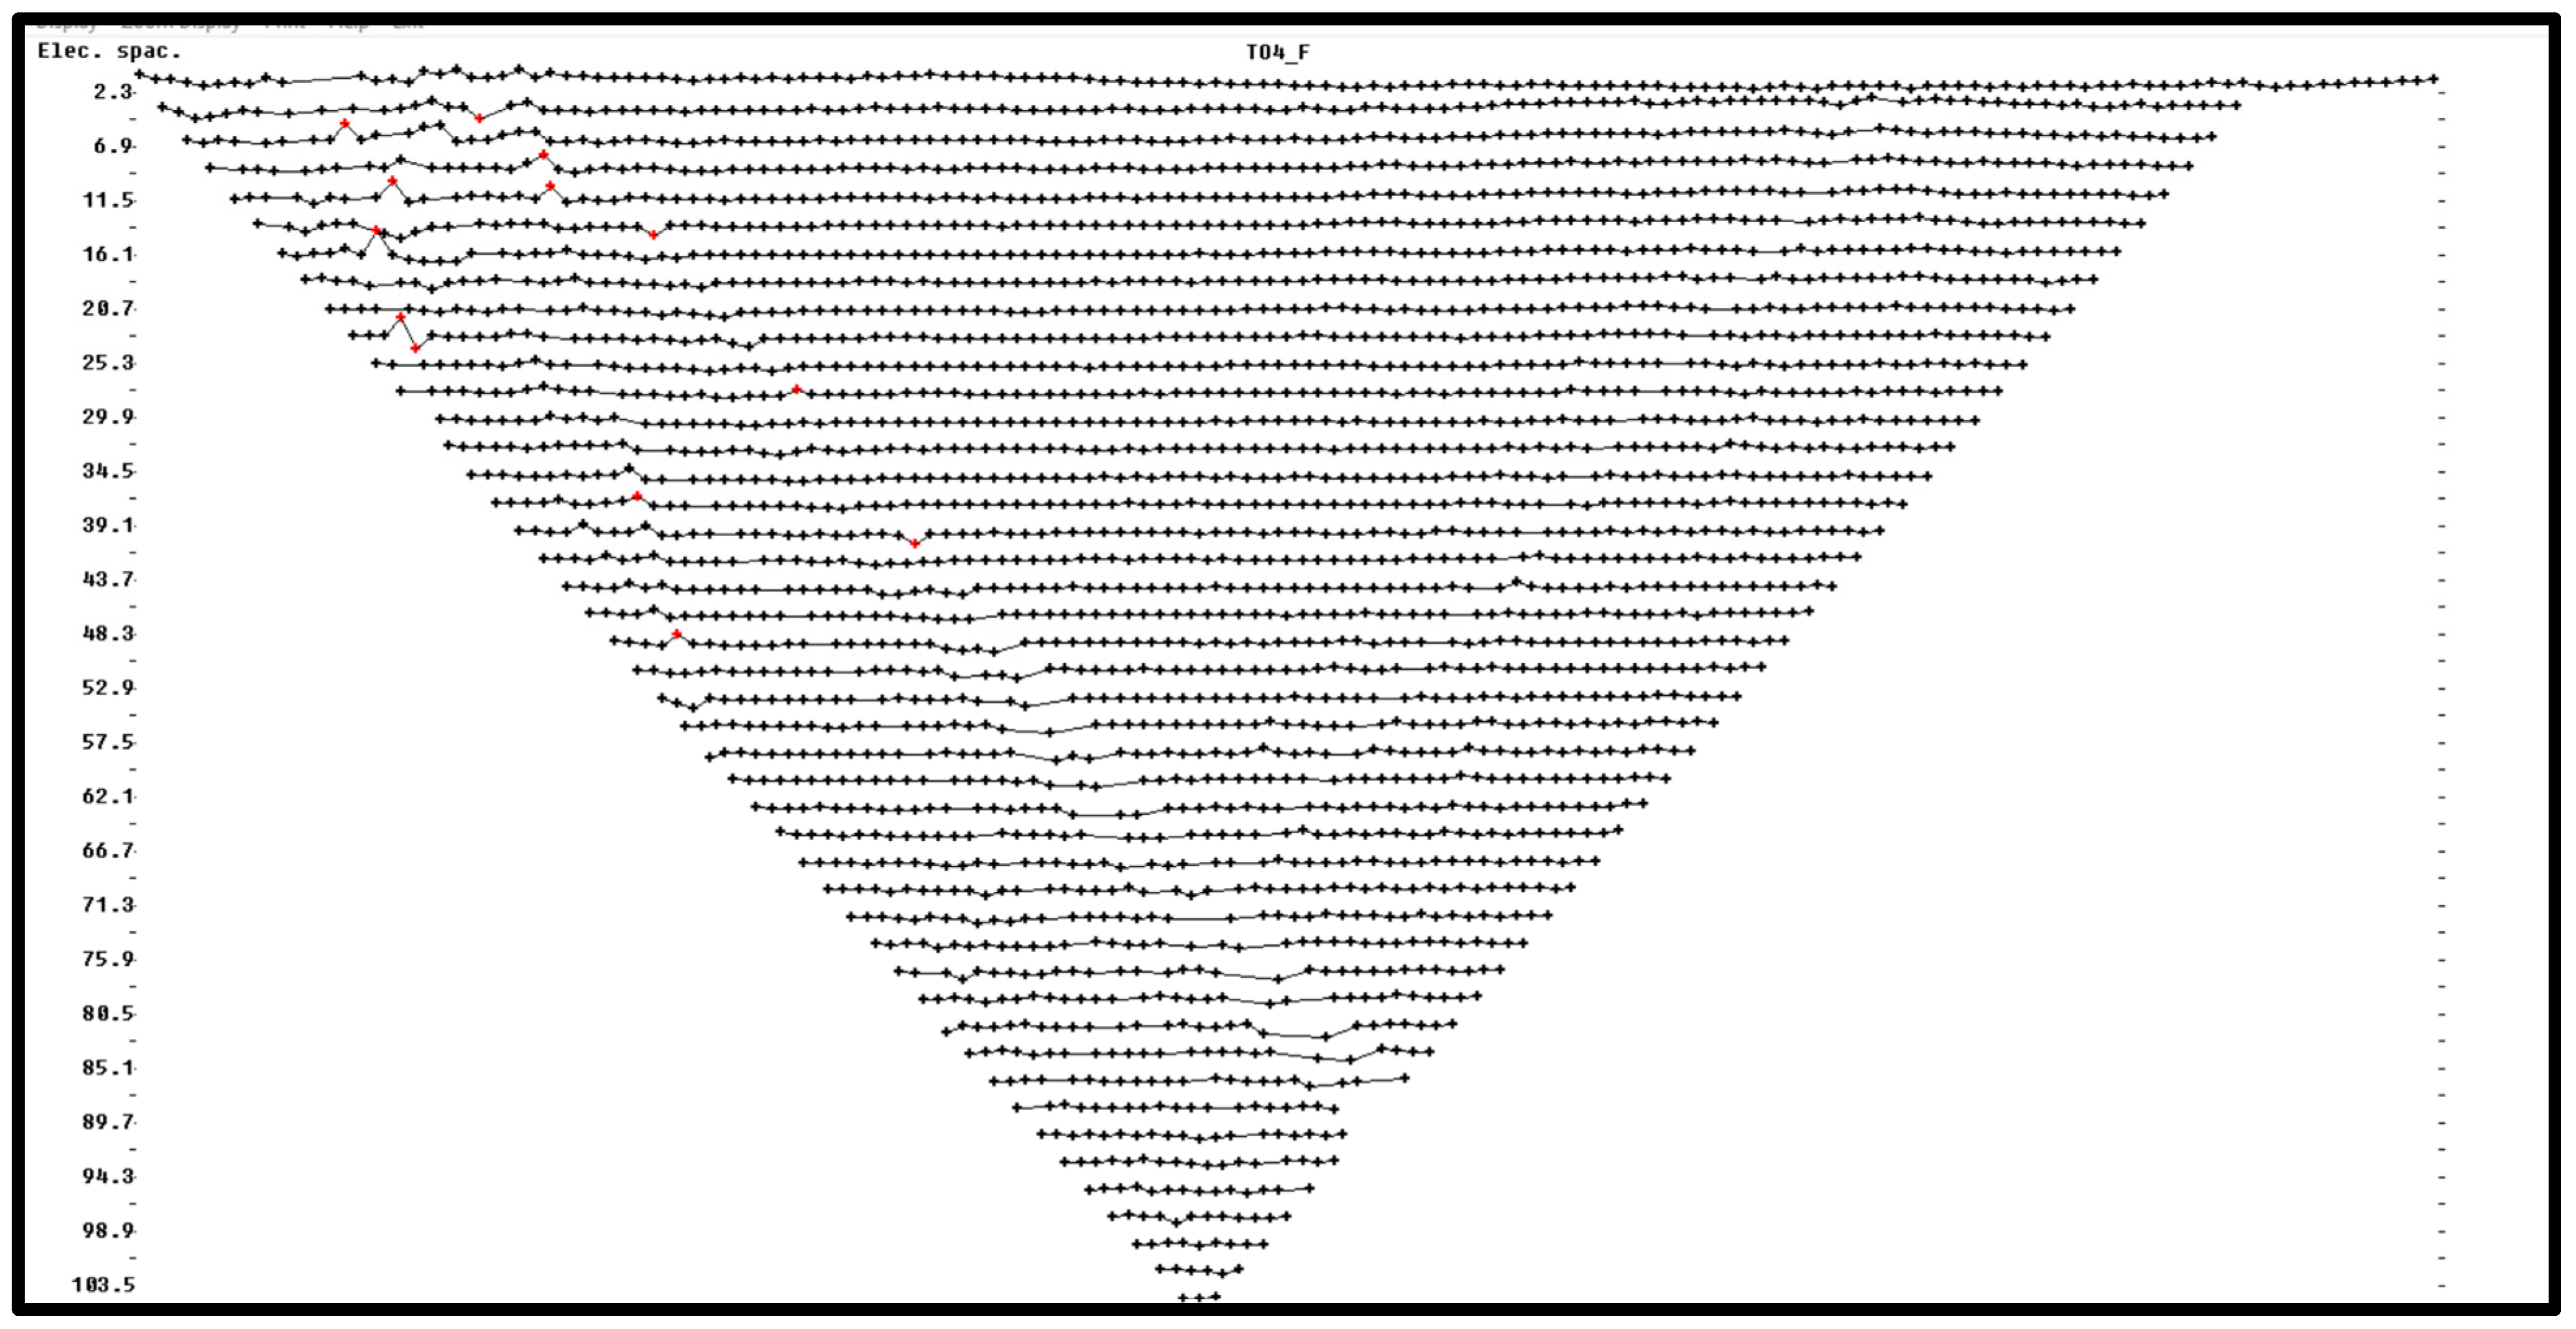
- Data Preprocessing: Quality control checks are crucial to ensure data accuracy. Exterminate bad points, and check the ERT data set for any outliers, spikes, or abnormal values that may result from noise or measurement errors. The primary objective of this option is to eliminate data points that exhibit resistivity values that are incorrect. These erroneous data points may arise from malfunctioning relays in one of the electrodes, inadequate contact between the electrode and the ground due to arid soil, or electrical shorting between the cables caused by excessively wet ground conditions. These flawed data points typically display apparent resistivity values that are conspicuously larger or smaller than the surrounding ERT data points. The most effective way to deal with such ERT data points is to discard them so that they do not exert any influence on the resulting model [61,62,63]. Figure A1, in the Appendix A, illustrates a data set containing a few flawed data points in red color.
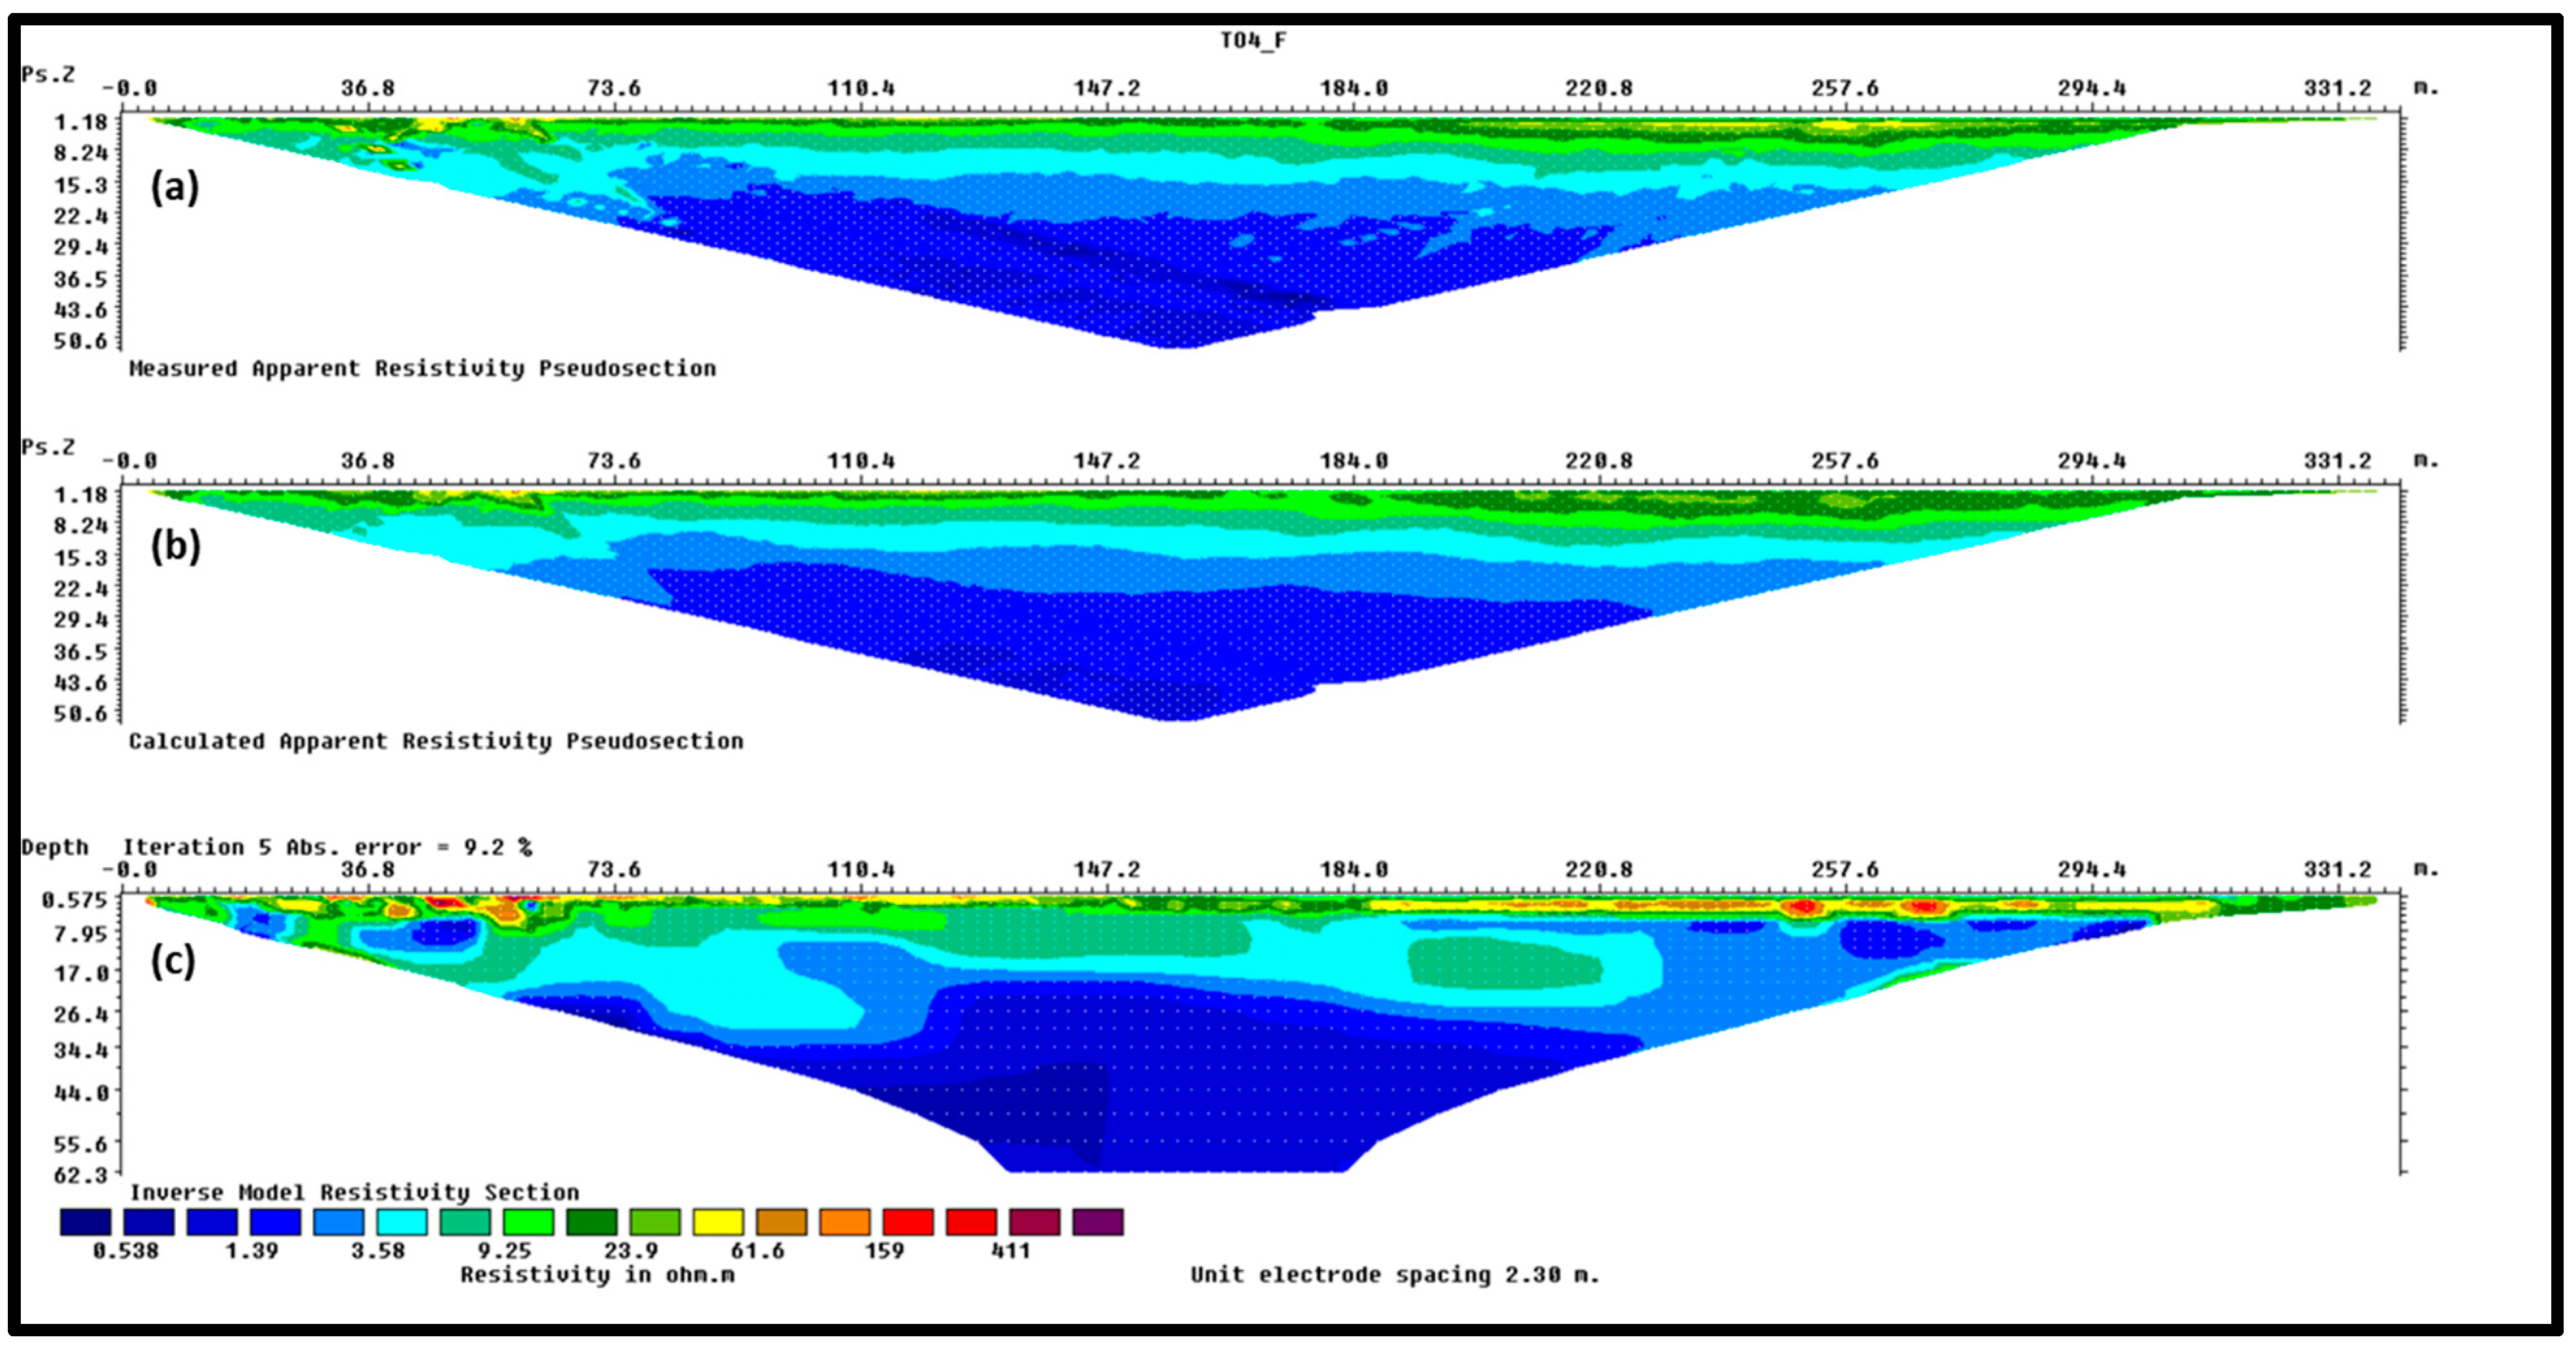
- Forward Modeling: Set up the forward modeling parameters. This includes defining the survey geometry, electrode configurations (e.g., Wenner in this case), electrode spacing, and pseudosection (Figure A2a). After that, perform a forward model simulation to calculate the expected apparent resistivity values based on an initial resistivity model. This procedure is instrumental in producing synthetic ERT data (Figure A2b) that will subsequently be examined alongside the acquired ERT data throughout the process of inversion (Figure A2c).
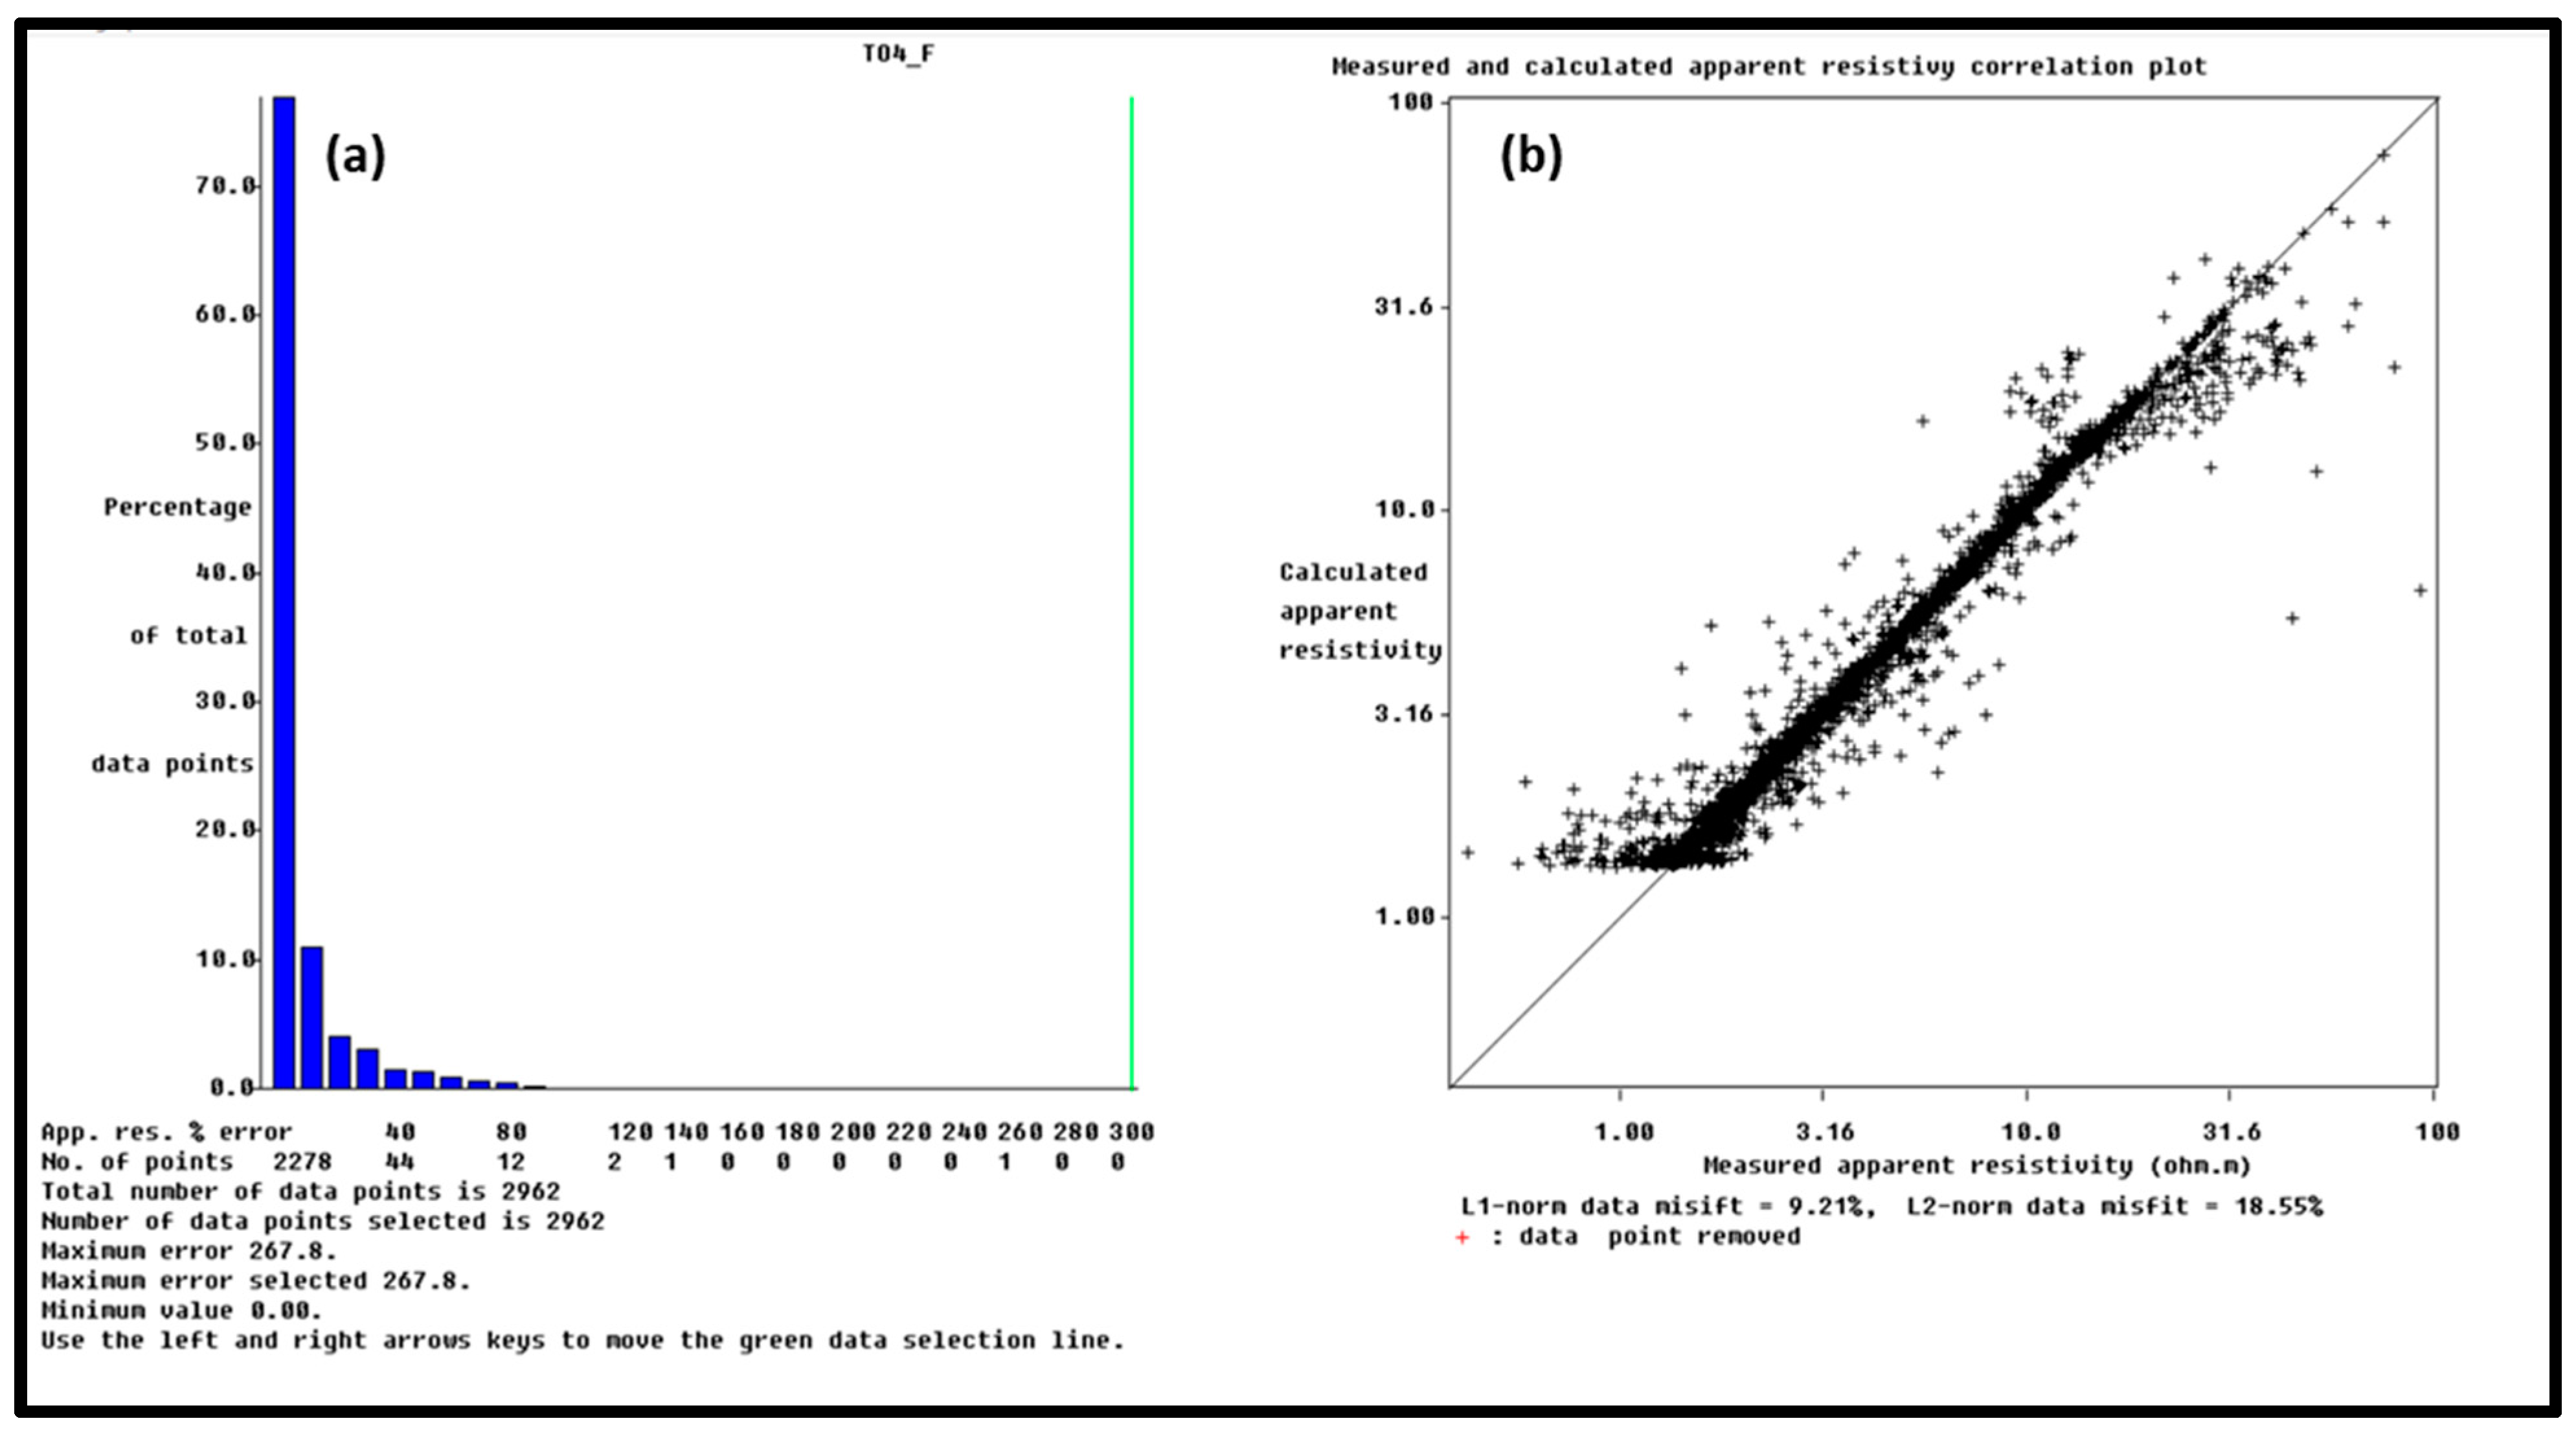
- Inversion: The process of inversion focuses on modifying the resistivity distribution under the surface to align it as closely as possible with the observed data (Figure A2). The inversion parameters, including the selection of the inversion algorithm (such as smoothness-constrained or Occam), damping factors (numerical parameters used to control the smoothness and stability of the inversion process), and convergence criteria (the predefined conditions or rules that determine when the inversion process should stop), need to be configured. These parameters impact the regularization and convergence of the inversion. Then, select an appropriate initial resistivity model, which can be based on prior geological information or initial assumptions about the subsurface. Initiate the inversion process, allowing Res2DInv to iteratively adjust the resistivity values in the model to minimize the misfit between observed and synthetic data (Figure A3). The aforementioned procedure persists until the attainment of convergence or the conclusion of a prearranged quantity of iterations.
- Visualization (graphical representations for final resistivity model): Generate comprehensive reports and visual representations of the final resistivity model. These reports should include geological interpretations, anomaly identification, and recommendations based on the findings. Utilize the visualization tools in Res2DInv or other software to create cross-sectional profiles, depth slices, and 2D/3D models of the subsurface resistivity distribution (Figure A2).
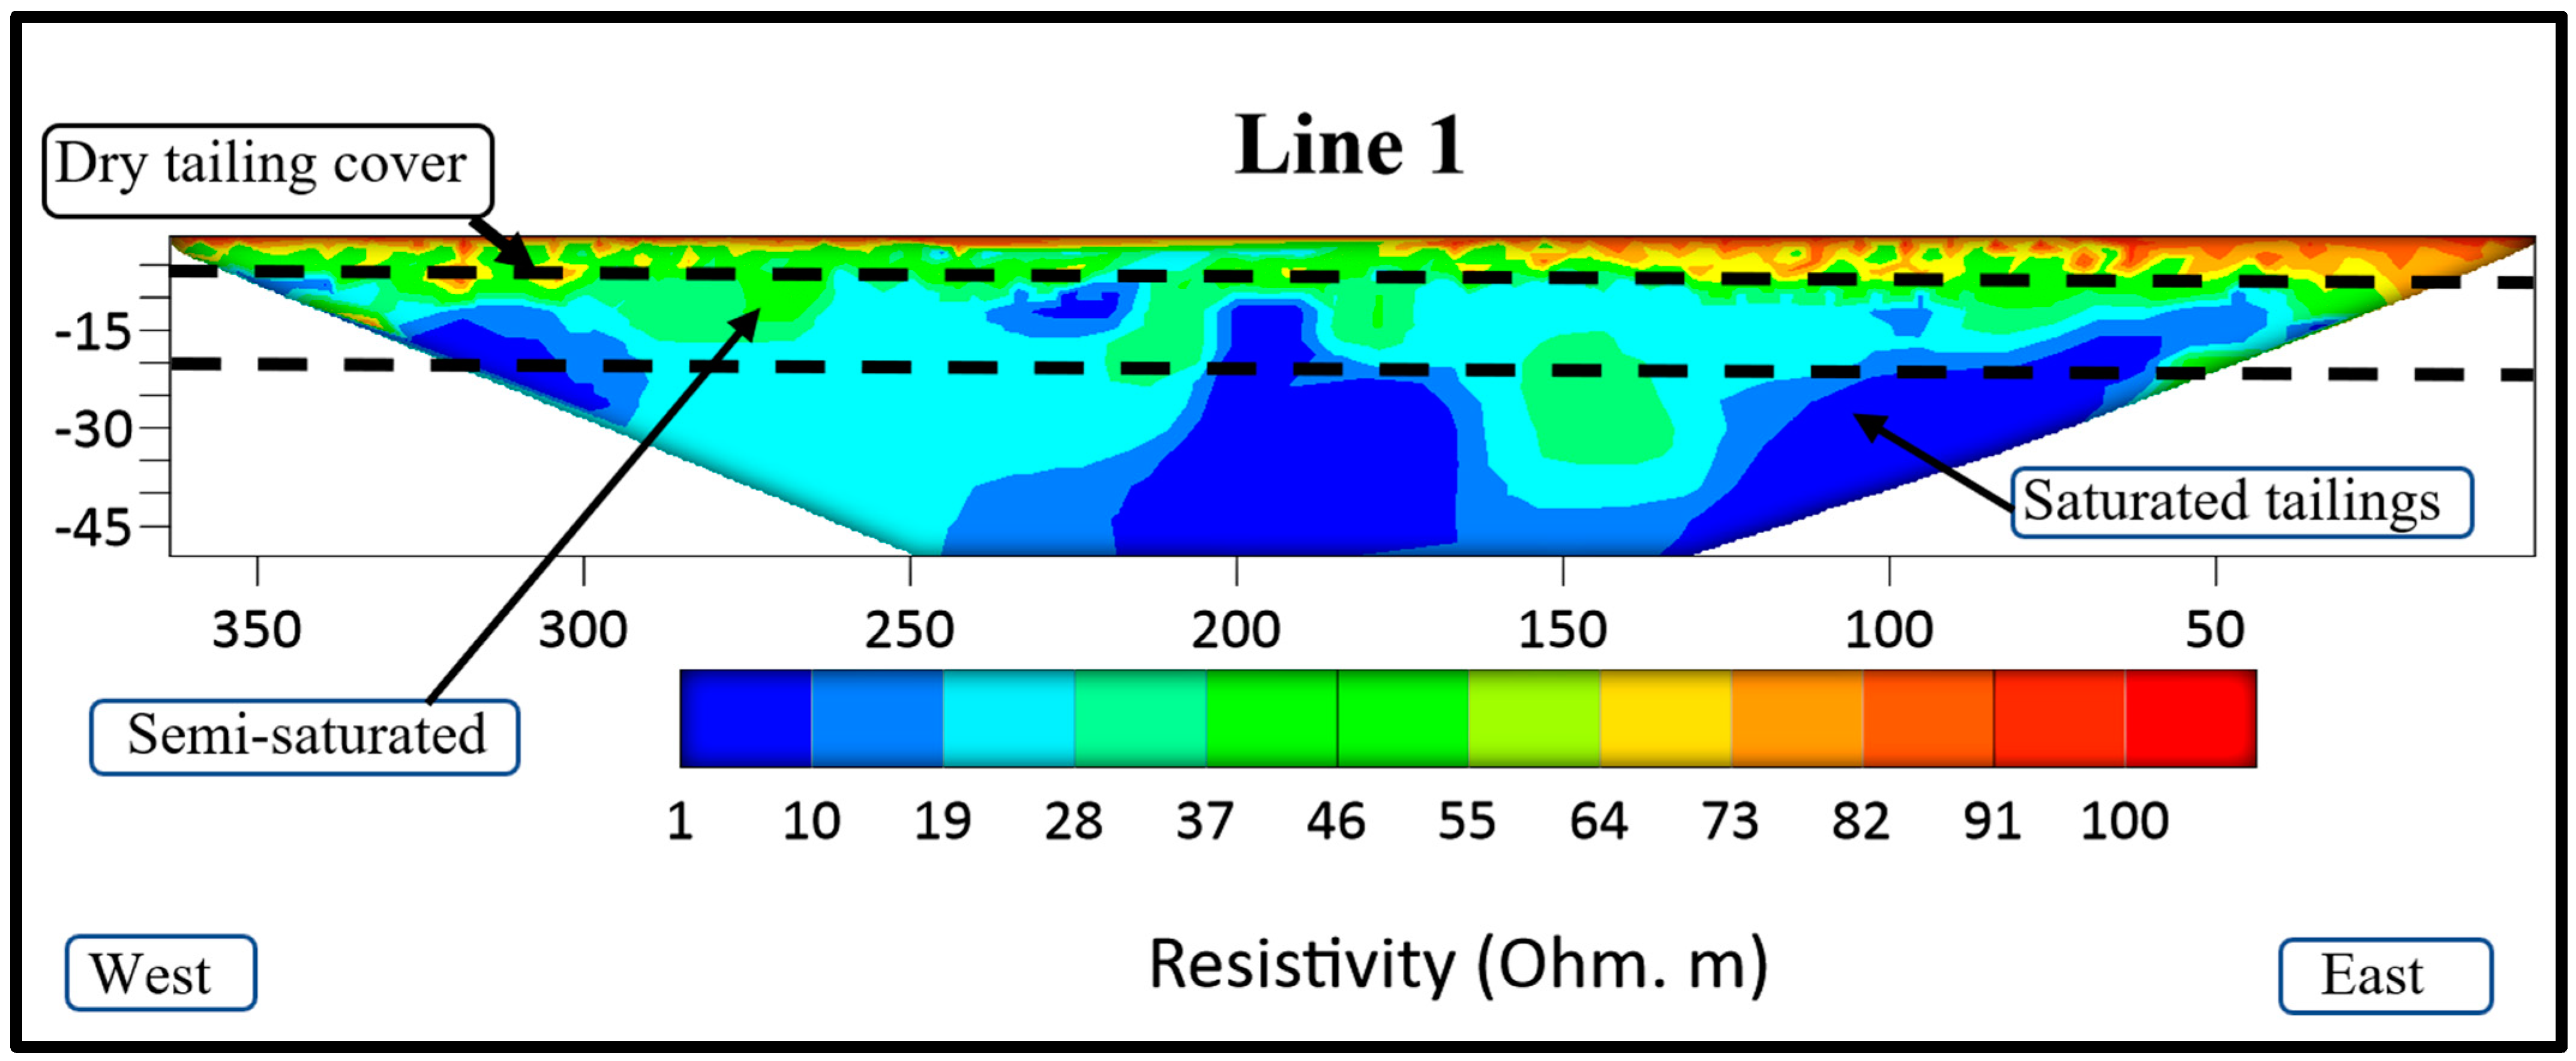
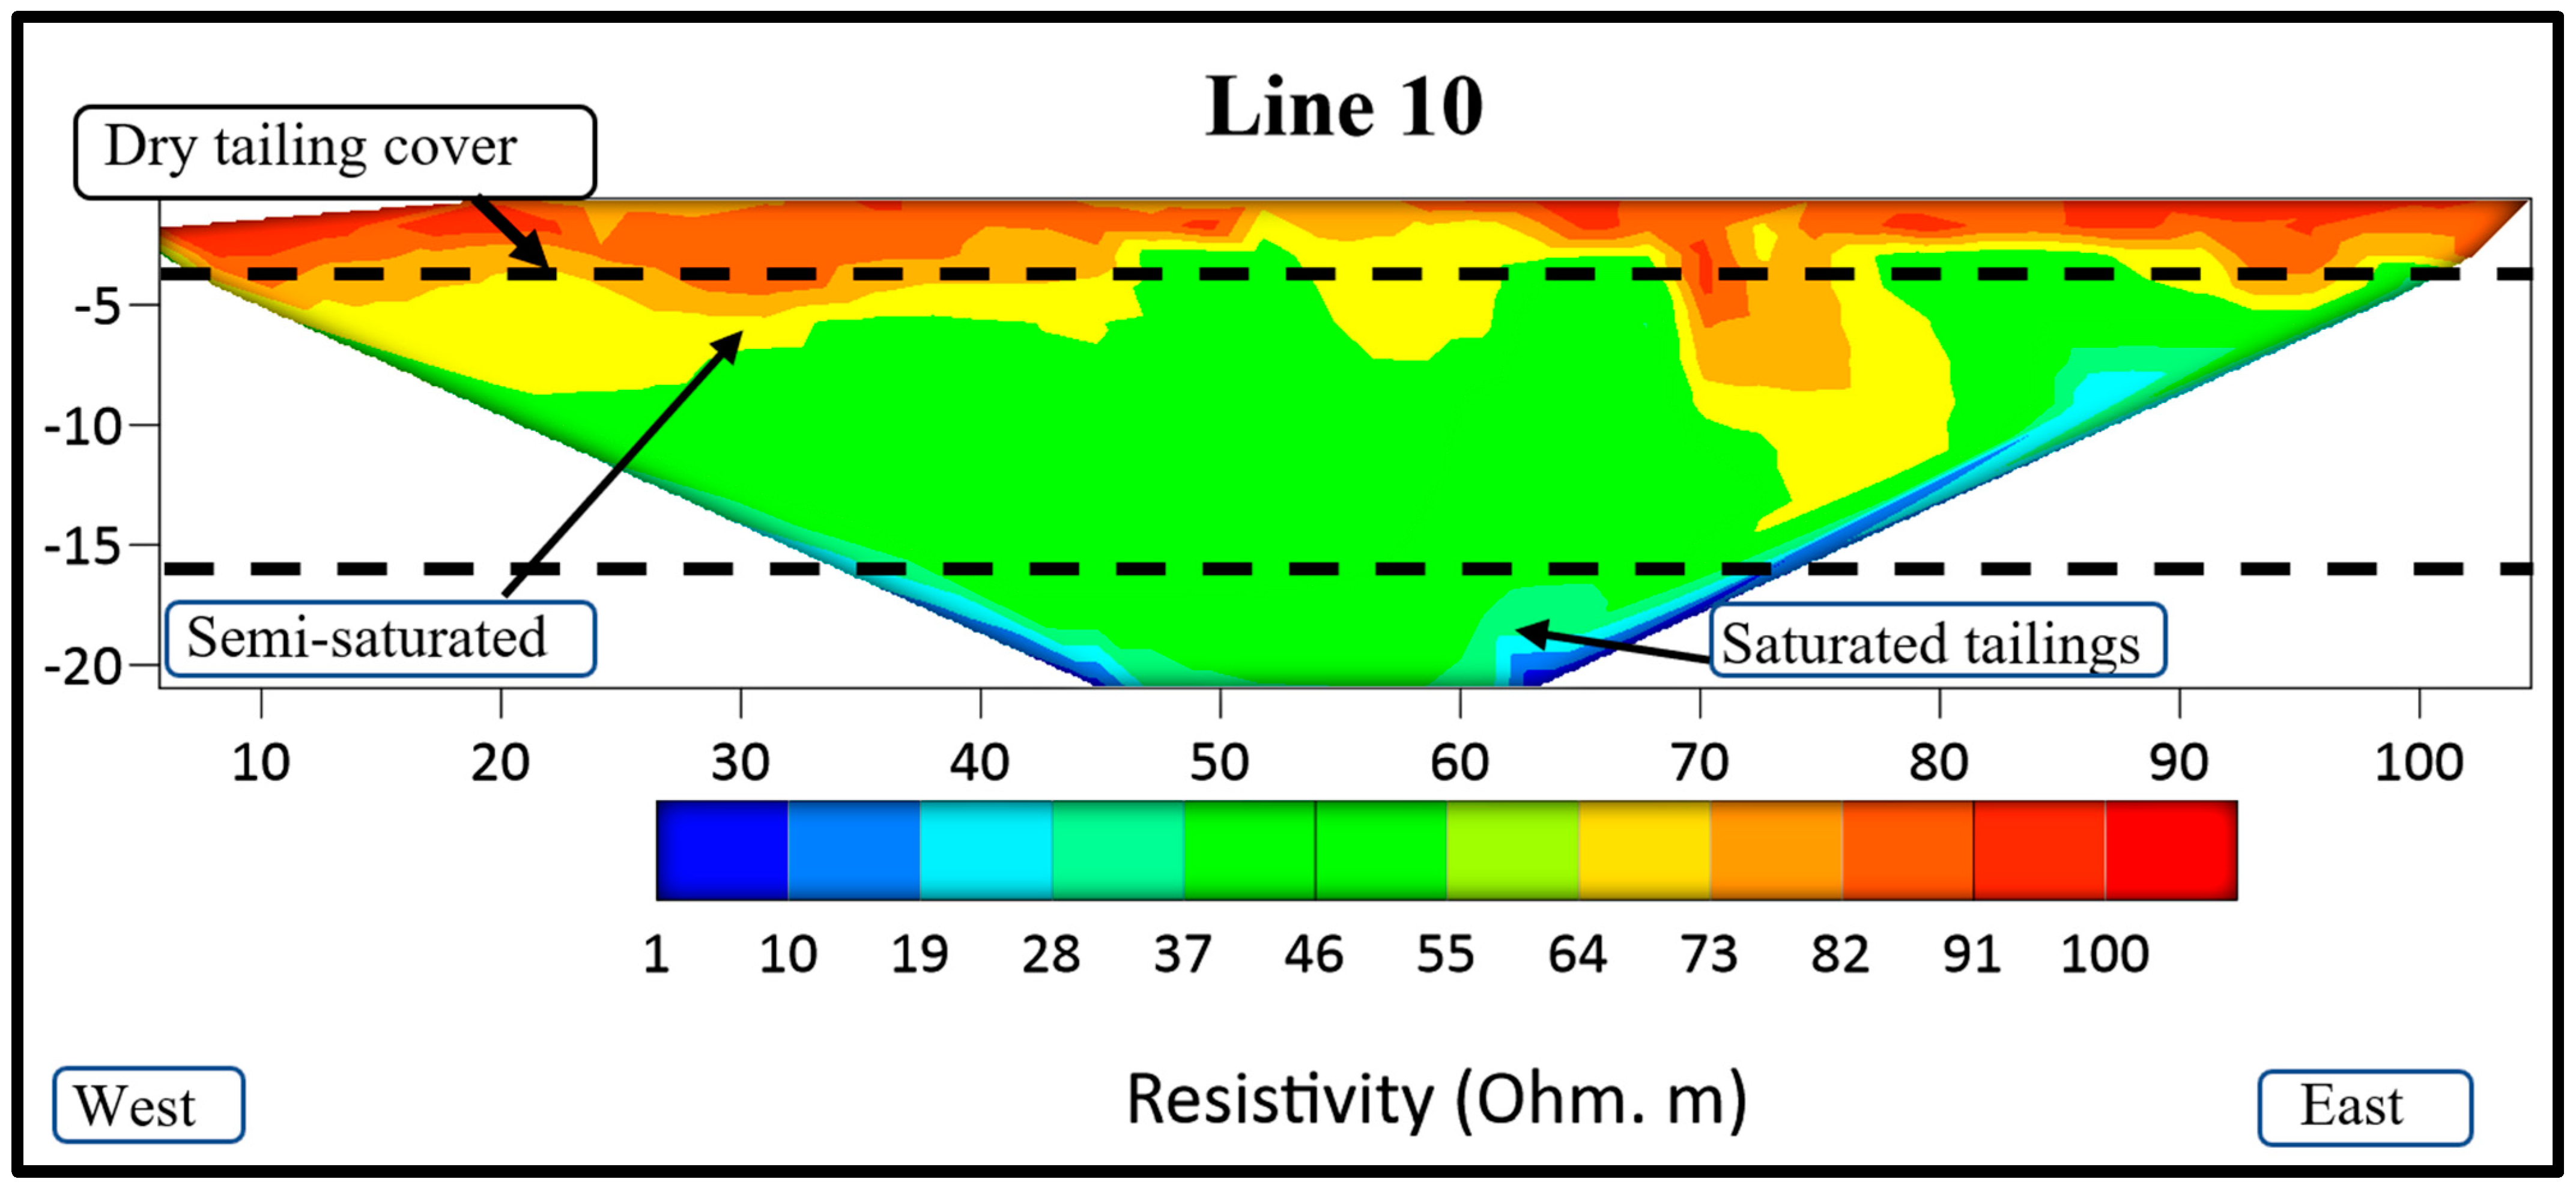
- Model Interpretation: Once the inversion process is complete, the software generates a resistivity model that represents the subsurface resistivity distribution. Interpret the resistivity model by identifying and characterizing geological features and anomalies, such as soil layers, bedrock, water bodies, or other subsurface structures. Use the visualization tools provided by Res2DInv to create contour plots, cross-sections (2D), and 3D representations of the resistivity model.
3. Results and Discussion
4. Conclusions
Author Contributions
Funding
Data Availability Statement
Acknowledgments
Conflicts of Interest
Appendix A


References
- Xu, D.; Zhan, C.; Liu, H.; Lin, H. A critical review of environmental implications, recycling strategies, and ecological remediation for mine tailings. Environ. Sci. Pollut. Res. 2019, 26, 35657–35669. [Google Scholar] [CrossRef] [PubMed]
- Lèbre, É.; Corder, G.; Golev, A. Sustainable practices in the management of mining waste: A focus on the mineral resource. Miner. Eng. 2017, 107, 34–42. [Google Scholar] [CrossRef]
- Kuranchie, F.A.; Shukla, S.K.; Habibi, D. Electrical resistivity of iron ore mine tailings produced in Western Australia. Int. J. Min. Reclam. Environ. 2015, 29, 191–200. [Google Scholar] [CrossRef]
- Ali, M.; Sun, S.; Qian, W.; Bohari, A.D.; Claire, D.; Zhang, Y. Application of Resistivity Method for Mining Tailings Site Selection in Karst Regions. In E3S Web Conferences; EDP Sciences: Ulys, France, 2020; Volume 144, p. 1002. [Google Scholar]
- Bordon, I.C.; Lima, M.; Abessa, D.M.S.; da Silva, P.S.C.; Cotrim, M.E.B.; Ulrich, J.C.; Takahashi, C.K.; da Silva, J.R.M.C. The Brumadinho Mining Disaster: Immediate Impacts of Mine Tailings 5 Days after the Dam Rupture. SSRN Electron. J. 2023, 17, 37–45. [Google Scholar] [CrossRef]
- Ramos, J.; Leiva, W.H.; Castillo, C.; Ihle, C.F.; Fawell, P.D.; Jeldres, R.I. Seawater flocculation of clay-based mining tailings: Impact of calcium and magnesium precipitation. Miner. Eng. 2020, 154, 106417. [Google Scholar] [CrossRef]
- Hudson, E.; Kulessa, B.; Edwards, P.; Williams, T.; Walsh, R. Integrated Hydrological and Geophysical Characterisation of Surface and Subsurface Water Contamination at Abandoned Metal Mines. Water Air Soil Pollut. 2018, 229, 256. [Google Scholar] [CrossRef]
- Ogilvy, R.D.; Kuras, O.; Palumbo-Roe, B.; Meldrum, P.I.; Wilkinson, P.B.; Chambers, J.E.; Klinck, B.A. The detection and tracking of mine-water pollution from abandoned mines using electrical tomography. In Proceedings of the International Mine Water Conference, Pretoria, South Africa, 19–23 October 2009; pp. 917–925. [Google Scholar]
- Rey, J.; Martínez, J.; Hidalgo, M.C.; Mendoza, R.; Sandoval, S. Assessment of Tailings Ponds by a Combination of Electrical (ERT and IP) and Hydrochemical Techniques (Linares, Southern Spain). Mine Water Environ. 2021, 40, 298–307. [Google Scholar] [CrossRef]
- Zhuang, Y.; Jin, K.; Cheng, Q.; Xing, A.; Luo, H. Experimental and numerical investigations of a catastrophic tailings dam break in Daye, Hubei, China. Bull. Eng. Geol. Environ. 2021, 81, 9. [Google Scholar] [CrossRef]
- Park, I.; Tabelin, C.B.; Jeon, S.; Li, X.; Seno, K.; Ito, M.; Hiroyoshi, N. A review of recent strategies for acid mine drainage prevention and mine tailings recycling. Chemosphere 2019, 219, 588–606. [Google Scholar] [CrossRef]
- Mewafy, F.M.; Werkema, D.D.; Atekwana, E.A.; Slater, L.D.; Abdel Aal, G.; Revil, A.; Ntarlagiannis, D. Evidence that bio-metallic mineral precipitation enhances the complex conductivity response at a hydrocarbon-contaminated site. J. Appl. Geophys. 2013, 98, 113–123. [Google Scholar] [CrossRef]
- Mewafy, F.M.; Atekwana, E.A.; Werkema, D.D., Jr.; Slater, L.D.; Ntarlagiannis, D.; Revil, A.; Skold, M.; Delin, G.N. Magnetic susceptibility as a proxy for investigating microbially mediated iron reduction. Geophys. Res. Lett. 2011, 38, L21402. [Google Scholar] [CrossRef]
- Zarif, F.; Isawi, H.; Elshenawy, A.; Eissa, M. Coupled geophysical and geochemical approach to detect the factors affecting the groundwater salinity in the coastal aquifer at the area between Ras Sudr and Ras Matarma area, South Sinai, Egypt. Groundw. Sustain. Dev. 2021, 15, 100662. [Google Scholar] [CrossRef]
- Abdelfattah, M.; Abu-Bakr, H.A.-A.; Mewafy, F.M.; Hassan, T.M.; Geriesh, M.H.; Saber, M.; Gaber, A. Hydrogeophysical and hydrochemical assessment of the northeastern coastal aquifer of Egypt for desalination suitability. Water 2023, 15, 423. [Google Scholar] [CrossRef]
- Maurya, P.K.; Rønde, V.K.; Fiandaca, G.; Balbarini, N.; Auken, E.; Bjerg, P.L.; Christiansen, A.V. Detailed landfill leachate plume mapping using 2D and 3D electrical resistivity tomography with correlation to ionic strength measured in screens. J. Appl. Geophys. 2017, 138, 1–8. [Google Scholar] [CrossRef]
- Alam, M.I.; Katumwehe, A.; Atekwana, E. Geophysical characterization of a leachate plume from a former municipal solid waste disposal site: A case study on Norman landfill. Am. Assoc. Pet. Geol. Bull. 2022, 106, 1183–1195. [Google Scholar] [CrossRef]
- Chambers, J.E.; Kuras, O.; Meldrum, P.I.; Ogilvy, R.D.; Hollands, J. Electrical resistivity tomography applied to geologic, hydrogeologic, and engineering investigations at a former waste-disposal site. Geophysics 2006, 71, B231–B239. [Google Scholar] [CrossRef]
- Hasan, M.; Shang, Y.; Jin, W.; Akhter, G. Joint geophysical prospecting for groundwater exploration in weathered terrains of South Guangdong, China. Environ. Monit. Assess. 2021, 193, 734. [Google Scholar] [CrossRef]
- Gabarrón, M.; Martínez-Pagán, P.; Martínez-Segura, M.A.; Bueso, M.C.; Martínez-Martínez, S.; Faz, Á.; Acosta, J.A. Electrical resistivity tomography as a support tool for physicochemical properties assessment of near-surface waste materials in a mining tailing pond (El Gorguel, SE Spain). Minerals 2020, 10, 559. [Google Scholar] [CrossRef]
- Martínez, J.; Mendoza, R.; Rey, J.; Sandoval, S.; Carmen Hidalgo, M. Characterization of tailings dams by electrical geophysical methods (ERT, IP): Federico mine (La Carolina, Southeastern Spain). Minerals 2021, 11, 145. [Google Scholar] [CrossRef]
- Islam, K.; Murakami, S. Global-scale impact analysis of mine tailings dam failures: 1915–2020. Glob. Environ. Chang. Policy Dimens. 2021, 70, 102361. [Google Scholar] [CrossRef]
- Paz, M.C.; Alcalá, F.J.; Medeiros, A.; Martínez-Pagán, P.; Pérez-Cuevas, J.; Ribeiro, L. Integrated MASW and ERT Imaging for Geological Definition of an Unconfined Alluvial Aquifer Sustaining a Coastal Groundwater-Dependent Ecosystem in Southwest Portugal. Appl. Sci. 2020, 10, 5905. [Google Scholar] [CrossRef]
- Agbalagba, E.O.; Nenuwe, O.N.; Owoade, L. Geophysical survey of groundwater potential and radioactivity assessment of soil depth lithology for drinking water-quality determination. Environ. Earth Sci. 2019, 78, 24. [Google Scholar] [CrossRef]
- Jhariya, D.; Khan, R.; Mondal, K.C.; Kumar, T.; K., I.; Singh, V.K. Assessment of groundwater potential zone using GIS-based multi-influencing factor (MIF), multi-criteria decision analysis (MCDA) and electrical resistivity survey techniques in Raipur city, Chhattisgarh, India. J. Water Supply Res. Technol. 2021, 70, 375–400. [Google Scholar] [CrossRef]
- Brahmi, S.; Baali, F.; Hadji, R.; Brahmi, S.; Hamad, A.; Rahal, O.; Zerrouki, H.; Saadali, B.; Hamed, Y. Assessment of groundwater and soil pollution by leachate using electrical resistivity and induced polarization imaging survey, case of Tebessa municipal landfill, NE Algeria. Arab. J. Geosci. 2021, 14, 249. [Google Scholar] [CrossRef]
- Akankpo, A.O.; Igboekwe, M.U. Monitoring Groundwater Contamination Using Surface Electrical Resistivity and Geochemical Methods. J. Water Resour. Prot. 2011, 3, 318–324. [Google Scholar] [CrossRef]
- Campanella, R.G.; Weemees, I. Development and use of an electrical resistivity cone for groundwater contamination studies. Can. Geotech. J. 1990, 27, 557–567. [Google Scholar] [CrossRef]
- Tarik, L.; Benamara, A.; Chaibi, M.T.; Tarik, M.; Hritta, D.; Bouhali, K. Application and comparison of very low frequency electromagnetic and electrical resistivity techniques to investigate a Karstic Region: A case study of EL Hajeb Municipality, Morocco. J. Appl. Geophys. 2023, 215, 105121. [Google Scholar] [CrossRef]
- Ogungbe, A.S.; Onori, E.O.; Olaoye, M.A. Application of electrical resistivity techniques in the investigation of groundwater contamination: A case study of lie-Epo Dumpsite, Lagos, Nigeria. Int. J. Geomat. Geosci. 2012, 3, 30–41. [Google Scholar]
- Wychowaniak, D.; Zawadzki, Ł.; Lech, M. Application of column tests and electrical resistivity methods for leachate transport monitoring. Ann. Wars. Univ. Life Sci. Land Reclam. 2015, 47, 237–247. [Google Scholar] [CrossRef]
- Zawadzki, Ł.; Wychowaniak, D.; Lech, M. Electrical resistivity methods for landfill monitoring. Ann. Wars. Univ. Life Sci.-SGGW Land Reclam. 2018, 50, 183–193. [Google Scholar] [CrossRef]
- Rein, A.; Hoffmann, R.; Dietrich, P. Influence of natural time-dependent variations of electrical conductivity on DC resistivity measurements. J. Hydrol. 2004, 285, 215–232. [Google Scholar] [CrossRef]
- Dusabemariya, C.; Jiang, F.; Qian, W.; Faruwa, A.R.; Bagaragaza, R.; Ali, M. Water seepage detection using resistivity method around a pumped storage power station in China. J. Appl. Geophys. 2021, 188, 104320. [Google Scholar] [CrossRef]
- Das, K.; Mishra, A.; Singh, A.; Agrahari, S.; Chakrabarti, R.; Mukherjee, A. Solute exchanges between multi-depth groundwater and surface water of climatically vulnerable Gangetic delta front aquifers of Sundarbans. J. Environ. Manag. 2021, 284, 112026. [Google Scholar] [CrossRef] [PubMed]
- Yan, Y.; Deng, Y.; Ma, L.; Zhao, G.; Qian, J. Characterizing seasonal recharge between a river and shallow aquifer in a floodplain based on time-lapse electrical resistivity tomography. Hydrogeol. J. 2022, 31, 111–126. [Google Scholar] [CrossRef]
- Owen, R.; Gwavava, O.; Gwaze, P. Multi-electrode resistivity survey for groundwater exploration in the Harare greenstone belt, Zimbabwe. Hydrogeol. J. 2006, 14, 244–252. [Google Scholar] [CrossRef]
- Kumar, D. Efficacy of electrical resistivity tomography technique in mapping shallow subsurface anomaly. J. Geol. Soc. India 2012, 80, 304–307. [Google Scholar] [CrossRef]
- ClarkJames, A.; Richard, P.S. Inexpensive Geophysical Instruments Supporting Groundwater Exploration in Developing Nations. J. Water Resour. Prot. 2011, 2011, 768–780. [Google Scholar]
- Lu, Y.; Tao, J.; Cao, C.; Liu, H.; Liu, Y.; Ge, Z. Detection of Landfill Leachate Leakage Based on ERT and OCTEM. Water 2023, 15, 1778. [Google Scholar] [CrossRef]
- Martorana, R.; Capizzi, P.; Pirrera, C. Unconventional Arrays for 3D Electrical Resistivity and Induced Polarization Tomography to Detect Leachate Concentration in a Waste Landfill. Appl. Sci. 2023, 13, 7203. [Google Scholar] [CrossRef]
- Netto, L.G.; Malagutti Filho, W.; Moreira, C.A.; di Donato, F.T.; Helene, L.P.I. Delineation of necroleachate pathways using electrical resistivity tomography (ERT): Case study on a cemetery in Brazil. Environ. Chall. 2021, 5, 100344. [Google Scholar] [CrossRef]
- Martínez-Pagán, P.; Gómez-Ortiz, D.; Martín-Crespo, T.; Martín-Velázquez, S.; Martínez-Segura, M. Electrical Resistivity Imaging Applied to Tailings Ponds: An Overview. Mine Water Environ. 2021, 40, 285–297. [Google Scholar] [CrossRef]
- Benyassine, E.M.; Lachhab, A.; Dekayir, A.; Parisot, J.C.; Rouai, M. An application of electrical resistivity tomography to investigate heavy metals pathways. J. Environ. Eng. Geophys. 2017, 22, 315–324. [Google Scholar] [CrossRef]
- Lachhab, A.; Benyassine, E.M.; Rouai, M.; Dekayir, A.; Parisot, J.C.; Boujamaoui, M. Integration of multi-geophysical approaches to identify potential pathways of heavy metals contamination-a case study in Zeida, Morocco. J. Environ. Eng. Geophys. 2020, 25, 415–423. [Google Scholar] [CrossRef]
- Moreira, C.A.; Guireli Netto, L.; Camarero, P.L.; Bertuluci, F.B.; Hartwig, M.E.; Domingos, R. Application of electrical resistivity tomography (ERT) in uranium mining earth dam. J. Geophys. Eng. 2022, 19, 1265–1279. [Google Scholar] [CrossRef]
- Diallo, M.C.; Cheng, L.Z.; Chouteau, M.; Rosa, E.; Liu, C.; Abbassi, B.; Dimech, A. Abandoned old mine excavation detection by Electrical Resistivity Tomography. Eng. Geol. 2023, 320, 107123. [Google Scholar] [CrossRef]
- Martínez-Pagán, P.; Gómez-Ortiz, D.; Martín-Crespo, T.; Manteca, J.I.; Rosique, M. The electrical resistivity tomography method in the detection of shallow mining cavities. A case study on the Victoria Cave, Cartagena (SE Spain). Eng. Geol. 2013, 156, 1–10. [Google Scholar] [CrossRef]
- Ali, M.A.H.; Sun, S.; Qian, W.; Abdou Dodo, B. Electrical resistivity imaging for detection of hydrogeological active zones in karst areas to identify the site of mining waste disposal. Environ. Sci. Pollut. Res. 2020, 27, 22486–22498. [Google Scholar] [CrossRef]
- Éric, V.; Cullen, M.P.; Feasby, D.G. NI 43-101 Technical Report Amended Preliminary Economic Assessment for the Optimization and Expansion of the El Mochito Mine; Ascendant Resources Inc.: Toronto, ON, Canada, 2018. [Google Scholar]
- Loke, M.H.; Chambers, J.E.; Rucker, D.F.; Kuras, O.; Wilkinson, P.B. Recent developments in the direct-current geoelectrical imaging method. J. Appl. Geophys. 2013, 95, 135–156. [Google Scholar] [CrossRef]
- Ali, M.; Sun, S.; Qian, W.; Bohari, A.D.; Claire, D.; Zhang, Y. Geoelectrical tomography data processing and interpretation for Pb-Zn-Ag mineral exploration in Nash Creek, Canada. In E3S Web of Conferences; EDP Sciences: Ulys, France, 2020; Volume 168. [Google Scholar]
- Ali, M.A.H.; Mewafy, F.M.; Qian, W.; Alshehri, F.; Ahmed, M.S.; Saleem, H.A. Integration of Electrical Resistivity Tomography and Induced Polarization for Characterization and Mapping of (Pb-Zn-Ag) Sulfide Deposits. Minerals 2023, 13, 986. [Google Scholar] [CrossRef]
- Telford, W.M.; Geldart, L.P.; Sheriff, R.E. Applied Geophysics; Cambridge University Press: Cambridge, UK, 1990. [Google Scholar]
- Binley, A.; Kemna, A. DC resistivity and induced polarization methods. In Hydrogeophysics; Springer: Dordrecht, The Netherlands, 2005; pp. 129–156. [Google Scholar]
- Bery, A.A.; Mohamad, E.T.; Jinmin, M. Electrical Resistivity and Induced Polarization Data Correlation with Conductivity for Iron Ore Exploration. Electron. J. Geotech. Eng. 2012, 17, 3223–3233. [Google Scholar]
- Dahlin, T. The development of DC resistivity imaging techniques. Comput. Geosci. 2001, 27, 1019–1029. [Google Scholar] [CrossRef]
- Ma, C.; Liu, J.; Liu, H.; Guo, R.; Musa, B.; Cui, Y. 2.5D electric resistivity forward modeling with element-free Galerkin method. J. Appl. Geophys. 2019, 162, 47–57. [Google Scholar] [CrossRef]
- Li, S.; Liu, B.; Nie, L.; Liu, Z.; Tian, M.; Wang, S.; Su, M.; Guo, Q. Detecting and monitoring of water inrush in tunnels and coal mines using direct current resistivity method: A review. J. Rock Mech. Geotech. Eng. 2015, 7, 469–478. [Google Scholar] [CrossRef]
- Loke, M.H. Tutorial: 2-D and 3-D Electrical Imaging Surveys; Geotomo Software: Gelugor, Malaysia, 2014; p. 127. [Google Scholar]
- Loke, M.H.; Dahlin, T. A comparison of the Gauss--Newton and quasi-Newton methods in resistivity imaging inversion. J. Appl. Geophys. 2002, 49, 149–162. [Google Scholar] [CrossRef]
- Loke, M.H.; Kiflu, H.; Wilkinson, P.B.; Harro, D.; Kruse, S. Optimized arrays for 2D resistivity surveys with combined surface and buried arrays. Near Surf. Geophys. 2015, 13, 505–518. [Google Scholar] [CrossRef]
- Loke, M.H. Rapid 2D Resistivity & IP Inversion Using the Least-Squares Method. 2018. Available online: www.geotomosoft.com (accessed on 31 October 2023).


| Survey Item | Specifications |
|---|---|
| Survey Type | Direct current resistivity |
| Geophysical System | EarthProbe High-Resolution surface and borehole DCIP system |
| Data Type | Full-waveform, 256 ms on-time and 256 ms off-time, castle waveform |
| Survey Configuration | Surface DCIP: Wenner Alpha array |
| Voltage Input | The system uses 12V DC, it has a transformer inside to convert 12 V into 24 V to 800 V. |
| Electrode Spacing | 2.3 m |
| Line Label | No. of Spreads | No. of Electrodes/Spread | No. of Electrodes Are in Overlap | Total Data Points |
|---|---|---|---|---|
| Line 1 | 2 | *S1 = 112 S2 = 112 | 64 | 4050 |
| Line 2 | 2 | S1 = 138 S2 = 57 | 36 | 3564 |
| Line 3 | 1 | 134 | --- | 2894 |
| Line 4 | 2 | S1 = 138 S2 = 91 | 80 | 4268 |
| Line 5 | 1 | 136 | --- | 2920 |
| Line 6 | 1 | 105 | --- | 1755 |
| Line 7 | 1 | 96 | --- | 1466 |
| Line 8 | 1 | 80 | --- | 1010 |
| Line 9 | 1 | 80 | --- | 1026 |
| Line 10 | 1 | 48 | --- | 359 |
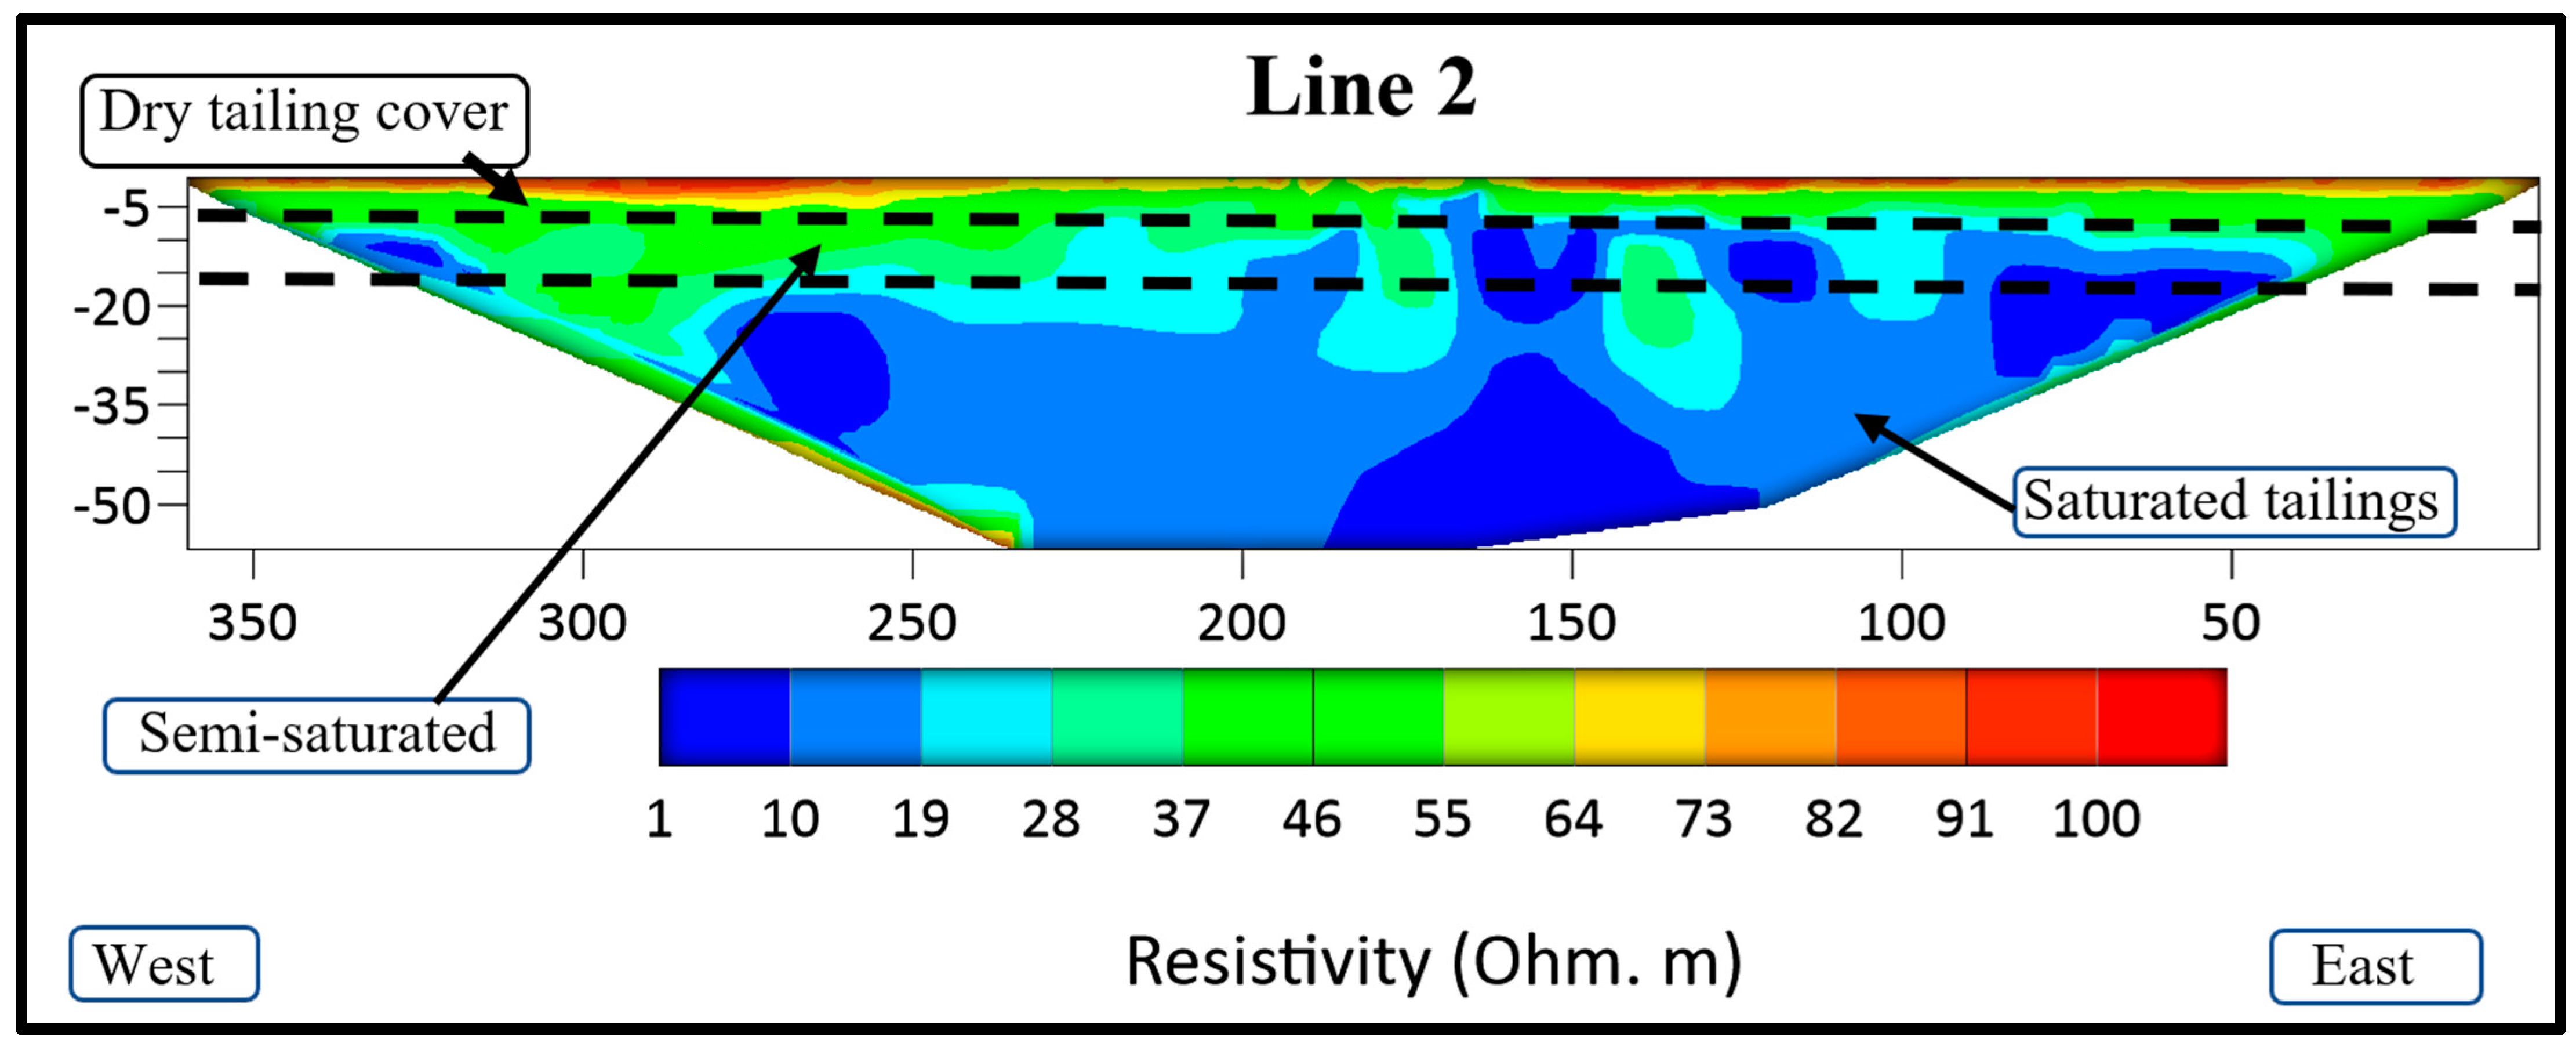
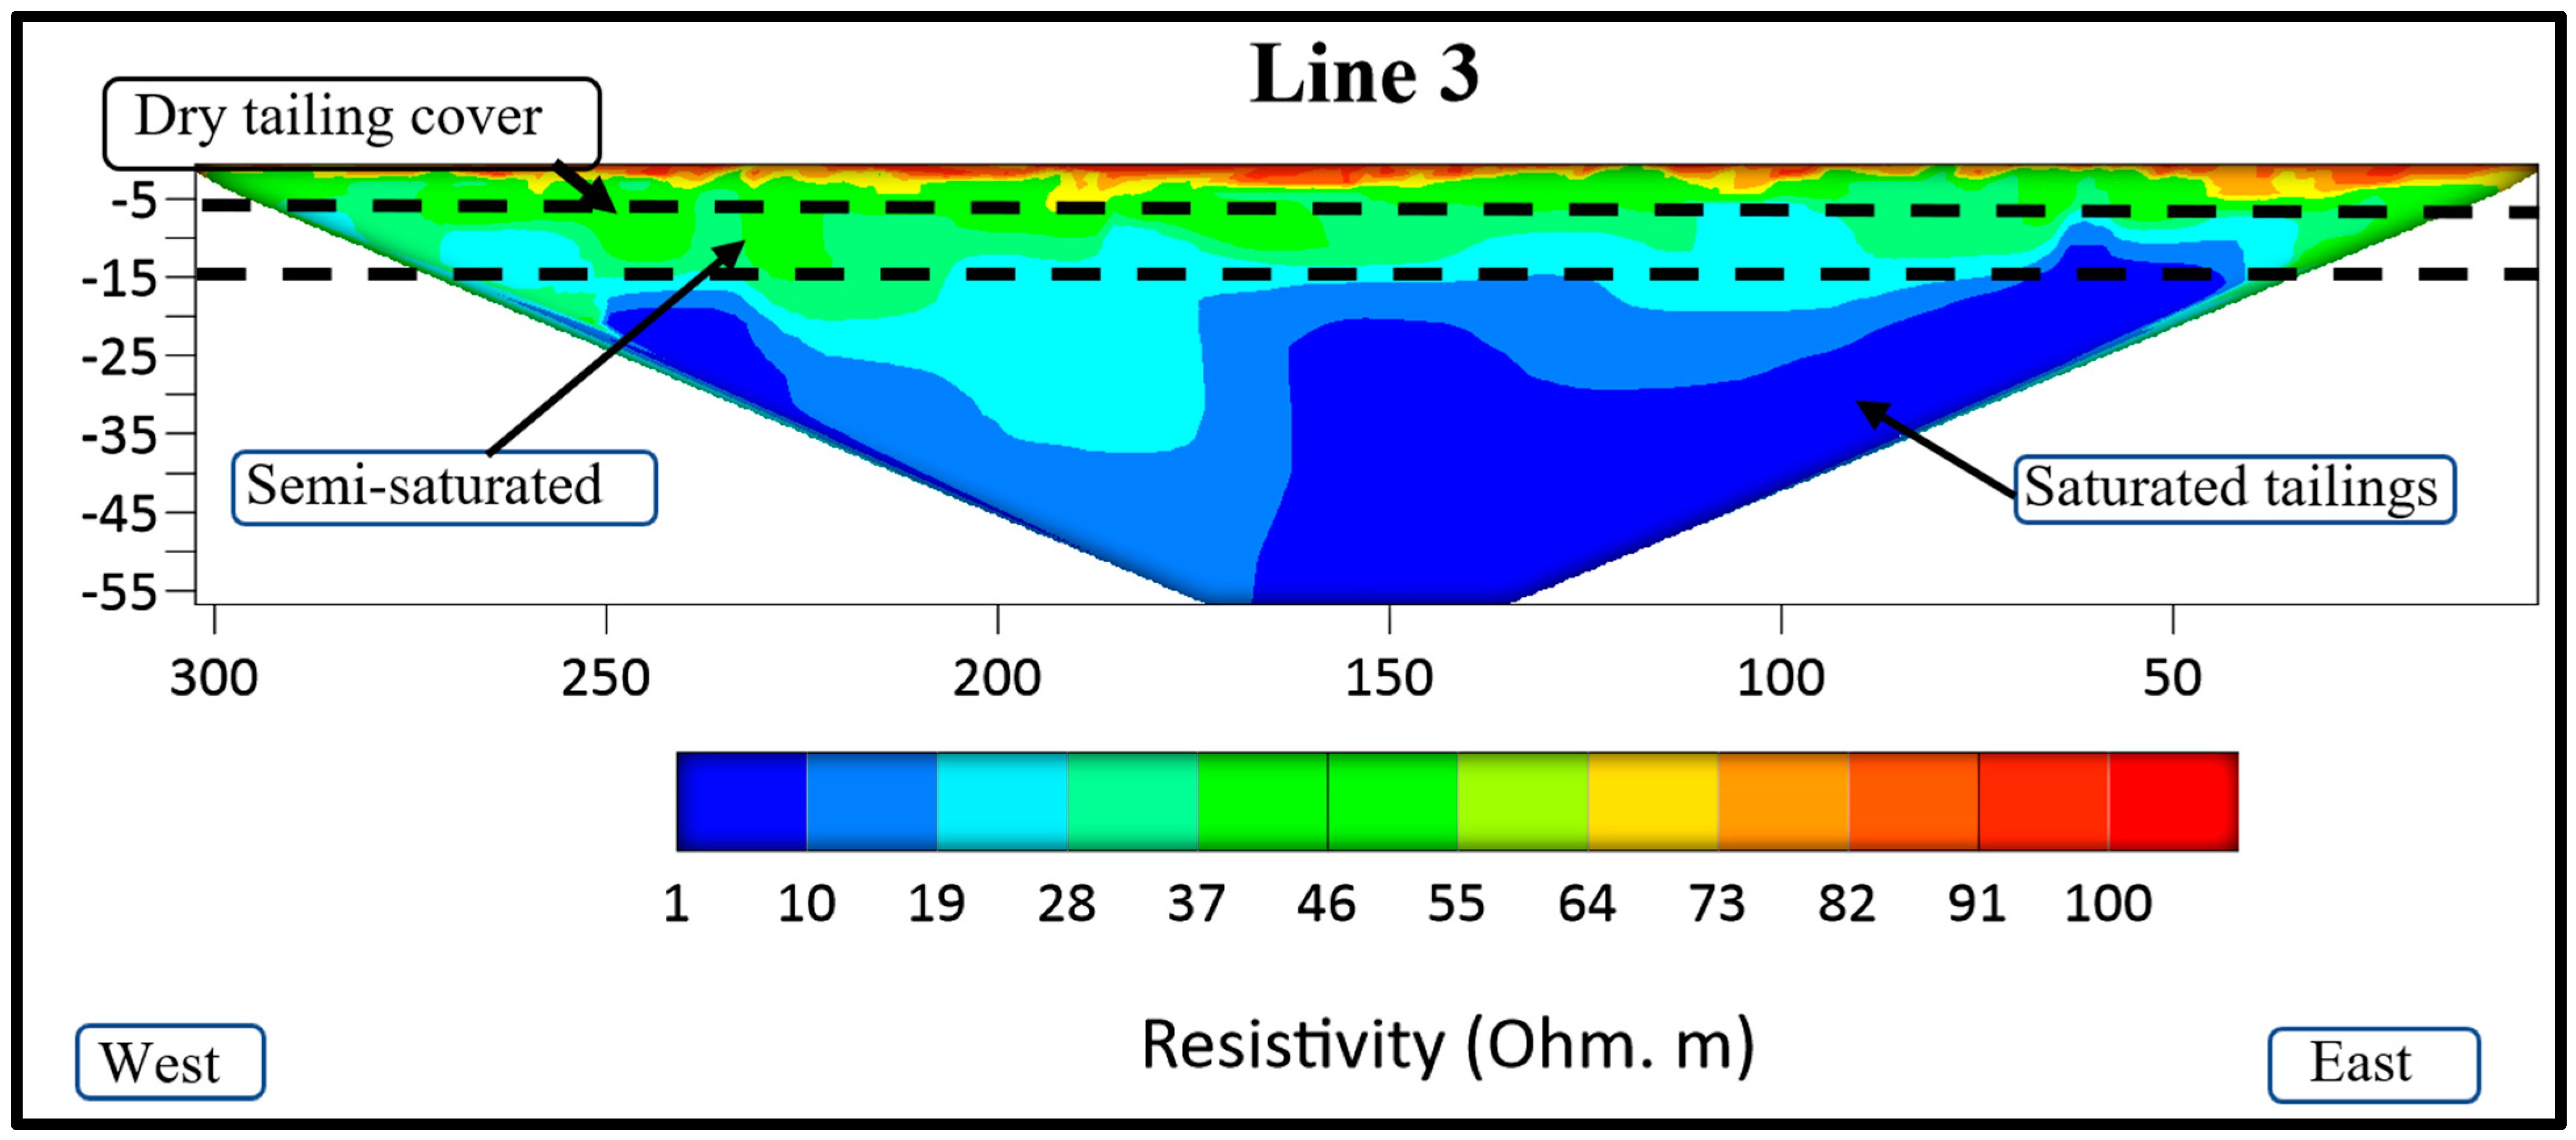
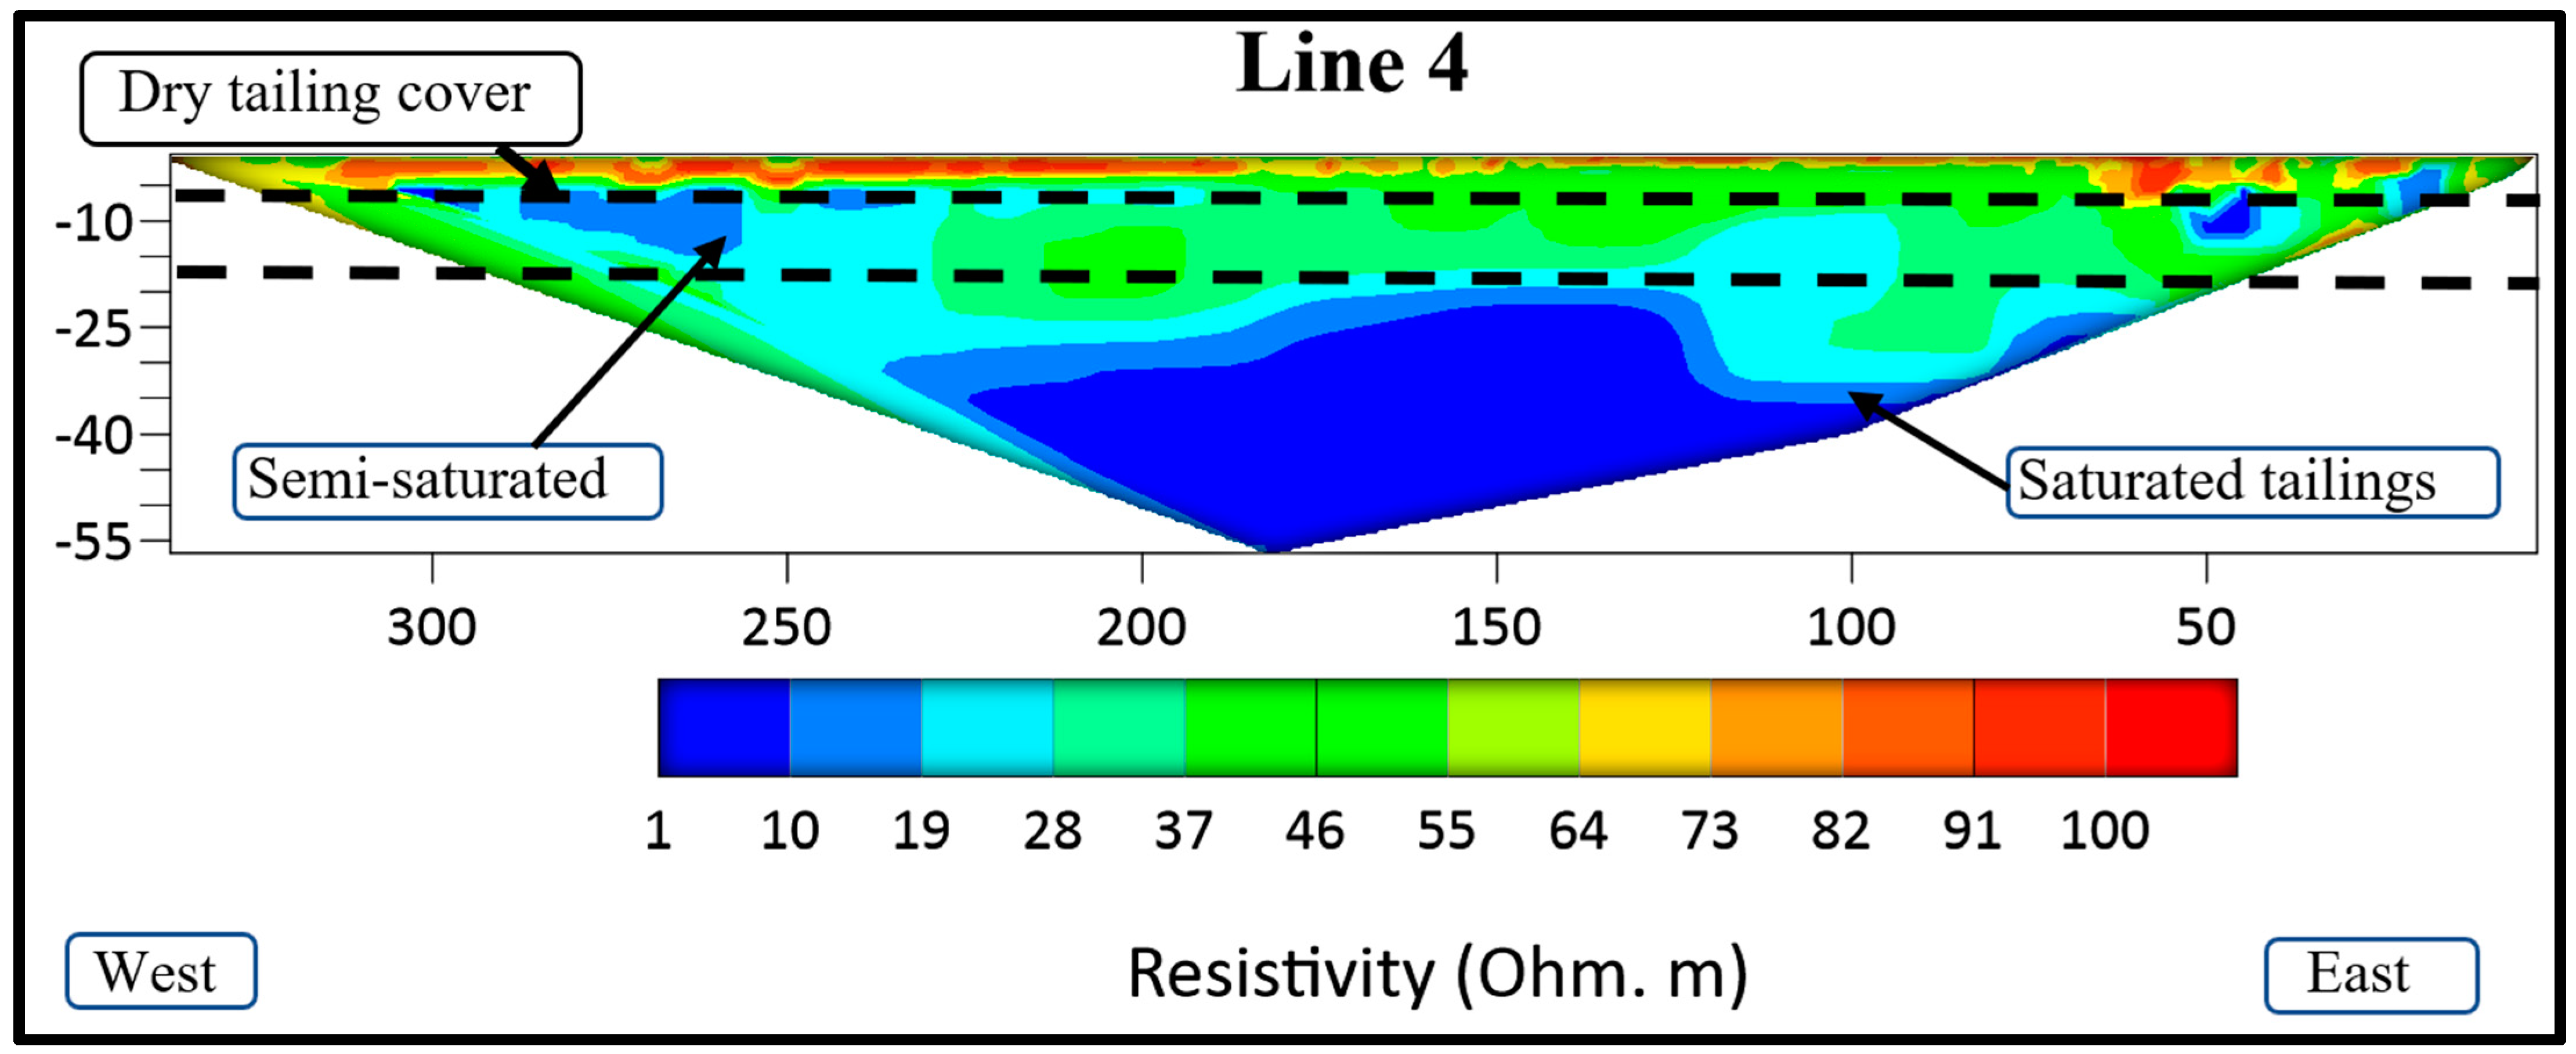
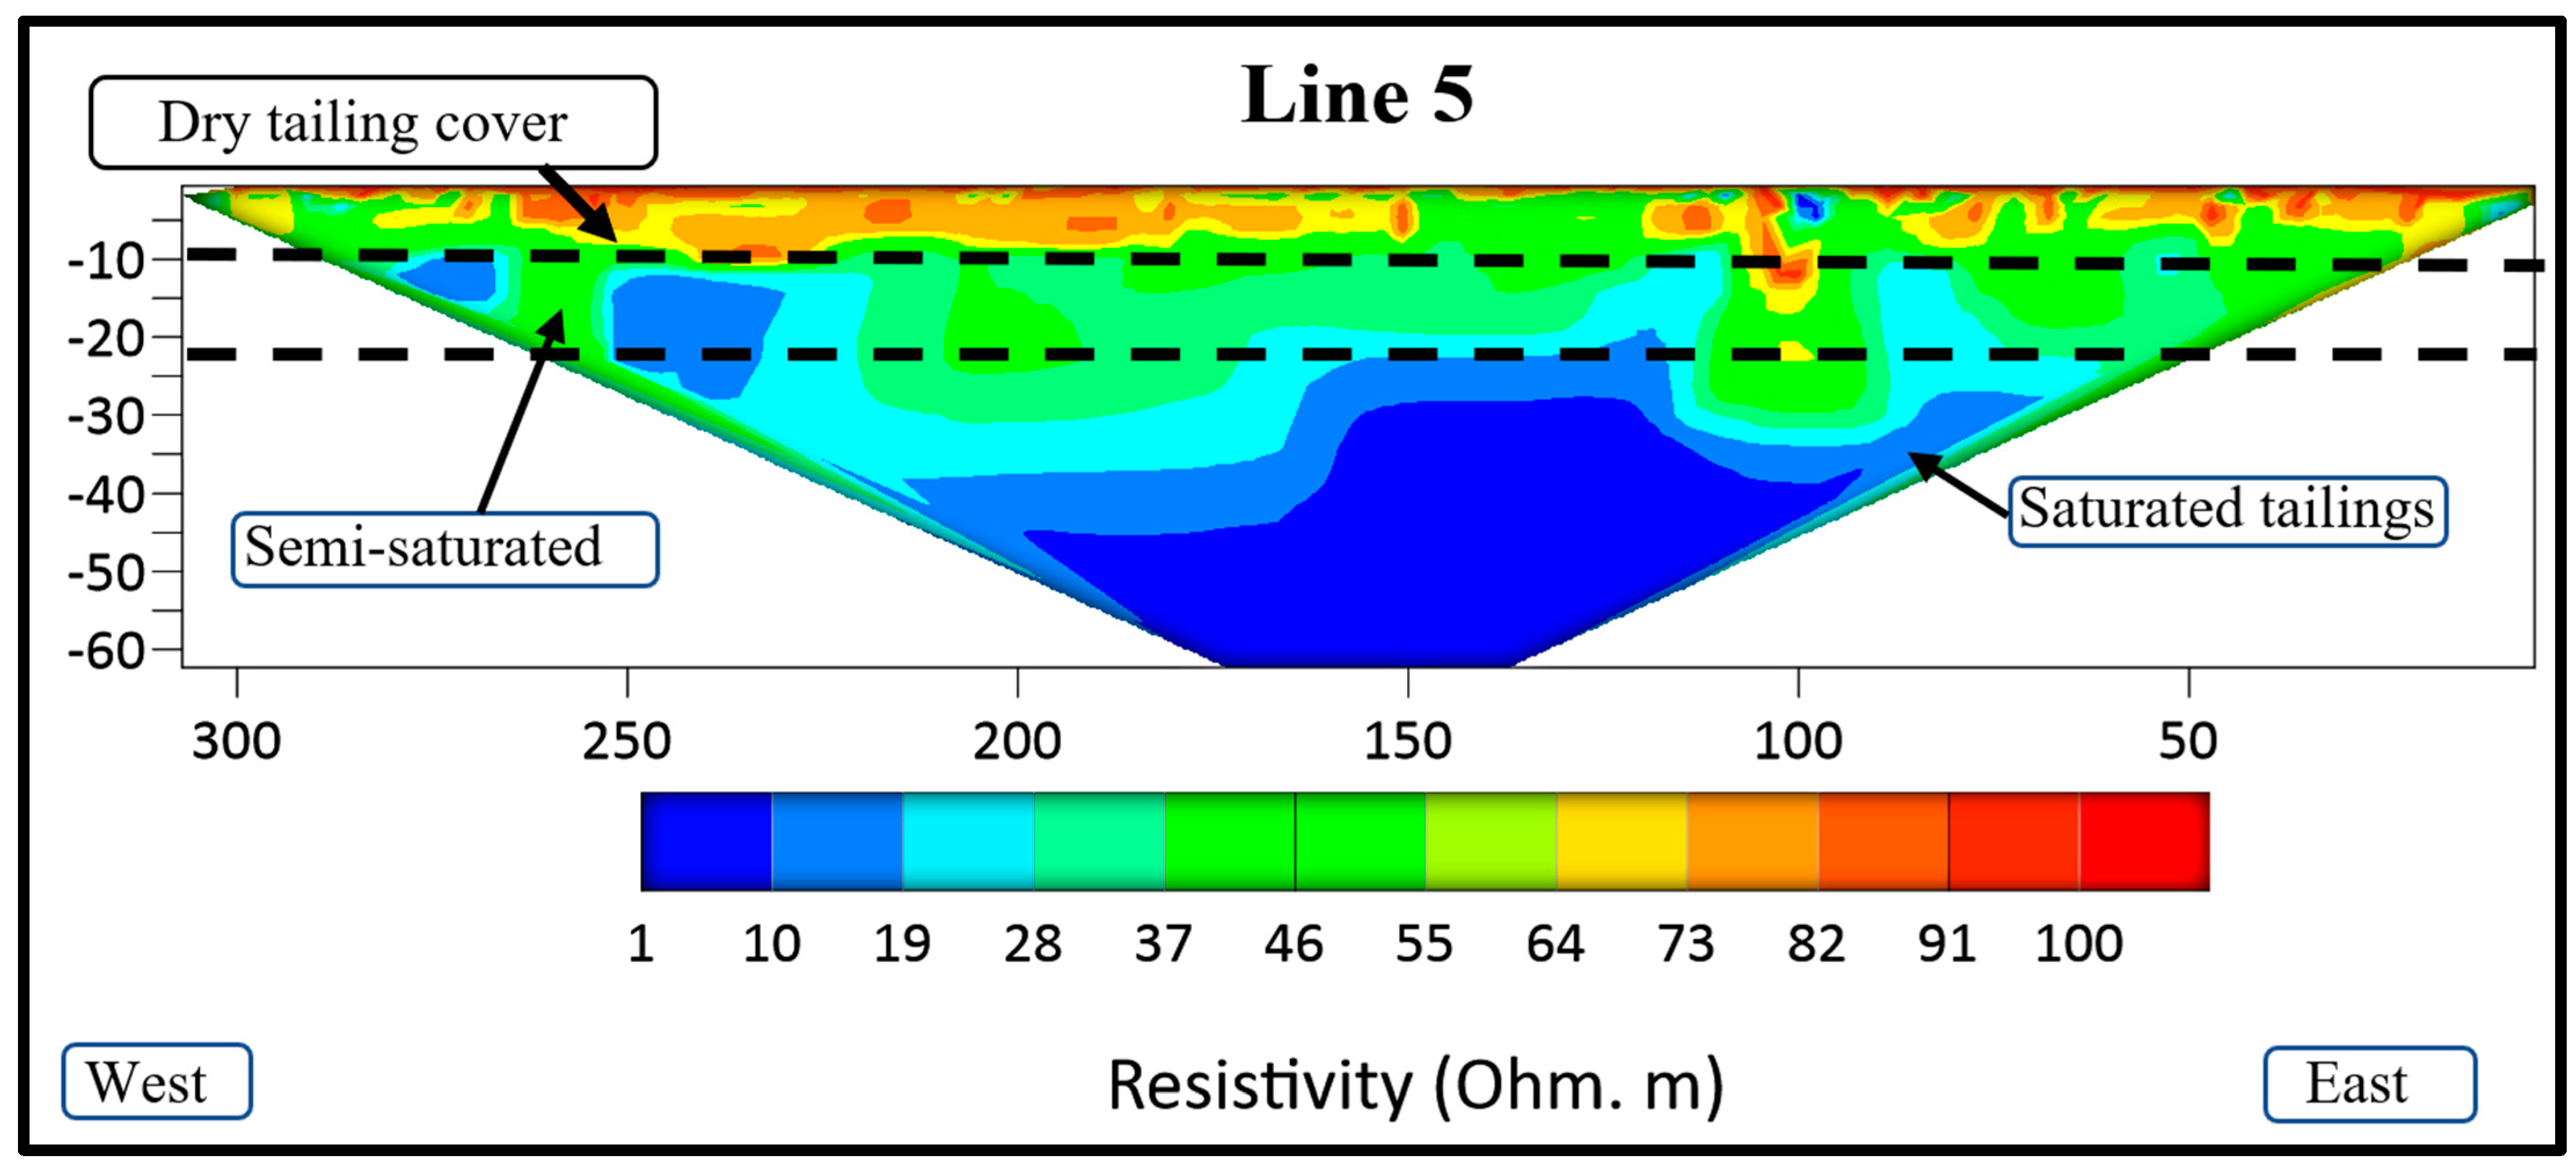
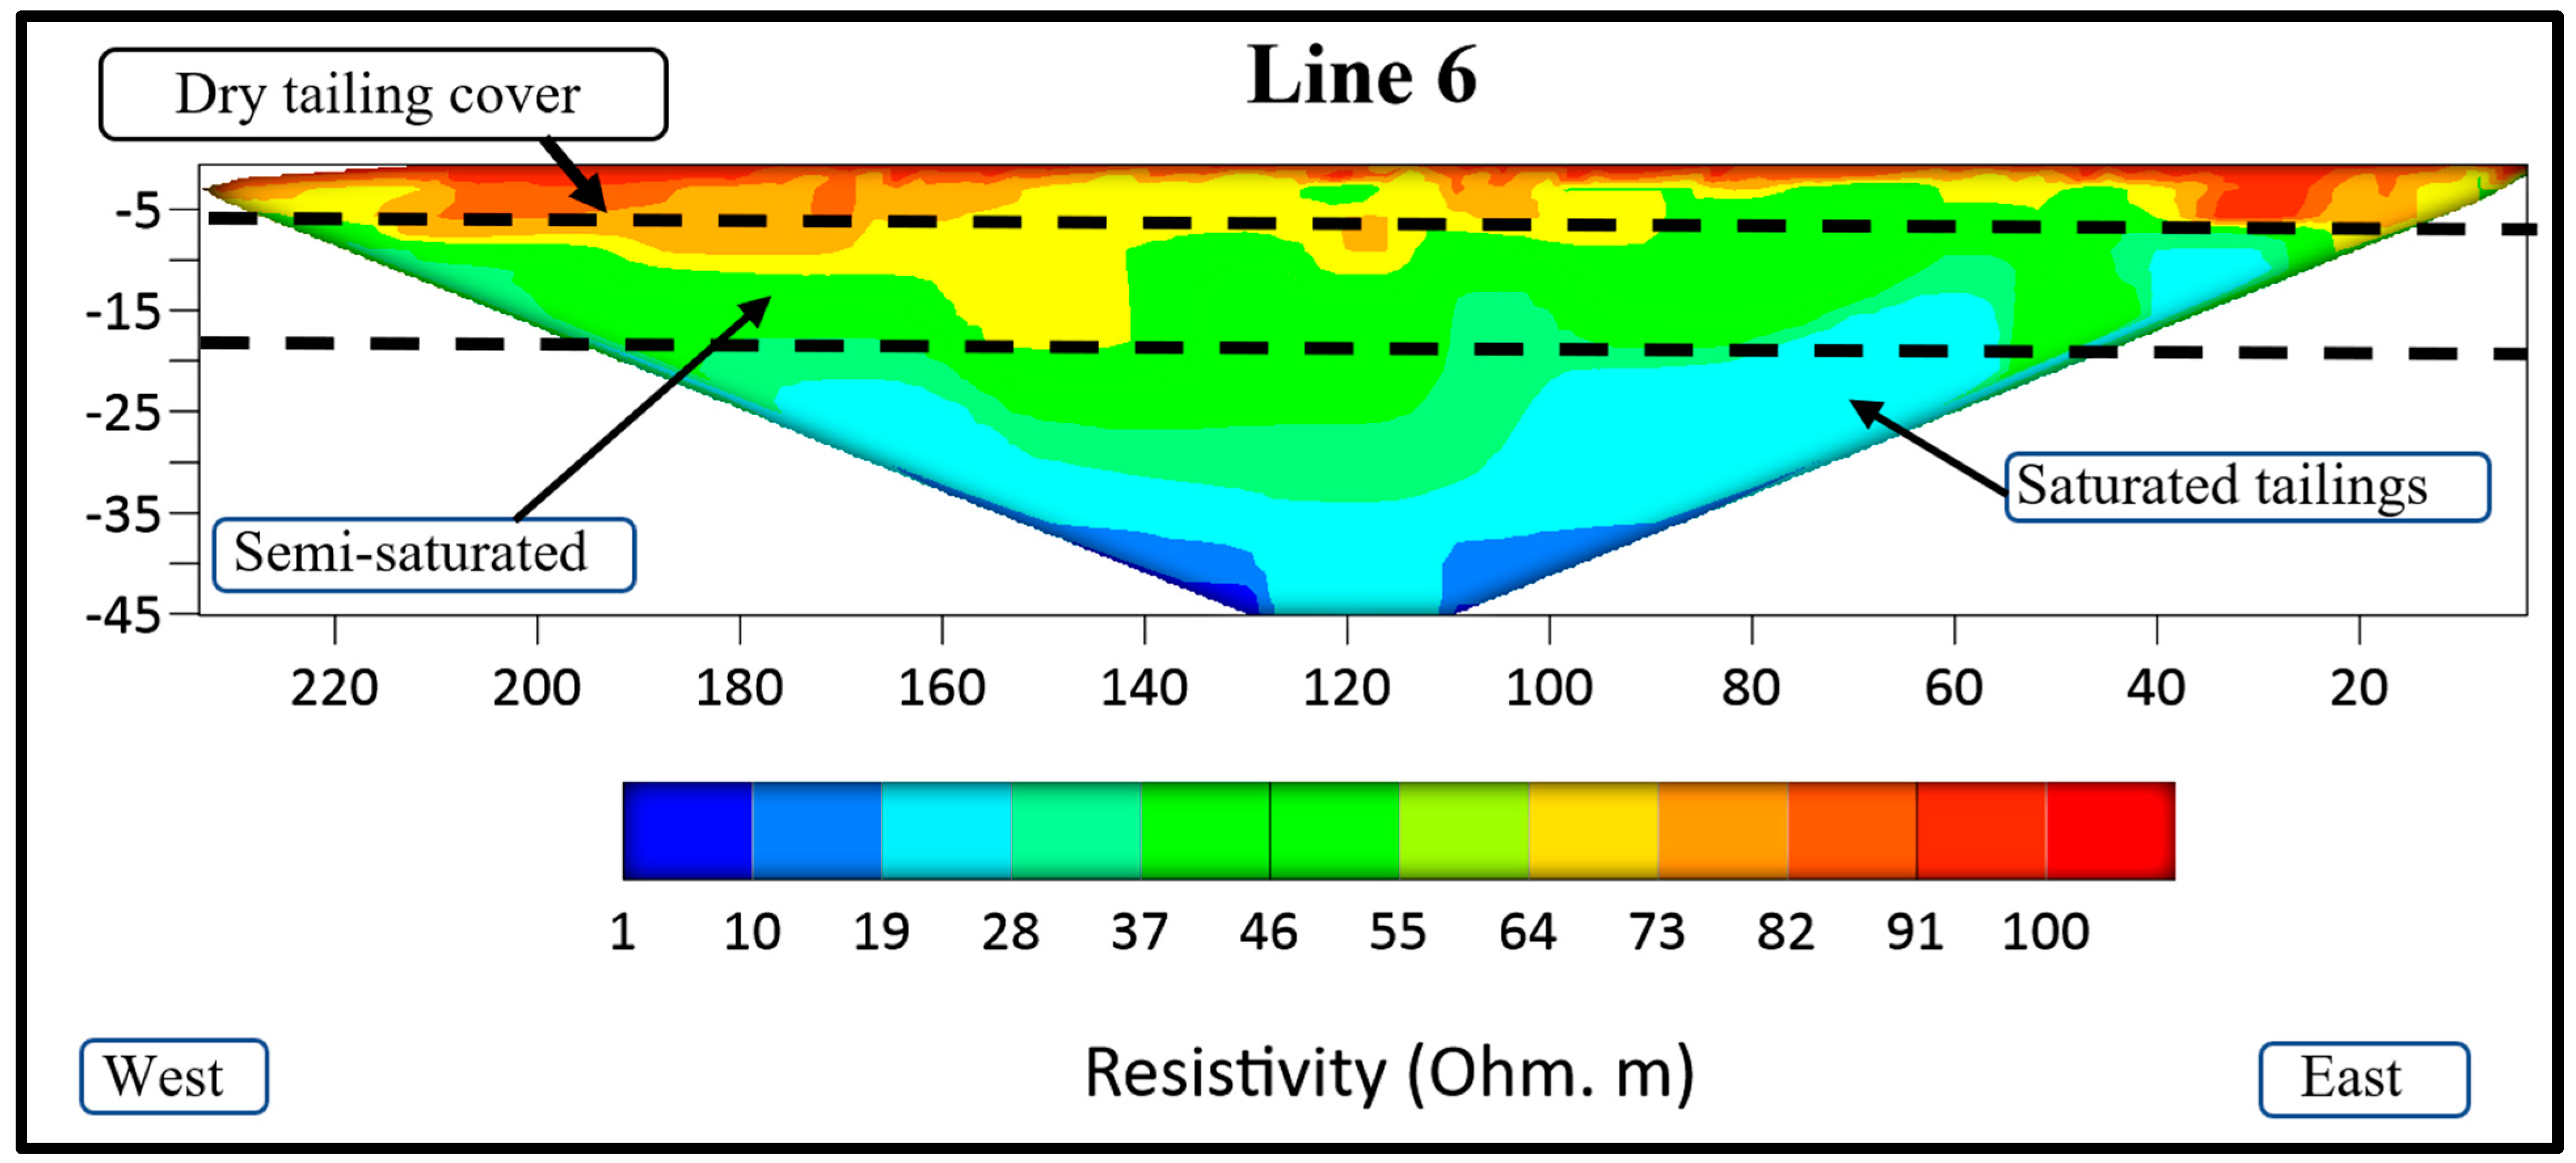
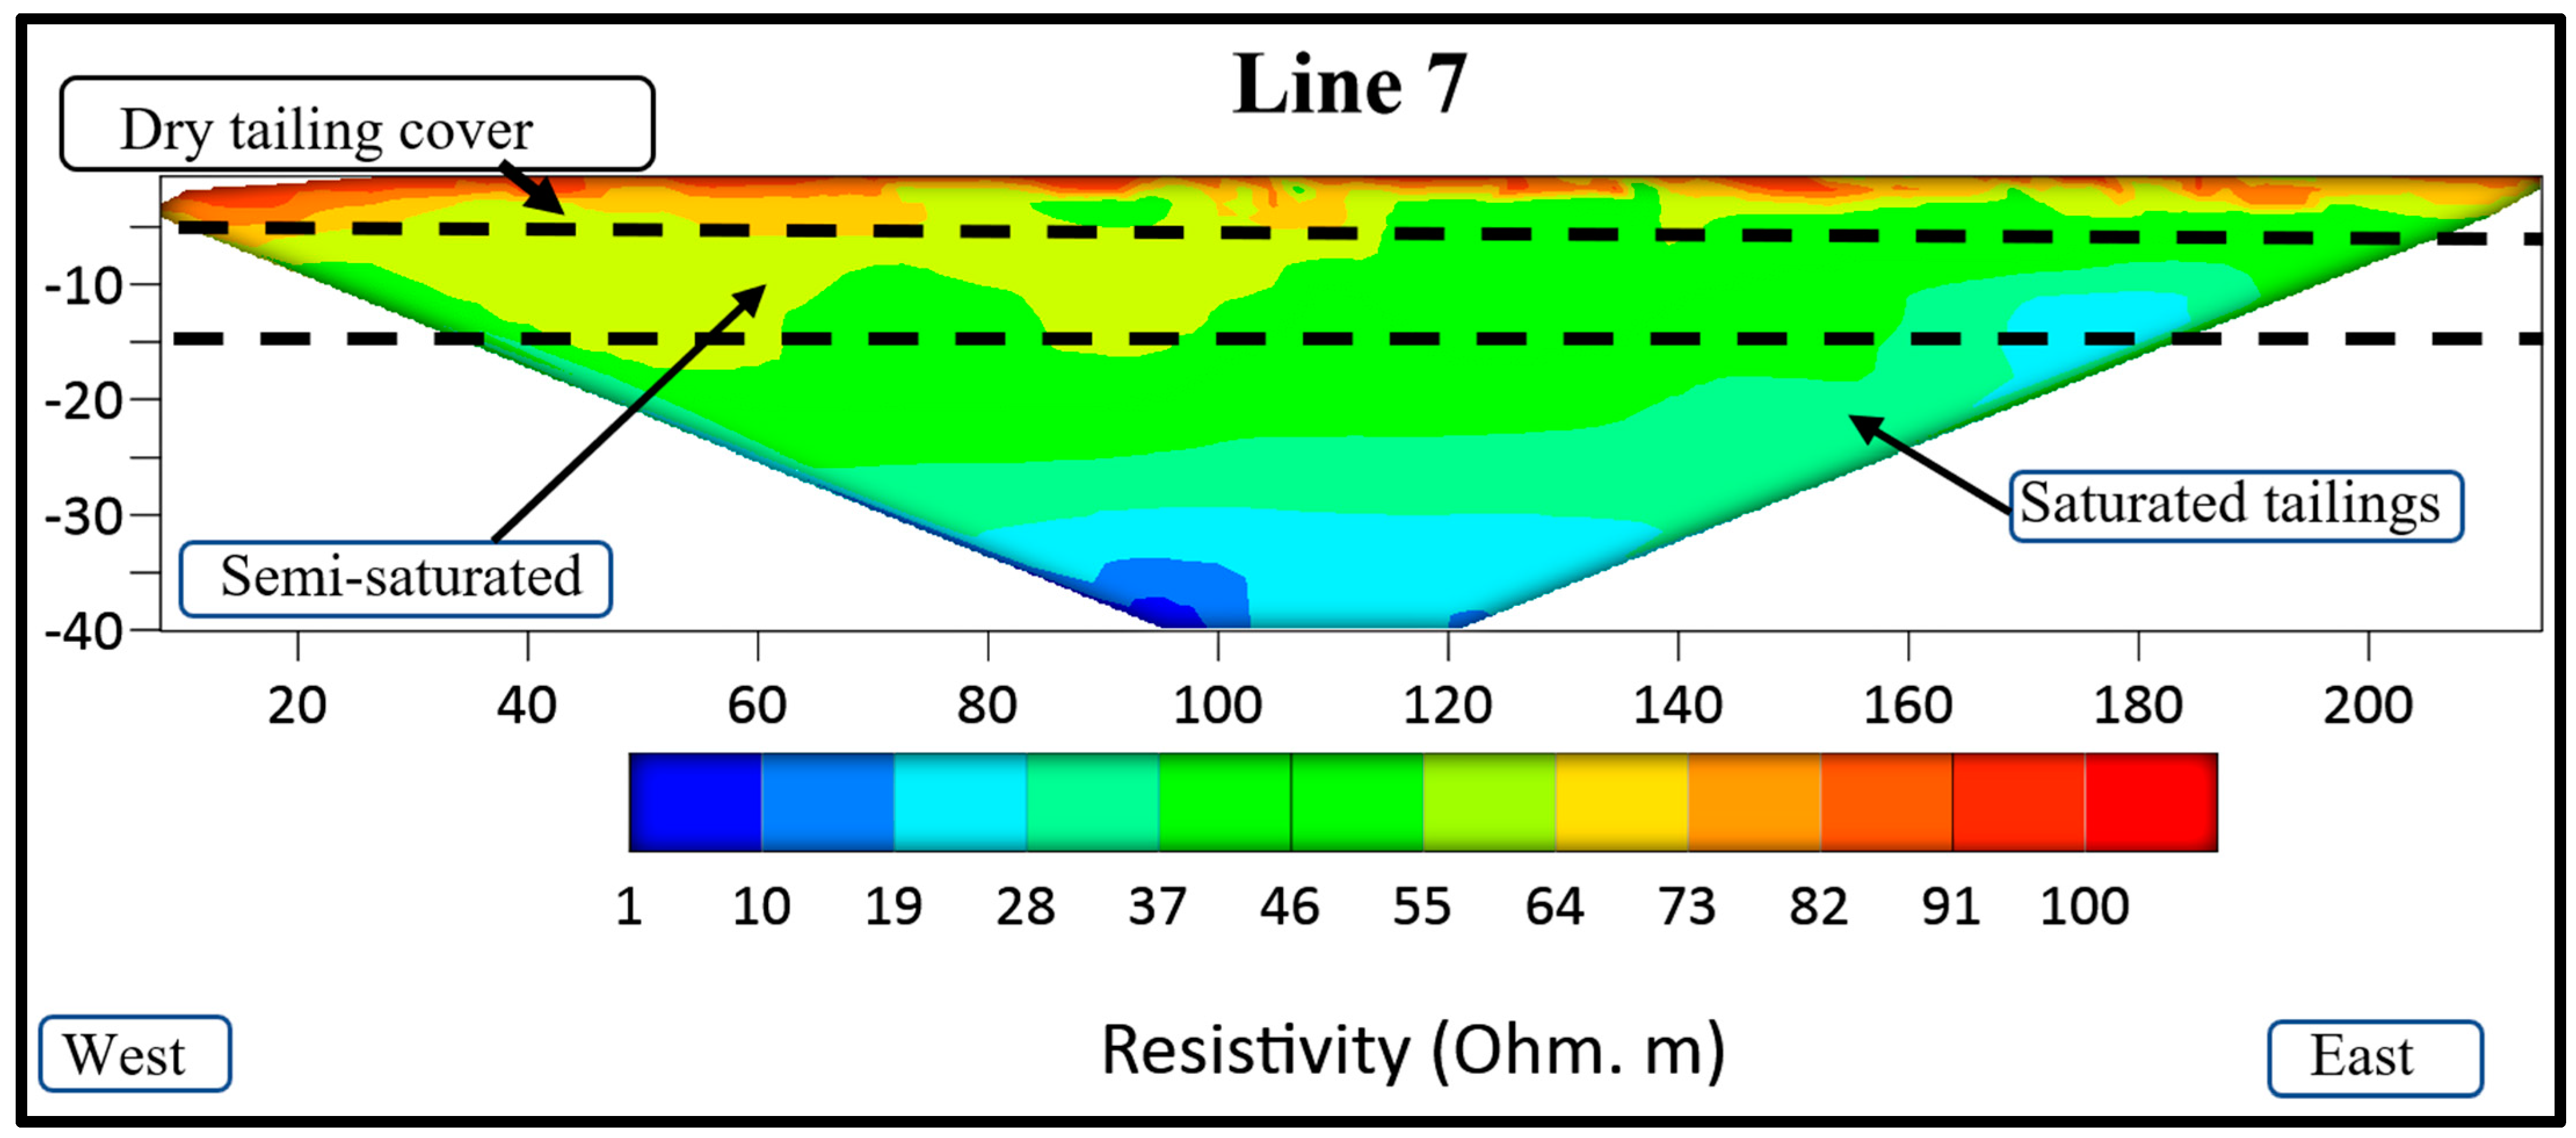
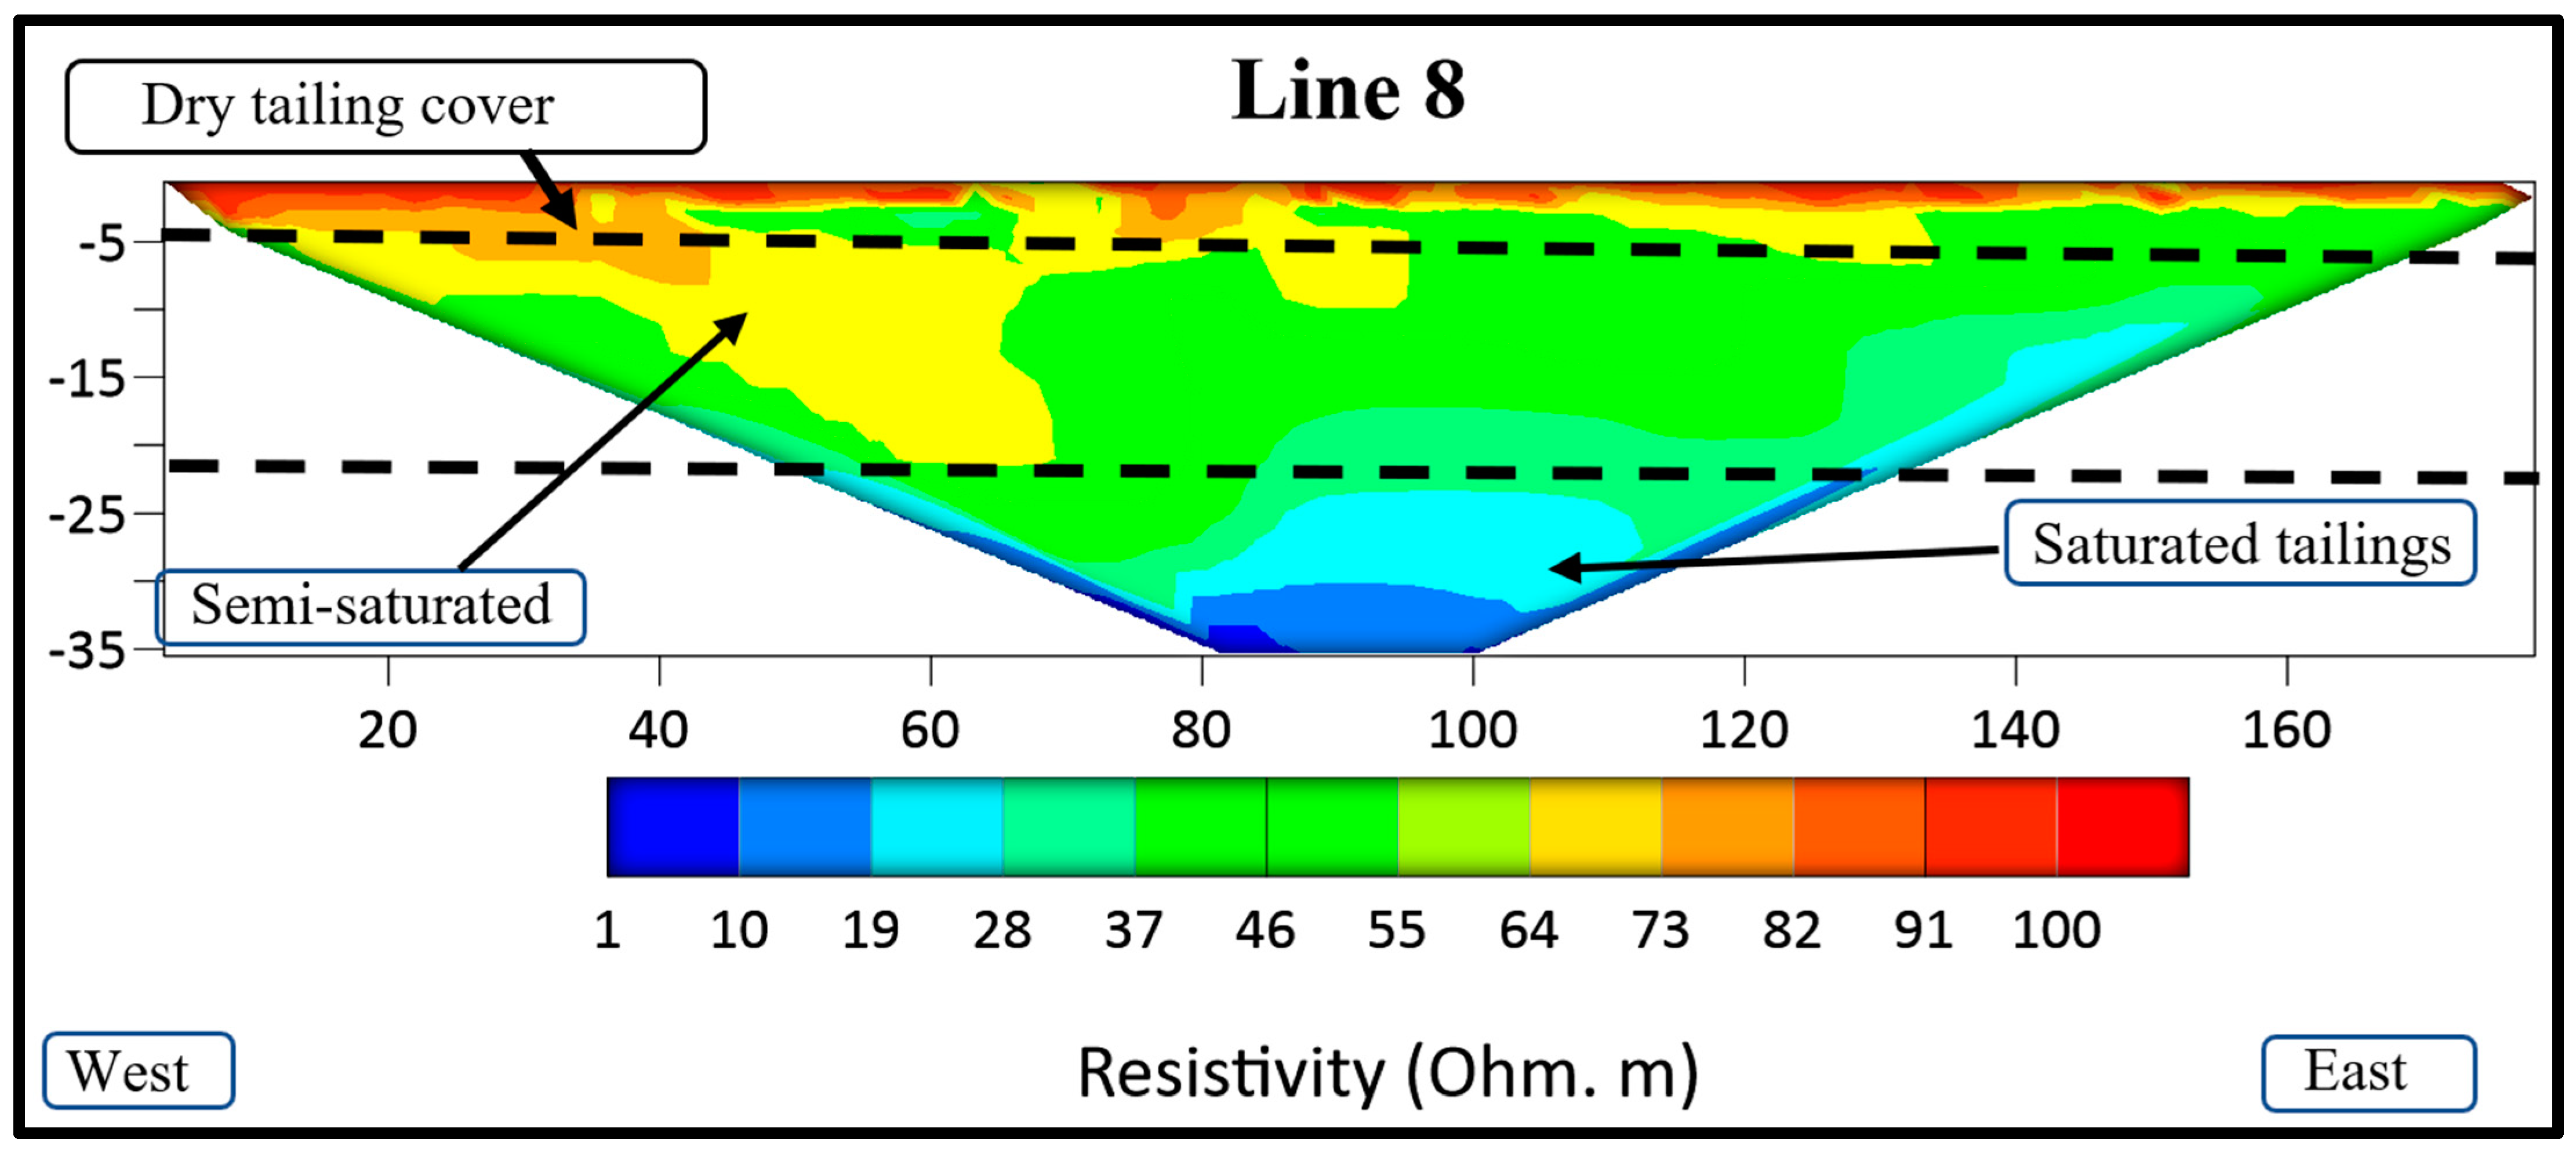
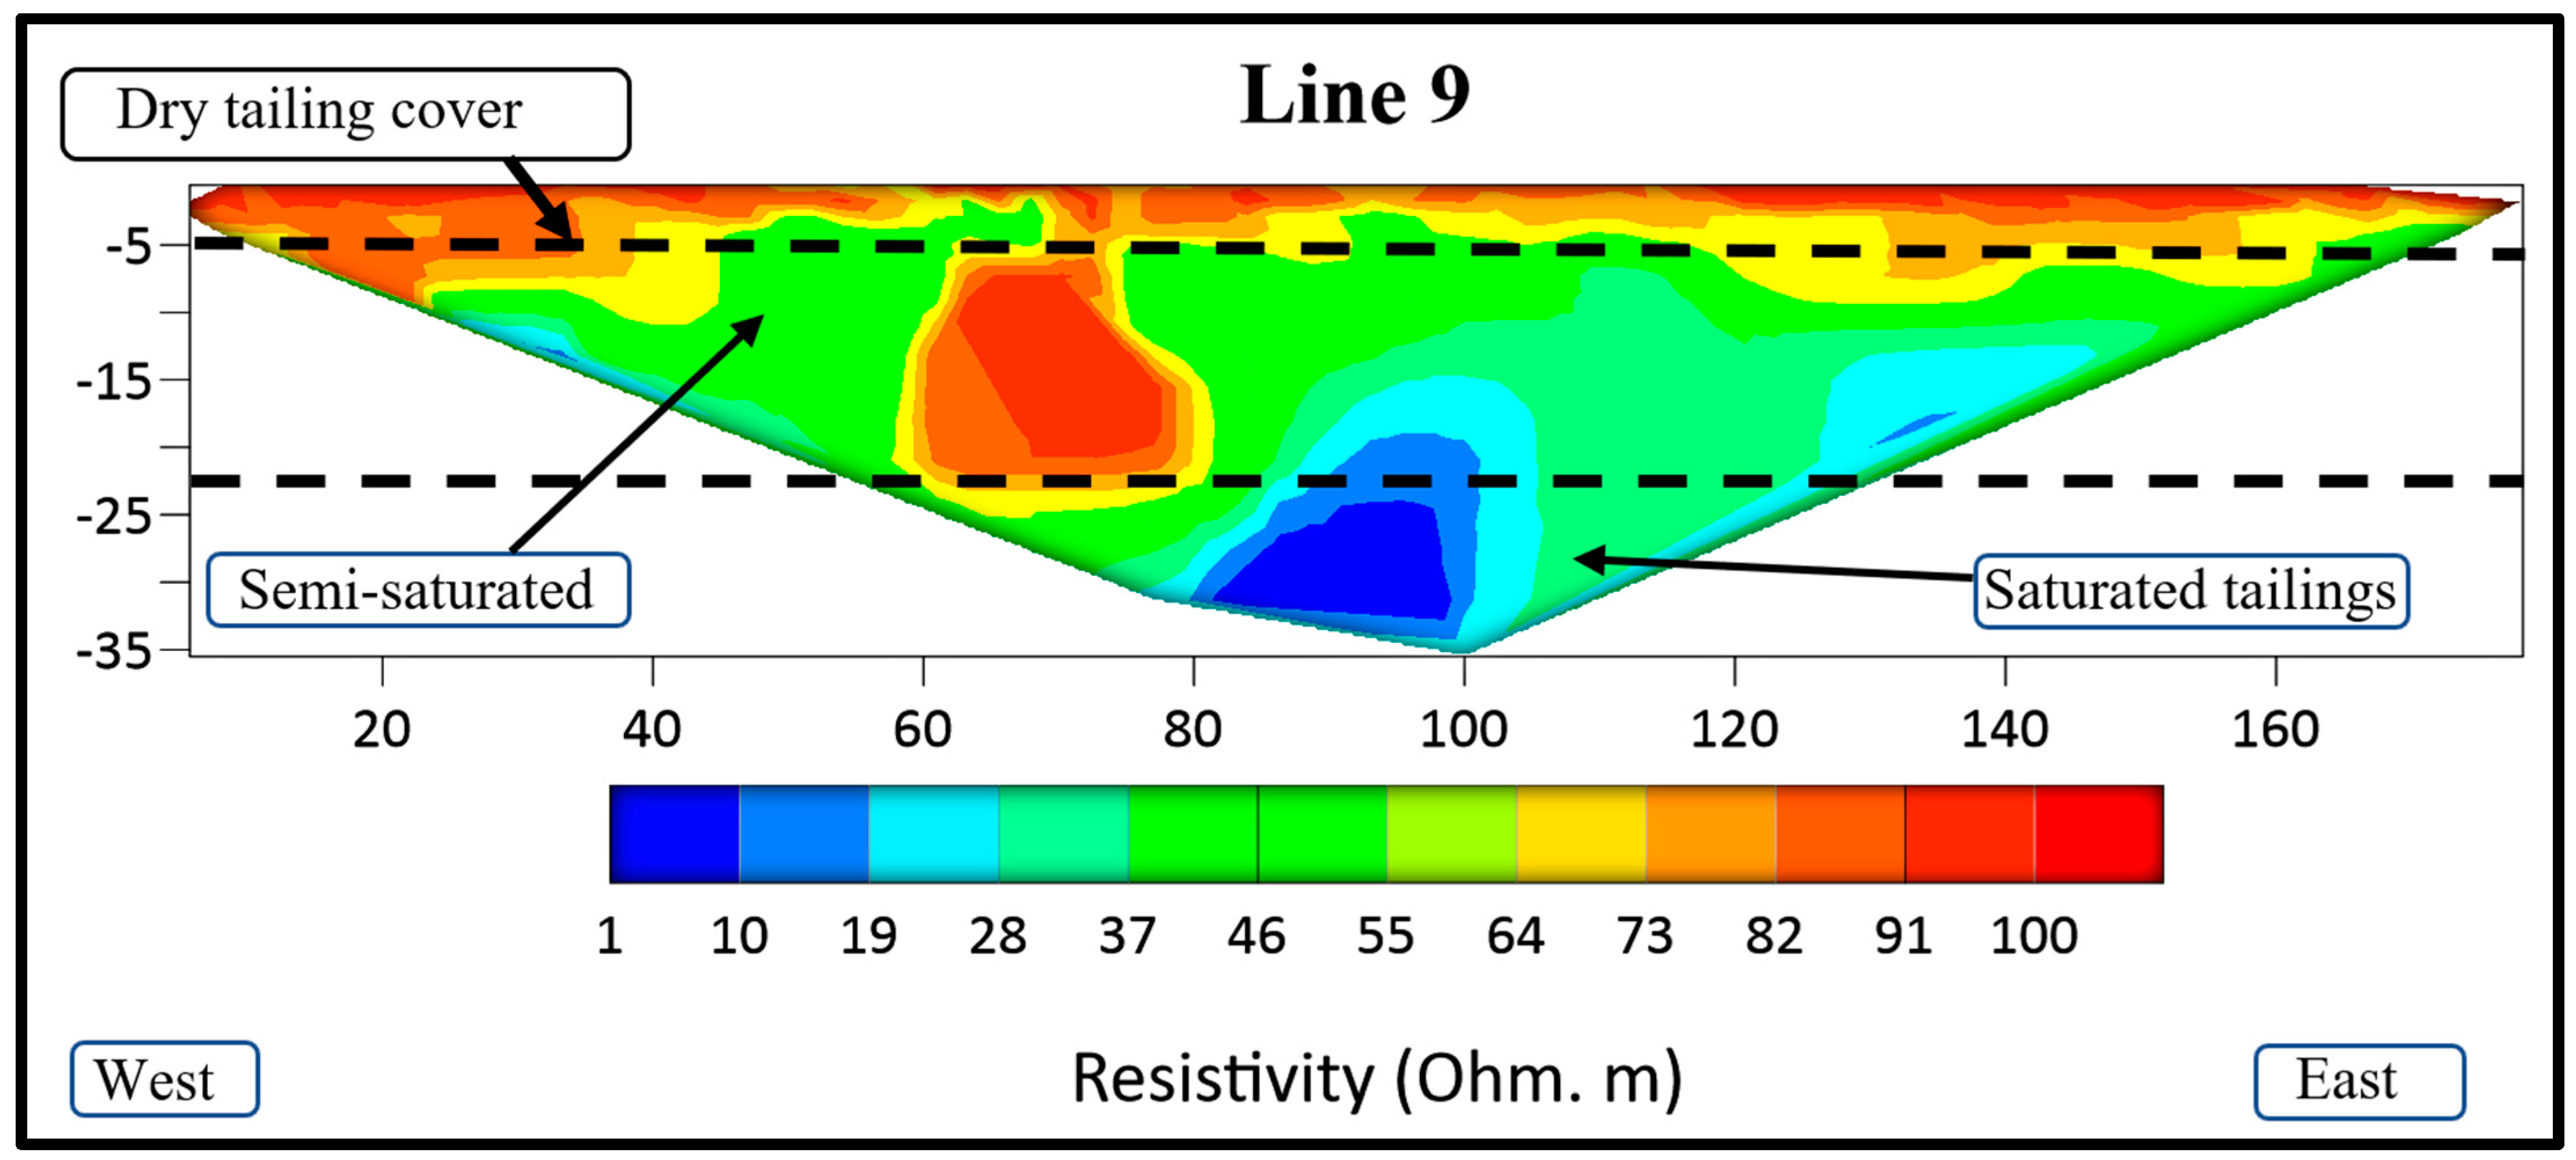
| Geoelectric Layer | Resistivity (Ohm.m) | Thickness (m) |
|---|---|---|
| Top (A) | >60 | ~3–10 |
| Middle (B) | >30:60 | ~10–20 |
| Bottom (C) | <30 | ~10–40 |
Disclaimer/Publisher’s Note: The statements, opinions and data contained in all publications are solely those of the individual author(s) and contributor(s) and not of MDPI and/or the editor(s). MDPI and/or the editor(s) disclaim responsibility for any injury to people or property resulting from any ideas, methods, instructions or products referred to in the content. |
© 2023 by the authors. Licensee MDPI, Basel, Switzerland. This article is an open access article distributed under the terms and conditions of the Creative Commons Attribution (CC BY) license (https://creativecommons.org/licenses/by/4.0/).
Share and Cite
Ali, M.A.H.; Mewafy, F.M.; Qian, W.; Alshehri, F.; Almadani, S.; Aldawsri, M.; Aloufi, M.; Saleem, H.A. Mapping Leachate Pathways in Aging Mining Tailings Pond Using Electrical Resistivity Tomography. Minerals 2023, 13, 1437. https://doi.org/10.3390/min13111437
Ali MAH, Mewafy FM, Qian W, Alshehri F, Almadani S, Aldawsri M, Aloufi M, Saleem HA. Mapping Leachate Pathways in Aging Mining Tailings Pond Using Electrical Resistivity Tomography. Minerals. 2023; 13(11):1437. https://doi.org/10.3390/min13111437
Chicago/Turabian StyleAli, Mosaad Ali Hussein, Farag M. Mewafy, Wei Qian, Fahad Alshehri, Sattam Almadani, Mofleh Aldawsri, Majed Aloufi, and Hussein A. Saleem. 2023. "Mapping Leachate Pathways in Aging Mining Tailings Pond Using Electrical Resistivity Tomography" Minerals 13, no. 11: 1437. https://doi.org/10.3390/min13111437