Article

Through the Looking Glass: Technological Characterization of Roman Glasses Mimicking Precious Stones from the Gorga Collection (Museo Nazionale Romano—Palazzo Altemps)

1
Departament de Geologia, Universitat Autònoma de Barcelona (UAB), Edifici C, 08193 Cerdanyola del Vallès, Spain
2
Dipartimento di Geoscienze, Università Degli Studi di Padova, via G. Gradenigo 6, 35131 Padova, Italy
3
Departamento de Electrocerámica, Instituto de Cerámica y Vidrio (CSIC), 28049 Madrid, Spain
4
ALBA Synchrotron Light Source, 08290 Cerdanyola del Vallès, Spain
5
Department of Geosciences, Institut of Environmental Assessment and Water Research, Consejo Superior de Investigaciones Científicas (IDAEA-CSIC), Jordi Girona 18-26, 08034 Barcelona, Spain
6
Institut de Ciència de Materials de Barcelona (ICMAB-CSIC), Campus de la UAB, 08193 Bellaterra, Spain
7
Museo Nazionale Romano, Palazzo Altemps, via di S. Apollinare 8, 00186 Rome, Italy
8
Museo Nazionale Romano, Terme di Diocleziano, Viale Enrico de Nicola 78, 00185 Rome, Italy
*
Author to whom correspondence should be addressed.
Minerals 2023, 13(11), 1421; https://doi.org/10.3390/min13111421
Submission received: 17 September 2023 / Revised: 12 October 2023 / Accepted: 2 November 2023 / Published: 8 November 2023
(This article belongs to the Special Issue Colours in Minerals and Rocks, Volume II)

Abstract

:
This paper provides a detailed technological characterization of the Roman opus sectile glasses (second century AD) coming from the renowned Gorga collection. Nine glass samples corresponding to imitations of the porfido verde antico, cipollino rosso, rosso antico, giallo antico, diaspro nero e giallo, semesanto and agate/alabaster stones were studied. The aim of this study was twofold: (i) archaeometric, i.e., to provide valuable data on the production, raw materials and techniques of these refined Roman glasses that mimic precious stones and (ii) methodological, i.e., to highlight the good performance of combining polished thin sections and local probe measurements for the study of glassy microstructures. Based on the nature of the flux used, the glasses from the samples were classified as either natron-type or mixed-type (natron/plant ash). The latter stem from remelted glasses and contain relict grains of wollastonite that were not found in the pure natron samples. Relict wollastonite crystals appear to be a proficient petrographic marker to spot recycled glasses along with the commonly used chemical fingerprints. Different production and colouring techniques were identified, even for a given type of imitated stone. Metallic Cu, Ca antimonates and Pb-Fe antimonates were the three opacifiers used for the opaque glasses. Based on the crystal morphologies, metallic Cu and Ca antimoniates were possibly synthesized in situ simultaneously with the glass, whilst the Pb-Fe antimonates were prepared ex situ. The working temperatures for these glasses were estimated within the 900–1100 °C range based on the presence and known thermal stability of some identified crystal phases.

Graphical Abstract

1. Introduction

The Roman glasses from the Gorga collection are excellent examples to illustrate intermaterial deception–illusion phenomena. Intermaterial phenomena include a great variety of relations and dependencies [1,2,3,4]. In a nutshell, there are three main ways in which materials can interact: the material interaction, the material transfer and the material interference [5]. In the first case, different materials enter into dialogue but remain separate from one another in their different materialities (e.g., a combination of different materials in sculpture). A second way of interaction can be named the mode of deception–illusion because it is based on the function transfer from one material to another. Finally, in the third type of interaction, materials overlap, intermingle and change into something completely new with a different aesthetic [5]. Intermaterial phenomena are persistent throughout history, and they become prevalent between the Late Republic and the Early Empire Period when they end by involving all the genres of material culture. The Roman expansion into the East resulted in a significant interest in Greek culture and architectural, sculptural and exotic objects became goods of cultural exchange. Starting from the Augustan Era onwards, a new triumph of arts and handicrafts occurred and, at the same time, a consumer revolution that fostered the emergence of new genres whilst existing genres were re-innovated. In this context, glass is an excellent material for the analysis of intermaterial phenomena. During the reign of August, glass became a widespread component of tableware and decorations on furniture and walls, in competition with other materials [6]. The important role played by glass is quite understandable, as it was easier to work compared with stone due to its pliability; it was readily available from glass workshops, avoiding the complications of high extraction and transportation costs of exotic materials; and it achieved a broader range of commercialization. The use of glass allowed for the production of a wide range of coloured materials, also taking advantage of its intrinsic qualities, among them the potentiality to create the illusion of depth or to produce a surface finish with a greater shininess compared with polished rocks. Non-porous, odourless, and apt to store liquids and food, glass quickly overtook pottery, becoming the most popular material for drinking vessels [7,8].
Glasses that mimic stones are widely documented by classical authors (Pliny, NH XXXVI, 197–198) as revetments in the shape of panels or crustae producing visual geometric or figurative compositions. The material evidence supports the writing sources. Glass fragments imitating an Egyptian dark purple-red porphyry (porfido rosso antico) are hosted at the Corning Museum of Glass [9] and they were also found in the archaeological site of Kechries (Greece) [10]. Other glass fragments, hosted at The Toledo Museum of Art (Toledo, OH, USA), are imitations of a Greek dark green serpentine (porfido verde antico) [11], while those from the Roman Colonia Celsa (Spain) imitate a Greek impure marble (cipollino verde) [8]. Masterpieces in glass imitating different precious stones are held in the Gorga collection [12] at the Museo Nazionale Romano—Palazzo Altemps (Rome, Italy). The main purpose of the present study was to characterize, from a technological point of view, monochrome and polychrome opus sectile glass pieces from the Gorga collection [13] that replicate expensive and rare stones. The Gorga collection constitutes a unique heritage ensemble in the world (more than 150.000 glass pieces) collected by the famous Italian tenor Evan Gorga (1865–1957) between the end of the 19th century and the first decades of the 20th century. This massive collection activity soon went beyond the boundaries of a normal passion, and it accompanied the famous tenor throughout his life, extending to all kinds of finds, ancient and modern (Figure 1). Many objects collected by E. Gorga were derived from leading Roman antiquarians. However, most of the collection arose from the contemporary excavations in Rome and outside the capital in central and southern Italy [14]. In 1949, because of financial problems, Gorga was forced to sell his collection to the Italian Government, which committed to pay him a modest annuity, establish and maintain ten scholarships associated with his name, and organize the most important finds of the collection and exhibit them to the public [15,16].
The most substantial nucleus of the Gorga collection is represented by the glasses of the first and middle Roman imperial age, which provide an extremely varied picture of the techniques, shapes, colours and multiplicity of uses that Romans allocated to this material.
Some previous archaeometric studies on the Gorga glasses were undertaken [17,18,19,20], including one on monochrome and polychrome glass tesserae replicating precious marbles and rare stones [20]. However, this previous work on similar glassy imitations was solely based on non-invasive chemical analytical methods.
In this article, we took a step forward in the study of such imitations: for the first time, the Museo Nazionale Romano has granted permission to slice small bits of some samples of these Roman glasses that mimic precious stones from the Gorga Collection. The destructive sample preparation was carried out with the goal to provide valuable insights into the composition, mineral inclusions, structure, temperatures and production techniques of these fascinating glass sectilia. To achieve the archaeometric and technological characterization of these glasses with an unprecedented level of detail, we opted for a singular methodological approach based on the use of polished thin sections (~30 µm thickness) as the support for both petrographic inspection and analyses using different local probe techniques. With very few exceptions [21], glass fragments are usually prepared and analyzed as polished blocks (thick sections). As we already pointed out for ceramic glazes [22], in the domain of glass studies, the petrographic approach based on polished thin sections also remains essentially unexplored. Nonetheless, there are several advantages of a combined petrographic and analytical study of thin-section samples. Optical images using thin sections are better than SEM images, as glass is opaque to electrons and different glassy layers that appear almost identical in SEM images can be easily distinguished in optical images. Furthermore, images in plane-polarized light (PPL) taken in transmission light (TL) are also more useful than those taken in reflected light (RL), where the latter is the only option for polished blocks. In fact, crystals that are under the polished surface of the sample remain unnoticed when using reflected light and their morphologies can be misunderstood based on the appearance of their sections. Apart from the mentioned advantages, the use of the polished thin section in the study of glassy microstructures enables a straightforward correlation between the analysis produced by the different techniques. This is because the measurements can be done on the very same crystals viewed under the petrographic microscope and the different visualization systems of the employed analytical techniques. In recent years, the advantages of combining analyses of thin section samples have been illustrated and discussed in different papers, including materials like mummies, bones, hairs, ceramic glazes and wood [23,24,25,26,27,28]. We are conscious that the complexity of preparing a good polished thin section compared with a polished block can hinder its introduction as a standard approach in glass studies. However, the combination of petrographic and analytical studies of thin-section samples offers an exhaustive picture of the glassy microstructures, unveiling details that may remain unperceived using other approaches. Hence, even if such an approach is more difficult to implement, it still deserves to be considered.

2. Materials and Methods

2.1. Sampled Materials

A selection of nine opus sectile glass pieces (Figure 2 and Table 1) from the Gorga collection and assigned to the villa of Emperor Lucius Verus (161–169 AD) [29] was analyzed. The villa, located at the fifth milestone on the Via Clodia/Cassia in Rome, comprised a large number of rooms decorated with monochrome and polychrome glass pieces (sectilia) that would have amazed guests with a whirlwind of colours and images [30,31]. The nine glasses replicate precious and rare stones (see pictures in Figure S1, most of them from [32]), seven are mainly two-coloured and two are basically monochrome:
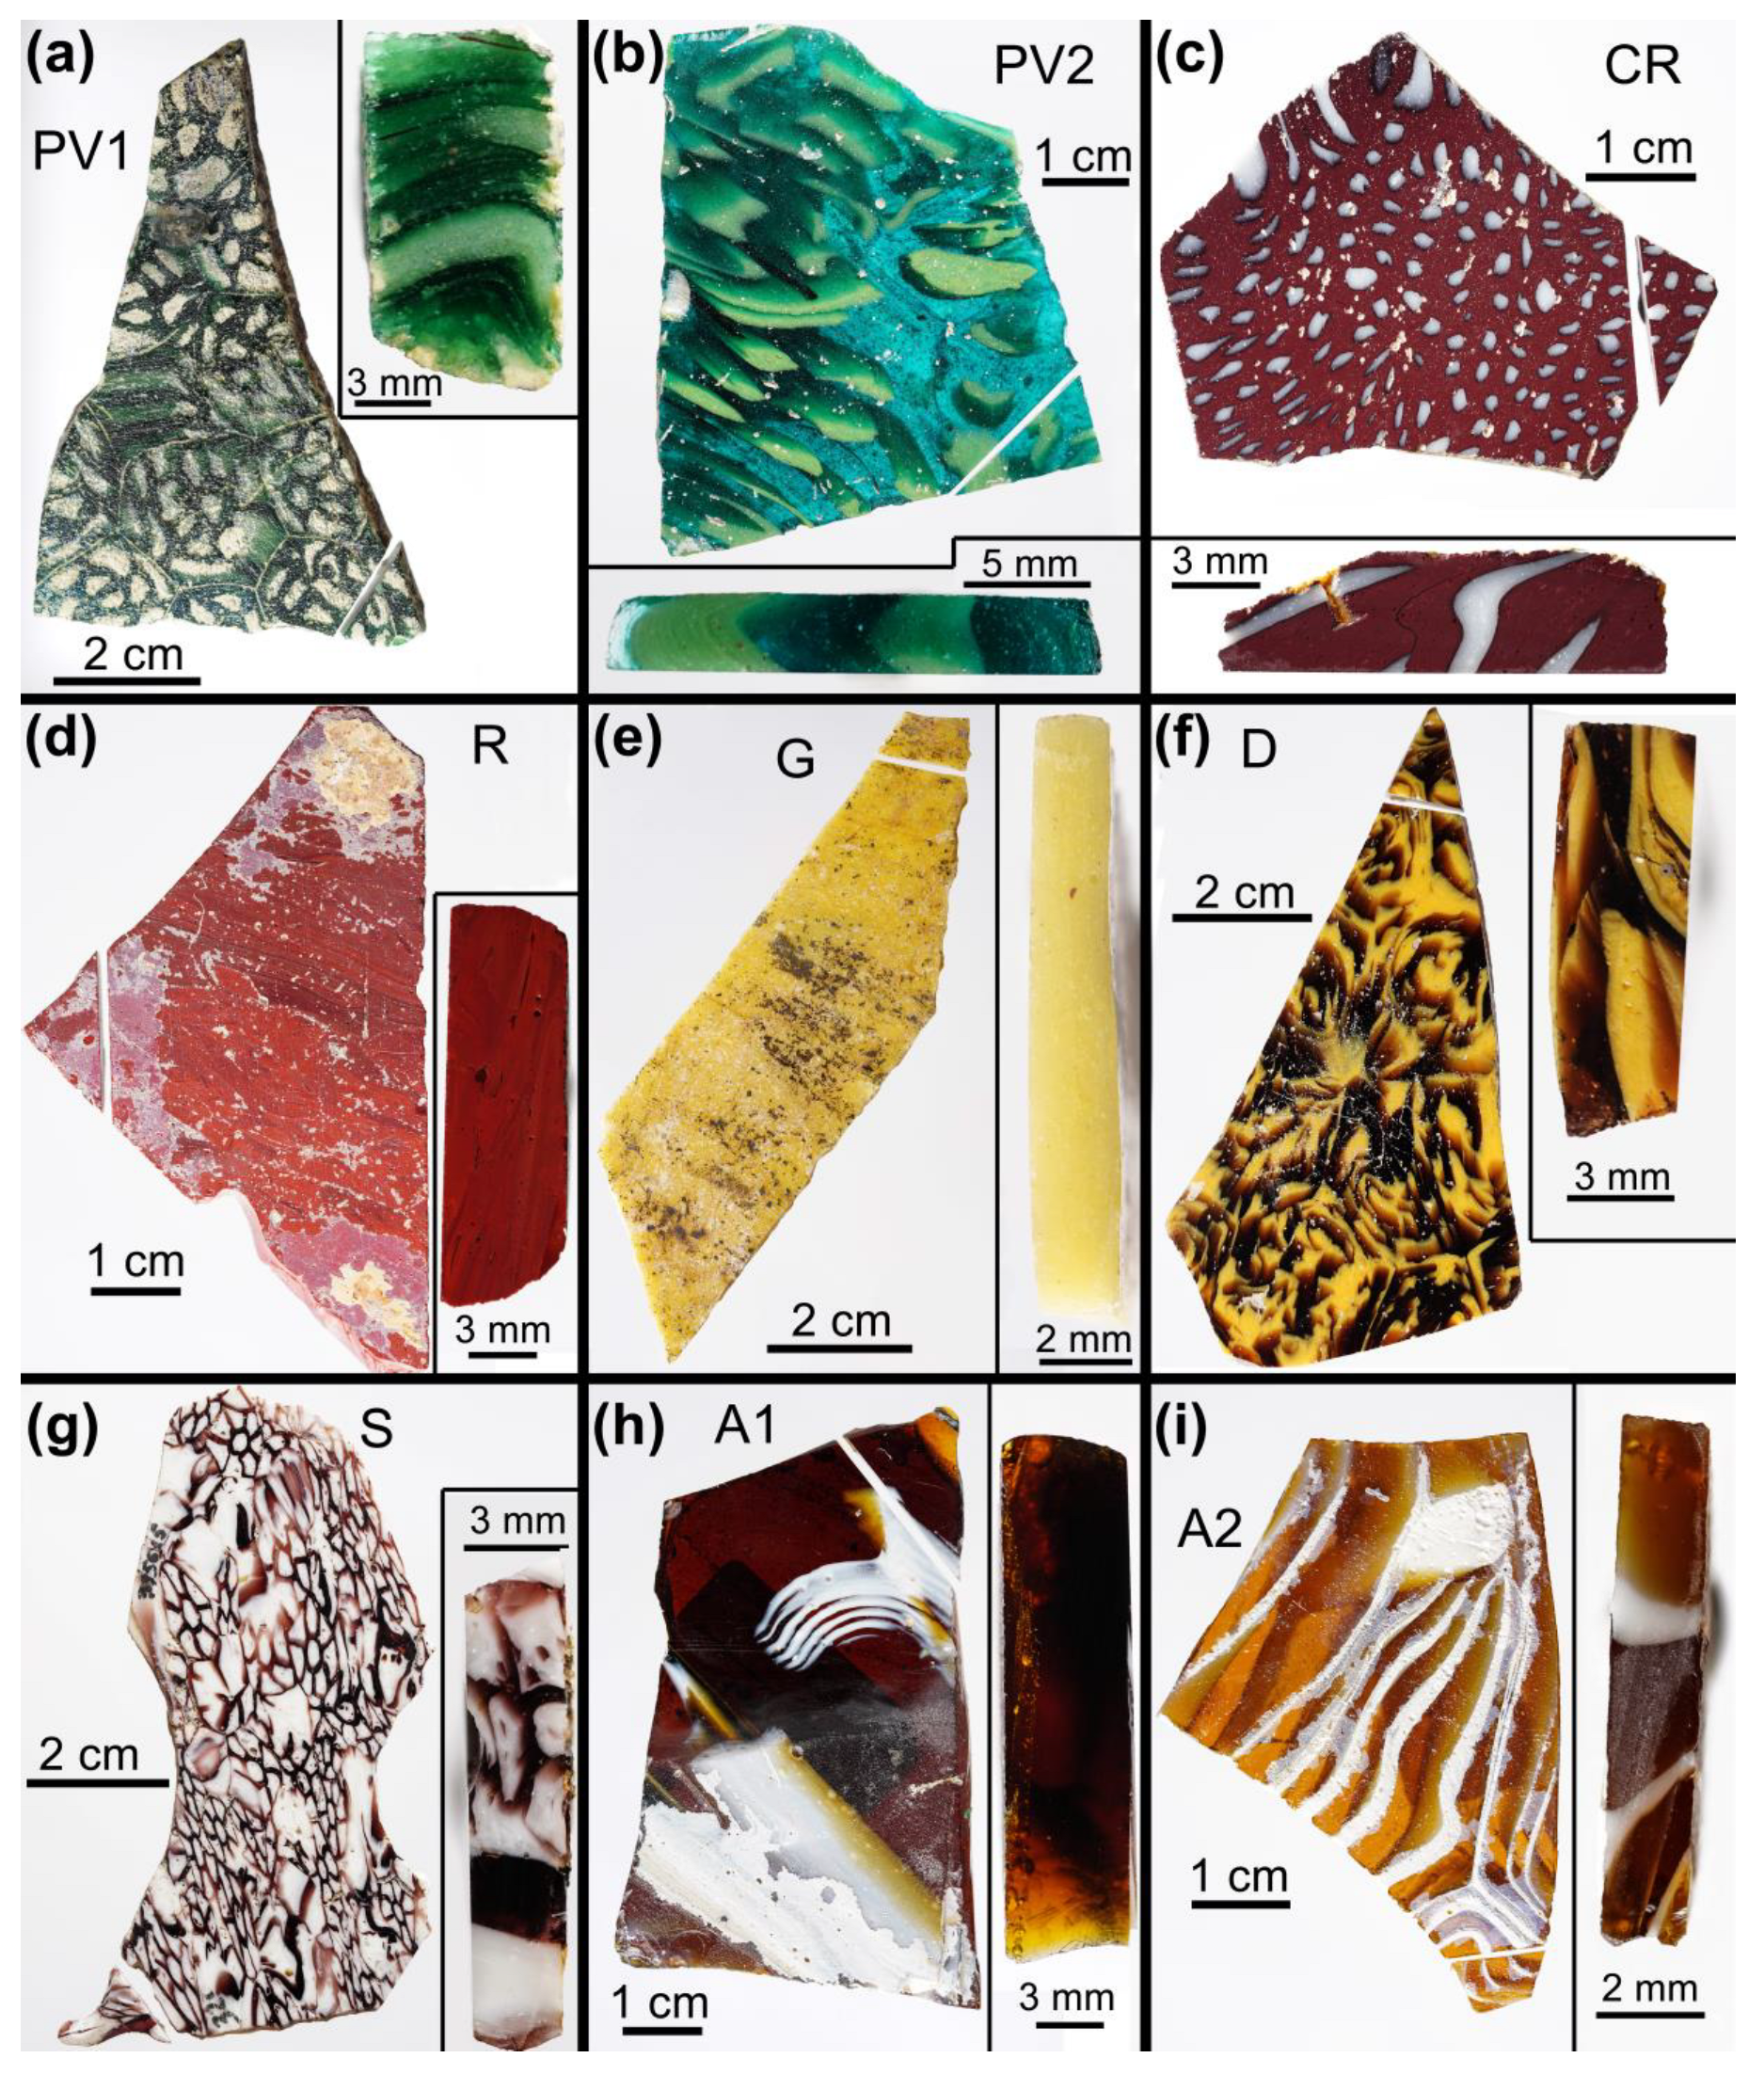
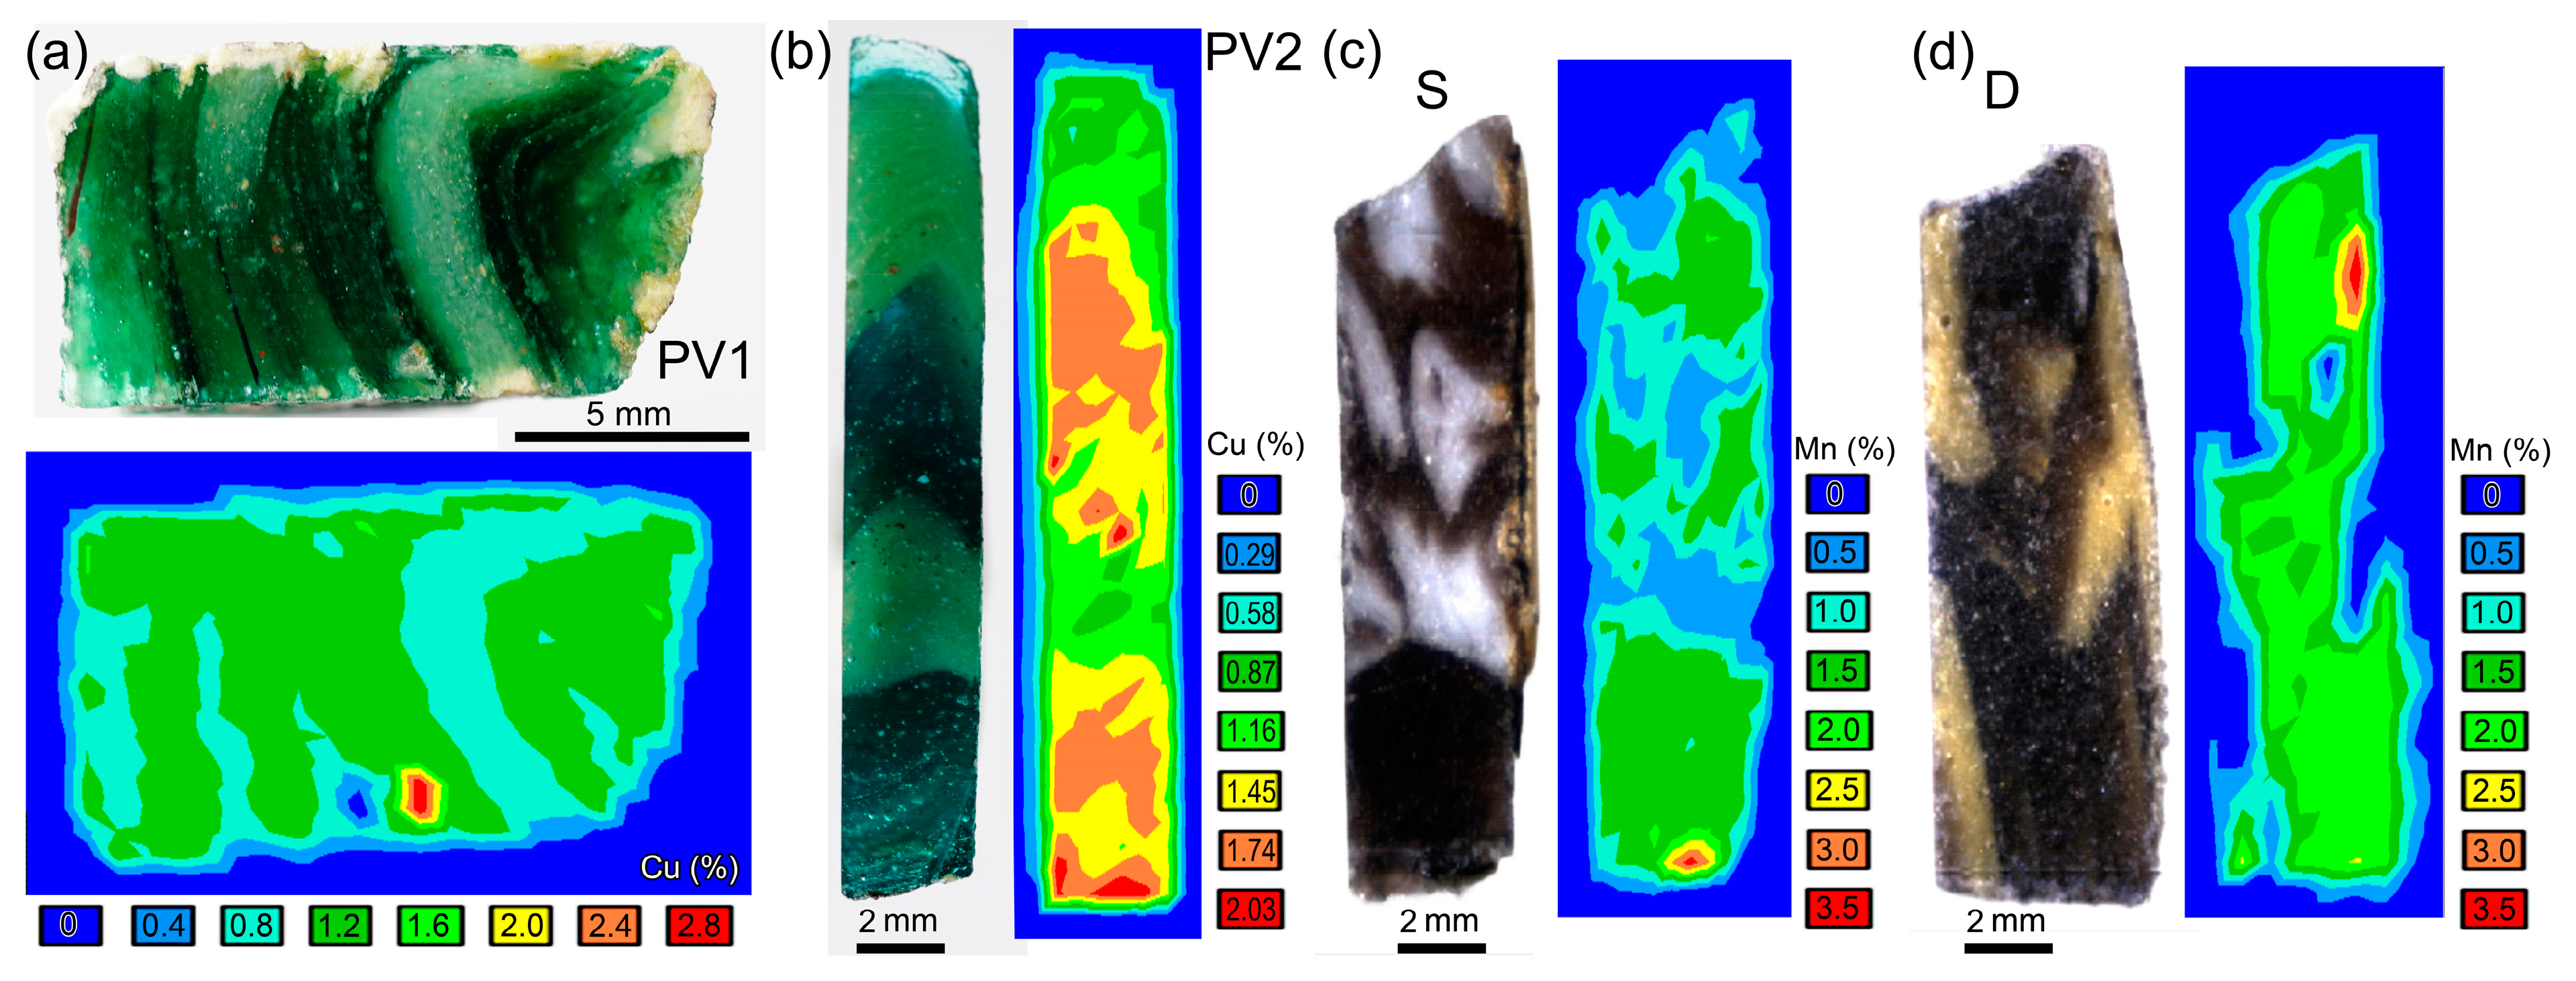
  • Samples PV1 (Figure 2a) and PV2 (Figure 2b) reproduce two varieties of the porfido verde antico (lapis lacedaemonius), which is a porphyritic volcanic rock (Figure S1a) quarried in Laconia (Greece). The original stone shows prismatic, square, acicular or irregular light green, whitish, yellowish or violet phenocrystals of plagioclase embedded in a dark green crypto-crystalline groundmass [33]. Macroscopically, sample PV1 (Figure 2a) exhibits a translucent dark green background embedding multiple opaque light green deformed canes, and these lighter areas appear chipped (perhaps intentionally), leaving whitish cavities. On the other hand, sample PV2 (Figure 2b) shows a translucent green matrix with turquoise hues embedding opaque greenish-yellow strips.
  • Sample CR (Figure 2c) imitates the cipollino rosso (marmor iassense or marmor carium), which is a Turkish red hematitic marble (Figure S1b) quarried near the ancient Iasos (Caria, now Kiyikişlacik). Three varieties of this marble are known: uniformly red, veined (white/white-grey and greenish veins) and brecciated (whitish clasts in a red matrix) [34]. Sample CR faithfully mimics the brecciated variety with an opaque red matrix embedding opaque white deformed canes.
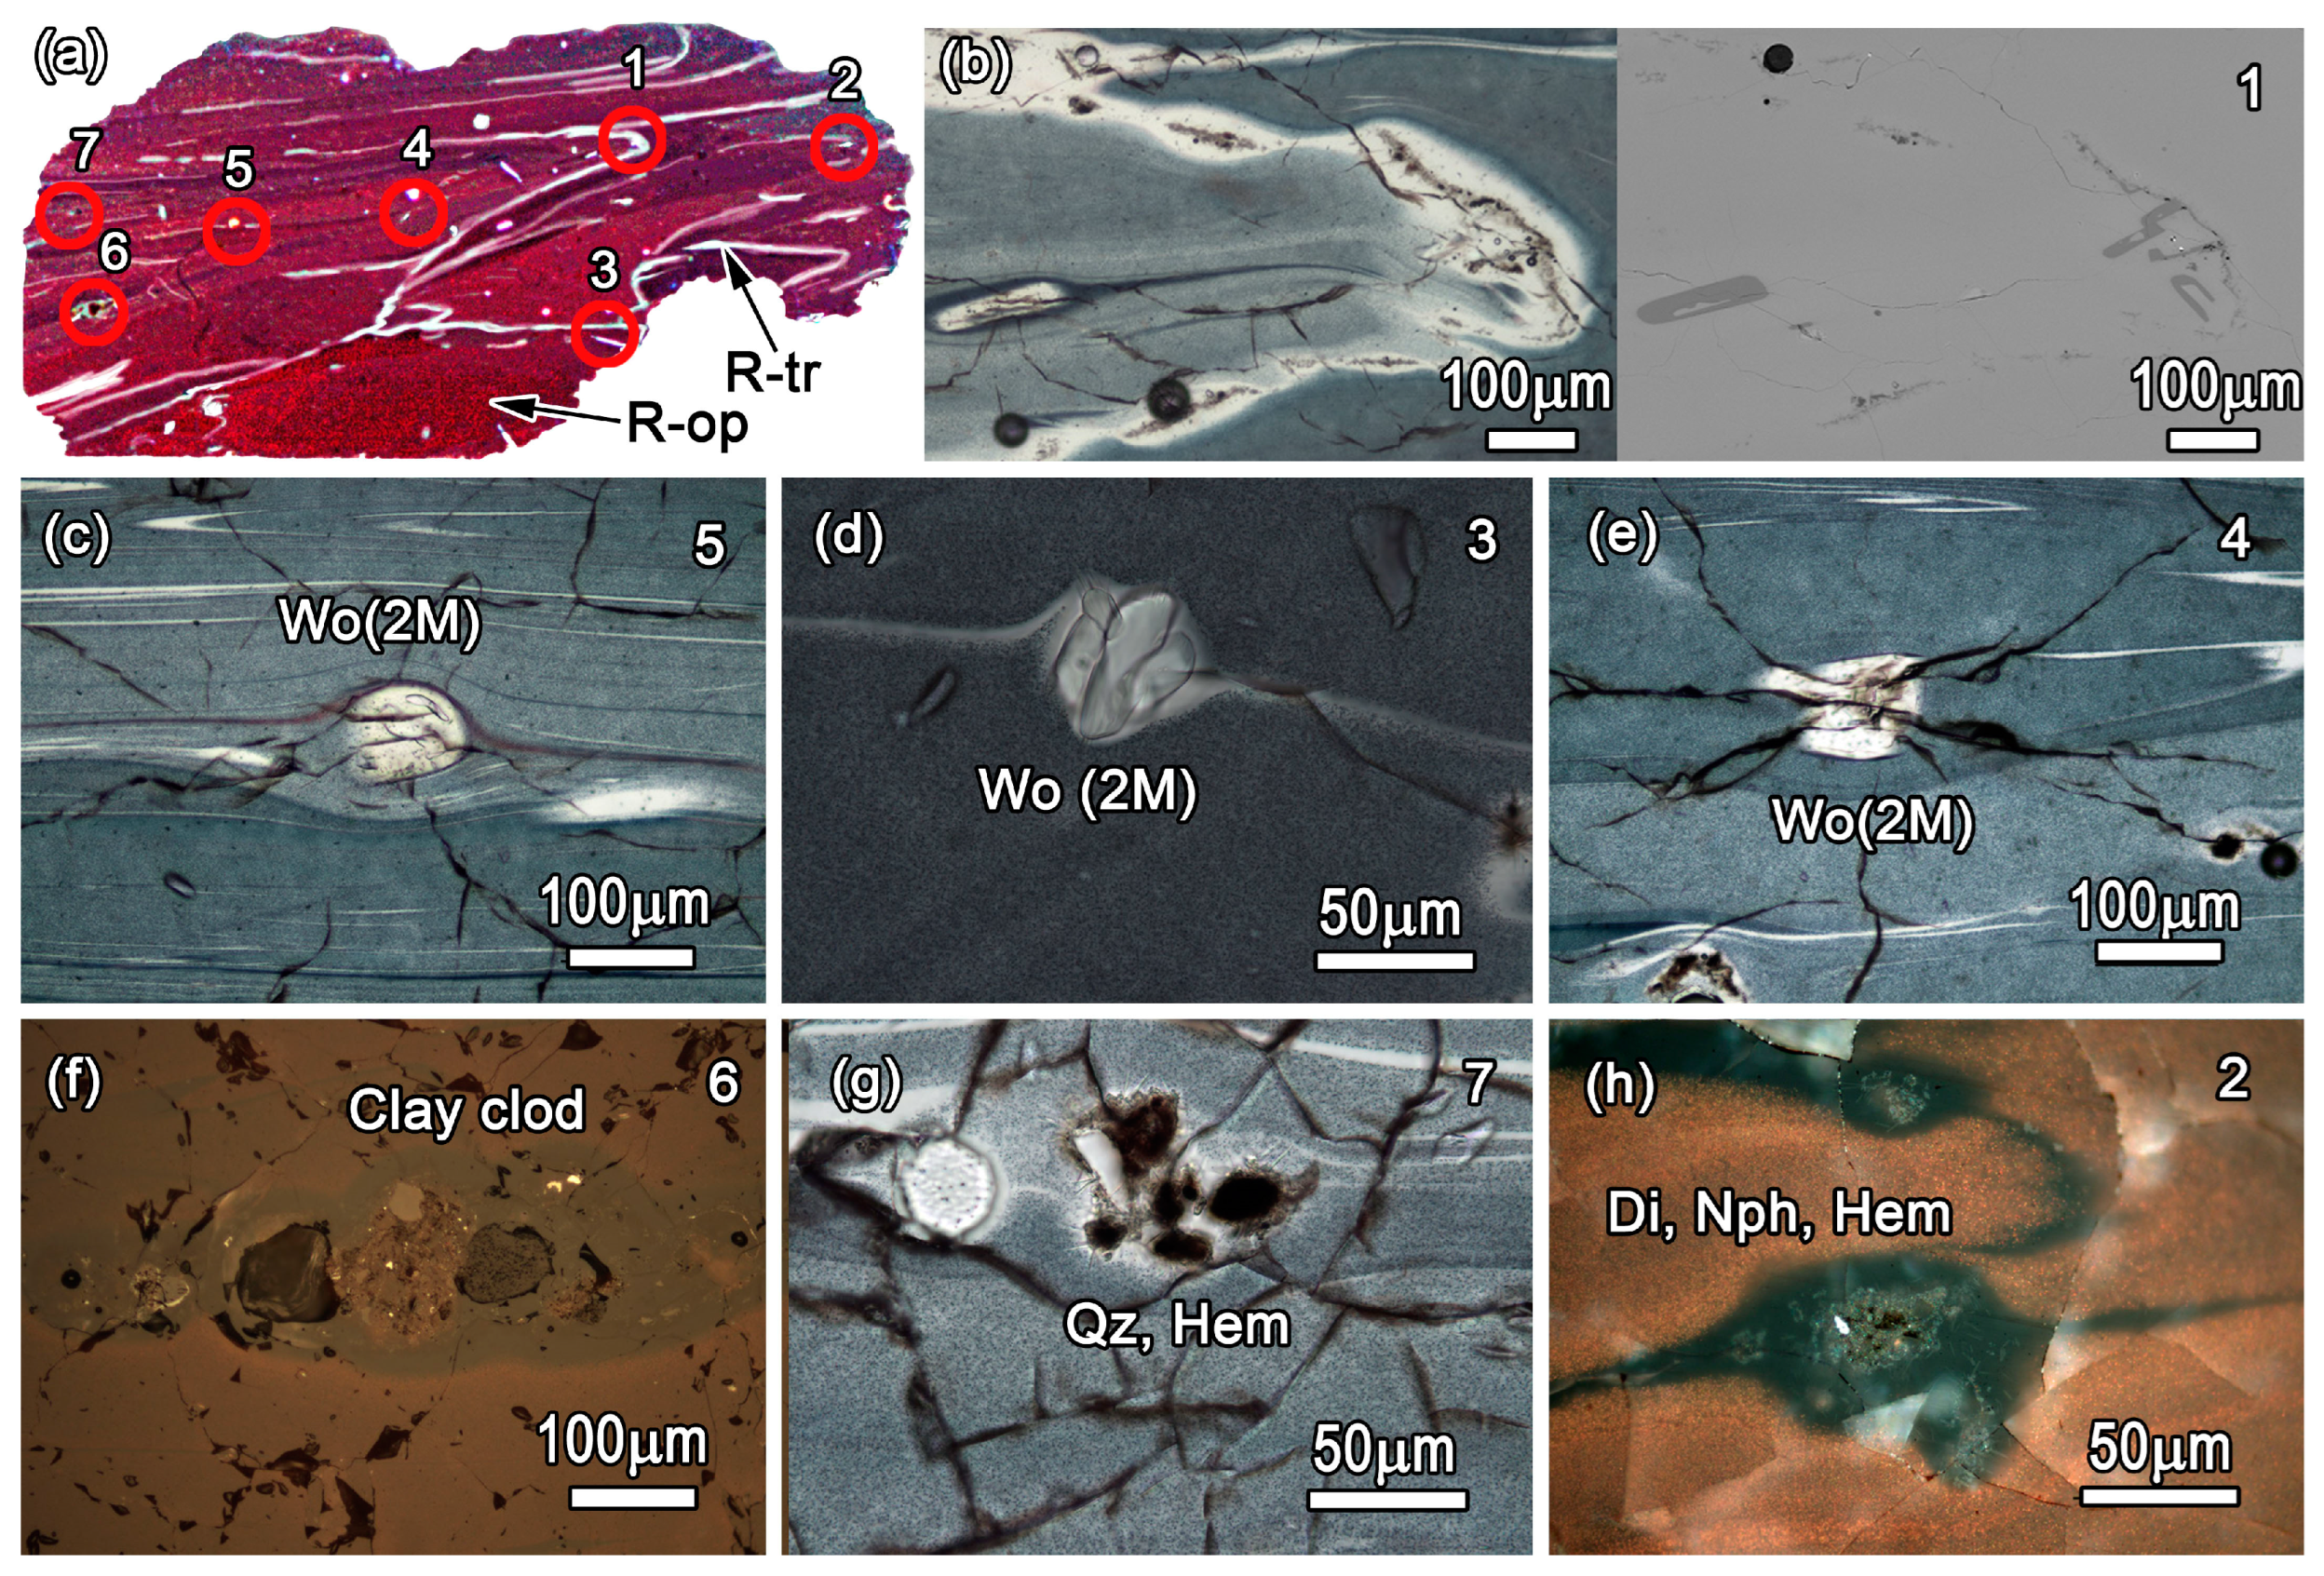
  • Sample R (Figure 2d) resembles the rosso antico (marmor taenarium), which is an impure, very fine red marble (Figure S1d) coloured by the presence of hematite. It is a foliated marble but macroscopically often shows a rather homogeneous red colouration. It was quarried in Cape Mapatan and many other localities of the Mani peninsula (Greece) [33]. The corresponding glass imitation is basically monochrome, exhibiting a veined opaque red matrix, including various red hues. However, relatively thin dark veins are also present.
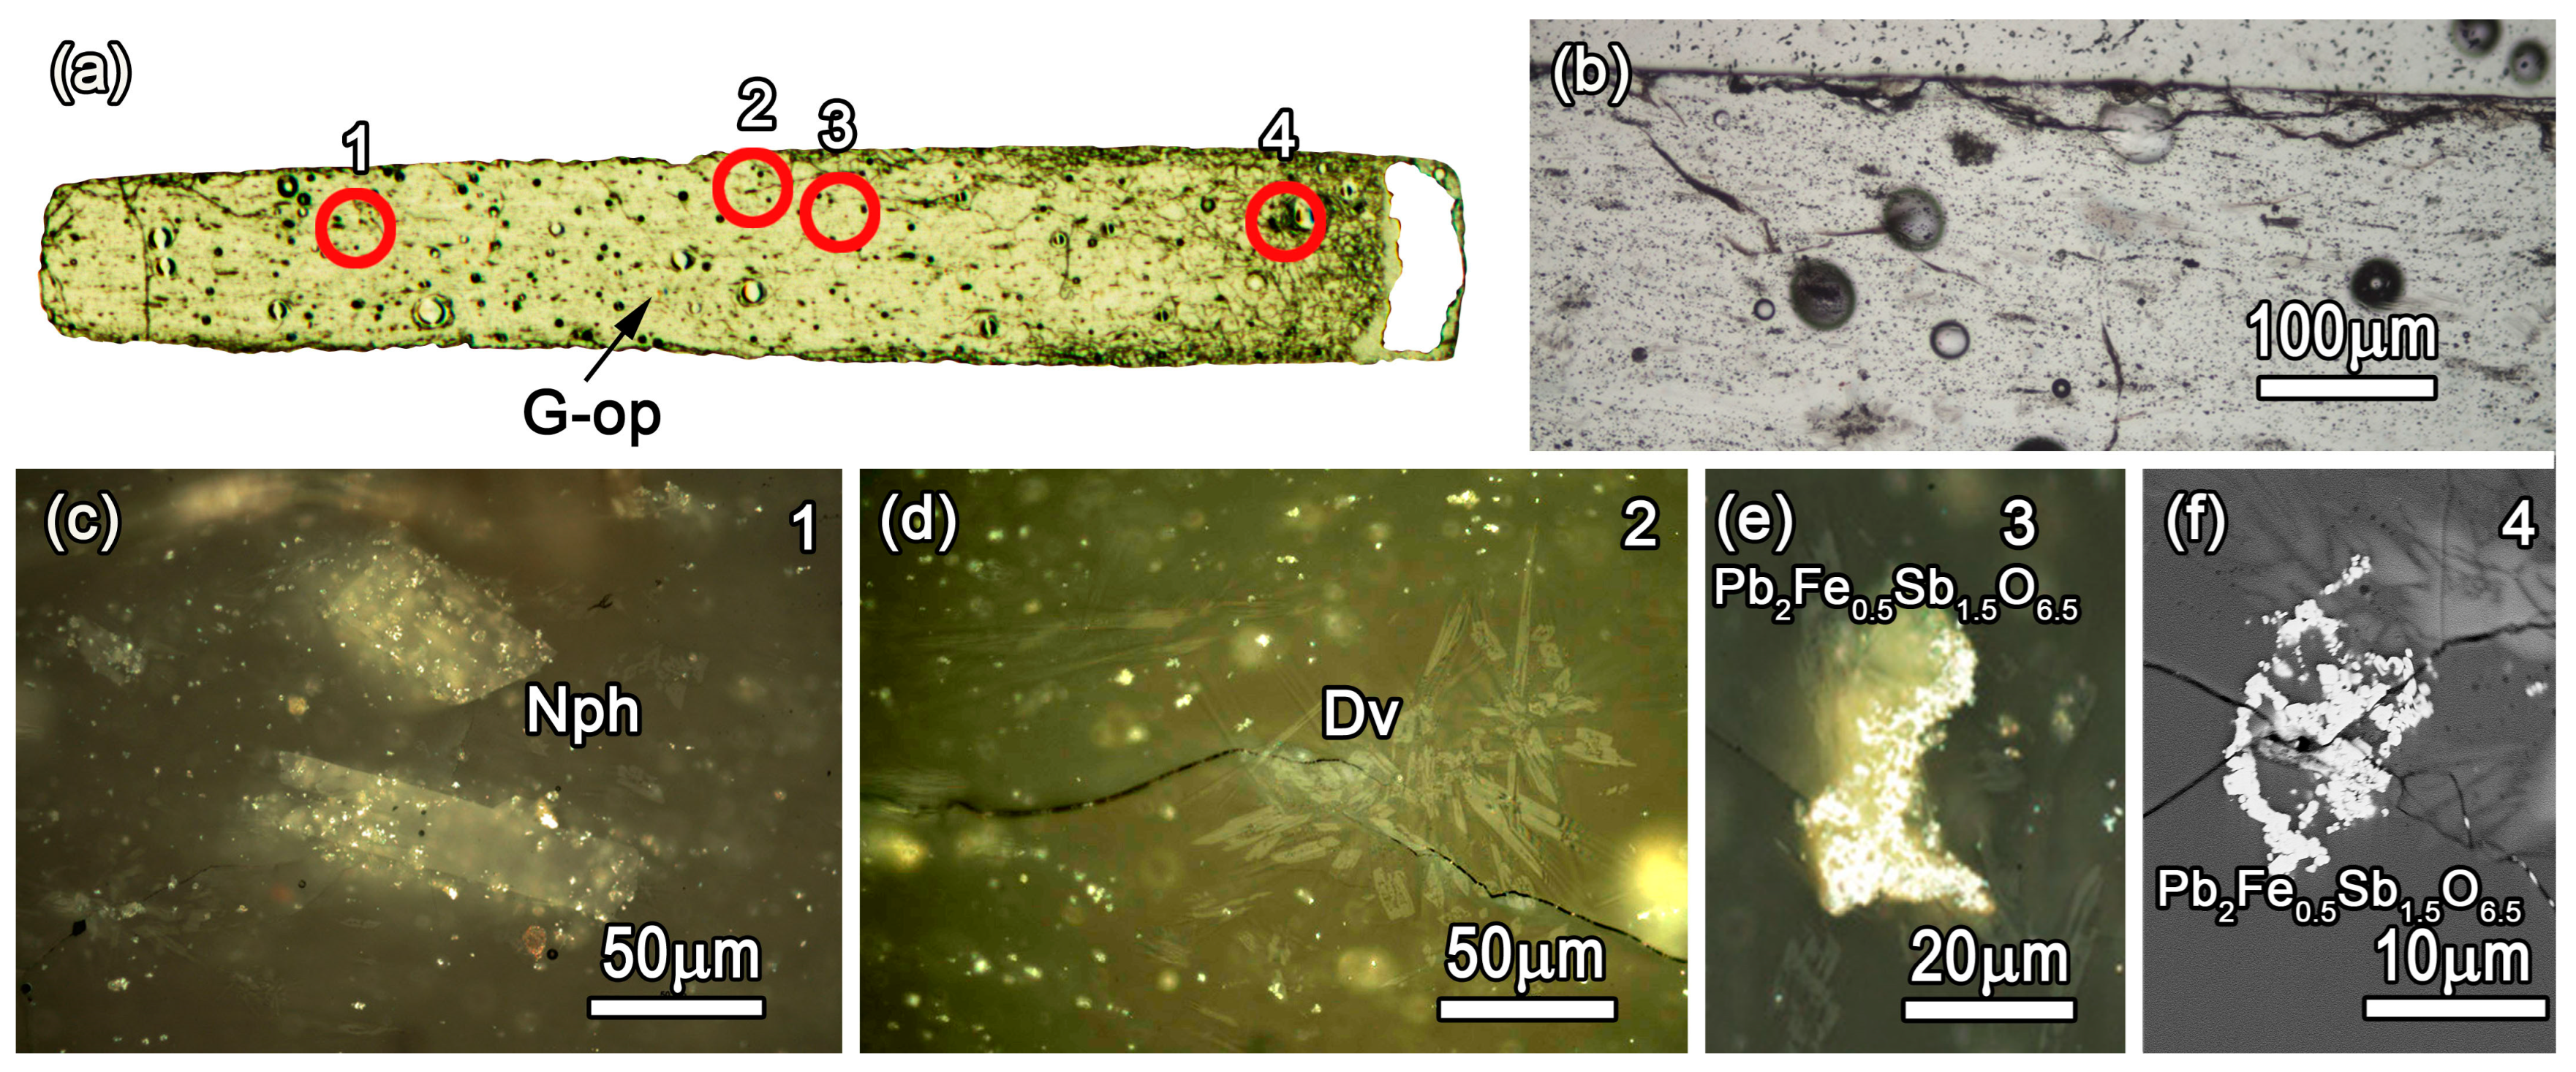
  • Sample G (Figure 2e) looks like the giallo antico (marmor numidicum), which is a compact yellow or light-yellow microcrystalline limestone (Figure S1c), sometimes with red or brown veins. The brecciated variety was also very common. The corresponding quarries were situated in the hills near the ancient town of Simitthus (now Chemtou, in Tunisia), and from 27 BCE, they turned into an imperial estate. It was one of the most expensive stones (200 denarii per cubic foot) in Diocletian’s Edict of maximum prices [35]. Macroscopically, the glass imitation is markedly monochrome, consisting of an opaque yellow matrix with only brown speckles that appear to be superficial.
  • Sample D (Figure 2f) resembles the diaspro nero e giallo, which is a rare stone of unknown provenance. Characteristically it has greenish, greyish and black decorative patterns on a yellow background [35]. The imitation in glass displays fused intermixed translucent brown/opaque yellow canes.
  • Sample S (Figure 2g) reproduces the appearance of the Semesanto (Figure S1e), which is a variety of a deformed breccia marble (marmor scyreticum) quarried on the island of Skyros (Greece), typically with a smaller (millimetric) clast size compared with the most common variety. In this particular variety, the clasts exhibit sharp edges and appear elongated, collectively defining a foliation. They often consist of white/milky-white calcitic marble fragments, but occasionally other light-coloured clasts appear. The colour of the clasts contrast with the hematitic dark red/purple cement [33]. To the naked eye, the corresponding glass imitation shows a reticular pattern made by fusing cylindrical units of eight bichrome canes (a central cane contoured by seven canes). Every bichrome cane consists of an opaque white centre and a dark surface. The deformation by flattening the fused murrines accurately reproduces the texture of the original semesanto stone.
  • Samples A1 (Figure 2h) and A2 (Figure 2i) could be imitations of relatively common agate (Figure S1g) or alabaster (Figure S1f) stones [36]. Agate is a banded variety of chalcedony, which is a cryptocrystalline form of quartz, whilst alabaster is a banded stalagmitic limestone. The imitations in glass of these stones allowed for creating many different chromatic arrangements, such as repeating lines, shapes and colours. Sample A1 exhibits a translucent brown background with decorative opaque white, amber and deep brown motives, whilst sample A2 shows opaque white veins in a translucent amber matrix.

2.2. Characterization Methods

Samples were cut and prepared in the form of polished thin sections (~30 µm thickness) at the Geology Department of the University of Padua (Italy) and studied according to the methodology established by Di Febo et al. [22]. As a first step, thin-section petrography (TSP) was used to examine the samples to spot the presence of different translucent/transparent and opaque areas to be characterized chemically, and in a second step, a more detailed inspection was performed to select crystalline inclusions for subsequent microanalyses. A Nikon Eclipse Me600 microscope (Nikon Corporation, Tokyo, Japan) at the Universitat Autònoma de Barcelona (UAB) was used to carry out observations in both transmitted plane-polarized light (TL-PPL) and reflected plane-polarized light (RL-PPL). Scanner images of the polished thin sections were used to help locate the general position of the crystals within the thin section during microanalyses. Chemical compositions of the glassy matrices and the crystalline phases were tested using a scanning electron microscope (SEM) equipped with an energy-dispersive X-ray spectrometer (EDS) at the Servei de Microscòpia (UAB) using a Merlin Field Emission Scanning Electron Microscope (FE-SEM) (Zeiss, Oberkochen, Germany) with an accelerating voltage of 15 kV, 1 nA beam current and an overall counting time of 60–100 s. Quantifications of the element concentrations were obtained using mineral and synthetic standards. SEM images were taken using backscattered electron and InLens detectors. Electron microprobe (EMP) analyses of both the glassy matrix and inclusions were conducted at the Centres Científics i Tecnològics at the Universitat de Barcelona (CCiTUB, UB) by employing a JXA-8230 (Jeol Ltd., Tokyo, Japan). The experimental conditions were 1 µm spot size, 15 kV, 6 nA probe current and an overall counting time of 100 s. The reliability of the chemical results was checked against the international reference standard Corning Glass B [37,38] (Table S1). The composition of the glassy matrix was, in general, obtained using a minimum of seven point microanalyses on it, avoiding inclusions, and average and standard deviations were calculated. Multivariate analysis of the compositional data was performed using available scripts from RStudio (the integrated development environment for R software), R version 4.3.0 was used.
Chemical mappings using energy-dispersive X-ray fluorescence (EDXRF) were performed using a benchtop small-spot spectrometer (XDV-SD model, Helmut Fischer GmbH, Sindelfingen, Germany) for some samples (PV1, PV2, CR, D and S) to complement the SEM and EMP data on chromophores and opacifiers. The analyses were carried out by operating the X-ray generator at a voltage of 50 kV and a current of 1 mA. All the analyses were performed in open-air conditions, which made it impossible to quantify elements lighter than calcium (Z = 20). Compositional mappings were built from a grid of individual-point 100 s analyses. Spectral data were evaluated using the WinFTM™ software (Helmut Fischer GmbH, Germany) using a fundamental parameters approach [39].
Synchrotron through-the-substrate μ-X-ray diffraction (tts-μXRD) measurements directly performed on the microcrystals of polished thin sections were undertaken at the ALBA Synchrotron (Cerdanyola del Vallès, Spain) for all the samples. A total of 80 to 120 point analyses were done for each sample. The areas of interest from the polished thin sections were selected using an on-axis visualization system and were measured using a transmission geometry with a focused beam of 15 × 15 μm2 (full width at half-maximum). The energy used was 29 keV (λ = 0.4246 Å) and the diffraction patterns were recorded with a Rayonix SX165 CCD detector (active area of 165 mm diameter, frame size 2048 × 2048 pixels, 79 μm pixel size and dynamic range 16 bit). The calibration of the sample–detector distance and beam centre (from a LaB6 sample measured in the same conditions) and the radial integration of the images were performed with the d2Dplot software [40]. Phase identification was performed using Panalytical HighscorePlus software using an integrated PDF-2 database (ICDD).
Confocal Raman microscopy (μ-Raman) measurements were performed only on opacifying crystals using an Alpha 300 RA microscope (WITec, Ulm, Germany) equipped with a Nd:YAG laser light source (532 nm) operating at 5 mW laser power at the Instituto de Cerámica y Vidrio (Madrid, Spain). Raman spectra were recorded in the spectral range of 0–1175 cm−1 by using a grating of 1800 lines per millimetre with a spectral resolution of ca. 0.02 cm−1. The microscopy setup was mounted in a piezo-driven scan platform with a 4 nm lateral and 0.5 nm vertical positioning accuracy. Raman images of different sizes were recorded in a backscattering configuration using a 100× objective with a numerical aperture of 0.95, an integration time of 1 s per pixel, and an optical resolution of approximately 300 nm in the longitudinal direction and 500 nm in the transversal direction. The microscope base was also equipped with an active vibration isolation system, which was active for 0.7–1000 Hz. The acquired spectra were analyzed by using WITec Project Plus, 2.08 Software.
To characterize the microcrystals found in a particular sample (CR) using transmission electron microscopy (TEM), a thin lamella was prepared using a focused ion beam (FIB)–scanning electron microscope (SEM) Helios 5 UX dual system (Thermo Fisher, Waltham, MA, USA) installed at the Institut Català de Nanociència i Nanotecnologia (Bellaterra, Spain). This equipment allows carrying out a controlled thinning and polishing of the sample by gradually decreasing the accelerating voltage and ionic intensity current. The initial conditions were a 30 kV accelerating voltage and a decreasing intensity from 0.26 nA to 90 pA for the thinning down steps. Settings of 5 kV and 21 pA were employed for the subsequent polishing and 1 kV and 12 pA for the final cleaning. After this process, the cross-sectional TEM specimen had an approximate thickness of 50 nm. Electron diffraction patterns were later obtained from the specimen using a JEOL 1210 TEM (Jeol Ltd., Tokyo, Japan) operating at 120 kV and equipped with a side-entry 60°/30° double-tilt GATAN 646 specimen holder available at the Institut de Ciència de Materials (Bellaterra, Spain).

3. Results

All the analyses were performed on polished thin sections; full scan images of the nine thin sections corresponding to the analyzed stone imitations can be found in Figure S2, where the different types of identified glasses are indicated. For a full chemical characterization of the nine opus sectile pieces, each glass type identified was analyzed separately, for a total of 18 analytical samples.

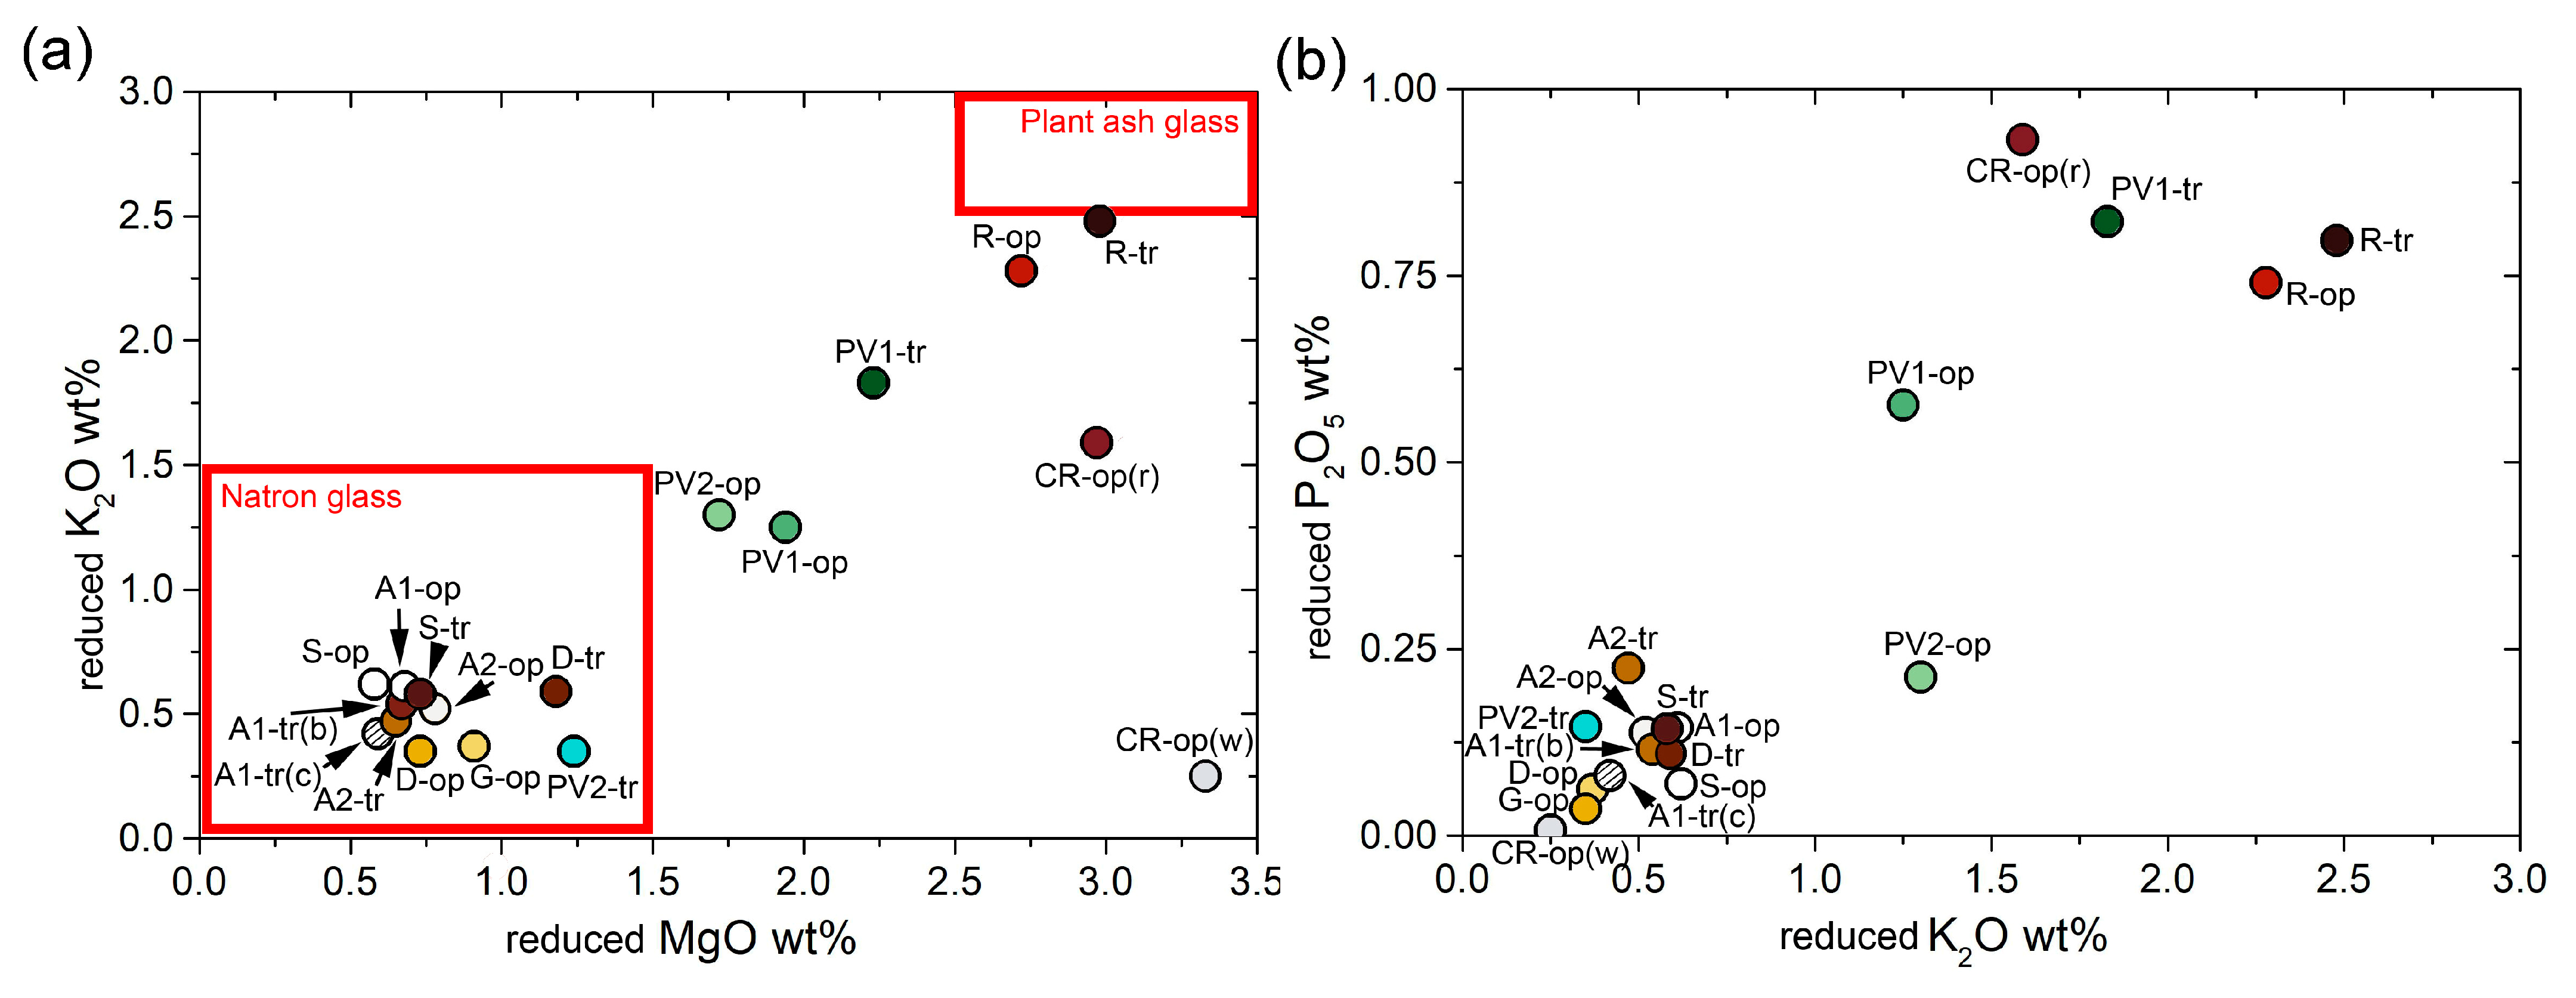
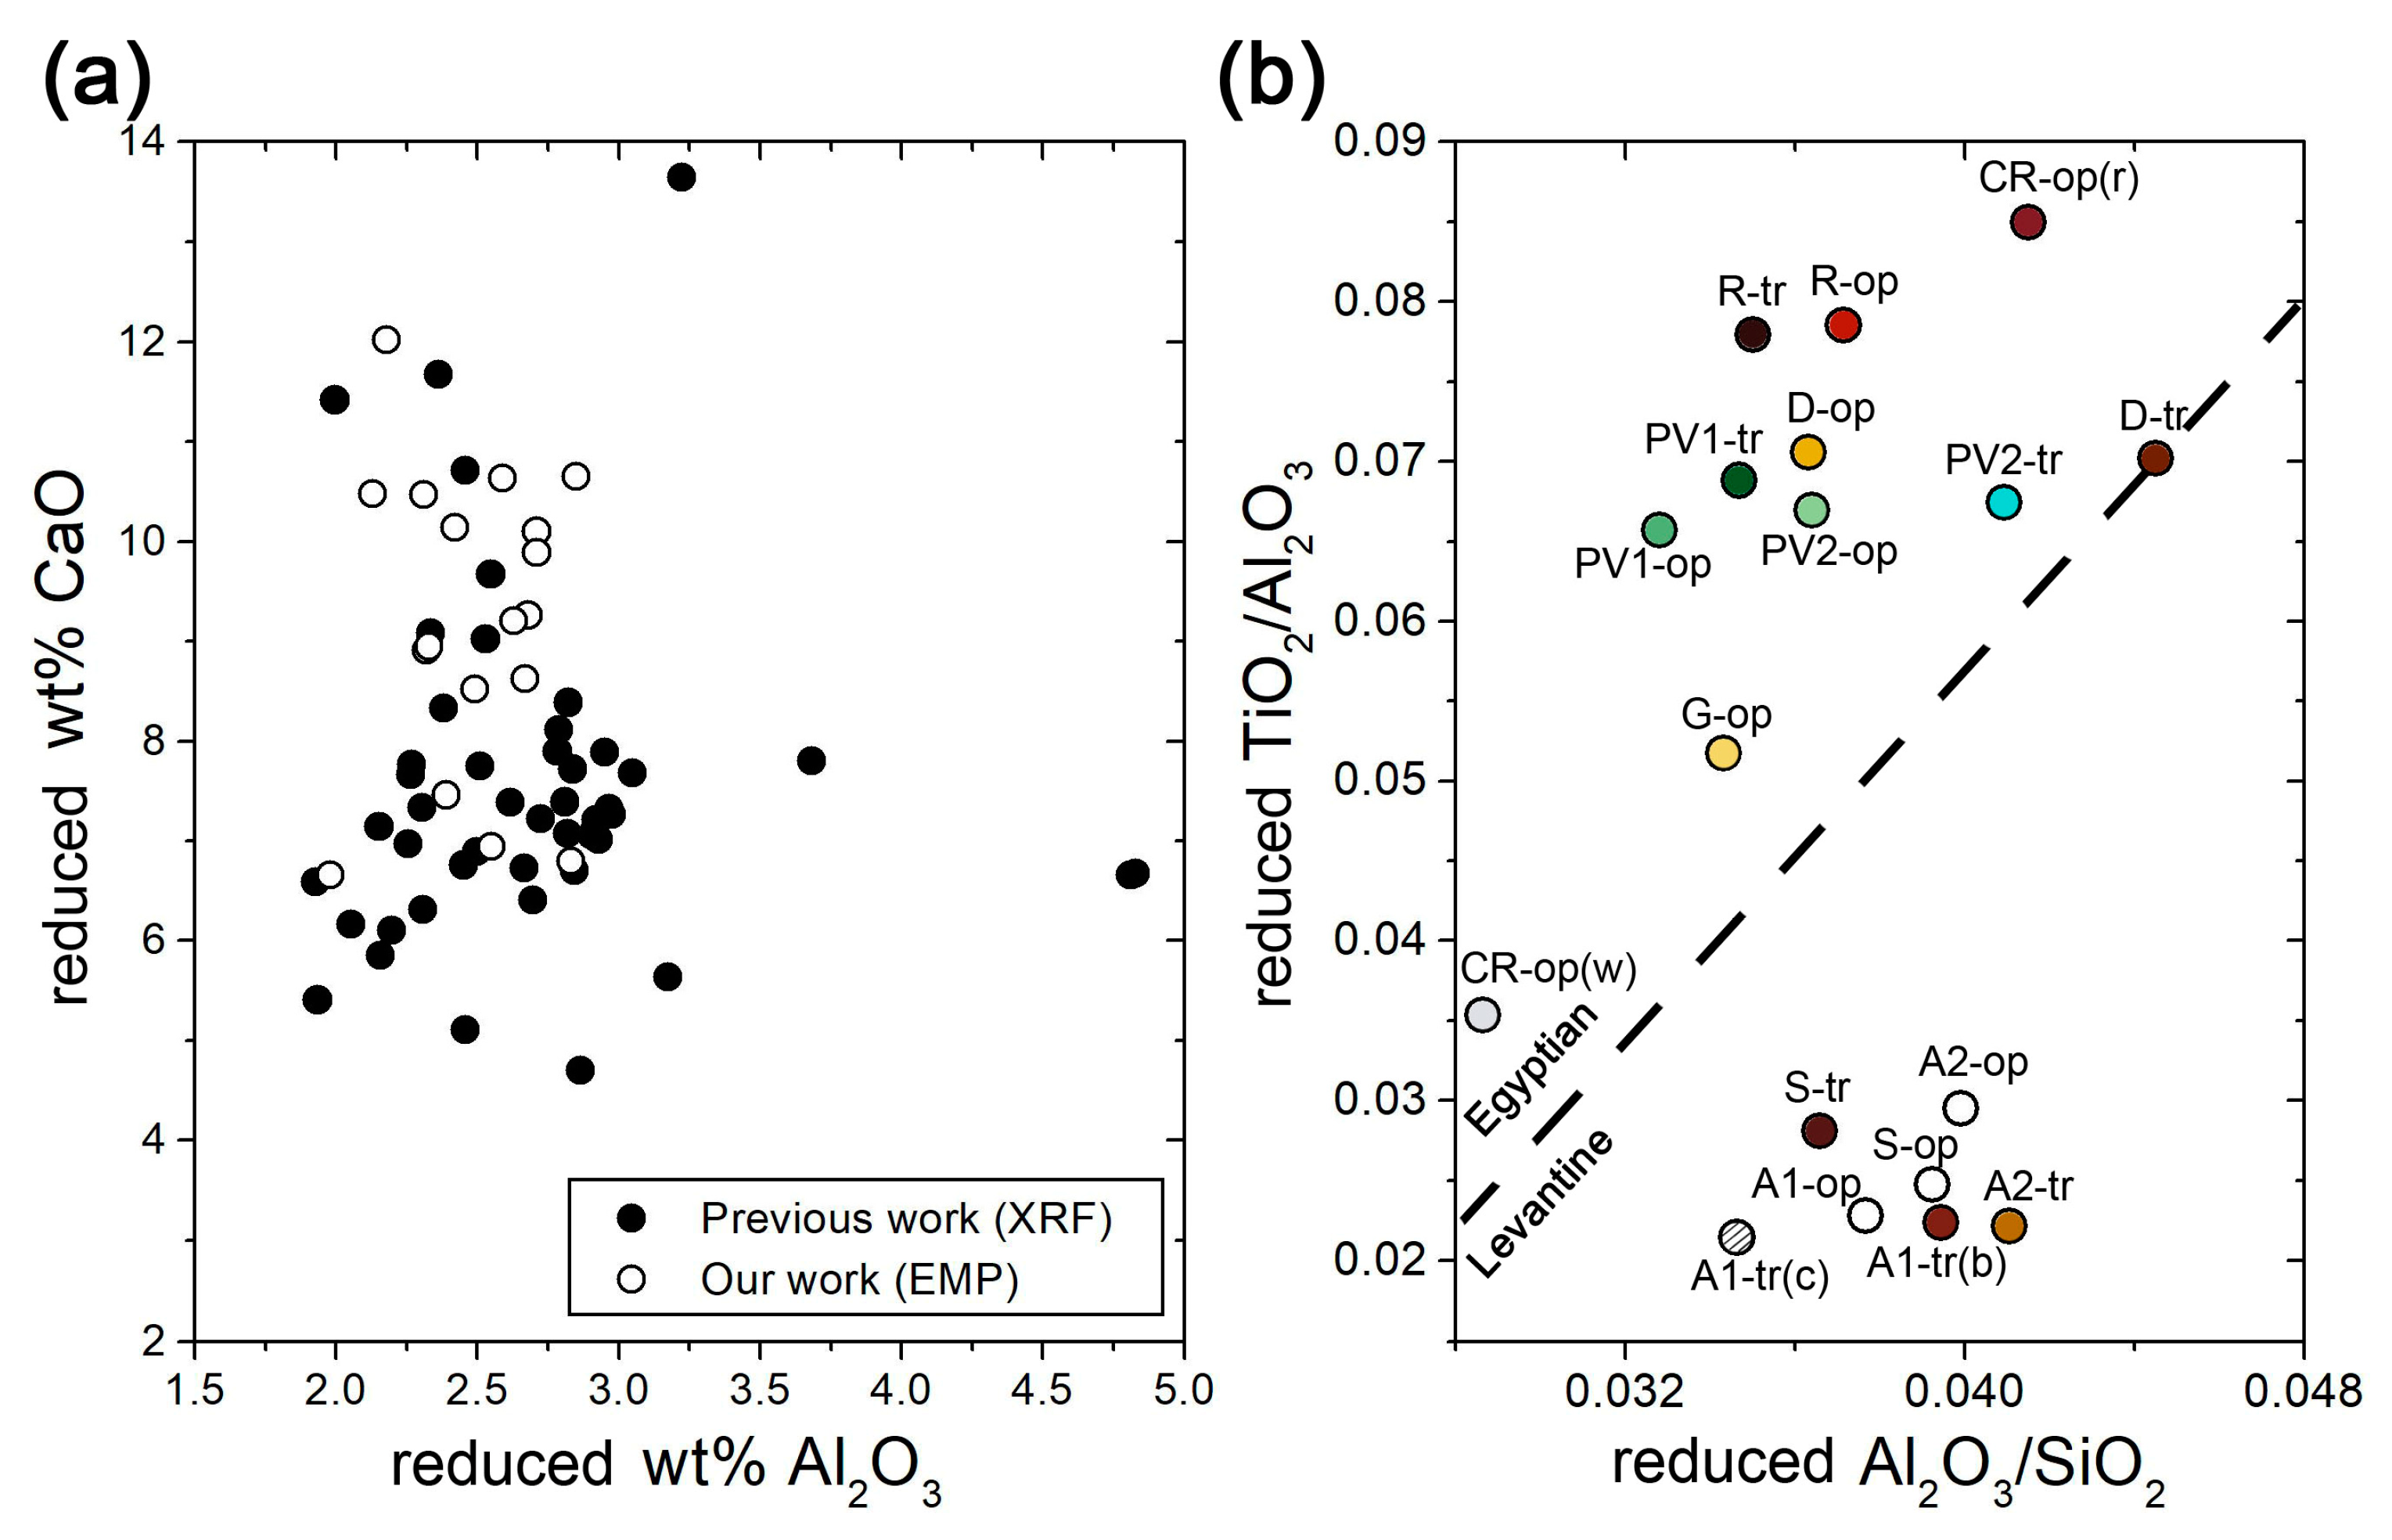
3.1. Bulk Composition (Glassy Phase)

The bulk chemical compositions of the analytical samples obtained via EMP analysis are shown in Table 2. At least two different bulk compositions were obtained for all the samples (with the exception of the strictly monochromatic sample G) on areas with different colours and transparency. All the measurements indicated Si, Na and Ca oxides as the main components, with SiO2 ranging from ~57 to ~67 wt%, CaO from ~6 to ~12 wt% and Na2O from ~11 to ~18 wt%. The Al2O3 concentration is just about constant in all the glasses (1.95–2.74 wt%). The Cl values are also relatively high and constant in all the samples (all glasses but four have values >1 wt%).
Pb is present in significant concentrations (1.33–13.33 wt% as PbO) in most of the samples. Its presence is consonant with most of the opacified glasses but it is also oddly high (PbO 7.6 wt%) within the transparent (macroscopically dark) thin veins in sample R-tr. Other elements commonly associated with opacification, like Sb and Sn, also appear but in lower concentrations. The presence of Sb appears connected to some of the opacified glasses; in contrast, Sn is not so markedly linked to opaque glasses. When present, Sn correlates with Cu-bearing glasses. Detailed data on colouring elements are presented in Section 3.1.2.

3.1.1. Composition of the Base Glass

The compositions of the glassy matrices was obtained by subtracting the content of the elements related to colouring and opacifying from the bulk composition and normalizing the rest to 100 wt% (Table S2). All the samples can be classified as soda-lime-silica glasses with SiO2 ranging from approximately 62 to 72 wt%, CaO between 7 and 12 wt% and Na2O from 12 to 18 wt%.
Regarding the MgO and K2O contents, as seen in Figure 3a, a group of samples lie within the known area of natron glasses. These are both the translucent (tr) and opaque (op) glasses from semesanto (S), agate/alabaster (A1, A2), diaspro nero e giallo (D), opaque giallo antico (G) and the translucent turquoise-green glass in one of the porfido verde imitations (PV2-tr). These samples, besides having low MgO and K2O concentrations (<1.5 wt%), also have relatively high Cl (0.86–1.77 wt%) and SO3 (0.30–0.93 wt%) values and a low P2O5 (0.06–0.22 wt%) concentration, which are consistent with the use of a mineral soda (natron) as a flux [41]. The remaining glass samples, i.e., the other porfido verde imitation (PV1), cipollino rosso (CR) and rosso antico (R), along with the opaque glass of the previously mentioned porfido verde imitation (PV2-op), appear scattered exhibiting intermediate compositions between the known compositional areas for natron-based and plant-ash-based glasses. However, sample R (both R-tr and R-op) could be considered almost a plant ash glass (both MgO and K2O > 2wt%). Additionally, the position of the white CR-op(w) sample deserves a mention as it lies in the bottom-right corner of the plot with an anomalously high MgO (3.33 wt%) concentration for a natron glass. This sample also exhibits high SO3 (0.45 wt%) and very low K2O and P2O5 values, as is typical in natron glasses.
A similar picture of the above graph is found for the K2O vs. P2O5 ratios (Figure 3b), where the glasses of hybrid composition also appear scattered. Their high K and P values are considered symptomatic of contamination through fuel ash and vapour that occur when different cycles of remelting take place. In contrast, the natron-based glasses lie grouped in the bottom-left corner of the plot again and, therefore, without hints of contamination. In this new biplot, the white opaque glass CR-op(w) in the cipollino rosso imitation joins the clustered natron-based glasses.
Lime and alumina are another couple of components frequently used in the first step to distinguish glass groups, as they can reflect the impurities present in the sand [42]. In Figure 4a, the reduced CaO versus Al2O3 contents for the analyzed glasses are plotted, along with the results obtained by Tesser et al. [20] for other glass imitations from the Gorga collection. Despite the use of different techniques to determine the composition, all the samples distribute approximately within the same area, with a homogeneous alumina content and a larger variability in the lime amounts. The values also match the known contents for Roman second c. AD glass productions [43,44,45,46], although the lime concentrations for most of the samples studied here are statistically higher and distribute without defining different clusters. Lime is sometimes indicative of contamination from fuel ash during the glassmaking process [43]. However, considering the use of different analytical techniques and the fact that some opacifiers can also contain Ca, the considerations on the purity of the used sand derived from lime values should be relativized.
In Figure 4b, the reduced Al2O3/SiO2 versus TiO2/Al2O3 weight ratios of the studied glasses are plotted. Al, Fe and Ti oxides are considered useful elements to track the mineralogy of the original sand used to produce the glass [43]. In particular, the TiO2/Al2O3 ratio seems convenient here to distinguish two types of glasses among the studied samples. The different glasses from samples A1, A2 and S form a cluster with a low TiO2/Al2O3 ratio; according to [43], these are compatible with Levantine primary glass productions. It is worth mentioning that the glasses of these three samples also appear clustered in Figure 3. This would indicate that these were made from a pure sand to produce natron glasses that possibly were not subjected to different cycles of recycling. The rest of the glasses from other samples appear more scattered and within the area attributed to Egyptian primary glass [43]. All these exhibit notably higher TiO2/Al2O3 ratios, except Cr-op(w), which shows a lower Al2O3/SiO2 value.
Multivariate data analyses produce additional evidence of the geochemical division between natron and hybrid glasses. Furthermore, opacified A1-op, A2-op and S-op form a third distinct group (Figure S3).

3.1.2. Colouring Elements and Opacifiers

Colours are relevant for all the studied sectilia and they involve both translucent and opaque glasses. The chemical elements responsible for the obtained colours can be inferred from surface XRF measurements, along with the previously presented EMP analyses (Table 2) and point SEM-EDS measurements. In the porfido verde antico imitations (samples PV1 and PV2), the green colour would mainly relate to Cu. Both opacified and translucent glasses of these samples contain this element, but it is particularly concentrated in the translucent (and greener) glasses (Figure 5a,b). Fe, Sn and Pb are also present in these glasses. Pb is clearly related to opacifiers (as its presence increases in the opacified glasses). The presence of Pb (1.33 wt% PV1-tr, 0.78 wt% PV2-tr) and Sn (0.20 wt% PV1-tr, 0.18 wt% PV2-tr) in the transparent glasses could indicate the use of metal scraps (bronze and pewter) as the source of colourant (Cu).
Apart from the green PV glasses, Cu is also found in the rosso antico (R-op and R-tr) and cipollino rosso (CR-op(r)) imitations. Its presence could be related to colouring for the red opacified glasses R-op and CR-op(r), possibly in connection with the presence of metallic Cu. Both samples can be classified as “low-Pb and low-Cu glass”, as they show low lead (PbO < 15 wt%), copper (CuO 1–5 wt%) and iron (FeO 1–4 wt%) amounts compared with other red glasses [47]. According to the literature, relatively low Pb concentrations—in particular in red glass CR-op(r) (6.06 PbO wt%)—could be unrelated to an intentional addition in order to achieve specific technical advantages [48]. In contrast, levels >10 wt%, as in those measured in the glass R-op (11.17 PbO wt%), suggest a purposely addition of Pb [48].
Mn appears to be the colouring agent for the purple/brownish translucent glasses of semesanto (S-tr) and diaspro nero e giallo (D-tr) imitations, respectively (Figure 5c,d). Trivalent Mn3+ in oxidizing conditions may produce a purple colour, whilst the brownish tone might be related to lower concentrations of Mn3+ or Mn4+ [49]. The D-tr glass has the highest Mn (3.31 wt%) and Fe contents (1.07 wt%), where the latter could have also been intentionally added to obtain a stronger colour. Mn seems to also be relevant for agate/alabaster imitations, at least in the case of the A1 sample. In this imitation, Mn is not concentrated within the brown translucent glass but in a different (colourless) transparent glass that appears fused to the opacified white glass. The bands of opacified glass (A1-op) form sets of white sheets intercalated in colourless transparent glass (A1-tr(c)) (see A1 in Figure S2). This colourless glass contains 1.23 wt% of Mn, possibly allowing for the known decolouration role of Mn2+, which promotes the oxidation of Fe to prevent the bluish shade from Fe2+ [50]. In the case of sample A2, the Mn values are rather low (<0.5 wt%), suggesting that Mn could have only come from the glass batch as a contaminant of sand and not intentionally added. In any event, the origin of the brown/amber colour of A1-tr and A2-tr remains difficult to grasp but could be related to the ferric-sulphide chromophore in a reducing atmosphere [51].
Concerning opacified glasses, Pb is relevant for some of them. However, this is not the case for the white glasses CR-op, A1-op and A2-op, which have almost no Pb. Moreover, in samples PV1 and PV2, the amount of Pb is rather low (PbO ~2 wt%) in the opacified glasses but significantly higher than that of the corresponding transparent (and coloured) glasses of the same samples. The presence of Sb is remarkable (~2–6 Sb2O3 wt%) in all the white opacified glasses, in particular in the low-Pb A1-op and A2-op glasses, pointing to calcium antimonates as white opacifiers in these two samples. The relatively high values of both Pb and Sb for D-op and especially S-op glasses seem to indicate the use of yellowish lead antimonate as the opacifier, although S-op is actually a white glass. The identification of Sb-based opacifiers is consistent with the known chronology of the studied sectilia. It is worth noting the correlation between Sb and S that could indicate the direct use of stibnite (Sb2S3) [52] as the source of Sb (Figure S4). Another element commonly associated with opacification is Sn. Its presence is in the range 0.1–0.2 (expressed as SnO2 wt%) for some glasses (those in PV1, PV2 and R samples), but with no difference between opacified and transparent glasses. The white S-op glass also has a similar Sn concentration but, in this case, the corresponding S-tr glass has almost no Sn.

3.2. Glassy Microstructures and Crystalline Phases (Studied Using Thin Sections)

A detailed petrographic inspection of the studied thin sections (using TSP) resulted in petrographic descriptions, including morphological observations of microcrystalline inclusions and their textural arrangements within the different glasses. Local probe analytical measurements performed on the inclusions using tts-μXRD, μ-Raman and SEM-BSE/EDS enabled their mineralogical characterization. In the following subsections, the results from the TSP are detailed for every type of imitated stone and at the end, a table (Table 3) summarizes the results regarding the identified microcrystalline inclusions.

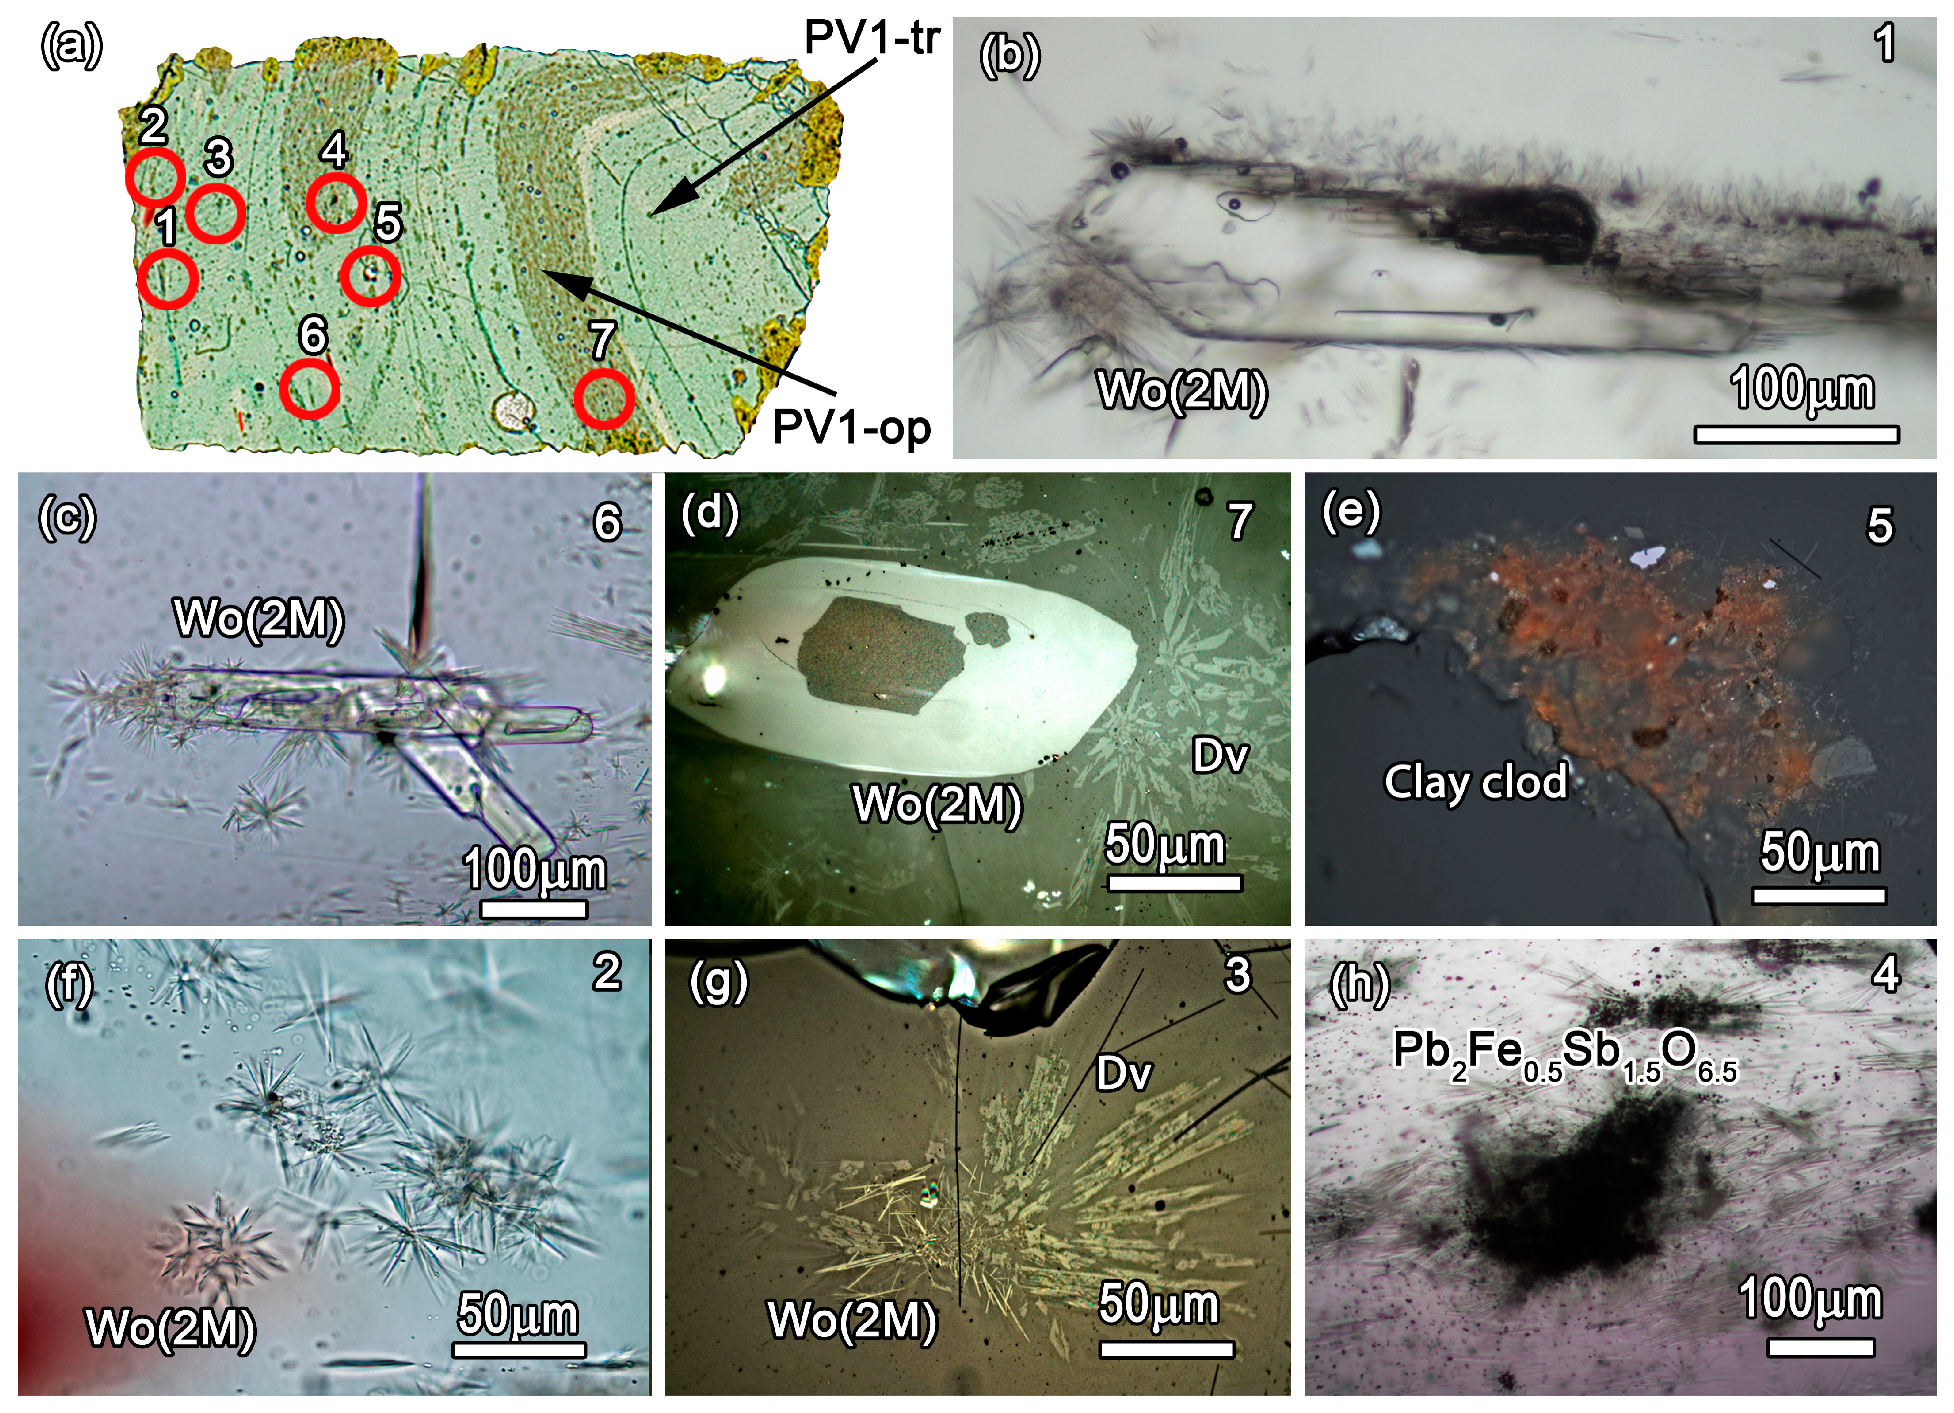
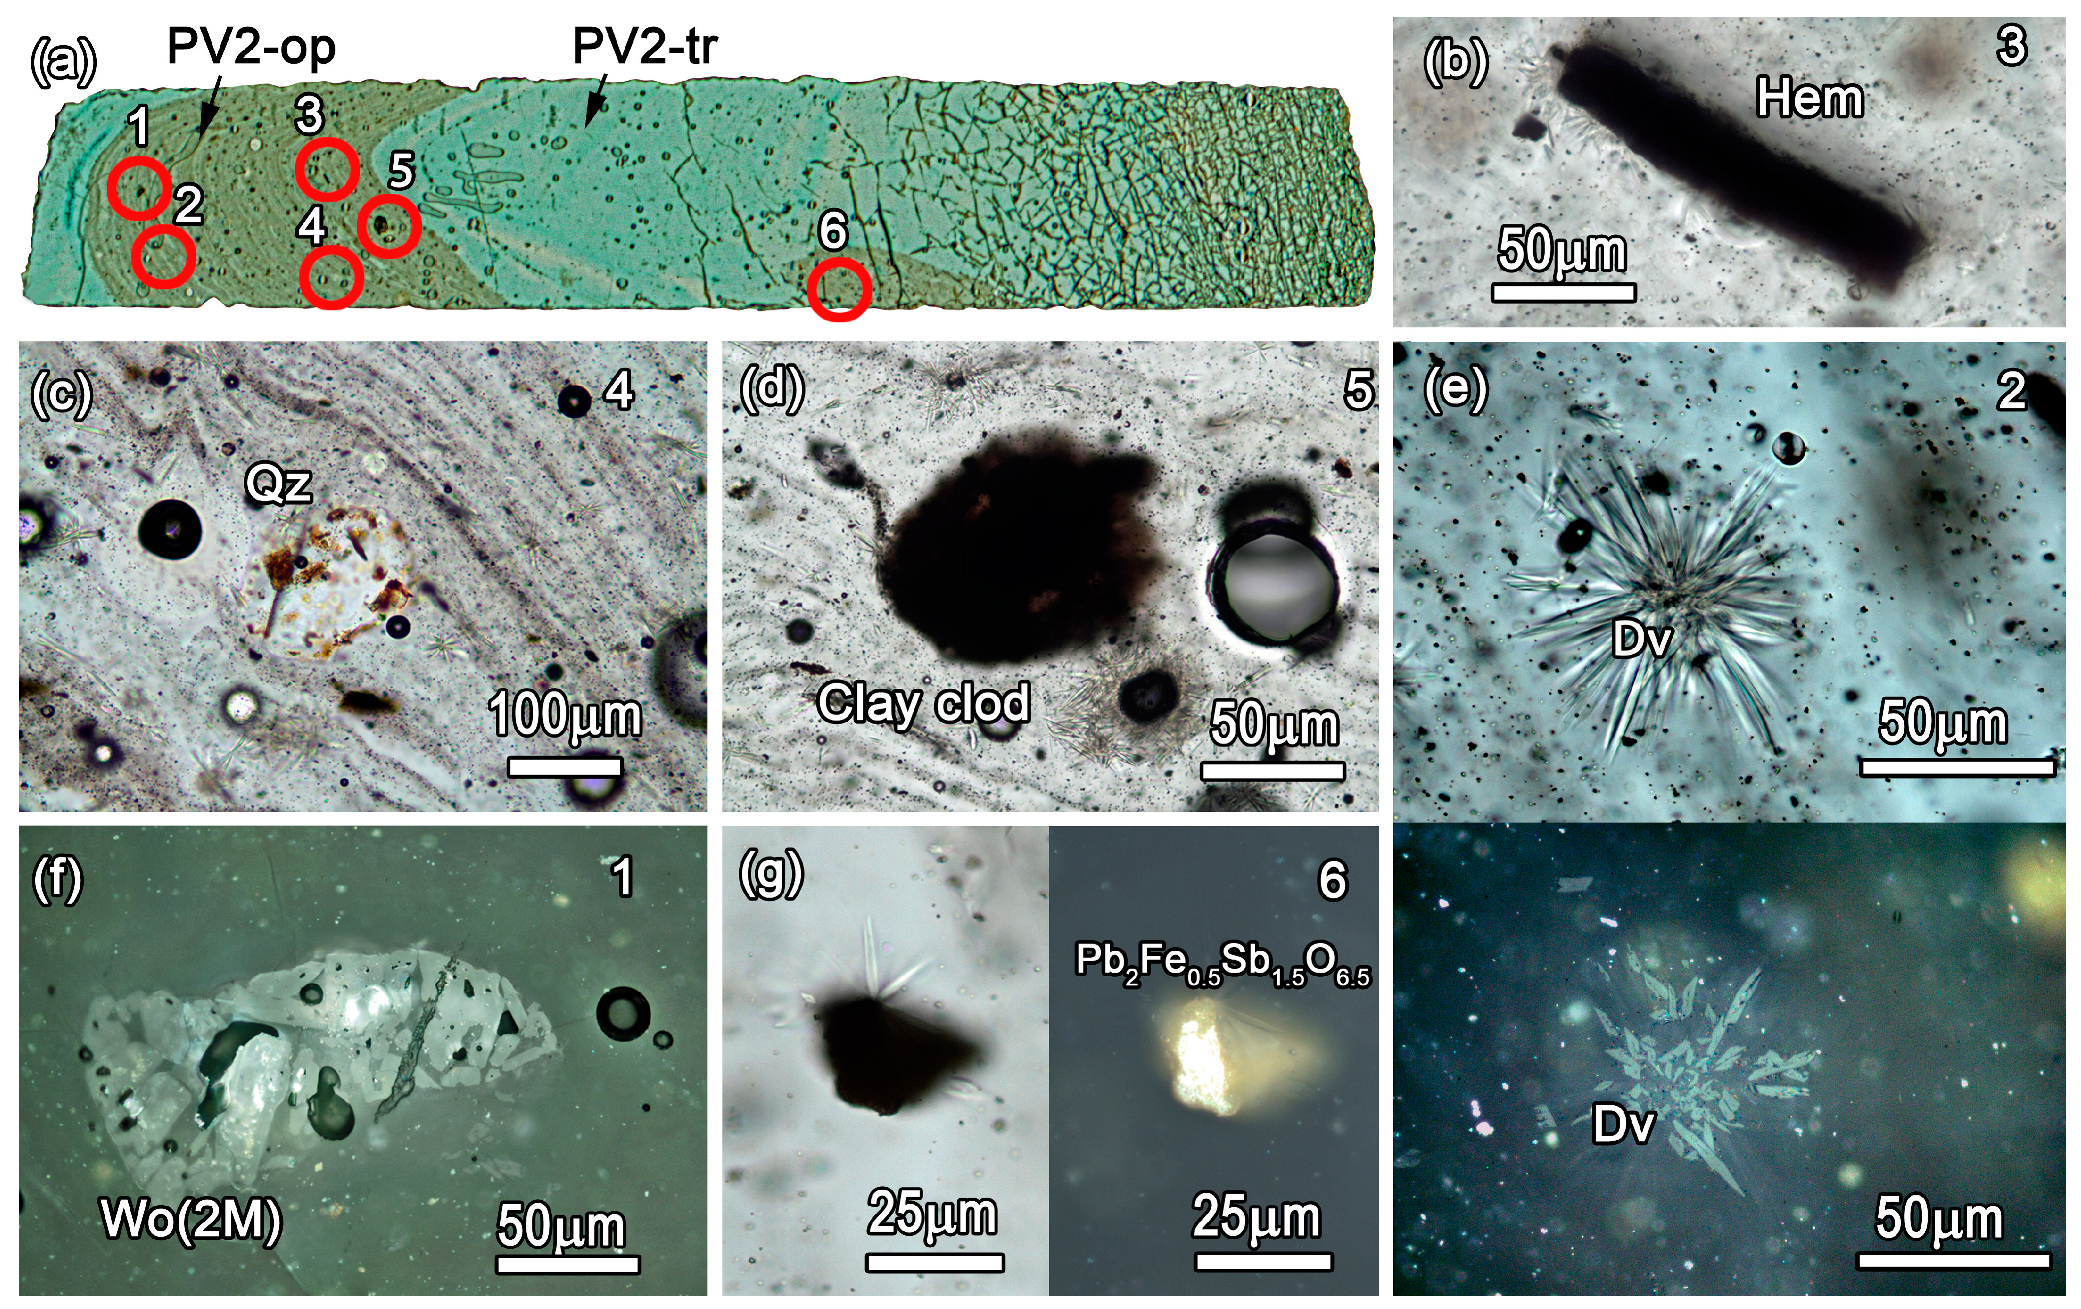
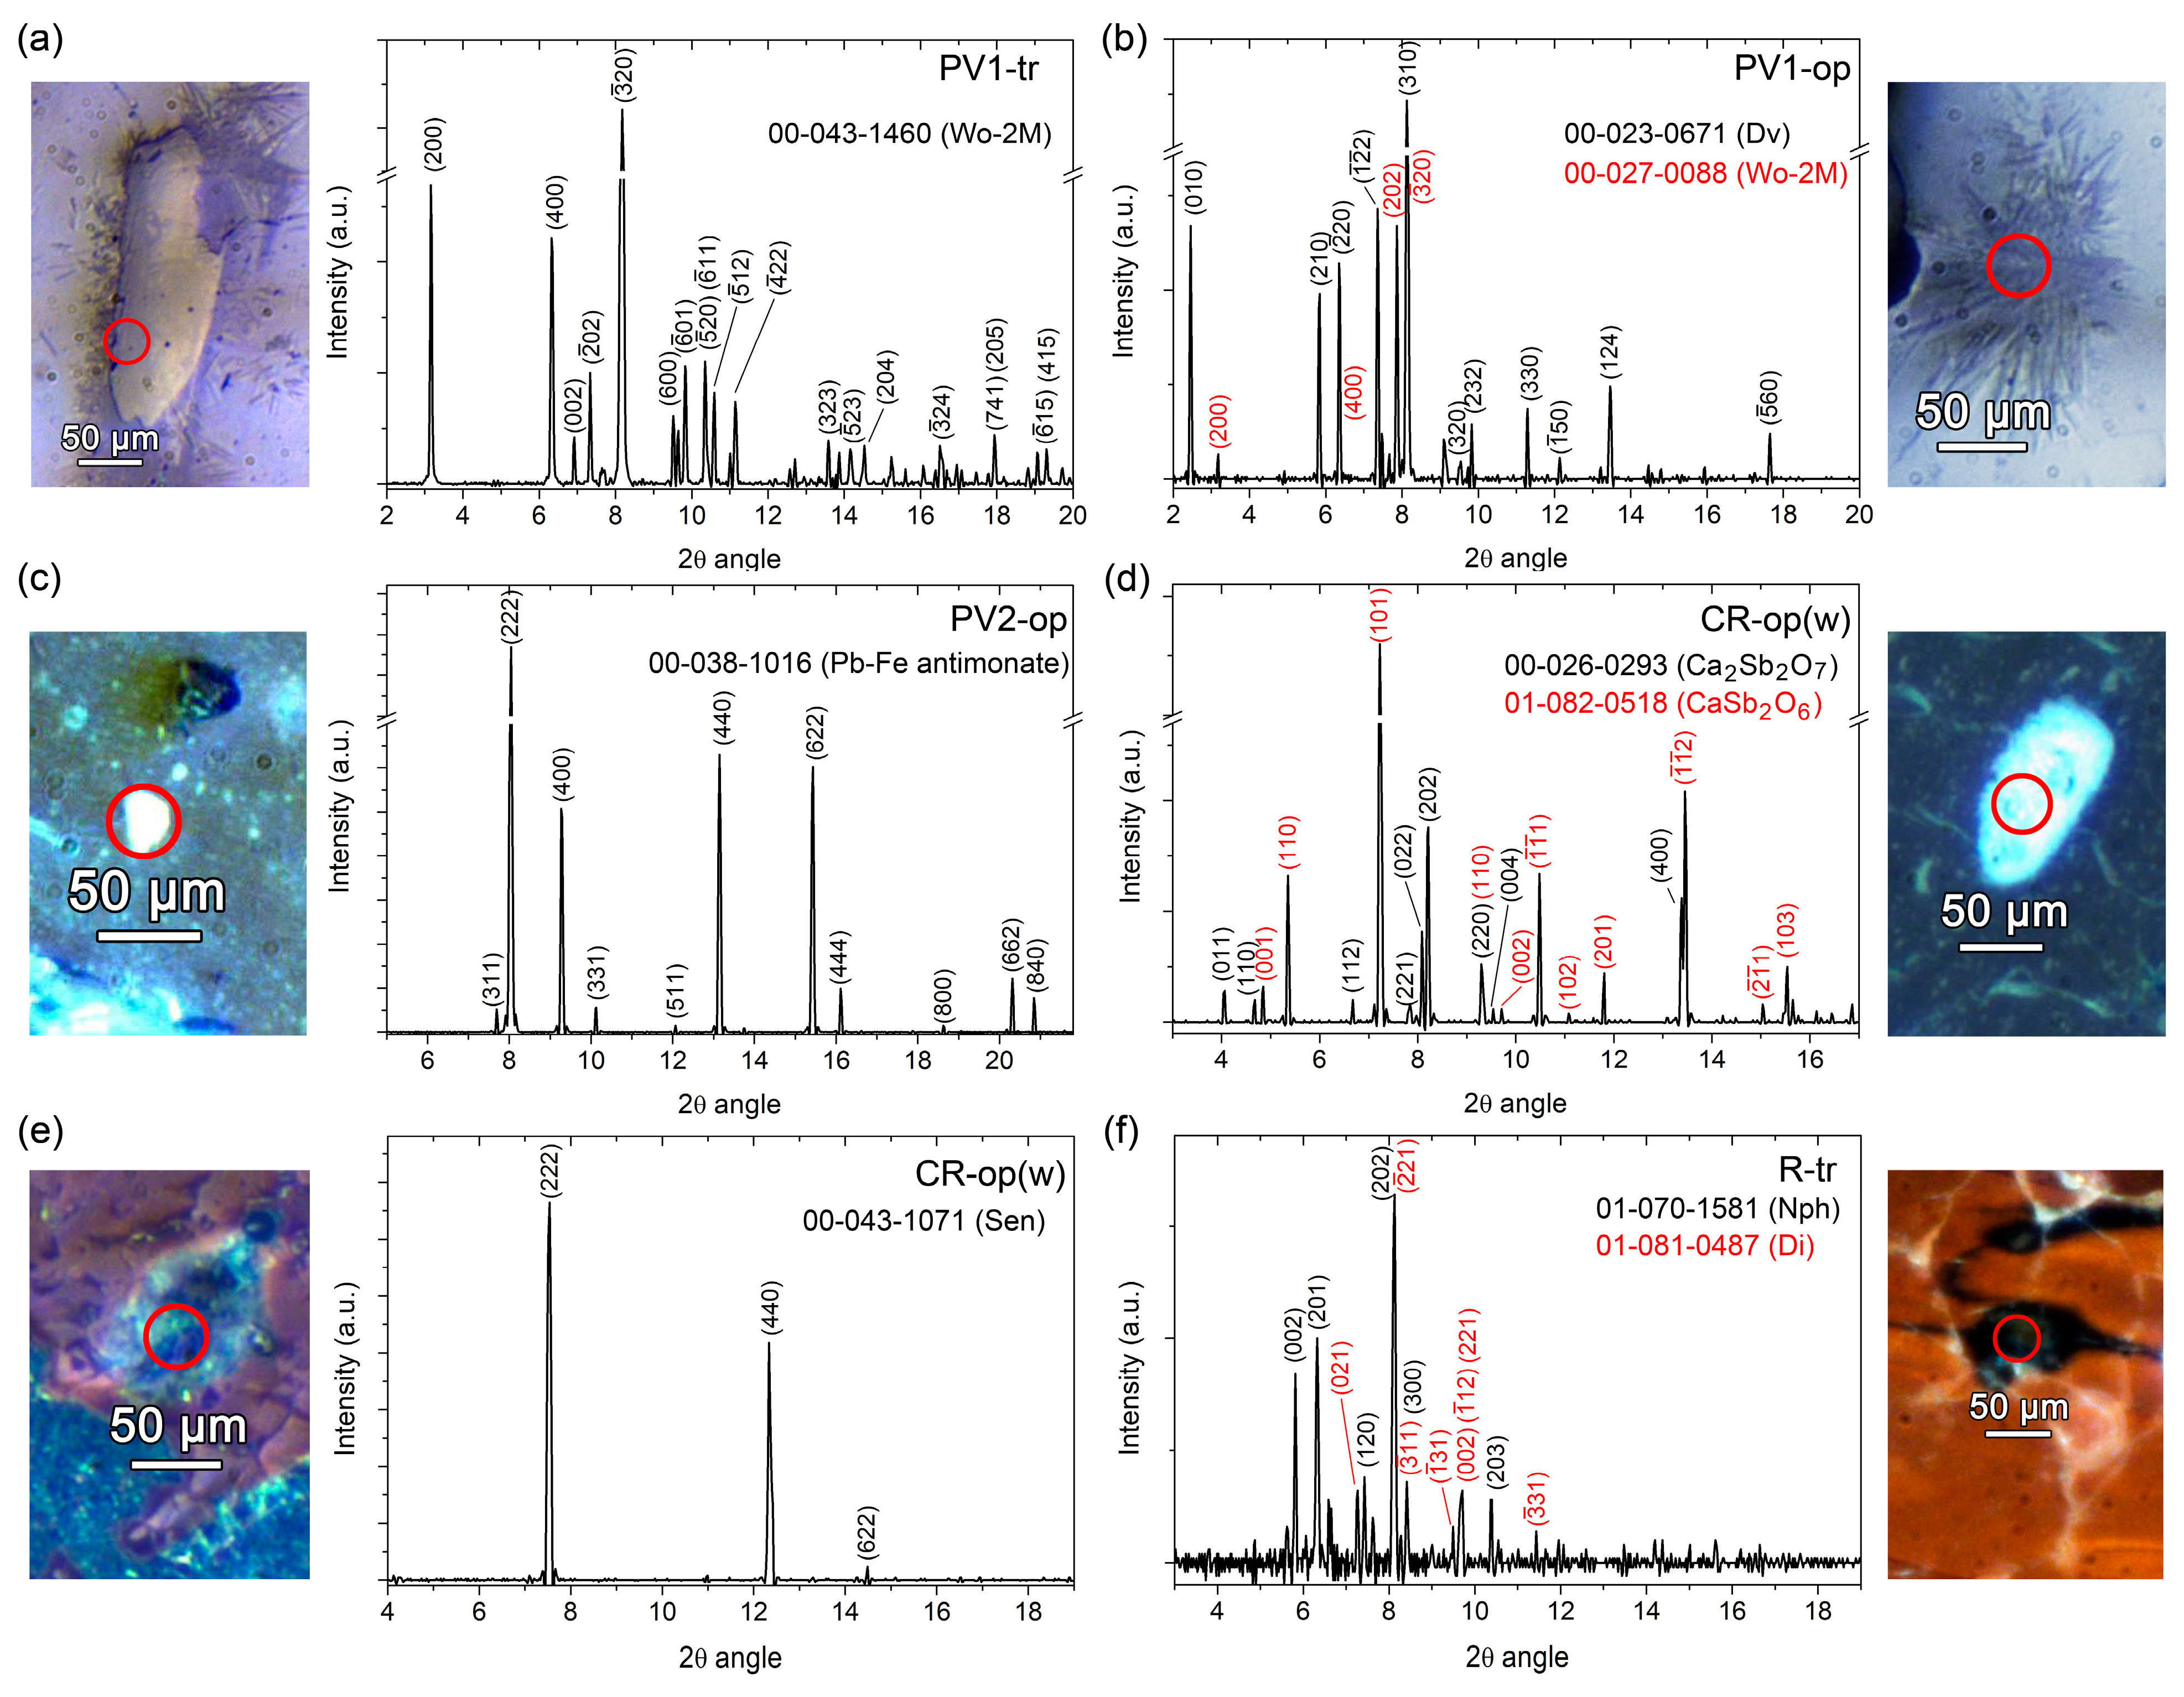
3.2.1. Porfido Verde Antico Imitations (Samples PV1 and PV2)

From a microscopic point of view, both samples (PV1 and PV2) are made of a translucent greenish matrix and opaque bands (Figure 6a and Figure 7a). However, the two samples have different textural and petrographic features. Sample PV1 is rich in relict and newly formed crystals scattered all over the glassy matrix. Relict phases are represented by rounded/sub-rounded grains, sometimes embayed (partially dissolved by the melt) and ranging in size from approximately 50 to 400 μm. They are colourless in TL and light grey in RL, with a moderate-to-high relief (Figure 6b,c). They are found alone or in association with devitrification phases, mostly in the translucent area (PV1-tr) and sometimes in the opaque strips (Figure 6d). Based on the SEM-EDS analyses, they are calcium silicates (CaSiO3) that were identified using tts-μXRD as wollastonite polytype 2M (Figure 8a). Other relict phases that are unevenly present in the glass are clusters of particles containing Si, Al, Na, Ca, Fe and Ti (clay clods, Figure 6e). Unmelted quartz and feldspar grains were seldom observed in translucent and opaque strips of the sample. Regarding devitrification products, which are particularly abundant in the opaque strips (PV1-op), two phases were identified. First, transparent (in TL) and light grey (in RL) whisker crystals that form fans of needles that are again found to be wollastonite (2M) (Figure 6f). The second phase consists of transparent (in TL) and grey (in RL) tabular crystals with skeletal morphologies, which were identified as devitrite (Na2Ca3Si6O16) (Figure 6d,g). These devitrification products can be found together, alone, or in association with either the abovementioned relict wollastonite or opacifier crystals. Micrometric particles of opacifiers containing Pb, Sb and Fe appear finely dispersed in the opaque PV1-op strips or clustered in lumps (Figure 6h). Their tts-μXRD patterns correspond to lead iron antimonate (Pb2Fe0.5Sb1.5O6.5) with a pyrochlore crystallographic structure of cubic space group F d 3 ¯ m . Some of these opacifier particles exhibit anhedral morphologies, whereas others present sub-euhedral/euhedral shapes (Figure S5). Furthermore, Pb-Fe antimonates were analyzed using µ-Raman and a representative spectrum collected on them is shown in Figure 9, with the main Raman bands at 81, 147, 306, 346, 459, 515, 655 and 748 cm−1.
In contrast, in sample PV2, the translucent area (PV2-tr) displays a particularly pure glassy matrix practically deprived of microcrystals. The opaque strips contain abundant hematite (Figure 7b) and quartz grains (Figure 7c). Based on their rounded morphologies and their role as nucleation sites, both the hematite and quartz grains can be considered relict inclusions, along with some clay clusters (Figure 7d). Regarding newly formed crystals, there is abundant devitrite (Na2Ca3Si6O16) (Figure 7e). No wollastonite devitrification crystals were found in this sample, and only a single relict crystal of wollastonite (2M) was spotted (Figure 7f). Its size is about 180 μm and it shows a grainy crystalloid morphology. Similarly to the PV1 sample, the phase associated with the opacifier consists of Pb-Fe antimonate particles (Figure 7g), which were also identified using tts-μXRD (Figure 8c).

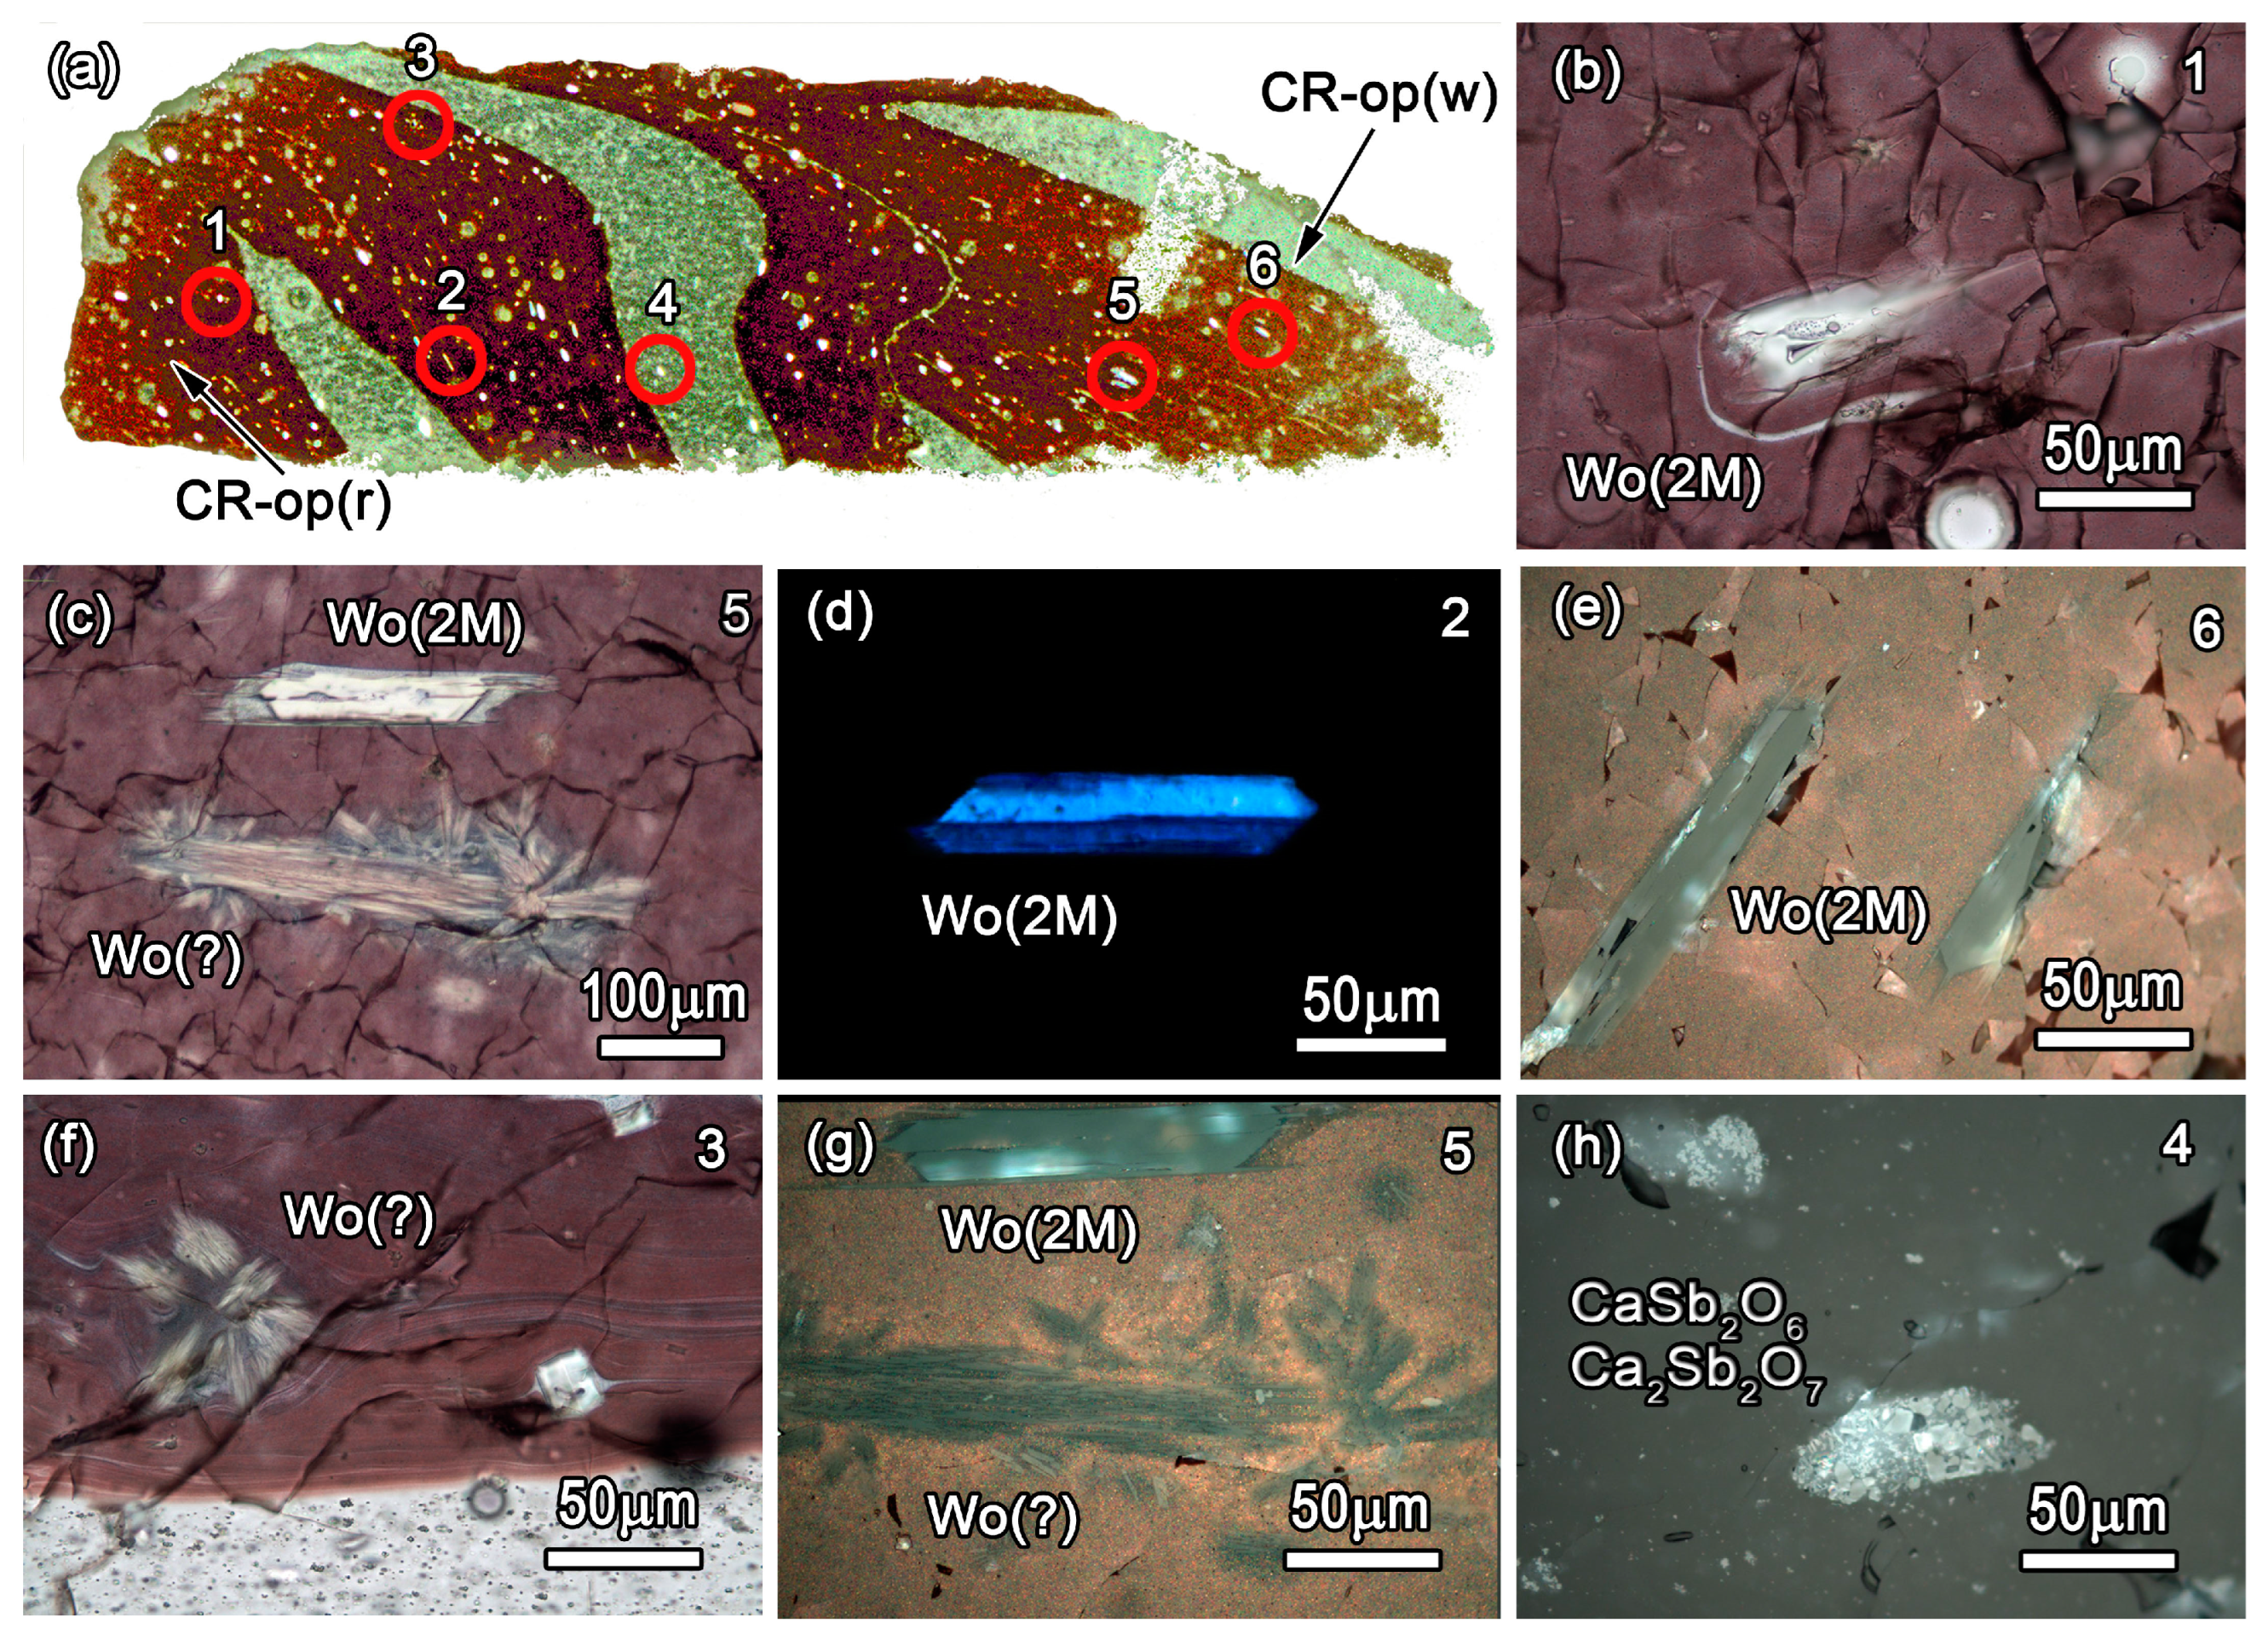
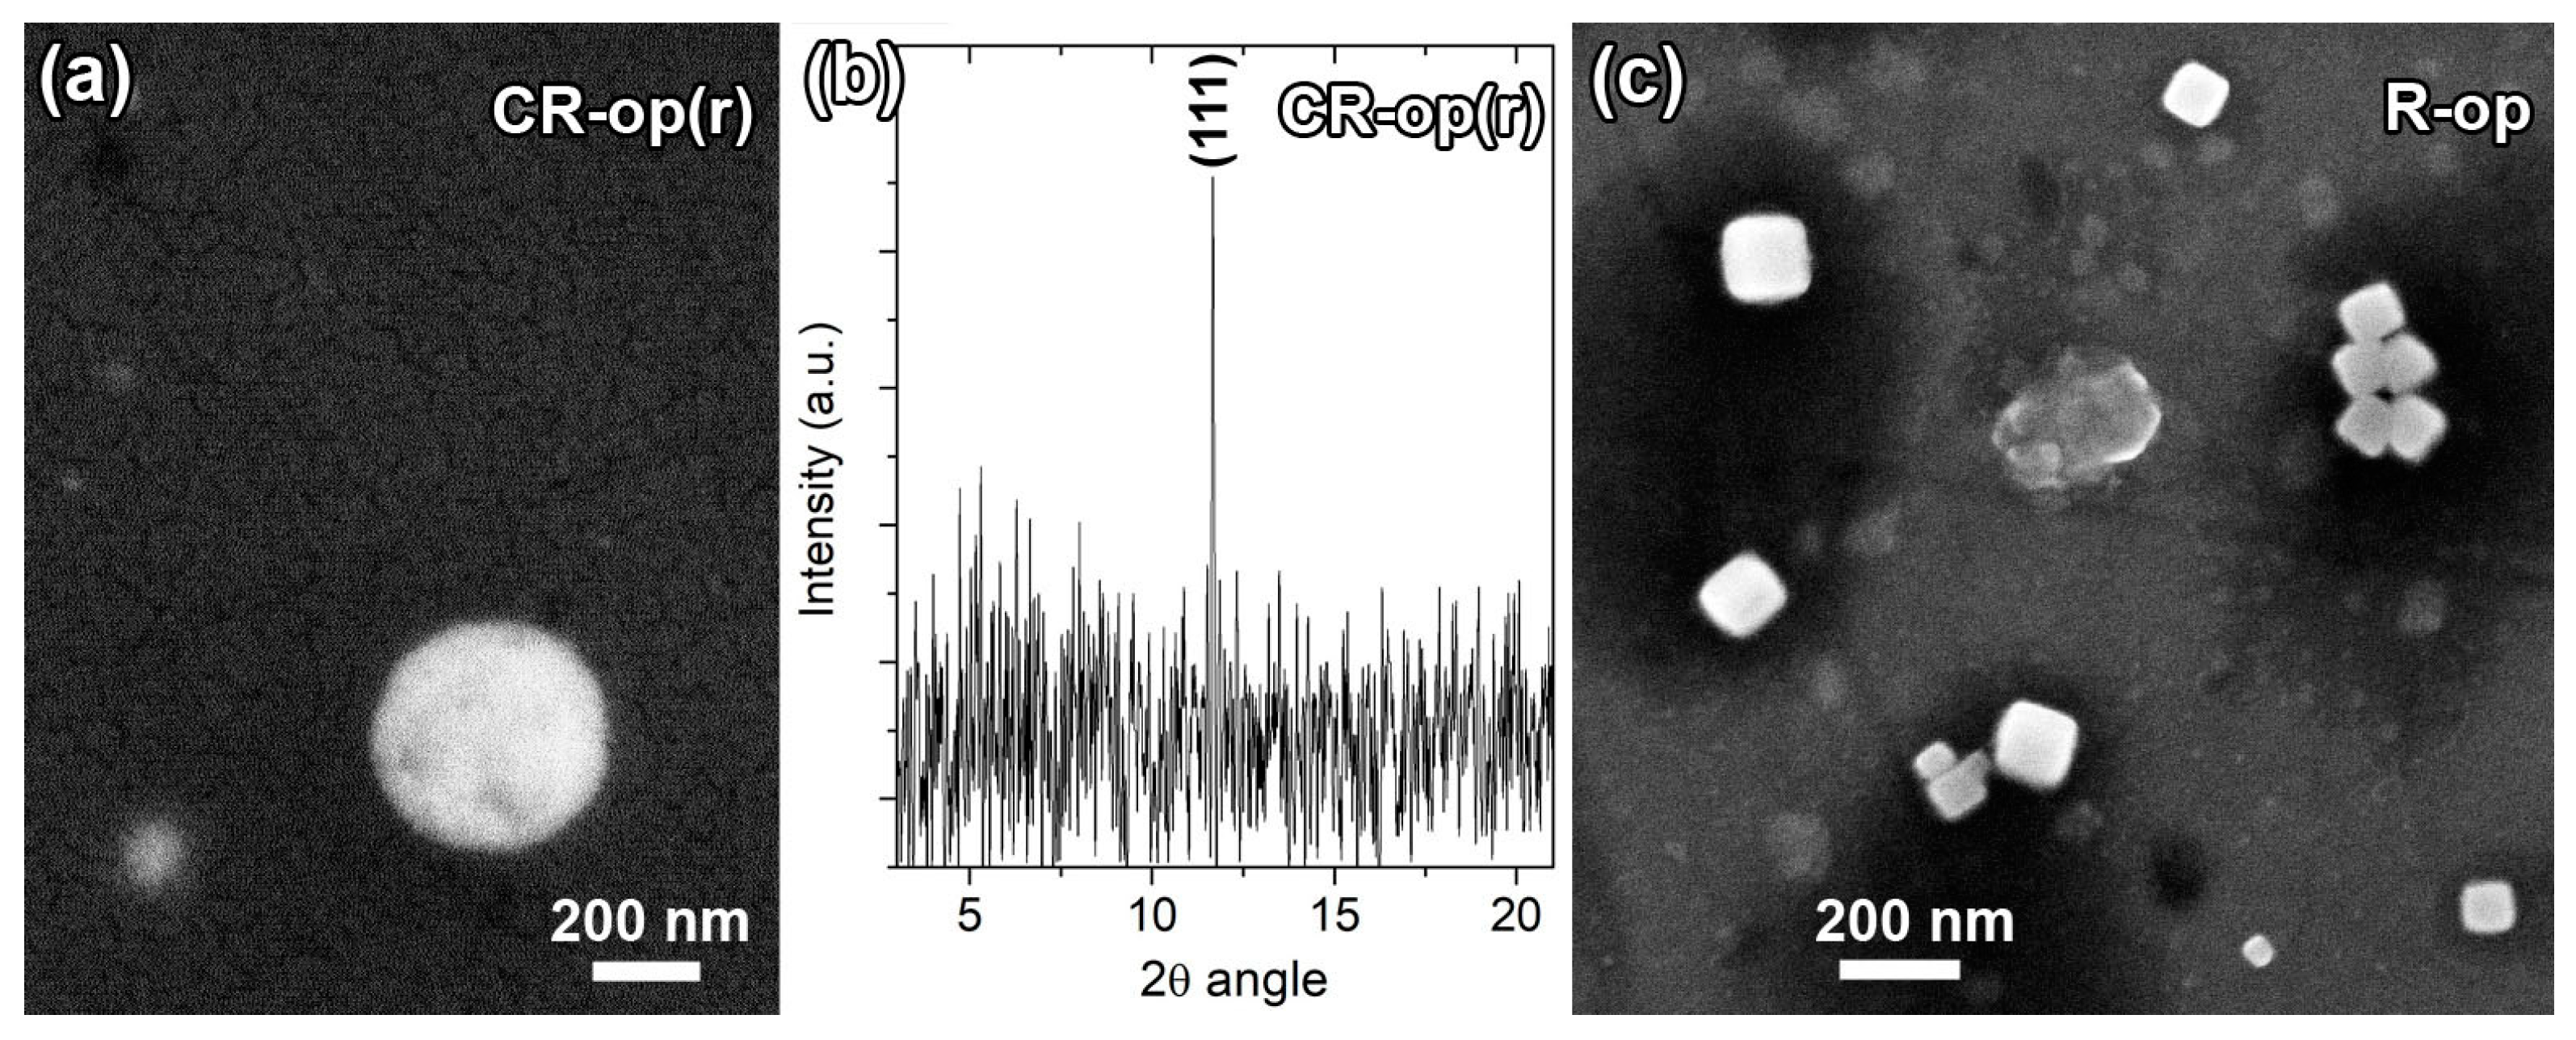
3.2.2. Cipollino Rosso Imitation (Sample CR)

From a microscopic point of view, the macroscopic red matrix (CR-op(r)) of the sample appears greyish-maroon in TL and with a red-orange tone in RL (Figure 10). A close look in RL revealed the presence of intensively interspersed sub-micrometric grains that were identified using SEM-EDS as copper-bearing particles (Figure 11a) and as metallic copper using tts-μXRD (Figure 11b). The coloured matrix shows high opacity, but the white bands are also highly opacified. In TL, the maroon matrix reveals tone changes towards purple-blue hues in some layers and around fibrous microcrystals (Figure 10b,c,f). Three types of crystals can be observed in the maroon matrix, where all of them share approximately the same calcsilicate composition compatible with wollastonite: (i) rounded/sub-rounded relict grains, transparent in PPL (Figure 10b); (ii) newly formed idiomorphic crystals with prismatic and tabular morphologies, most of them twinned (Figure 10c–e); and (iii) lamellar/layered crystals forming fibrous aggregates that appear purple-blue in TL due to the strong absorption colours of the matrix where they are embedded (Figure 10c,f). In some cases, these fibrous aggregates appear to form coronitic structures that encircled the ii-type crystals (Figure 10c). Analyses of these fibrous inclusions are complex since the crystals are very thin; this could explain their more impure composition (Figure 10g). The wollastonitic nature of the three types of crystals was confirmed using tts-μXRD. However, in the case of the fibrous aggregates (iii-type crystals), the correspondence with XRD reference patterns is not so clear. Electron diffraction patterns recorded on an FIB-prepared lamella indicate that the fibrous crystals contain multiple layered stacking faults (Figure 12), mainly with a statistical half-faulting parameter that turned the diffraction spots on odd levels into diffraction streaks [53]. A detailed structural study of these crystals will be the subject of a separate paper, but stacking faults are a relatively common feature in wollastonite [54]. In this case, the planar defects could have originated from the transition from the monoclinic phase to a low-temperature triclinic polymorph. Besides wollastonite, some quartz and hematite grains, as well as clay clods, are also observed in the maroon matrix.
Regarding the opacifiers in the white bands (CR-op(w)), these are represented by relatively homogeneous clusters of about 100–250 μm. In most of them, euhedral crystals, along with anhedral sub-micrometric particles, can be observed (Figure 10h). They were identified as Ca-antimonates using tts-μXRD. Some clusters consist of both the hexagonal (CaSb2O6) and orthorhombic (Ca2Sb2O7) forms whilst others contain only the orthorhombic form (Figure 8d). Additionally, other Sb oxides, such as Sb2O3 (senarmontite) (Figure 8e) and Sb6O13, were recognized using tts-μXRD.

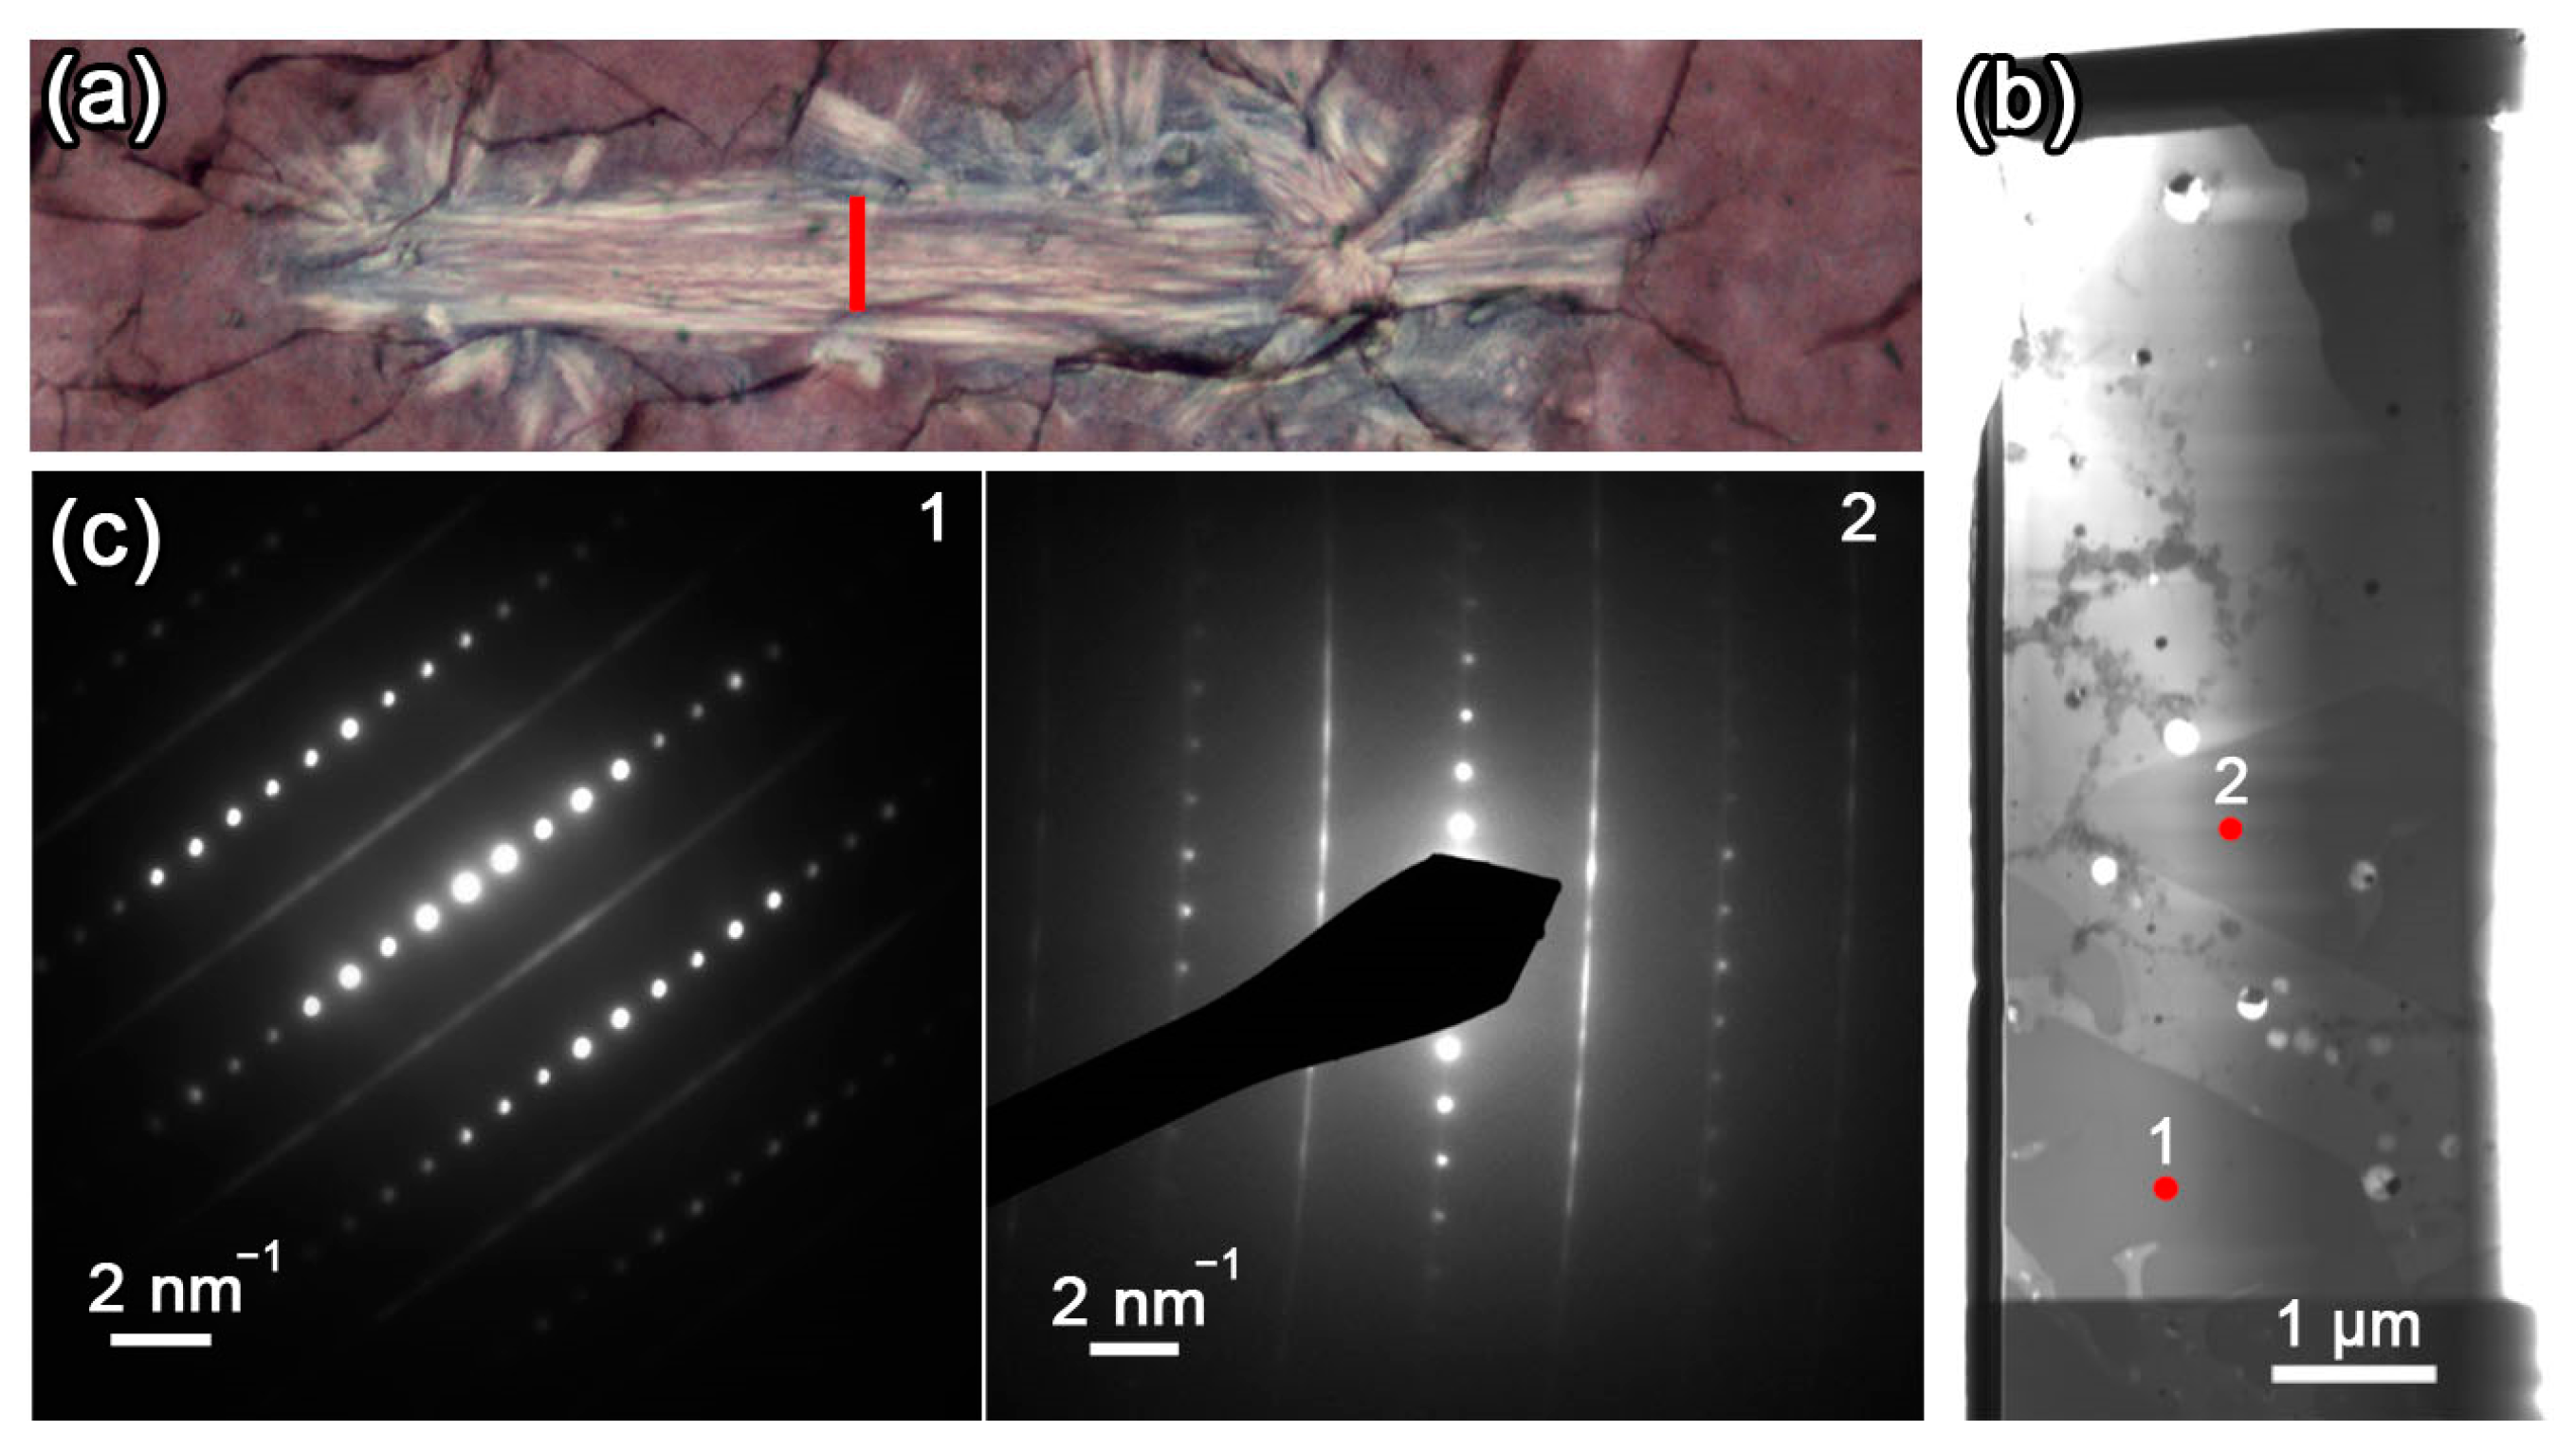
3.2.3. Rosso Antico Imitation (Sample R)

Under the microscope, the macroscopically red R sample appears differently coloured depending on the observation mode. This effect was already observed for sample CR but here it is even more apparent. In TL, the glass exhibits wavy ribs of different tones of a greyish-blue matrix (Figure 13b,c) that appear copper red in RL (Figure 13f,h). This effect relates to the different behaviour of the light depending on the wavelength. Long (reddish) wavelengths tend to be reflected by the R glass while short (bluish) wavelengths travel through the glass. Copper particles (metallic copper) are, as in sample CR, responsible for this chromatic effect. In this case, the particles exhibit cubic shapes and sizes < 200 nm (Figure 11c) and they are found all over the opaque glass. Furthermore, the macroscopically observed thin dark veins (R-tr) appear to be completely transparent and colourless under the microscope and completely deprived of copper particles. These transparent veins (thickness from ~10 µm to ~150 µm) can easily pass unnoticed in SEM, camouflaging as a part of the red opaque glass (Figure 13b). Using the petrographic microscope, they not only appear optically distinct but also enriched with some mineral phases not found in the opaque glass. These veins, which are sometimes reduced to extremely thin lines within the coloured matrix, contribute to creating the foliated marbled appearance. The main relict inclusions, which are present in both the opaque matrix and the transparent veins, correspond to the omnipresent calcium silicate (monoclinic wollastonite) already described in samples PV1 and PV2 (porfido verde antico imitations) and CR (cipollino rosso imitation). They are unevenly scattered and, in some cases, their position in the glass matrix brings to mind the typical metamorphic textures with the bending of the foliation around porphyroblasts (Figure 13c–e). Other relict inclusions, although detected solely in the transparent glassy matrix, correspond to clay clusters, quartz and hematite grains (Figure 13f,g). Newly formed crystals, which are also only present within the transparent veins, were identified as nepheline (NaAlSiO4) and diopside (CaMgSi2O6) (Figure 13h) using tts-μXRD. Both phases are in form of tiny needle-like crystals.

3.2.4. Giallo Antico Imitation (Sample G)

Under the petrographic microscope, sample G presents a semi-opaque matrix as seen in TL, including profuse newly formed crystals (Figure 14a,b). These are widespread all over the matrix and, based on the tts-μXRD, they correspond to devitrite (Na2Ca3Si6O16) and nepheline (NaAlSiO4). They are transparent in TL and light grey in RL, showing skeletal and tabular morphologies (Figure 14c,d). Very few thin crystals of monoclinic wollastonite (CaSiO3) were also identified. The opacity and yellow colour of the glass is related to the presence of Pb-Fe antimonates in the form of clusters, as well as finely scattered particles in the matrix (Figure 14e,f). Using SEM, their morphologies appear to range from anhedral (or sub-euhedral) to euhedral. Comparatively, relict inclusions are not so common, they consist of quartz grains and clay clumps.

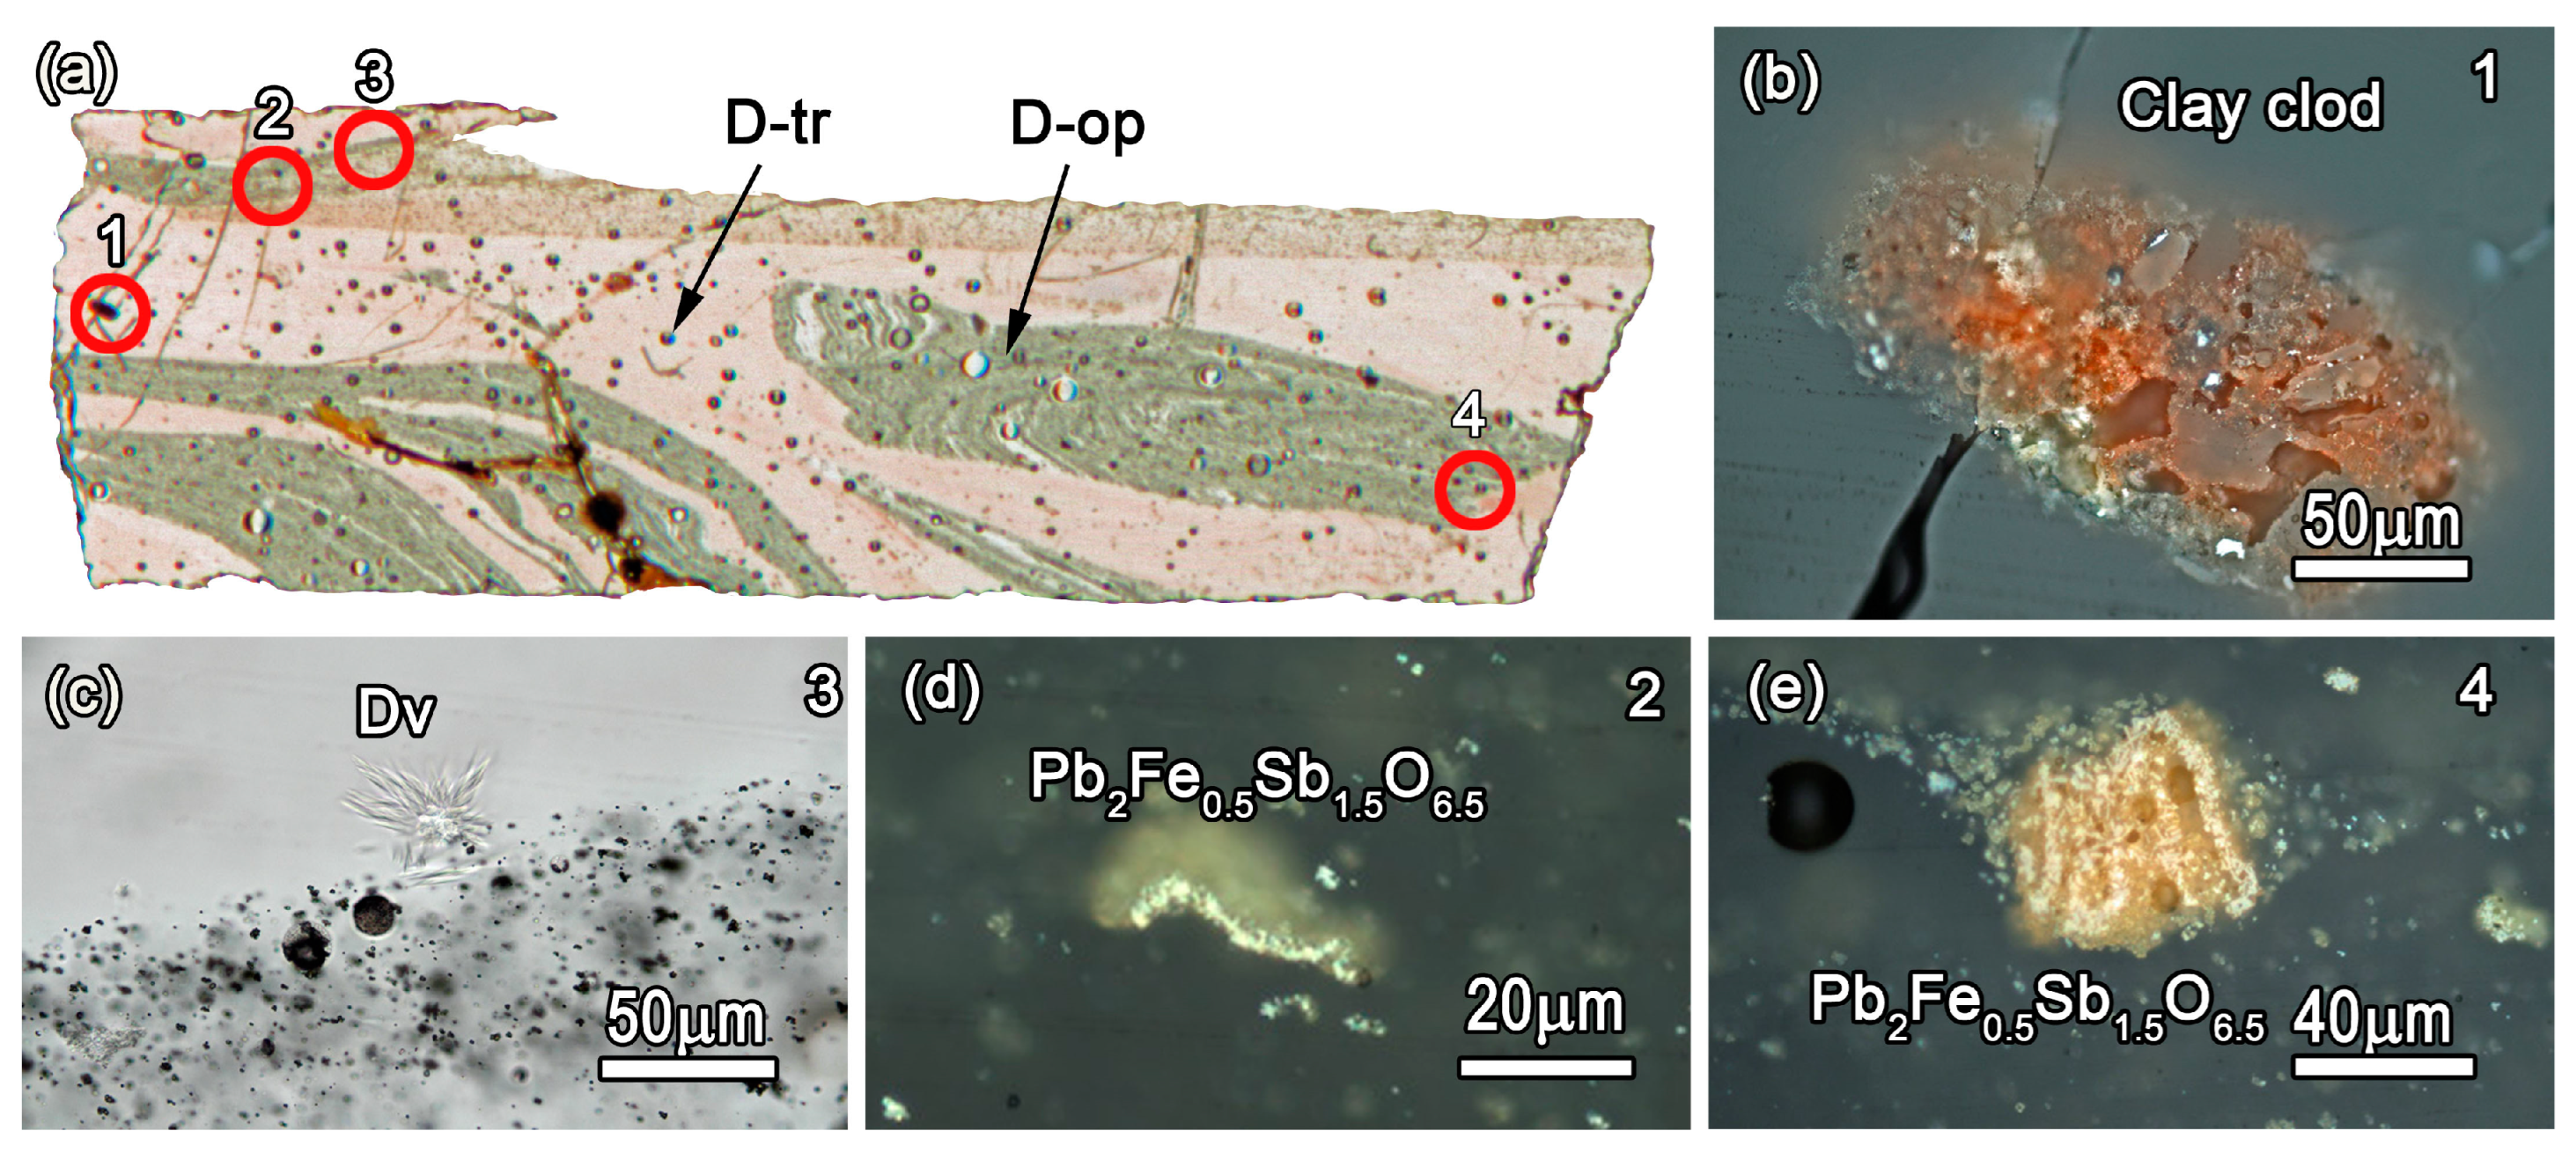
3.2.5. Diaspro Nero e Giallo Imitation (Sample D)

The thin section of sample D shows a mixture of colourless transparent glass and opacified glass under the microscope using TL (Figure 15a). The microcrystals are basically concentrated in the opaque areas (D-op). Relict grains are scarce and consist of quartz and clay clumps of different silicate grains (Figure 15b). Devitrification crystals are common and they are found in the opaque bands, as well as in the interface between the transparent and opaque areas. They chiefly consist of devitrite (Na2Ca3Si6O16) (Figure 15c) and, very seldom, wollastonite. Opacifier crystals are of course also concentrated within the opaque bands in the form of abundant clusters of Pb-Fe antimonates (they act as an opacifier and yellow pigment). Some idiomorphic/platy crystals of them can be observed, along with rosary-shaped aggregates (Figure 15d,e). The transparent areas are essentially deprived of microcrystals.

3.2.6. Semesanto Imitation (Sample S)

Similarly to sample D, sample S shows two different types of glass (Figure 16a). Under the petrographic microscope, the purple bands correspond to a transparent glass (S-tr) and appear colourless; in contrast, the macroscopic white bands appear heavily opacified (S-op). Despite the differences, the two types of glasses appear very closely linked in such a way that even in the 30 µm thin section, they sometimes appear overlapped, creating different hues (Figure 16b). It is interesting to note the arrangement and, in particular, the stretching of the opaque clumps (Figure 16c) that reflect the working technique of juxtaposing, pressing and distending the canes. Devitrification products, like devitrite (Na2Ca3Si6O16), are found as microcrystals, mainly in the opacified areas or in the interface with the transparent glass. Opacifiers are only found in the opaque bands forming abundant clusters of Ca-antimonate (Figure 16d) and also finely dispersed in the form of very small crystals. These were identified as the orthorhombic phase (Ca2Sb2O7) using tts-μXRD, and generally, they exhibit rounded anhedral morphologies and only occasionally sub-idiomorphic morphologies. Relict crystals are rarer, they appear in both types of glasses and correspond to quartz and feldspar grains.

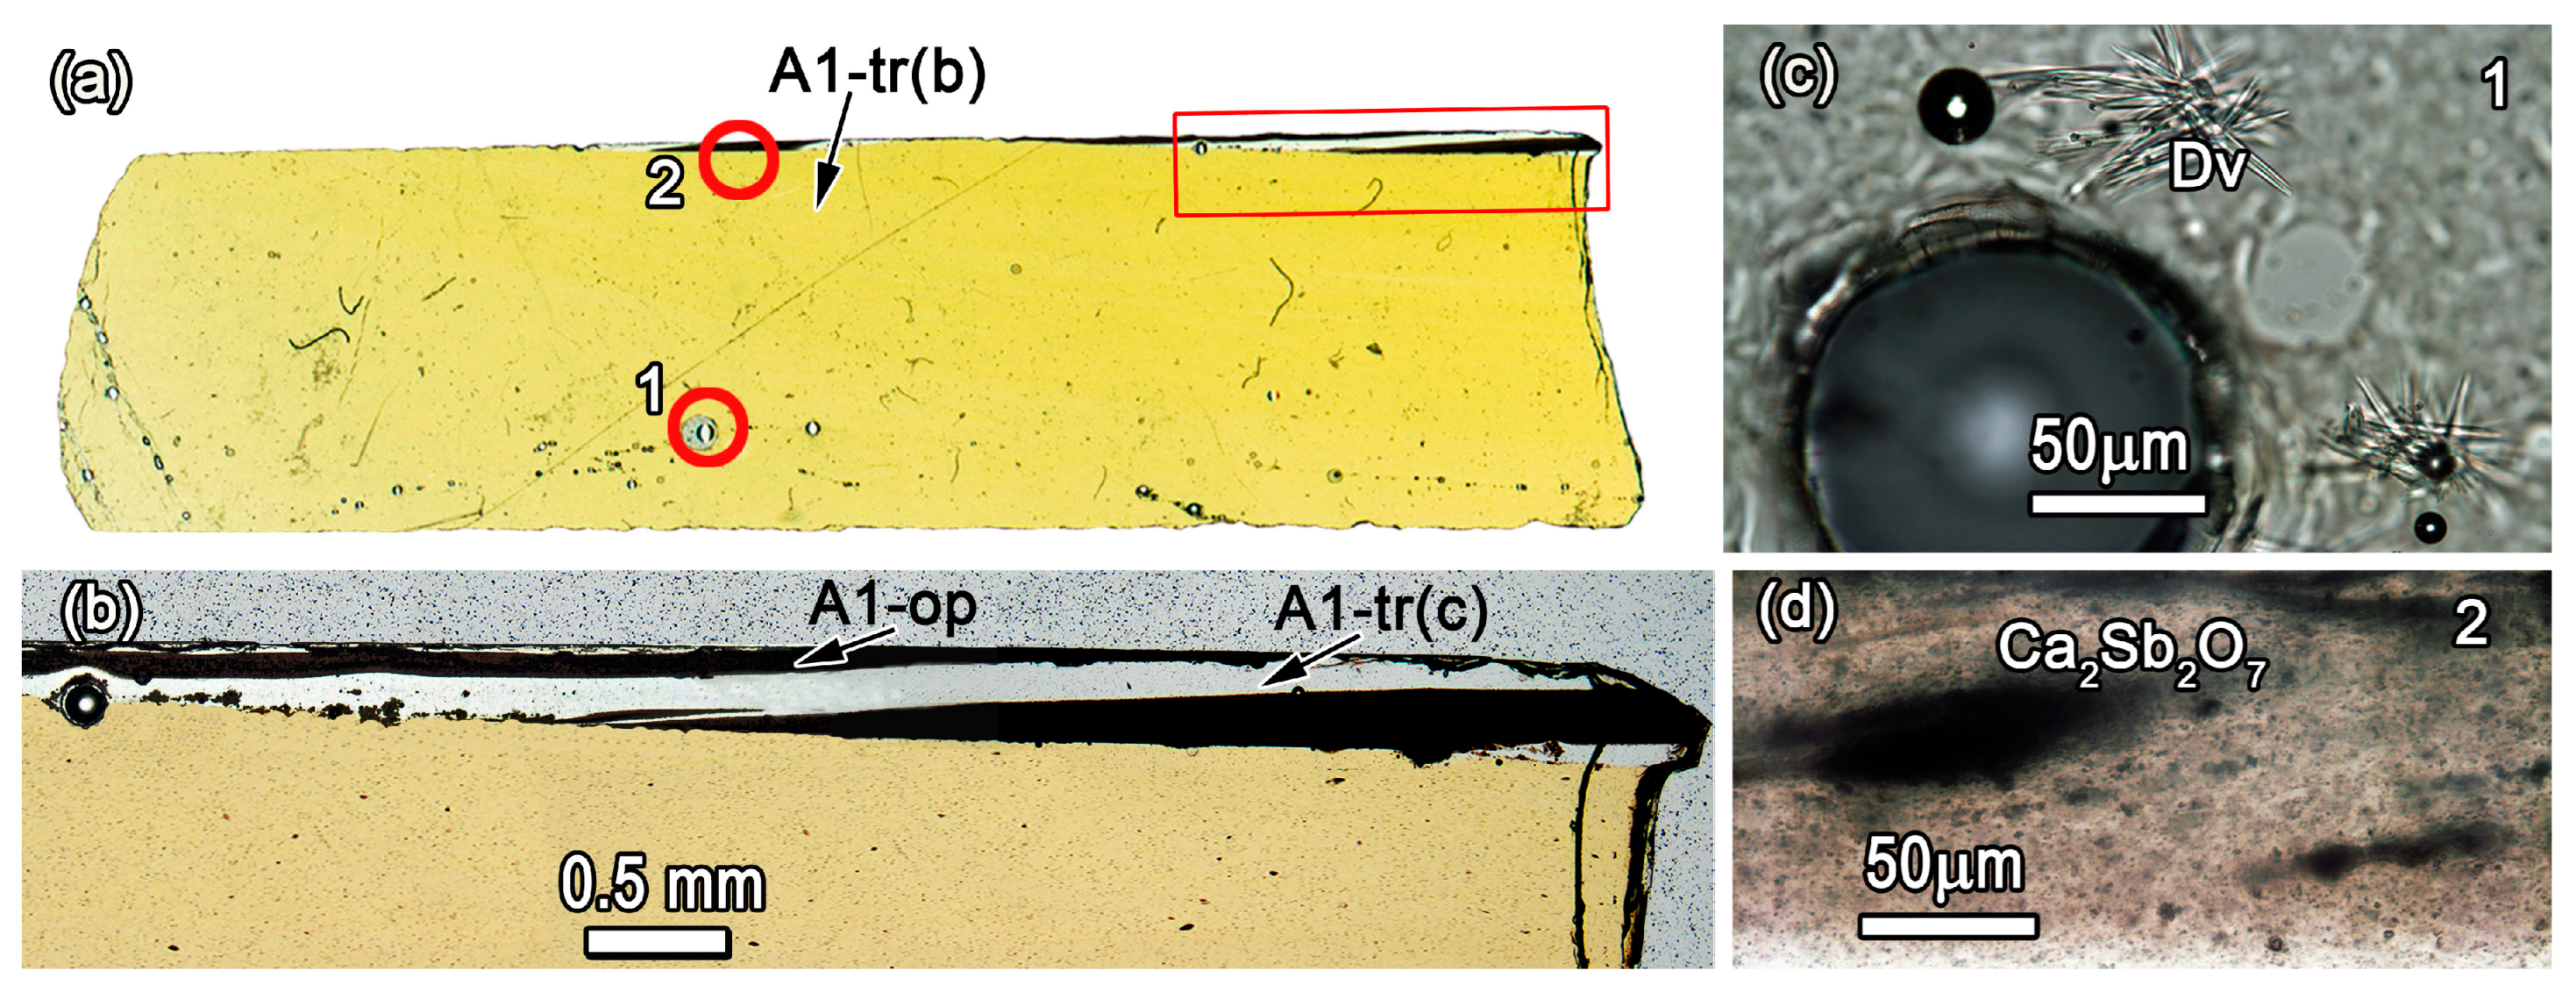
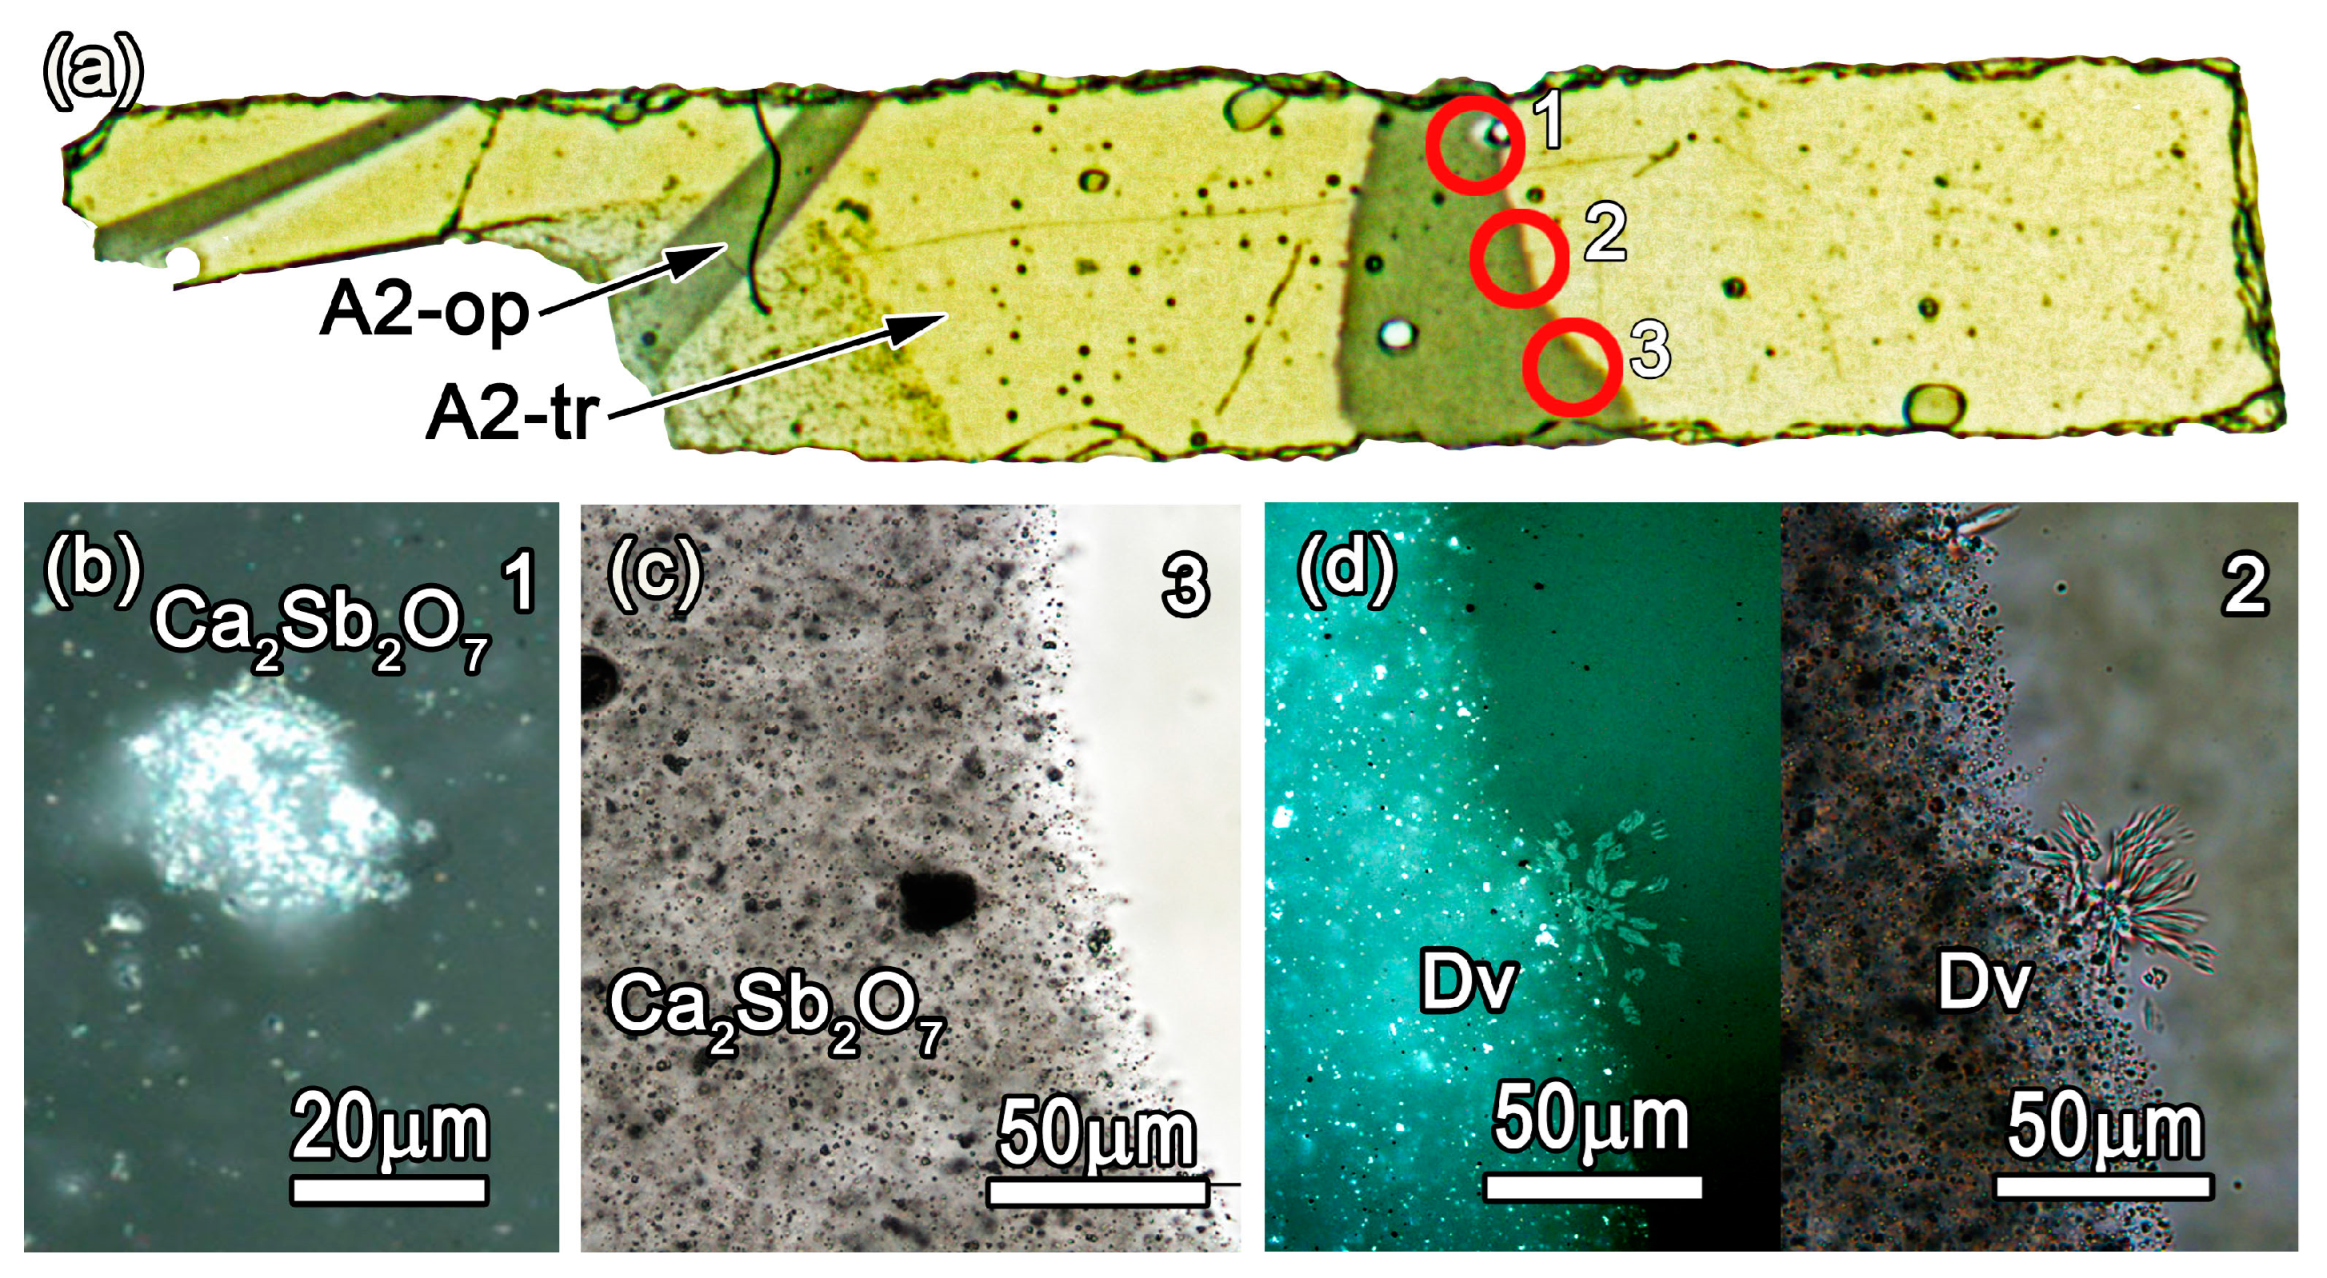
3.2.7. Agate/Alabaster Imitations (Samples A1 and A2)

The studied thin section of sample A1 was cut by mainly crossing the macroscopically brown matrix and the opacified white bands were only superficially sliced (Figure 17a). Under the petrographic microscope, the three different glasses of this sample are clearly observed. The macroscopically brownish transparent glass A1-tr(b) appears yellow in the thin section. The opacified area contains opaque thin layers (A1-op) that are finely separated by equally narrow transparent and colourless bands (A1-tr(c)) (Figure 17b). Both coloured and colourless transparent glasses show very similar chemical compositions, and both contain occasional relict quartz grains and newly formed acicular crystals of devitrite (Na2Ca3Si6O16) (Figure 17c). The two transparent glasses appear identical in the SEM images (Figure S6), but in contrast, they are easily distinguishable in the optical images. The only significant differences, apart from the colour, are the Mn content (markedly present in the colourless glass) and the identification of monoclinic wollastonite in the thin colourless layers. Concerning the opaque strips (A1-op), they contain anhedral crystals that form clumps of stretched clusters of calcium antimonate (Ca2Sb2O7) (Figure 17d), as identified using tts-μXRD.
Regarding sample A2, the prepared thin section displays a transparent light honey matrix corresponding to the macroscopically amber areas (A2-tr) with three opaque strips (A2-op) under the microscope in TL (Figure 18a). These latter strips contain plenty of fine particles and small clusters formed by anhedral/sub-euhedral crystals that correspond again to opacifier calcium antimonate (Ca2Sb2O7) (Figure 18b,c). The transparent area corresponds to a pure glass lacking microcrystals. Very few acicular crystals identified as devitrite (Na2Ca3Si6O16) were found in the interface between the transparent and opaque strips (Figure 18d).
Figure 18. (a) Microphotograph of the scanned polished thin section of sample A2 with indication of its two different glasses (A2-tr and A2-op). Three areas are highlighted in red, corresponding to optical microphotographs of (b) a small Ca-antimonate agglomerate (Ca2Sb2O7), (c) Ca-antimonate particles (Ca2Sb2O7) in one of the opaque bands of the sample, and (d) newly formed devitrite crystals as seen in RL (left) and LT mode (right). Image (b) was obtained in RL and (c) was obtained in TL mode.
Minerals 13 01421 g018
Table 3. Summary of the microcrystalline inclusions identified within the analyzed glasses and classified as relict grains, newly formed crystals and opacifiers. A: antimonate, Di: diopside, Dv: devitrite, Qz: quartz, Fsp: feldspar, Hem: hematite, Nph: nepheline, Sen: senarmontite, Wo (2M): monoclinic wollastonite, Wo (1T): triclinic wollastonite, clays: clay clod, tr: translucent, op: opaque.
GlassRelict GrainsNewly Formed CrystalsOpacifier Crystals
PV1-trWo (2M), clays, Qz, FspWo (2M), Dv-
PV1-opWo (2M), clays, Qz, FspWo (2M), DvPb-Fe A,
PV2-tr-Dv-
PV2-opHem, Qz, Wo (2M)DvPb-Fe A
CR-op(r)Wo (2M), Hem, Qz, claysWo (2M), Wo (1T?)Cu
CR-op(w)Sen-Ca A
R-trWo (2M), Qz, Hem, claysNph, Di-
R-opWo (2M)-Cu
G-opQz, claysDv, Nph, Wo (2M)Pb-Fe A
D-trQz--
D-opQz, claysDv, Wo (2M)Pb-Fe A
S-trQz, Fsp--
S-opQz, FspDvCa A
A1-tr(b)QzDv-
A1-tr(c)QzWo (2M)
A1-op Ca A
A2-tr---
A2-op-DvCa A

4. Discussion

4.1. Glass Compositional Groups and Recycling Markers

Chemical analyses of the studied samples confirmed that they are soda-lime-silica glasses, as expected. However, based on different chemical ratios, including multivariate data analyses and different biplots, the glasses were classified into two categories: (i) pure natron glasses and (ii) glasses with intermediate compositions between natron- and plant-ash-type glasses.
Glasses from samples A1, A2, D, G and S, along with the translucent glass of sample PV2 and the white opaque glass of sample CR, were identified as being produced using natron glass batches. Besides the diagnostic MgO and K2O values, samples belonging to this group also have the characteristic Cl, SO3 and P2O5 concentrations of the natron glasses. Generally, the P2O5 contents in natron glasses are below 0.15 wt%, but this is not the case for sample A2-tr, with a P2O5 content around 0.22 wt%. Relatively high values of P2O5 were found for some dark brown/amber natron glasses by Silvestri et al. [21] and were related to the presence of calcium phosphates as opacifiers. Based on its colour, glass A2-tr can be classified as an amber glass too, and its chemical composition (except for the P2O5 value) matches with the data published by Paynter and Jackson on amber glasses [55]. Nonetheless, A2-tr is a translucent glass with no evidence of opacifiers. Presumably, the higher P values of this sample could be associated with contamination of fuel ash from the furnace.
The rest of the glasses (samples PV1, CR-op(r), R and PV2-op) exhibit intermediate compositions. However, taking into account the fact that R glasses have MgO and K2O values above 2 wt%, these can be considered as having been produced using plant ash as the fluxing agent [56]. In particular, for red glasses, it seems that remnants of carbonaceous matter from plant ashes help to maintain the reducing conditions required to produce them [57]. Previous archaeometric studies on the Gorga Collection already highlighted the presence of red glasses and glassy imitations of the porfido verde antico, gabbro eufotide and cipollino rosso stones based on plant ash as the fluxing agent [18,20]. On the other hand, the white CR-op(w) glass shows the typical very low K2O content (0.25 wt%) of natron glasses but its high MgO values set the sample apart from the natron glass cluster (Figure 3a). The P2O5/K2O ratios seem to confirm the high affinity of this white opaque glass to the natron group. Natron high-magnesium white opaque glasses were identified in Medieval mosaics in Rome [58]. The use of a source of Sb containing Mg or of sand with dolomite (CaMg(CO3)2) was suggested by some authors as a possible explanation for the high MgO values [59]. In addition, high MgO, low P2O5 and K2O concentrations were also found by Tesser et al. [20] in a natron opaque white glass of the giallo antico imitation from the Gorga collection. Regarding the possibility of distinguishing production groups, the natron translucent/transparent glasses (A1-tr(b), A1-tr(c), A2-tr, S-tr, D-tr, PV2-tr) were clearly produced with particularly pure sand based on the petrographic observations. This reinforces the idea that these glasses were not subjected to different recycling sequences. This evidence is also reflected in the plot of Figure 4b, whereby the glasses of three of them (A1, A2 and S) lie clustered together.
We are not able to set out the recipe used for the glasses with hybrid compositions and different possibilities could account for them, e.g., mixing two types of glassy bases or small amounts of potash plant ash added to the natron glass. However, tantalizing information was provided by the characterization of the microcrystals embedded in the glasses. The petrographic inspection highlighted the presence of relict crystals of 2M-wollastonite in all the glasses with mixed composition between the known compositional areas for natron-based and plant-ash-based glasses, including the rosso antico imitation (sample R), which, in practice, is a plant ash glass. All these glasses would have been produced from recycled glasses, as the K2O vs. P2O5 biplot also suggests. Conversely, in the pure natron glasses, relict wollastonite was not found and this would indicate that these were not produced from reused glass. Wollastonite is a calcium-inosilicate mineral that belongs to the pyroxenoid group with two common polytypes: 1T (triclinic) and 2M (monoclinic) wollastonite [60]. In nature, wollastonite is a typical product of the reaction between quartz and calcite in contact metamorphic aureoles developed in impure limestones, while in synthetic products, such as ceramics, glazes and glasses, it is a common phase among white inorganic materials. In particular, wollastonite was described as the predominant newly formed phase in glass batches with a sand:flux ratio of 1:0.2 [61]. The connection between wollastonite and recycled glass is known. For instance, in modern industry, waste glasses are purposely recycled as a precursor for synthesizing wollastonite, which is a mineral receiving increasing interest [62,63,64]. In archaeological studies, glass recycling identification is a pivotal part of understanding the tracks of production, trade, use and reworking. Thus far, their detection has been based on chemical markers, such as elevated levels of certain trace elements not intentionally added or by identifying heterogeneous isotopic compositions [65,66,67]. However, a much more compelling indicator of recycling is the presence of relict wollastonite grains that could be used as a petrographic marker for both colourless and coloured glasses. If this hypothesis is workable, primary glass should contain only newly formed wollastonite, but not in the form of relict grains. The systematic remelting of the glass through recycling would produce glass with both relict and newly formed wollastonite crystals.

4.2. Production Practices and Different Versions of a Given Imitated Stone

Glass differences concern not only distinct samples but, in some cases, also the glasses fused in a given sample. In particular, the glasses of two samples, namely, CR (cipollino rosso) and PV2 (porfido verde), were produced by fusing a natron glass (CR-op(w) and PV2-tr) and a mixed-composition glass (CR-op(r) and PV2-op). Moreover, a given imitated stone could be produced using various types of glasses. For instance, the translucent PV1-tr glass from the other studied porfido verde imitation is not a natron-type glass but a glass with an intermediate composition. Tesser et al. [20] also reported differences between the porfido verde glass imitations, and the comparison between other stone imitations studied by Tesser et al. and our samples indicate divergences for certain stones [20]. On the one hand, the cipollino rosso analyzed by Tesser et al. [20] resulted from the fusion of a natron white glass and a red plant ash glass conversely to our red CR-op(r) glass, which is a recycled, mixed composition-based glass. On the other hand, the two rosso antico imitations characterized by Tesser et al. [20] correspond to the so-called “sealing wax” type [48] and they are rich in copper (CuO 7.90%–8.30%) and lead oxide (PbO 32.0%–36.0%). In contrast, the R sample studied here contains low Cu and low Pb, is duller than the “sealing wax” type and contains small particles of metallic copper. In this R sample, besides the red matrix (R-op), macroscopically dark transparent veins (R-tr) also appear, contributing to the marbled effect. Similar veins were described in red glasses (not stone imitations) from the Gorga collection studied by Bandiera et al. [18]. No compositional differences between the veins and the red layers were found by the authors and, therefore, these were interpreted as the result of inadequate redox conditions in some areas of the melt in such a way that Cu dissolved in the glass in the form of Cu+ ions. In the thin section, the R-tr glass seems to have a distinct texture with newly formed microcrystal inclusions (nepheline and diopside) and relict grains (quartz, hematite and clay clusters) that were not found in the red matrix. Furthermore, the red matrix (Figure 13c,d) moulds around the relict wollastonite, indicating that these calcium silicate grains pre-existed in the veins. If this is so, then the transparent veins would correspond to a different recycled glass. These veins contained Cu and Pb in a lower concentration compared with the red matrix and their actual concentration could even be lower, as the measured values could have been affected by the nearness of the red matrix.
More discrepancies for a given imitated stone concern the use of opacifiers in the PV samples. In both opacified glasses (PV1-op and PV2-op), yellow Pb-Fe antimonate was identified. The corresponding colours are slightly different, with light green and greenish-yellowish, respectively, and the method to achieve coloured opacification appear to be peculiar. In glass PV1-op, Pb-Fe antimonate is associated with very abundant devitrite and wollastonite crystals. In this glass, the yellow colour provided by the Pb-Fe antimonates seems to have been counteracted by the nucleation of very small and abundant white wollastonite crystals. In this way, the final result mimicks very well the appearance of the porfido verde variety bearing light green phenocrystals embedded in a darker green crypto-crystalline groundmass. In contrast, in the greenish-yellow of glass PV2-op, the abundance of quartz and, in particular, hematite relict grains is striking, suggesting that their presence could be deliberate. As iron oxides readily dissolve in glass melt, their existence would imply a very short firing cycle confirmed by the abundance of quartz relicts. The addition of hematite grains directly to the glass melt might have promoted a stronger colour and quartz grains could also contribute to the opacification effect [44,68].
In reference to Pb-Fe antimonates, besides opacified PV glasses, they were also found in the yellow glasses G-op and D-op. It is worth mentioning that these are truly Fe-bearing Pb antimonates, as verified both by chemical and structural analyses (and not pure Pb antimonates). Their measured chemical average composition is ~61.93 wt% PbO, 32.14 wt% Sb2O5 and 5.92 wt% FeO, and the diffraction patterns fit very well with the reference pattern for Pb2Fe0.5Sb1.5O6.5 (see Figure 8c). The corresponding Raman vibrational spectrum (Figure 9) shows comparable modifications to other yellow lead antimonates doped with Sn and Zn [69]. In particular, the main modifications concern the wavenumber of the Pb-O lattice mode found at 110 cm−1 that shifts to a higher value (147 cm−1) and the characteristic peak at 510 cm−1 corresponding to the Sb-O lattice mode that moves to 515 cm−1. Some authors suggested that Fe could help to produce a stronger yellow pigment in this Pb-antimonate with cubic pyrochlore structure [70]. It is, however, difficult to assert whether this extra Fe was intentionally added or was simply the result of an Fe source contamination (for instance, pyrite mixed with the source of Sb). In fact, the only strictly yellow glasses are those corresponding to the giallo antico (G-op) and the diapro nero e giallo (D-op) imitations. This yellow pigment and opacifier is usually considered to be pre-formed (ex situ) and then added to the glass melt mixed with silica, similarly to the anime used in Venetian yellow glasses (18th–19th centuries) [71]. The presence of antimonate microcrystals with anhedral morphologies and forming rosary-shaped aggregates (see, e.g., Figure 14e,f and Figure 15d,e) support the pre-formation hypothesis [44]. However, sub-euhedral and euhedral antimonates are also present, although these could have dissolved and reprecipitated later. In contrast, a certain correlation of Sb with S points towards in situ production using stibnite (Sb2S3) as a source of Sb.
The correlation between Sb and S is even clearer for glasses opacified with white Ca-antimonates (A1-op, A2op, S-op and CR-op(w)), suggesting the simultaneous production of the glass and the opacifier using stibnite (Sb2S3). Whilst stibnite (Sb2S3) is the primary antimony ore, senarmontite (Sb2O3), which was found in CR-op(w) (Figure 9e), is the cubic low-temperature form of antimony trioxide. Nonetheless, we are not able to confirm whether the sulphide mineral had been roasted before being added to the glass or added in its raw form. Some authors suggested that low absolute concentrations of SO3 (<1 wt%), as in the glasses studied here, could be unrelated to the use of sulphides but instead due to natural impurities [72]. Even so, Foster and Jackson, in experimental white glass reproductions, ended up with glasses bearing only about 0.6 SO3 wt% using stibnite (Sb2S3) [73]. The presence of senarmontite does not really imply its use in the glass recipe; the heat and oxidizing conditions in the melt could have produced the oxidation of stibnite in the batch before reacting to form the antimonates and occasionally, unreacted Sb2O3 could remain trapped in the glass. Also, the absence of rosary-shaped aggregates for Ca-antimonates suggests in situ formation. Besides Sb and S, it is worth mentioning the variable Pb content in white glasses (CR-op(w), S-op, A1-op and A2-op) and the particularly high values in S-op (~13 wt%). This high level of Pb is difficult to explain but it could be related to the use of an ore rich in Pb and Sb [70]. Similarly, high Pb concentrations were reported for white glass pieces in mosaic vessels dated to the first century AD [70,74]. To finish, some differences concerning the production of glass imitations A1 and A2 are discussed. Both samples share the same type of opacifier for the white bands (Ca antimonate). However, sample A1 appears more elaborate, requiring the combination of three different glasses. The thin white opacified layers of the A1 imitation were actually prepared as sandwiched between transparent layers. Later, the corresponding murrines were mixed into the brown transparent glass, creating a rich variety of shades of brown. It is worth noting that the two transparent glasses appeared almost undistinguishable using SEM images, while they were easily discriminated using optical images. In contrast with the complex A1 sample, the A2 imitation would have been made as a simple mixture of opacified glass and amber glass. Additionally, divergencies are also related to the respective coloured glasses for these agate/alabaster imitations. A1-tr is darker (brownish) whilst A2-tr is lighter (amber). However, the compositions of both glasses fit with published data on amber glasses [55]. The amber colour was described as being produced by a combination of Fe and S, which form a ferric-sulphide chromophore Fe3+-S2− in a reducing atmosphere [51]. In spite of the low Fe and S concentrations in these glasses, the values are well within the known effective range for obtaining the amber colour, where too high of a Fe concentration can result in dark or olive tones [55]. Paradoxically, the Fe concentration is slightly higher for the glass with a lighter colour (A2-tr), but this could be explained by the certain amount of Mn (0.32 wt%), which is almost not present in the brown A1-tr glass, that could act as a decolouring agent in A2-tr.

4.3. Working Temperatures

Apart from relict crystals, wollastonite-2M was also found as newly formed crystals in some glasses and its presence can be used to speculate about the glass working temperatures. Along this line, Almasri et al. studied the physical, structural and optical properties of wollastonite in waste soda lime silica glasses [64]. They found that at 800 °C, the nucleation of the triclinic phase (1T) and small amounts of nepheline (NaAlSiO4) started. Increasing the temperature to 900 °C and above, the monoclinic phase (2M) is formed with nepheline. Please note that this mineral association was found in sample G. With sintering temperatures above 1000 °C, the only phase that remains is 2M. Mazzucato and Gualtieri also carried out experiments on the crystallization of wollastonite from a CaO-SiO2 glass [75]. They found that crystallisation of the 1T polytype at 900 °C is followed by a partial transition into a metastable disordered 1Td phase, and lastly, both 1T and 1Td phases transform into monoclinic wollastonite (2M) at 950 °C. At 1000–1100 °C, wollastonite-2M is clearly the prevailing polytype. Then, the presence of devitrification wollastonite crystals in glasses PV1-tr, PV1-op, R-op, G-op, D-op and A1-tr(c) suggests working temperatures within the range of 900–1100 °C. Such temperatures agree with data on Roman glass technology [61]. The production of glass from primary sources required higher temperatures compared with those for remelted glass. Experiments of high-temperature viscosity carried out on 1st–2nd century AD Roman blue-green bottle glass fragments from Coppergate (York) suggest temperatures of ∼1000–1150 °C to reshape glasses and provide suitable viscosities for forming articles [76].
Opacifiers can also provide information on the working temperatures. On the one hand, yellow Pb-Fe antimonates are stable up to a temperature of about 1100 °C [17], setting a similar maximum working temperature for the glasses with this kind of opacifier (PV1-op, PV2-op, G-op and D-op). On the other hand, the Ca-antimonates found in opacified white glasses (A1-op, A2op, S-op and CR-op(w)) are always in the form of the orthorhombic phase (Ca2Sb2O7), with the only exception being the CR-op(w) glass, where the hexagonal (CaSb2O6) also appeared. Assuming an in situ formation of these Ca-antimonates and according to experimental studies [52], the absence of hexagonal CaSb2O6 would indicate working temperatures below 927 °C. In contrast, the coexistence of both hexagonal and orthorhombic antimonates would constrain the temperature to within 927–1094 °C for glass CR-op. Even so, in the case of ex situ preparation using limestone and roasted stibnite, the temperatures could not follow this logic; see, for instance, [77,78].

5. Conclusions

Nine glass sectilia from the Gorga collection were intensely investigated, both chemically and mineralogically, providing an insight into the refined Roman (second century AD) glassmaking technology. The combination and fusion of preformed canes, along with chromatic variations, contributed to enhancing the closeness of these glass sectilia to similar lapidary pieces. In this way, the technology and technical skills of glassworkers were used to meet new market demands, either through a mere interpretation of the model in stone or through a certain creative and interpretive freedom. Two types of glasses were found: pure natron glasses (samples A1, A2, D, G, S) and glasses with intermediate composition between natron and plant ash glasses (samples PV1 and R, with the latter almost purely plant ash glass). The remaining two samples (PV2 and CR) appear to combine the natron-type (PV2-tr and CR-op(w)) with intermediate (PV2-op and CR-op(r)) glasses.
Mixed-glass compositions are known to be the result of recycling, i.e., remelting and mixing glasses, to make a new one. Relict wollastonite crystals were identified systematically in the glasses of hybrid composition and not in pure natron glasses. Hence, relict wollastonite can be used as a petrographic marker, in addition to the chemical signatures, to spot recycled glasses. Relict wollastonite should not be rare in glasses, as recycling was a very common practice in the Roman times, and not only. Nonetheless, in the literature, the relict nature of wollastonite is never mentioned. Only a deep textural study of the glass matrices (including a basic petrographic inspection) enables the morphological distinction between relict and newly formed wollastonite. Different production and colouring techniques were identified, including the combination of distinct base glass compositions. Even various colouring techniques were used for the production of a given imitation stone, as revealed by analyses of samples of agate/alabaster (A) and porfido verde antico (PV) imitations. This agrees with the results obtained by Tesser et al. [20], who also found divergences in the production technique of different porfido verde glasses. Additionally, the comparison between the rosso antico and cipollino rosso analyzed in [20] and our samples R and CR also revealed variety in the manufacturing technology. The identification of different methods to manufacture the same type of stone imitation would suggest the existence of various secondary workshops, where the primary glass was remelted and worked. However, a given secondary workshop could also be using different procedures. Regarding opacification processes, three main techniques were identified: metallic copper (for red glasses), Ca antimonate (for white glasses) and Pb-Fe antimonate (for yellow, light green and greenish-yellowish glasses). The in situ formation of the opacifier was obvious for the red glasses and seems reasonable for Ca-antimonate. In contrast, the ex situ preparation of Pb-Fe antimonate appears more probable. In a particular glass (PV1-op), the role of wollastonite as a white pigment also appears relevant.
Based on the presence/absence of the crystalline phases and their known stability ranges, it was possible to constrain the working temperatures for the glasses, which are always within the 900–1100 °C range. The lower working temperatures correspond to white glasses containing only orthorhombic Ca2Sb2O7 (A1-op, A2-op and S-op) whilst another white opacified glass (CR-op(w)) would have been worked at a slightly higher temperature (927–1094 °C). Newly formed wollastonite indicates working temperatures above 1000 °C for some other glasses (PV1-tr, PV1-op, CR-op(r), D-op and A1-tr(c)) and its coexistence with nepheline indicates a 900–1000 °C range for the G-op glass.
This study showed the advantages of a different approach to the study of glasses not solely based on chemical analyses but including an intensive petrographic and analytic characterization of microcrystalline glass inclusions using polished thin sections. It would have been unfeasible to achieve a similar amount of information on the raw materials, temperatures and technology of production without the use of thin section samples. The strengths of the presented approach include local structural identification, a distinction between relict and newly formed phases, and textural analyses of the glasses. By highlighting the importance of thin-section petrography to glass studies and showing how it can greatly enhance interpretations, this paper will hopefully serve to spur more archaeological chemists to either learn this technique or collaborate with trained and experienced scientists in thin-section petrography.

Supplementary Materials

The following supporting information can be downloaded from https://www.mdpi.com/article/10.3390/min13111421/s1. Figure S1. Macroscopic pictures of the stones imitated by the studied glasses. (a) porfido verde antico, (b) cipollino rosso, (c) giallo antico, (d) rosso antico, (e) semesanto, (f) alabaster, (g) agate. Pictures a, b, c, e, f from the Earth Sciences Museum of the University of Bari (Italy) [32]; pictures d, g from the stone collection at the Universitat Autònoma de Barcelona (Spain). Figure S2. Microphotographs of the scanned polished thin sections of the studied glass samples named after their corresponding imitated stone: (a) PV1, porfido verde antico; (b) S, semesanto; (c) R, rosso antico; (d) G, giallo antico; (e) A1 and (f) A2, both imitations of agate or alabaster; (g) R, cipollino rosso brecciato; (h) D, diaspro nero e giallo; (i) PV2, another version of porfido verde antico. All the images share the same scale, except the zoomed area in (e). The different analysed glasses have been indicated according to their identification label used in the article. Please note that in these transmitted light scans, transparent glasses tend to appear white whilst opaque glasses tend to appear dark. Figure S3. Multivariate chemical data analyses of the studied glasses. (a) Standardized PCA biplot of factor scores for the first two principal components, some samples have been encircled. Inset: PCA biplot of the original compositional variables. (b) HCA dendrogram computed using Euclidean distance and Ward’s linkage method. tr: translucent/transparent; op: opaque. Figure S4. The SO3 vs. Sb2O3 diagram for the analysed glasses, showing a positive correlation. Figure S5. Different examples of SEM backscattering images of Pb-Fe antimonate crystals in the opaque glasses PV1-op (a,b,c) and PV2-op (d), displaying different idiomorphic degrees. Figure S6. SEM backscattering images of the different glasses in A1 sample, A1-tr(b) and A1-tr(c) appear indistinguishable. Table S1. Measured chemical composition obtained by EMP and known values of Corning B [38]. Table S2. Average reduced compositions for each analytical sample as determined by EMP analyses. Cations are expressed in wt% of arbitrary oxides.

Author Contributions

Conceptualization, R.D.F.; sampling, C.G., G.B. and R.D.F.; experimental work: petrography, R.D.F.; SEM-EDS analyses, R.D.F.; EMP analyses, R.D.F.; EDXRF analyses, I.Q.; tts-µXRD analyses, O.V., J.R., R.D.F. and L.C.; µ-Raman analyses, Á.A.d.C. and R.D.F.; FIB preparation, M.V. and J.G.; TEM analyses, J.O.; statistical analyses of geochemical data, L.C.; writing—original draft preparation, R.D.F. and L.C.; comprehensive discussion of results, R.D.F., L.C. and A.S., writing—review and editing, all authors. All authors read and agreed to the published version of the manuscript.

Funding

IDAEA-CSIC is a Centre of Excellence Severo Ochoa (Spanish Ministry of Science and Innovation, Project CEX2018-000794-S). This research was partially funded by the Spanish Ministry of Economía, Industria y Competitividad, grant MAT2015-67593-P.

Data Availability Statement

Most of the data presented in this study have been made publicly available. Any other data are available on request from the corresponding author.

Acknowledgments

We are indebted to the Museo Nazionale Romano for supporting this study and granting permission to sample the Gorga glasses. We are also grateful to the University of Padua, in particular to Leonardo Tauro (Laboratorio Sezioni sottili e Sezioni lucide) and Stefano Castelli (Laboratorio di Fotografia e 3D). Many thanks to Giancarlo Catena who helped with art insurance issues. Also, we would like to express our deepest appreciation to illustrator Ricard Zaplana for drawing a fabulous graphical abstract. Finally, we would like to thank the editor as well as the anonymous reviewers for their valuable remarks and comments.

Conflicts of Interest

The authors declare no conflict of interest.

References

  1. Vickers, M. Surface Colour Transfer from Metal, Ivory and Stone to Ceramic and Glass. MRS Online Proc. Libr. 1995, 352, 189–199. [Google Scholar] [CrossRef]
  2. Flecker, M. An Age of Intermateriality: Skeuomorphism and Intermateriality between the Late Republic and Early Empire. In Aesthetics, Semantics and Function; Haug, A., Hielscher, A., Lauritsen, M.T., Eds.; De Gruyter: Berlin, Germany; Boston, MA, USA, 2022; pp. 264–282. ISBN 9783110764734. [Google Scholar]
  3. Engels, B. Roman Basket urns as Elements in a Transmaterial Design System. In Aesthetics, Semantics and Function; Haug, A., Hielscher, A., Lauritsen, M.T., Eds.; De Gruyter: Berlin, Germany; Boston, MA, USA, 2022; pp. 244–263. ISBN 9783110764734. [Google Scholar]
  4. Hielscher, A. Four-Legged Marble Tables (Mensae) in Pompeian Houses: The Intersection of Function, Aesthetics and Semantics. In Aesthetics, Semantics and Function; Haug, A., Hielscher, A., Lauritsen, M.T., Eds.; De Gruyter: Berlin, Germany; Boston, MA, USA, 2022; pp. 182–201. ISBN 9783110764734. [Google Scholar]
  5. Strässle, T. Einleitung: Pluralis Materialitatis. In Theorien—Praktiken—Perspektiven; Strässle, T., Kleinschmidt, C., Mohs, J., Eds.; Transcript Verlag: Bielefeld, Germany, 2013; pp. 7–24. ISBN 9783839422649. [Google Scholar]
  6. Löbbing, J.-P. The Concept of Skeuomorphism and the Spread of Glass Vessels in the Augustan Period. In Tarraco Biennal. August i les Províncies Occidentals. 2000 Aniversari de la Mort d’August. Actes del 2on Congrés Internacional d’Arqueologia i Món Antic; Fundació Privada Mútua Catalana: Tarragona, Spain, 2015; pp. 105–111. [Google Scholar]
  7. Bacchelli, B.; Pasqualucci, R.; Mastrodonato, V. Glass in Interior Decoration and Furniture in the Roman Imperial Period. In Annales du 14e Congrès de l’Association Internationale pour l’Histoire du Verre (Venezia-Milano 1998); AIHV: Lochem, The Netherlands, 2000; pp. 86–88. [Google Scholar]
  8. Cisneros, M. El Empleo Privado del Mármol en el Valle del Ebro: La Colonia Victrix Ivlia Lepida-Celsa (Velilla de Ebro, Zaragoza). Caesaraugusta 1998, 74, 13–36. [Google Scholar]
  9. Goldstein, S.M. Pre-Roman and Early Roman Glass in the Corning Museum of Glass; Corning Museum of Glass: Corning, NY, USA, 1979. [Google Scholar]
  10. Brill, R.; Ibrahim, L.; Scranton, R. Kenchreai, Eastern Port of Corinth: Results of Investigations by the University of Chicago and Indiana University for the American School of Classical Studies at Athens II. The Panels of “opus Sectile” in Glass; Brill: Leiden, The Netherlands, 1976. [Google Scholar]
  11. Grose, D.F. The Toledo Museum of Art, Early Ancient Glass: Core-Formed, Rod-Formed, and Cast Vessels and Objects from the Late Bronze Age to the Early Roman Empire, 1600 BC to AD 50; Hudson Hills Press in association with the Toledo Museum of Art: New York, NY, USA, 1989. [Google Scholar]
  12. Saguì, L. Vetri. In Evan Gorga. La Collezione di Archeologia; Museo Nazionale Romano: Milan, Italy, 2013; pp. 418–440. [Google Scholar]
  13. Saguì, L.; Bacchelli, B.; Pasqualucci, R. Un Patrimoine Unique Au Monde. Les Verres de La Collection Gorga. In Proceedings of the Annales du 13e Congrès de l’Association Internationale pour l’Histoire du Verre (Pays Bas 1995), Amsterdam, Rotterdam, Leiden, the Hague, Leerdam, Nijmegen, The Netherlands, 28 August–1 September 1995; Association Internationale pour l’histoire du verre: Lochem, The Netherlands, 1996; pp. 213–224. [Google Scholar]
  14. Cagiano de Azevedo, E. Evan Gorga. Dalla Collezione Ai Musei. In Evan Gorga. La Collezione di Archeologia; Museo Nazionale Romano: Milan, Italy, 2013; pp. 28–43. [Google Scholar]
  15. Bruni, S. L’acquisizione Della Collezione Gorga Da Parte Dello Stato: L’inventariazione. In Evan Gorga. La Collezione di Archeologia; Museo Nazionale Romano: Milan, Italy, 2013; pp. 44–58. [Google Scholar]
  16. Rustico, L. L’impegno Dell’Amministrazione Dopo Il 1950. In Evan Gorga. La Collezione di Archeologia; Museo Nazionale Romano: Milan, Italy, 2013; pp. 59–71. [Google Scholar]
  17. Verità, M.; Maggetti, M.; Saguì, L.; Santopadre, P. Colors of Roman Glass: An Investigation of the Yellow Sectilia in the Gorga Collection. J. Glass Stud. 2013, 55, 39–52. [Google Scholar]
  18. Bandiera, M.; Verità, M.; Lehuédé, P.; Vilarigues, M. The Technology of Copper-Based Red Glass Sectilia from the 2nd Century AD Lucius Verus Villa in Rome. Minerals 2020, 10, 875. [Google Scholar] [CrossRef]
  19. Bandiera, M.; Lehuédé, P.; Verità, M.; Alves, L.; Biron, I.; Vilarigues, M. Nanotechnology in Roman Opaque Red Glass from the 2nd Century AD. Archaeometric Investigation in Red Sectilia from the Decoration of the Lucius Verus Villa in Rome. Heritage 2019, 2, 2597–2611. [Google Scholar] [CrossRef]
  20. Tesser, E.; Verità, M.; Lazzarini, L.; Falcone, R.; Saguì, L.; Antonelli, F. Glass in Imitation of Exotic Marbles: An Analytical Investigation of 2nd Century AD Roman Sectilia from the Gorga Collection. J. Cult. Herit. 2020, 42, 202–212. [Google Scholar] [CrossRef]
  21. Silvestri, A.; Tonietto, S.; Molin, G.; Guerriero, P. The Palaeo-Christian Glass Mosaic of St. Prosdocimus (Padova, Italy): Archaeometric Characterisation of Tesserae with Antimony- or Phosphorus-Based Opacifiers. J. Archaeol. Sci. 2012, 39, 2177–2190. [Google Scholar] [CrossRef]
  22. Di Febo, R.; Casas, L.; Rius, J.; Tagliapietra, R.; Melgarejo, J.C. Breaking Preconceptions: Thin Section Petrography for Ceramic Glaze Microstructures. Minerals 2019, 9, 113. [Google Scholar] [CrossRef]
  23. Cotte, M.; Walter, P.; Tsoucaris, G.; Dumas, P. Studying Skin of an Egyptian Mummy by Infrared Microscopy. Vib. Spectrosc. 2005, 38, 159–167. [Google Scholar] [CrossRef]
  24. Bertrand, L.; Vichi, A.; Doucet, J.; Walter, P.; Blanchard, P. The Fate of Archaeological Keratin Fibres in a Temperate Burial Context: Microtaphonomy Study of Hairs from Marie de Bretagne (15th c., Orléans, France). J. Archaeol. Sci. 2014, 42, 487–499. [Google Scholar] [CrossRef]
  25. Lebon, M.; Müller, K.; Bahain, J.-J.; Fröhlich, F.; Falguères, C.; Bertrand, L.; Sandt, C.; Reiche, I. Imaging Fossil Bone Alterations at the Microscale by SR-FTIR Microspectroscopy. J. Anal. At. Spectrom. 2011, 26, 922–929. [Google Scholar] [CrossRef]
  26. Di Febo, R.; Casas, L.; del Campo, Á.A.; Rius, J.; Vallcorba, O.; Melgarejo, J.C.; Capelli, C. Recognizing and Understanding Silica-Polymorph Microcrystals in Ceramic Glazes. J. Eur. Ceram. Soc. 2020, 40, 6188–6199. [Google Scholar] [CrossRef]
  27. Di Febo, R.; Molera, J.; Pradell, T.; Vallcorba, O.; Melgarejo, J.C.; Capelli, C. Thin-Section Petrography and SR-µXRD for the Identification of Micro-Crystallites in the Brown Decorations of Ceramic Lead Glazes. Eur. J. Mineral. 2017, 29, 861–870. [Google Scholar] [CrossRef]
  28. Echard, J.-P.; Bertrand, L.; von Bohlen, A.; Le Hô, A.-S.; Paris, C.; Bellot-Gurlet, L.; Soulier, B.; Lattuati-Derieux, A.; Thao, S.; Robinet, L.; et al. The Nature of the Extraordinary Finish of Stradivari’s Instruments. Angew. Chem. Int. Ed. 2010, 49, 197–201. [Google Scholar] [CrossRef] [PubMed]
  29. Bacchelli, B.; Barbera, M.; Pasqualucci, R.; Saguì, L. Nuove Scoperte Sulla Provenienza Dei Pannelli in Opus Sectile Vitreo Della Collezione Gorga. In Atti del II Colloquio dell’Associazione Italiana per los Studio e la Conservazione del Mosaico (Roma, 1994); Bragantini, I., Guidobaldi, F., Eds.; Corning Museum of Glass: Corning, NY, USA, 1995; pp. 447–466. [Google Scholar]
  30. Caserta, E. La Villa Di Lucio Vero Sulla Via Cassia a Roma in Località Acquatraversa. J. Rom. Archaeol. 2015, 28, 179–191. [Google Scholar] [CrossRef]
  31. Saguì, L. Storie al Caleidoscopio. In I Vetri Della Collezione Gorga: Un Patrimonio Ritrovato; All’insegna del Giglio: Florence, Italy, 1998. [Google Scholar]
  32. Fioretti, G.; Acquafredda, P.; Monno, A.; Montenegro, V.; Francescangeli, R. Roman Marble Collections in the Earth Sciences Museum of the University of Bari (Italy): A Valuable Heritage to Support Provenance Studies. Heritage 2023, 6, 4054–4071. [Google Scholar] [CrossRef]
  33. Lazzarini, L. Poikiloi Lithoi, Versiculores Maculae: I Marmi Colorati Della Grecia Antica. In Storia, Uso, Diffusione, Cave, Geologia, Caratterizzazione Scientifica, Archeometria, Deterioramento; Fabrizio Serra Editore: Rome, Italy, 2007. [Google Scholar]
  34. Andreoli, A.; Berti, F.; Lazzarini, L.; Pierobon Benoit, R. New Contributions on Marmor Iassense. In ASMOSIA VI, Interdisciplinary Studies on Ancient Stones; Lazzarini, L., Ed.; Aldo Ausilio Editore: Padua, Italy, 2002; pp. 13–18. [Google Scholar]
  35. Gnoli, R. Marmora Romana; Edizioni dell’Elefante: Rome, Italy, 1998. [Google Scholar]
  36. Pullen, H.W. Handbook of Ancient Roman Marbles; Gangemi Editore: Rome, Italy, 2018. [Google Scholar]
  37. Vicenzi, E.P.; Eggins, S.; Logan, A.; Wysoczanski, R. Microbeam Characterization of Corning Archeological Reference Glasses: New Additions to the Smithsonian Microbeam Standard Collection. J. Res. Natl. Instig. Stand. Technol. 2002, 107, 719–727. [Google Scholar] [CrossRef]
  38. Brill, R. Chemical Analyses of Early Glasses; Corning Museum of Glass: Corning, NY, USA, 1999; Volume 2. [Google Scholar]
  39. Roessiger, V.; Nensel, B. Analysis of Layers. In Handbook of Practical X-ray Fluorescence Analysis; Beckhoff, B., Kanngiesser, B., Langhoff, N., Wedell, R., Wolff, H., Eds.; Springer: Berlin/Heidelberg, Germany, 2006; pp. 554–600. [Google Scholar]
  40. Vallcorba, O.; Rius, J. D2Dplot: 2D X-Ray Diffraction Data Processing and Analysis for through-the-Substrate Microdiffraction. J. Appl. Crystallogr. 2019, 52, 478–484. [Google Scholar] [CrossRef]
  41. Sayre, E.V.; Smith, R.W. Compositional Categories of Ancient Glass. Science 1961, 133, 1824–1826. [Google Scholar] [CrossRef]
  42. Freestone, I.; Gorin-Rosen, Y.; Hughes, M.J. Primary Glass from Israel and the Production of Glass in Late Antiquity and the Early Islamic Period. Route Verre 2000, 33, 65–83. [Google Scholar]
  43. Schibille, N.; Sterrett-Krause, A.; Freestone, I.C. Glass Groups, Glass Supply and Recycling in Late Roman Carthage. Archaeol. Anthr. Sci. 2017, 9, 1223–1241. [Google Scholar] [CrossRef]
  44. Maltoni, S.; Silvestri, A. A Mosaic of Colors: Investigating Production Technologies of Roman Glass Tesserae from Northeastern Italy. Minerals 2018, 8, 255. [Google Scholar] [CrossRef]
  45. Boschetti, C.; Henderson, J.; Evans, J.; Leonelli, C. Mosaic Tesserae from Italy and the Production of Mediterranean Coloured Glass (4rd Century BCE–4th Century CE). Part I: Chemical Composition and Technology. J Archaeol. Sci. Rep. 2016, 7, 303–311. [Google Scholar] [CrossRef]
  46. Freestone, I. Glass Production in the First Millennium CE: A Compositional Perspective. In Glas und Glasproduktion in Ur- und Frühgeschichtlicher Zeit; Klimscha, F., Karlsen, H.J., Hansen, S., Renn, J., Eds.; Edition TOPOI: Berlin, Germany, 2016. [Google Scholar]
  47. Ricciardi, P.; Colomban, P.; Tournié, A.; Macchiarola, M.; Ayed, N. A Non-Invasive Study of Roman Age Mosaic Glass Tesserae by Means of Raman Spectroscopy. J. Archaeol. Sci. 2009, 36, 2551–2559. [Google Scholar] [CrossRef]
  48. Freestone, I. Composition and Microstructure of Early Opaque Red Glass. Early Vitr. Mater. 1987, 56, 173–191. [Google Scholar]
  49. Nassau, K. The Physics and Chemistry of Color: The Fifteen Causes of Color, 2nd ed.; Wiley-Interscience: New York, NY, USA, 2001. [Google Scholar]
  50. İyiel, A.; Öktem, D.; Akmaz, F. Parameters Affecting the Color Mechanism of Manganese Containing Colored Glasses. J. Chem. Chem. Eng. 2014, 8, 849–858. [Google Scholar]
  51. Meulebroeck, W.; Cosyns, P.; Baert, K.; Wouters, H.; Cagno, S.; Janssens, K.; Terryn, H.; Nys, K.; Thienpont, H. Optical Spectroscopy as a Rapid and Low-Cost Tool for the First-Line Analysis of Glass Artefacts: A Step-by-Step Plan for Roman Green Glass. J. Archaeol. Sci. 2011, 38, 2387–2398. [Google Scholar] [CrossRef]
  52. Lahlil, S.; Biron, I.; Galoisy, L.; Morin, G. Rediscovering Ancient Glass Technologies through the Examination of Opacifier Crystals. Appl. Phys. A 2008, 92, 109–116. [Google Scholar] [CrossRef]
  53. Willis, B.T.M. An Optical Method of Studying the Diffraction from Imperfect Crystals. I. Modulated Structures. Proc. R. Soc. Lond. Ser. A 1957, 239, 184–191. [Google Scholar] [CrossRef]
  54. Akai, J. Direct Observation of Stacking Faults in Wollastonite. Mem. Fac. Sci. Kyoto Univ. Ser. Geol. Mineral. 1975, 41, 1–13. [Google Scholar]
  55. Paynter, S.; Jackson, C.M. Mellow Yellow: An Experiment in Amber. J. Archaeol. Sci. Rep. 2018, 22, 568–576. [Google Scholar] [CrossRef]
  56. Schibille, N.; Freestone, I.C. Composition, Production and Procurement of Glass at San Vincenzo Al Volturno: An Early Medieval Monastic Complex in Southern Italy. PLoS ONE 2013, 8, e76479. [Google Scholar] [CrossRef] [PubMed]
  57. Kunicki-Goldfinger, J.J.; Freestone, I.C.; McDonald, I.; Hobot, J.A.; Gilderdale-Scott, H.; Ayers, T. Technology, Production and Chronology of Red Window Glass in the Medieval Period—Rediscovery of a Lost Technology. J. Archaeol. Sci. 2014, 41, 89–105. [Google Scholar] [CrossRef]
  58. Verità, M. Le Tessere Vitree Dei Mosaici Medievali a Roma. Tecnologia e Degrado. In Mosaici Medievali a Roma Attraverso il Restauro dell’ICR 1991–2004; Gangemi Editore: Roma, Italy, 2017; pp. 437–482. [Google Scholar]
  59. Wypyski, M.T.; Becker, L. Glassmaking Technology at Antioch: Evidence from the Atrium House Triclinium and Later Mosaics. In The Arts of Antioch–Art Historical and Scientific Approaches to Roman Mosaics and a Catalogue of the Worcester Art Museum Antioch Collection; Worcester Art Museum: Worcester, MA, USA, 2005; pp. 115–175. [Google Scholar]
  60. Wenk, H.-R. Polymorphism of Wollastonite. Contrib. Mineral. Petrol. 1969, 22, 238–247. [Google Scholar] [CrossRef]
  61. Silvestri, A.; Molin, G.; Salviulo, G.; Schievenin, R. Sand for Roman Glass Production: An Experimental and Philological Study on Source of Supply. Archaeometry 2006, 48, 415–432. [Google Scholar] [CrossRef]
  62. Azarov, G.M.; Maiorova, E.V.; Oborina, M.A.; Belyakov, A.V. Wollastonite Raw Materials and Their Applications (a Review). Glass Ceram. 1995, 52, 237–240. [Google Scholar] [CrossRef]
  63. Nour, W.M.N.; Mostafa, A.A.; Ibrahim, D.M. Recycled Wastes as Precursor for Synthesizing Wollastonite. Ceram. Int. 2008, 34, 101–105. [Google Scholar] [CrossRef]
  64. Almasri, K.A.; Sidek, H.A.A.; Matori, K.A.; Zaid, M.H.M. Effect of Sintering Temperature on Physical, Structural and Optical Properties of Wollastonite Based Glass-Ceramic Derived from Waste Soda Lime Silica Glasses. Results Phys. 2017, 7, 2242–2247. [Google Scholar] [CrossRef]
  65. Degryse, P.; Schneider, J.; Haack, U.; Lauwers, V.; Poblome, J.; Waelkens, M.; Muchez, P. Evidence for Glass ‘Recycling’ Using Pb and Sr Isotopic Ratios and Sr-Mixing Lines: The Case of Early Byzantine Sagalassos. J. Archaeol. Sci. 2006, 33, 494–501. [Google Scholar] [CrossRef]
  66. Zanini, R.; Moro, G.; Orsega, E.F.; Panighello, S.; Šelih, V.S.; Jaćimović, R.; van Elteren, J.T.; Mandruzzato, L.; Moretto, L.M.; Traviglia, A. Insights into the Secondary Glass Production in Roman Aquileia: A Preliminary Study. J. Archaeol. Sci. Rep. 2023, 50, 104067. [Google Scholar] [CrossRef]
  67. Scott, R.; Neyt, B.; Brems, D.; Eekelers, K.; Shortland, A.; Degryse, P. Experimental Mixing of Natron and Plant Ash Style Glass: Implications for Ancient Glass Recycling. Glass Technol. Eur. J. Glass Sci. Technol. Part A 2017, 58, 8–16. [Google Scholar] [CrossRef]
  68. Arletti, R.; Fiori, C.; Vandini, M. The Study of Glass Tesserae from Mosaics in the Monasteries of Daphni and Hosios Loukas (Greece). Archaeometry 2010, 52, 796–815. [Google Scholar] [CrossRef]
  69. Rosi, F.; Manuali, V.; Miliani, C.; Brunetti, B.G.; Sgamellotti, A.; Grygar, T.M.; Hradil, D. Raman Scattering Features of Lead Pyroantimonate Compounds. Part I: XRD and Raman Characterization of Pb2Sb2O7 Doped with Tin and Zinc. J. Raman Spectrosc. 2009, 40, 107–111. [Google Scholar] [CrossRef]
  70. Freestone, I.; Stapleton, C. Composition, Technology and Production of Coloured Glasses from Roman Mosaic Vessels. In Glass of the Roman World; Oxbow: Oxford, UK, 2014; pp. 62–77. [Google Scholar]
  71. Moretti, C.; Hreglich, S. Opacification and Colouring of Glass by the Use of «anime». Glass Technol. 1984, 25, 277–282. [Google Scholar]
  72. Turner, W.E.S. Studies in Ancient Glasses and Glassmaking Processes. Part VI. The Composition and Physical Characteristics of the Glasses of the Portland Vase. J. Soc. Glass Technol. 1959, 43, 262–288. [Google Scholar]
  73. Foster, H.; Jackson, C. “A Whiter Shade of Pale”? Chemical and Experimental Investigation of Opaque White Roman Glass Gaming Counters. Glass Technol. Eur. J. Glass Sci. Technol. Part A 2005, 46, 327–333. [Google Scholar]
  74. Boschiero, J.; Maltoni, S.; Marcante, A.; Molin, G.; Bonetto, J.; Silvestri, A. Production Technology for Roman Mosaic Glass Vessels: New Data from the Domus of Tito Macro in Aquileia (Italy). J. Cult. Herit. 2022, 55, 117–127. [Google Scholar] [CrossRef]
  75. Mazzucato, E.; Gualtieri, A.F. Wollastonite Polytypes in the CaO-SiO2 System. Phys. Chem. Miner. 2000, 27, 565–574. [Google Scholar] [CrossRef]
  76. Jackson, C.M.; Paynter, S.; Nenna, M.-D.; Degryse, P. Glassmaking Using Natron from El-Barnugi (Egypt); Pliny and the Roman Glass Industry. Archaeol. Anthr. Sci. 2018, 10, 1179–1191. [Google Scholar] [CrossRef]
  77. Chelazzi, L.; Boffa Ballaran, T.; Nestola, F.; Bindi, L.; Bonazzi, P. High-Pressure Behavior of the Synthetic Ca2Sb2O7 Weberite-Type Compound. Solid State Sci. 2011, 13, 1092–1095. [Google Scholar] [CrossRef]
  78. Wahba, O.A.G.; Hassan, A.M.; El-wahab, H.A.; Mohy-Eldin, A.; Naser, A.M.; Fouad, O.A. Synthesis of Nanosized Mixed Metal Oxides Heat and Corrosion Resistant Pigments: CaMnO, CaCrO and CaSbO. Pigment. Resin Technol. 2015, 44, 379–385. [Google Scholar] [CrossRef]
Figure 1. Archaeological objects from the Gorga Collection hosted at the Palazzo Altemps. (a) Opus sectile glass pieces; (b) mosaic glass bowl; (c) alabaster vessels; (d) Roman painted plasters most probably coming from the Domus Aurea and the Palatine hill [12].
Minerals 13 01421 g001
Figure 2. Macroscopic pictures of the glass samples selected for the study and, as inset, a zoom of the polished surface of the small, sectioned parts. They correspond to imitations of (a,b) Porfido verde antico, (c) Cipollino rosso brecciato, (d) Rosso antico, (e) Giallo antico, (f) Diaspro nero e giallo, (g) Semesanto, and (h,i) agate or alabaster. Pictures by Stefano Castelli (University of Padua, Italy).
Minerals 13 01421 g002
Figure 3. Binary compositional diagrams using reduced compositions. (a) MgO (wt%) versus K2O (wt%). The compositional fields assigned to natron- and plant-ash-based glasses are highlighted in red. (b) K2O (wt%) versus P2O5 (wt%). tr: translucent/transparent, op: opaque.
Minerals 13 01421 g003
Figure 4. Compositional plots to explore the presence of impurities in the sands used to produce the base glasses. (a) Reduced Al2O3 (wt%) versus CaO (wt%) diagram for the glasses analyzed (open dots), along with other previously published values for the Gorga glasses [20]. (b) Al2O3/SiO2 versus TiO2/Al2O3 ratios for the glasses analyzed, where the dashed line indicates the division between Levantine and Egyptian primary productions from [43]. tr: translucent/transparent, op: opaque.
Minerals 13 01421 g004
Figure 5. Compositional maps obtained using XRF, reflecting the Cu% on the cut surfaces of (a) PV1 and (b) PV2 samples and the Mn% on the cut surfaces of (c) S and (d) D samples.
Minerals 13 01421 g005
Figure 6. (a) Microphotograph of the scanned polished thin section of sample PV1 with indication of its two different glasses (PV1-tr and PV1-op). Yellow areas correspond to partially altered portions of glass. Seven areas are highlighted in red, corresponding to optical microphotographs of (b,c) relict crystals of monoclinic wollastonite surrounded by newly formed crystals, (d) rounded relict grain of wollastonite and newly formed skeletal devitrite crystals in an opaque strip, (e) clay clod containing different mineral particles, (f) newly formed transparent acicular crystals of wollastonite, (g) newly formed crystals of acicular wollastonite and platy skeletal devitrite, and (h) aggregate of Pb-Fe antimonate opacifier. Images (b,c,f,h) were obtained in TL, while images (d,e,g) were obtained in RL.
Minerals 13 01421 g006
Figure 7. (a) Microphotograph of the scanned polished thin section of sample PV2 with indication of its two different glasses (PV2-tr and PV2-op). Six areas are highlighted in red, corresponding to optical microphotographs of (b) relict crystal of hematite in TL, (c) rounded relict crystal of quartz in TL, (d) clay clod in the opaque bands in TL, (e) newly formed transparent acicular devitrite crystals seen in TL (above) and RL (below), (f) relict crystal of wollastonite with grainy crystalloid morphology in RL, and (g) Pb-Fe antimonate opacifier particle seen in TL (left) and RL (right).
Minerals 13 01421 g007
Figure 8. Indexed experimental tts-μXRD patterns of different identified microcrystals found in the studied samples (a) monoclinic wollastonite (CaSiO3) in PV1-tr glass (also found in PV1-op, PV2-op, red CR-op, R-tr, R-op and A1-tr(c)), (b) devitrite (Na2Ca3Si6O16) in PV1-op glass (also found in PV1-tr, PV2-tr, PV2-op, G-op, D-op, S-op, A1-tr(b) and A2-op) with minor content of wollastonite, (c) opacifier Pb2Fe0.5Sb1.5O6.5 in PV2-op glass (also found in PV1-op, G-op and D-op), (d) opacifiers Ca2Sb2O7 and CaSb2O6 in CR-op(w) glass (Ca2Sb2O7 also found in S-op, A1-op and A2-op), (e) senarmontite (Sb2O3) in CR-op(w) glass, and (f) nepheline (Na3K(Si,Al)8O16) and diopside (CaMgSi2O6) in R-tr glass (nepheline was also found in G-op). The codes of the PDF reference patterns are indicated in the pictures. Images taken from the camera of the sample visualization system at the MSPD beamline with indication of the irradiated area (red circles) are shown next to the diffractograms.
Minerals 13 01421 g008
Figure 9. Representative micro-Raman spectrum obtained from the Pb-Fe antimonate crystalline phase.
Minerals 13 01421 g009
Figure 10. (a) Microphotograph of the scanned polished thin section of the sample CR with indication of its two different glasses (red CR-op(r) and white CR-op(w)). Six areas are highlighted in red, corresponding to optical microphotographs of (b) relict crystal of monoclinic wollastonite embedded in the opaque greyish-maroon matrix, (c) devitrification crystals corresponding to euhedral wollastonite (with corona of a different phase) and a fibrous aggregate, perhaps triclinic wollastonite, (d) twinned section of idiomorphic newly formed wollastonite, (e) two elongated sections of newly formed wollastonite embedded into the opaque matrix, (f) newly formed fibrous aggregate in the greyish-maroon matrix (possibly wollastonite), (g) same area seen in (c) but at a higher magnification and (h) cluster of Ca-antimonate crystals in an opaque band. Images (b,c,f) were obtained in TL, image (d) was obtained in XPL-TL and images (e,g,h) were obtained in RL.
Minerals 13 01421 g010
Figure 11. (a) One of the multiple sub-rounded copper particles in the CR-op(r) glass identified as metallic copper, as revealed by the presence of (b) the Cu (111) reflection in the tts-μXRD pattern (01-085-1326 JPD pattern); (c) similar euhedral cubic nanocrystals of copper in R-op glass.
Minerals 13 01421 g011
Figure 12. (a) Petrographic image in TL of the aggregate of crystals investigated using FIB-TEM, the approximate position of the cut lamella has been indicated (in red); (b) scanning transmission electron microscopy (STEM) image of the FIB cross-section, the measured points have been indicated (in red); (c) electron diffraction patterns of the measured points exhibiting complete stacking disorder.
Minerals 13 01421 g012
Figure 13. (a) Microphotograph of the scanned polished thin section of the sample R with indication of its two different glasses (R-tr and R-op). Seven areas are highlighted in red, corresponding to optical/SEM microphotographs of (b) the same glassy area viewed in a petrographic microscope in TL mode (left) and using backscattering SEM (right); (ce) relict grains of monoclinic wollastonite, (f) a clay clod of different silica particles in the transparent glass; (g) relict quartz and hematite grains spotted in the transparent glass; and (h) a cluster of devitrification crystals of nepheline and diopside, along with relict hematite spotted in a transparent area of the sample. Images (ce,g) were obtained in TL, while images (f,h) were obtained in RL.
Minerals 13 01421 g013
Figure 14. (a) Microphotograph of the scanned polished thin section of the sample G consisting of yellow opaque glass G-op. (b) A general view of the thin section in PPL-TL showing the semi-opaque matrix. Four areas are highlighted in red within the scanned thin section, corresponding to optical/SEM microphotographs of (c) tabular crystals of nepheline surrounded by opacifier particles in RL, (d) light grey skeletal crystals of devitrite in RL, and (e) RL and (f) SEM backscattering images displaying Pb-Fe antimonates.
Minerals 13 01421 g014
Figure 15. (a) Microphotograph of the scanned polished thin section of sample D with indication of its two different glasses (D-tr and D-op). Four areas are highlighted in red, corresponding to optical microphotographs of (b) a clay clod formed by different silicate particles spotted in the transparent area of the sample, (c) acicular newly formed crystals of devitrite nucleated at the interface between the opaque and transparent glass, and (d,e) two examples of rosary-shaped aggregates of Pb-Fe antimonate. Images (b,d,e) were obtained in RL, while image (c) was obtained in TL.
Minerals 13 01421 g015
Figure 16. (a) Microphotograph of the scanned polished thin section of the sample S with indication of its two different glasses (S-tr and S-op). In (b), the red rectangular area is zoomed to show variations in the colour of the opaque bands. In (c) the yellow rectangular area is zoomed to show the stretching of the opaque clusters that contributed to creating the macroscopic appearance of a foliation. The red encircled area contains a Ca-antimonate aggregate (Ca2Sb2O7) that is shown in (d), as seen in RL. Images (b,c) were obtained in TL mode.
Minerals 13 01421 g016
Figure 17. (a) Microphotograph of the scanned polished thin section of the sample A1 mainly formed by yellow A1-tr(b) glass, except for the top-right corner area that is zoomed in (b), revealing the presence of A1-op and colourless A1-tr(c) glasses. Moreover, two areas are highlighted (encircled in red), corresponding to (c) devitrification transparent acicular crystals of devitrite nucleated around a bubble and (d) stretched Ca-antimonate agglomerates (Ca2Sb2O7) in the opaque glass A1-op.
Minerals 13 01421 g017
Table 1. Sampled Gorga glasses from the Villa of Emperor Lucius Verus (2nd c. AD) with the label used here, the corresponding museum reference code, the name of the original imitated stone and the macroscopic description of the samples (with the labels corresponding to the analytical samples).
LabelMuseum Ref.Stone ImitationMacroscopic Description (with Labels of Analytical Samples)
PV118.M328-2.13Porfido verde anticoTranslucent dark green matrix (PV1-tr) with opaque light green canes (PV1-op)
PV218.M328-2.14Porfido verde anticoTranslucent green-turquoise matrix (PV2-tr) with opaque greenish-yellow strips (PV2-op)
CR18.M328-2.19Cipollino rosso brecciatoOpaque red matrix (CR-op(r)) with opaque white canes (CR-op(w))
R18.M328-2.16Rosso anticoVeined red matrix (R-op) with thin dark veins (R-tr)
G18.M328-2.3Giallo anticoOpaque yellow matrix (G-op) with superficial brown speckles
D18.M328-2.2Diaspro nero e gialloFusion of a translucent brown (D-tr) and an opaque yellow glass
(D-op)
S3956615SemesantoCombination of translucent purple (S-tr) and opaque white canes
(S-op)
A118.M328-2.5Agate/alabasterTranslucent brown matrix (A1-tr(b)) with white (A1-op), amber and deep brown bands *
A218.M328-2.6Agate/alabasterTranslucent amber matrix (A2-tr) and opaque white veins (A2-op)
* An additional colourless and transparent glass (A1-tr(c)) was analyzed but it was not macroscopically visible and, therefore, not reported here.
Table 2. Average compositions and standard deviations for each analytical sample as determined using EMP analyses. Colour and transparency (TR: translucent/transparent, OP: opaque) are also indicated. Cations are expressed in wt% of arbitrary oxides.
SamplePV1PV2CRRGDSA1A2
Imitated stonePorfido verde
antico
Porfido verde anticoCipollino rossoRosso anticoGiallo
antico
Diaspro giallo e neroSemesantoAgate/alabasterAgate/
alabaster
ColourDark greenLight greenGreen-turquoiseGreenish-yellowRedWhiteColourlessRedYellowBrownYellowPurpleWhiteBrownColourlessWhiteAmberWhite
Analytical samplePV1-trPV1-opPV2-trPV2-opCR-op(r)CR-op(w)R-trR-opG-opD-trD-opS-trS-opA1-tr(b)A1-tr(c)A1-opA2-trA2-op
SiO260.1962.2262.5462.957.8967.9159.6656.6764.1161.5664.0066.5357.8567.2467.9464.2065.1863.37
σ0.550.890.490.610.660.460.110.260.830.340.381.640.650.260.970.460.680.55
Na2O14.3515.0317.4917.0113.8515.9610.8311.1016.0616.7514.4816.8011.6617.9016.8313.7917.4314.75
σ0.090.230.380.310.440.240.210.090.440.280.610.440.380.340.250.150.240.29
CaO11.5110.048.267.159.866.549.468.828.4510.236.328.335.468.949.268.469.979.23
σ0.310.470.340.160.110.080.330.080.100.180.390.180.070.150.040.220.070.11
Al2O32.082.042.562.292.401.952.092.102.202.742.322.442.272.332.682.422.682.53
σ0.040.070.070.080.030.060.050.060.100.050.160.100.420.090.030.060.020.06
K2O1.751.200.341.251.470.252.241.980.350.570.320.570.490.420.540.560.460.49
σ0.020.090.040.010.230.040.050.040.010.050.030.070.060.030.030.020.020.03
MgO2.141.861.191.652.753.272.692.370.861.130.670.710.470.590.670.630.640.73
σ0.040.150.080.120.040.270.100.040.020.040.020.090.020.010.020.030.020.02
FeO1.090.970.991.111.900.381.461.710.801.070.920.550.440.280.350.390.390.61
σ0.050.080.090.080.030.040.040.040.070.020.030.070.030.020.020.010.040.05
TiO20.140.140.170.150.210.070.160.160.120.190.170.060.050.050.060.060.060.07
σ0.020.020.020.020.020.010.040.010.020.010.01 0.020.010.010.020.010.01
P2O50.790.550.140.200.860.010.720.640.060.11<0.070.140.060.080.120.130.220.13
σ0.070.210.030.080.01 0.060.050.040.04 0.020.040.07 0.050.040.04
SO30.380.370.410.380.270.440.220.200.390.400.420.340.750.310.380.720.290.77
σ0.010.070.060.030.060.060.060.050.040.070.030.080.070.060.060.060.060.08
Cl1.331.391.761.711.301.460.861.191.451.351.481.280.721.771.170.591.370.64
σ0.030.050.090.060.070.140.000.060.060.040.060.190.030.050.080.040.070.06
Cr2O30.050.040.050.050.050.050.070.070.050.040.060.050.070.060.050.040.040.05
σ0.010.010.010.020.020.010.030.020.010.010.010.010.010.010.010.010.010.01
MnO0.430.330.130.220.370.020.270.24<0.033.310.042.491.060.031.231.110.320.54
σ0.040.030.060.040.030.010.060.04 0.090.030.410.040.010.060.030.020.03
CoO0.010.02<0.02<0.02 <0.02<0.03 <0.030.020.02<0.02<0.02<0.05<0.02<0.02<0.02<0.04
σ
NiO<0.03<0.03<0.02<0.06<0.04 <0.02<0.03<0.05 <0.03<0.03<0.040.010.01<0.02
σ
CuO1.921.542.581.851.15 1.101.38<0.040.05<0.09 0.03<0.02<0.02 <0.04
σ0.060.070.290.050.22 0.130.14 0.04 0.02
ZnO0.060.060.060.090.07<0.070.070.13<0.05<0.060.040.03<0.090.070.050.060.03<0.06
σ0.040.030.040.060.04 0.040.04 0.030.02 0.040.020.030.02
SnO20.200.170.180.150.12<0.020.180.25<0.040.02<0.03<0.020.16 <0.030.03<0.02<0.04
σ0.030.060.070.020.02 0.020.03 0.01 0.02 0.02
Sb2O30.440.460.370.530.201.690.100.100.550.731.15 4.31 <0.026.38<0.035.18
σ0.050.040.100.100.030.170.020.030.050.020.15 0.20 0.75 0.41
BaO0.060.060.06<0.040.04<0.050.08<0.070.050.16<0.030.03<0.100.05<0.06<0.060.050.05
σ0.010.060.03 0.03 0.11 0.040.01 0.02 0.06 0.010.03
PbO1.332.170.781.896.060.077.6111.174.48<0.046.780.0513.330.040.09<0.07<0.070.26
σ0.200.120.320.240.430.090.110.250.29 0.220.040.540.010.06 0.13
Total100.2100.6100.1100.6100.8100.199.8100.3100.0100.599.2100.499.2100.2101.499.699.199.4
Disclaimer/Publisher’s Note: The statements, opinions and data contained in all publications are solely those of the individual author(s) and contributor(s) and not of MDPI and/or the editor(s). MDPI and/or the editor(s) disclaim responsibility for any injury to people or property resulting from any ideas, methods, instructions or products referred to in the content.

