
Ore Mineralogy, Fluid Inclusion Geochemistry, and Zircon U-Pb Geochronology of the Nanmingshui Gold Deposit in East Junggar, Xinjiang, Northwest China: Implications for Ore Genesis

 ,
,
Abstract
:1. Introduction

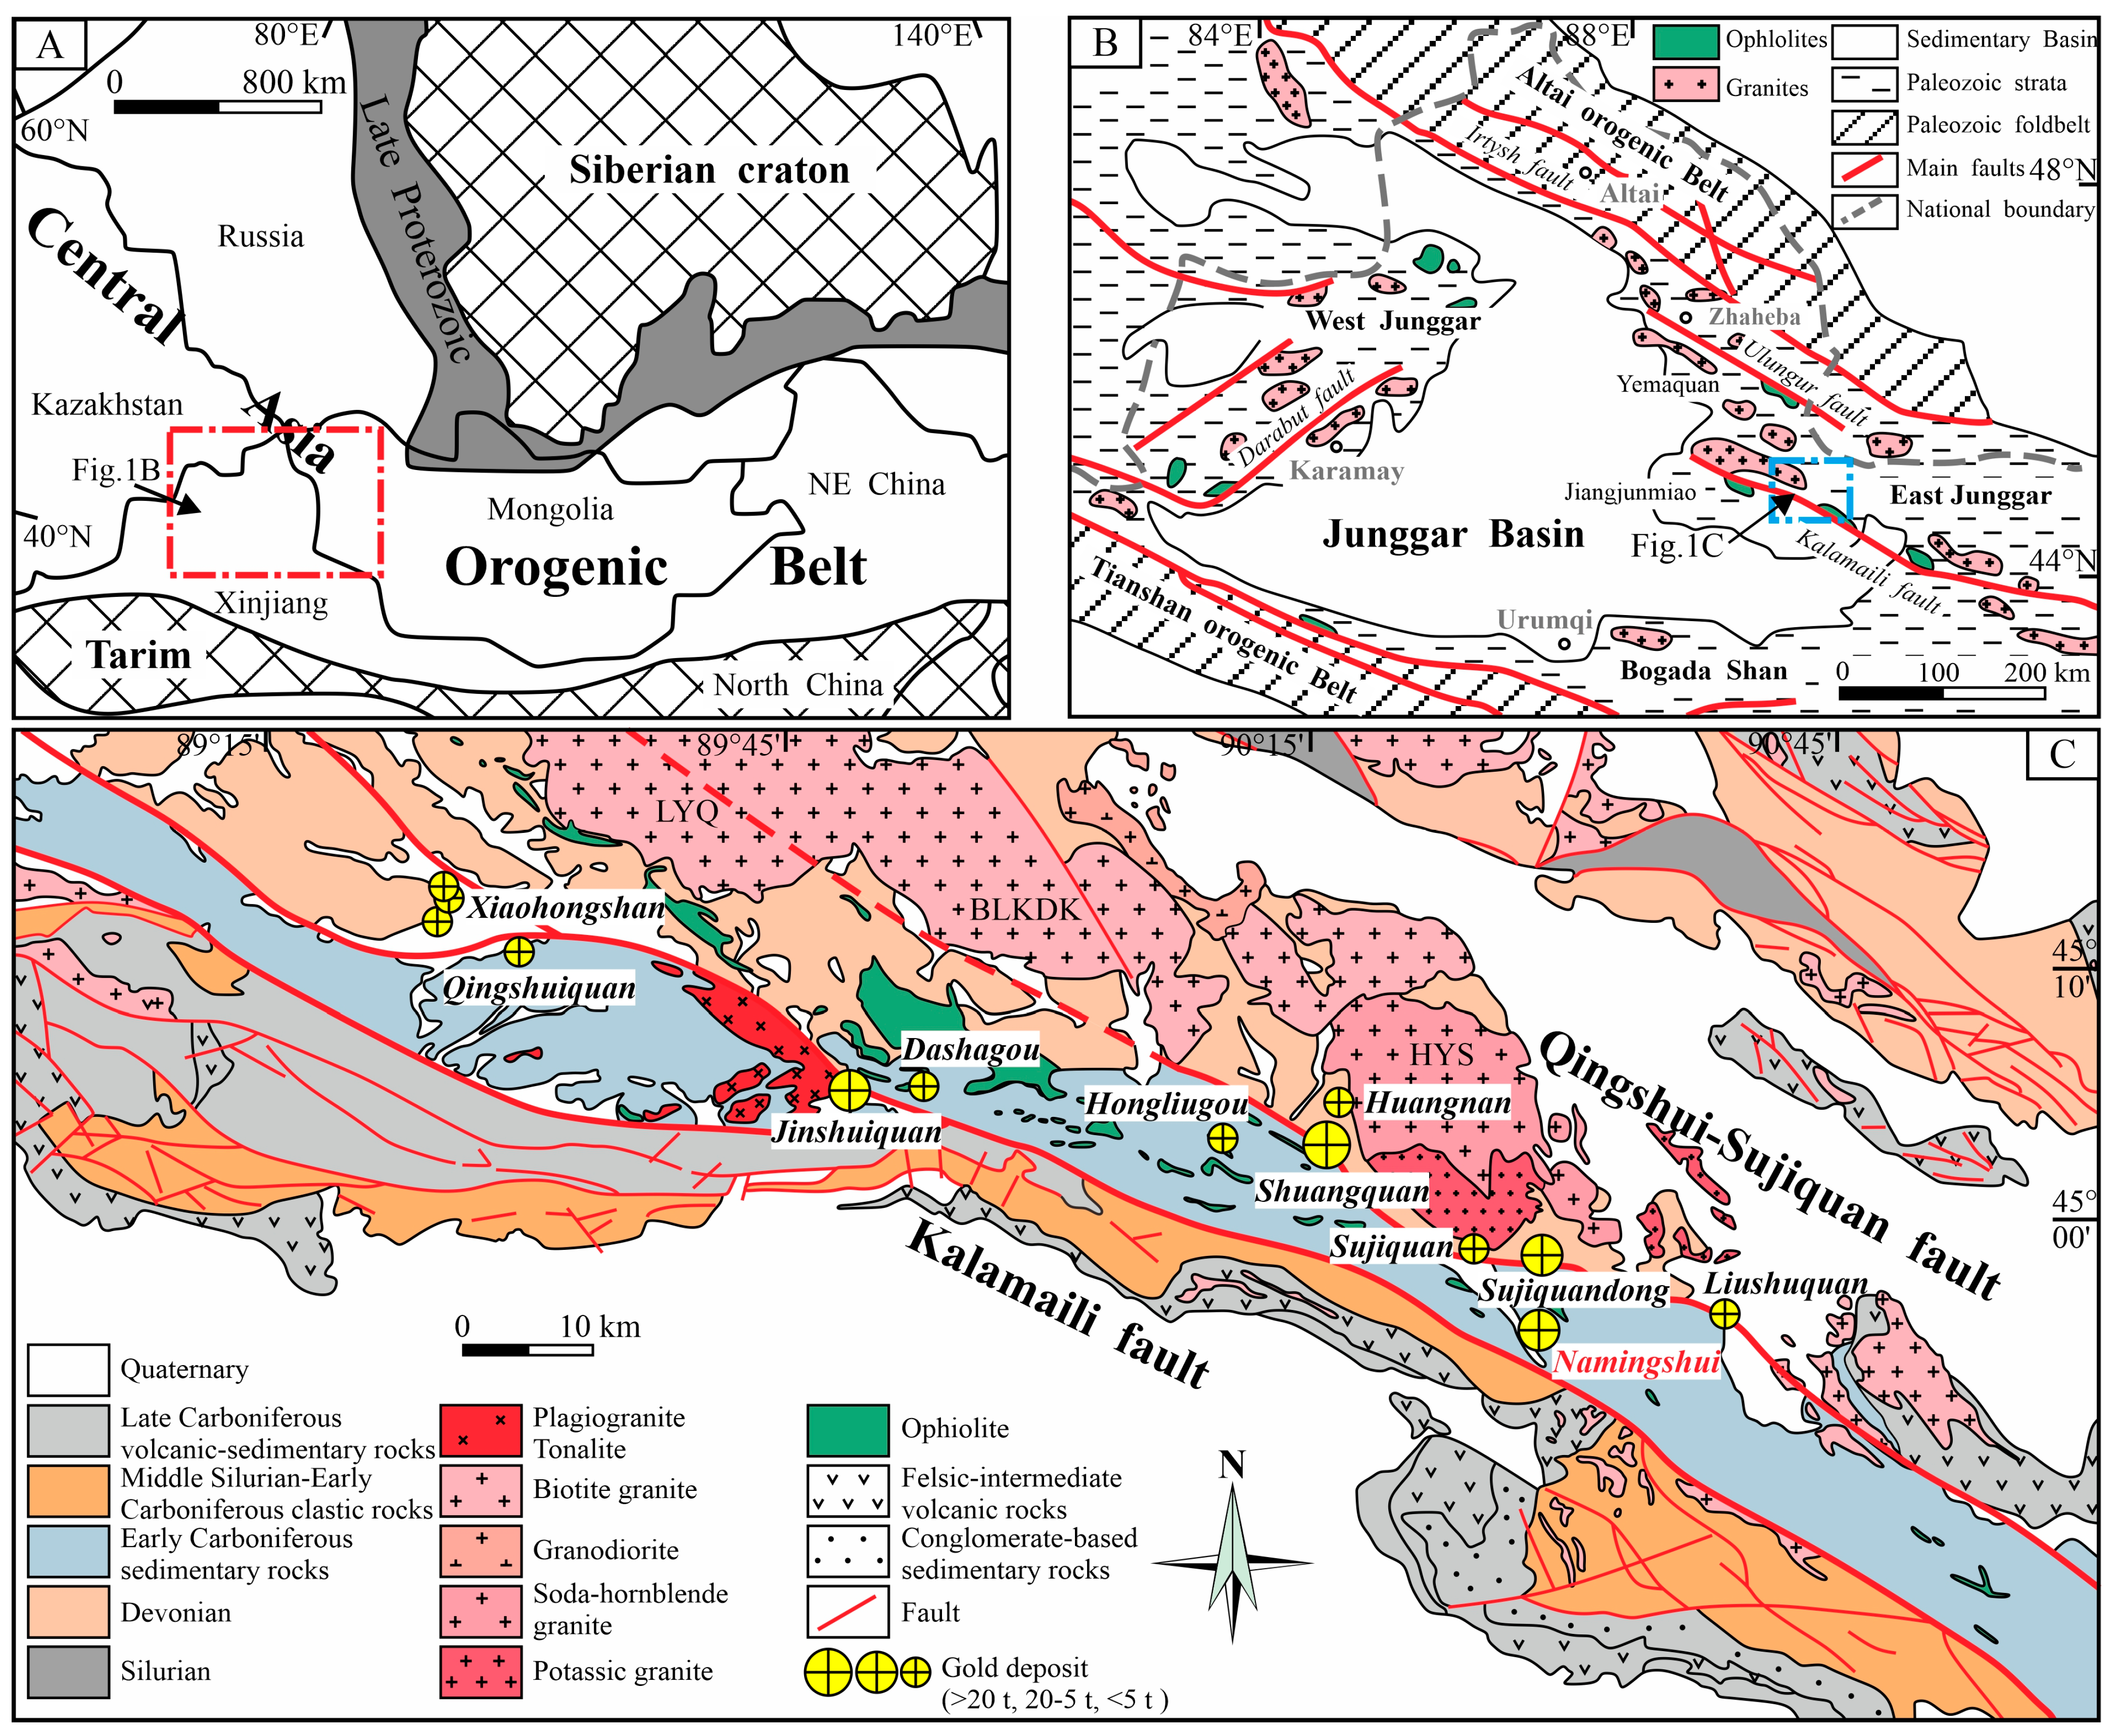
2. Regional Geology
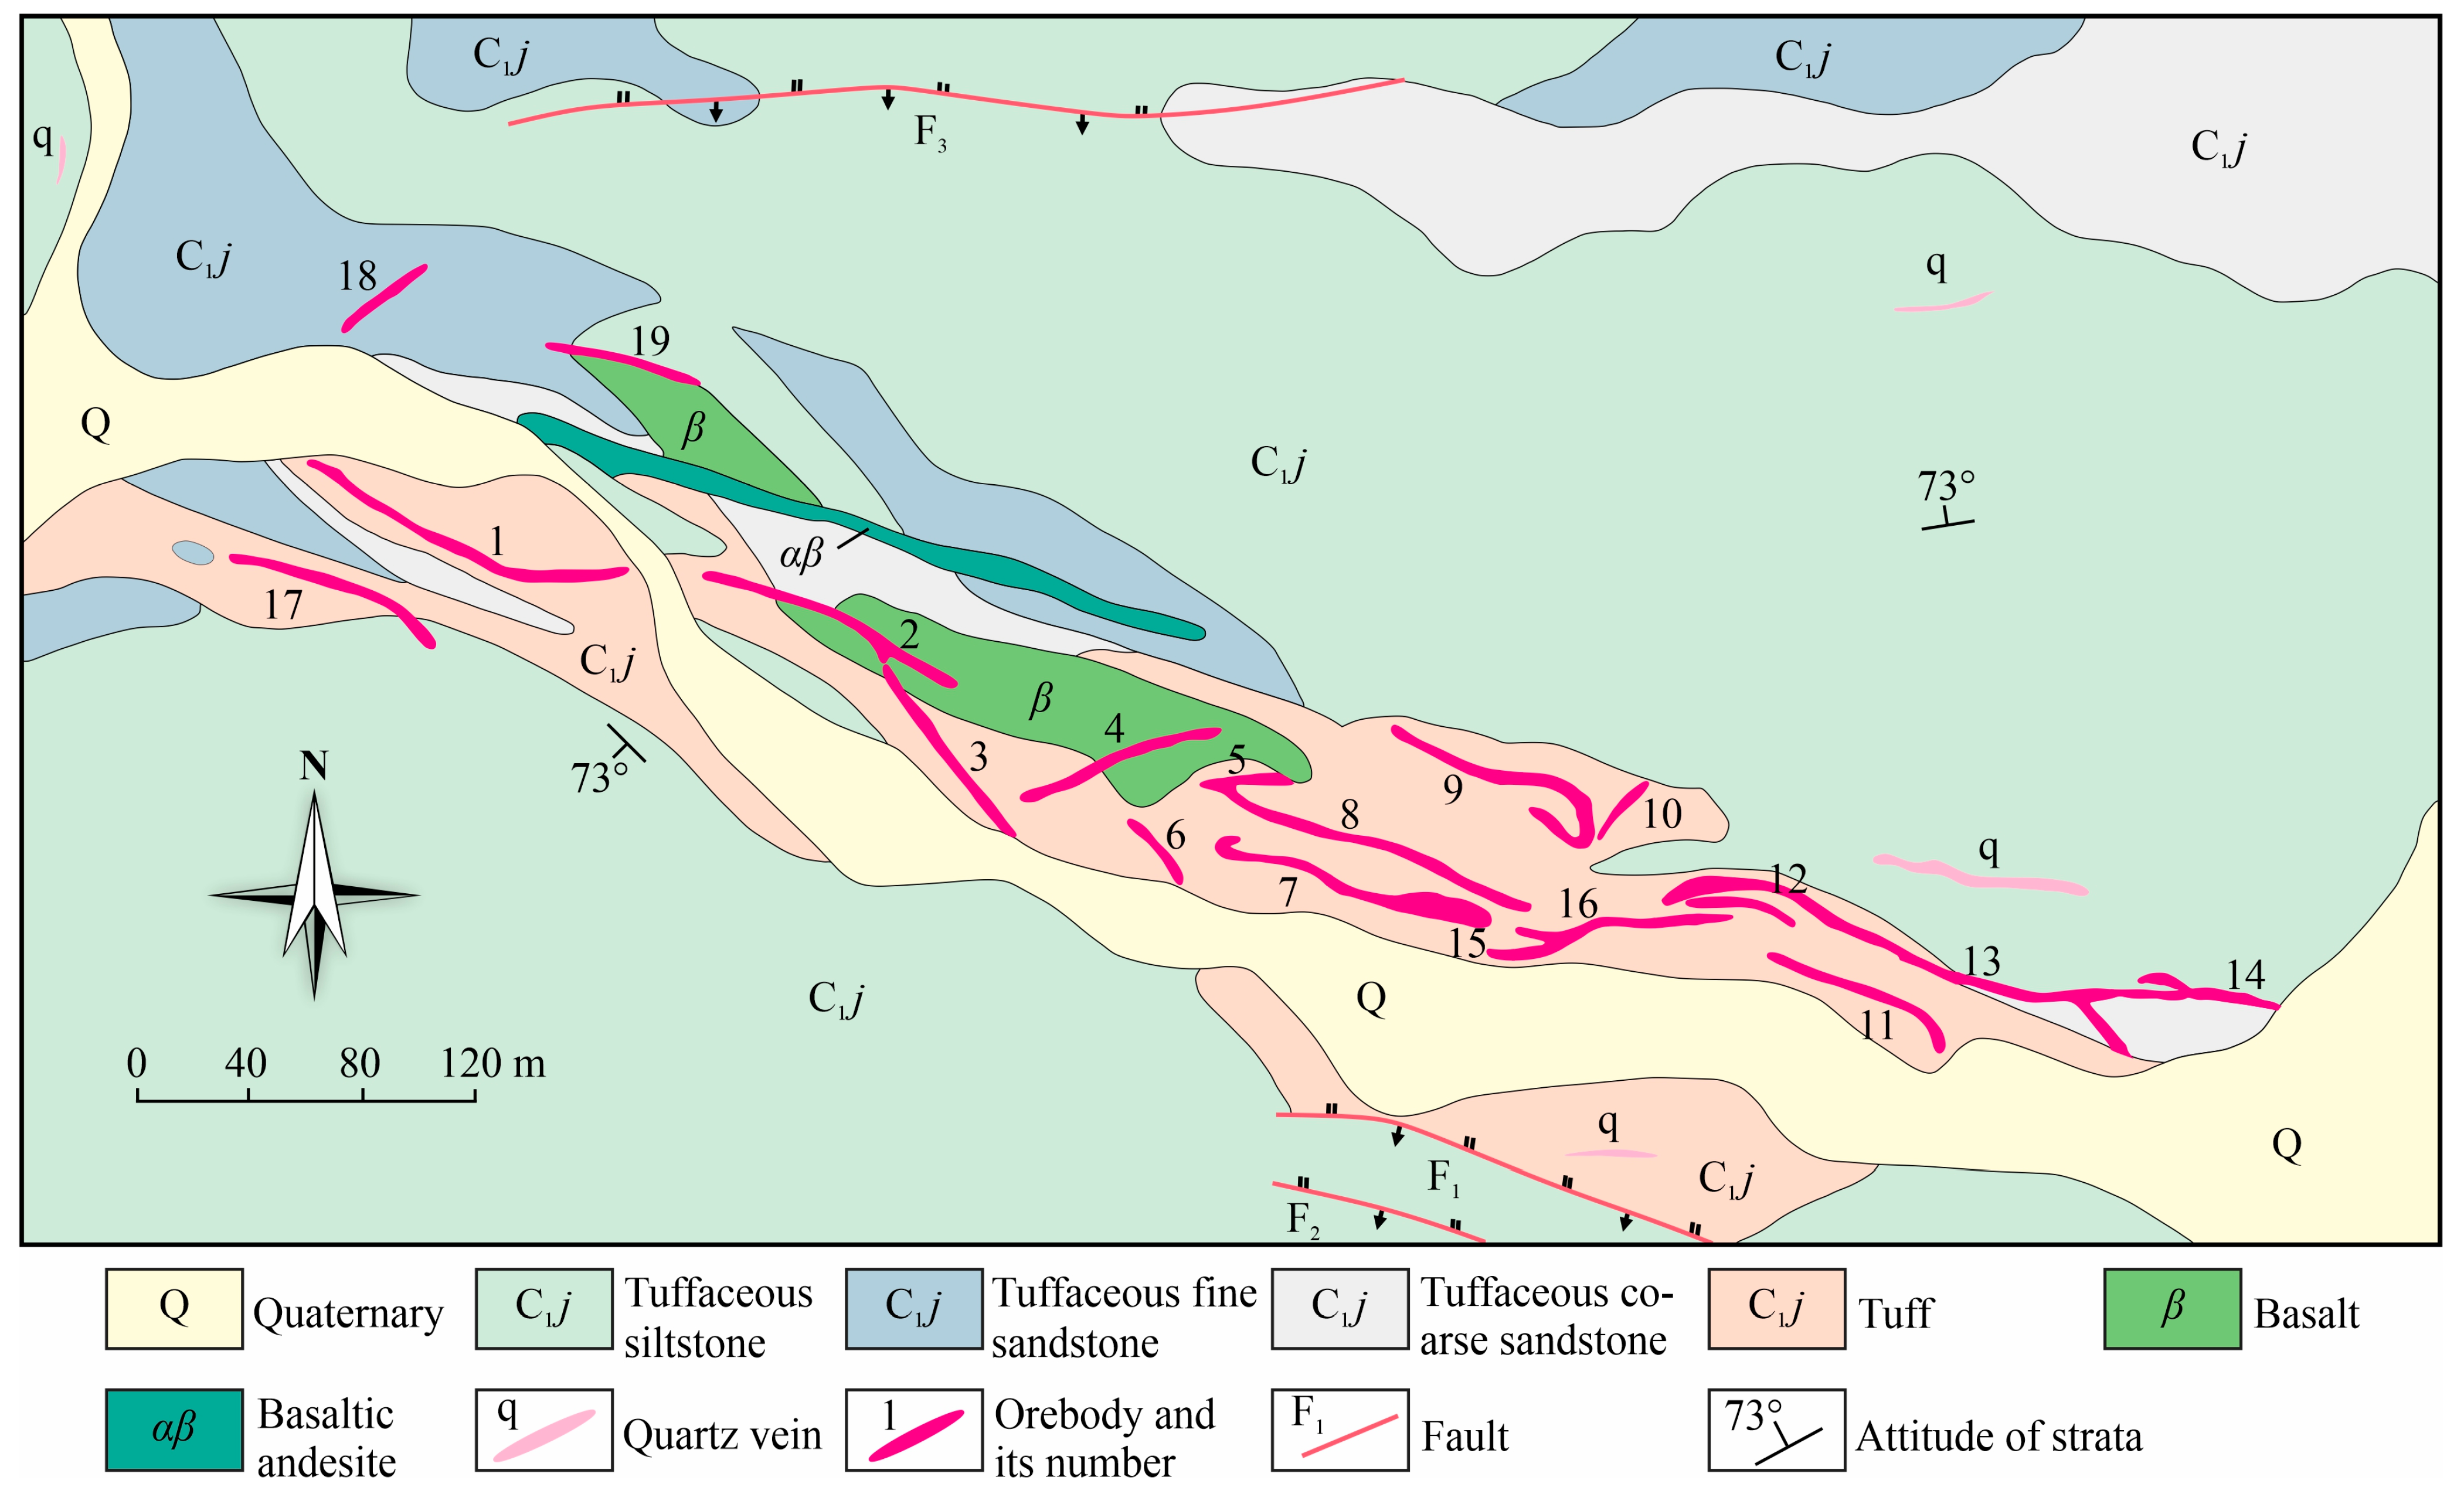
3. Deposit Geology
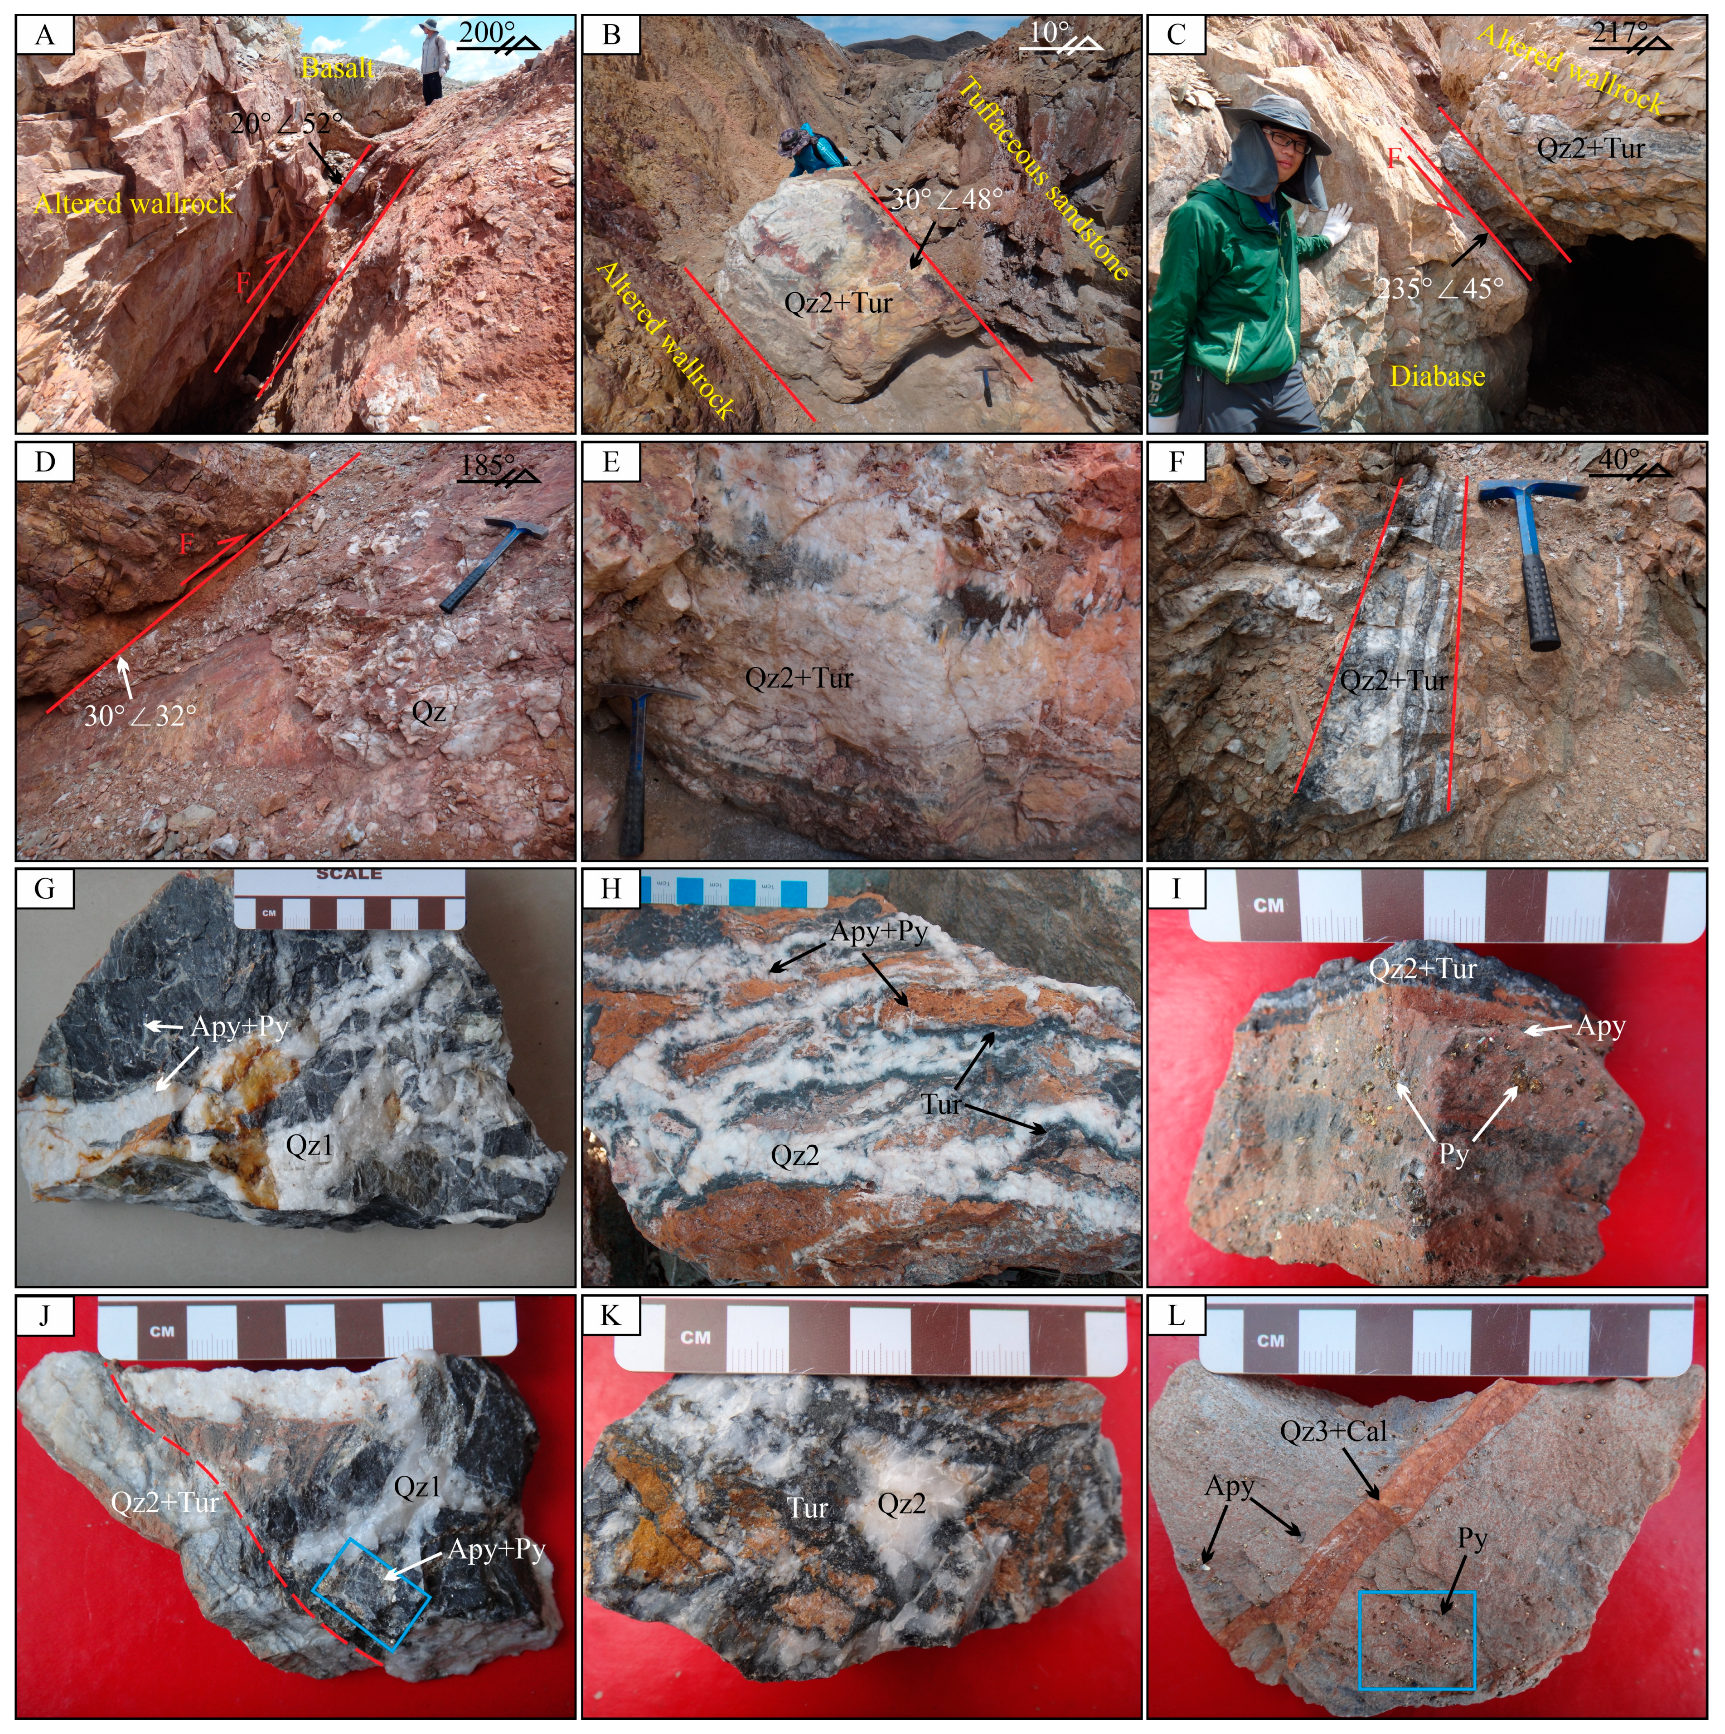
3.1. Features of the Ore-Hosting Faults
3.2. Characteristics of the Orebodies
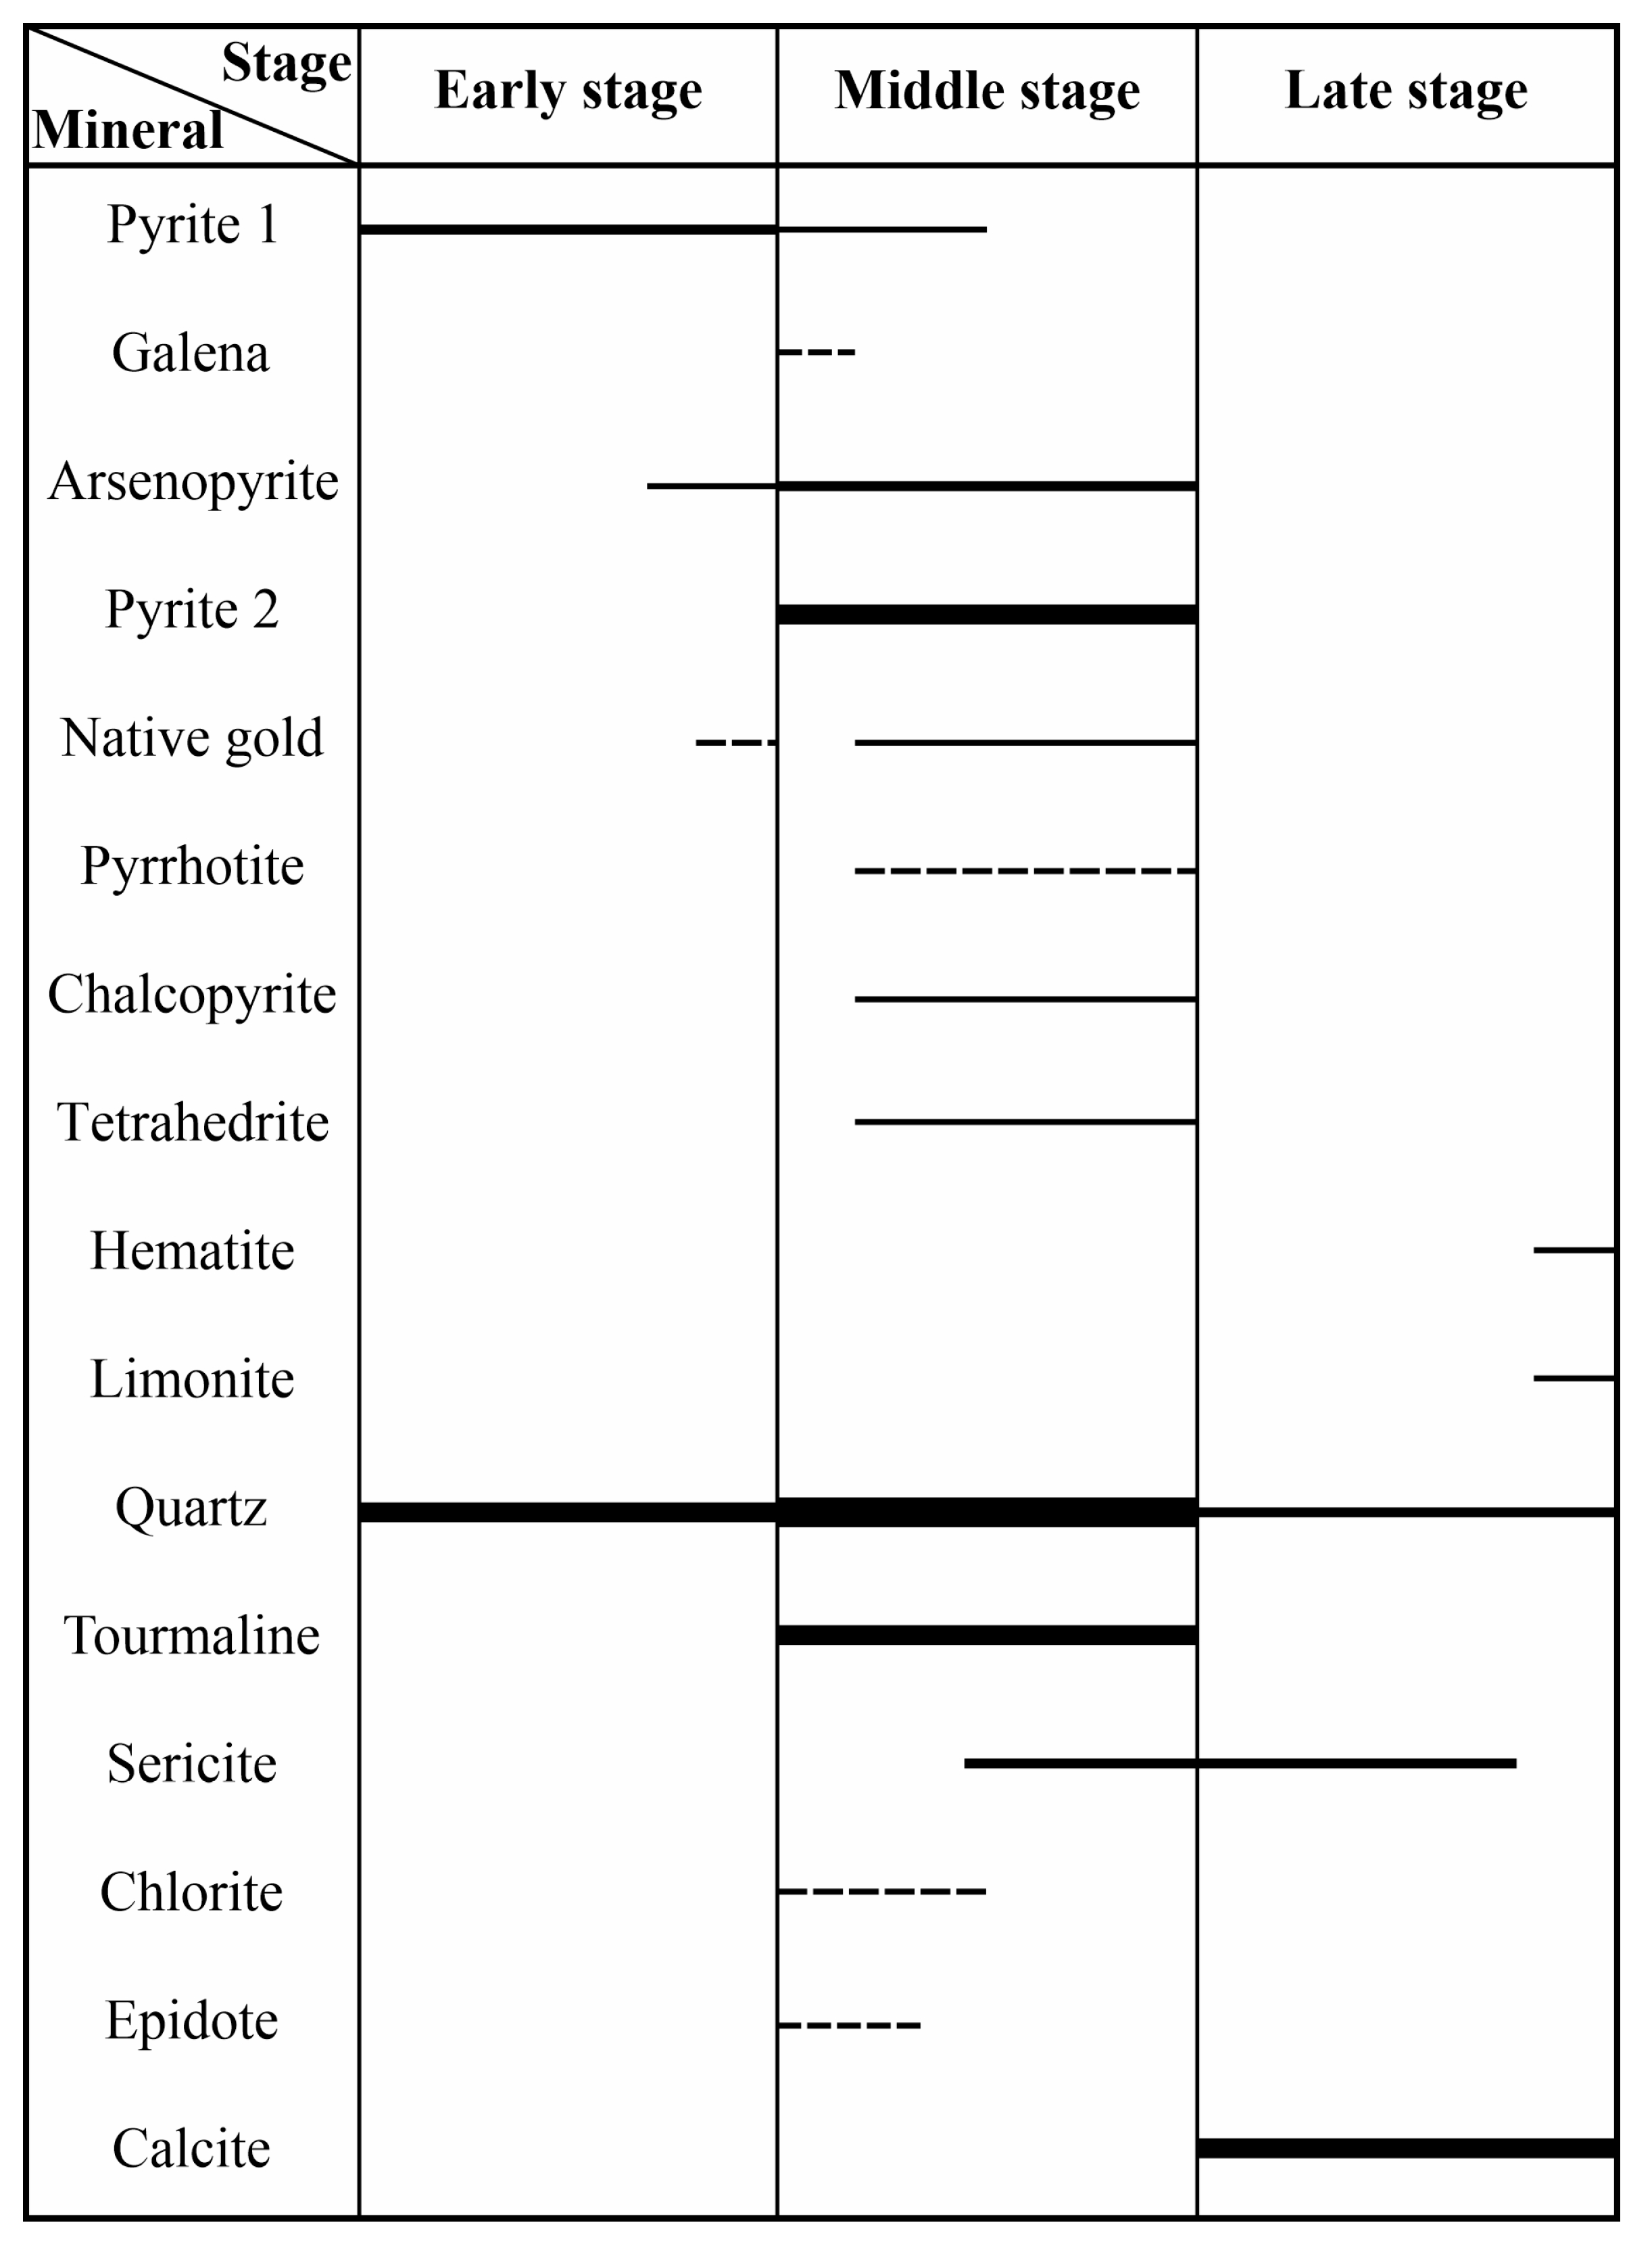
3.3. Ore Types and Mineral Assemblages
3.4. Mineralization Stages and Wall-Rock Alteration
4. Samples and Analytical Methods
4.1. EPMA and Mapping
4.2. Fluid Inclusion Study
4.3. H-O Isotope Analyses
4.4. Zircon U-Pb Dating
5. Results
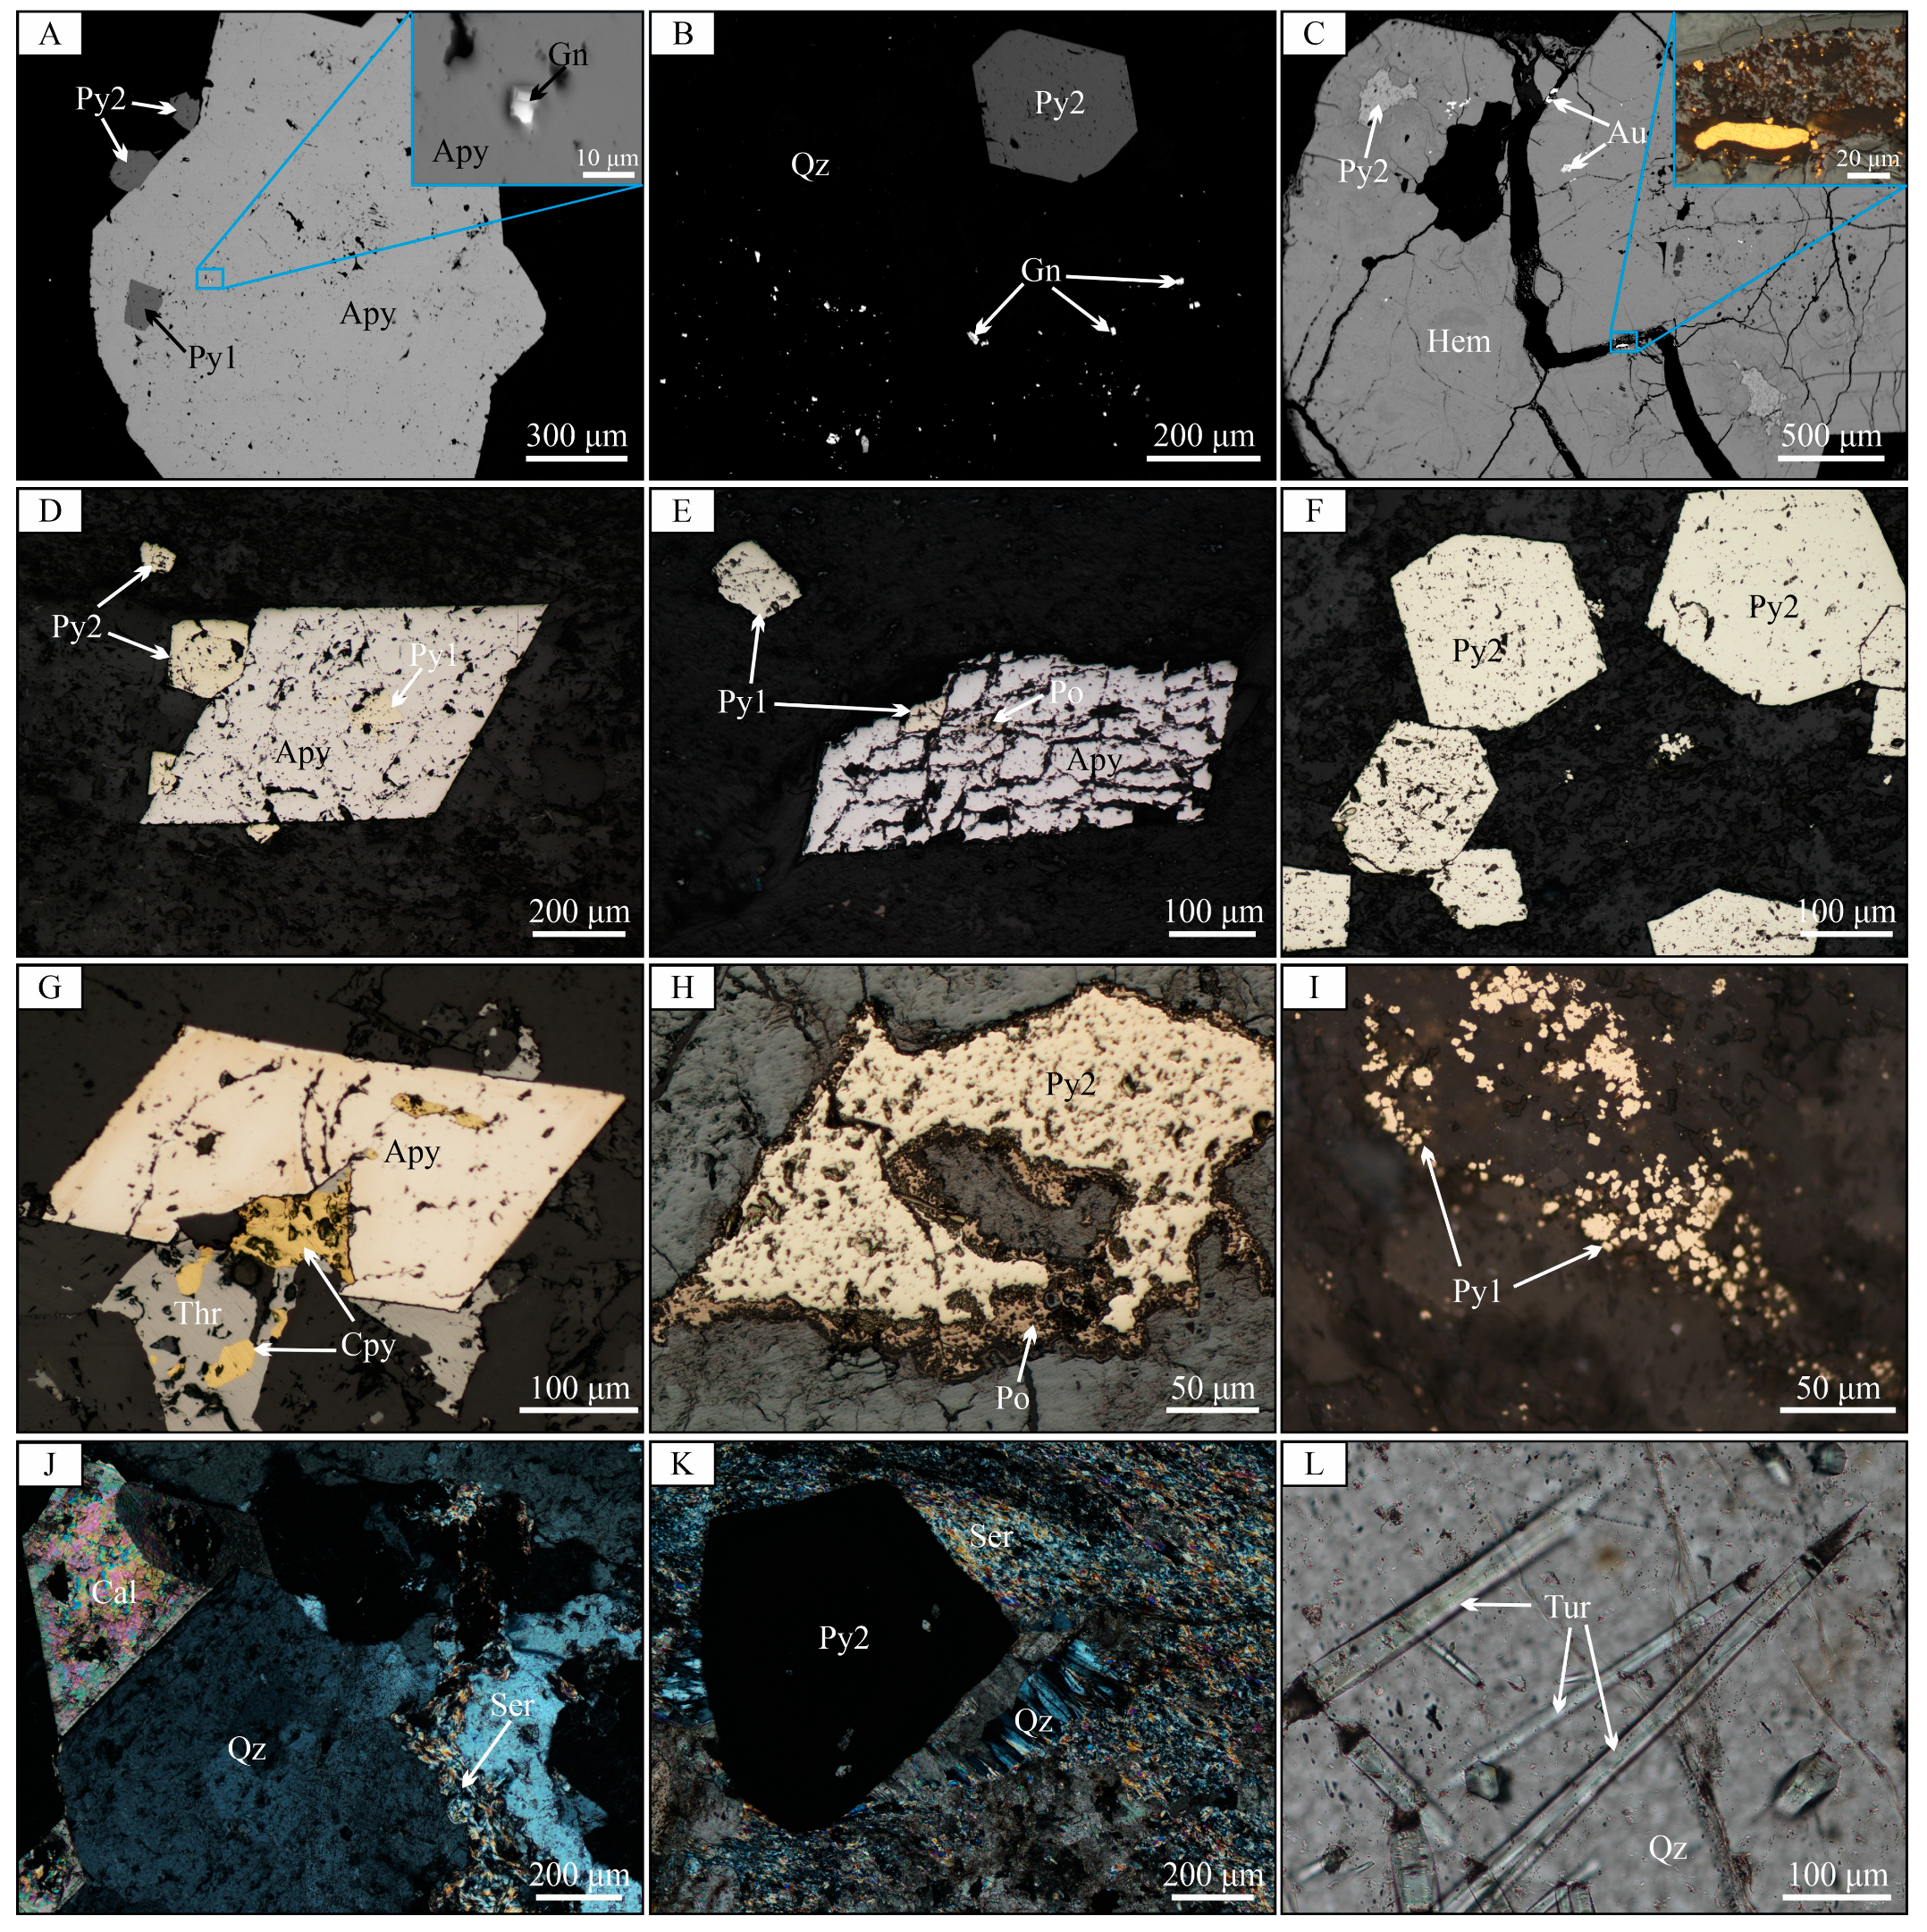
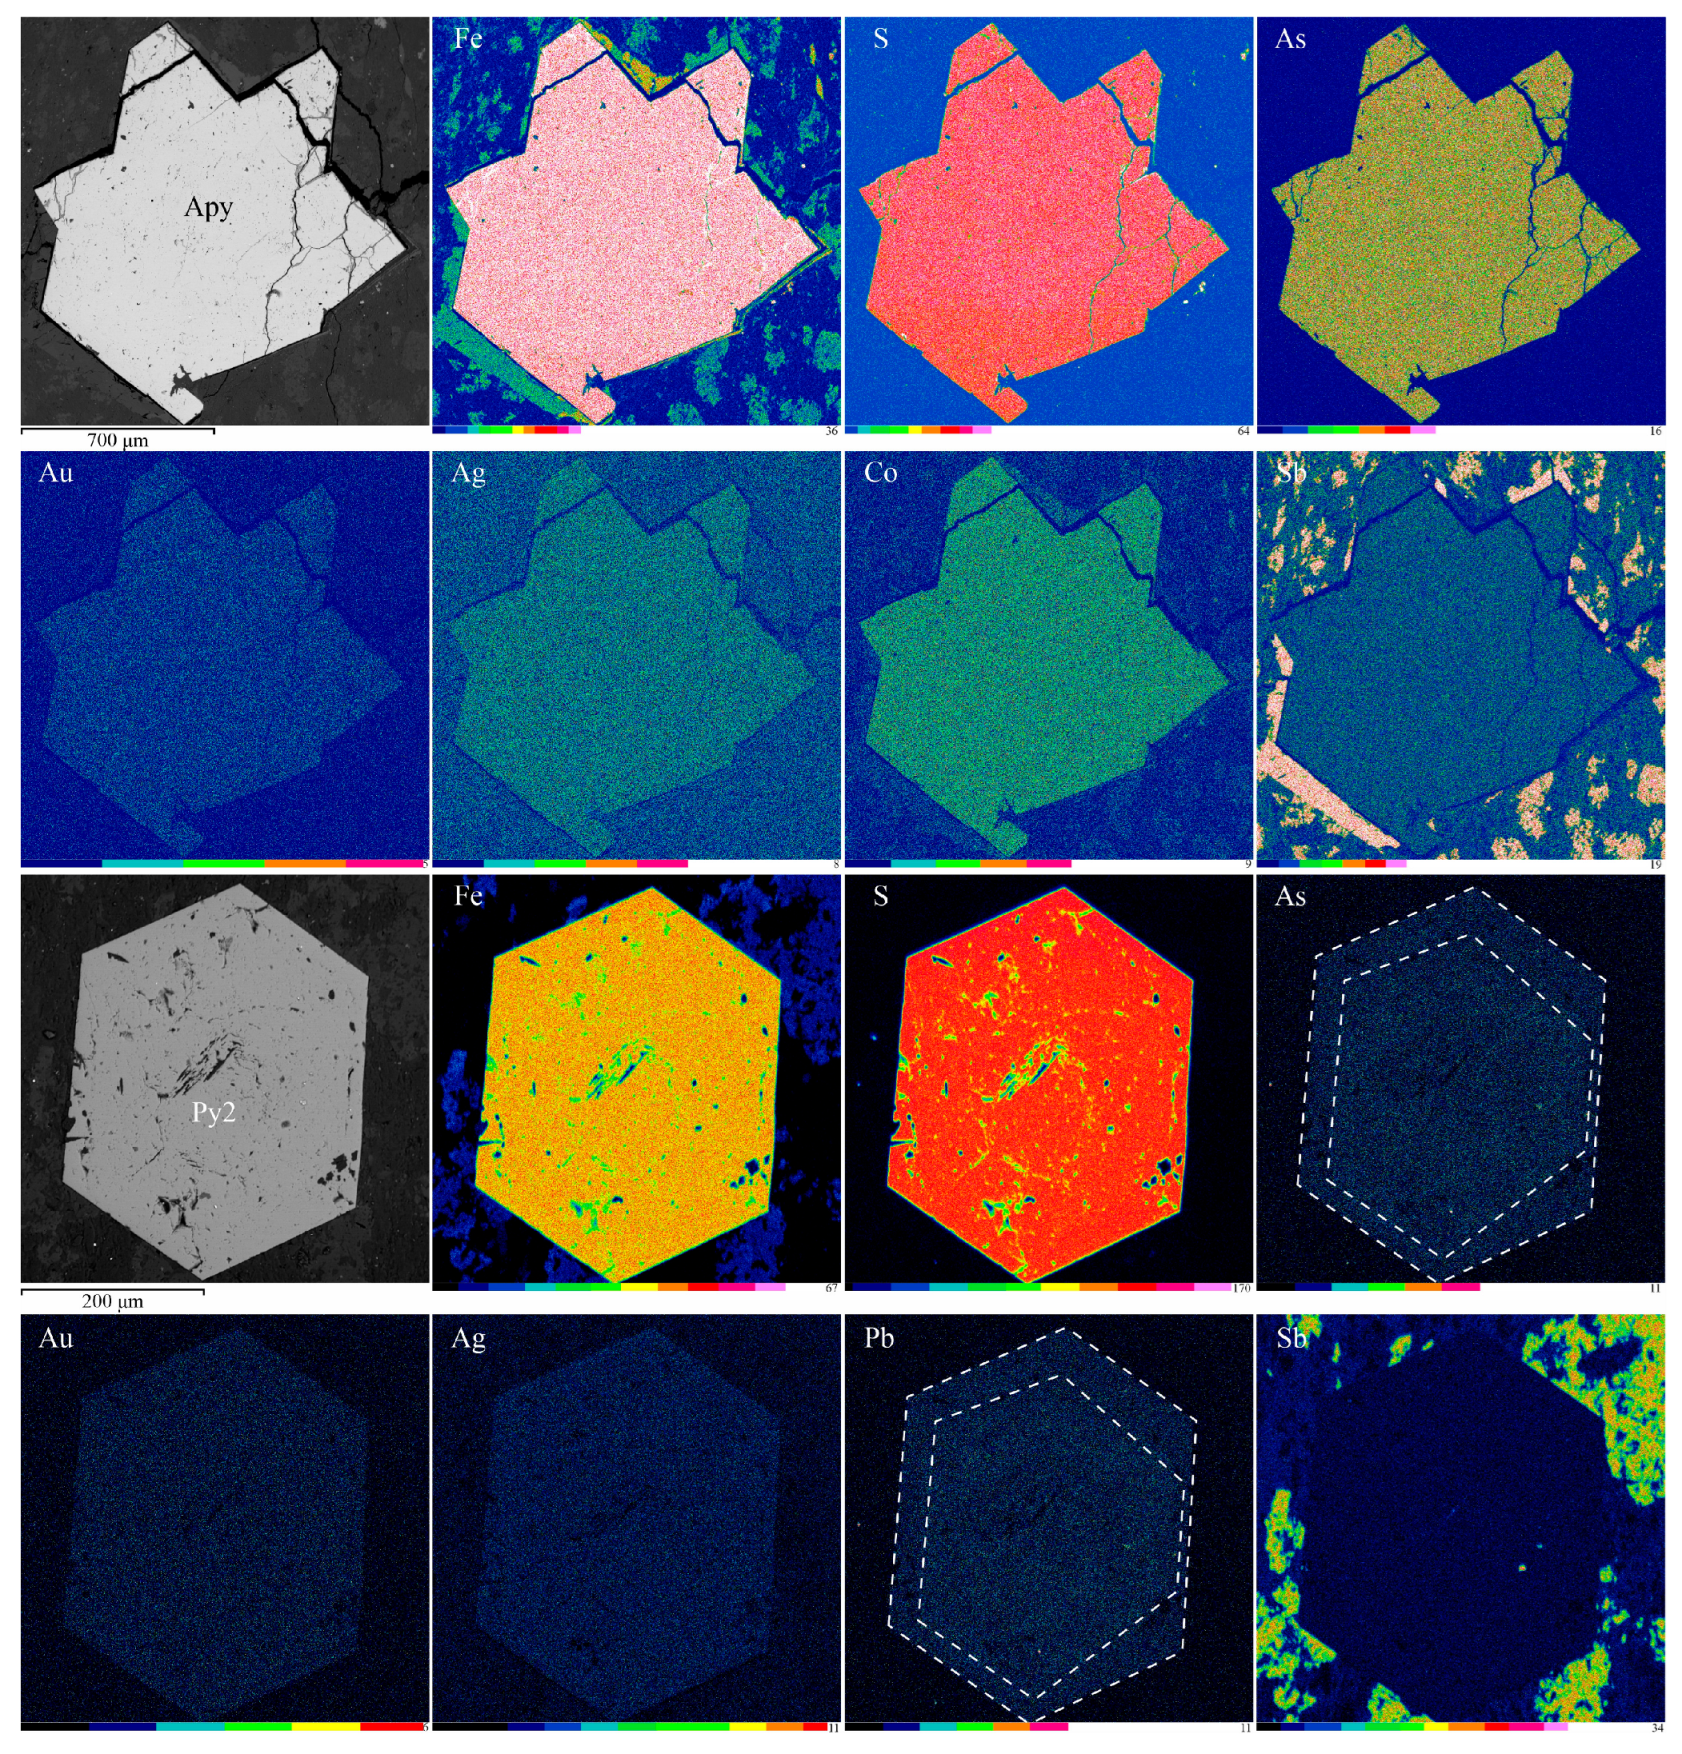
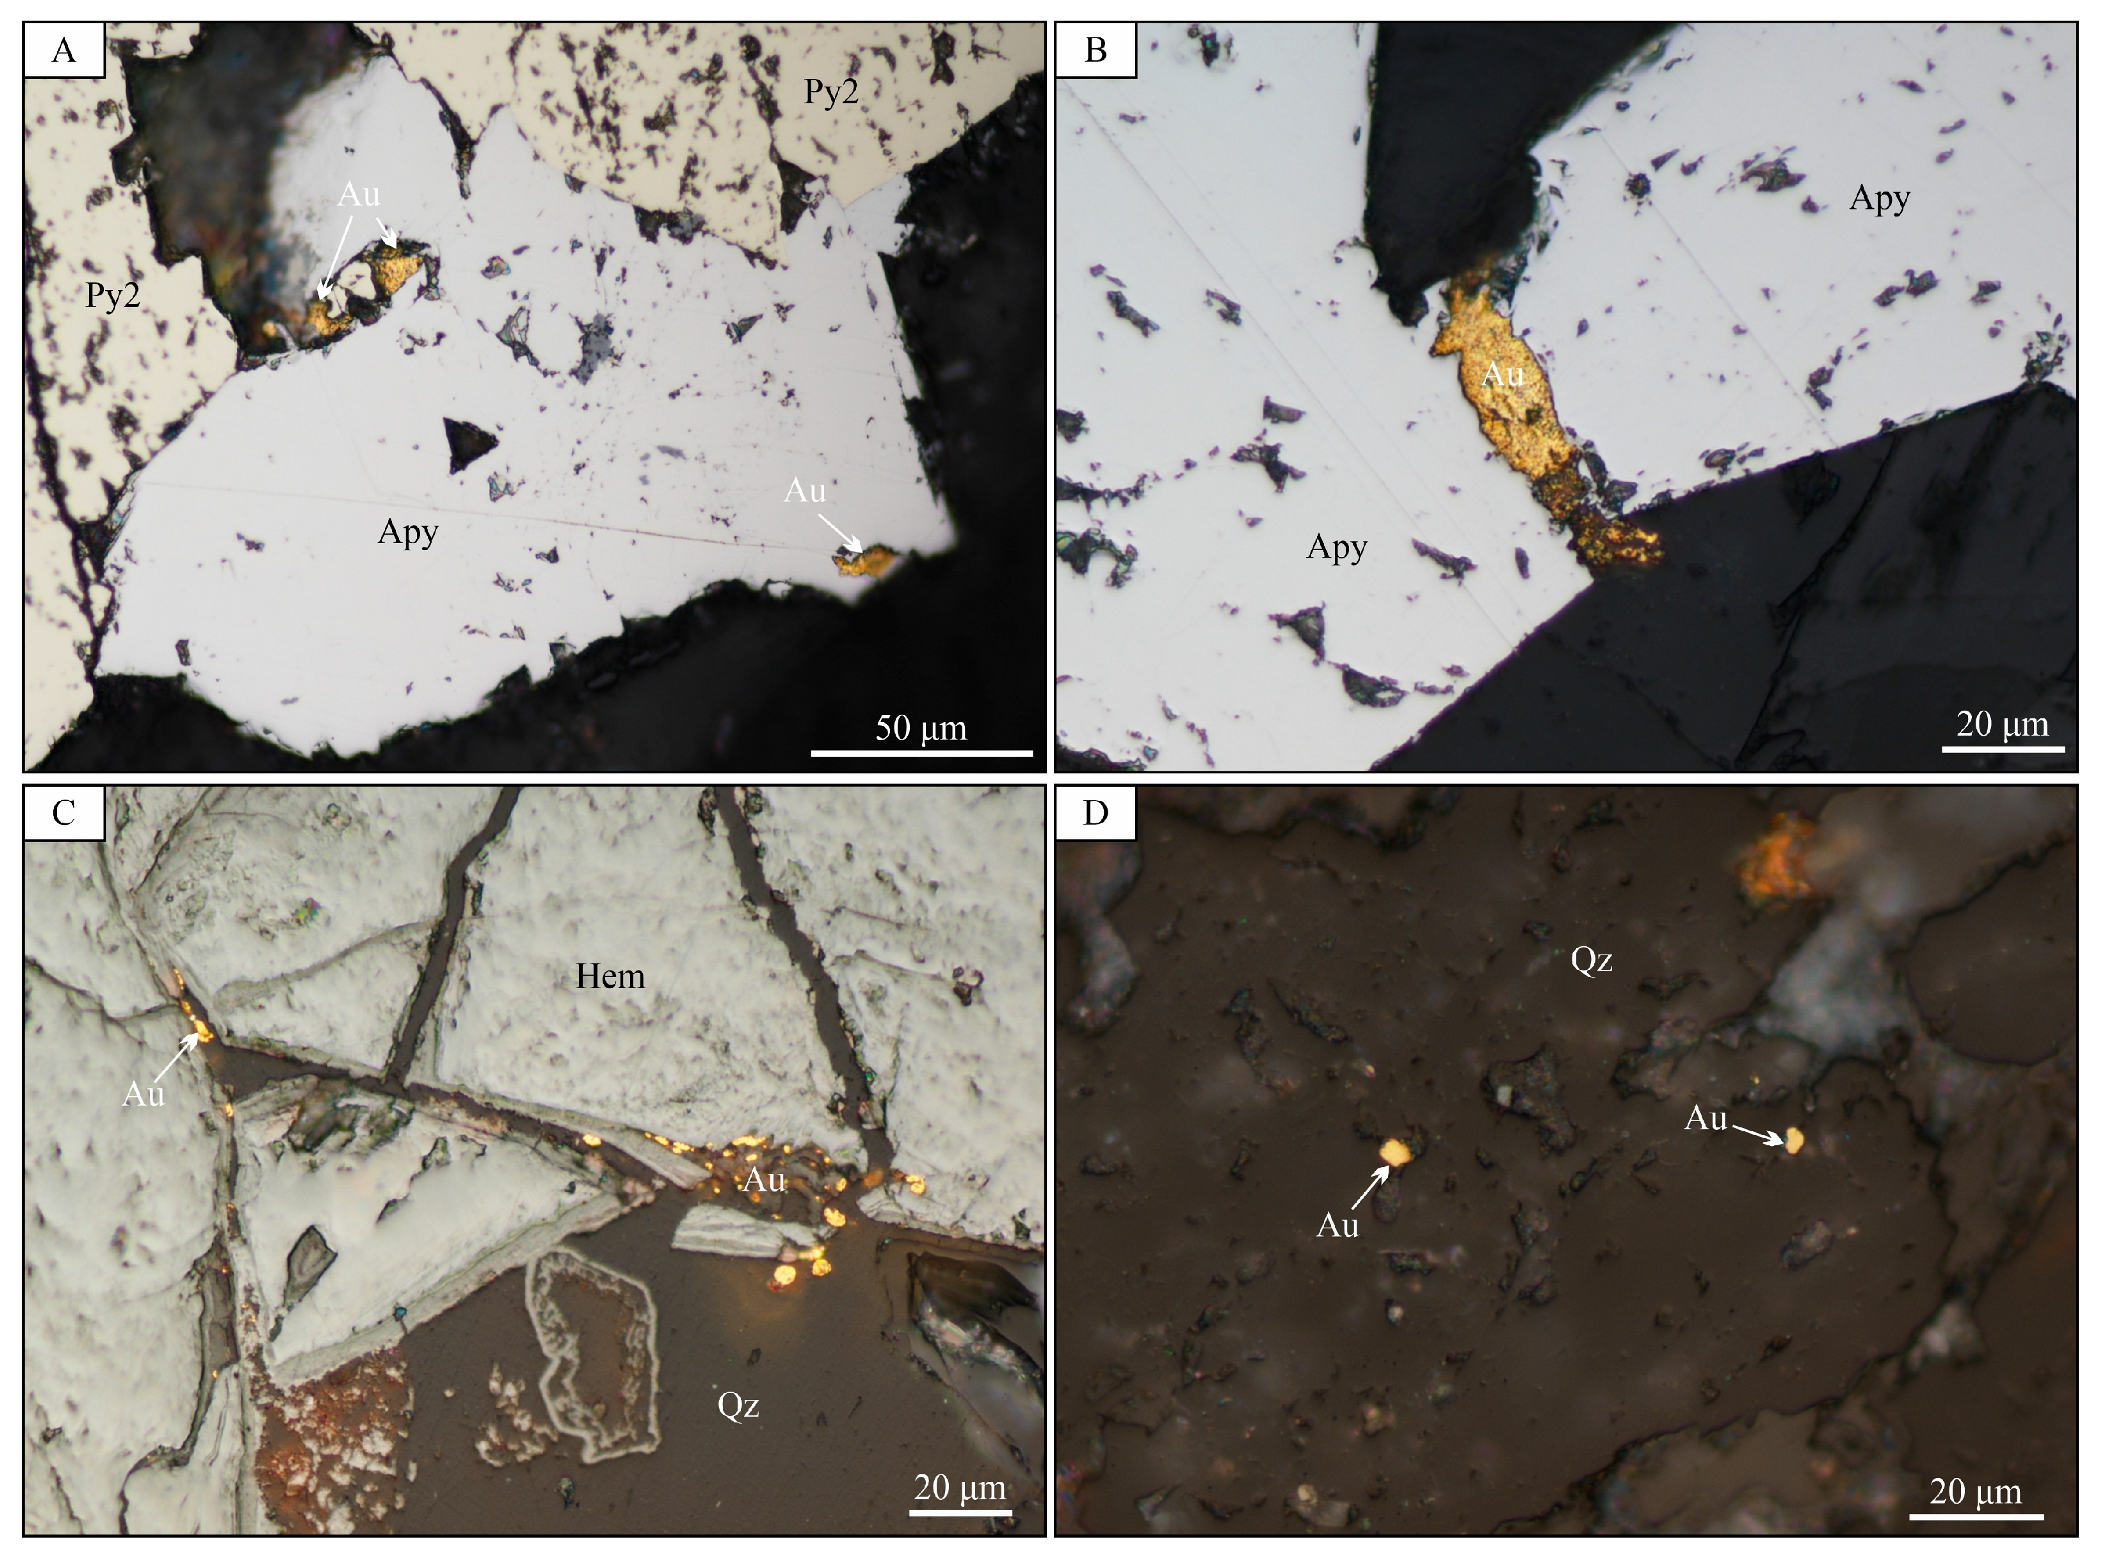
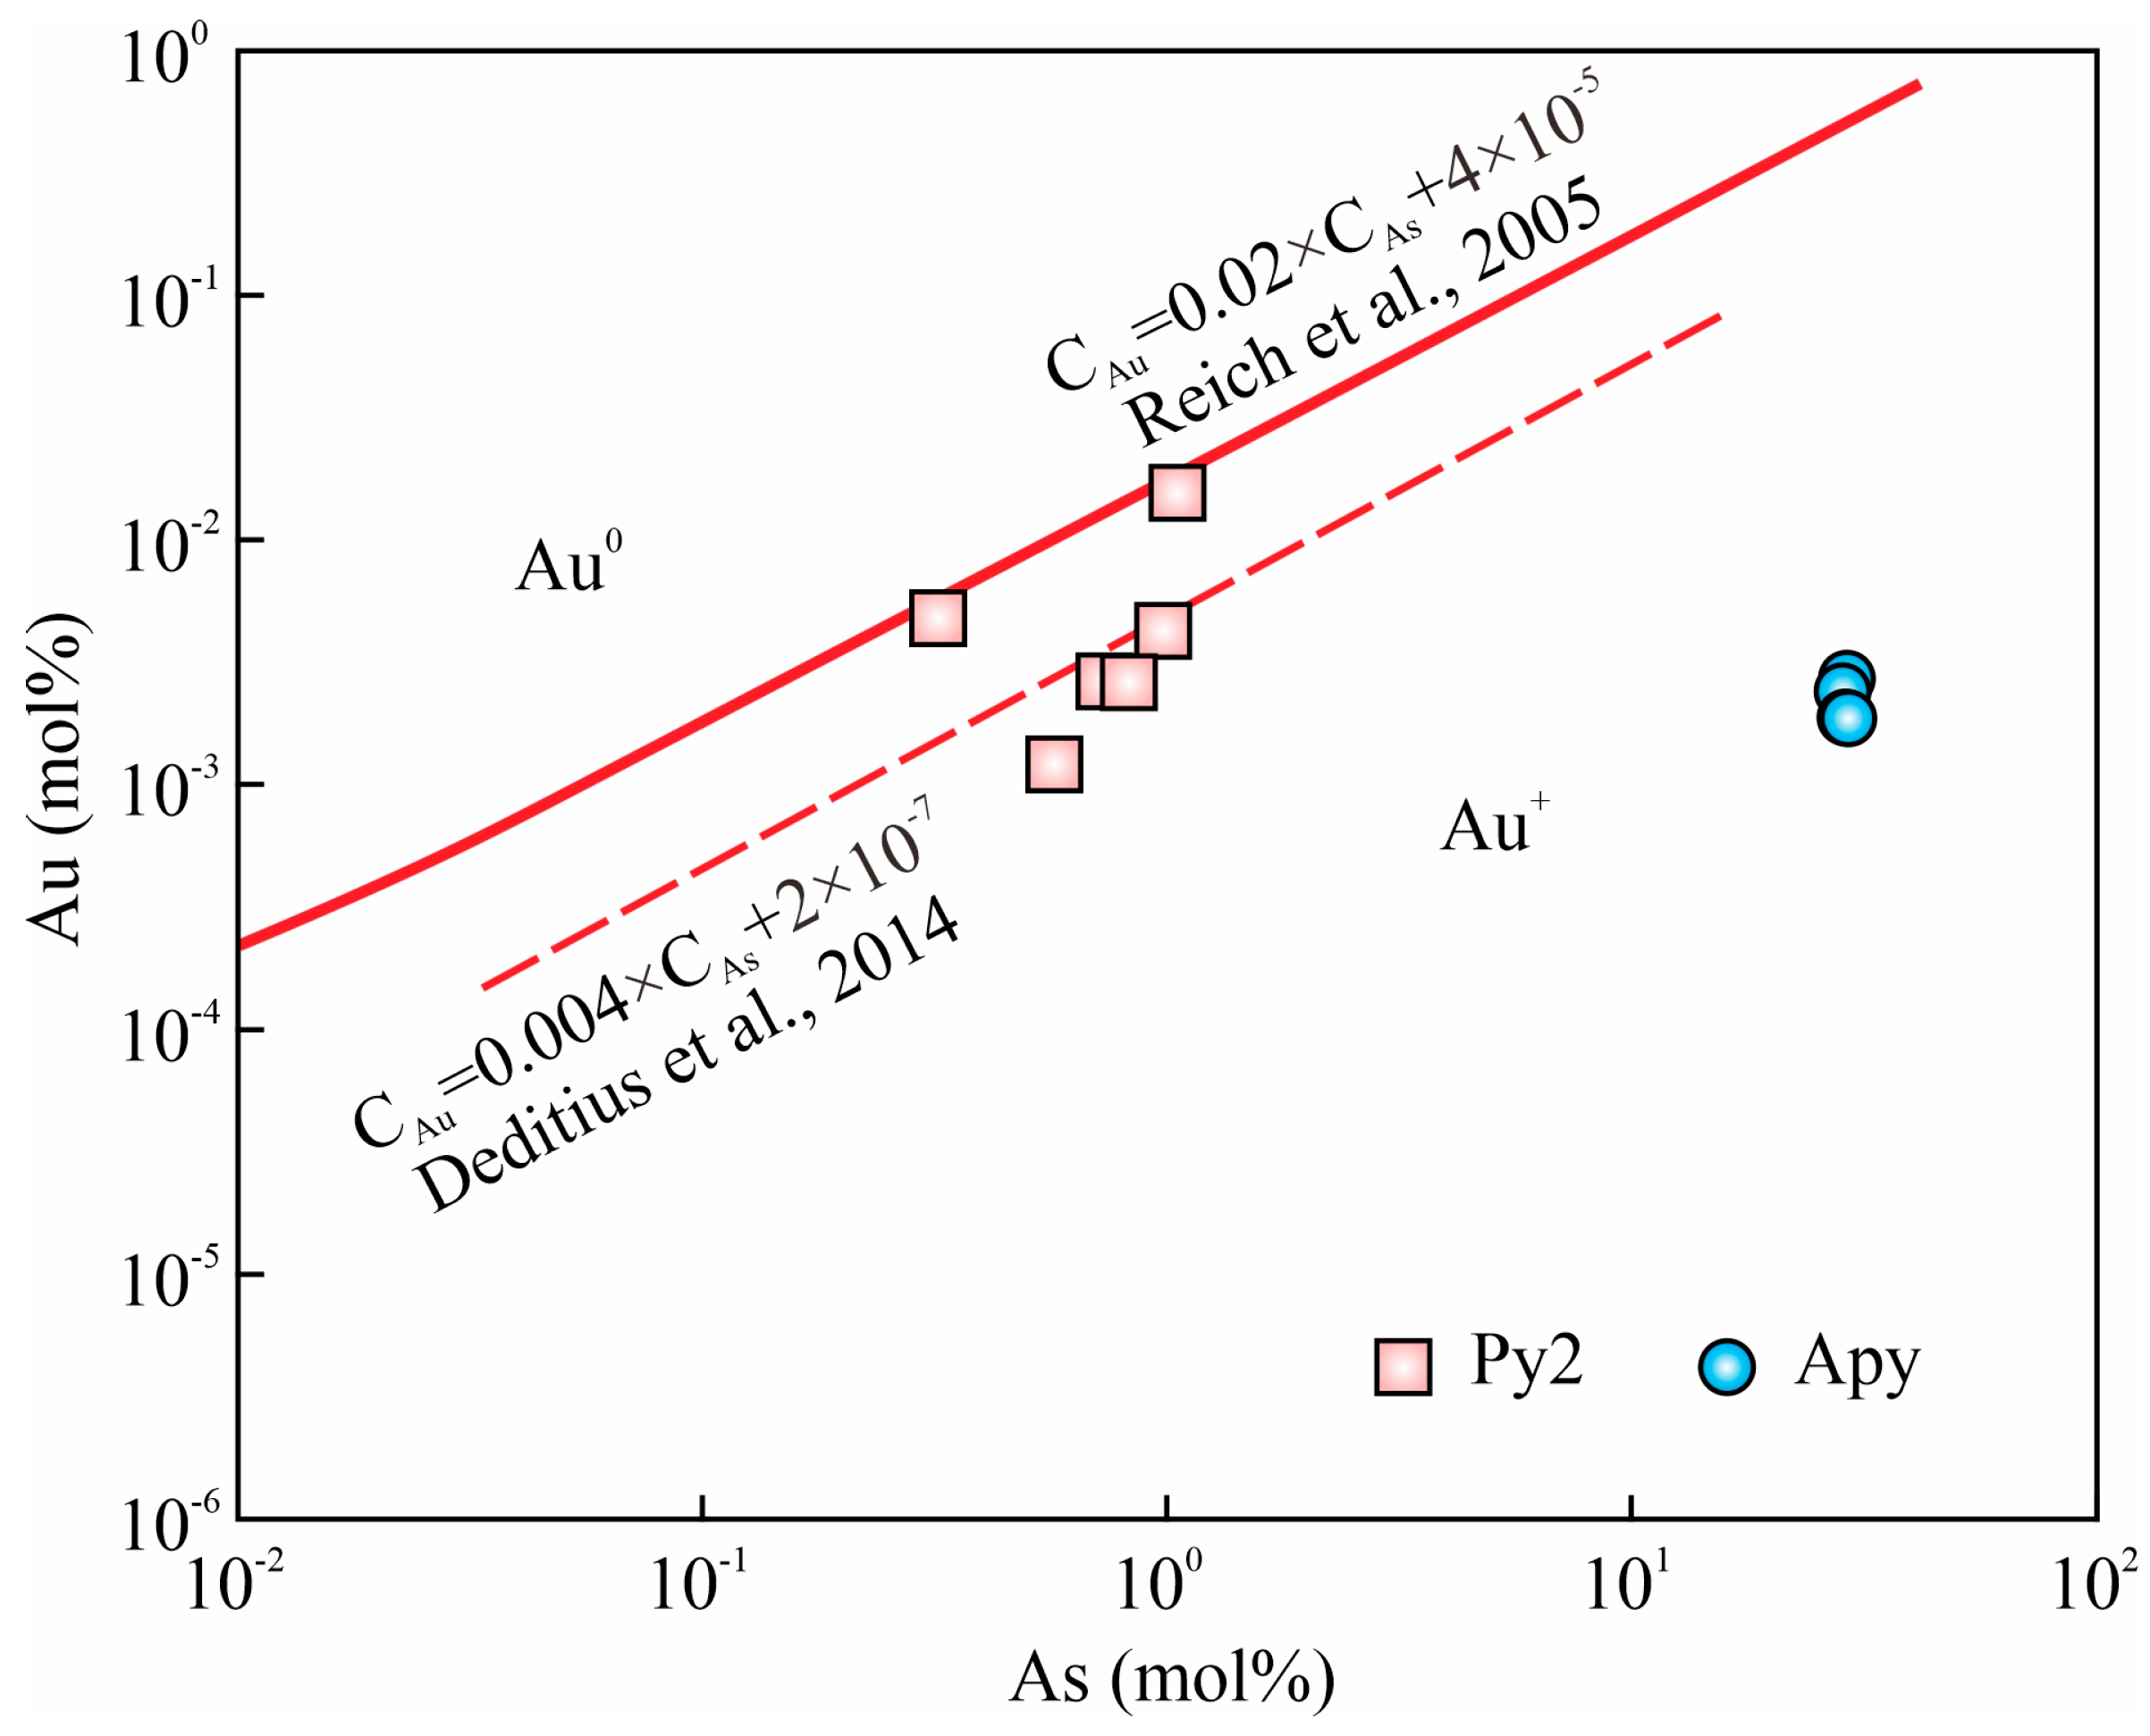
5.1. Chemical Compositions of Native Gold and Sulfides
5.2. Fluid Inclusion Geochemistry
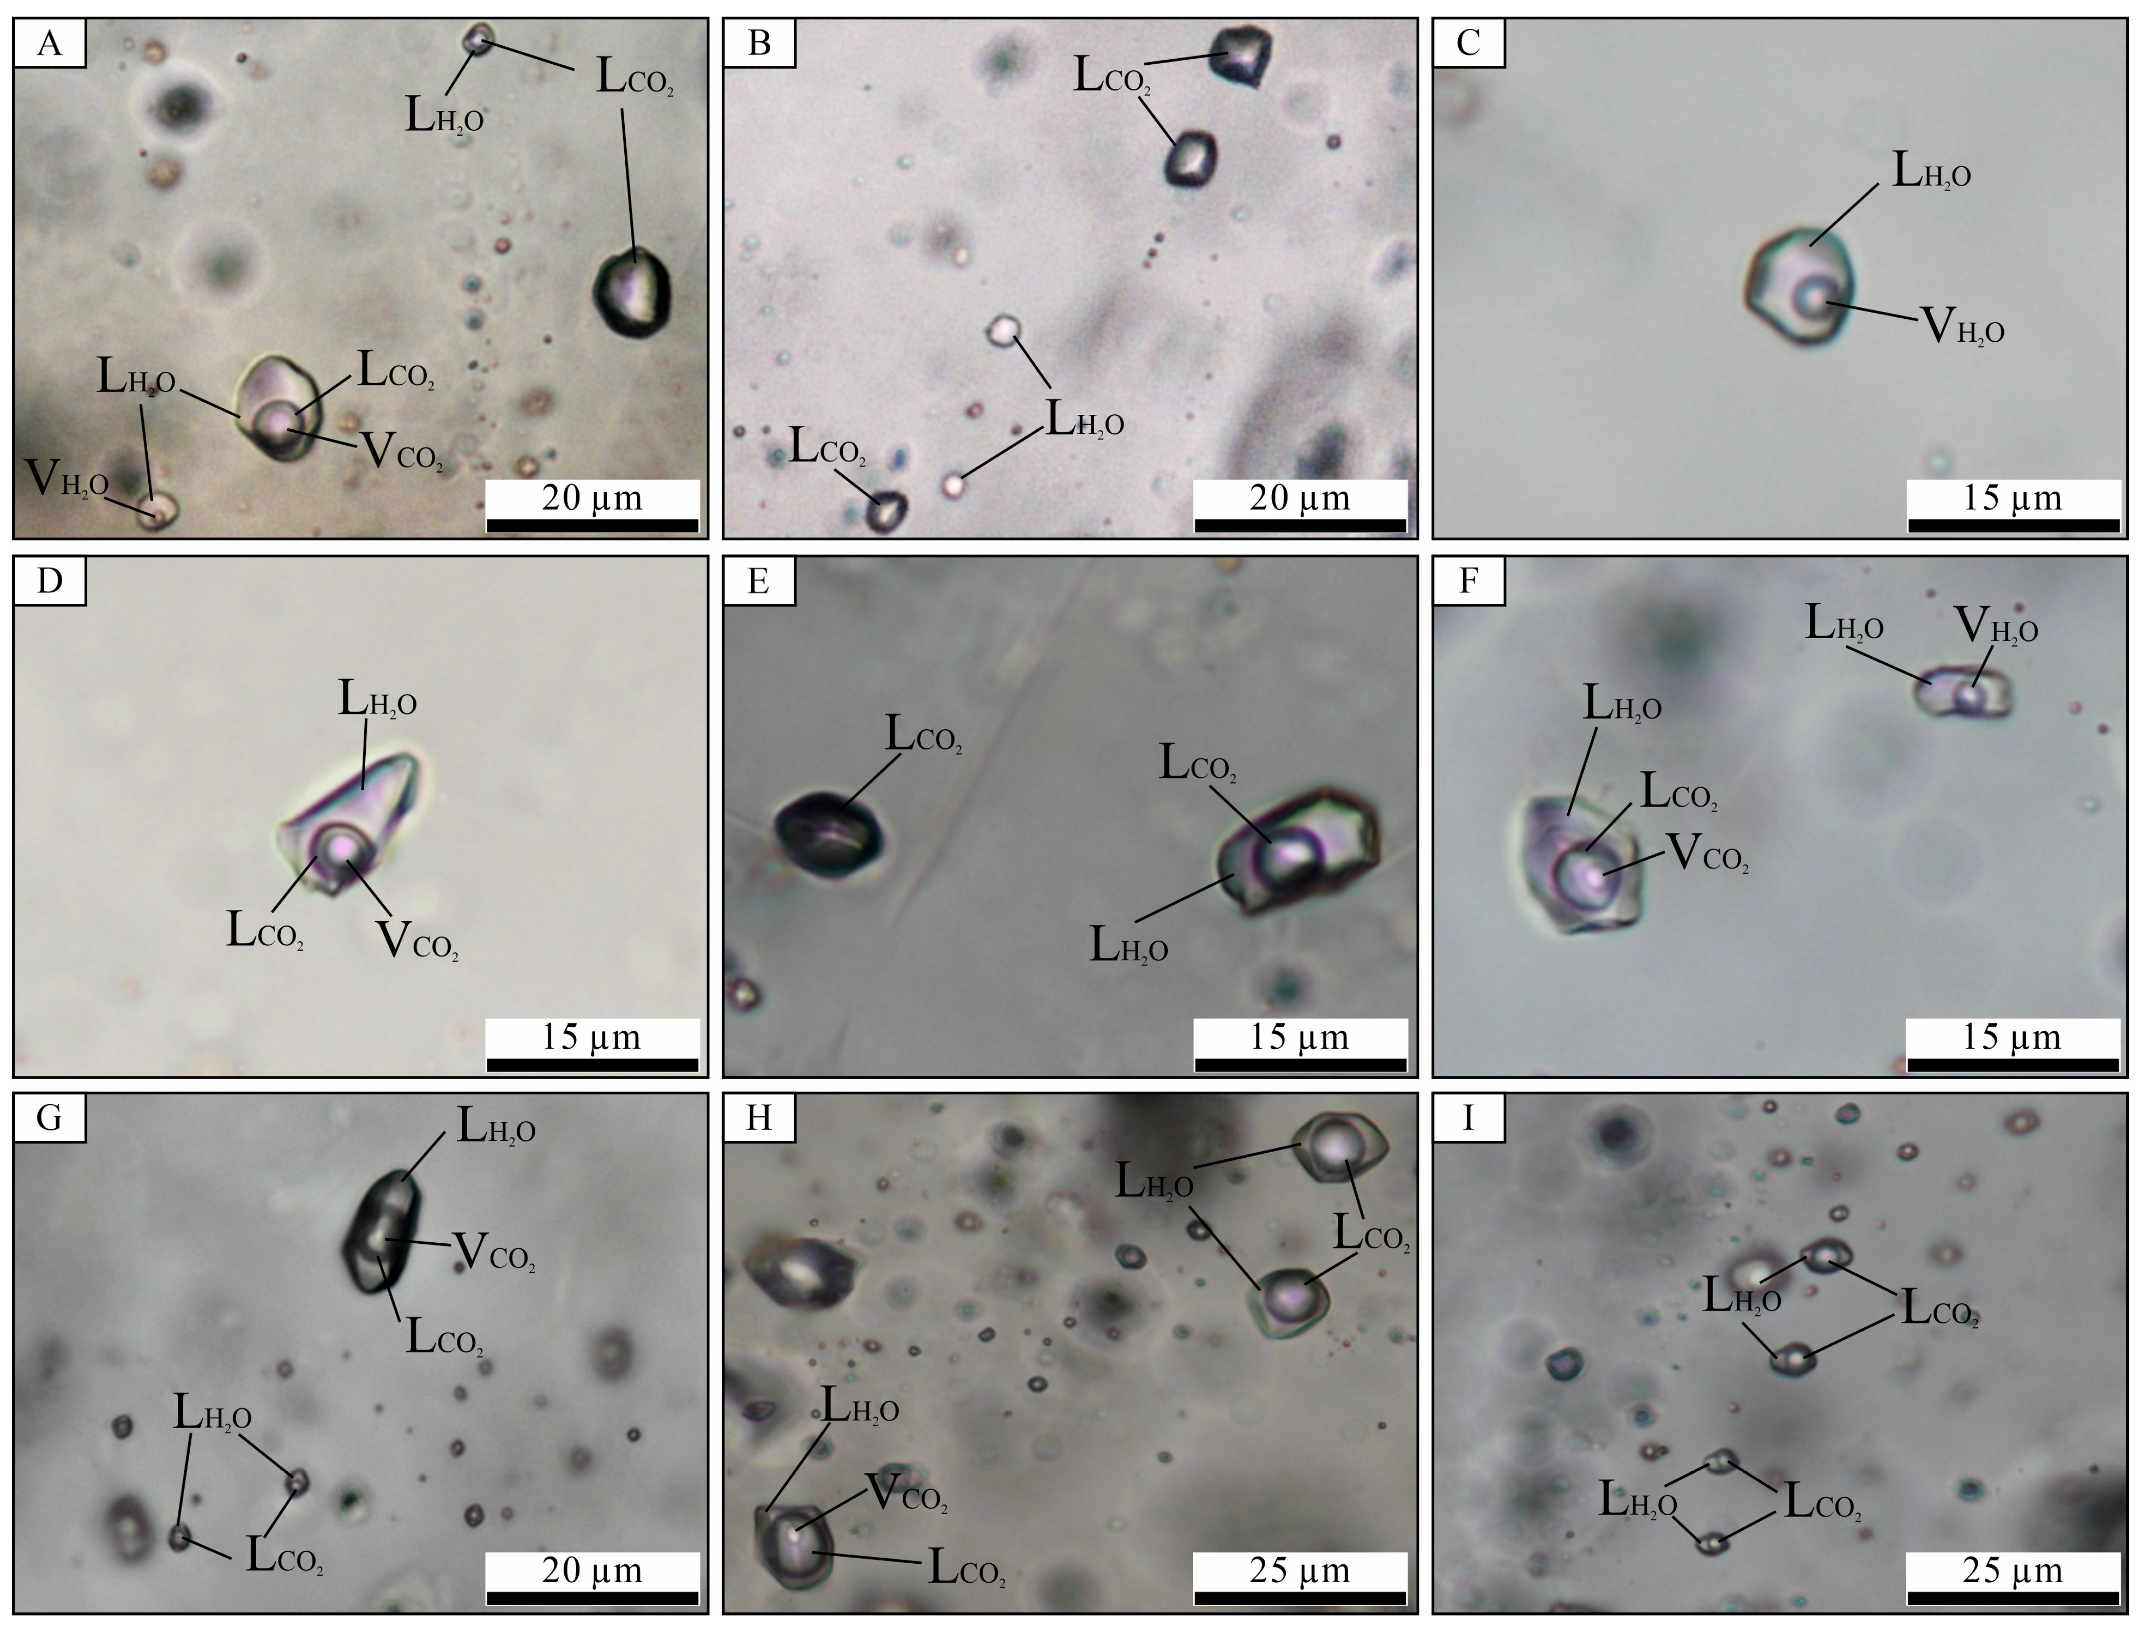
5.2.1. Petrography and Classification
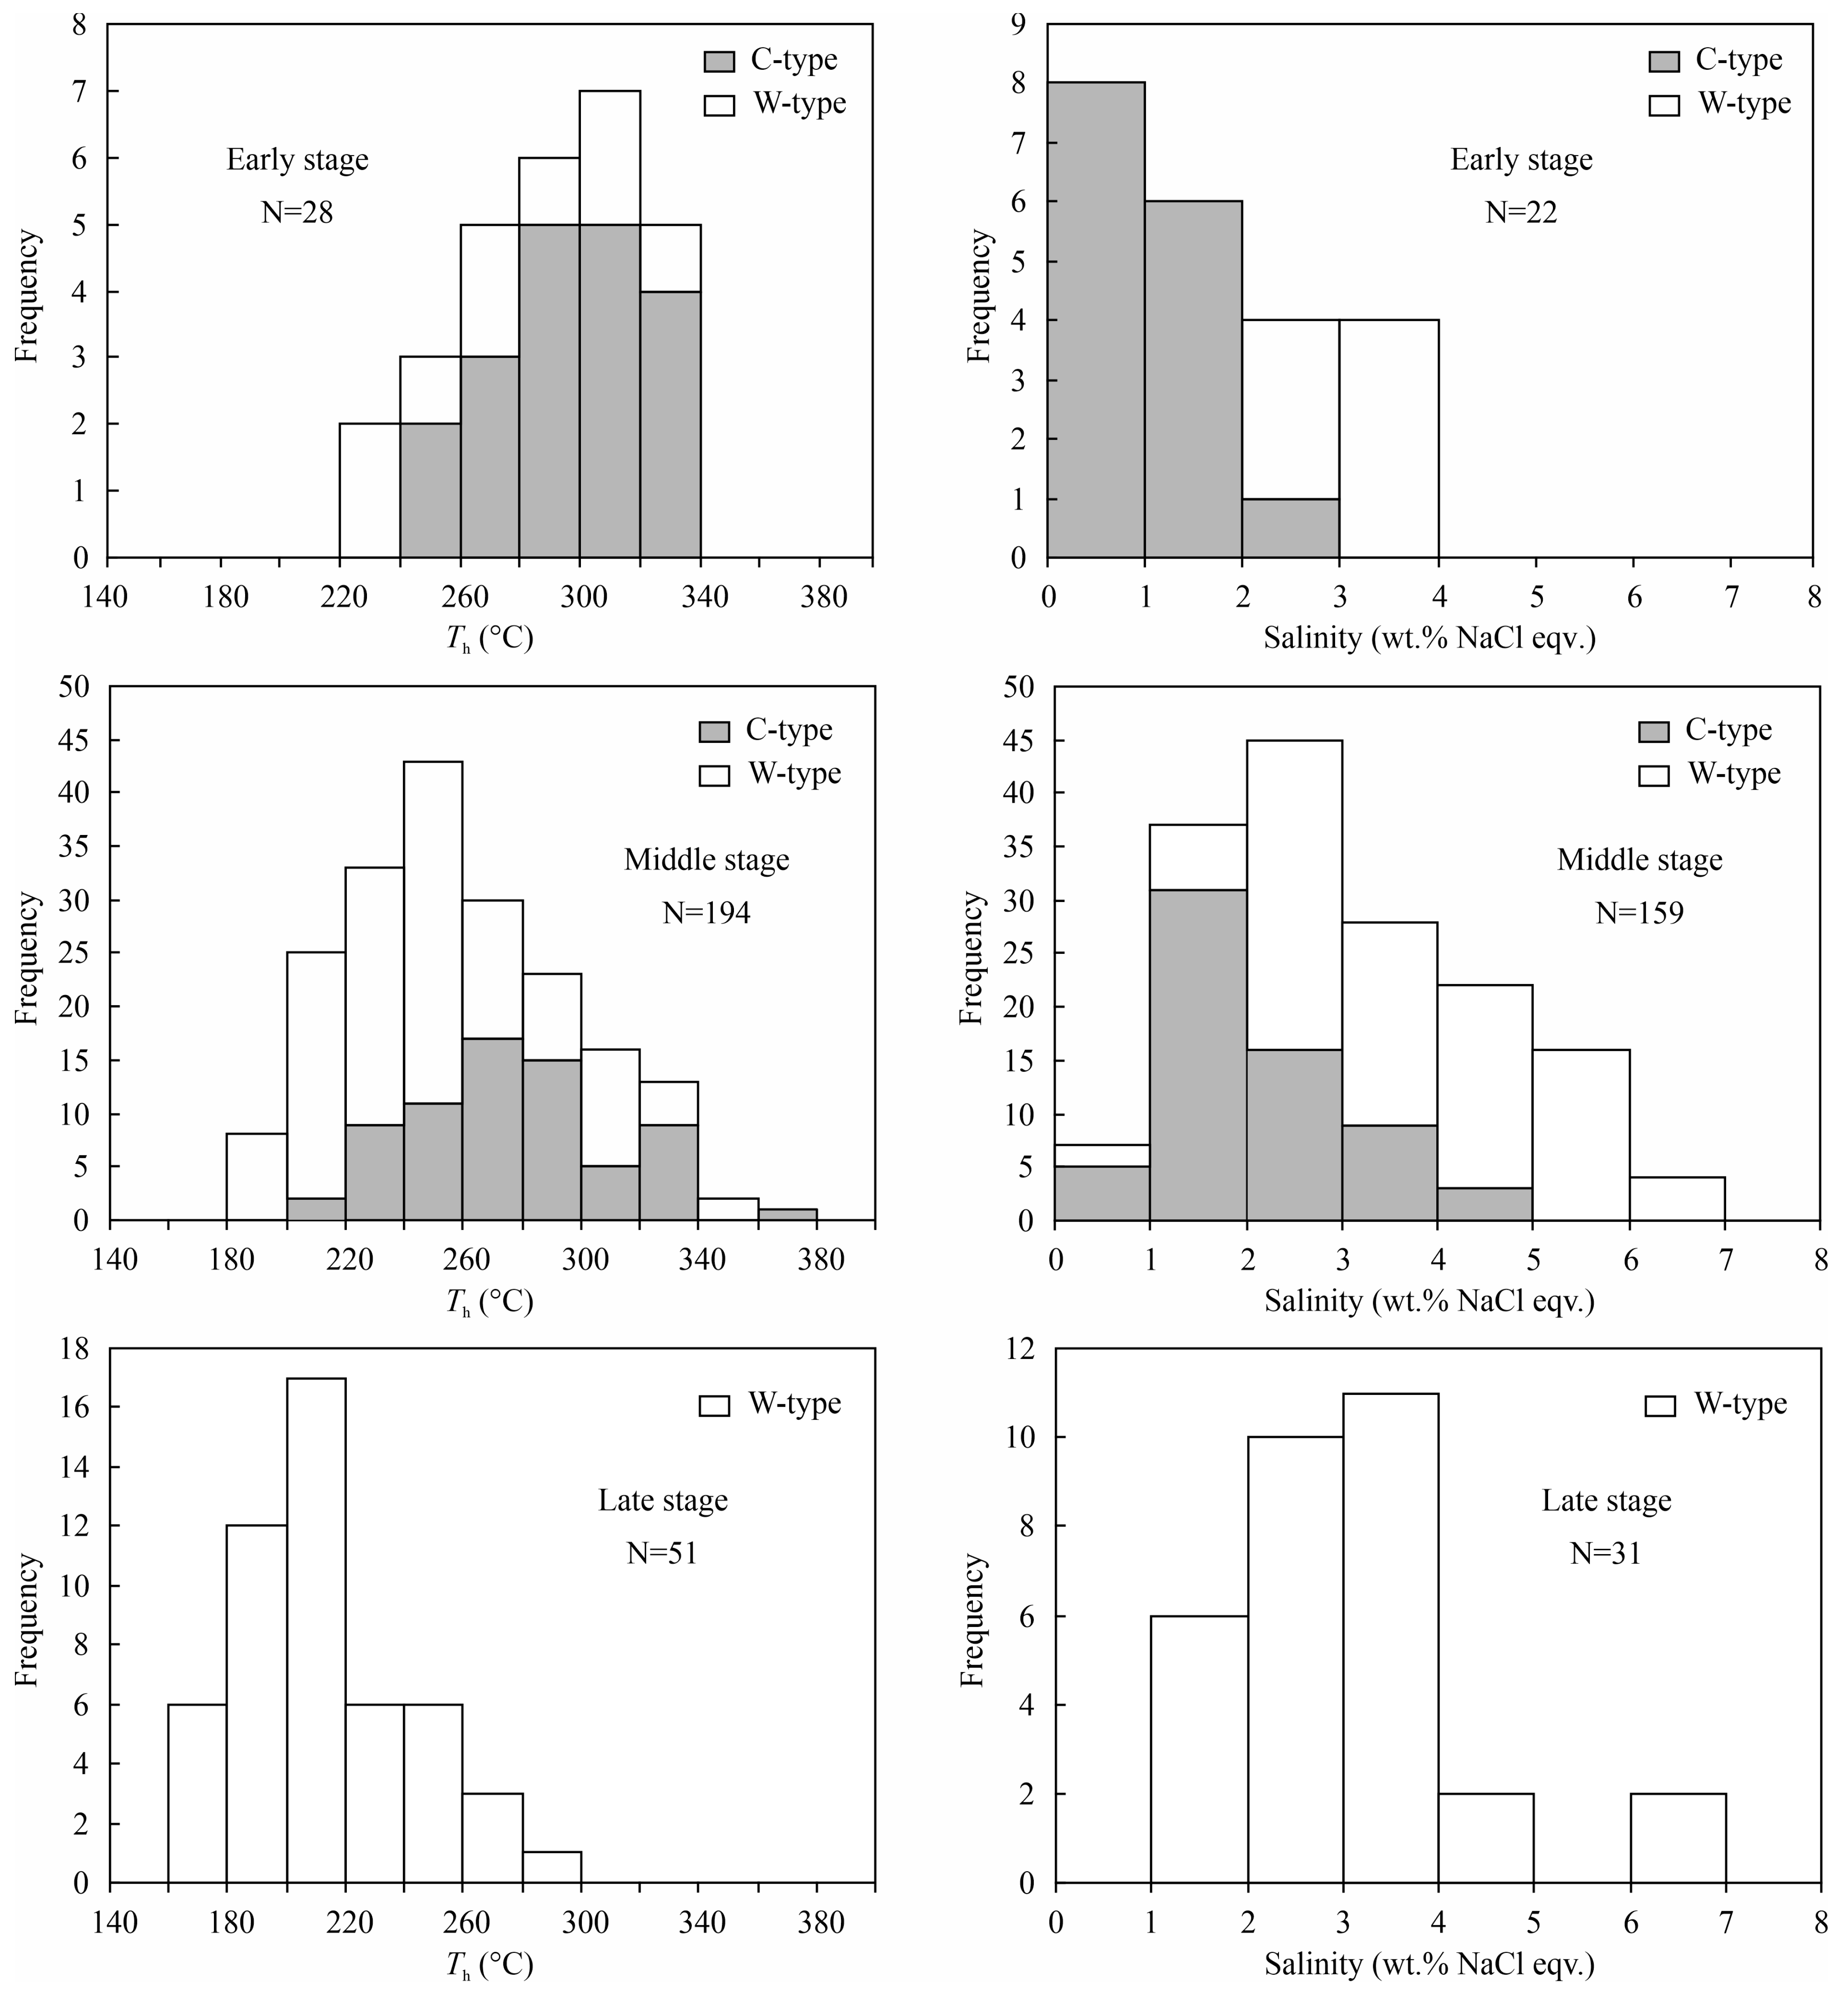
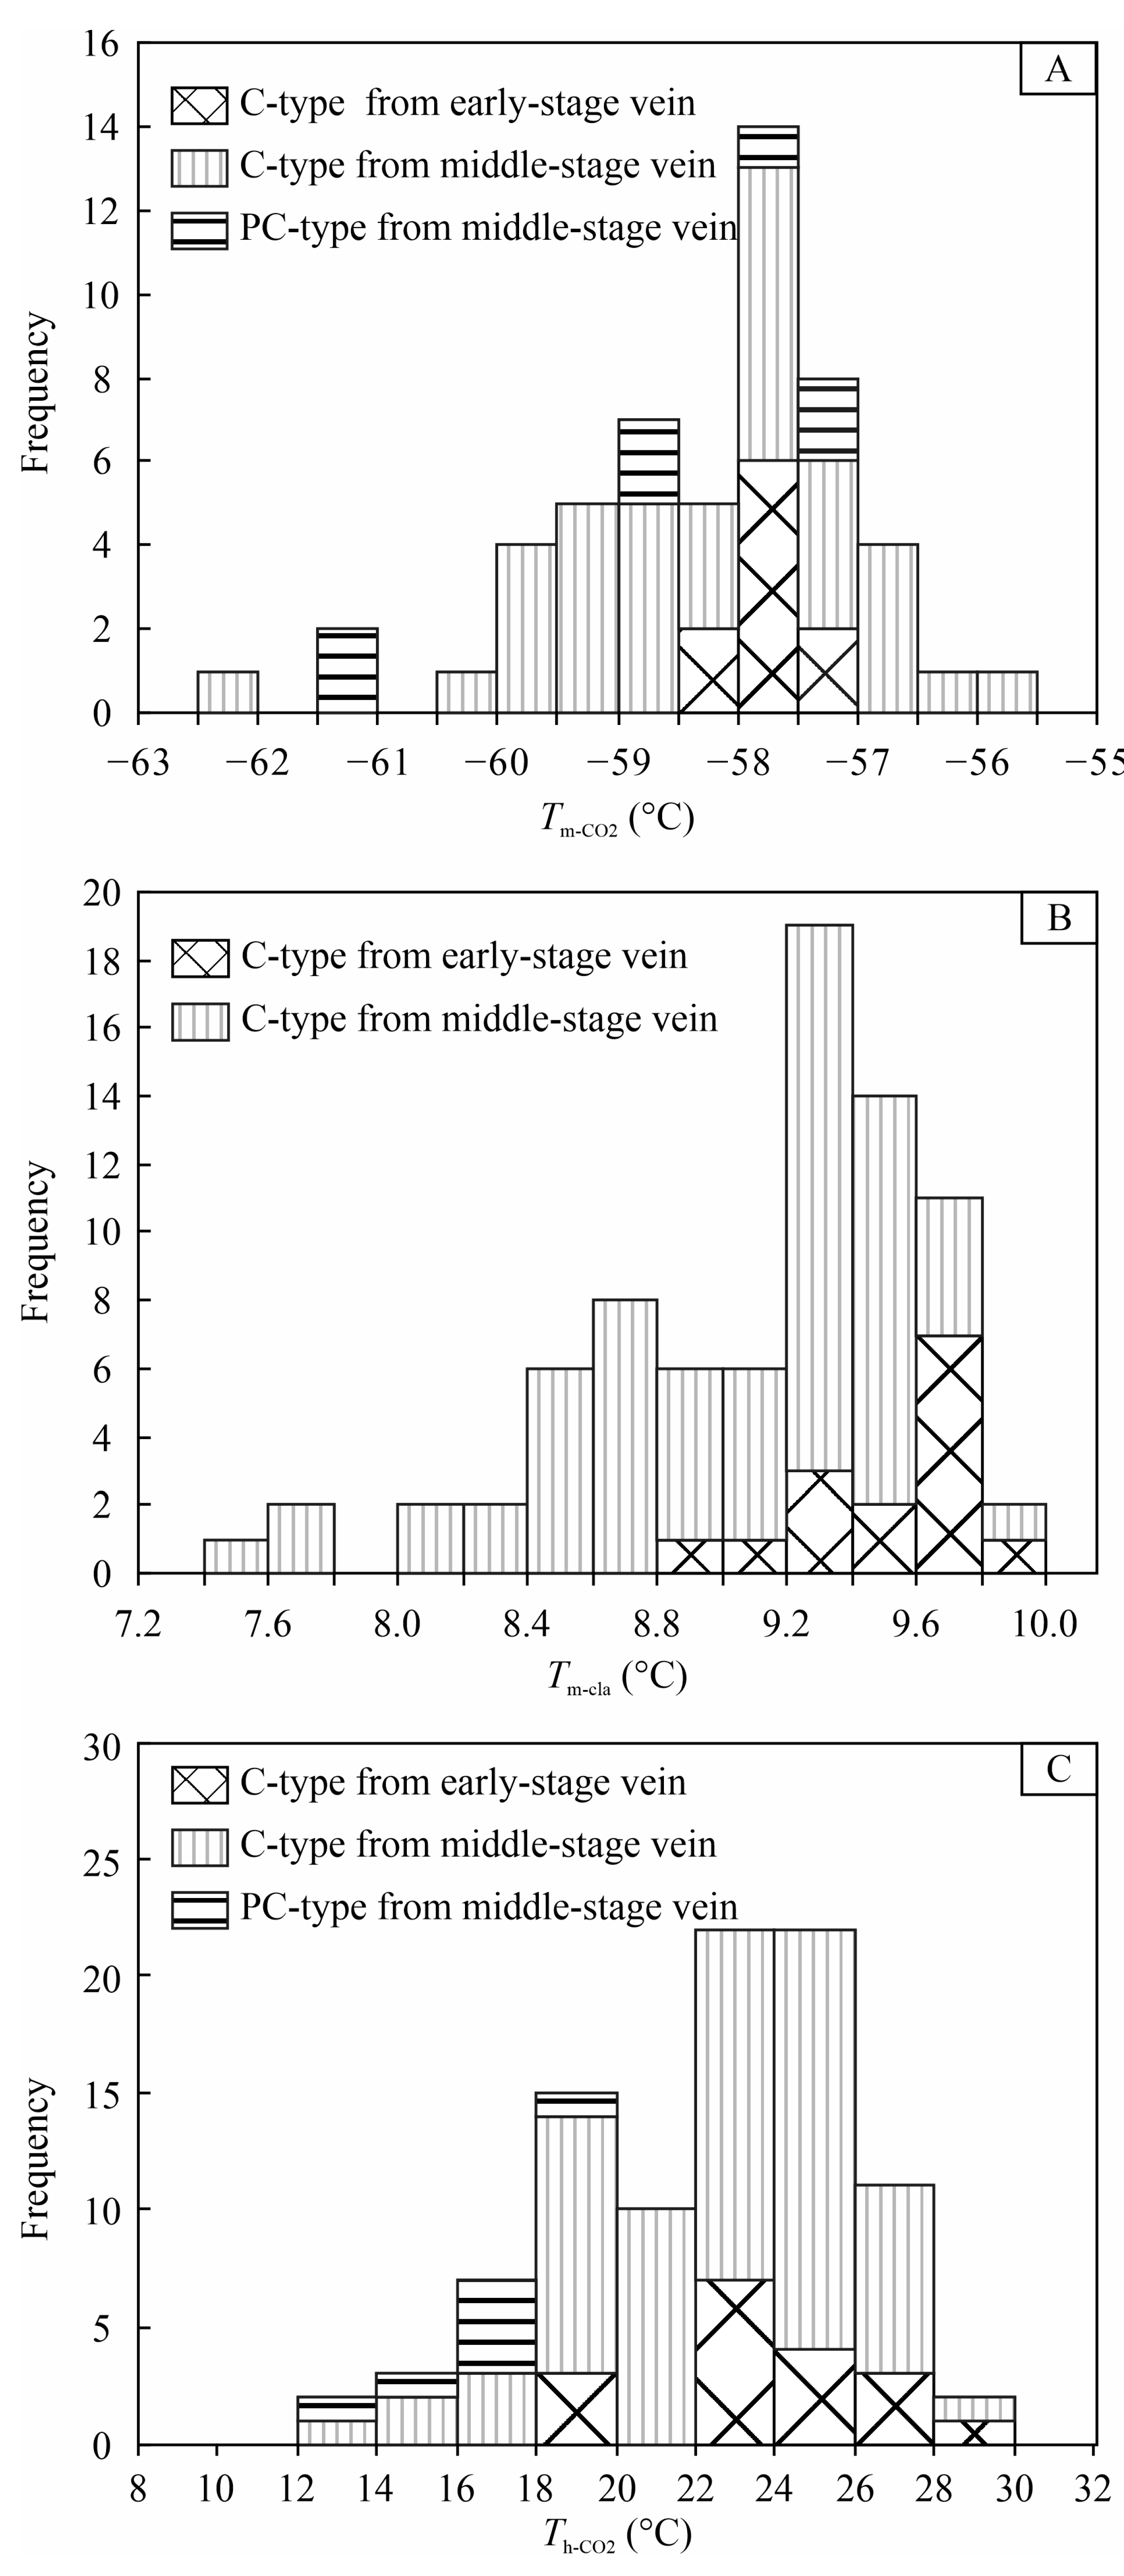
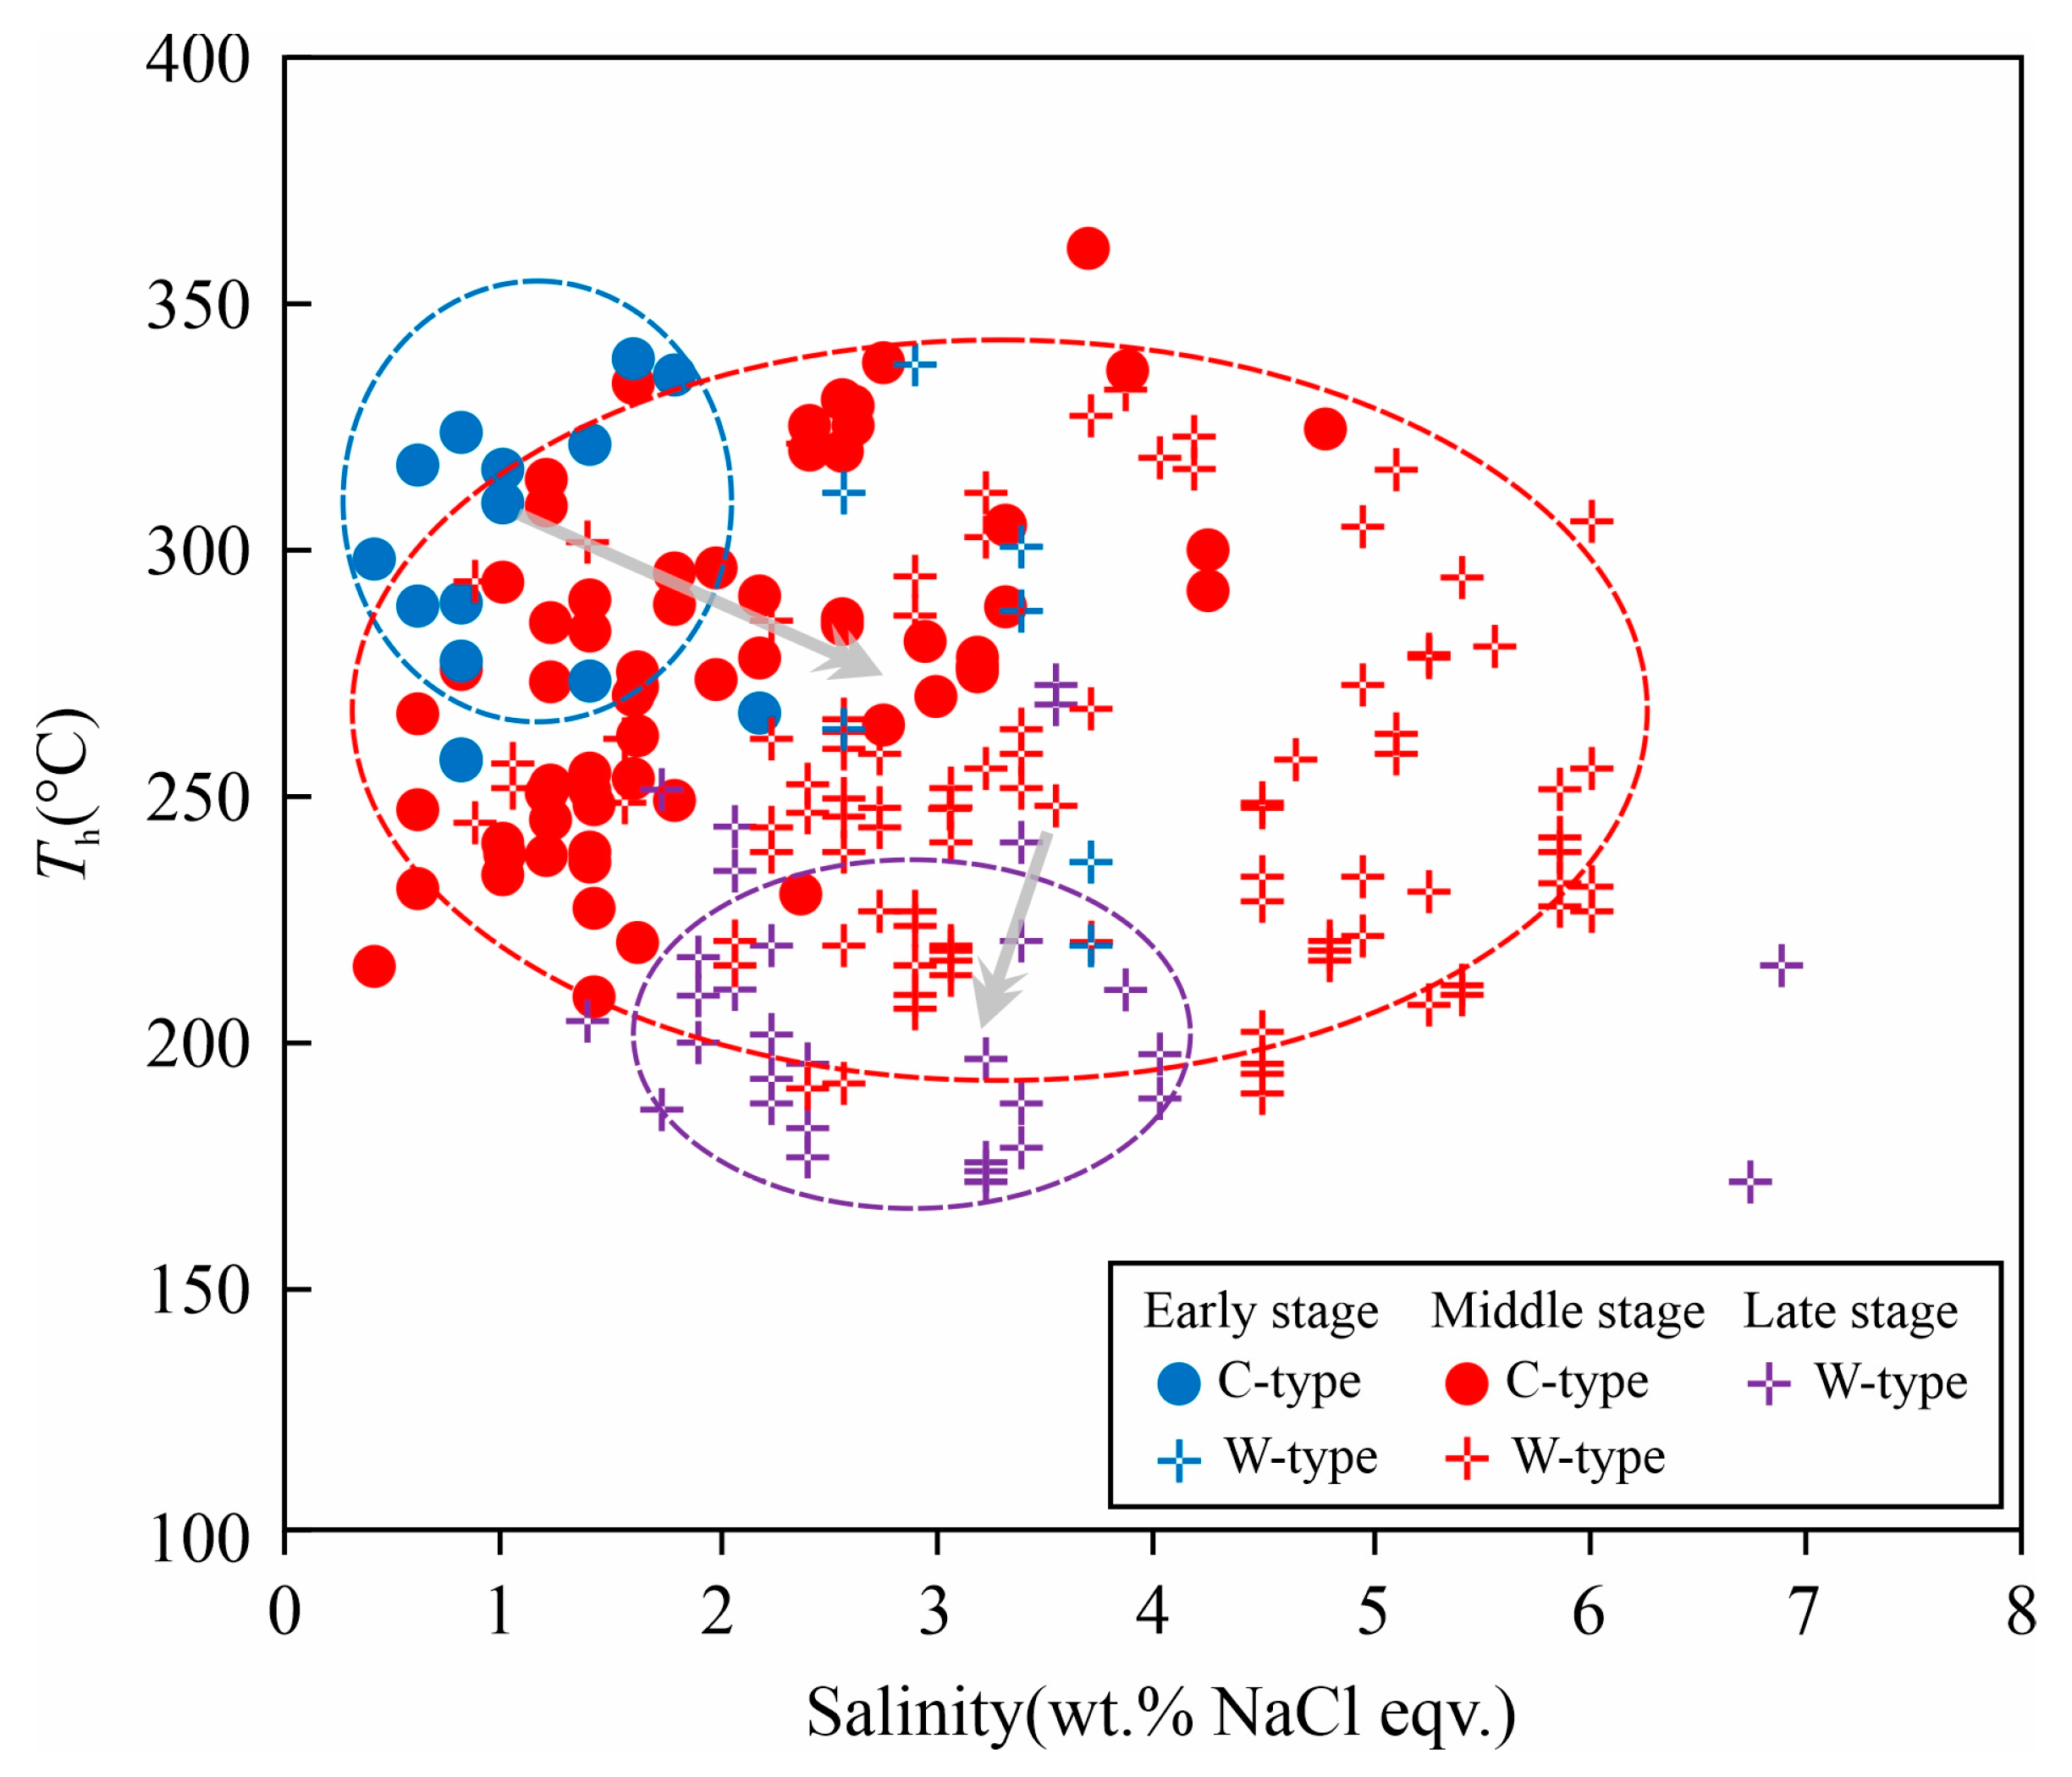
5.2.2. Microthermometry
5.2.3. Metallogenic Pressure and Depth
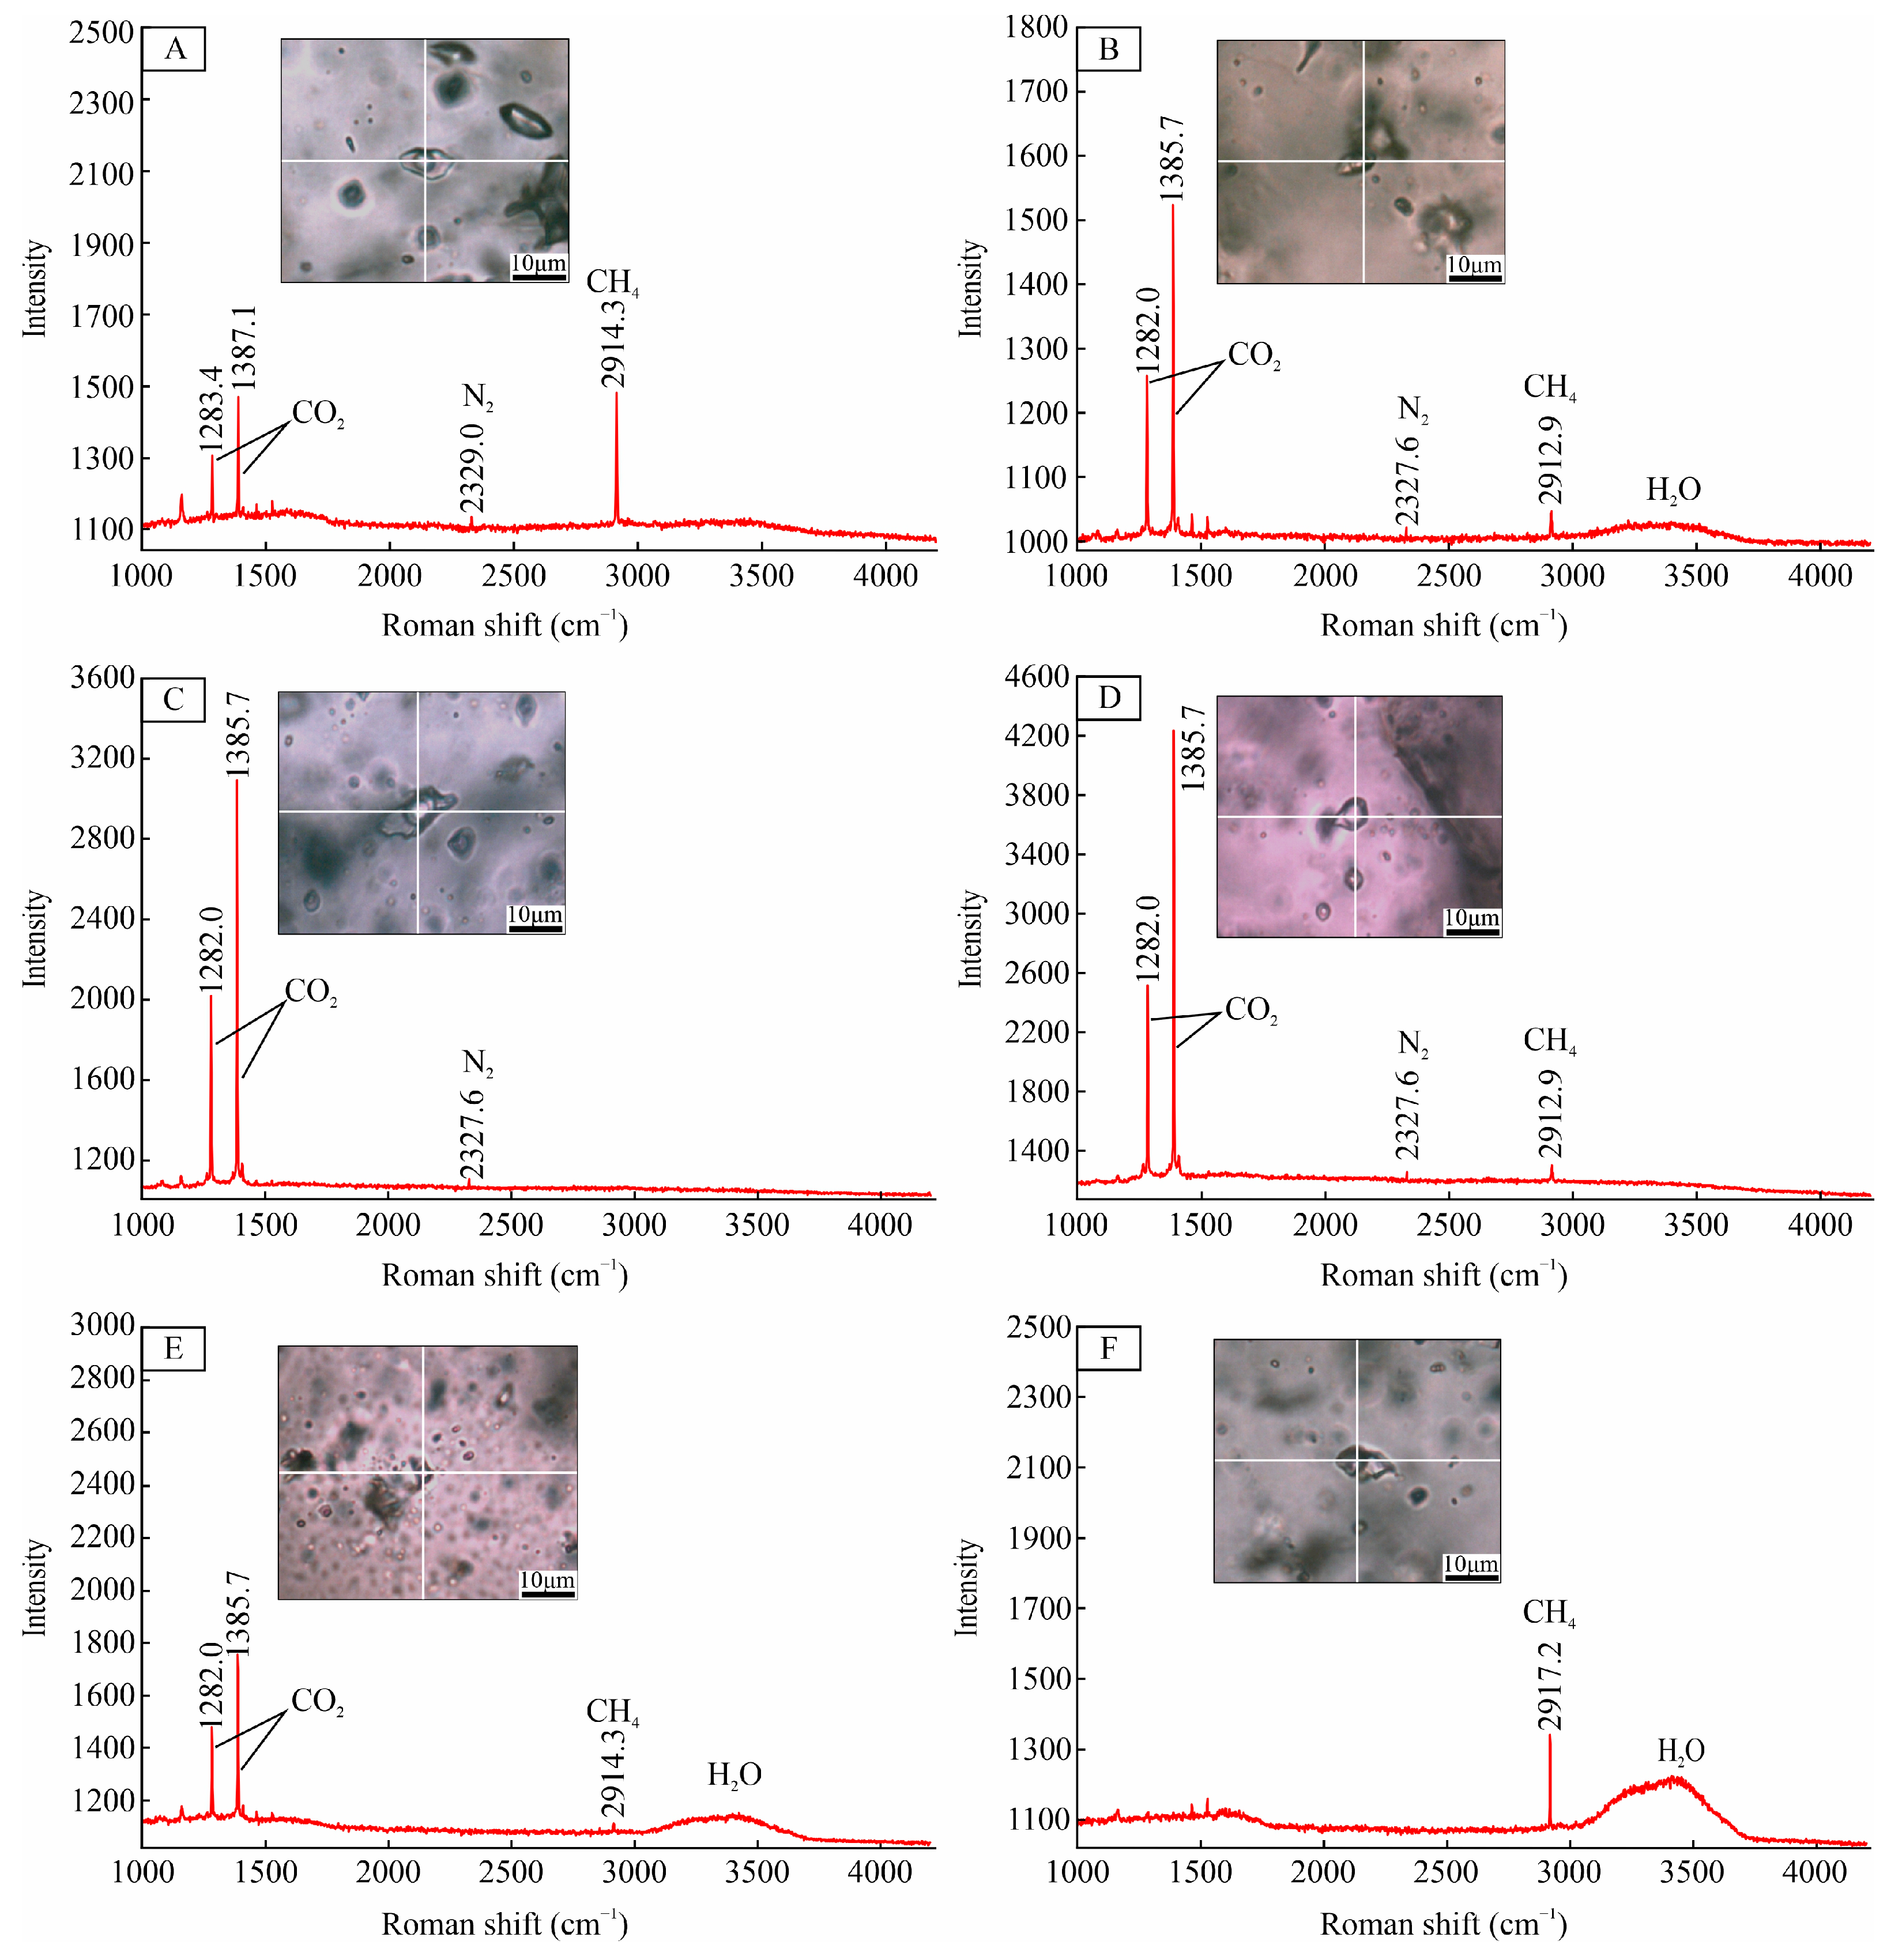
5.2.4. Laser Raman Spectroscopy
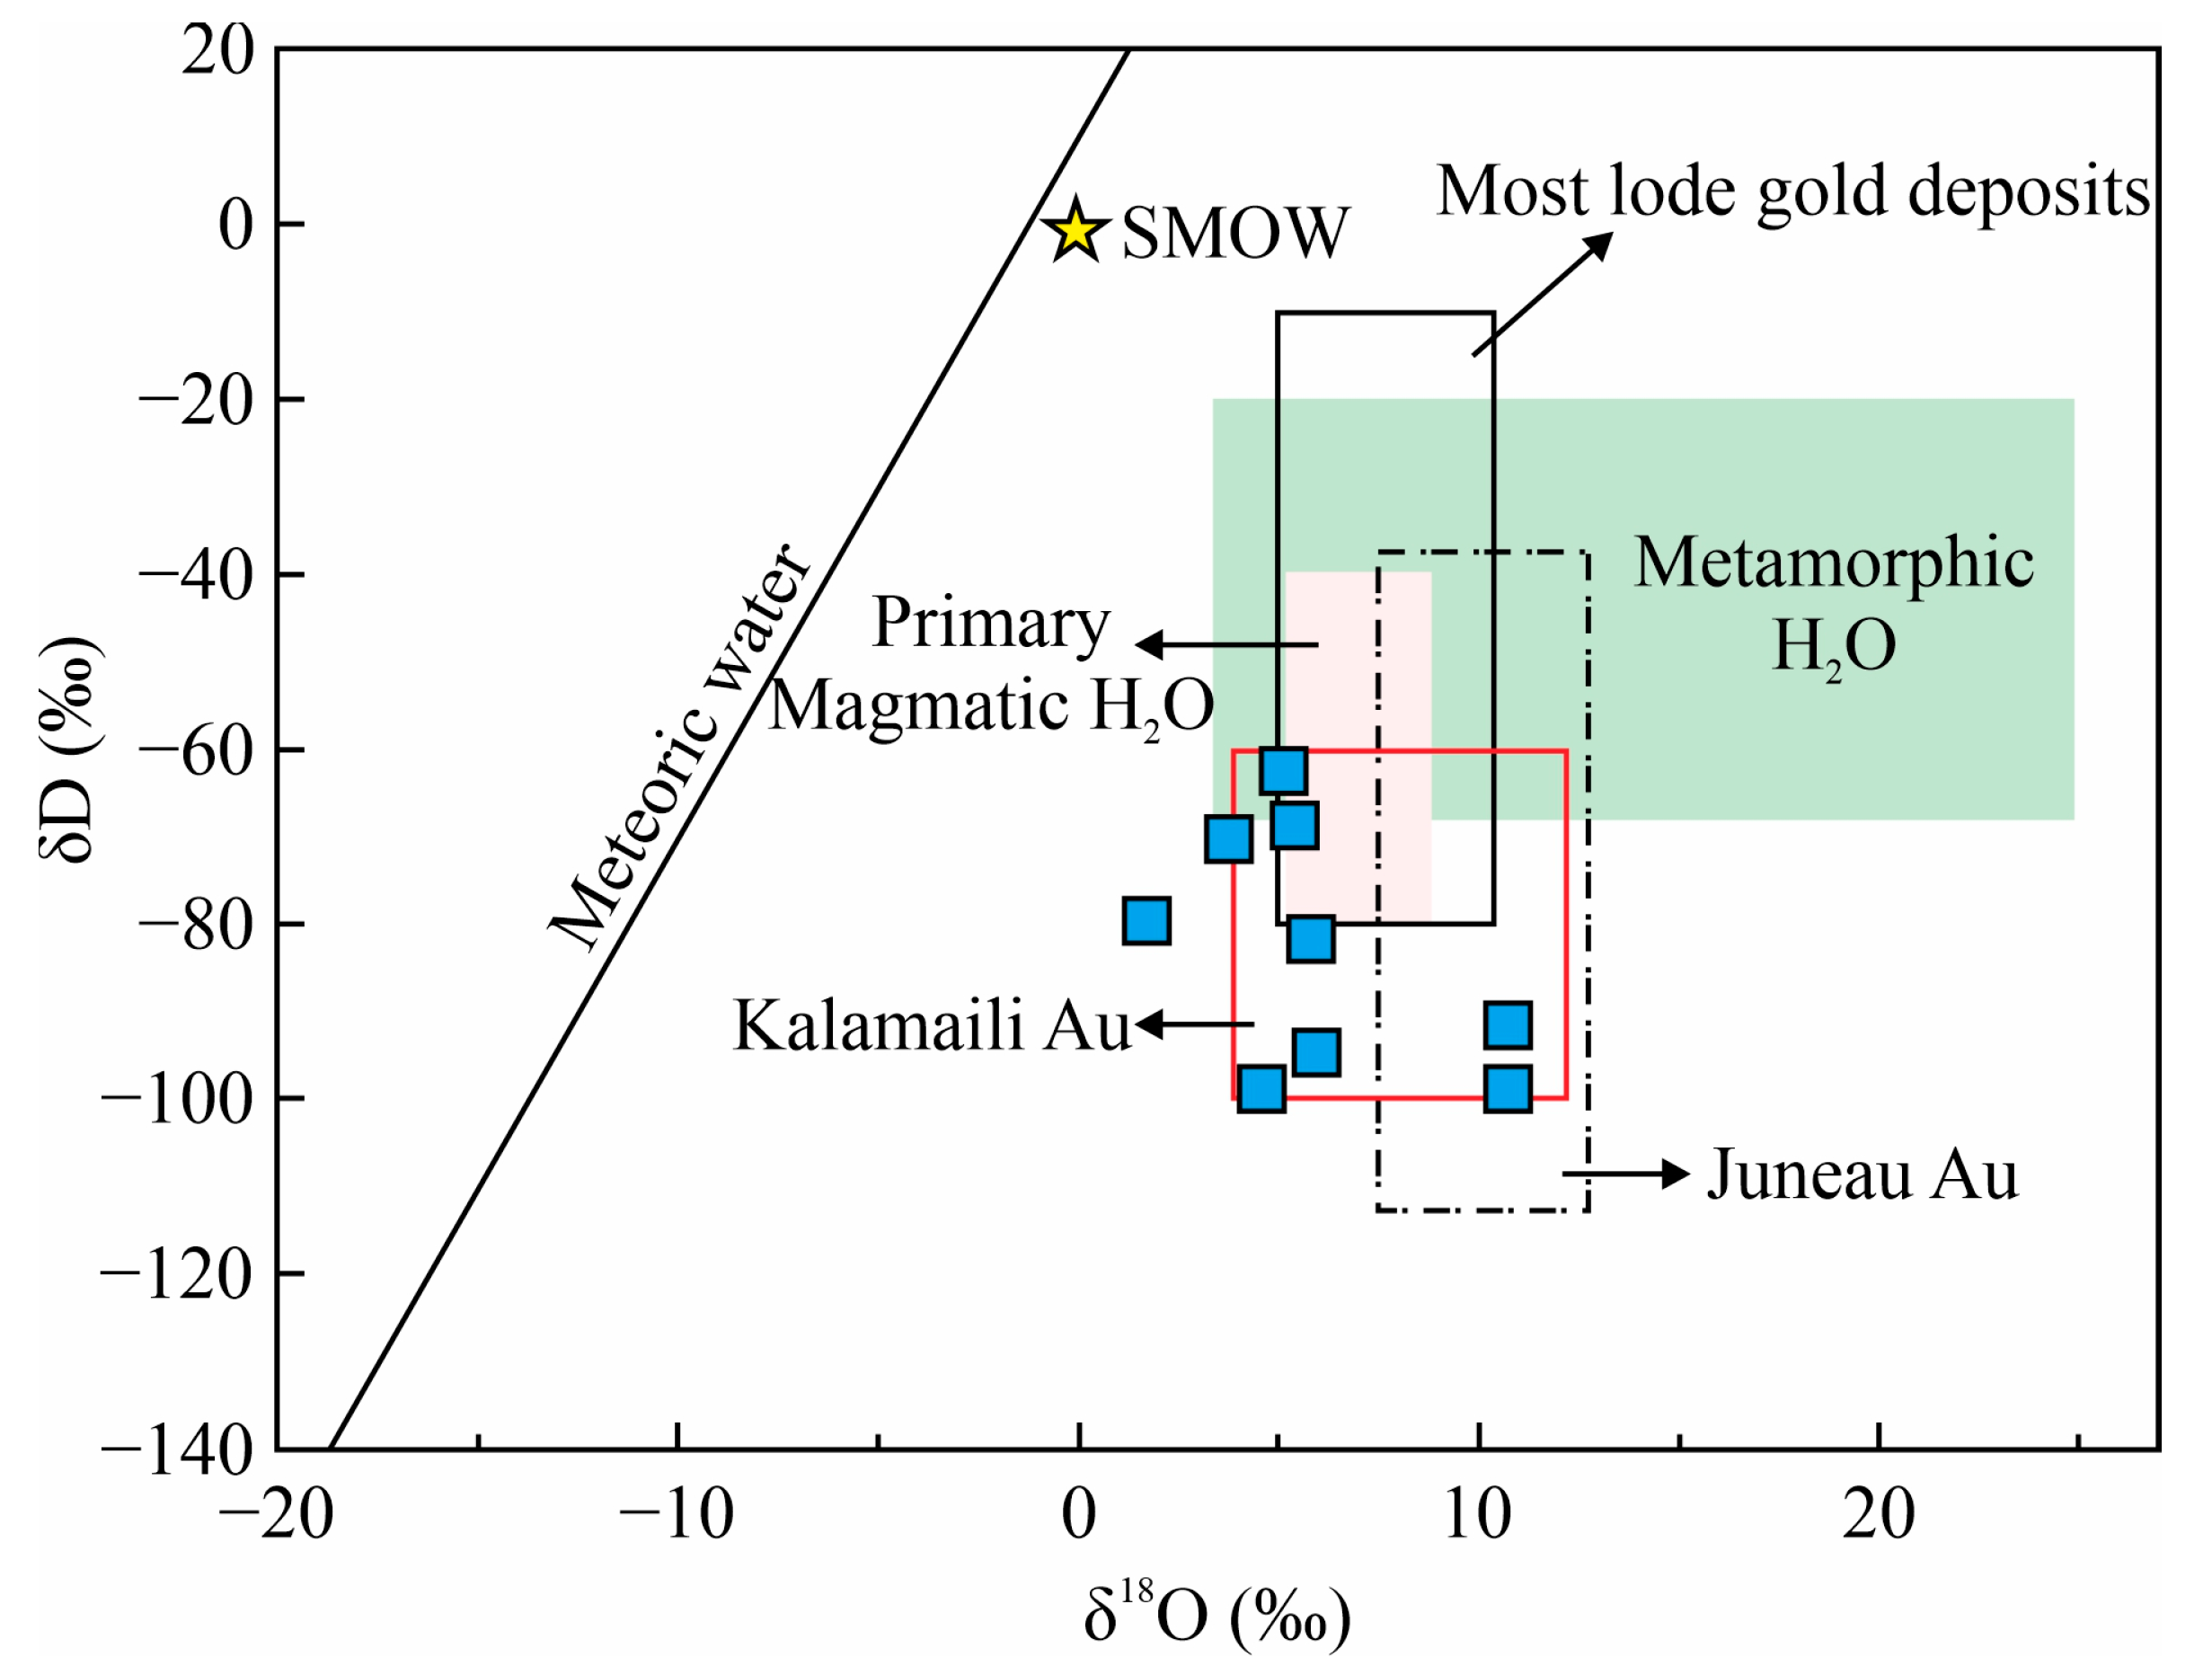
5.3. H-O Isotopic Compositions
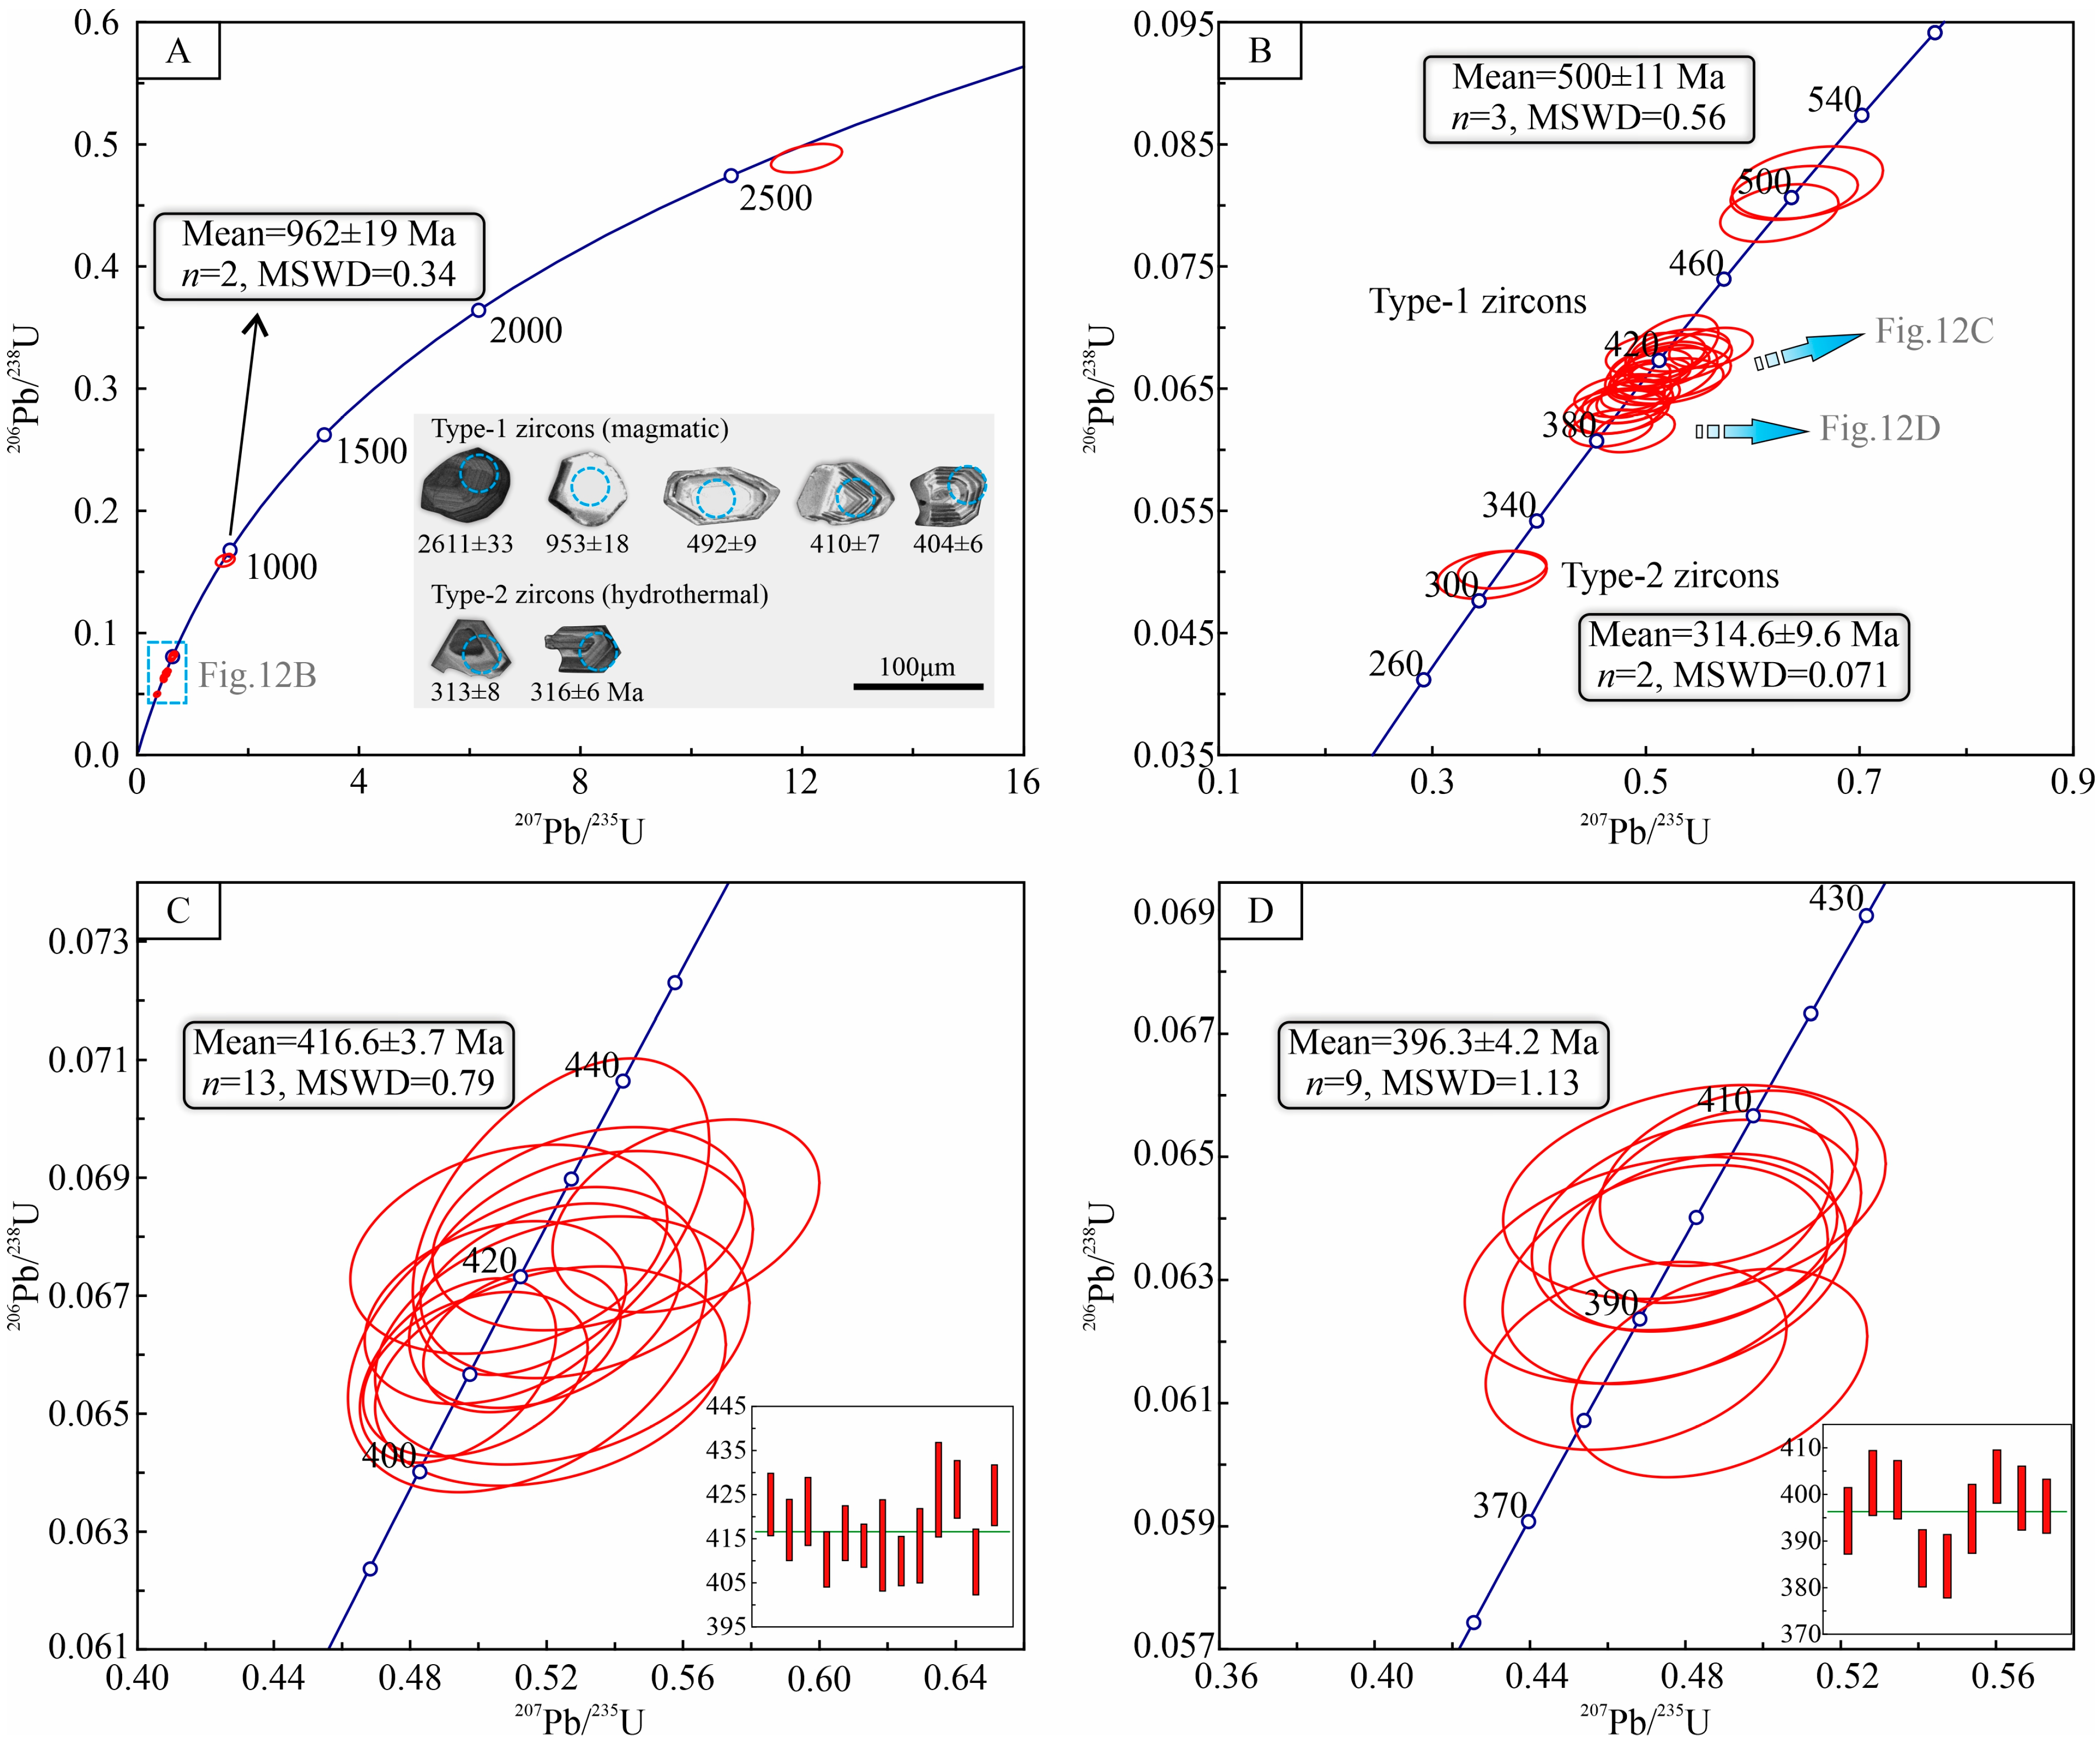
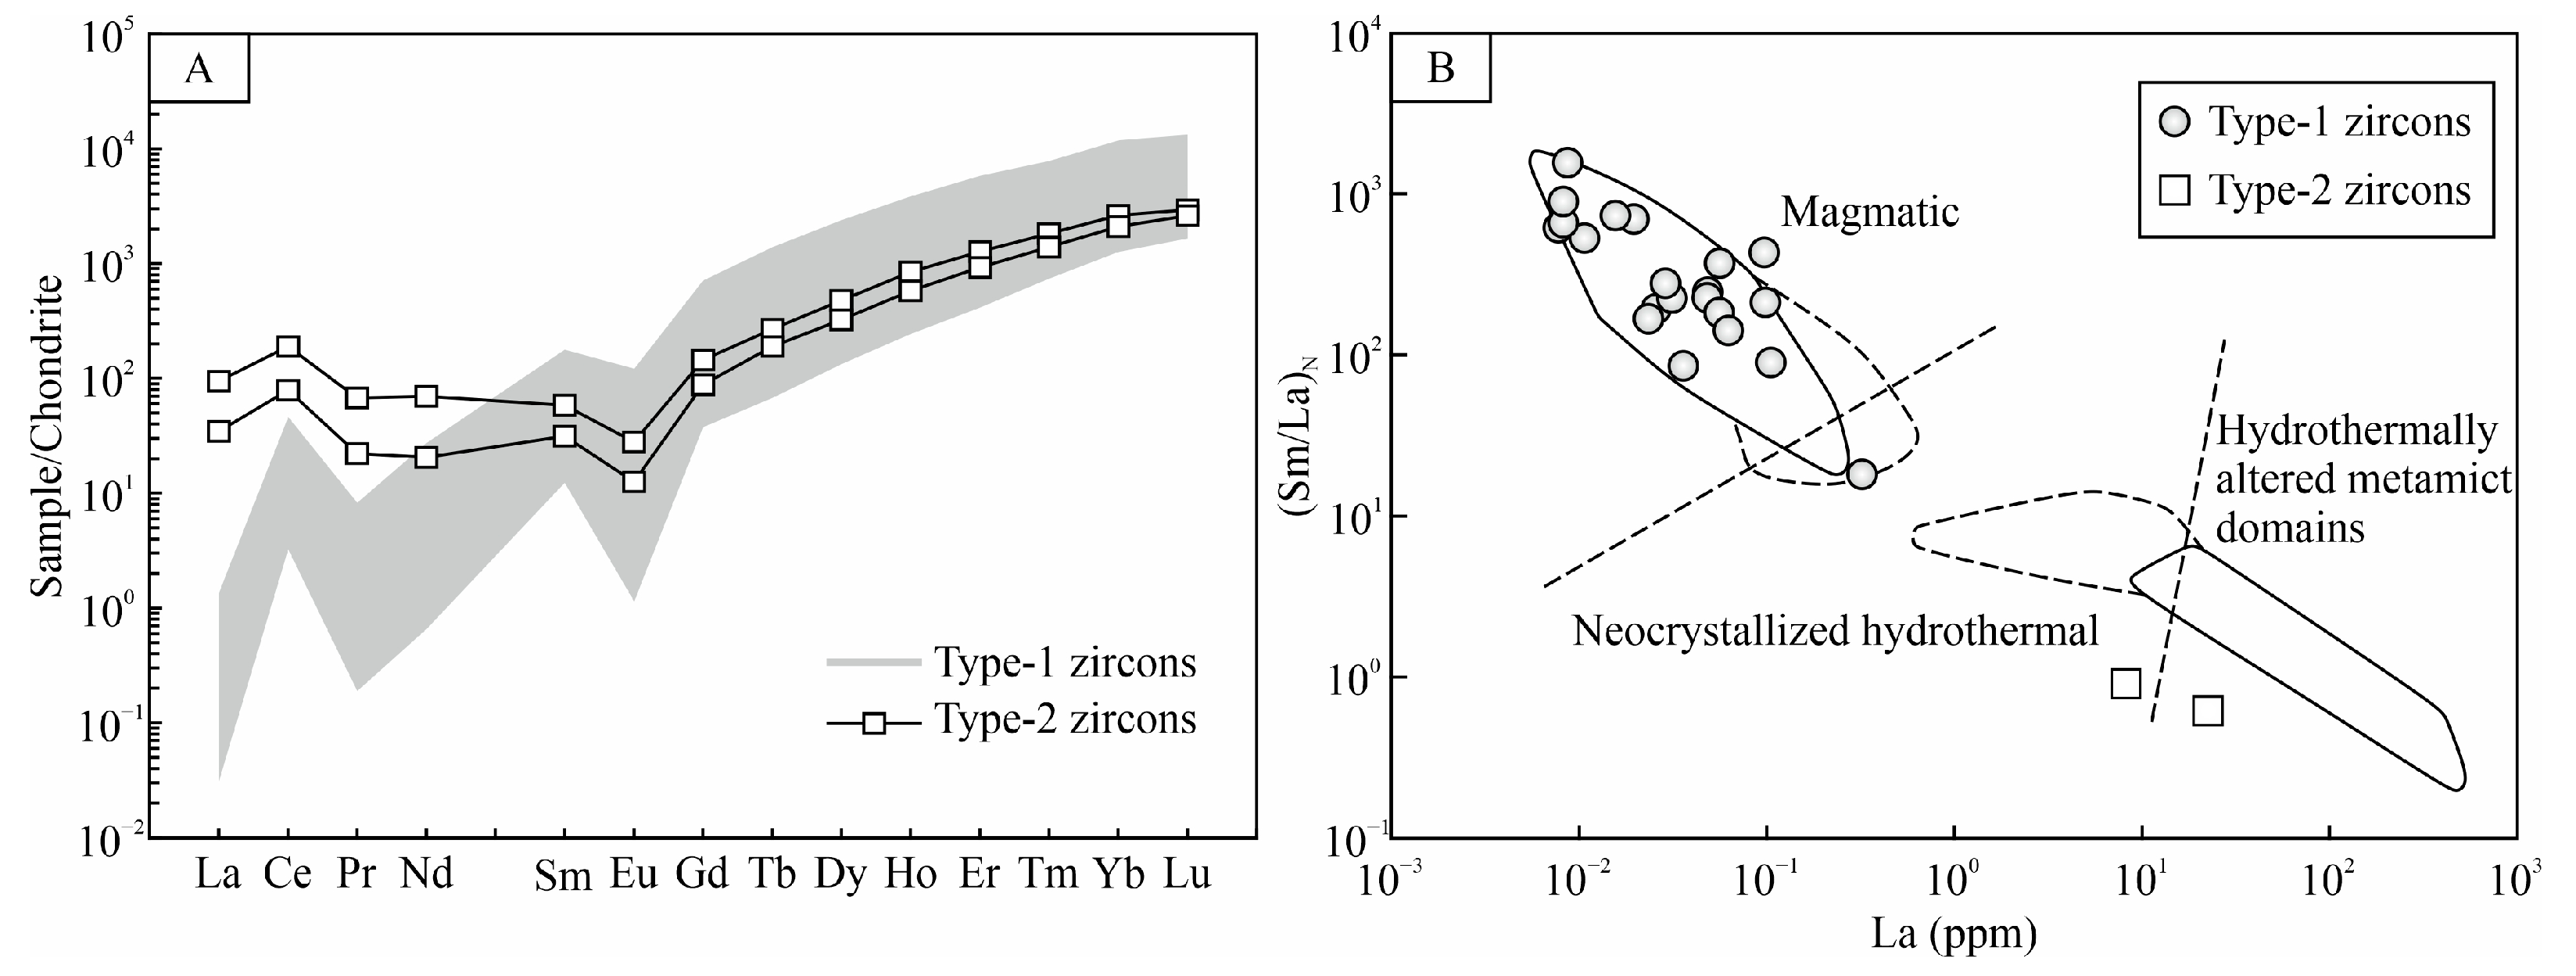
5.4. Zircon U-Pb Geochronology

6. Discussion
6.1. Gold Occurrences in Pyrite and Arsenopyrite
6.2. Nature and Evolution of Ore-forming Fluids
6.3. Fluid Immiscibility and Gold Deposition
6.4. Timing of Gold Mineralization
6.5. Ore Genetic Type
7. Conclusions
Supplementary Materials
Author Contributions
Funding
Data Availability Statement
Acknowledgments
Conflicts of Interest
References
- Groves, D.I.; Santosh, M.; Deng, J.; Wang, Q.F.; Yang, L.Q.; Zhang, L. A holistic model for the origin of orogenic gold deposits and its implications for exploration. Miner. Depos. 2020, 55, 275–292. [Google Scholar] [CrossRef]
- Hou, Z.Q.; Wang, Q.F.; Zhang, H.J.; Yu, N.; Wang, R.; Groves, D.I.; Zheng, Y.C.; Han, S.C.; Gao, L.; Yang, L. Lithosphere architecture characterized by crust-mantle decoupling controls the formation of orogenic gold deposits. Natl. Sci. Rev. 2023, 10, nwac257. [Google Scholar] [CrossRef] [PubMed]
- Groves, D.I.; Goldfarb, R.J.; Gebre-Mariam, M.; Hagemann, S.G.; Robert, F. Orogenic gold deposits: A proposed classification in the context of their crustal distribution and relationship to other gold deposit types. Ore Geol. Rev. 1998, 13, 7–27. [Google Scholar] [CrossRef]
- Mueller, A.G.; Hagemann, S.G. A thematic issue dedicated to the giant Golden Mile Au-Te deposit, Kalgoorlie, Western Australia. Miner. Depos. 2020, 55, 597–600. [Google Scholar] [CrossRef]
- Chudasama, B.; Porwal, A.; Kreuzer, O.P.; Butera, K. Geology, geodynamics and orogenic gold prospectivity modelling of the Paleoproterozoic Kumasi Basin, Ghana, West Africa. Ore Geol. Rev. 2016, 78, 692–711. [Google Scholar] [CrossRef]
- White, A.J.R.; Waters, D.J.; Robb, L.J. Exhumation-driven devolatilization as a fluid source for orogenic gold mineralization at the Damang deposit, Ghana. Econ. Geol. 2015, 110, 1009–1025. [Google Scholar] [CrossRef]
- Lawrence, D.M.; Treloar, P.J.; Rankin, A.H.; Harbidge, P.; Holliday, J. The geology and mineralogy of the Loulo mining district, West Africa: Evidence for two distinct styles of orogenic gold mineralization. Econ. Geol. 2013, 108, 199–227. [Google Scholar] [CrossRef]
- Lawrence, D.M.; Treloar, P.J.; Rankin, A.H.; Boyce, A.; Harbidge, P. A fluid inclusion and stable isotope study at the Loulo Mining District, Mali, West Africa: Implications for multifluid sources in the generation of orogenic gold deposits. Econ. Geol. 2013, 108, 229–257. [Google Scholar] [CrossRef]
- Qiu, Y.M.; Groves, D.I.; McNaughton, N.J.; Wang, L.G.; Zhou, T.H. Nature, age, and tectonic setting of granitoid-hosted, orogenic gold deposits of the Jiaodong Peninsula, eastern North China craton, China. Miner. Depos. 2002, 37, 283–305. [Google Scholar] [CrossRef]
- Zhang, L.; Weinberg, R.F.; Yang, L.Q.; Groves, D.I.; Sai, S.X.; Matchan, E.; Phillips, D.; Kohn, B.P.; Miggins, D.P.; Liu, Y.; et al. Mesozoic orogenic gold mineralization in the Jiaodong Peninsula, China: A focused event at 120 ± 2 Ma during cooling of pregold granite intrusions. Econ. Geol. 2020, 115, 415–441. [Google Scholar] [CrossRef]
- Qiu, K.F.; Deng, J.; Laflamme, C.; Long, Z.Y.; Wan, R.Q.; Moynier, F.; Yu, H.C.; Zhang, J.Y.; Ding, Z.J.; Goldfarb, R. Giant Mesozoic gold ores derived from subducted oceanic slab and overlying sediments. Geochim. Cosmochim. Acta 2023, 343, 133–141. [Google Scholar] [CrossRef]
- McCuaig, T.C.; Kerrich, R. P-T-t deformation-fluid characteristics of lode gold deposits: Evidence from alteration systematics. Ore Geol. Rev. 1998, 12, 381–454. [Google Scholar] [CrossRef]
- Kerrich, R.; Goldfarb, R.J.; Groves, D.; Garwin, S.; Jia, Y.F. The characteristics, origins, and geodynamic settings of supergiant gold metallogenic provinces. Sci. China Ser. D 2000, 43, 1–68. [Google Scholar] [CrossRef]
- Goldfarb, R.J.; Groves, D.I.; Gardoll, S. Orogenic gold and geologic time: A global synthesis. Ore Geol. Rev. 2001, 18, 1–75. [Google Scholar] [CrossRef]
- Groves, D.I.; Santosh, M. The giant Jiaodong gold province: The key to a unified model for orogenic gold deposits? Geosci. Front. 2016, 7, 409–417. [Google Scholar] [CrossRef]
- Groves, D.I.; Santosh, M.; Goldfarb, R.J.; Zhang, L. Structural geometry of orogenic gold deposits: Implications for exploration of world-class and giant deposits. Geosci. Front. 2018, 9, 1163–1177. [Google Scholar] [CrossRef]
- Nesbitt, B.E. Gold deposit continuum: A genetic model for lode Au mineralization in the continental crust. Geology 1988, 6, 1044–1048. [Google Scholar] [CrossRef]
- Neumayr, P.; Walshe, J.; Hagemann, S.; Petersen, K.; Roache, A.; Frikken, P.; Horn, L.; Halley, S. Oxidized and reduced mineral assemblages in greenstone belt rocks of the St. Ives gold camp, Western Australia: Vectors to high-grade ore bodies in Archaean gold deposits? Miner. Depos. 2008, 43, 363–371. [Google Scholar] [CrossRef]
- Helt, K.M.; Williams-Jones, A.E.; Clark, J.R.; Wing, B.A.; Wares, R.P. Constraints on the genesis of the Archean oxidized, intrusion-related Canadian Malartic gold deposit, Quebec, Canada. Econ. Geol. 2014, 109, 713–735. [Google Scholar] [CrossRef]
- Goldfarb, R.J.; Groves, D.I. Orogenic gold: Common or evolving fluid and metal sources through time. Lithos 2015, 233, 2–26. [Google Scholar] [CrossRef]
- Spence-Jones, C.P.; Jenkin, G.R.; Boyce, A.J.; Hill, N.J.; Sangster, C.J.S. Tellurium, magmatic fluids and orogenic gold: An early magmatic fluid pulse at Cononish gold deposit, Scotland. Ore Geol. Rev. 2018, 102, 894–905. [Google Scholar] [CrossRef]
- Windley, B.F.; Alexeiev, D.; Xiao, W.J.; Kröner, A.; Badarch, G. Tectonic models for accretion of the Central Asian orogenic belt. J. Geol. Soc. Lond. 2007, 164, 31–47. [Google Scholar] [CrossRef]
- Rui, Z.Y.; Goldfarb, R.J.; Qiu, Y.M.; Zhou, T.H.; Chen, R.Y.; Pirajno, F.; Yun, G. Paleozoic-early Mesozoic gold deposits of the Xinjiang Autonomous Region, northwestern China. Miner. Depos. 2002, 37, 393–418. [Google Scholar] [CrossRef]
- Goldfarb, R.J.; Taylor, R.D.; Collins, G.S.; Goryachev, N.A.; Orlandini, O.F. Phanerozoic continental growth and gold metallogeny of Asia. Gondwana Rese. 2014, 25, 48–102. [Google Scholar] [CrossRef]
- Zheng, J.H.; Shen, P.; Feng, W.Y. Hydrothermal apatite record of ore-forming processes in the Hatu orogenic gold deposit, West Junggar, Northwest China. Contrib. Mineral. Petrol. 2022, 177, 27. [Google Scholar] [CrossRef]
- Gu, X.X.; Zhang, Y.M.; Ge, Z.L.; Chen, W.Z.; Xu, J.C.; Huang, G.; Tao, W. The orogenic Au mineralization system and regional tectonic evolution in the Kalamaili area, East Junggar, Xinjiang. Earth Sci. Front. 2020, 27, 254–275. (In Chinese) [Google Scholar]
- Gu, X.X.; Zhang, Y.M.; Ge, Z.L.; Chen, W.Z. Mineralization and genesis of the orogenic gold system in the Kalamaili area, East Junggar, Xinjiang, northwestern China. GSA Bull. 2023, 6. [Google Scholar] [CrossRef]
- Li, J.Y.; Yang, T.N.; LI, Y.P.; Zhu, Z.X. Geological features of the Karamaili faulting belt, eastern Junggar region, Xinjiang, China and its constraints on the reconstruction of Late Paleozoic ocean-continental framework of the Central Asian region. Geol. Bull. China 2009, 28, 1817–1826. (In Chinese) [Google Scholar]
- Zhang, Y.Y.; Pe-Piper, G.; Piper, D.J.W.; Guo, Z.J. Early Carboniferous collision of the Kalamaili orogenic belt, North Xinjiang, and its implications: Evidence from molasse deposits. GSA Bull. 2013, 125, 932–944. [Google Scholar] [CrossRef]
- Song, P.; Wang, T.; Tong, Y.; Zhang, J.J.; Huang, H. Late Carboniferous intrusions along the Kalamaili suture zone, southwestern Central Asian Orogenic Belt (CAOB): Implications for a tectonic switch from subduction to collision. Int. Geol. Rev. 2023, 65, 1601–1621. [Google Scholar] [CrossRef]
- Xu, B.; Lu, Y.M.; Gu, X.X.; Zhang, W.Z. Characteristics of ore-forming fluids and O, H, S isotopic geochemistry of the gold deposits in the Kalamaili Area, Xinjiang, China. Earth Sci. Front. 2010, 17, 227–240. (In Chinese) [Google Scholar]
- Nie, X.Y. Carboniferous Granitic Magma Activity and Gold Mineralization in the Kalamaily Region, Northern Xinjiang. Ph.D. Thesis, China University of Geosciences, Beijing, China, 2017. (In Chinese). [Google Scholar]
- Xiao, W.J.; Windley, B.F.; Yuan, C.; Sun, M.; Han, C.M.; Lin, S.F.; Chen, H.L.; Yan, Q.R.; Liu, D.Y.; Qin, K.Z.; et al. Paleozoic multiple subduction-accretion processes of the southern Altaids. Am. J. Sci. 2009, 309, 221–270. [Google Scholar] [CrossRef]
- Jahn, B.M.; Wu, F.Y.; Chen, B. Granitoids of the Central Asian Orogenic Belt and continental growth in the Phanerozoic. Earth Environ. Sci. Trans. R. Soc. Edinb. 2000, 91, 181–193. [Google Scholar]
- Chen, B.; Jahn, B.M. Genesis of post-collisional granitoids and basement nature of the Junggar Terrane, NW China: Nd-Sr isotope and trace element evidence. J. Asian Earth Sci. 2004, 23, 691–703. [Google Scholar] [CrossRef]
- Guo, L.S.; Zhang, R.; Liu, Y.L.; Xu, F.J.; Su, L. Zircon U-Pb age of Tonghualing intermediate-acid intrusive rocks, Eastern Junggar, Xinjiang. Acta Sci. Nat. Univ. Pekin. 2009, 1, 22–27. (In Chinese) [Google Scholar]
- Han, B.F.; Ji, J.Q.; Song, B.; Chen, L.H.; Zhang, L. Late Paleozoic vertical growth of continental crust around the Junggar Basin, Xinjiang, China (Part I): Timing of post-collisional plutonism. Acta Petrol. Sin. 2006, 22, 1077–1086. (In Chinese) [Google Scholar]
- Yang, G.X.; Li, Y.J.; Wu, H.E.; Zhong, X.; Yang, B.K.; Yan, C.X.; Yan, J.; Si, G.H. Geochronological and geochemical constrains on petrogenesis of the Huangyangshan A-type granite from the East Junggar, Xinjiang, NW China. J. Asian Earth Sci. 2011, 40, 722–736. [Google Scholar] [CrossRef]
- Liu, W.; Liu, X.J.; Liu, L.J. Underplating generated A-and I-type granitoids of the East Junggar from the lower and the upper oceanic crust with mixing of mafic magma: Insights from integrated zircon U-Pb ages, petrography, geochemistry and Nd-Sr-Hf isotopes. Lithos 2013, 179, 293–319. [Google Scholar] [CrossRef]
- Han, Y.G.; Zhao, G.C. Final amalgamation of the Tianshan and Junggar orogenic collage in the southwestern Central Asian Orogenic Belt: Constraints on the closure of the Paleo-Asian Ocean. Earth Sci. Rev. 2018, 186, 129–152. [Google Scholar] [CrossRef]
- Li, J.Y. Main Characteristics and emplacement process of the East Junggar ophiolites, Xinjiang, China. Acta Petrol. Sin. 1995, 11, 73–84. [Google Scholar]
- Fang, A.M.; Wang, S.G.; Zhang, J.M.; Zang, M.; Fang, J.H.; Hu, J.M. The U-Pb ages of zircons from the gabbro in the Kalamaili ophiolite, North Xinjiang and its tectonic significances. Chin. J. Geol. 2015, 50, 140–154. (In Chinese) [Google Scholar]
- Wang, B.Y.; Jiang, C.Y.; Li, Y.J.; Wu, H.E.; Xia, Z.D.; Lu, R.H. Geochemistry and tectonic implications of Karamaili ophiolite in East Junggar of Xinjiang. J. Mineral. Petrol. 2009, 29, 74–82. (In Chinese) [Google Scholar]
- Huang, G.; Niu, G.Z.; Wang, X.L.; Guo, J.; Yu, F. Formation and emplacement age of Karamaili ophiolite: LA-ICP-MS zircon U-Pb age evidence from the diabase and tuff in eastern Junggar, Xinjiang. Geol. Bull. China 2012, 31, 1267–1278. (In Chinese) [Google Scholar]
- Tang, H.F.; Su, Y.P.; Liu, C.Q.; Hou, G.S.; Wang, Y.B. Zircon U-Pb age of the plagiogranite in Kalamaili belt, northern Xinjiang and its tectonic implications. Geotecton. Metallog. 2007, 31, 110–117. (In Chinese) [Google Scholar]
- Qin, B. Time constraints and SHRIMP of zircon from plagioclase granite of ophiolitic in Aletunkunduo. Northwest. Geol. 2012, 45, 20–25. (In Chinese) [Google Scholar]
- Zhao, L.; Ji, J.Q.; Xu, Q.Q.; Gong, J.F.; Tu, J.Y.; Wang, J.D. Karamaili strike-slipping fault and deformational sequence since Late Paleozoic in the northern Xinjiang. Acta Petrol. Sin. 2010, 28, 2257–2268. (In Chinese) [Google Scholar]
- Garofalo, P.; Matthäi, S.K.; Heinrich, C.A. Three-dimensional geometry, ore distribution and time-integrated mass transfer through the quartz-tourmaline-gold vein network of the Sigma deposit (Abitibi belt, Canada). Geofluids 2002, 2, 217–232. [Google Scholar] [CrossRef]
- Sibson, R.H.; Robert, F.; Poulsen, K.H. High-angle reverse faults, fluid-pressure cycling, and mesothermal gold-quartz deposits. Geology 1988, 16, 551–555. [Google Scholar] [CrossRef]
- Cox, S.F.; Sun, S.S.; Etheridge, M.A.; Wall, V.J.; Potter, T.F. Structural and geochemical controls on the development of turbidite-hosted gold quartz vein deposits, Wattle Gully mine, central Victoria, Australia. Econ. Geol. 1995, 90, 1722–1746. [Google Scholar] [CrossRef]
- Bodnar, R.J. Revised equation and table for determining the freezing point depression of H2O-NaCl solutions. Geochim. Cosmochim. Acta 1993, 57, 683–684. [Google Scholar] [CrossRef]
- Brown, P.E.; Lamb, W.M. P-V-T properties of fluids in the system H2O±CO2±NaCl: New graphical presentations and implications for fluid inclusion studies. Geochim. Cosmochim. Acta 1989, 53, 1209–1221. [Google Scholar] [CrossRef]
- Brown, P.E. FLINCOR: A microcomputer program for the reduction and investigation of fluid-inclusion data. Am. Mineral. 1989, 74, 1390–1393. [Google Scholar]
- Clayton, R.N.; Mayeda, T.K. The use of bromine pentafluoride in the extraction of oxygen from oxides and silicates for isotopic analysis. Geochim. Cosmochim. Acta 1963, 27, 43–52. [Google Scholar] [CrossRef]
- Clayton, R.N.; O’Neil, J.R.; Mayeda, T.K. Oxygen isotope exchange between quartz and water. J. Geophys. Res. 1972, 77, 3057–3067. [Google Scholar] [CrossRef]
- Sláma, J.; Košler, J.; Condon, D.J.; Crowley, J.L.; Gerdes, A.; Hanchar, J.M.; Horstwood, M.S.A.; Morris, G.A.; Nasdala, L.; Norberg, N.; et al. Plešovice zircon—A new natural reference material for U-Pb and Hf isotopic microanalysis. Chem. Geol. 2008, 249, 1–35. [Google Scholar] [CrossRef]
- Liu, Y.S.; Hu, Z.C.; Gao, S.; Günther, D.; Xu, J.; Gao, C.G.; Chen, H.H. In situ analysis of major and trace elements of anhydrous minerals by LA-ICP-MS without applying an internal standard. Chem. Geol. 2008, 257, 34–43. [Google Scholar] [CrossRef]
- Ludwig, K.R. User’s Manual for Isoplot/ex Version 3.00: A Geochronological Toolkit for Microsoft Excel; Special Publication; Berkeley Geochronology Center: Berkeley, CA, USA, 2003. [Google Scholar]
- Boyle, R.W. The geochemistry of gold and its deposits. Geol. Surv. Can. Bull. 1979, 280, 1–584. [Google Scholar]
- Youngson, J.H.; Wopereis, P.; Kerr, L.C.; Craw, D. Au-Ag-Hg and Au-Ag alloys in Nokomai and Nevis valley placers, northern Southland and Central Otago, New Zealand, and their implications. N. Z. J. Geol. Geop. 2002, 45, 53–69. [Google Scholar] [CrossRef]
- Simon, G.; Kesler, S.E.; Chryssoulis, S. Geochemistry and textures of gold-bearing arsenian pyrite, Twin Creeks, Nevada: Implications for deposition of gold in Carlin-type deposits. Econ. Geol. 1999, 94, 405–422. [Google Scholar] [CrossRef]
- Goldfarb, R.J.; Baker, T.; Dubé, B.; Groves, D.I.; Hart, C.J.R.; Gosselin, P. Distribution, character, and genesis of gold deposits in metamorphic terranes. Econ. Geol. 2005, 100, 407–450. [Google Scholar]
- Zhou, Z.J.; Chen, Y.J.; Jiang, S.Y.; Zhao, H.X.; Qin, Y.; Hu, C.J. Geology, geochemistry and ore genesis of the Wenyu gold deposit, Xiaoqinling gold field, Qinling Orogen, southern margin of North China Craton. Ore Geol. Rev. 2014, 59, 1–20. [Google Scholar] [CrossRef]
- Gao, H.Z.; Zhang, W.S. Characteristics and metallogenic fluid and thermodynamic condition analysis of metallogenic system in highly strained structural belt, East Junggar. Earth Sci.-J. China Univ. Geosci. 2000, 25, 369–374. (In Chinese) [Google Scholar]
- Hoskin, P.W.O. Patterns of chaos: Fractal statistics and the oscillatory chemistry of zircon. Geochim. Cosmochim. Acta 2000, 64, 1905–1923. [Google Scholar] [CrossRef]
- Hoskin, P.W.O.; Schaltegger, U. The composition of zircon and igneous and metamorphic petrogenesis. Rev. Mineral. Geochem. 2003, 53, 27–62. [Google Scholar] [CrossRef]
- Wang, J.; Su, Y.P.; Zheng, J.P.; Belousova, E.A.; Griffin, W.L.; Zhou, X.; Dai, H.K. Hidden Eoarchean crust in the southwestern Central Asian Orogenic Belt. Lithos 2020, 360–361, 105437. [Google Scholar] [CrossRef]
- Hoskin, P.W.O. Trace-element composition of hydrothermal zircon and the alteration of Hadean zircon from the Jack Hills, Australia. Geochim. Cosmochim. Acta 2005, 69, 637–648. [Google Scholar] [CrossRef]
- Kirkland, C.L.; Whitehouse, M.J.; Slagstad, T. Fluid-assisted zircon and monazite growth within a shear zone: A case study from Finnmark, Arctic Norway. Contrib. Mineral. Petrol. 2009, 158, 637–657. [Google Scholar] [CrossRef]
- McDonough, W.F.; Sun, S.S. The composition of the Earth. Chem. Geol. 1995, 120, 223–253. [Google Scholar] [CrossRef]
- Cabri, L.J.; Newville, M.; Gordon, R.A.; Crozier, E.D.; Sutton, S.R.; McMahon, G.; Jiang, D.T. Chemical speciation of gold in arsenopyrite. Can. Mineral. 2000, 38, 1265–1281. [Google Scholar] [CrossRef]
- Chen, Y.L.; Li, H.; Zheng, C.Y.; Elatikpo, S.M.; Cheng, S.L.; Jiang, W.T. Ore-forming process of the Haigou gold deposit in the eastern Central Asian Orogenic Belt, NE China: Constrains from EPMA and LA-ICP-MS analysis of Au-bearing pyrite. Resour. Geol. 2022, 72, e12304. [Google Scholar] [CrossRef]
- Liu, H.M.; Beaudoin, G. Geochemical signatures in native gold derived from Au-bearing ore deposits. Ore Geol. Rev. 2021, 132, 104066. [Google Scholar] [CrossRef]
- Harris, D.C. The mineralogy of gold and its relevance to gold recoveries. Miner. Depos. 1990, 25, S3–S7. [Google Scholar] [CrossRef]
- Deditius, A.P.; Reich, M.; Kesler, S.E.; Utsunomiya, S.; Chryssoulis, S.L.; Walshe, J.; Ewing, R.C. The coupled geochemistry of Au and As in pyrite from hydrothermal ore deposits. Geochim. Cosmochim. Acta 2014, 140, 644–670. [Google Scholar] [CrossRef]
- Li, H.; Zhu, D.P.; Algeo, T.J.; Li, M.; Jiang, W.C.; Chen, S.F.; Elatikpo, S.M. Pyrite trace element and S-Pb isotopic evidence for contrasting sources of metals and ligands during superimposed hydrothermal events in the Dongping gold deposit, North China. Miner. Depos. 2023, 58, 337–358. [Google Scholar] [CrossRef]
- Reich, M.; Kesler, S.E.; Utsunomiya, S.; Palenik, C.S.; Chryssoulis, S.L.; Ewing, R.C. Solubility of gold in arsenian pyrite. Geochim. Cosmochim. Acta 2005, 69, 2781–2796. [Google Scholar] [CrossRef]
- Cabri, L.J.; Chryssoulis, S.L.; de Villiers, J.P.R.; Laflamme, J.G.; Buseck, P.R. The nature of “invisible” gold in arsenopyrite. Can. Mineral. 1989, 27, 353–362. [Google Scholar]
- Fougerouse, D.; Reddy, S.M.; Aylmore, M.; Yang, L.; Guagliardo, P.; Saxey, D.W.; Rickard, W.D.A.; Timms, N. A new kind of invisible gold in pyrite hosted in deformation-related dislocations. Geology 2021, 49, 1225–1229. [Google Scholar] [CrossRef]
- Böhlke, J.K.; Kistler, R.W. Rb-Sr, K-Ar, and stable isotope evidence for the ages and sources of fluid components of gold-bearing quartz veins in the northern Sierra Nevada foothills metamorphic belt, California. Econ. Geol. 1986, 81, 296–322. [Google Scholar] [CrossRef]
- Jia, Y.F.; Li, X.; Kerrich, R. Stable isotope (O, H, S, C, and N) systematics of quartz vein systems in the turbidite-hosted Central and North Deborah gold deposits of the Bendigo gold field, central Victoria, Australia: Constraints on the origin of ore-forming fluids. Econ. Geol. 2001, 96, 705–721. [Google Scholar] [CrossRef]
- Chen, H.Y.; Chen, Y.J.; Baker, M. Isotopic geochemistry of the Sawayaerdun orogenic-type gold deposit, Tianshan, northwest China: Implications for ore genesis and mineral exploration. Chem. Geol. 2012, 310-311, 1–11. [Google Scholar] [CrossRef]
- Ridley, J.R.; Diamond, L.W. Fluid chemistry of orogenic lode gold deposits and implications for genetic models. Rev. Econ. Geol. 2000, 13, 146–162. [Google Scholar]
- Goldfarb, R.J.; Newberry, R.J.; Pickthorn, W.J.; Gent, C.A. Oxygen, hydrogen, and sulfur isotope studies in the Juneau gold belt, southeastern Alaska: Constraints on the origin of hydrothermal fluids. Econ. Geol. 1991, 86, 66–80. [Google Scholar] [CrossRef]
- Zhang, J.; Chen, Y.J.; Pirajno, F.; Deng, J.; Chen, H.Y.; Wang, C.M. Geology, C-H-O-S-Pb isotope systematics and geochronology of the Yindongpo gold deposit, Tongbai Mountains, central China: Implication for ore genesis. Ore Geol. Rev. 2013, 53, 343–356. [Google Scholar] [CrossRef]
- Liu, J.Y.; Yu, H.X.; Wu, G.Q. Alkali granites and tin deposits of the Kalamaili area, northern Xinjiang. Geollogical. Explor. Non-Ferr. Met. 1997, 6, 129–135. (In Chinese) [Google Scholar]
- Taylor, H.P. The application of oxygen and hydrogen isotope studies to problems of hydrothermal alteration and ore deposition. Econ. Geol. 1974, 69, 843–883. [Google Scholar] [CrossRef]
- Wilkinson, J.J. Fluid inclusions in hydrothermal ore deposits. Lithos 2001, 55, 229–272. [Google Scholar] [CrossRef]
- Coulibaly, Y.; Boiron, M.C.; Cathelineau, M.; Kouamelan, A.N. Fluid immiscibility and gold deposition in the Birimian quartz veins of the Angovia deposit (Yaouré, Ivory Coast). J. Afr. Earth Sci. 2008, 50, 234–254. [Google Scholar] [CrossRef]
- Deng, X.H.; Chen, Y.J.; Santosh, M.; Yao, J.M. Genesis of the 1.76 Ga Zhaiwa Mo-Cu and its link with the Xiong’er volcanics in the North China Craton: Implications for accretionary growth along the margin of the Columbia supercontinent. Precambr. Res. 2013, 227, 337–348. [Google Scholar] [CrossRef]
- Craw, D.; Teagle, D.A.H.; Belocky, R. Fluid immiscibility in late-Alpine gold-bearing veins, Eastern and Northwestern European Alps. Miner. Depos. 1993, 28, 28–36. [Google Scholar] [CrossRef]
- Bowers, T.S.; Helgeson, H.C. Calculation of the thermodynamic and geochemical consequences of nonideal mixing in the system H2O-CO2-NaCl on phase relations in geologic systems: Metamorphic equilibria at high pressures and temperatures. Am. Mineral. 1983, 68, 1059–1075. [Google Scholar]
- Ramboz, C.; Pichavant, M.; Weisbrod, A. Fluid immiscibility in natural processes: Use and misuse of fluid inclusion data: II. Interpretation of fluid inclusion data in terms of Immiscibility. Chem. Geol. 1982, 37, 29–46. [Google Scholar] [CrossRef]
- Robert, F.; Kelly, W.C. Ore-forming fluids in Archean gold-bearing quartz veins at the Sigma Mine, Abitibi greenstone belt, Quebec, Canada. Econ. Geol. 1987, 82, 1464–1482. [Google Scholar] [CrossRef]
- Xu, Y.F.; Ni, P.; Wang, G.G.; Pan, J.Y.; Guan, S.J.; Chen, H.; Ding, J.Y.; Li, L. Geology, fluid inclusion and stable isotope study of the Huangshan orogenic gold deposit: Implications for future exploration along the Jiangshan-Shaoxing fault zone, South China. J. Geochem. Explor. 2016, 171, 37–54. [Google Scholar] [CrossRef]
- Roedder, E. Fluid inclusions: Reviews in Mineralogy and Geochemistry. Mineral. Soc. Am. 1984, 12, 1–644. [Google Scholar]
- Hollister, L.S. Enrichment of CO2 in fluid inclusions in quartz by removal of H2O during crystal-plastic deformation. J. Struct. Geol. 1990, 12, 895–901. [Google Scholar] [CrossRef]
- Hall, D.L.; Bodnar, R.J. Methane in fluid inclusions from granulites: A product of hydrogen diffusion? Geochim. Cosmochim. Acta 1990, 54, 641–651. [Google Scholar] [CrossRef]
- Benning, L.G.; Seward, T.M. Hydrosulphide complexing of Au(I) in hydrothermal solutions from 150–400 °C and 500-1500 bar. Geochim. Cosmochim. Acta 1996, 60, 1849–1871. [Google Scholar] [CrossRef]
- Stefánsson, A.; Seward, T.M. Gold(I) complexing in aqueous sulphide solutions to 500 °C at 500 bar. Geochim. Cosmochim. Acta 2004, 68, 4121–4143. [Google Scholar] [CrossRef]
- Phillips, G.N.; Powell, R. Formation of gold deposits: A metamorphic devolatilization model. J. Metamorph. Geol. 2010, 28, 689–718. [Google Scholar] [CrossRef]
- Phillips, G.N.; Evans, K.A. Role of CO2 in the formation of gold deposits. Nature 2004, 429, 860–863. [Google Scholar] [CrossRef]
- Neall, F.B.; Phillips, G.N. Fluid-wall rock interaction in an Archean hydrothermal gold deposit: A thermodynamic model for the Hunt Mine, Kambalda. Econ. Geol. 1987, 82, 1679–1694. [Google Scholar] [CrossRef]
- Naden, J.; Shepherd, T.J. Role of methane and carbon dioxide in gold deposition. Nature 1989, 342, 793–795. [Google Scholar] [CrossRef]
- Lee, J.K.W.; Williams, I.S.; Ellis, D.J. Pb, U and Th diffusion in natural zircon. Nature 1997, 390, 159–162. [Google Scholar] [CrossRef]
- Yeats, C.J.; McNaughton, N.J.; Groves, D.I. SHRIMP U-Pb geochronological constraints on Archean volcanic-hosted massive sulfide and lode gold mineralization at Mount Gibson, Yilgarn Craton, Western Australia. Econ. Geol. 1996, 91, 1354–1371. [Google Scholar] [CrossRef]
- Claoué-Long, J.C.; King, R.W.; Kerrich, R. Archaean hydrothermal zircon in the Abitibi greenstone belt: Constraints on the timing of gold mineralisation. Earth Planet. Sci. Lett. 1990, 98, 109–128. [Google Scholar] [CrossRef]
- Kerrich, R.; King, R. Hydrothermal zircon and baddeleyite in Val-d’Or Archean mesothermal gold deposits: Characteristics, compositions, and fluid-inclusion properties, with implications for timing of primary gold mineralization. Can. J. Earth Sci. 1993, 30, 2334–2351. [Google Scholar] [CrossRef]
- Xu, J.C.; Gu, X.X.; Zhang, Y.M.; Wang, J.L.; He, G.; Zhou, C.; Liu, R.P. Geology, fluid inclusions, HO isotope, and hydrothermal zircon U-Pb geochronology of the Daqingshan orogenic gold deposit in Beishan orogenic belt, Xinjiang, NW China. Miner. Depos. 2021, 56, 325–342. [Google Scholar] [CrossRef]
- Deng, X.D.; Li, J.W.; Wen, G. U-Pb geochronology of hydrothermal zircons from the early Cretaceous iron skarn deposits in the Handan-Xingtai district, North China craton. Econ. Geol. 2015, 110, 2159–2180. [Google Scholar] [CrossRef]
- Li, X.; Wang, K.Y.; Sun, G.S.; Sun, J.D.; Liu, G.Y.; Zhang, J.T.; Han, L.; Wang, G.W. Discussion on metallogenesis of Zhaojiagou Ta-Nb deposit in Inner Mongolia: Evidence from amazonitization and albitization granite geochronology and geochemistry. Acta Petrol. Sin. 2021, 37, 1765–1784. (In Chinese) [Google Scholar]
- Li, X.C.; Fan, H.R.; Zeng, X.; Yang, K.F.; Yang, Z.F.; Wang, Q.W.; Li, H.T. Identification of ~1.3 Ga hydrothermal zircon from the giant Bayan Obo REE deposit (China): Implication for dating geologically-complicated REE ore system. Ore Geol. Rev. 2021, 138, 104405. [Google Scholar] [CrossRef]
- Zhang, S.; Zhou, T.F.; Zhang, Z.Z.; Wu, M.A.; Wang, J.; Lü, Q.T. In-situ hydrothermal zircon U-Pb and phlogopite 40Ar-39Ar geochronology of uranium mineralisation in Luzong ore district scientific drilling (LTZK01), Anhui Province, SE China: Constraints on the mineralisation process. Ore Geol. Rev. 2021, 134, 104133. [Google Scholar] [CrossRef]
- Jiang, W.C.; Li, H.; Evans, N.J.; Wu, J.H. Zircon records multiple magmatic-hydrothermal processes at the giant Shizhuyuan W-Sn-Mo-Bi polymetallic deposit, South China. Ore Geol. Rev. 2019, 115, 103160. [Google Scholar] [CrossRef]
- Elatikpo, S.M.; Li, H.; Liu, B.; Zhang, W.D. Metallogenesis of the Bakoshi-Kundila gold deposit in northern West Nigerian Subshield: Insights from pyrite chemical and sulfur isotopic compositions and zircon U-Pb geochronology. Precambr. Res. 2022, 383, 106890. [Google Scholar] [CrossRef]
- Dubińska, E.; Bylina, P.; Kozlowski, A.; Dörr, W.; Nejbert, K.; Schastok, J.; Kulicki, C. U-Pb dating of serpentinization: Hydrothermal zircon from a metasomatic rodingite shell (Sudetic ophiolite, SW Poland). Chem. Geol. 2004, 203, 183–203. [Google Scholar] [CrossRef]
- Dempster, T.J.; Hay, D.C.; B1uck, B.J. Zircon growth in slate. Geology 2004, 32, 221–224. [Google Scholar] [CrossRef]
- Zhai, W.; Zhang, E.; Zheng, S.Q.; Santosh, M.; Sun, X.M.; Niu, H.C.; Fu, B.; Fu, Y.; Li, D.F.; Jiang, Y.H.; et al. Hydrothermal zircon: Characteristics, genesis and metallogenic implications. Ore Geol. Rev. 2022, 149, 105111. [Google Scholar] [CrossRef]
- Fan, T.T.; Zhou, X.H.; Liu, Y.Q.; Li, W.; Zheng, Z.Y.; Hu, T.; Liang, H. Crystal tuff zircon LA-ICP-MS U-Pb ages from the Lower Jiangbasitao Formation in the East Daheishan area, Xinjiang and their geological implications. Acta Sedimentol. Sin. 2011, 29, 312–320. (In Chinese) [Google Scholar]
- Wang, J.; Su, Y.P.; Zheng, J.P.; Belousova, E.A.; Chen, M.; Dai, H.K.; Zhou, L. Rapid transition from oceanic subduction to postcollisional extension revealed by Carboniferous magmatism in East Junggar (NW China), southwestern Central Asian orogenic belt. GSA Bull. 2022, 134, 1018–1042. [Google Scholar] [CrossRef]
- Xi, X.W.; Yang, L.Q.; Wang, Y.J.; Deng, J.; Lin, G.; Wang, J.P.; Lei, X.Q. Numerical modeling of the temperature effects of tectonic regimes transformation and their ore-forming dynamics. Earth Sci. Front. 2003, 10, 47–55. (In Chinese) [Google Scholar]
- Li, H.Q.; Chen, F.W. Regional Mineralization in Altay Area of Northern Xinjiang China; Geological Publishing House: Beijing, China, 2004; pp. 1–391. (In Chinese) [Google Scholar]
- Lu, Y.M.; Zhang, Y.J.; Pan, M.; Fan, J.J.; Liu, Y.F.; Zhang, D.; Chen, X.W.; Pan, A.J. Types and geological characteristics of gold deposits in East Junggar, Xinjiang. Acta Geosci. Sin. 2010, 31, 434–442. (In Chinese) [Google Scholar]
- Chen, W.Z.; Gu, X.X.; Zhang, Y.M.; He, G.; Huang, G.; Li, J.T. Geological features and geochronology of the Jinshuiquan gold deposit in the East Junggar, Xinjiang. Geol. Bull. China 2019, 38, 1240–1255. (In Chinese) [Google Scholar]
- Liu, J.; Bao, X.S.; Gao, Y.B.; Yang, K.; Kou, S.L.; Yang, W.; Wang, Z.B.; He, J.L.; Zhang, Y.X.; Chen, H. Composition and Geochemical Characteristics of Pyrite and Quartz: Constraints on the Origin of the Xinjiazui Gold Deposit, Northwestern Margin of the Yangtze Block, China. Minerals 2022, 12, 688. [Google Scholar] [CrossRef]


| Mineral | Se | Cd | Au | Ag | As | Fe | S | Cu | Pb | Sb | Zn | Ni | Co | Hg | Te | Bi | Total | |
|---|---|---|---|---|---|---|---|---|---|---|---|---|---|---|---|---|---|---|
| Ng (n = 3) | ||||||||||||||||||
| Min | wt.% | 89.35 | 2.81 | bdl | 0.49 | 0.01 | 0.03 | bdl | bdl | bdl | bdl | bdl | 2.42 | bdl | 0.78 | 96.89 | ||
| Max | 90.51 | 3.08 | 0.01 | 1.30 | 0.02 | 0.06 | bdl | 0.02 | 0.02 | bdl | 0.02 | 2.56 | 0.04 | 1.29 | 97.26 | |||
| Avg | 89.82 | 2.95 | 0.01 | 0.77 | 0.01 | 0.04 | bdl | 0.01 | 0.01 | bdl | 0.01 | 2.50 | 0.01 | 0.97 | 97.10 | |||
| Min | at.% | 0.87 | 0.05 | bdl | 0.02 | 0.00 | 0.00 | bdl | bdl | bdl | bdl | bdl | 0.02 | bdl | 0.01 | 1.00 | ||
| Max | 0.90 | 0.05 | 0.00 | 0.04 | 0.00 | 0.00 | bdl | 0.00 | 0.00 | bdl | 0.00 | 0.02 | 0.00 | 0.01 | 1.00 | |||
| Avg | 0.88 | 0.05 | 0.00 | 0.03 | 0.00 | 0.00 | bdl | 0.00 | 0.00 | bdl | 0.00 | 0.02 | 0.00 | 0.01 | 1.00 | |||
| Apy (n = 8) | ||||||||||||||||||
| Min | wt.% | 0.20 | bdl | bdl | bdl | 39.84 | 35.53 | 21.21 | bdl | bdl | bdl | bdl | bdl | 0.03 | 98.26 | |||
| Max | 0.27 | 0.03 | 0.01 | 0.02 | 41.38 | 36.45 | 22.39 | 0.01 | 0.08 | 0.08 | 0.03 | 0.02 | 0.06 | 99.35 | ||||
| Avg | 0.23 | 0.01 | 0.00 | 0.01 | 40.45 | 35.93 | 22.02 | 0.00 | 0.02 | 0.02 | 0.01 | 0.01 | 0.05 | 98.75 | ||||
| Min | at.% | 0.00 | bdl | bdl | bdl | 0.85 | 1.02 | 1.07 | bdl | bdl | bdl | bdl | bdl | 0.00 | 3.00 | |||
| Max | 0.01 | 0.00 | 0.00 | 0.00 | 0.89 | 1.04 | 1.12 | 0.00 | 0.00 | 0.00 | 0.00 | 0.00 | 0.00 | 3.00 | ||||
| Avg | 0.00 | 0.00 | 0.00 | 0.00 | 0.86 | 1.03 | 1.10 | 0.00 | 0.00 | 0.00 | 0.00 | 0.00 | 0.00 | 3.00 | ||||
| Formula | Fe1.03As0.86S1.10 (to 3 atoms p.f.u.) | |||||||||||||||||
| Py2 (n = 10) | ||||||||||||||||||
| Min | wt.% | bdl | bdl | bdl | bdl | 0.51 | 45.64 | 52.34 | bdl | bdl | bdl | bdl | bdl | bdl | 99.44 | |||
| Max | 0.01 | 0.02 | 0.08 | 0.01 | 1.96 | 46.66 | 53.68 | 0.05 | 0.12 | 0.02 | 0.03 | 0.28 | 0.15 | 101.11 | ||||
| Avg | 0.00 | 0.01 | 0.02 | 0.00 | 1.21 | 46.05 | 52.78 | 0.01 | 0.04 | 0.00 | 0.01 | 0.05 | 0.07 | 100.25 | ||||
| Min | at.% | bdl | bdl | bdl | bdl | 0.01 | 0.99 | 1.97 | bdl | bdl | bdl | bdl | bdl | bdl | 3.00 | |||
| Max | 0.00 | 0.00 | 0.00 | 0.00 | 0.03 | 1.00 | 2.00 | 0.00 | 0.00 | 0.00 | 0.00 | 0.01 | 0.00 | 3.00 | ||||
| Avg | 0.00 | 0.00 | 0.00 | 0.00 | 0.02 | 0.99 | 1.98 | 0.00 | 0.00 | 0.00 | 0.00 | 0.00 | 0.00 | 3.00 | ||||
| Formula | Fe0.99S1.98 (to 3 atoms p.f.u.) | |||||||||||||||||
| Cpy (n = 10) | ||||||||||||||||||
| Min | wt.% | bdl | bdl | bdl | 0.00 | bdl | 27.27 | 33.54 | 32.06 | 0.00 | bdl | 0.01 | bdl | 0.04 | 97.90 | |||
| Max | 0.05 | 0.03 | 0.05 | 0.04 | 0.03 | 31.05 | 34.73 | 35.93 | 0.10 | 0.12 | 1.52 | 0.01 | 0.07 | 99.48 | ||||
| Avg | 0.01 | 0.01 | 0.01 | 0.02 | 0.01 | 29.24 | 34.30 | 34.45 | 0.04 | 0.05 | 0.38 | 0.00 | 0.05 | 98.57 | ||||
| Min | at.% | bdl | bdl | bdl | 0.00 | bdl | 0.92 | 1.98 | 0.94 | 0.00 | bdl | 0.00 | bdl | 0.00 | 4.00 | |||
| Max | 0.00 | 0.00 | 0.00 | 0.00 | 0.00 | 1.04 | 2.02 | 1.07 | 0.00 | 0.00 | 0.04 | 0.00 | 0.00 | 4.00 | ||||
| Avg | 0.00 | 0.00 | 0.00 | 0.00 | 0.00 | 0.98 | 2.00 | 1.01 | 0.00 | 0.00 | 0.01 | 0.00 | 0.00 | 4.00 | ||||
| Formula | Cu1.01Fe0.98S2.00 (to 4 atoms p.f.u.) | |||||||||||||||||
| Stage/Type | Range | Vapor (vol.%) | XCO2 | Tm-CO2 (°C) | Tm-cla (°C) | Th-CO2 (°C) | Tm-ice (°C) | Th (°C) | Salinity (wt.% NaCl eqv.) | ρCO2 (g/cm3) | ρtotal (g/cm3) |
|---|---|---|---|---|---|---|---|---|---|---|---|
| Early stage | |||||||||||
| C-type | Min | 30 | 0.11 | −58.2 | 8.9 | 18.8 | 257 | 0.4 | 0.60 | 0.80 | |
| Max | 60 | 0.31 | −57.4 | 9.8 | 29.9 | 339 | 2.2 | 0.79 | 1.01 | ||
| Avg | 36 | 0.15 | −57.8 | 9.5 | 23.6 | 298 | 1.1 | 0.73 | 0.91 | ||
| n | 19 | 18 | 10 | 15 | 18 | 19 | 15 | 18 | 18 | ||
| W-type | Min | 20 | −2.2 | 220 | 2.6 | 0.66 | |||||
| Max | 30 | −1.5 | 338 | 3.7 | 0.87 | ||||||
| Avg | 26 | −1.9 | 276 | 3.2 | 0.77 | ||||||
| n | 9 | 7 | 9 | 7 | 7 | ||||||
| Middle stage | |||||||||||
| C-type | Min | 20 | 0.07 | −62.2 | 7.5 | 12.9 | 209 | 0.4 | 0.66 | 0.82 | |
| Max | 80 | 0.58 | −56.0 | 9.8 | 28.8 | 361 | 4.8 | 0.84 | 0.99 | ||
| Avg | 38 | 0.16 | −58.3 | 9.0 | 22.5 | 277 | 2.0 | 0.74 | 0.91 | ||
| n | 69 | 69 | 36 | 64 | 69 | 69 | 64 | 69 | 69 | ||
| W-type | Min | 15 | −3.7 | 190 | 0.9 | 0.69 | |||||
| Max | 70 | −0.5 | 349 | 6.0 | 0.91 | ||||||
| Avg | 25 | −2.2 | 249 | 3.6 | 0.82 | ||||||
| n | 125 | 95 | 125 | 95 | 95 | ||||||
| PC-type | Min | 10 | −61.5 | 12.3 | 0.80 | ||||||
| Max | 30 | −57.2 | 19.0 | 0.86 | |||||||
| Avg | 21 | −59.0 | 16.1 | 0.82 | |||||||
| n | 7 | 7 | 7 | 7 | |||||||
| Late stage | |||||||||||
| W-type | Min | 15 | −4.3 | 172 | 1.4 | 0.79 | |||||
| Max | 35 | −0.8 | 287 | 6.9 | 0.95 | ||||||
| Avg | 23 | −1.8 | 213 | 3.0 | 0.88 | ||||||
| n | 51 | 31 | 51 | 31 | 31 | ||||||
| Sample No. | Mineral | δDwater | δ18Omineral | T (°C) | δ18Owater | Reference |
|---|---|---|---|---|---|---|
| L1506 | Quartz | −80.1 | 11.6 | 233 | 1.8 | This study |
| L15114 | Quartz | −68.7 | 14.0 | 261 | 5.5 | |
| L15197 | Quartz | −70.7 | 13.5 | 237 | 3.9 | |
| NMS4-29 | Quartz | −95.0 | 14.1 | 269 | 6.0 | [26] |
| NMS4-30 | Quartz | −92.0 | 19.0 | 269 | 10.9 | |
| NMS7-6 | Quartz | −82.0 | 14.8 | 253 | 6.0 | |
| NMS7-7 | Quartz | −99.0 | 19.7 | 253 | 10.9 | |
| SQD-84 | Quartz | −99.0 | 13.3 | 256 | 4.6 | [31] |
| 6N-53 | Quartz | −62.9 | 13.9 | 255 | 5.2 | [64] |
| Average | −83.3 | 14.9 | 6.1 |
Disclaimer/Publisher’s Note: The statements, opinions and data contained in all publications are solely those of the individual author(s) and contributor(s) and not of MDPI and/or the editor(s). MDPI and/or the editor(s) disclaim responsibility for any injury to people or property resulting from any ideas, methods, instructions or products referred to in the content. |
© 2023 by the authors. Licensee MDPI, Basel, Switzerland. This article is an open access article distributed under the terms and conditions of the Creative Commons Attribution (CC BY) license (https://creativecommons.org/licenses/by/4.0/).
Share and Cite
Ge, Z.; Gu, X.; Zhang, Y.; Ma, C.; Hao, D.; Zheng, Y.; Zhang, X.; Wang, L.; Liu, M.; Chen, W. Ore Mineralogy, Fluid Inclusion Geochemistry, and Zircon U-Pb Geochronology of the Nanmingshui Gold Deposit in East Junggar, Xinjiang, Northwest China: Implications for Ore Genesis. Minerals 2023, 13, 1296. https://doi.org/10.3390/min13101296
Ge Z, Gu X, Zhang Y, Ma C, Hao D, Zheng Y, Zhang X, Wang L, Liu M, Chen W. Ore Mineralogy, Fluid Inclusion Geochemistry, and Zircon U-Pb Geochronology of the Nanmingshui Gold Deposit in East Junggar, Xinjiang, Northwest China: Implications for Ore Genesis. Minerals. 2023; 13(10):1296. https://doi.org/10.3390/min13101296
Chicago/Turabian StyleGe, Zhanlin, Xuexiang Gu, Yongmei Zhang, Cheng Ma, Di Hao, Yanrong Zheng, Xiaoxing Zhang, Luzhi Wang, Ming Liu, and Weizhi Chen. 2023. "Ore Mineralogy, Fluid Inclusion Geochemistry, and Zircon U-Pb Geochronology of the Nanmingshui Gold Deposit in East Junggar, Xinjiang, Northwest China: Implications for Ore Genesis" Minerals 13, no. 10: 1296. https://doi.org/10.3390/min13101296