Article

Decoupling Method for the Convective-Dominated Leaching Process of Ion-Adsorption-Type Rare-Earth Ores

1
School of Civil and Surveying & Mapping Engineering, Jiangxi University of Science and Technology, Ganzhou 341000, China
2
Jiangxi Key Laboratory of Mining Engineering, Jiangxi University of Science and Technology, Ganzhou 341000, China
*
Author to whom correspondence should be addressed.
Minerals 2023, 13(1), 89; https://doi.org/10.3390/min13010089
Submission received: 14 November 2022 / Revised: 2 January 2023 / Accepted: 4 January 2023 / Published: 6 January 2023
(This article belongs to the Section Mineral Processing and Extractive Metallurgy)

Abstract

:
Ion-adsorption-type rare-earth ores (IATREOs) that have experienced granite weathering have good permeability, and their leaching process involves the solute transport problem, which is dominated by convection. Because of the oscillation and dispersion errors of existing numerical methods for solving the convective-dominated solute transport equation, the results have low precision in the twin leaching process. In this paper, the convection–dispersion equation is decoupled into the dispersion equation, the convection equation, and the source-sink equation; the Crank–Nicolson and implicit difference methods are used to solve the dispersion equation and the source-sink equation, respectively. The solution of the convection equation is achieved on the basis of its physical interpretation. Therefore, a decoupling method for the convective-dominated solute transport equation is established. In comparison to the two examples with analytical solutions, the calculation errors of the method established in this paper are less than 2.00%, and it can solve the oscillation and dispersion problems. The rationality of the method is further demonstrated through the column leaching experiment of IATREOs. In comparison to the test results, the coefficients of determination of the breakthrough curves of rare-earth ions and ammonium ions calculated by the proposed method are all greater than 0.850, and the peak concentration error of rare-earth ions is less than 7.00%. This indicates that the proposed method can simulate the leaching process well. Furthermore, by combining the multiple/half method and the dichotomy method, an optimization method for determining the leaching agent amount was established to analyze the relationship between the leaching agent and the ratio of dispersion to pillar length. The results can provide a solution that can be used to mine IATREOs from experience to theory.

1. Introduction

Medium and heavy rare-earth ores are crucial for high-precision products, and they are mainly obtained from ion-adsorption-type rare-earth ores (IATREOs) [1,2]. The leaching process of IATREOs can be divided into two processes: the exchange process, where the cations in the leaching agent solution undergo an ion exchange reaction with the cations adsorbed on the surface of the mineral soil particles [3,4,5], and the transport process, where the ions in the solution move down with the flow of water [4,6]. It can be seen that ionic rare-earth leaching is an issue of solute transport, and its twin model can be built by using the leaching solute transport theory [7,8,9]. Guo et al. [10] reviewed the solute transport mechanism of the ionic rare-earth leaching process. Long et al. [11] used the revealed difference method to solve the convection–dispersion equation to simulate the leaching process. Liu et al. [12] studied the seepage–reaction–stress-coupled simulation in the leaching process of IATREOs based on the solute transport module of COMSOL. The theory of solute transport based on convection and dispersion has been established. When convection is dominant, existing numerical methods are prone to introduce oscillation and dispersion errors, resulting in poor accuracy [13,14]. Therefore, establishing a high-precision solution to the convection-dominated solute transport equation is crucial to ensure the comprehensive application of the solute transport theory in leaching IATREOs.
A significant amount of research has been conducted to find a numerical solution to the convective-dominated solute transport problem; several methods, including the Euler method, Lagrange method, and Euler–Lagrange method, have been proposed. Based on the conventional numerical results, the Euler method [15,16] increases the numerical dispersion coefficient and revises the calculation results, which reduces the oscillation and dispersion of the calculation results to a certain extent. However, this method increases the complexity of differential decomposition, leading to the large computation burden of 2D and 3D problems [17]. Further, the Lagrange method transforms the coordinate system. When the motion of the coordinate system is the same as the convective motion, the problem of convection–dispersion motion is transformed into the problem of solute dispersion in the Lagrange coordinate system. The results show that the Lagrange method weakens the oscillation and dispersion of the calculated results. Similar to the Euler method, the Lagrange method also suffers from issues regarding large computational burdens and long calculation times, making it difficult to solve the 3D solute transport equation [18,19]. The Euler–Lagrange method proposes a series of improved algorithms [20,21] on the basis of introducing the characteristic line method into the calculation of the solute transport equation [22]. The results show that the Euler–Lagrange method and its improved algorithm can obtain ideal results by adopting low-price interpolation near non-steep peak surfaces. However, near steep peak surfaces, using low-price interpolation still leads to numerical dispersion [23]. Although significant research has been conducted to find a numerical solution to the convection-dominated solute transport equation, most methods have certain limitations, and the oscillation and dispersion problems of numerical solutions must still be solved.
The convection-dominated solute transport equation is prone to oscillation and dispersion problems, mainly because of the convection term. For the pure convection equation, there is an accurate solution. Therefore, the convection equation can be decoupled from the solute transport equation, and the existing accurate solution can be used to solve the convection equation so as to improve the solution accuracy of the convection–dispersion method. Based on this idea, the solute transport equation is decoupled into the dispersion equation, convection equation, and source-sink equation, and a decoupling method for the convection-dominated solute transport equation is established. The rationale of the proposed method was verified through theory and experimentation, and it was applied to determine the optimal amount of leaching agent.

2. Experimental

2.1. Ore Samples

Ore samples were taken from an ion adsorption rare-earth mine in Xinfeng, Jiangxi Province. All of the samples were air-dried in a ventilated environment and then sealed. The rare-earth partition was obtained through inductively coupled plasma mass spectrometry (ICP-MS) at the Center of Analysis and Testing at Jiangxi University of Science and Technology. The results are shown in Table 1; the relative molecular mass of rare-earth ions and rare-earth oxides was determined using a method of weighted averages, and the calculation formulas are Equations (1) and (2), respectively. The valence state of rare-earth ions can also be calculated from the rare-earth partition table through conducting weighted average calculations (Equation (3)).
M RE = p = 1 15 n p M RE , p 2 α p / M REO , p p = 1 15 n p M RE , p α p / M REO , p
M REO = p = 1 15 α p M REO , p
a = p = 1 15 n p a RE , p α p / M REO , p p = 1 15 n p α p / M REO , p
where MRE is the relative molecular mass of the rare-earth ions; MREO is the relative molecular mass of the rare-earth oxides; p = 1, 2, 3, …, 15 represent La, Ce, Pr, …, Y, respectively; np is the atomic number of the rare-earth element in a rare-earth oxide; αp is the amount of a certain rare-earth oxide in the total amount of rare-earth oxide as a percentage, as shown in Table 1; MRE,p and MREO,p are the relative molecular masses of a certain rare-earth ion and a rare-earth oxide, respectively; a is the average valence of rare-earth ions; aRE,p is the valence of the corresponding rare-earth ion, i.e., when p = 1, the rare-earth ion is a Lanthanum ion, as aRE,p = 3.

2.2. Grade Experiment of Ore Samples

Air-dried ore samples (0.05 kg) were poured into a glass funnel using moderate-speed filter paper (pore size 30–50 μm). Next, 0.30 L of (NH4)2SO4 solution ((NH4)2SO4 in the paper is the analytical reagent), with a concentration of 20 g/L, was added into the funnel each time. A measuring cylinder of 0.50 L was placed at the bottom of the funnel. The process of the experiment is shown in Figure 1. The volume of the leaching solution was measured and denoted as VRE,j. The concentration of rare-earth ions in the leaching solution was measured using the xylenol orange EDTA volumetric method [24], and this is denoted as cRE,j. Then, the grade of the ore sample was calculated using Equation (4). The detailed testing process was based on the experimental protocol of Long et al. [25].
ε RE = M REO j = 1 J V RE , j c RE , j 2 M RE m s
where εRE is the grade of the ore sample in g/kg; j is the amount of collected solution, j = 1, 2, …, J, where J is the total amount of liquid collected; VRE,j is the volume of the leaching solution, L; cRE,j is the concentration of rare-earth ions in g/L; ms is the mass of the ore samples in kg.

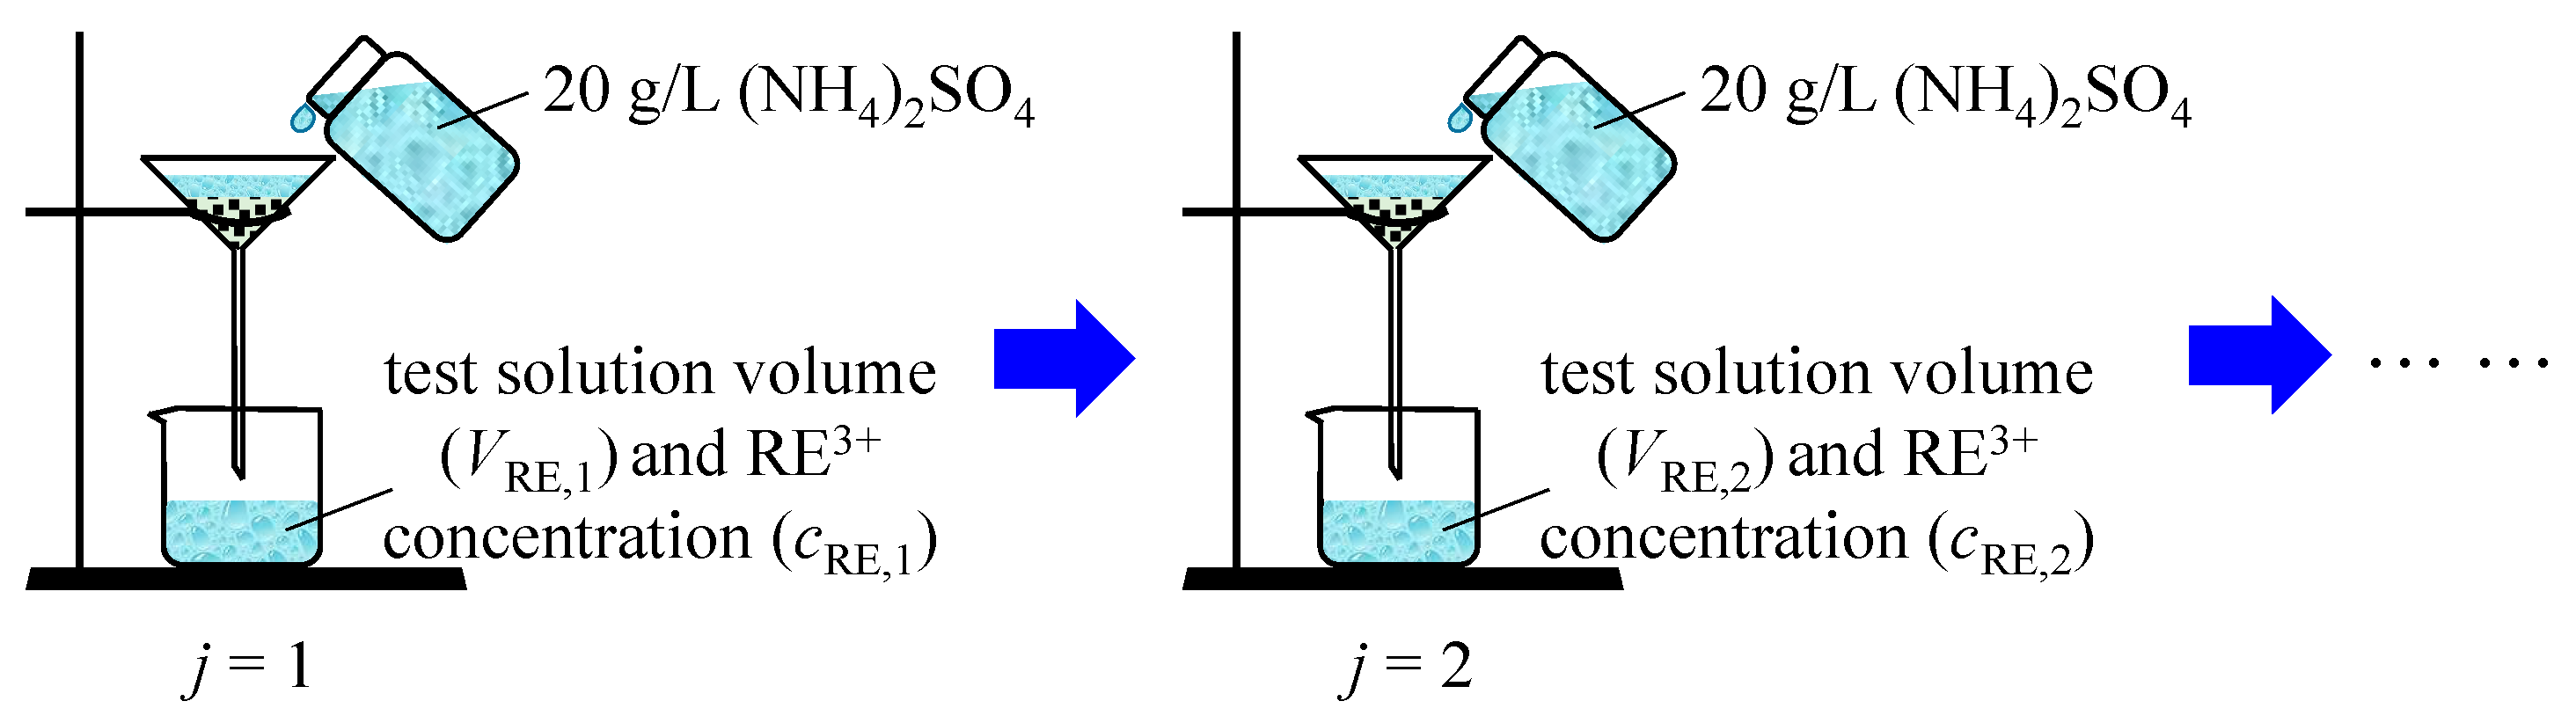
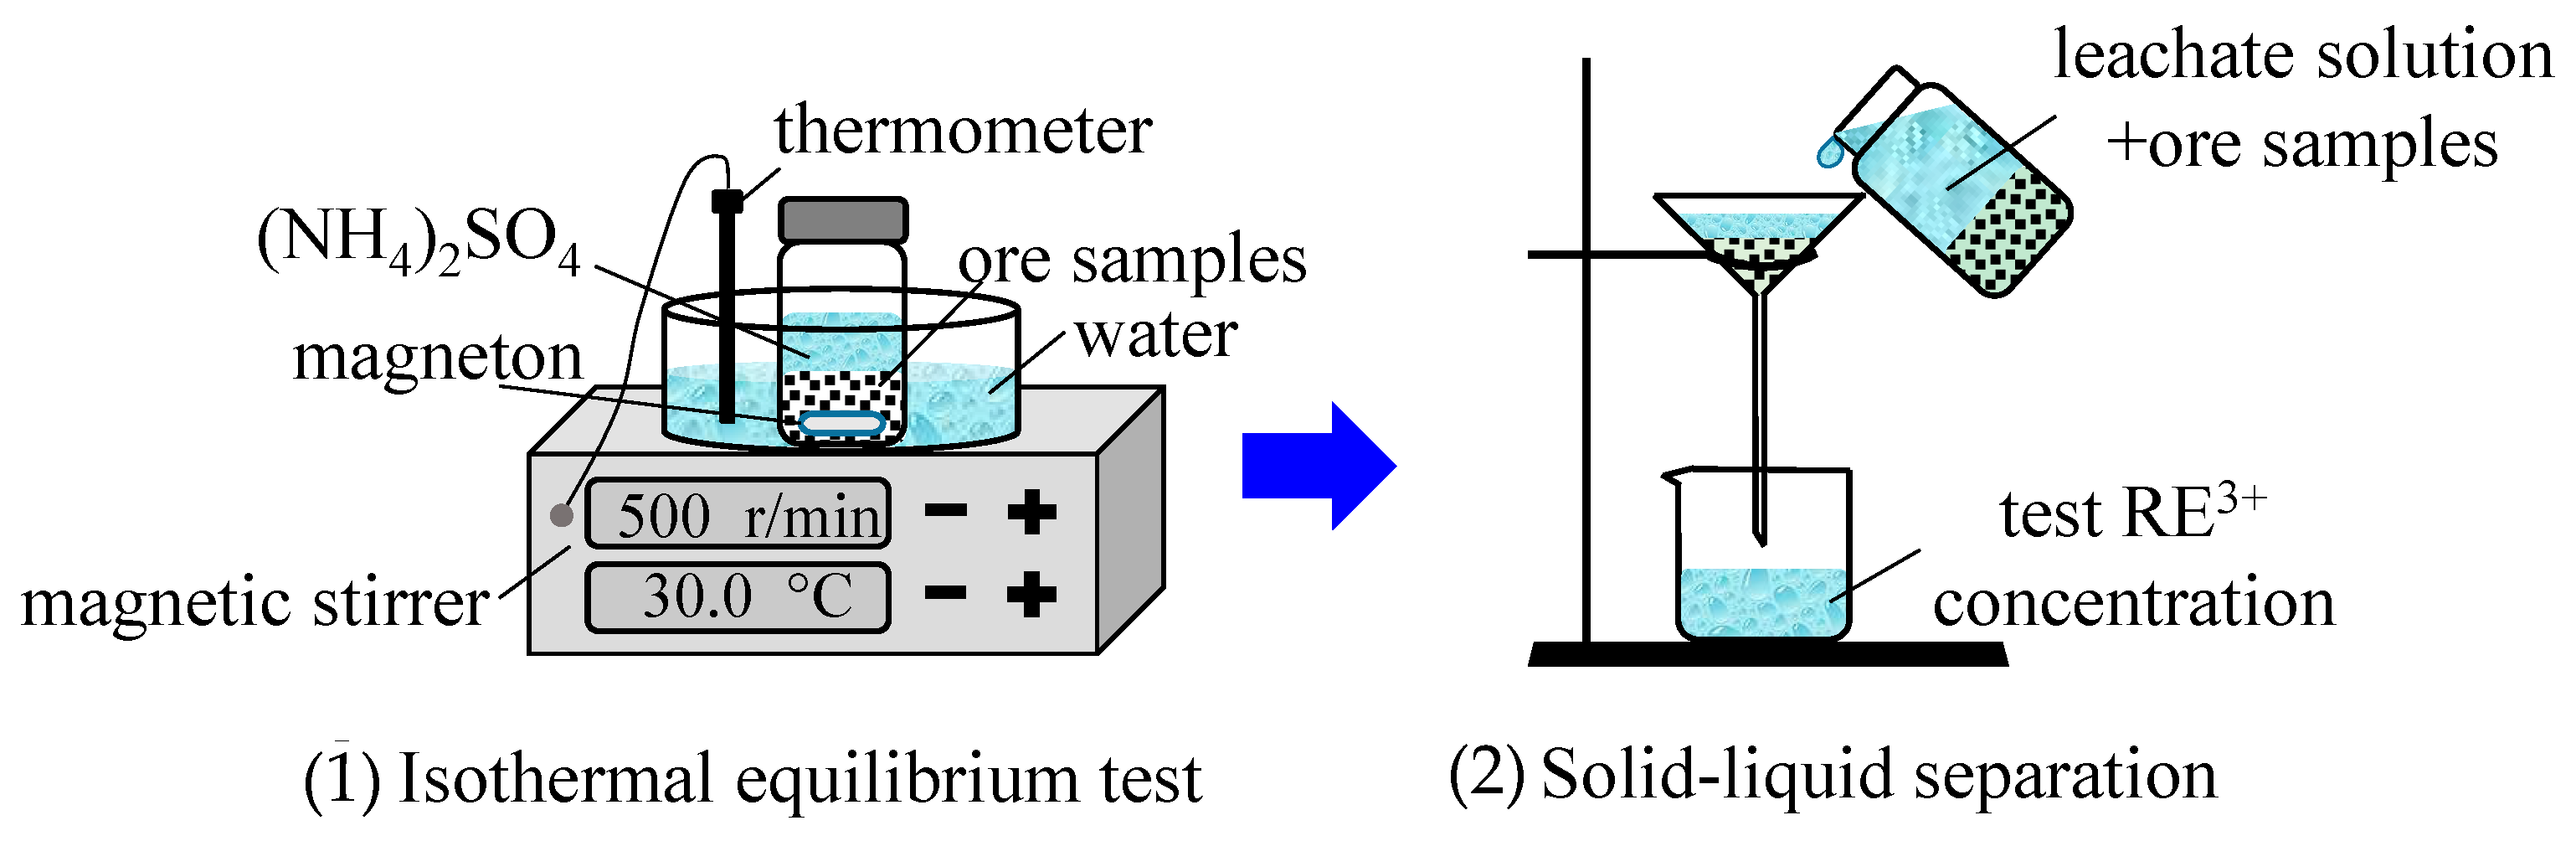
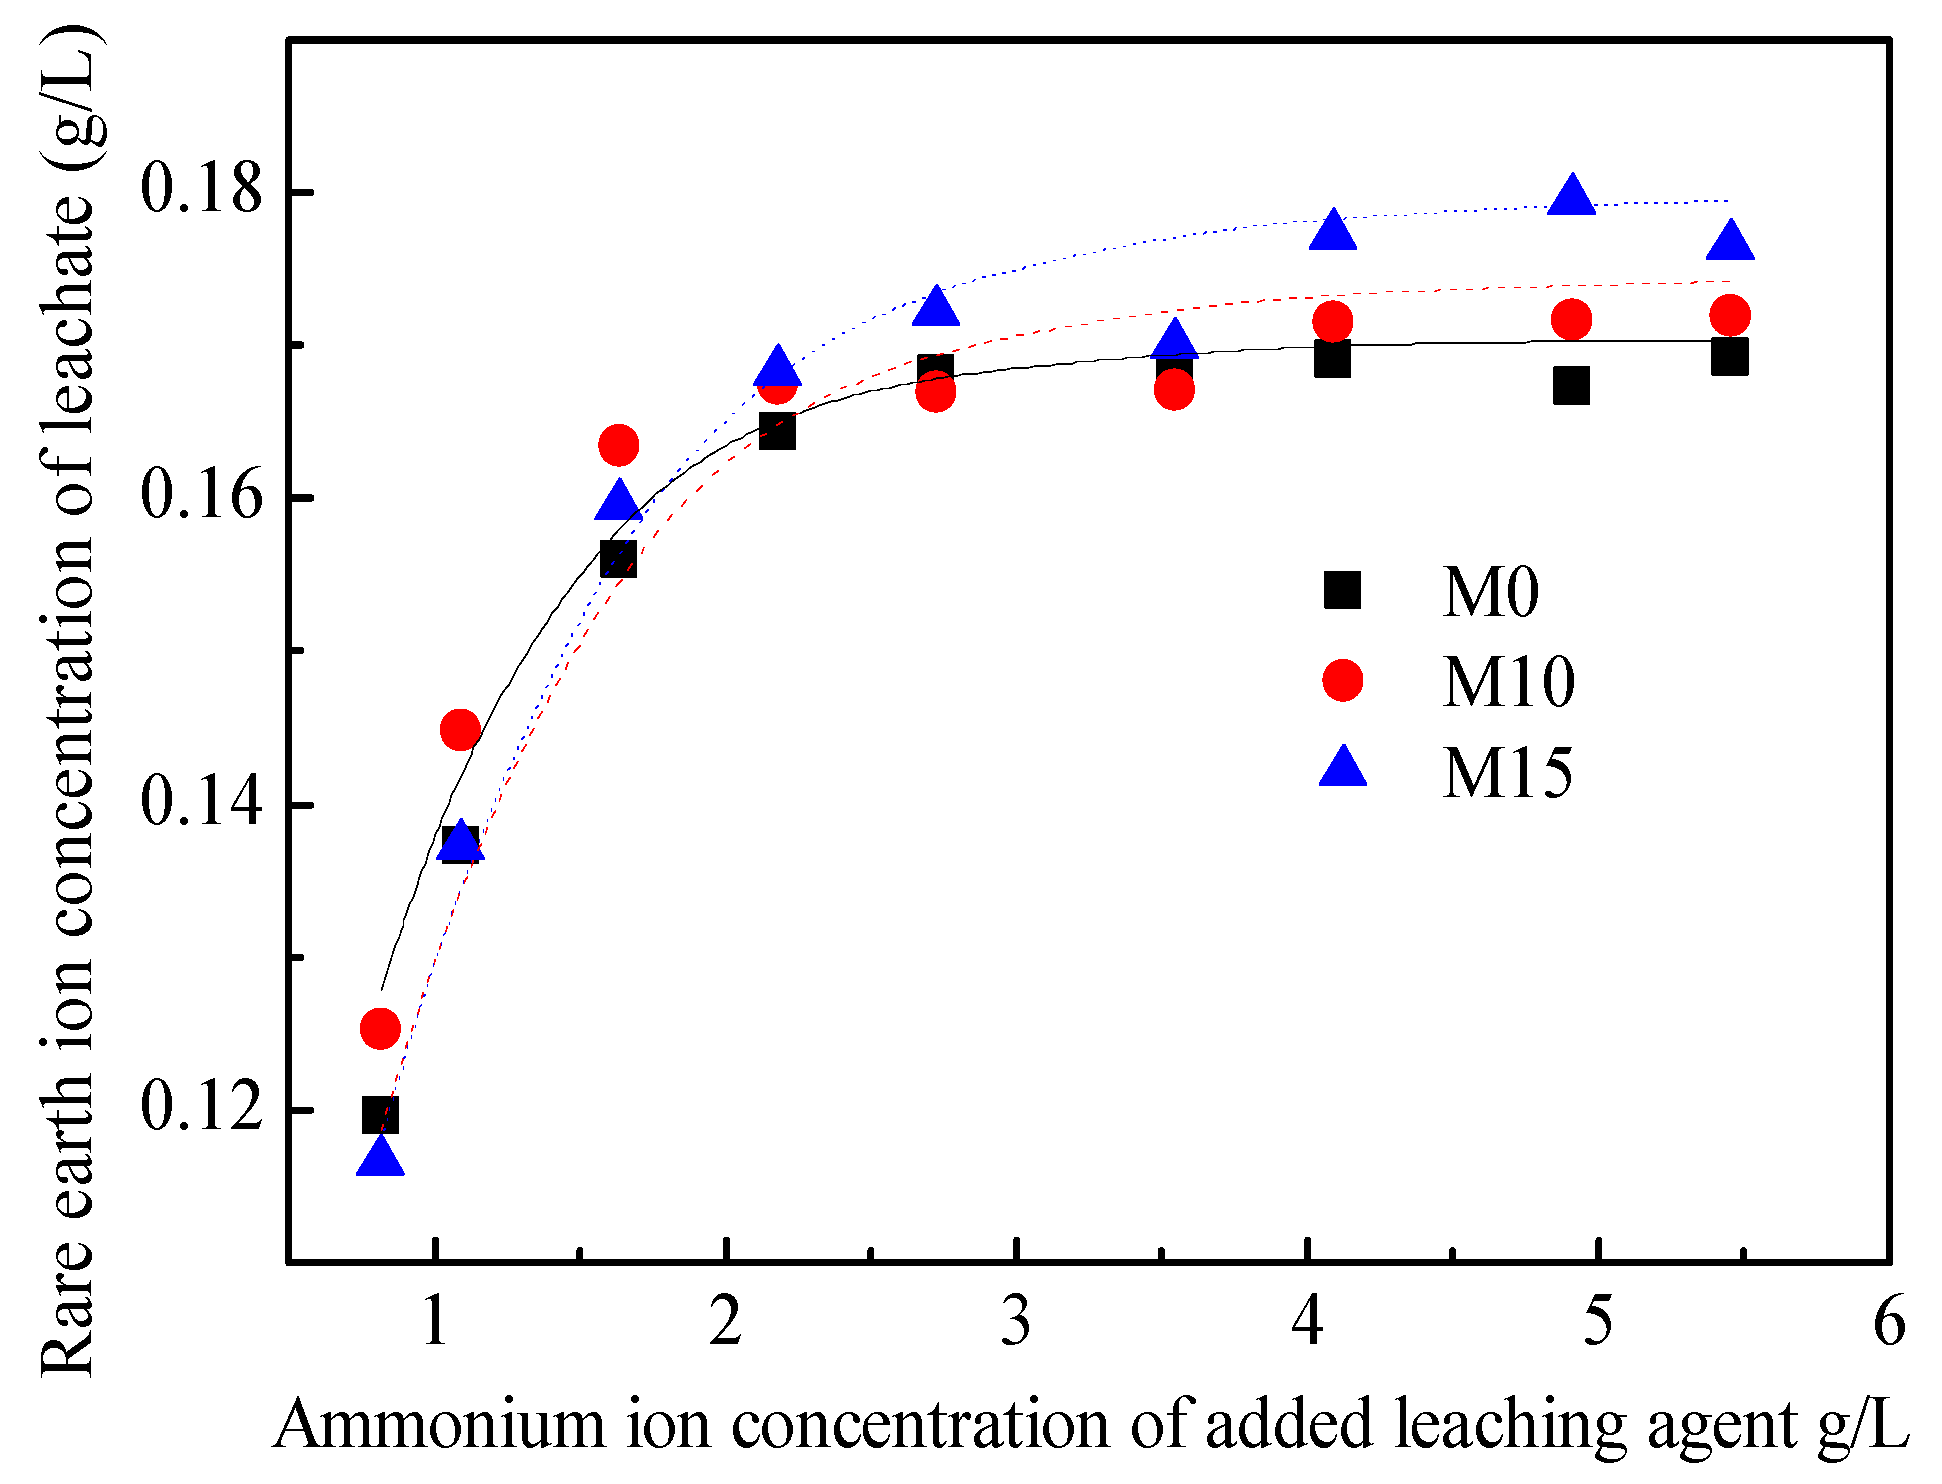
2.3. Ion Exchange Equilibrium Experiment

Five kg of the ore samples were sieved using a GZS-1 high-frequency vibrating screen machine (made by Zhejiang Dedong Motor Co., Ltd., Taizhou, China, the aperture was 0.3 mm). Percentages of the ore samples (0%, 10%, and 15%), which were smaller than 0.3 mm, were added into three 10.00 kg raw ore samples, then they were mixed well, and they were recorded as M0, M10, and M15, respectively.
The M0 ore sample (0.05 kg) was placed into nine centrifuge bottles. The (NH4)2SO4 solution (0.30 L), at various concentrations of 3, 4, 6, 8, 10, 13, 15, 18, and 20 g/L, was added into nine centrifuge bottles. All of the bottles were first put into an 85-2A magnetic stirrer (made by Changzhou Yuexin Instrument Manufacturing Co., Ltd., Changzhou, China), and the temperature was set at 30 °C, oscillated for 2 h, and then left to stand for 30 min. The medium-speed filter paper was used for the solid–liquid separation. The concentration of rare-earth ions in the leachate was measured by using the xylenol orange EDTA volumetric method. The ion exchange equilibrium test procedure for the M10 and M15 samples was the same as that which is mentioned above. The process of the ion exchange equilibrium experiment is shown in Figure 2.

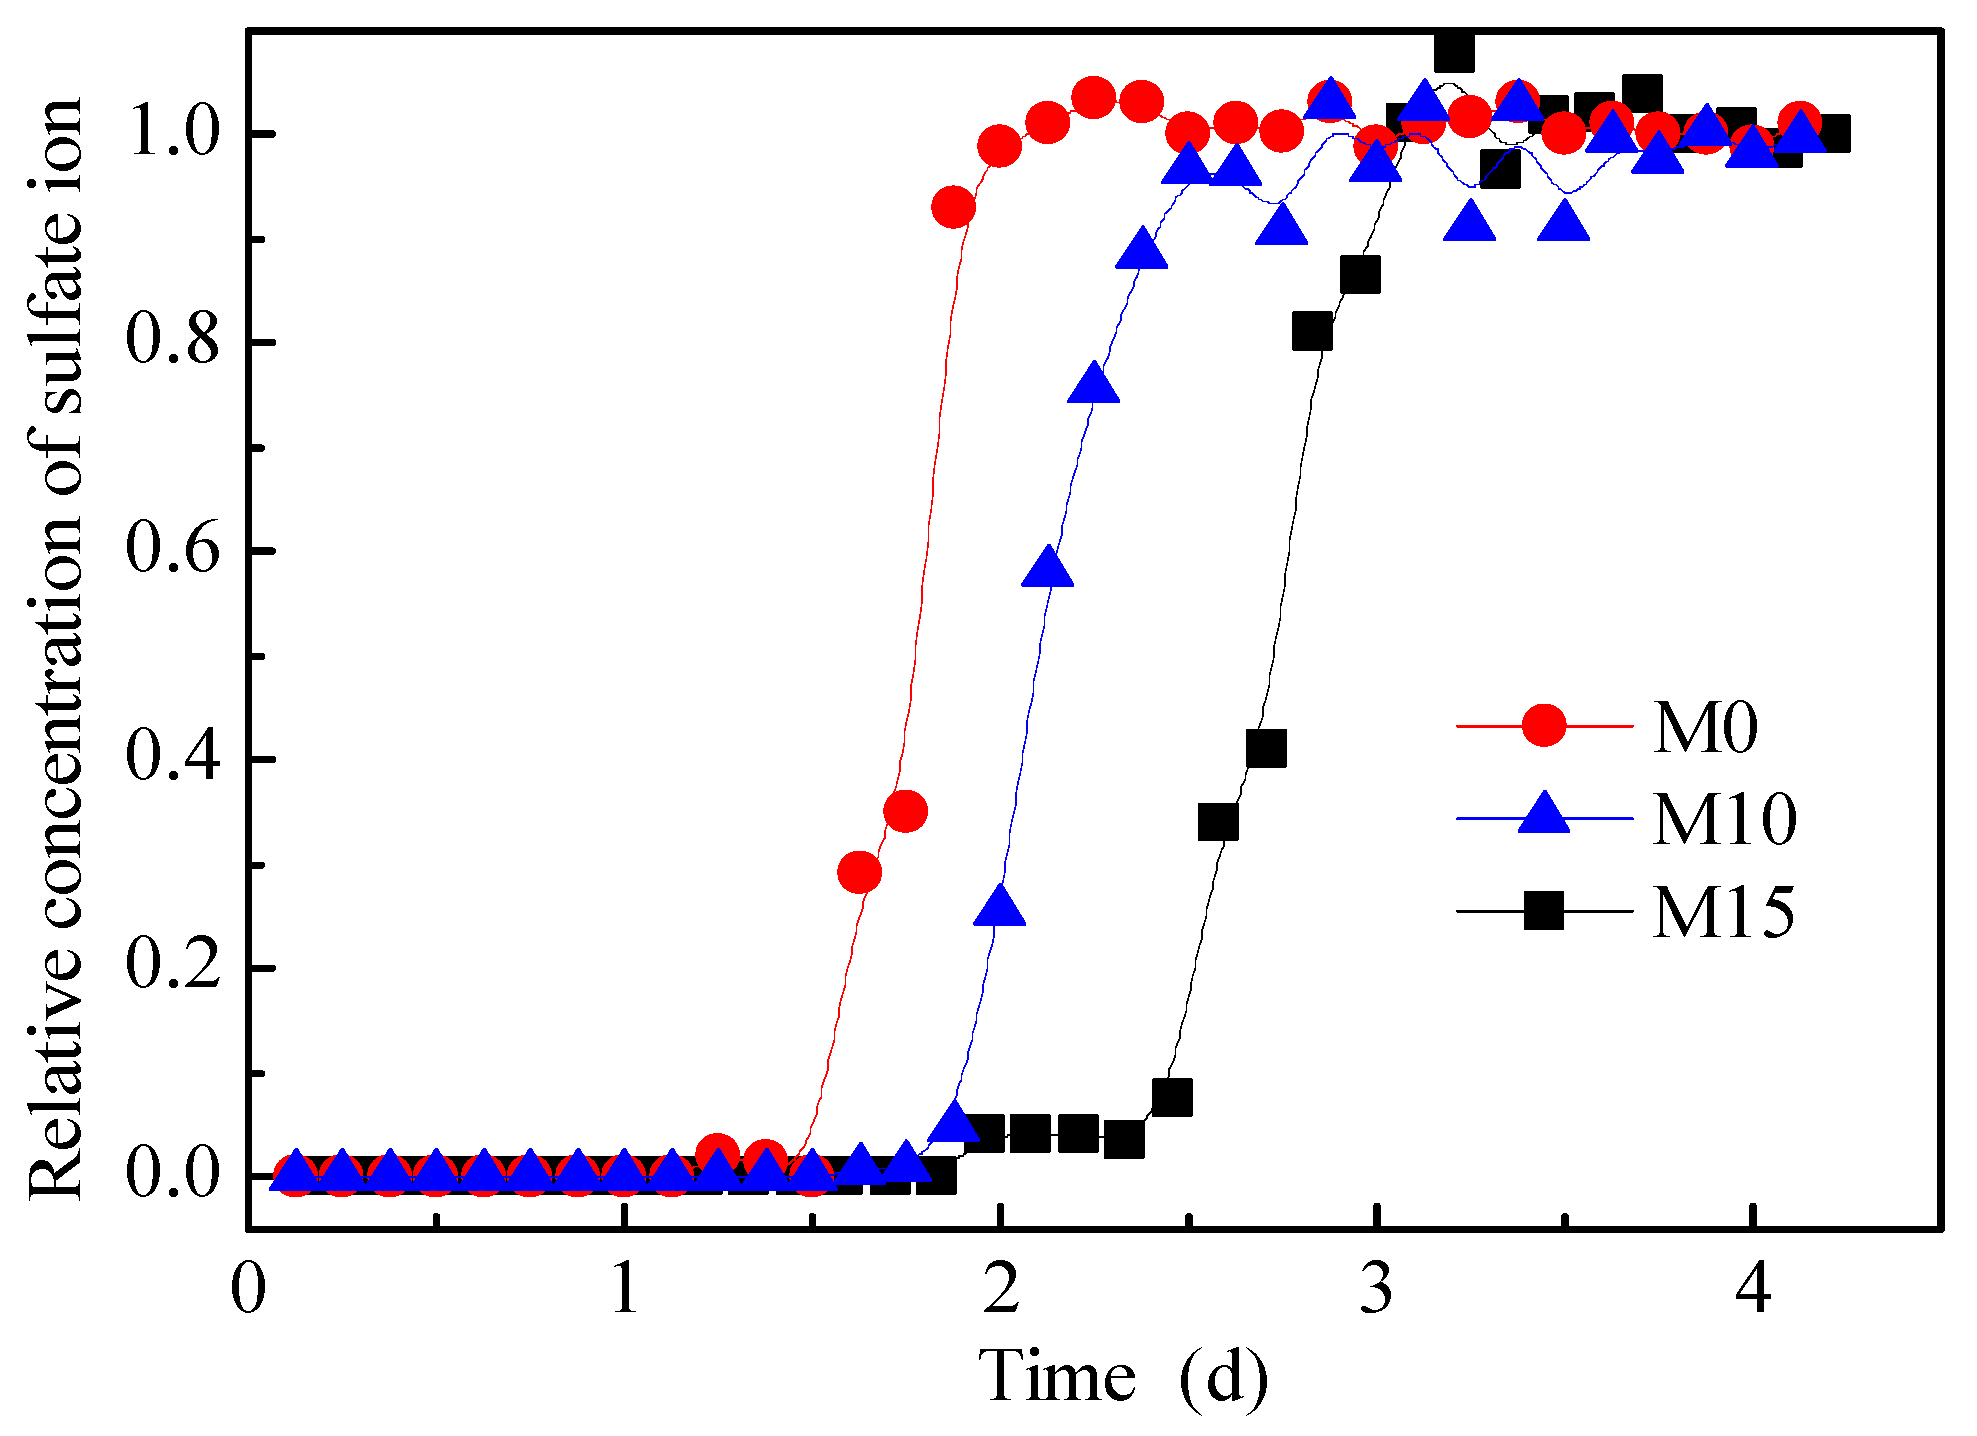
2.4. Column Leaching Experiment

The column leaching experiment of the M0 ore sample used taken as an example. The ore sample was turned into a wet ore sample with a mass moisture content of 10.0%. The ore pillar height was set to 0.20 m, and the void ratio was set to 1.0. A wet permeable stone was placed in a PVC pipe with a height of 0.30 m and an inner diameter of 0.075 m. Next, a filter paper was placed on the permeable stone, and a layer of coarse sand, with a thickness of 0.03 m, was evenly laid on the filter paper. The ore pillar was loaded in four layers, with an average thickness of 0.05 m, and it was scratched between the layers. After the ore pillar step was completed, a filter paper was placed on the top, and an overflow pipe was installed at 0.03 m above the filter paper. A BSZ-16 automatic liquid collector (made by the Shanghai Qingpu-Huxi Instruments Factory, Shanghai, China) was placed at the bottom of the ore pillar to collect the leachate. The column leaching test device is shown in Figure 3.
First, 132.53 mL (produced by AKDL-II-20 ultrapure water machine and made by Chengdu Aike Water Treatment Equipment Co., Ltd., Chengdu, China) of deionized water was added to the ore pillar, and the BT101L peristaltic pump (made by Balding Lead Fluid Technology Co., Ltd., Baoding, China) was used to continuously inject deionized water into the ore pillar. When the relative error between the injected quantity and outflow of deionized water was less than 1%, the deionized water was quickly replaced by (NH4)2SO4, with a concentration of 20 g/L; this moment was taken as the start time of the column leaching test. The volume of leaching solution collected was measured each time, and the concentrations of rare-earth ions, ammonium ions, and sulfate ions in the leaching solution were measured using the xylenol orange EDTA volumetric method, Nessler’s reagent spectrophotometer method [26], and Eriochrome black T EDTA titration method [27]. The leaching test for the M10 and M15 samples was the same as that are those mentioned above.

3. Modelling

3.1. Ion-Exchange Equilibrium Model

The leaching agent cationic desorption of IATREOs is a solid–liquid ion exchange process, whose reaction equation can be expressed by Equation (5) [8,28]. The Kerr model is usually used to describe the ion exchange equilibrium process of leaching IATREOs [29,30], and it is expressed as Equation (6).
REX a + a NH 4 + a NH 4 X + RE a +
K = ( q NH ) a c RE q RE ( c NH ) a
where RE represents the rare-earth ions; NH represents the ammonium ions; X represents the clay minerals, X = Al2Si2O5(OH)4; q is the solid phase ion concentration in g/kg; c is the liquid phase ion concentration in g/L; K is the ion exchange selectivity coefficient in (L/kg)a−1.
Before and after leaching, the leaching agent cations and rare-earth ions should satisfy the law of conservation of mass, and the number of adsorption sites on the ore surface should remain conserved [25,31]; Equations (7)–(9) can then be obtained. Equations (7)–(9) can be substituted into Equation (6) such that the relational formula between the cation concentration of the added leaching agent and the leached rare-earth ion concentration can be obtained, as shown in Equation (10). Taking the ion exchange selection coefficient as a basic unknown quantity, the ion exchange selectivity coefficient of the ore sample was determined by fitting the data of the ion-exchange equilibrium experiment in Section 2.3 with Equation (10).
c NH = c NH 0 + a M NH ( c RE 0 c RE ) M RE
q RE = q RE 0 + ( c RE 0 c RE ) V L m s
q NH = q NH 0 ( c RE 0 c RE ) a M NH V L M RE m s
K = [ q NH 0 ( c RE 0 c RE ) a M NH V L M RE m s ] a c RE [ q RE 0 + ( c RE 0 c RE ) V L m s ] [ c NH 0 + a M NH ( c RE 0 c RE ) M RE ] a
where the superscript 0 represents the ion concentration before leaching, and q RE 0 = 2 ε RE M RE / M REO ; MNH is the relative molecular mass of ammonium ions; VL is the volume of the added leaching agent solution in L.

3.2. Solute Transport Parameters Determination

When sulfates are used as leaching agents in the column leaching experiment, the adsorption of sulfate ions by mineral samples is always weak or non-existent [32]. In the process of leaching, sulfate ions are regarded as being non-reactive solutes. Under constant concentration boundary conditions, the average pore velocity and hydrodynamic dispersion coefficient of the ore pillars [13] can be determined by Equations (11) and (12), respectively, according to their relative concentration c SO R ( c SO R = c SO / c SO a ; c SO is the concentration of sulfate ions in the leachate and c SO a is the concentration of sulfate ions in the leaching agent) breakthrough curve of the sulfate ions.
u = L t 0.5
D = 1 8 ( L u t 0.16 t 0.16 L u t 0.84 t 0.84 ) 2
where u is the average pore velocity in m/d; D is the hydrodynamic dispersion coefficient in m2/d; D = αu, where α is the dispersion in m; L is the length of the soil column in m; t0.16, t0.5, and t0.84 are the corresponding times when c SO R = 0.16, c SO R = 0.5, and c SO R = 0.84, respectively, in the relative concentration breakthrough curve of sulfate ions, d.

3.3. Decoupling Method

Taking the Kerr model as the source-sink term, the convection—dispersion equation is used to describe the one-dimensional ionic rare-earth leaching process. The migration process of cations in the ore pillar can be expressed by Equation (13). The fixed solution conditions of the column leaching experiment in Section 2.4 are described by Equation (14).
c A t = D 2 c A z 2 u c A z + I A
{ c A ( t 0 , z = 0 ) = c A a c A ( t = 0 , z > 0 ) = c A 0 q A ( t = 0 , z > 0 ) = q A 0 c A ( t 0 ,   z = L ) z = 0
where A represents the ions migrating in the ore pillar, where A = RE, SO, or NH; t is time in d; z is the vertical coordinate; m is the positive direction vertically downwards; IA is the source and sink term of the ion, which is described by the Kerr model; c A a is the concentration of A ions in the leaching agent; c A 0 and q A 0 are the concentrations of A ions in the liquid and solid phases before leaching, respectively.
It is assumed that, in the ore pillar, the interactions between the dispersion, convection, and ion exchange of the ions is small, and it can be ignored. That is, at a certain moment, the ion migration process can be decoupled into three independent processes: diffusion, convection, and source-sink term processes. The dispersion equation and the convection equation are shown in Equations (15) and (16), respectively. Equation (15) is an ellipse equation, which yields high-precision results through the conventional numerical method. In this paper, the Crank–Nicolson difference method is used to solve Equation (15), and the result is Equation (17). Equation (16), which is a hyperbolic equation, and its corresponding numerical form are unconditionally unstable [13], therefore, the calculation results are poor. Equation (16) represents the pure convection equation, which can be calculated through its physical process. The characteristics of the pure convection process are as follows: if the ion concentration at time t and position x is c i k , after time interval ∆t, the ion concentration at position x + ut is also c i k , and Equation (16) can be calculated using Equation (18).
c ˜ A t = D 2 c ˜ A z 2
c ¯ A t = u c ¯ A z
D Δ t Δ z 2 c ˜ A | i 1 k + 1 + ( 1 + 2 D Δ t Δ z 2 ) c ˜ A | i k + 1 D Δ t Δ z 2 c ˜ A | i + 1 k + 1 = c A | i k
c ¯ A | i + g k + 1 = c ˜ A | i k
where c ˜ and c ¯ denote the ion concentrations under diffusion and convection, respectively; k and i are time and coordinate nodes, respectively, where k = 0, 1, 2, …, Nk and i = 1, 2, …, Ni − 1; ∆t and ∆z are the time and coordinate steps, respectively; g is a positive integer, g = ut/∆z.
The specific calculation steps for the convection–dispersion equation are as follows: (1) When k = 0, considering the influence of the diffusion process, the ion concentration distribution c ˜ A | i 1 at different positions can be obtained through Equation (17). (2) On the basis of the dispersion process, considering the influence of the convection process, the concentration distribution of the example in step (1) is corrected by Equation (18) to be c ˜ A | i 1 . (3) On the basis of steps (1) and (2), considering the source-sink process, the Kerr model of the column leaching process is shown in Equation (19), and the concentration distribution of rare-earth ions in the liquid phase can be determined by using Equation (19). (4) The concentration distribution of the liquid phase leaching agent cations, solid phase rare-earth ions, and solid phase leaching agent cations are obtained by substituting the concentration distribution of the liquid phase rare-earth ions into Equations (20)–(22). (5) Analogously, the concentration distribution of liquid phase rare-earth ions, solid phase rare-earth ions, liquid phase leaching agent cations, and solid phase leaching agent cations at different times can be obtained. A flow chart of the calculation process is shown in Figure 4.
K = [ q NH | i k ( c ¯ RE | i k + 1 c RE | i k + 1 ) a M NH V L M RE m s ] a c RE | i k + 1 [ q RE | i k + ( c ¯ RE | i k + 1 c RE | i k + 1 ) V L m s ] [ c ¯ NH | i k + 1 + a M NH ( c ¯ RE | i k + 1 c RE | i k + 1 ) M RE ] a
c NH | i k + 1 = c ¯ NH | i k + 1 + a M NH ( c ¯ RE | i k + 1 c RE | i k + 1 ) M RE
q RE | i k + 1 = q ¯ RE | i k + 1 + ( c ¯ RE | i k + 1 c RE | i k + 1 ) V L m s
q NH | i k + 1 = q ¯ NH | i k + 1 ( c ¯ RE | i k + 1 c RE | i k + 1 ) a M NH V L M RE m s
where VL/ms = θ0(1 + e)/ρs, θ0 is the volumetric water content of the ore pillar, in m3/m3; e is the pore ratio of the ore pillar; ρs is the density of soil particles, which is taken as ρs = 2700 kg/m3 in this paper.

4. Results and Discussion

4.1. Relative Molecular Weight and Valence of the Rare-Earth Ions

From the distribution data shown in Table 1, the proportions of Y2O3 and Eu2O3 are found to be 0.93% and 17.63%, respectively; this indicates that the test ore samples are of the medium yttrium and rich europium types. Using Equations (1) and (2), the relative molecular masses of the rare-earth ions and rare-earth oxides were calculated to be 135.9 and 331.77 g/mol, respectively. The average valence of the rare-earth ions calculated by Equation (3) is +3.19.

4.2. Grades of Ore Samples

The grades of all ore samples are shown in Figure 5, and they were analyzed through Equation (4). The grades of the M0 ore sample in parallel tests were found to be 1.25, 1.24, and 1.26 g/kg, respectively; those of the M10 sample were 1.28, 1.27, and 1.30 g/kg, and those of the M15 sample were 1.35, 1.31, and 1.30 g/kg, respectively. The cv (variation coefficients) of the test results for the M0, M10, and M15 samples are 0.80%, 1.74%, and 1.40%, respectively, which are all less than 5.00%, indicating that the grade experiment has good repeatability. The average value of three parallel tests was taken as the grade of the sample, therefore, the grades of the M0, M10, and M15 ore samples are 1.25, 1.28, and 1.32 g/kg, respectively.

4.3. Ion Exchange Selectivity Coefficient

The results for the ion-exchange equilibrium experiment are shown in Figure 6. When one is increasing the cation concentration of the leaching agent, the rare-earth ion concentration in the leachate first increases and then stabilizes. By taking the ion exchange selection coefficient K as the basic unknown quantity, the data in Figure 6 were fitted using Equation (10), and the K values of M0, M10, and M15 are 3.21 × 10⁻², 1.77 × 10⁻², and 1.56 × 10⁻² (L/kg)2.19, respectively. By taking cRE as the basic unknown quantity and substituting the result of the K value into Equation (10), the relationship curve between the ammonium ion concentration of the added leaching agent and the rare-earth ion concentration of the leachate was obtained, and it has been plotted in Figure 6. Further, the coefficients of determination between the fitting results and experimental values are 0.984, 0.992, and 0.987, respectively. It can be seen that the Kerr model can better describe the ion exchange process.

4.4. Determining u and D

The relative concentration breakthrough curves of the sulfate ions for M0, M10, and M15 are shown in Figure 7. According to the figure, the values of t0.16, t0.5, and t0.84 were obtained, as listed in Table 2. According to Table 2, u and D of the three pillars were obtained using Equations (11) and (12), respectively. The results are also listed in Table 2. The Peclet numbers (Pe = uL/D) of the three pillars are 208, 227, and 327, respectively. It can be seen that the leaching process of the three pillars was convection dominated.

4.5. Model Verification

4.5.1. Theoretical Verification

The two examples in the study by Mei et al. [33] were used to verify the rationality of the method proposed in this paper. The parameters in Example 1 are L = 120 m, u = 2 m/d, and D = 0.04 m2/d, the ions are non-reactive ions, and the concentration of injected agent was always 1.00 g/L. The parameters of Example 2 are L = 120 m, u = 2 m/d, and D = 0.04 m2/d, the ions are non-reactive ions, the change in the ion concentration with the coordinates at the initial time is shown in Equation (23), and the concentration of injected agent was always 0.00 g/L. The analytical solutions of Example 1 and Example 2 are Equation (11) and Equation (24), respectively. At the initial time, the solid phase rare-earth ion concentration, solid phase ammonium ion concentration, and liquid phase rare-earth ion concentration were set to 0, while the ammonium ion breakthrough curves at time t = 25 d were calculated by using the decoupling method under the two example parameters, as shown in Figure 8. The results of the analytical solution and the upstream weighting method (with a weighting factor of 0.8877) have also been plotted in Figure 8.
c ( t = 0 , z 0 ) = exp [ ( z z 0 ) 2 2 σ 0 2 ]
c ( t , x ) = σ 0 σ 0 2 + 2 D t exp [ ( z z 0 u t ) 2 2 σ 0 2 ]
where z0 = 20 m and σ0 = 8 m.
For Example 1 and Example 2, when the weighting factor is taken as 0.8877, the calculation results of the upstream weighting method exhibit no oscillation phenomena. However, in comparison to the analytical solution, in the area where the concentration changes greatly (Example 1: z ∈ [40, 60] and Example 2: z ∈ [40, 100]), the calculation result of the upstream weighting method is smoother, indicating that when the weighting coefficient is 0.8877, and the upstream weighting method can resolve the oscillation problem, but the dispersion phenomenon cannot be avoided. The calculation results of the proposed method agree well with the analytical solutions. The average relative error (Equation (25)) was used to quantify the accuracy of the calculation results. The average relative errors of Example 1 and Example 2 are 0.14% and 1.92%, respectively. It follows that the proposed method mitigates the oscillation and dispersion problems when one is solving the convection-dominated solute transport equation.
ξ = 0 L | c Ana c Dec | d z 0 L c Ana d z × 100 %
where ξ is the average relative error, cAna is the analytical solution of the breakthrough curves, and cDec is the breakthrough curve calculated by the proposed method.

4.5.2. Experimental Verification

The breakthrough curves of the column leaching experiments for the three samples are shown in Figure 9. At the end of the test, the volumetric water content of the M0, M10, and M15 pillars were 0.426, 0.428, and 0.445, respectively. In combination with the basic parameters measured above—the volume water content, RE grade, ion exchange selectivity coefficient, u, and D—the proposed method in Section 3.3 was used to simulate the IATREOs leaching process, and the breakthrough curves of ammonium ions and rare-earth ions were then obtained, as shown in Figure 9. The breakthrough curve calculated by the upstream weighting method has also been plotted in Figure 9. Table 3 shows the peak concentration, error, and coefficient of determination between the calculated results and the test results.
From Table 3, it can be seen that for the breakthrough curve of rare-earth ions, the upstream weighting method is negatively correlated with the test results, and the peak concentration error exceeds 45.00%, while the determination coefficients of the proposed method are all greater than 0.850, and the peak concentration error is less than 7.00%. For the breakthrough curves of the ammonium ions, the coefficients of determination of the upstream weighting method and the proposed method in this paper are all greater than 0.900. The results of the upstream weighting method show that the breakthrough curve of the rare-earth ions cannot be accurately predicted when the dispersion error is introduced into the solution algorithm. Further, the proposed method can simulate the rare-earth leaching process well.

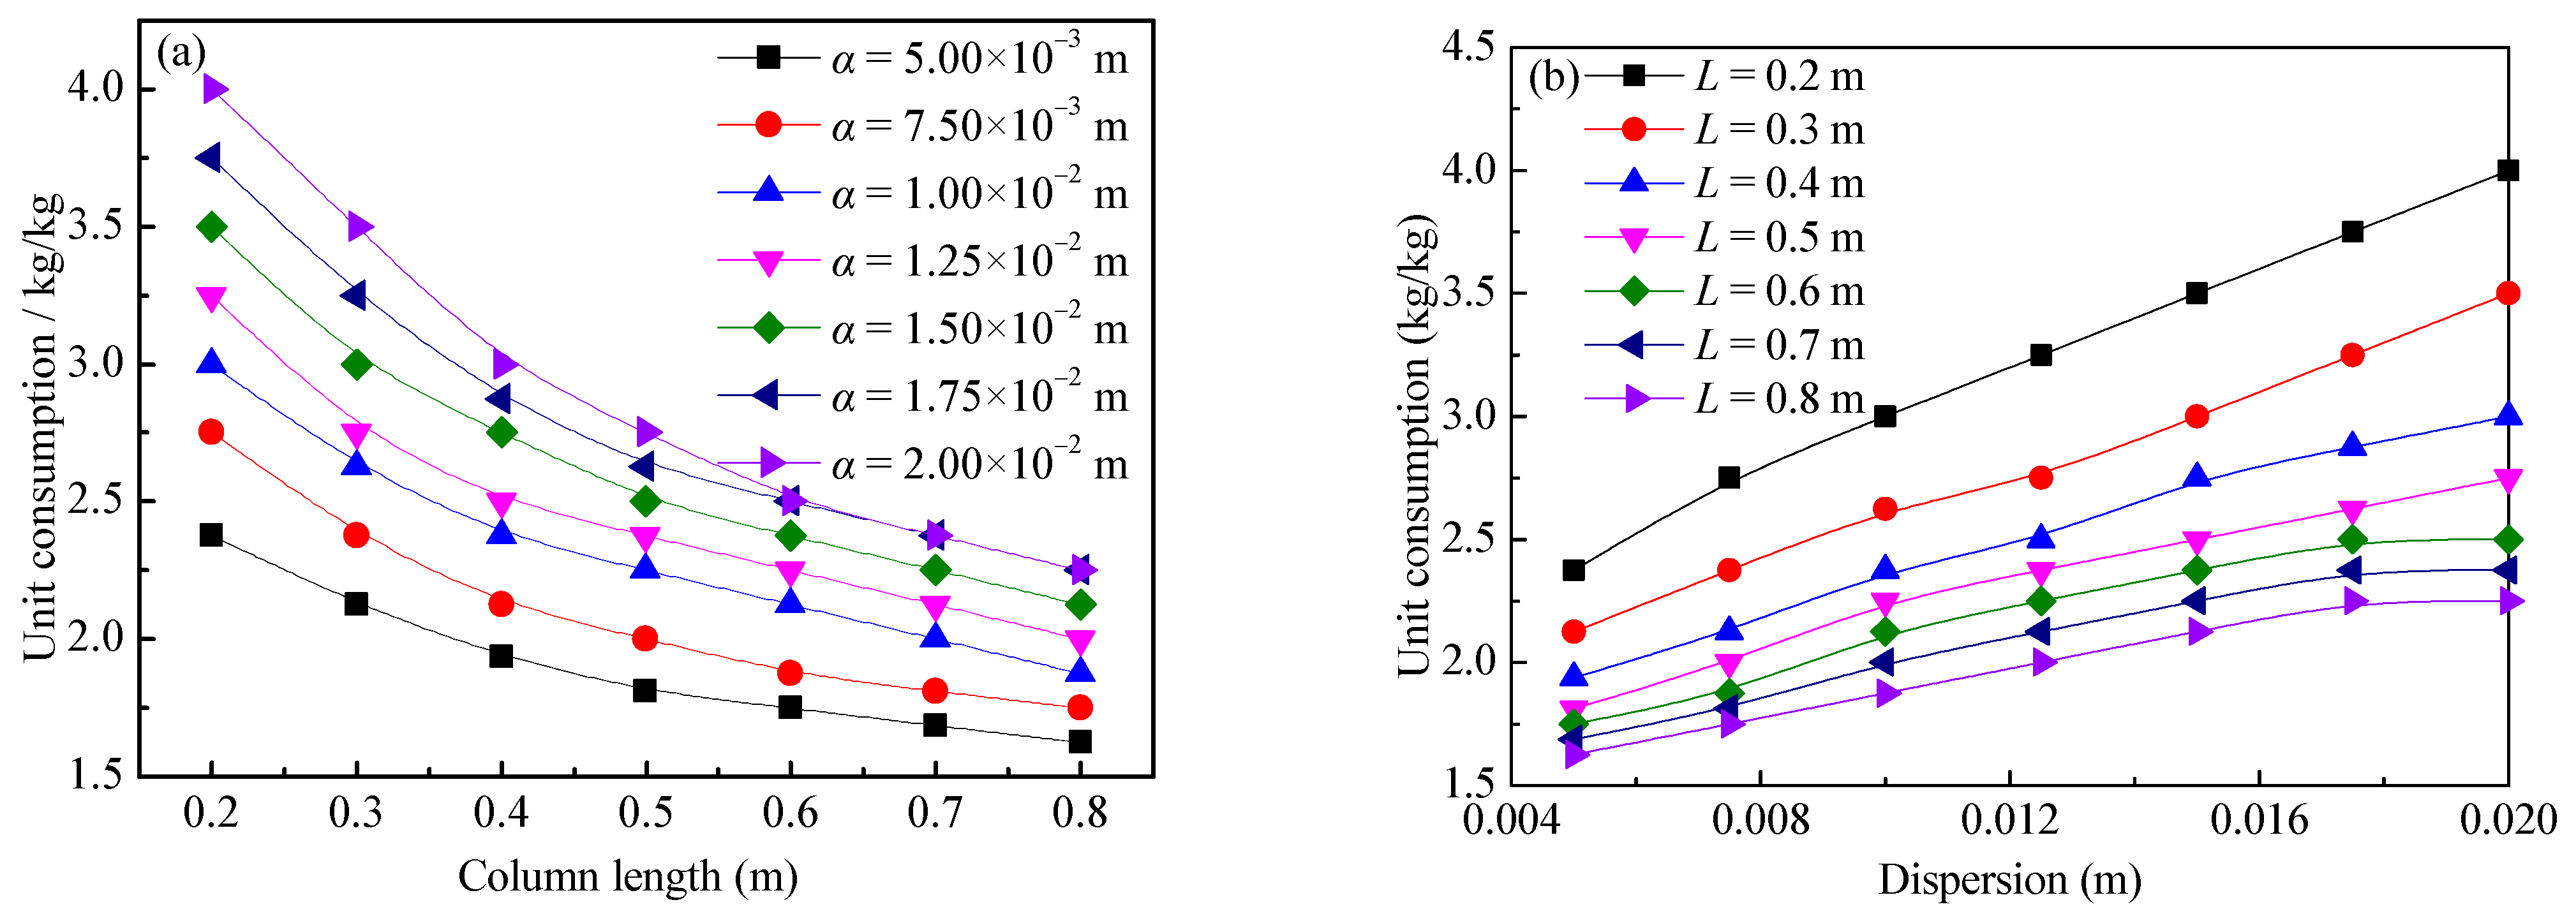
4.6. Optimization of Leaching Agent Consumption

The injected leaching agent concentration c NS a , the target rare-earth leaching rate ηaim, and the tolerance σ are given. Assuming that m inj 0 (the amount of leaching agent) is A L ρ s q RE 0 / ( 1 + e ) , Tinj (the total time during which the leaching agent was injected) is found to be m inj 0 / ( u A θ 0 c NS a ) . Then, upon injecting the water, the boundary conditions of the upper boundary are shown in Equation (26). The method proposed in Section 3.3 was then used to calculate the breakthrough curve of rare-earth ions, and η0 (the rare-earth leaching rate) was calculated by Equation (27).
{ c A ( 0 t T inj , z = 0 ) = c A a c A ( t > T inj , z = 0 ) = 0
η = 0 z [ c RE ( t = 0 , z ) c RE ( t = T , z ) ] d z 0 z c RE ( t = 0 , z ) d z × 100 %
(1)
When η0 (the rare-earth leaching rate) ∈ [ηaimσ, ηaim + σ], the calculation was completed if the result of the preset leaching agent consumption was calculated to be m inj 0 . When the rare-earth leaching rate η < ηaimσ, the preset leaching agent consumption was updated to m inj 1 = 2 m inj 0 . When the rare-earth leaching rate η > ηaim + σ, the preset leaching agent consumption was updated to be m inj 1 = m inj 0 / 2 ; by using m inj 1 as the amount of leaching agent, the rare-earth leaching rate η1 was then recalculated.
(2)
When the rare-earth leaching rate (η0ηaim)(η1ηaim) < 0, the dichotomy method was used to update the preset leaching agent consumption, otherwise, step (1) was repeated. The abovementioned process was repeated until the rare-earth leaching rate η ∈ [ηaimσ, ηaim + σ]; the leaching agent consumption was then determined.
The rare-earth grade of the ore pillar is 1.25 g/kg, the concentration of the leaching agent is 20.0 g/L, the ion exchange selection coefficient is 3.21 × 10⁻² (L/kg)2.19, the inner diameter of the ore pillar is 0.075 m, the void ratio was set as 1.0, the target leaching rate was set to 90.0%, and the tolerance is 1.0%. When the column length was 0.2–0.8 m and the dispersion was 0.005–0.02 m, the leaching agent consumption was calculated by using the aforementioned method. The change rule of leaching agent unit consumption according to the column length and dispersion was analyzed to establish a corresponding mathematical relationship.
The calculation results of the leaching agent unit consumption changing according to the column length and dispersion are shown in Figure 10. It can be seen from Figure 10 that the unit consumption has a negative correlation with the column length, and it has a positive correlation with the dispersion. This is because the greater the dispersion is, the more obvious the dispersion effect of ions in the ore body is, the lower the cation concentration of the leaching agent is [34,35], and the lower the leaching efficiency is. Therefore, the greater the dispersion is, more leaching agent is needed to leach a unit mass of rare-earth ions.
By taking α/L as the abscissa and κ as the ordinate, the data in Figure 10 were converted into a data graph, as shown in Figure 11. The data in Figure 11 were fitted with a quadratic function, and the results have also been plotted in Figure 11, with a coefficient of determination of 0.992. It can be seen that the relationship of the variation of the leaching agent unit consumption with the dispersion and column length can be quantified by Equation (28).
κ = 135.30 ( α L ) 2 + 38.32 α L + 1.46

5. Conclusions

(1)
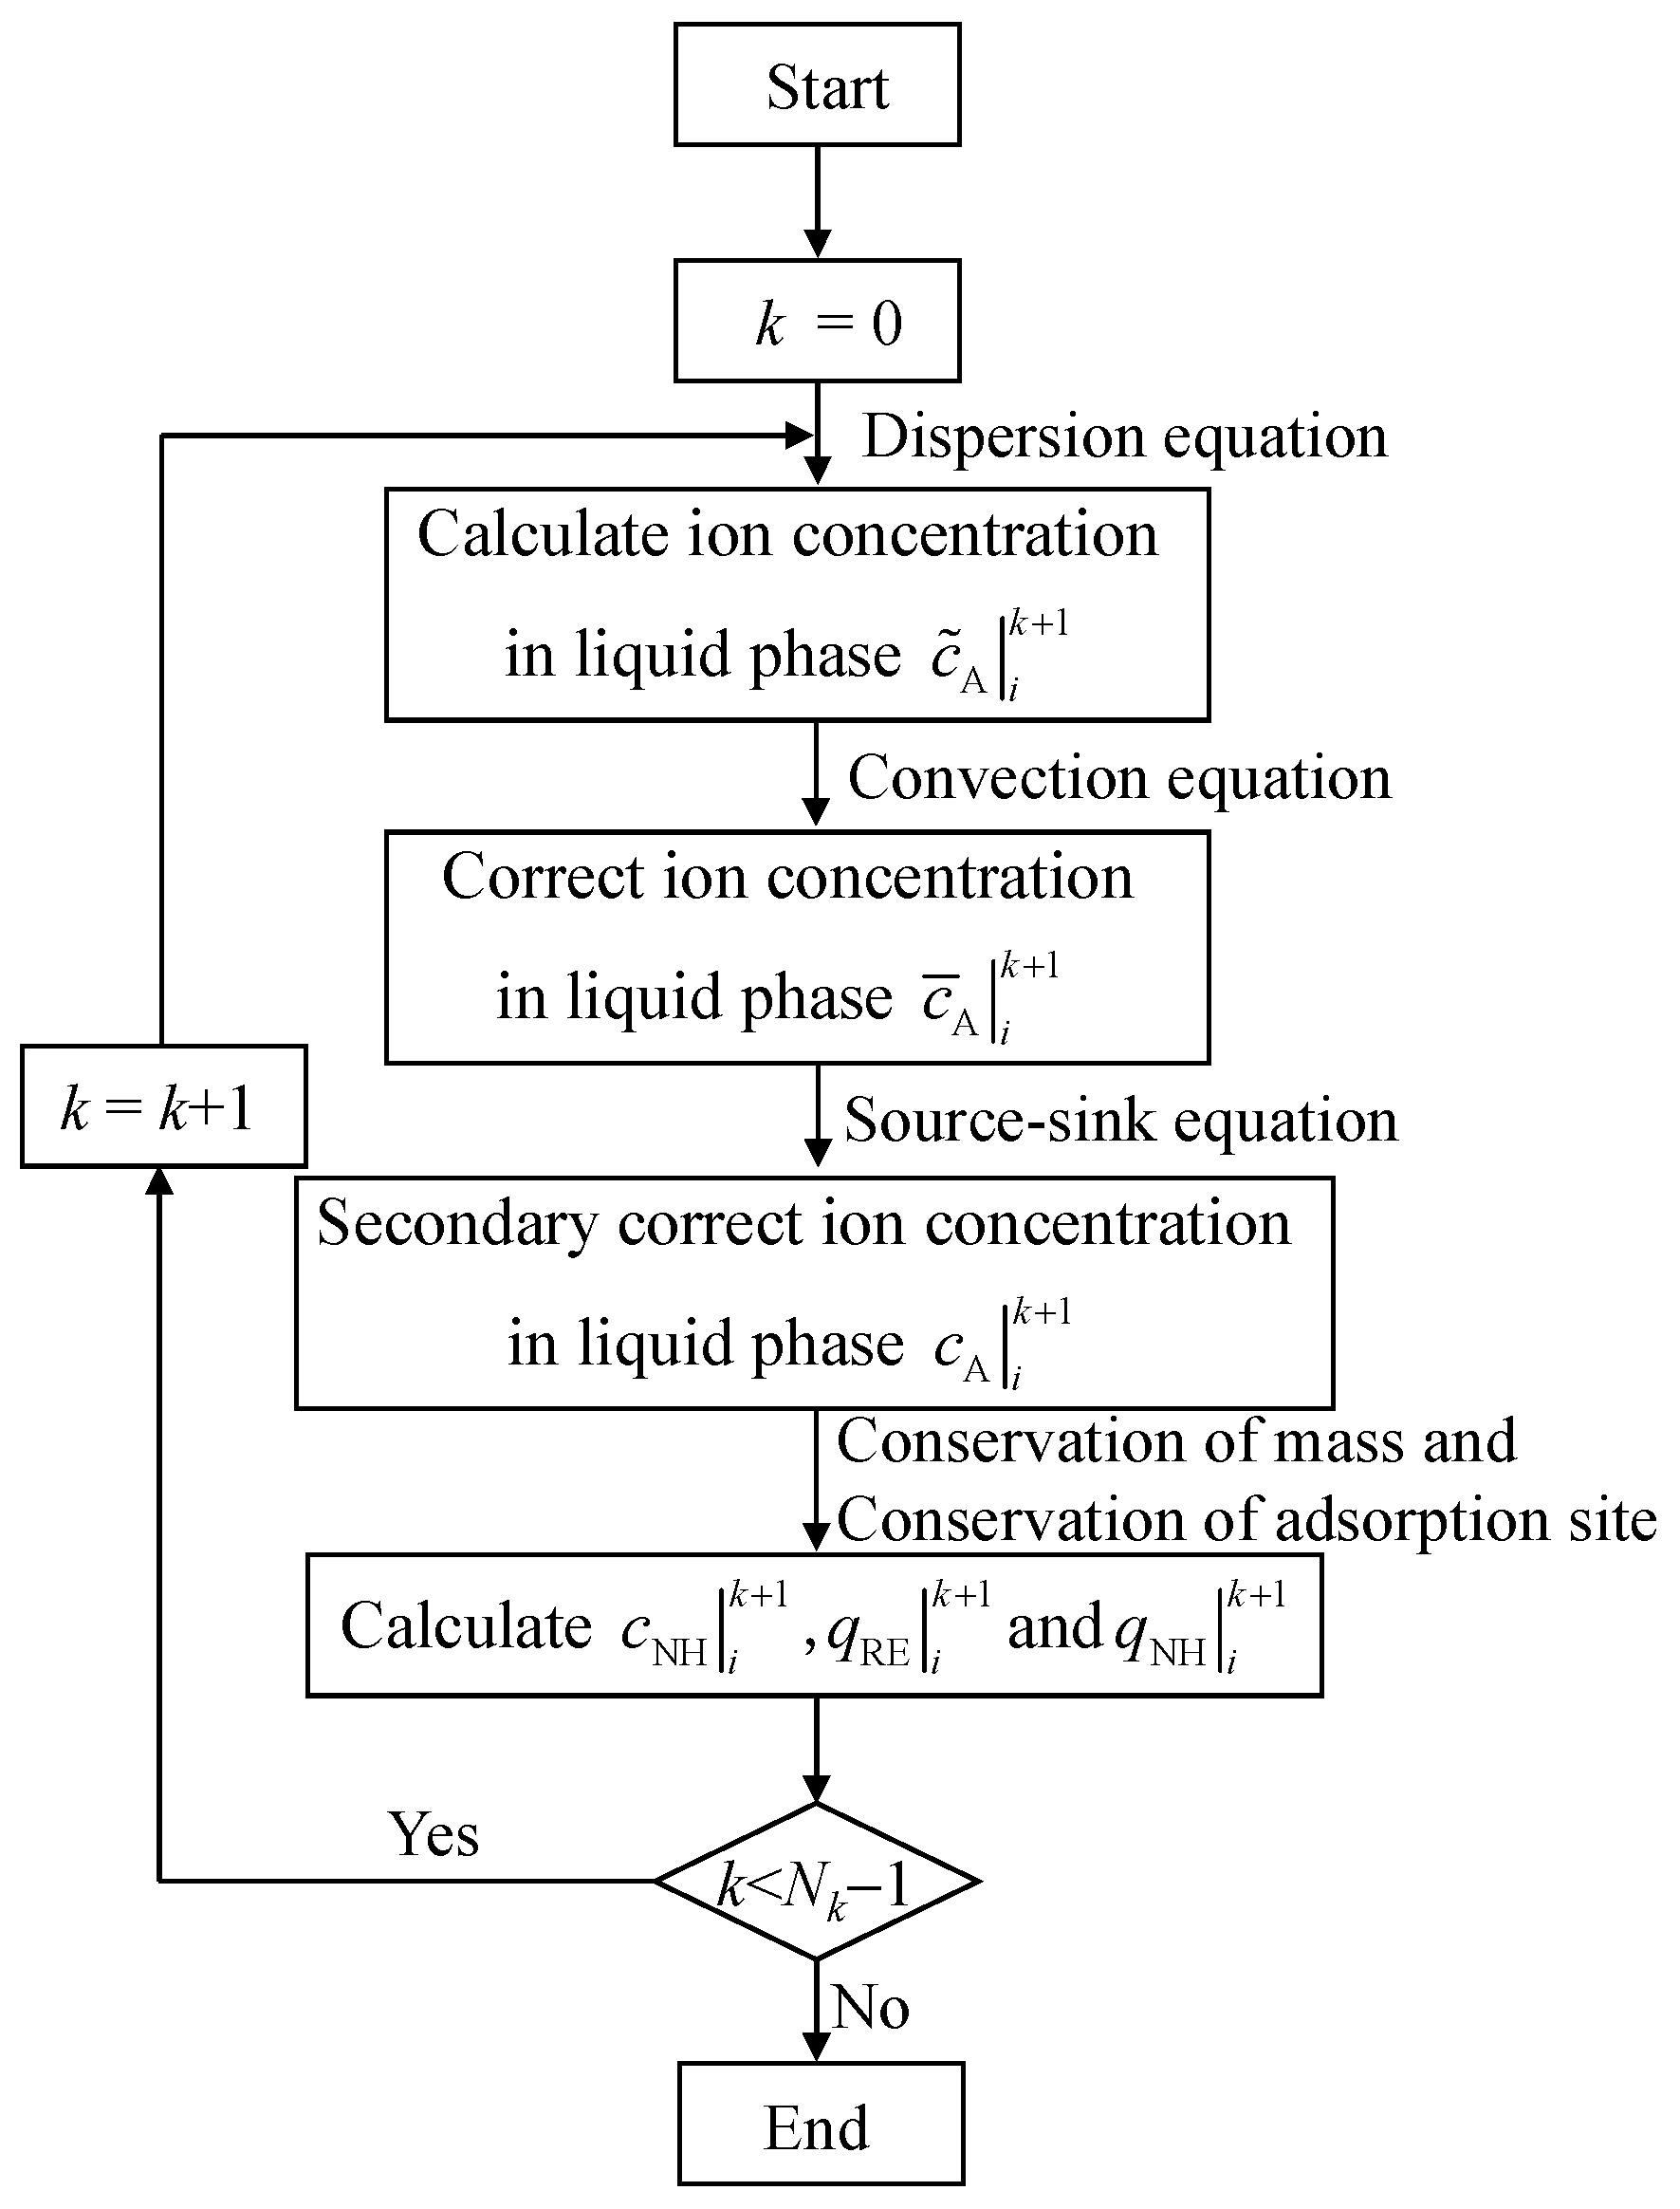
In this paper, a decoupling method is proposed to solve the solute transport equation. In detail, the solute transport is decoupled into the dispersion, convection, and source-sink equations. The dispersion equation is used to calculate the distribution of the ion concentration, and the convection equation and the source-sink equation are then used to correct the ion concentration.
(2)
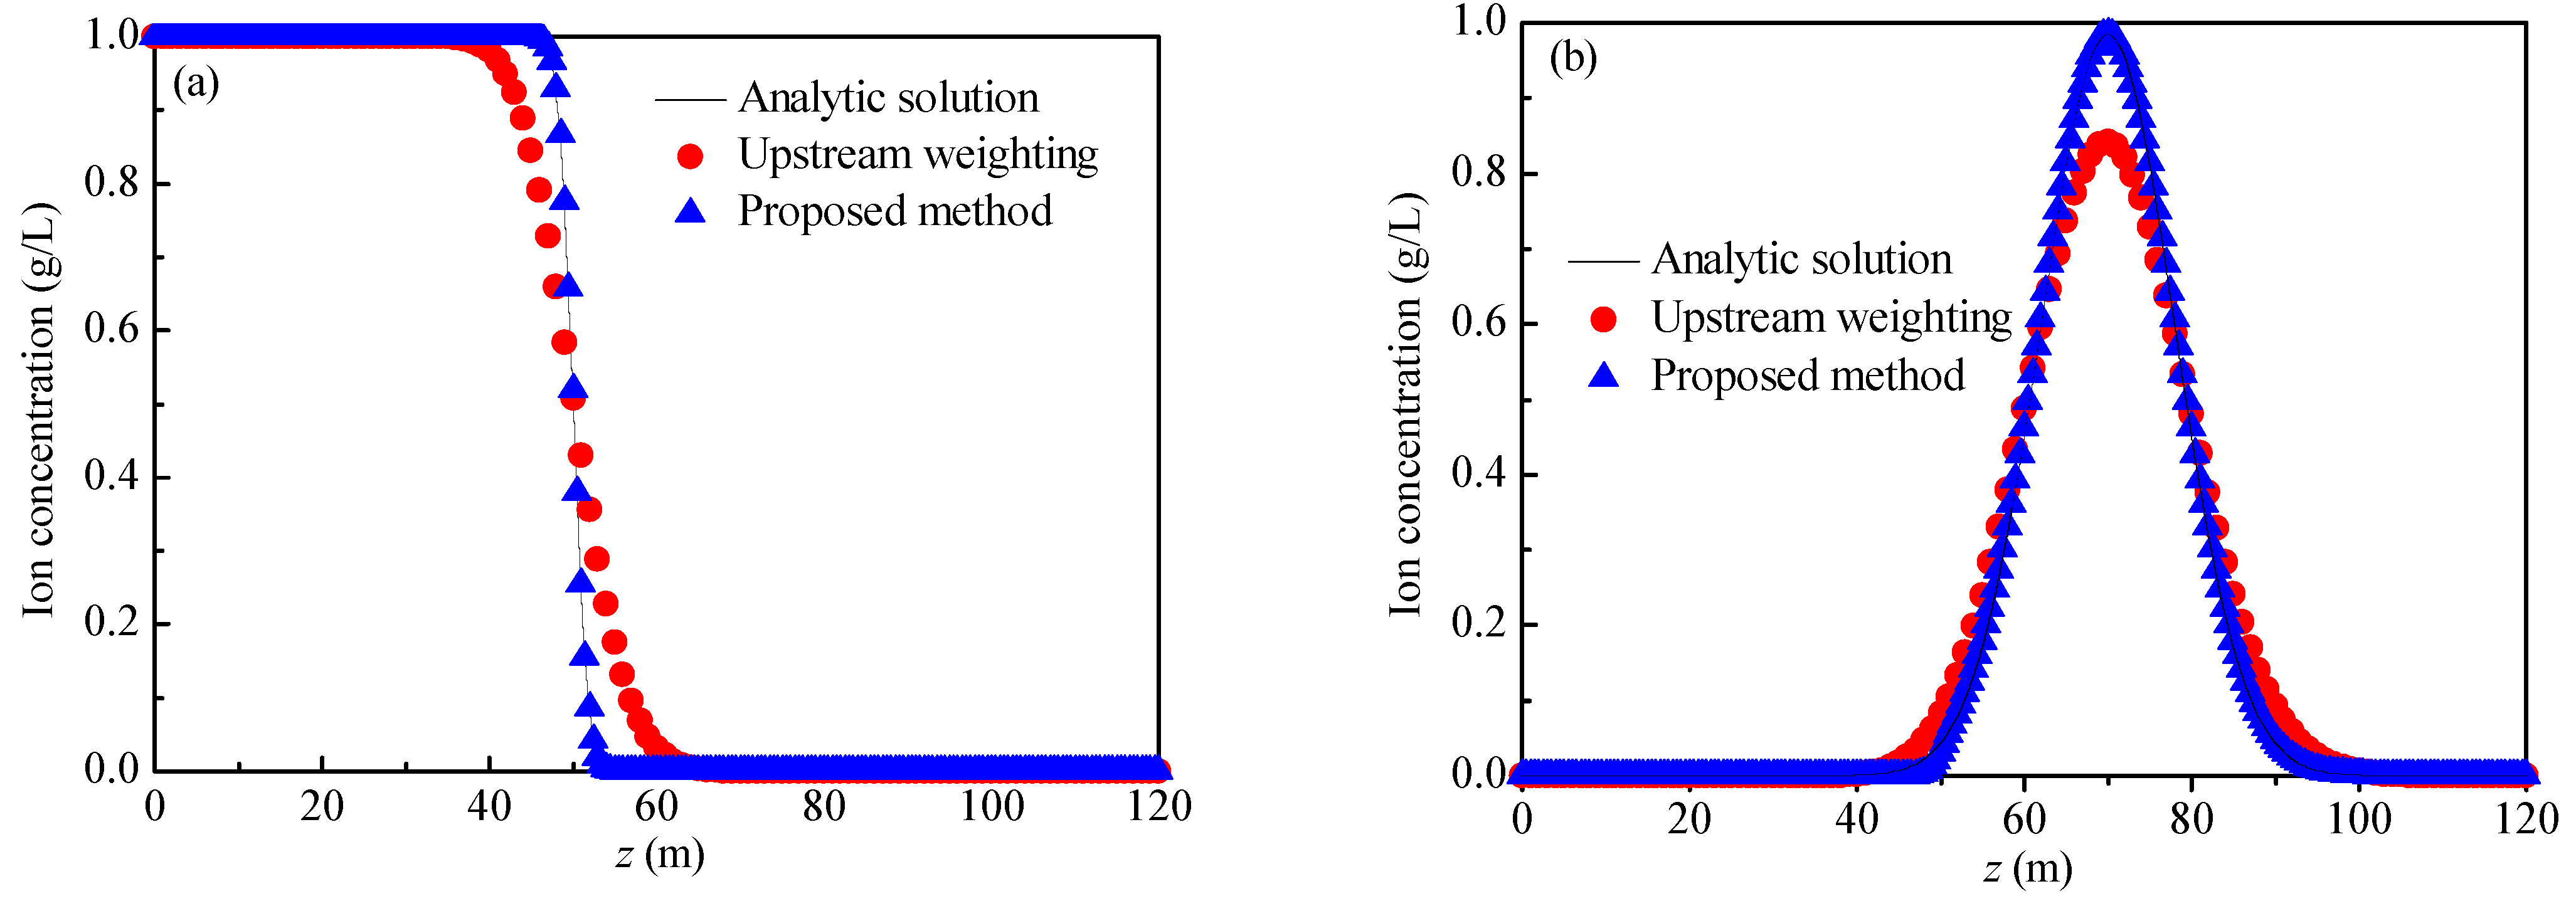
In comparison to the analytical solutions of the two convection-dominated problems, the upstream weighting method can solve the oscillation problem, but this still incurs a large dispersion error. The method proposed in this paper is in good agreement with the analytical solution, which shows that the proposed method can solve both the oscillation and dispersion problems.
(3)
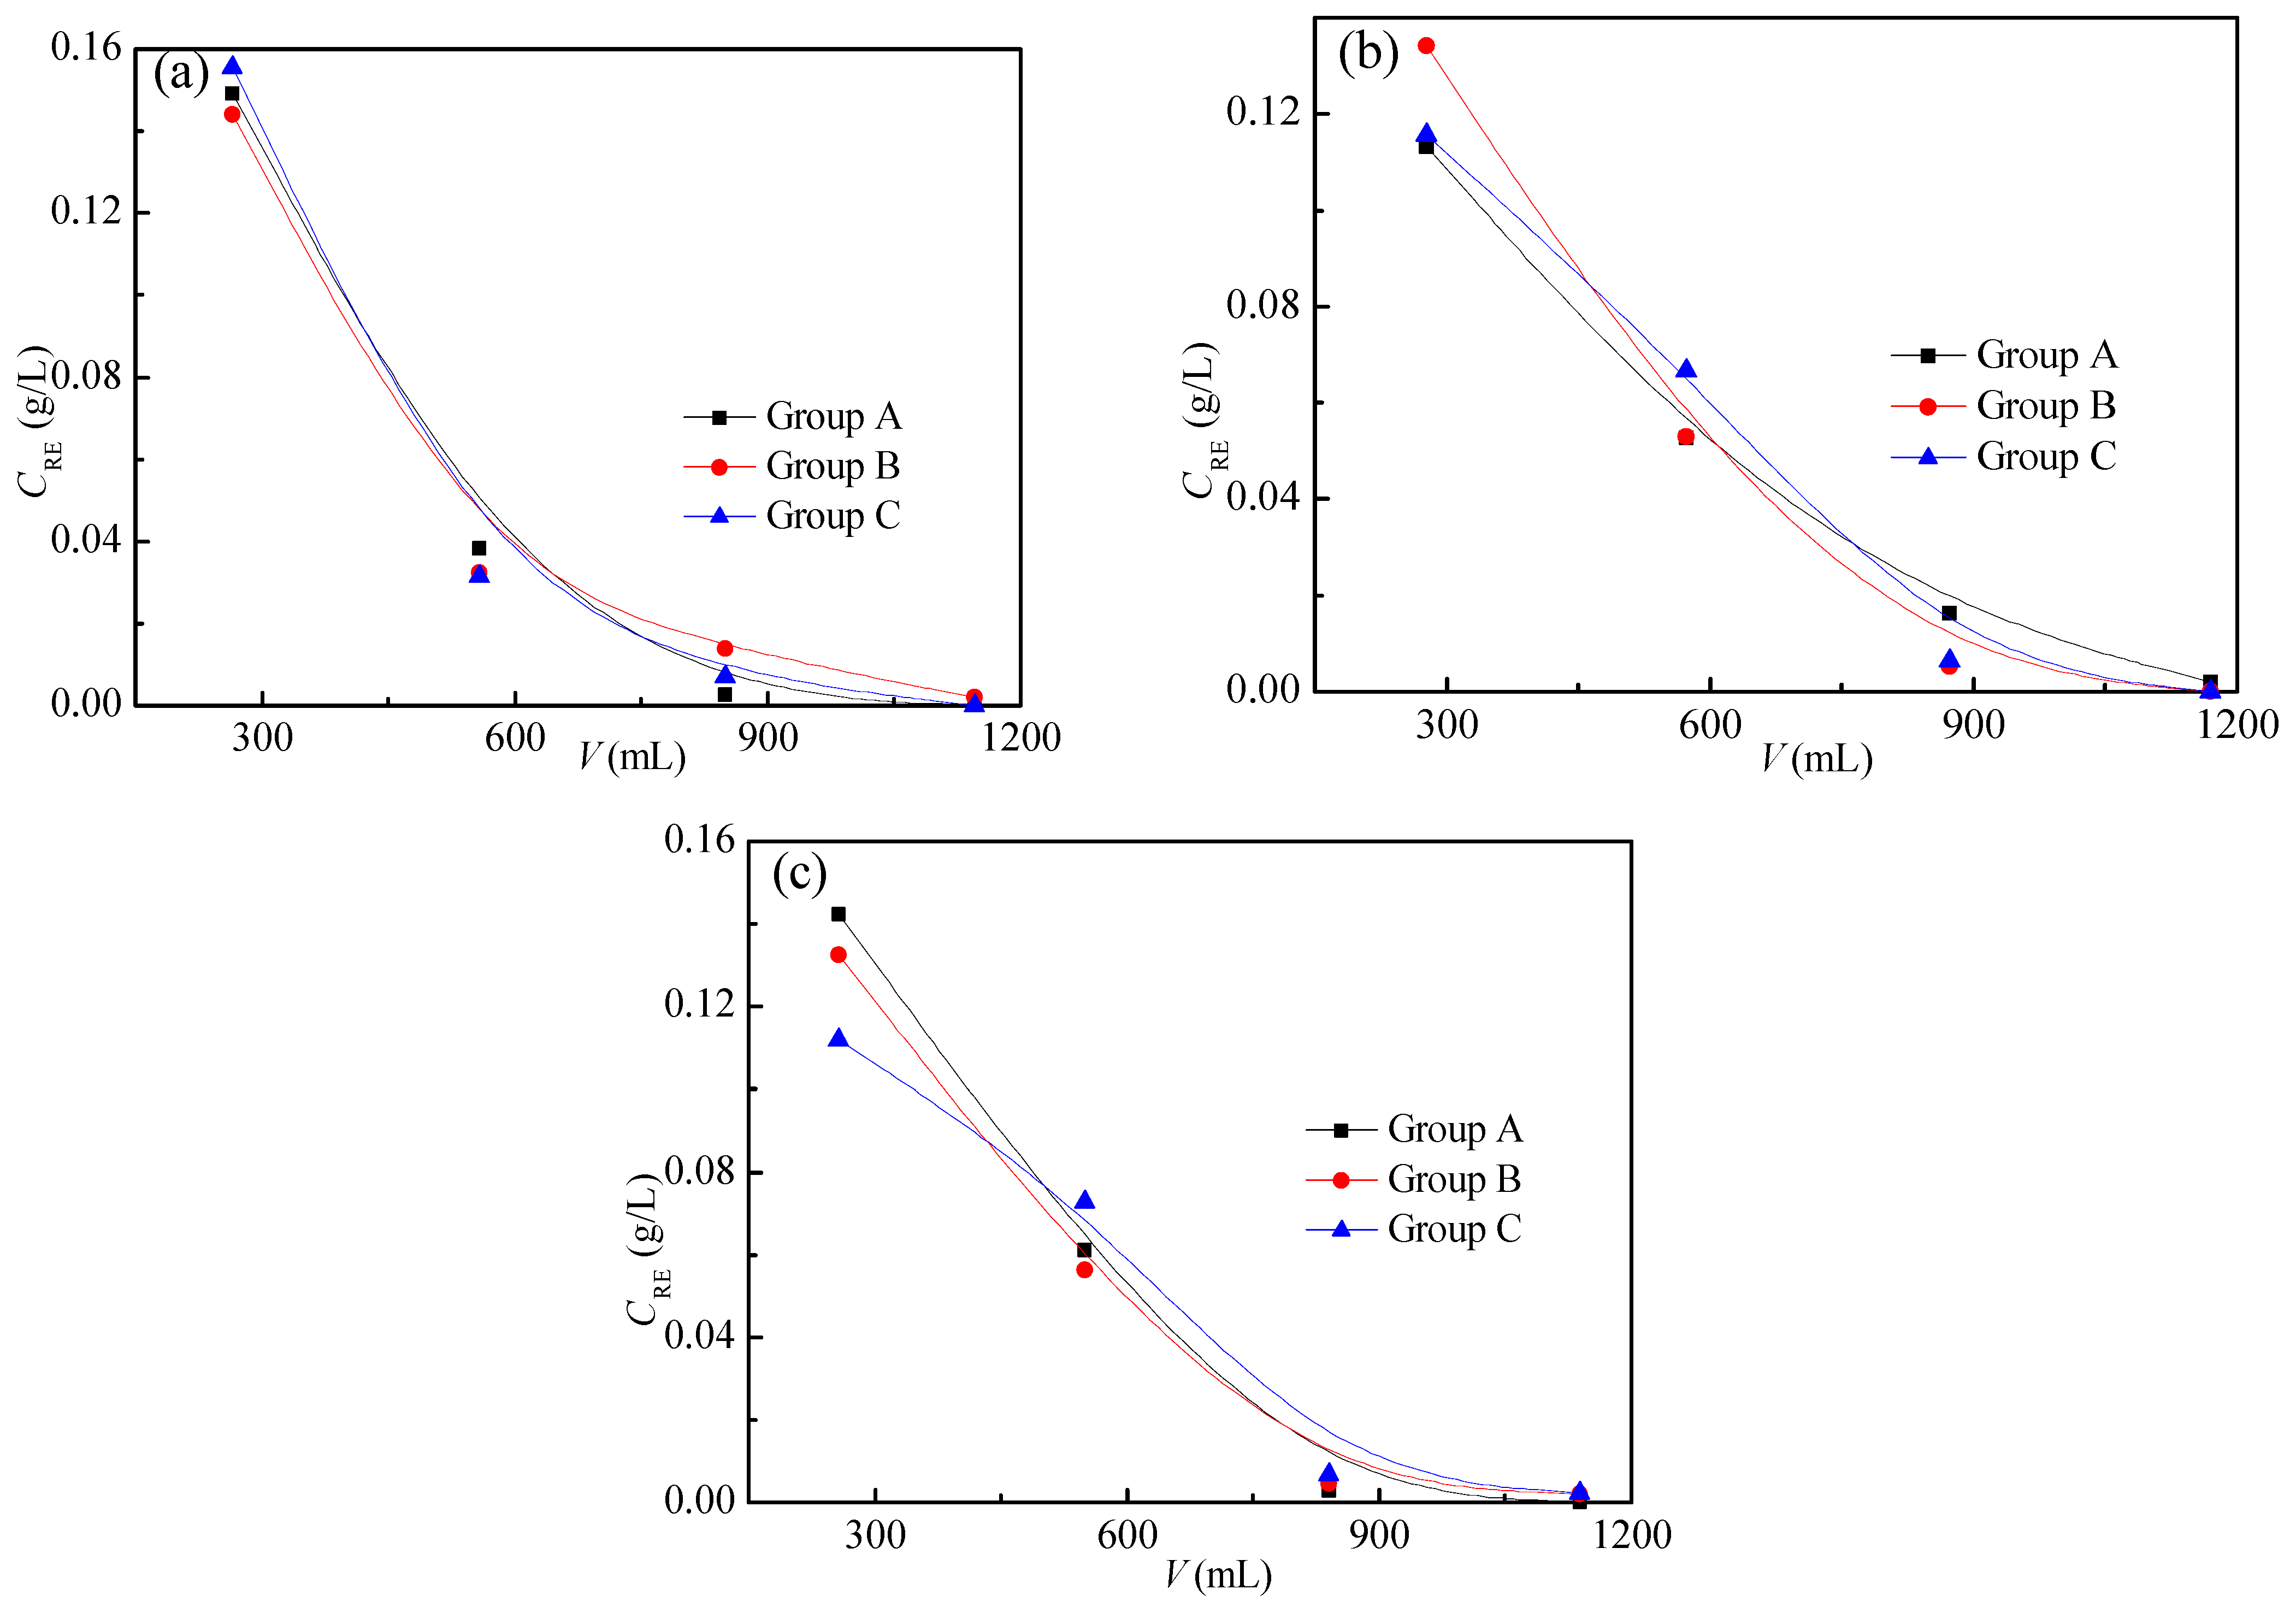
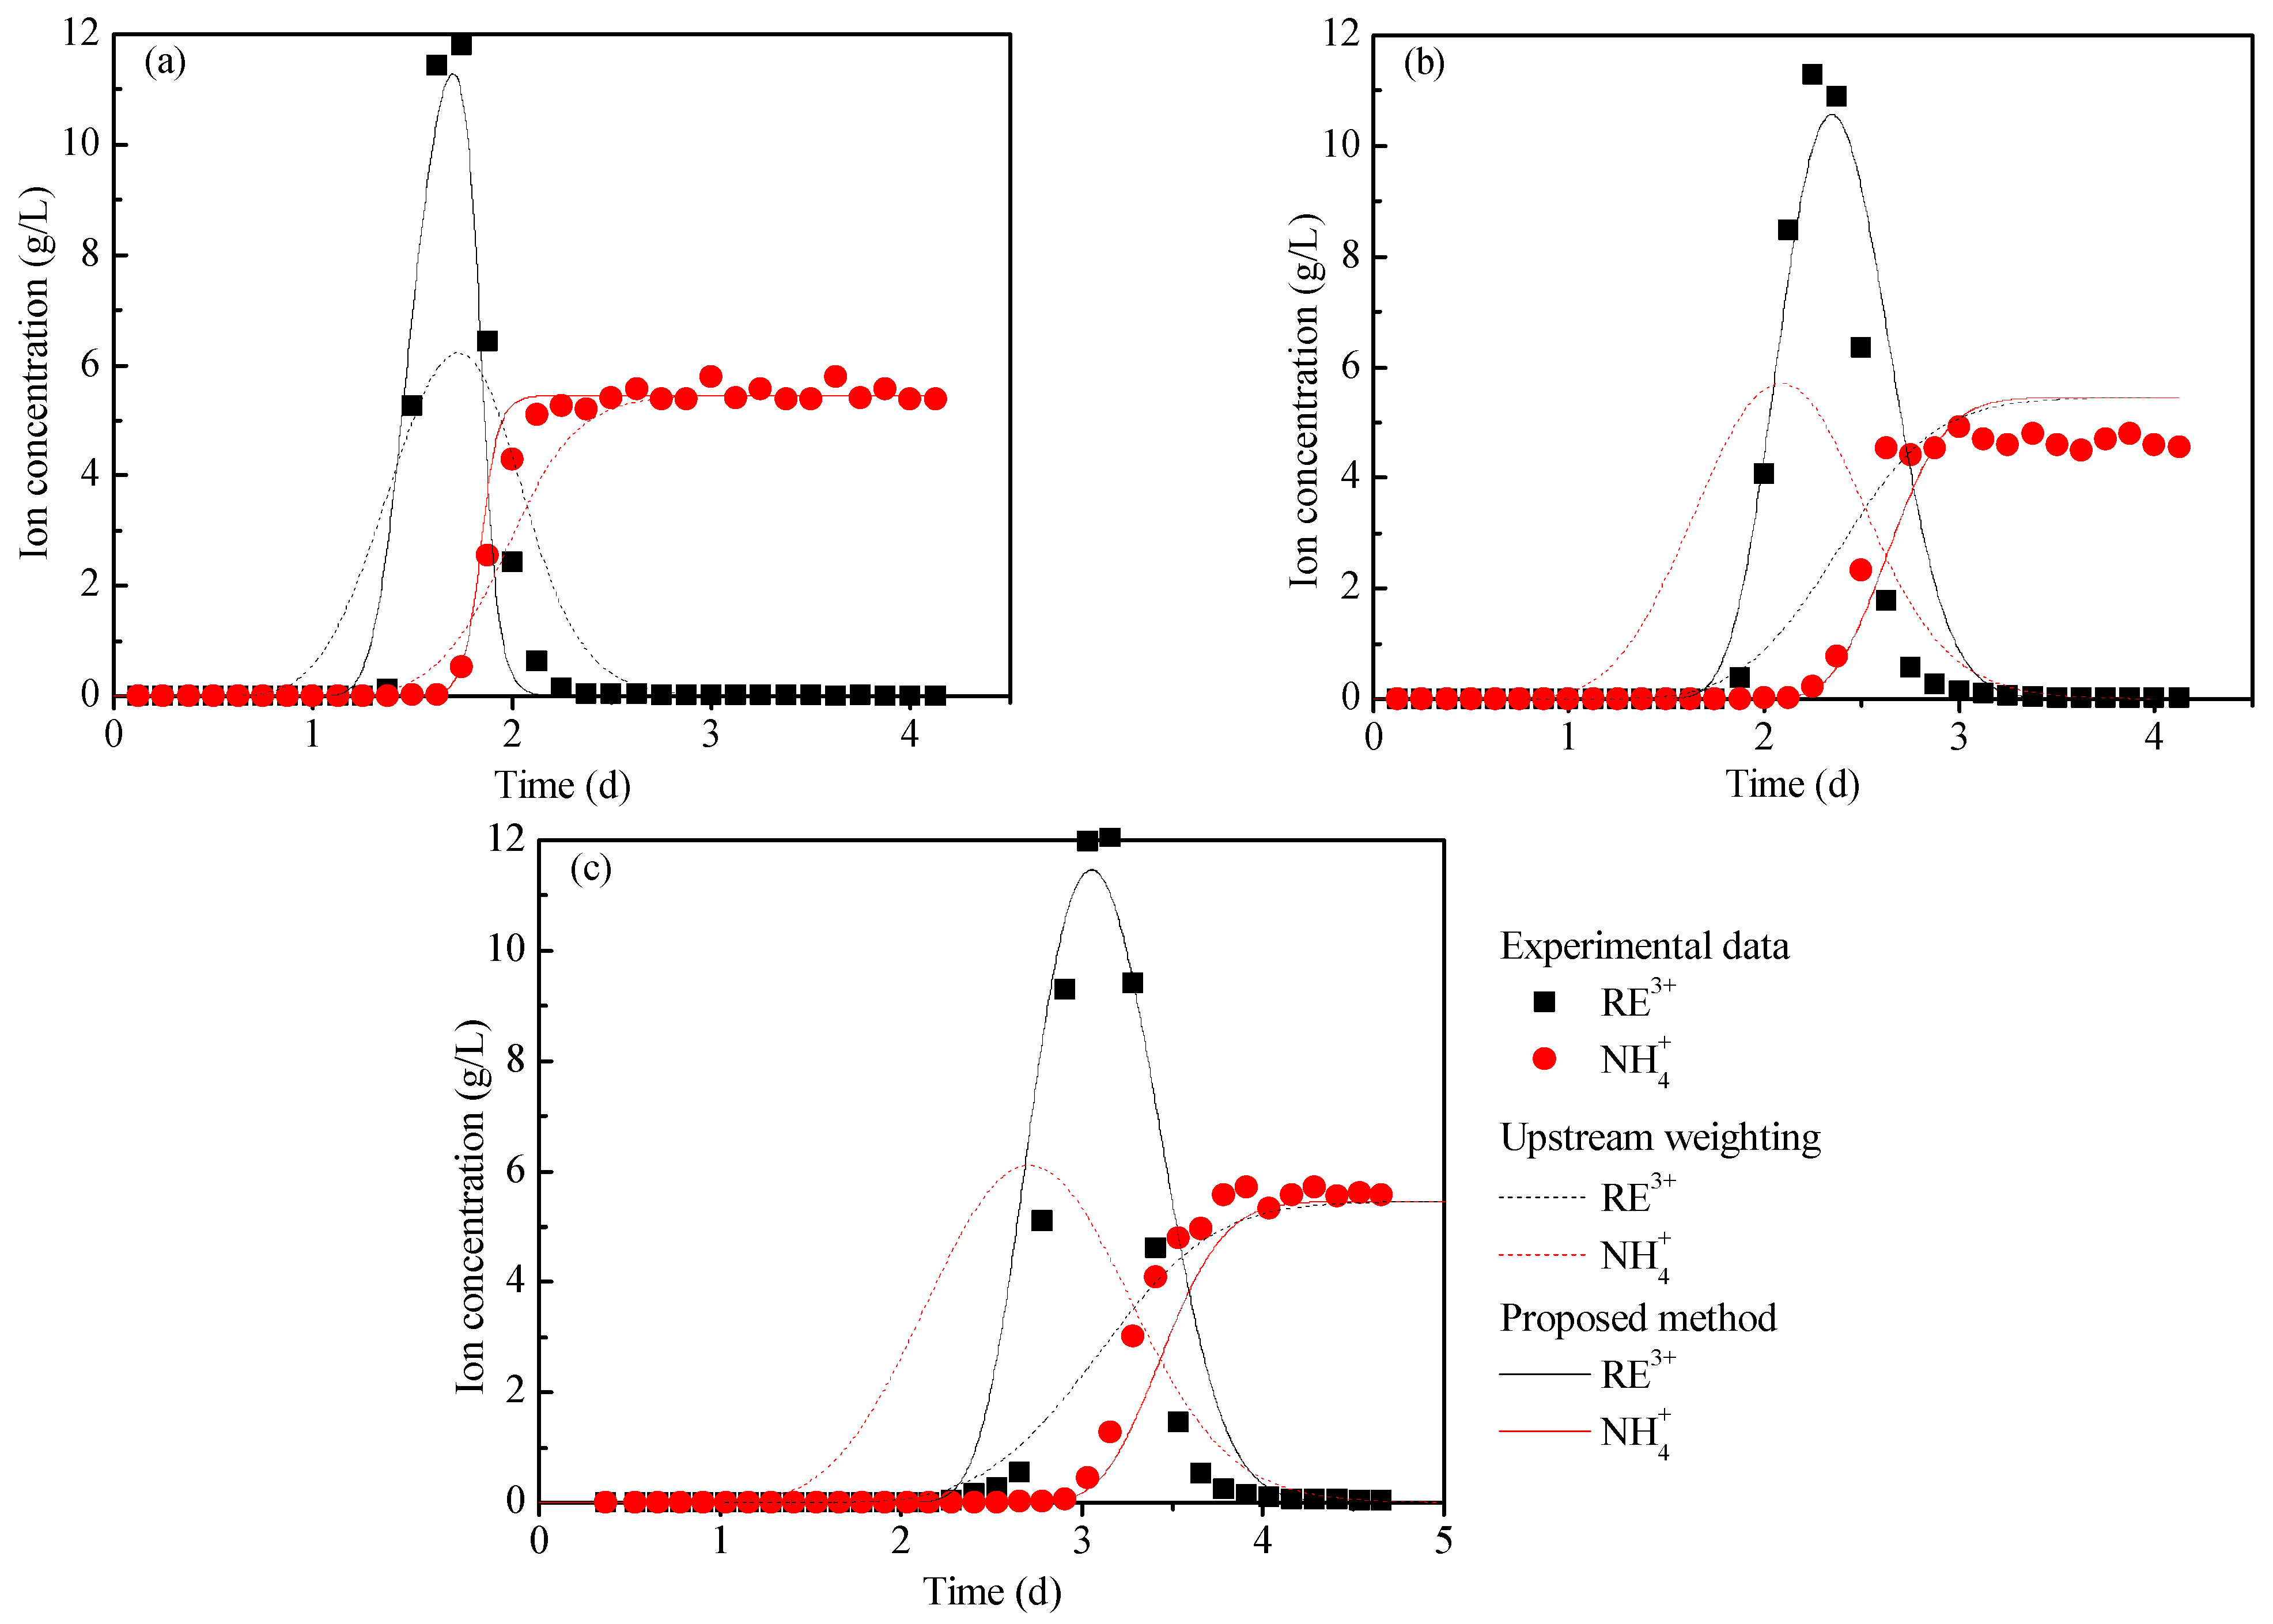
By comparing the simulation results of the leaching process through the proposed method with the experimental data, it can be found that the coefficients of determination of the breakthrough curves of rare-earth ions and ammonium ions are greater than 0.850 and 0.900, respectively, and the peak concentration error of rare-earth ions is less than 7.00%, indicating that the proposed method can simulate the leaching process of IATREOs well.
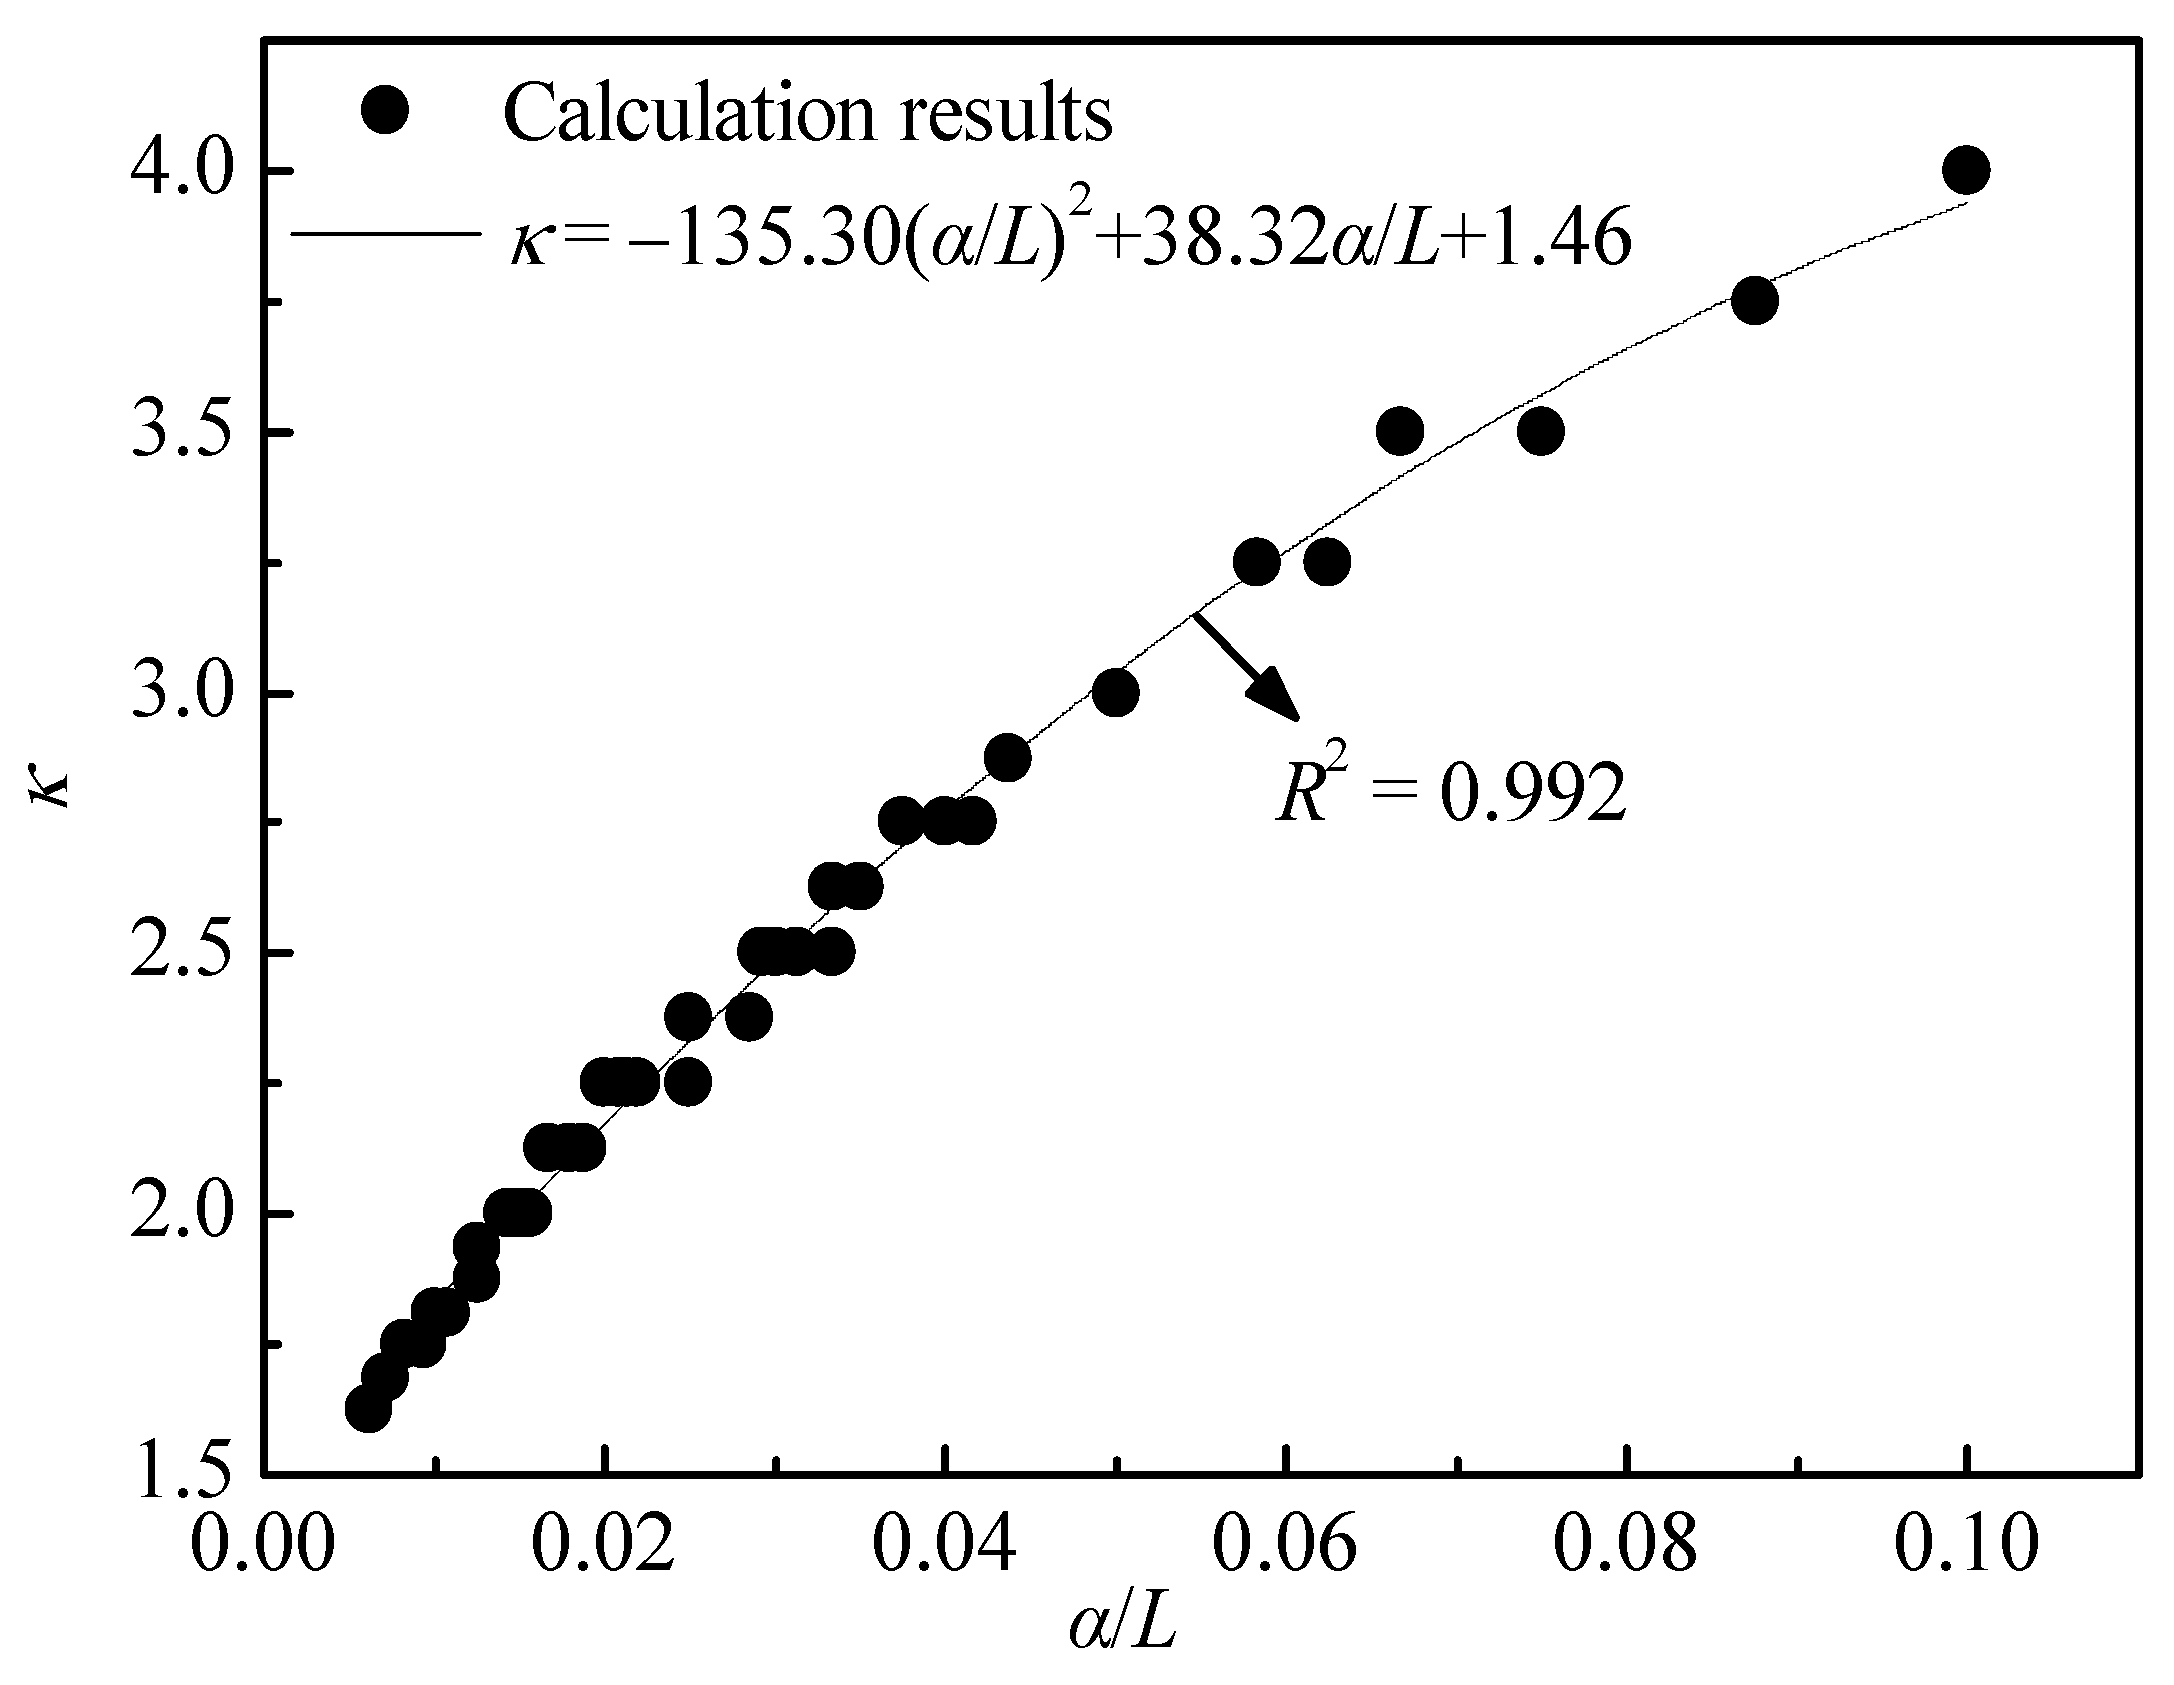
(4)
The leaching agent unit consumption κ is inversely proportional to the column length L, and it has a positive correlation with the dispersion α. The mathematical relationship between the three is κ = −135.30(α/L)2 + 38.32α/L + 1.46.

Author Contributions

Y.H.: Data curation, Formal analysis, Writing—Original draft; P.L.: Project administration, Writing—Review and editing, Funding acquisition; G.W.: Resources; S.L.: Funding acquisition. All authors have read and agreed to the published version of the manuscript.

Funding

The National Natural Science Foundation of China (No. 51874147), the Natural Science Foundation of Jiangxi Province, China (No. 20212BAB211012), the Educational Department of Jiangxi Province, China (No. GJJ200870) and Jiangxi University of Science and Technology (No. 205200100526).

Data Availability Statement

The data presented in this study are available on request from the corresponding author.

Conflicts of Interest

The authors declare no conflict of interests.

References

  1. Guo, Z.Q.; Zhou, J.R.; Zhou, K.F.; Jin, J.F.; Wang, X.J.; Zhao, K. Soil−water characteristics of weathered crust elution-deposited rare earth ores. Trans. Nonferrous Met. Soc. 2021, 31, 1452–1464. [Google Scholar] [CrossRef]
  2. Xiao, Y.F.; Huang, X.W.; Feng, Z.Y.; Dong, J.S.; Huang, L.; Long, Z.Q. Progress in the green extraction technology for rare earth from ion-adsorption type rare earths ore. Chin. Rare Earths 2015, 36, 109–115. [Google Scholar]
  3. Chai, X.W.; Li, G.Q.; Zhang, Z.Y.; Chi, R.A.; Chen, Z. Leaching Kinetics of Weathered Crust Elution-Deposited Rare Earth Ore with Compound Ammonium Carboxylate. Minerals 2020, 10, 516. [Google Scholar] [CrossRef]
  4. Moldoveanu, G.A.; Papangelakis, V.G. An overview of rare-earth recovery by ion-exchange leaching from ion-adsorption clays of various origins. Mineral. Mag. 2016, 80, 63–76. [Google Scholar] [CrossRef] [Green Version]
  5. Qiu, S.; Yan, H.S.; Hong, B.G.; Long, Q.B.; Xiao, J.; Li, F.J.; Tong, L.C.; Zhou, X.W.; Qiu, T.S. Desorption of REEs from Halloysite and Illite: A Link to the Exploitation of Ion-Adsorption RE Ore Based on Clay Species. Minerals 2022, 12, 1003. [Google Scholar] [CrossRef]
  6. Qiu, T.S.; Zhu, D.M.; Wu, C.Y.; Wang, L.M. Lattice Boltzmann model for simulation on leaching process of weathered elution-deposited rare earth ore. J. Rare Earths 2017, 35, 1014–1021. [Google Scholar] [CrossRef]
  7. Li, Y.X. Ion Adsorption Rare Earth Resources and Their Green Extraction; Chemical Industry Press: Beijing, China, 2014. [Google Scholar]
  8. Chi, R.A.; Tian, J. Chemical and Metallury Process of Weathered Crust Rare Earth Ore; Chemical Industry Press: Beijing, China, 2006. [Google Scholar]
  9. Wu, A.X.; Yin, S.H.; Wang, H.J.; Su, Y.D. Solute transport mechanism and model of dump leaching. J. Cent. South Univ. (Sci. Technol.) 2006, 37, 385–389. [Google Scholar]
  10. Guo, Z.Q.; Zhao, K.; Jin, J.F.; Zhu, Z.C.; Li, G. Solute transport mechanism of ion-adsorption type rare earth in-situ leaching mining. J. Chin. Soc. Rare Earths 2019, 37, 121–128. [Google Scholar]
  11. Long, P.; Wang, G.S.; Tian, J.; Hu, S.L.; Luo, S.H. Simulation of one-dimensional column leaching of weathered crust elution-deposited rare earth ore. Trans. Nonferrous Met. Soc. 2019, 29, 625–633. [Google Scholar] [CrossRef]
  12. Liu, Q.S.; Xiao, H.; Tan, C.L.; Yu, X.Y.; Wang, D.L.; Qiu, T.S. Simulation research on multi-field coupling in leaching process of ionic rare earth ore based on COMSOL. J. Chin. Soc. Rare Earths 2022, 40, 880–892. [Google Scholar]
  13. Wang, H.T. Dynamics of Fluid Flow and Contaminant Transport in Porous Media; Higher Education Press: Beijing, China, 2008. [Google Scholar]
  14. Navnit, J.; Shikha, V. Method of approximations for the convection-dominated anomalous diffusion equation in a rectangular plate using high-resolution compact discretization. MethodsX 2022, 9, 101853. [Google Scholar]
  15. Hossain, M.A.; Yonge, D.R. Simulating advective-dispersive transport in groundwater: An accurate finite difference model. Appl. Math. Comput. 1999, 105, 221–230. [Google Scholar] [CrossRef]
  16. Moldrup, P.; Yamaguchi, T.; Rolston, D.E.; Vestergaard, K.; Hansen, J.A. Removing numerically induced dispersion from finite difference models for solute and water transport in unsaturated soils. Soil Sci. 1994, 157, 153–161. [Google Scholar] [CrossRef]
  17. Chen, Y.; Falconer, R.A. Advection-diffusion modelling using the modified QUICK scheme. Int. J. Numer. Meth. Fluids 1992, 15, 1171–1196. [Google Scholar] [CrossRef]
  18. Chen, J.M.; Hu, J.W. Reviews on numerical method for solving solute transport problems in the saturated porous media. Hydrog. Eng. Geol. 2003, 2, 99–106. [Google Scholar]
  19. Wang, Q.M.; Zhou, Z.J. SUPG-Stabilized Virtual Element Method for Optimal Control Problem Governed by a Convection Dominated Diffusion Equation. Entropy 2021, 23, 723. [Google Scholar] [CrossRef] [PubMed]
  20. Zhang, J.J.; Lin, G.; Li, W.X.; Wu, L.S.; Zeng, L.Z. An iterative local updating ensemble smoother for high-dimensional inverse modeling with multimodal distributions. Water Resour. Res. 2018, 54, 1716–1733. [Google Scholar] [CrossRef]
  21. Tabata, M.; Uchiumi, S. An exactly computable Lagrange–Galerkin scheme for the Navier–Stokes equations and its error estimates. Math. Comput. 2017, 87, 39–67. [Google Scholar] [CrossRef]
  22. Douglas, J.; Russell, T.F. Numerical Methods for Convection-Dominated Diffusion Problems Based on Combining the Method of Characteristics with Finite Element or Finite Difference Procedures. SIAM J. Numer. Anal. 1982, 19, 871–885. [Google Scholar] [CrossRef]
  23. Leonard, B.P.; Lock, A.P.; MacVean, M.K. Conservative Explicit Unrestricted-Time-Step Multidimensional Constancy-Preserving Advection Schemes. J. Atmos. Sci. 1996, 124, 2588–2606. [Google Scholar] [CrossRef]
  24. Zhou, F.; Hang, S.H.; Feng, J.; Deng, D.H.; Wang, Z.W.; Liu, Q. Study on distribution law of rare earth ions and aluminum ions in ammonium salt leaching process of weathered crust elution-deposited rare earth ores. Chin. J. Nonferr. Met. 2022, 32, 195–205. [Google Scholar]
  25. Long, P.; Wang, G.S.; Zhang, C.; Huang, Y.; Luo, S.H. A two-parameter model for ion exchange process of ion-adsorption type rare earth ores. J. Rare Earths 2020, 38, 1251–1256. [Google Scholar] [CrossRef]
  26. Ministry of Environmental Protection of the People’s Republic of China. Water Quality-Determination of Ammonia Nitrogen-Nessler’s Reagent Spectrophotometry; HJ 535; Ministry of Environmental Protection of the People’s Republic of China: Beijing, China, 2009.
  27. Aviation Industry Corporation of China. Methods for Chemical Analysis of Metal Heat Treatment Salt Bath; HB 7064.3; Aviation Industry Corporation of China: Beijing, China, 1994. [Google Scholar]
  28. Fan, B.; Zhao, L.S.; Feng, Z.Y.; Liu, D.P.; Yin, W.Q.; Long, Z.Q.; Huang, X.W. Leaching behaviors of calcium and magnesium in ion-adsorption rare earth tailings with magnesium sulfate. Trans. Nonferrous Met. Soc. 2021, 31, 288–296. [Google Scholar] [CrossRef]
  29. Hu, S.L.; Cao, X.J.; Wang, G.S.; Long, P.; Zhou, X.Y. An ion exchange model for leaching process of weathered crust elution-deposited rare earth. Min. Metall. Eng. 2018, 38, 1–5. [Google Scholar]
  30. Chi, R.A.; Li, L.F.; Wang, D.Z. Studies of ion exchange equilibrium in clay minerals of adsorbed rare earth. J. Zhongnan Inst. Min. Metall. 1991, 22, 142–148. [Google Scholar]
  31. Long, P.; Wang, G.S.; Zhang, C.; Yang, Y.J.; Cao, X.J.; Shi, Z.B. Kinetics model for leaching of ion-adsorption type rare earth ores. J. Rare Earths 2020, 38, 1354–1360. [Google Scholar] [CrossRef]
  32. Li, F.H. Physical Chemistry of Soil; Chemical Industry Press: Beijing, China, 2006. [Google Scholar]
  33. Mei, Y.; Wu, J.C. New method for reducing the numerical error in solving the problem of contaminant transport in ground water. Adv. Water Sci. 2009, 20, 639–645. [Google Scholar]
  34. Swami, D.; Sharma, P.K.; Ojha, C.S.P. Simulation of experimental breakthrough curves using multiprocess non-equilibrium model for reactive solute transport in stratified porous media. Sadhana 2014, 39, 1425–1446. [Google Scholar] [CrossRef]
  35. Swami, D.; Sharma, A.; Sharma, P.K.; Shukla, D.P. Predicting suitability of different scale-dependent dispersivities for reactive solute transport through stratified porous media. J. Rock Mech. Geo-Tech. Eng. 2016, 8, 921–927. [Google Scholar] [CrossRef]
Figure 1. Schematic of the experiment.
Minerals 13 00089 g001
Figure 2. Schematic of the ion exchange equilibrium experiment.
Minerals 13 00089 g002
Figure 3. Schematic of the column leaching experiment.
Minerals 13 00089 g003
Figure 4. Flow chart of the decoupling method.
Minerals 13 00089 g004
Figure 5. Grades of ore samples: (a) M0, (b) M10, and (c) M15.
Minerals 13 00089 g005
Figure 6. Results of the ion exchange equilibrium experiment.
Minerals 13 00089 g006
Figure 7. Relative concentration breakthrough curves of sulfate ions.
Minerals 13 00089 g007
Figure 8. Breakthrough curves: (a) Example 1; (b) Example 2.
Minerals 13 00089 g008
Figure 9. Breakthrough curves of ammonium ions and rare-earth ions: (a) M0, (b) M10, and (c) M15.
Minerals 13 00089 g009
Figure 10. Relationship between the leaching agent unit consumption and dispersion and column length: (a) column length and (b) dispersion.
Minerals 13 00089 g010
Figure 11. Relationship between unit consumption (κ) and the ratio of dispersion to length (α/L).
Minerals 13 00089 g011
Table 1. Rare-earth partitioning of the ion-exchangeable phase of ore samples (wt%).
ComponentLa2O3CeO2Pr6O11Nd2O3Sm2O3
Cotent22.7315.545.0820.714.9
ComponentEu2O3Gd2O3Tb4O7Dy2O3Ho2O3
Cotent0.933.960.653.180.67
ComponentEr2O3Tm2O3Yb2O3Lu2O3Y2O3
Cotent1.860.331.550.2917.63
Table 2. u and D of M0, M10, and M15.
ParametersM0M10M15
t0.16 (d)1.341.942.48
t0.5 (d)1.512.102.72
t0.84 (d)1.632.342.90
u (m/d)1.32 × 10−19.52 × 10−17.35 × 10⁻¹
D (m2/d)1.27 × 10−40.84 × 10−40.45 × 10⁻⁴
Table 3. Parameter comparison between the test and calculation results.
Ore SamplesMethodPeak ConcentrationCoefficient of Determination
Value (g/L)Error (%)Rare-Earth IonAmmonium Ion
M0Experimental data11.81---
Upstream weighting6.2547.080.7260.977
Proposed method11.324.150.9300.989
M10Experimental data11.28---
Upstream weighting5.7249.290.5250.947
Proposed method10.586.210.8590.951
M15Experimental data12.06---
Upstream weighting6.1545.480.3140.935
Proposed method11.491.860.8810.969
Disclaimer/Publisher’s Note: The statements, opinions and data contained in all publications are solely those of the individual author(s) and contributor(s) and not of MDPI and/or the editor(s). MDPI and/or the editor(s) disclaim responsibility for any injury to people or property resulting from any ideas, methods, instructions or products referred to in the content.

