Article

Experimental Investigation of the Size Effect of Rock under Impact Load

1
State Key Laboratory of Deep Coal Mine Mining Response and Disaster Prevention and Control, Anhui University of Science and Technology, Huainan 232000, China
2
School of Safety Science and Engineering, Anhui University of Science and Technology, Huainan 232000, China
*
Author to whom correspondence should be addressed.
Minerals 2023, 13(1), 43; https://doi.org/10.3390/min13010043
Submission received: 23 September 2022 / Revised: 6 December 2022 / Accepted: 23 December 2022 / Published: 27 December 2022
(This article belongs to the Special Issue Green Mining of Coal Mine in China)

Abstract

:
When measuring the compressive strength of rock, size and strain rate are the two main influencing factors. To study the rock strength size effect, rock specimens with length-to-diameter ratios of 0.5, 0.6, 0.7, 0.8, 0.9 and 1 were subjected to static loading tests using the RMT rock mechanics test system and dynamic loading with the split Hopkinson pressure bar, respectively. Based on the Weibull size-effect formula, the experimental results were compared with the improved formula obtained. The results show that rock strength is influenced by size and strain rate. Both the dynamic increase factor and rock strength are proportional to strain rate. The different failure modes of rock with size variation and strain rate variation are described according to the failure process of the specimens. The same length-to-diameter ratio specimens produced more fragments with a strain rate increase. Under the same strain rate of impact, the larger the rock specimen, the finer the broken fragments. Considering the factor of strain rate in the Weibull size-effect formula, the calculated result is accurate. The improved size-effect formula could be used to better elaborate the potential mechanisms of dynamic rock strength. In the unified theoretical formula containing static and dynamic loads, the relationship of rock strength, size and strain rate is well described.

1. Introduction

The strength–size effect means that with an increase in structure size, the mechanical properties are no longer constant. The strength–size effect is an inherent property of (quasi-) brittle materials such as rock and concrete, and the main reason may lie in its heterogeneity. There are cracks, joints, weak surfaces and other defects inside, and the strength of specimens with different sizes is different in these brittle materials. Under the conditions of static loading, there are three widely accepted laws of size effect: Weibull et al. [1] initially proposed the statistical size-effect theory based on the randomness of material strength, and H.K. Man et al. [2] believed that it could better explain the size-effect phenomenon of quasi-brittle rock structures. Bazant et al. [3,4] put forward the theory of fracture mechanics size effect based on the fracture energy release and fracture zone model, which is not convenient to use in practice and its size effect law does not conform to materials with large structural sizes. Carpinteri et al. [5,6] proposed the theory of multifractal size effect based on the fractal concept in classical solid mechanics. Bažant et al. [7] pointed out the limitations of the multifractal size effect theory: (1) most of the energy is not consumed on the final fracture surface, so the fractal properties of the final fracture surface do not actually reflect the fracture nature of the material; (2) the dependence of the coefficient of the prediction multifractal size effect law on the structure geometry cannot be explained by the fractal theory; that is to say, the applicability of the multifractal size effect law on the structure is insufficient. It is known that the dynamic size effect is obviously different from the static size effect. Under the same strain rate, the material strength of the dynamic size effect increases with the increase in specimen size, and larger specimens exhibit more obvious strain rate effect. Under the influence of complex microstructure levels and limited crack growth velocity, the relationship between strength, strain rate and specimen size has always been the focus of studies [8,9,10,11]. Although the strength enhancement of materials under impact loads has been confirmed to be size dependent, the dynamic size effect on the rock’s material properties remains unclear. The size-effect law of rock materials under impact loading has not been fully understood, so it is urgent to expand the applicability of the law of size effect.
For the relationship between the strength and size of rock, many scholars have drawn some corresponding rules and empirical formulas by introducing some relevant theories or different experimental methods. Based on a large number of rock tests, Liu et al. [12] studied many experiments about the relationship between rock strength and different sizes, and summarized many empirical formulas for the size effect of rock materials. Yang et al. [13] calculated a set of theoretical models that can be applied to the size effect of rock materials through static compression experiments on marbles of different sizes. Based on the weakest chain model and Poisson distribution assumption of defects, Zhang et al. [14] established statistical models and general expressions for failure probability and the strength–size effect of quasi-brittle materials under static load tests by considering volume and material factors. Both empirical and theoretical models summarized by many scholars [12,13,14] can calculate the static compressive strength of rock in certain conditions, but they cannot be adapted to rock under dynamic loading conditions. Through many SHPB tests under different strain rate conditions, Wang et al. [15] put forward the empirical formula of the dynamic strengthening factor (DIF) of RCC compressive strength, which was used to predict material strength under different strain rates. Gong et al. [16] carried out static–dynamic compression tests on rocks with unified size, and proposed the unified model of dynamic enhancement factor based on strain rate and loading rate from low to high. This method overcomes the shortcomings of the segmental description of the traditional dynamic enhancement-factor model. Many scholars [15,16] studied rock strength under static and dynamic conditions in rocks of a single size, considering the full strain-rate range in the test, but they did not consider the change in rock strength caused by different sizes. Based on the Weibull distribution function, Wang et al. [17] introduced volume parameters and strain rate-related parameters, considered the influence of material size and rate effect, and elaborated the dynamic compressive strength law of RCC. However, the relevant parameters in the formula are only adapted to some materials.
International specifications have been proposed for the strain-rate change in concrete material strength [18], and many relevant studies on the size change have been studied [8,19]. Concerning rock materials, many scholars [20] have put forward many strength–size effect formulas based on relevant tests or theories, but there is no unified strength–size effect formula that meets the conditions of static and dynamic loading. The improved formula [14,17] based on the Weibull distribution function is applied to rock materials under static and dynamic loading conditions. The relevant parameters are determined through rock tests and related studies, and the application effect is verified; it can link the strength and size effects of rock in static and dynamic conditions. Under static conditions, the strength of rock materials are affected by rock dispersion and size effect. Under dynamic conditions, the mechanical characteristics of rock materials are affected by strain-rate effect and size effect. Based on the Weibull theory, the relationship between the static and dynamic size effects of rock materials is established in this paper.

2. Experiment Study

2.1. Specimen Preparation

Four groups of compression tests were designed, one group of static compression tests and three groups of dynamic compression tests with impact pressures of 0.5, 0.75 and 1 MPa, respectively. Granite specimens with diameters of 50 mm and length-to-diameter ratios (LDR) of 0.5, 0.6, 0.7, 0.8, 0.9 and 1 were made. Three groups of specimens were prepared for granite with different LDRs in the same group. The rock was prepared through a series of processes such as coring, cutting and grinding. Specimens were made to conform to the process standard. The granite’s mineral composition was quartz granular in 1~2 mm, the content was 35%~40%. Potassium feldspar mainly in 1~2 mm, the content was 15%~20%. Plagioclase mainly in 1~2 mm, the content was 35%~40%. Biotite content was about 2%, other mineral content was about 3%.

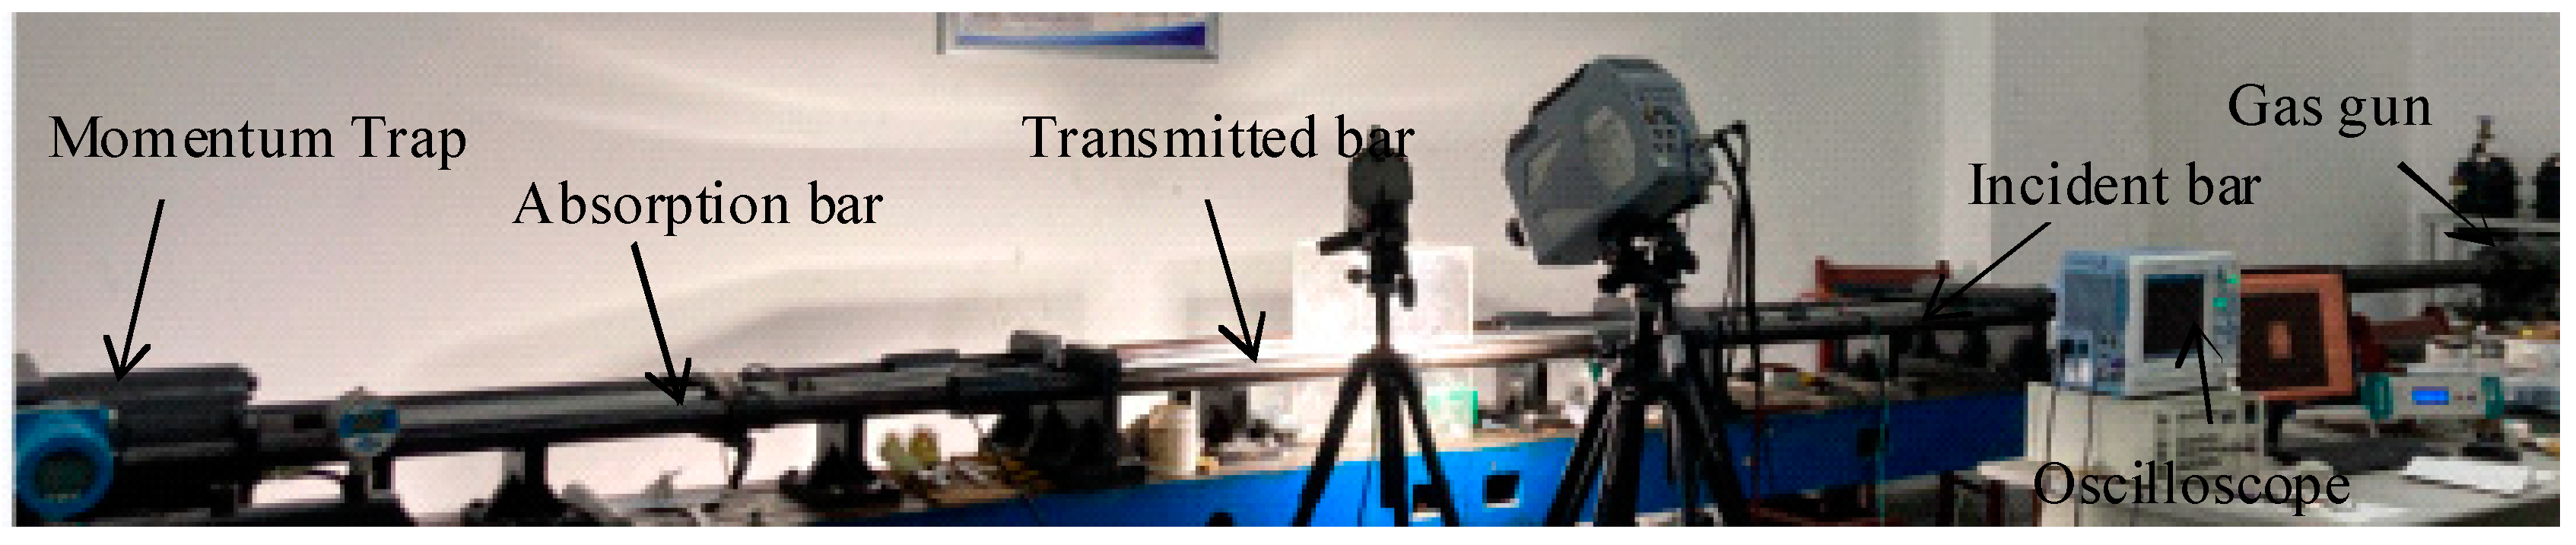
2.2. SHPB Experiment

The static loading test system was an RMT-150B rock mechanics servo control system. The displacement control loading method was adopted in the test, and the loading rate was 0.002 mm/s. The split Hopkinson pressure bar (SHPB) experimental device is shown in Figure 1. The incident bar, transmission bar and absorption bar were made of high-strength alloy with diameter of 5 cm, density of 7.82 g/cm3 and elastic modulus of 210 GPa. The incident bar impact specimen produced waveform dispersion, and a 0.1 cm rubber pad was added to the end of the incident bar as a waveform shaper. Specimens were sandwiched between the incident bar and the transmitted bar. In order to reduce the friction between the incident bar and the end face of the rock specimen, lubricant was applied to both ends of the specimen, so that energy consumption was negligible from the friction between incident bar and specimens.
Using an SHPB impact specimen at high strain rate in order to avoid the oscillation of test stress–strain curve, the semi-sinusoidal stress waveform was selected as the loading method for the quasi-brittle material in SHPB test. In addition, the incident wave needed a certain rise time so as not to destroy the specimen before the stress reached a balanced state between the two specimen surfaces. To reduce friction, Vaseline was evenly applied to the contact surface between specimen and bar. In the SPHB test, a firing pin propelled by a gas gun strikes the incident bar. In this way, a stress pulse can be generated in the incident bar. Due to the different wave impedances between the specimen and the incident bar, part of the stress pulse was transmitted through the specimen as a compression pulse, and part of the stress pulse was reflected into the incident bar as a tensile pulse. The strain gauges were mounted on the incident bar and transmitted bar, respectively, to record the incident pulse, reflected pulse and transmitted pulse throughout the whole impact process.
Based on the one-dimensional stress wave theory and the assumption of stress uniformity, a three-wave formula was used to calculate the stress, strain and average strain rates of the specimen during the impact process. The calculation principle is as follows:
σ s = A B E 2 A S [ ε t ( t ) + ε r ( t ) + ε i ( t ) ] ε . ( t ) = C L [ ε t ( t ) + ε r ( t ) ε i ( t ) ] ε t ( t ) = C L 0 t [ ε t ( t ) + ε r ( t ) ε i ( t ) ] d t
where σ s is the stress of the specimens, ε is the strain of the specimens, and ε . is the strain rate of the specimens, AB, E and C are the area, the elastic modulus and the wave velocity of the bar, respectively. As and L are the area and length of specimens, respectively. ε i ( t ) ,   ε r ( t ) ,   ε t ( t ) are the incident strain, the reflected strain and the transmitted strain at time t, respectively.

3. Experimental Results

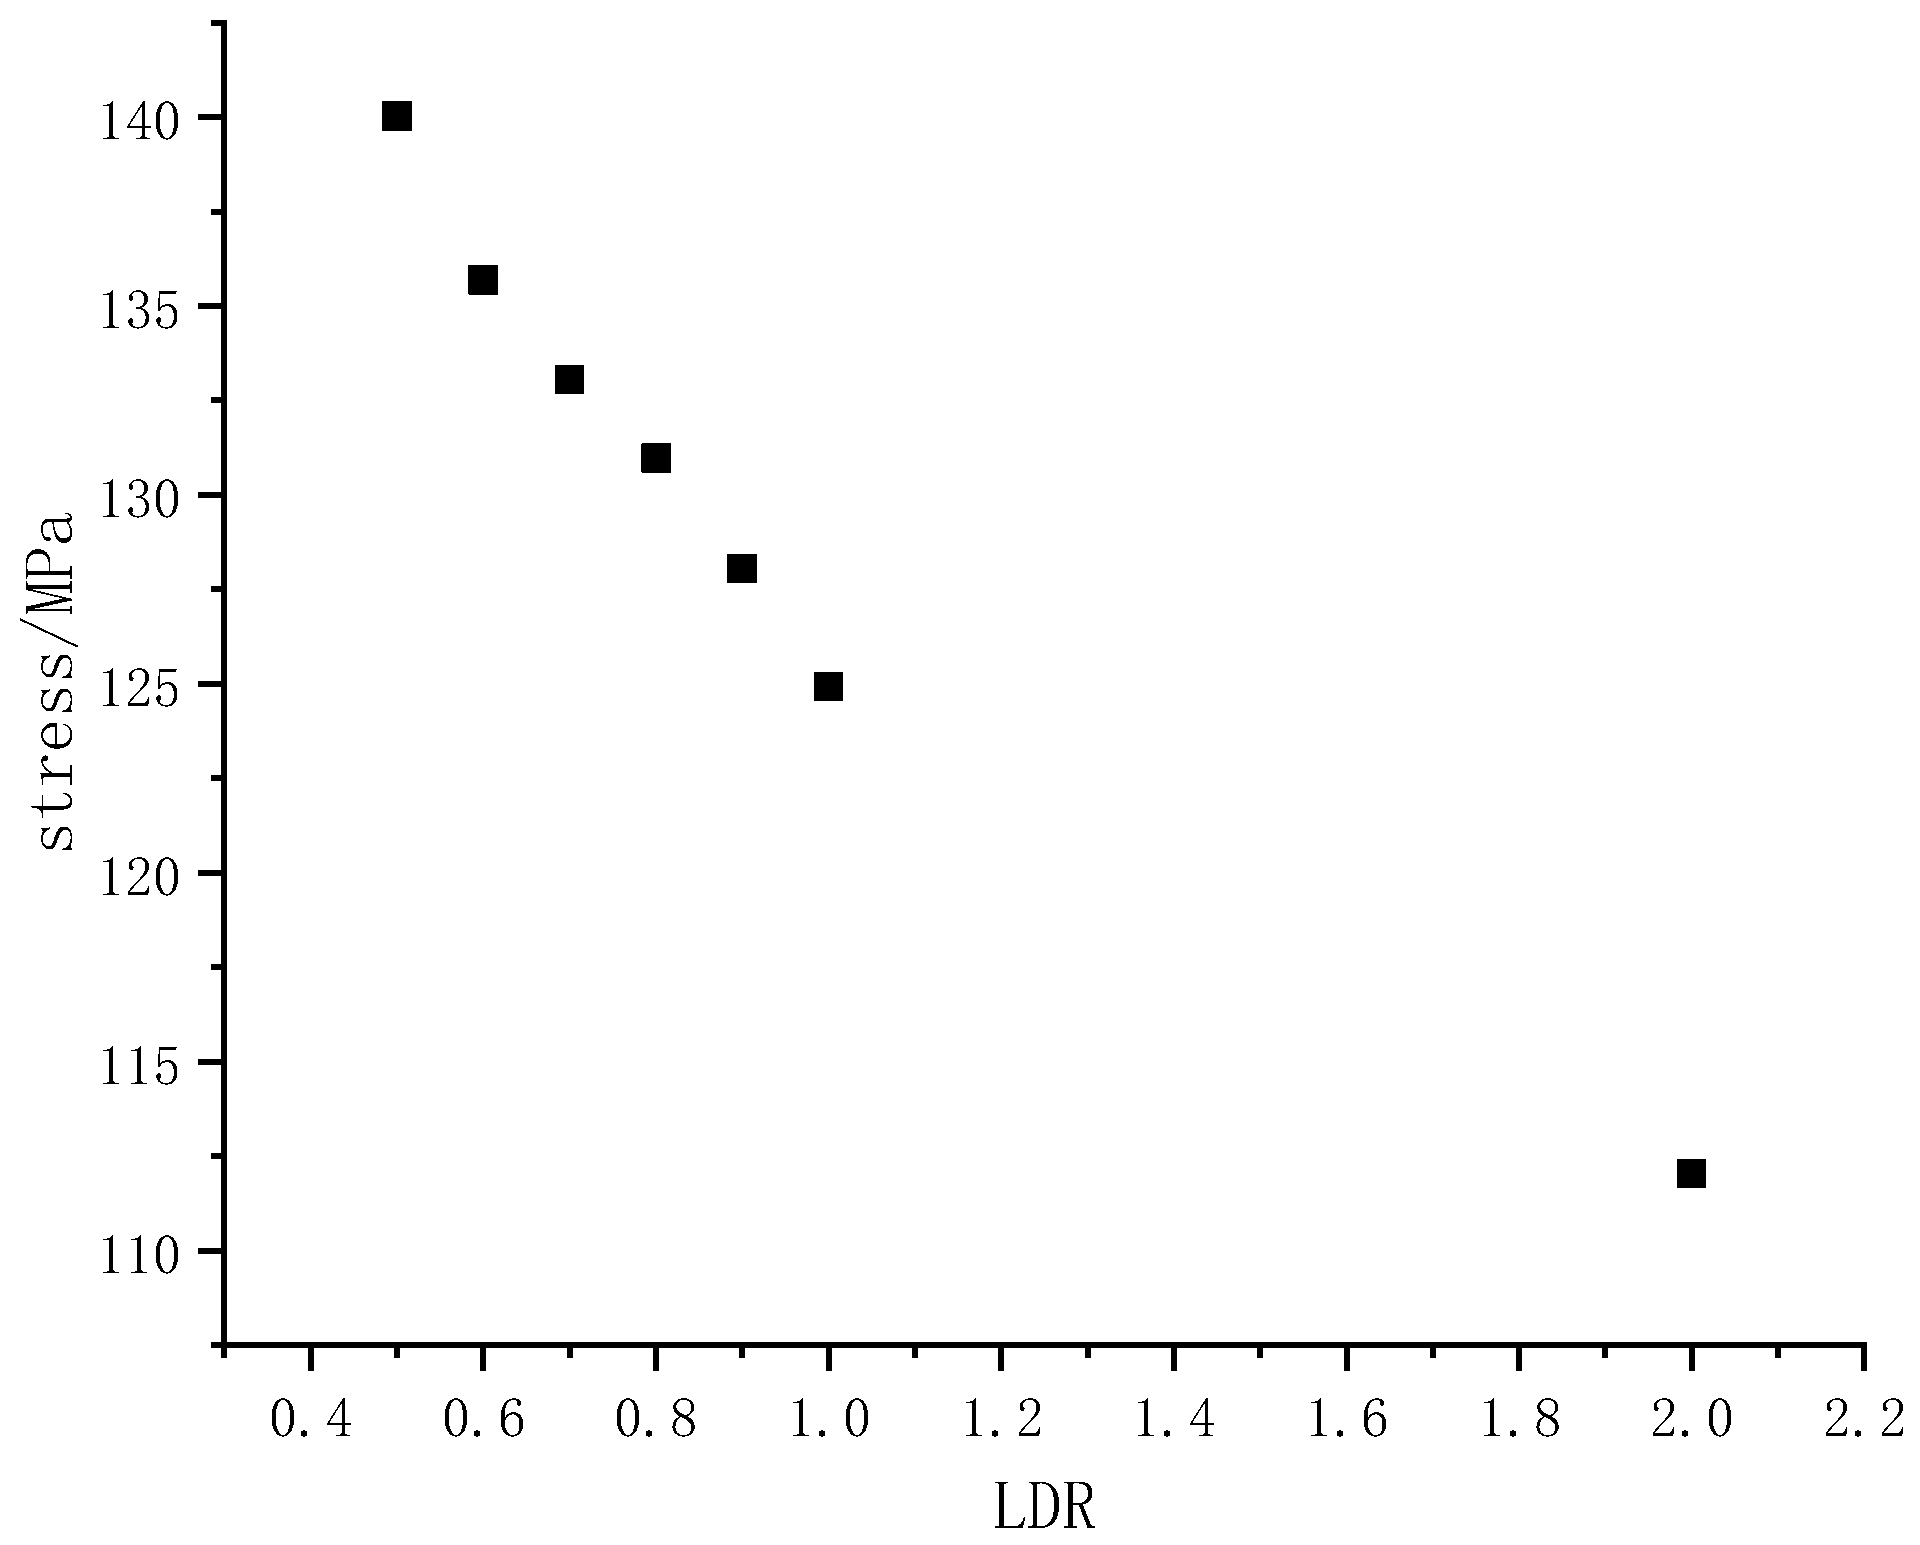
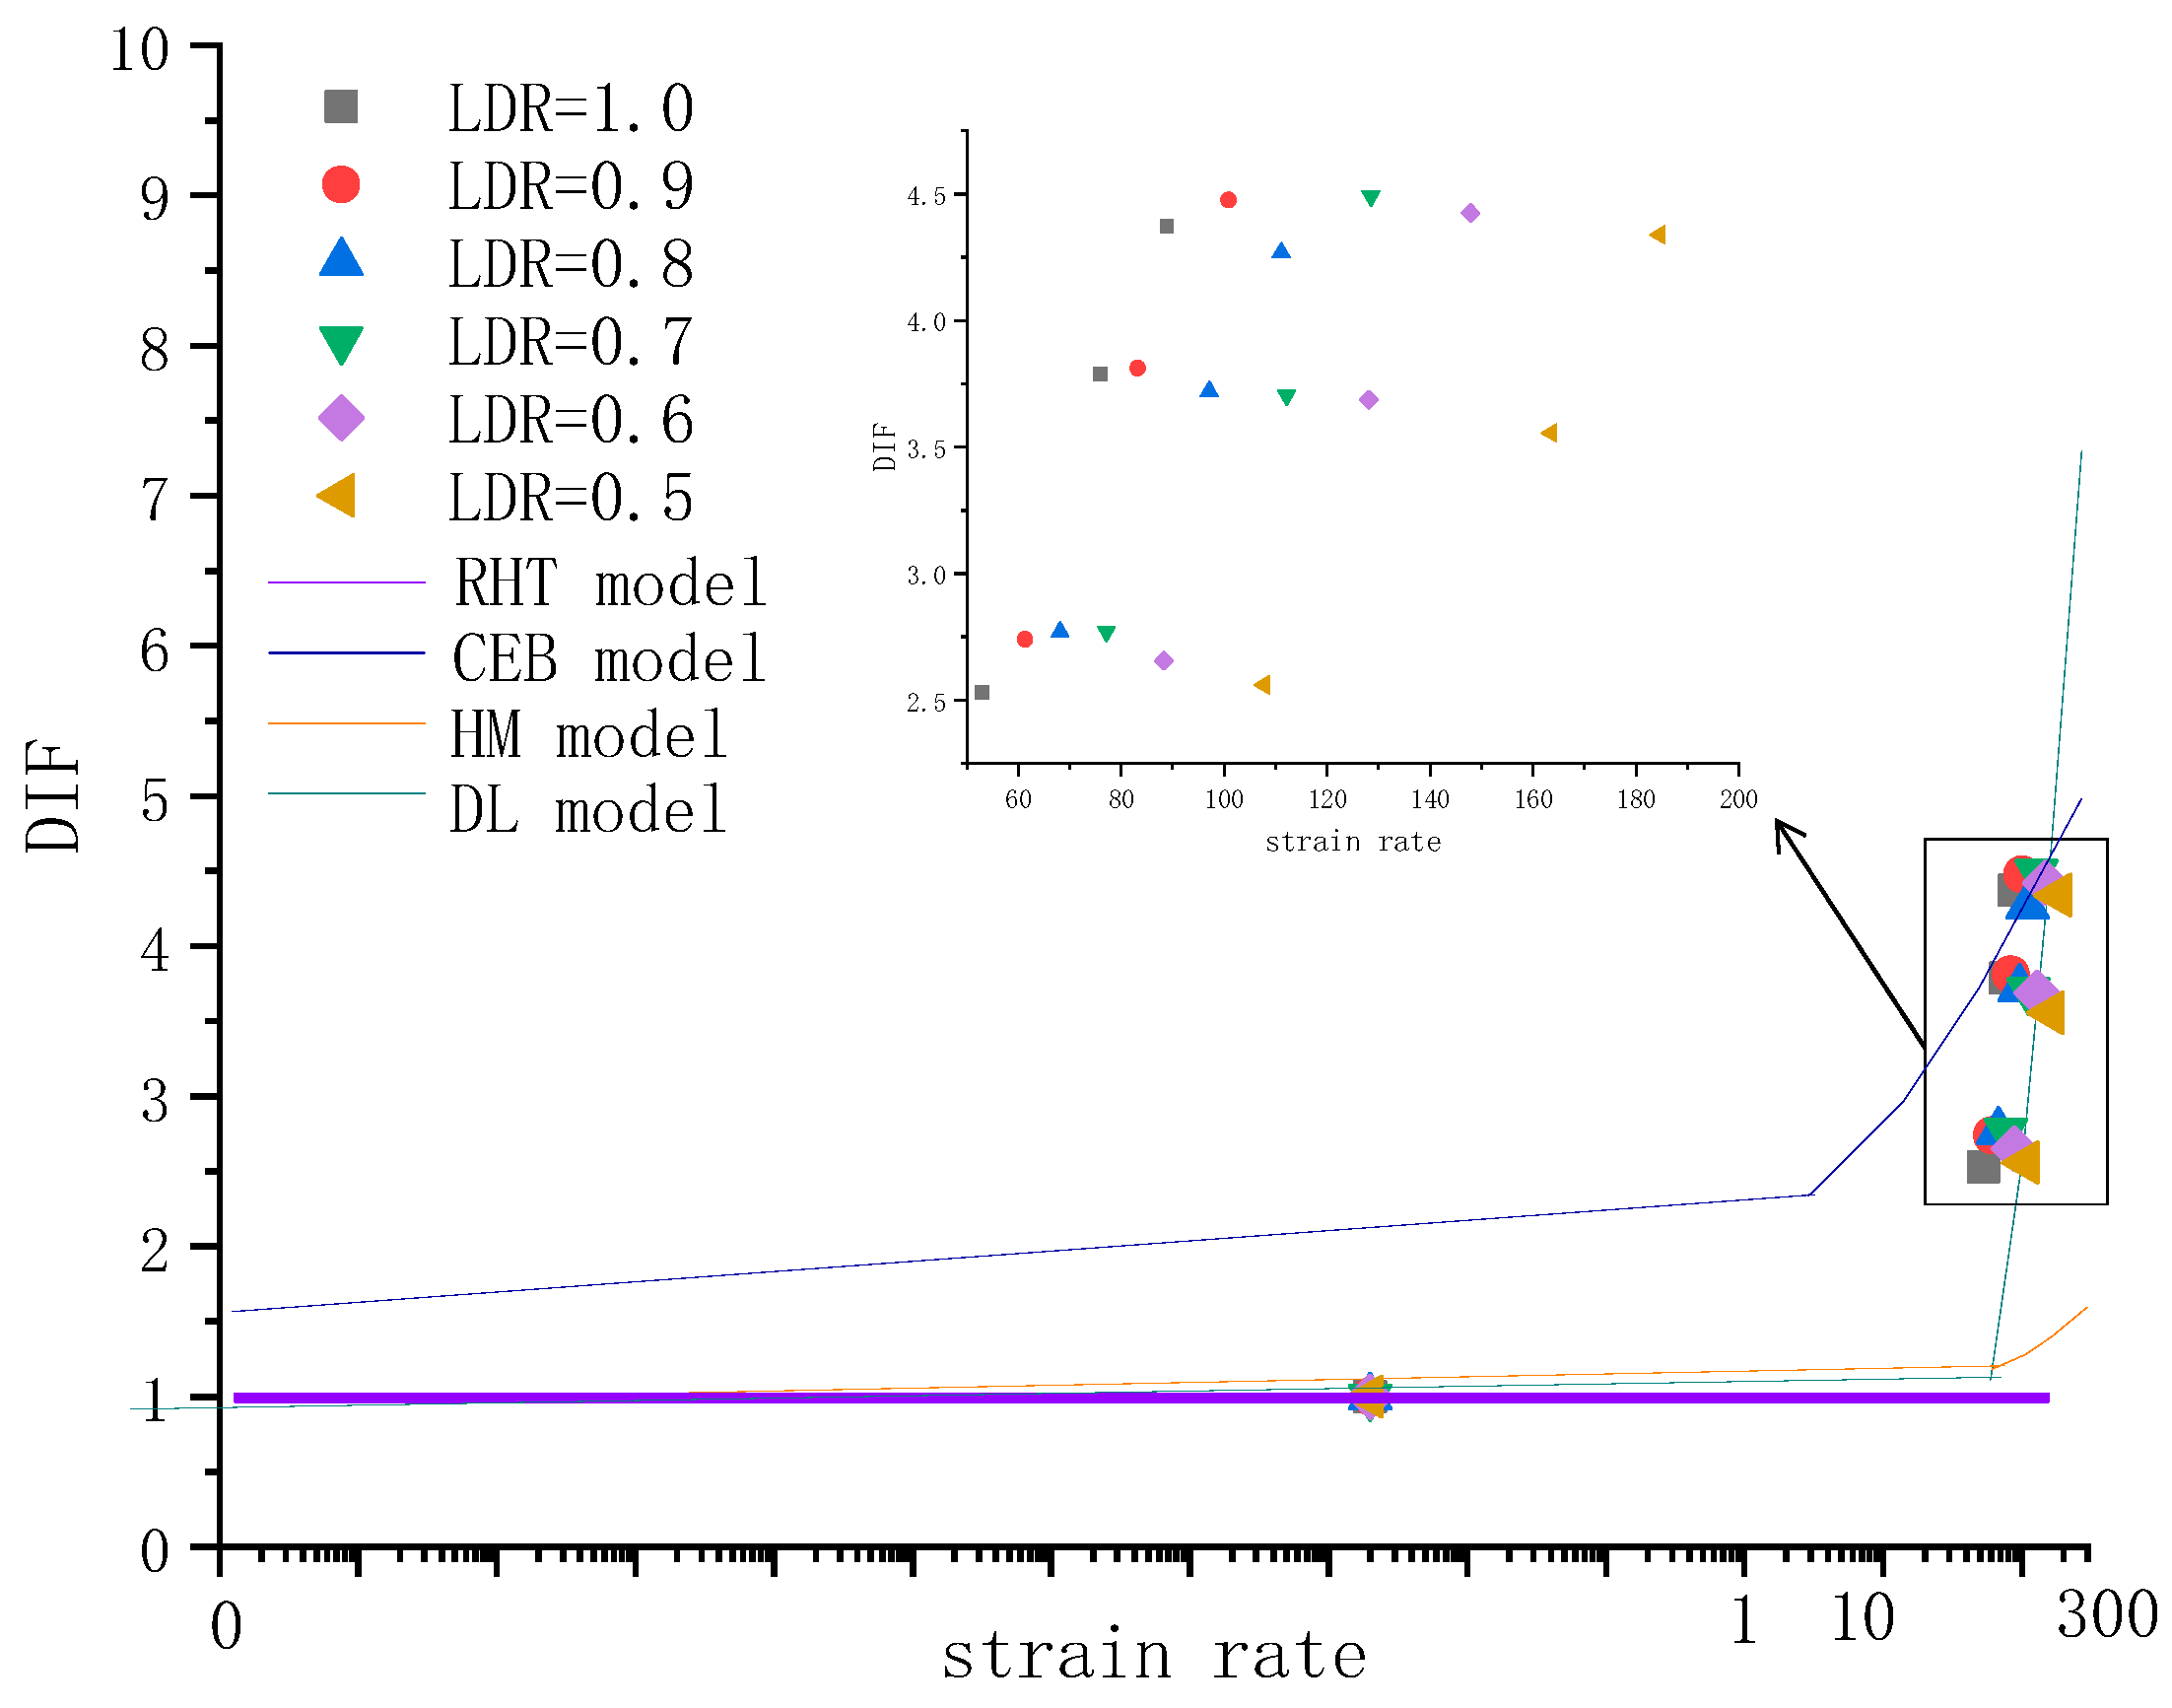
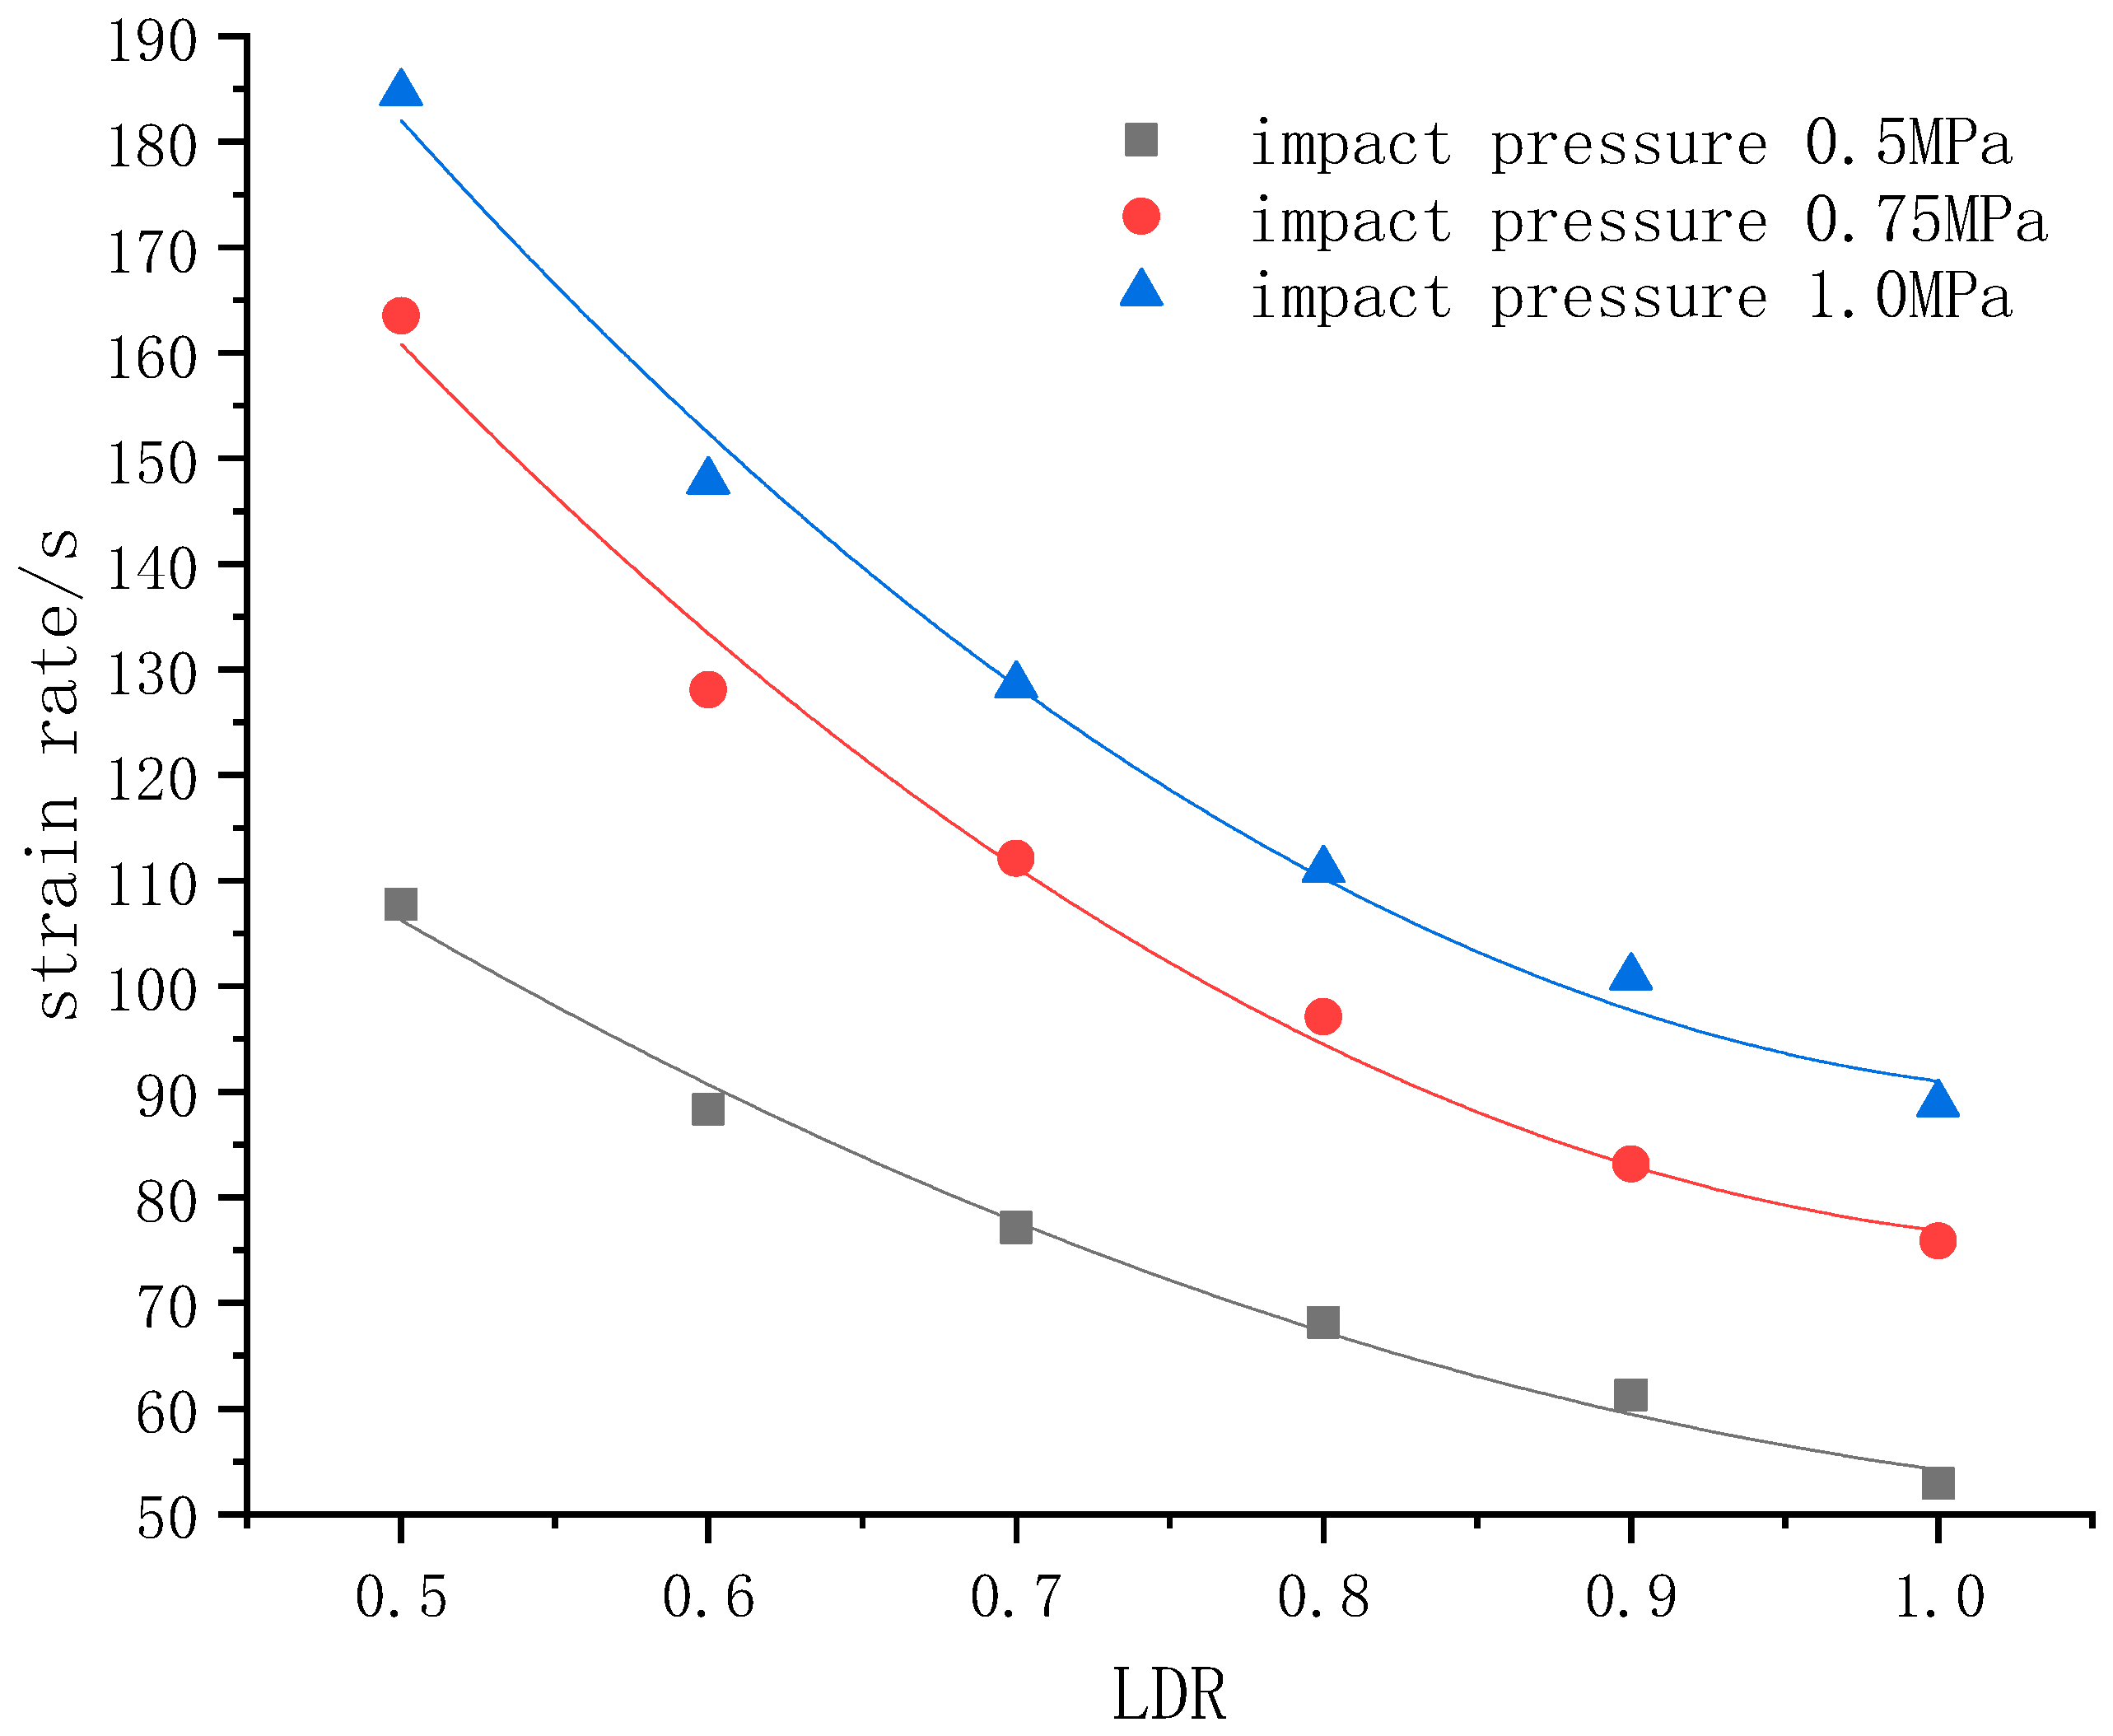
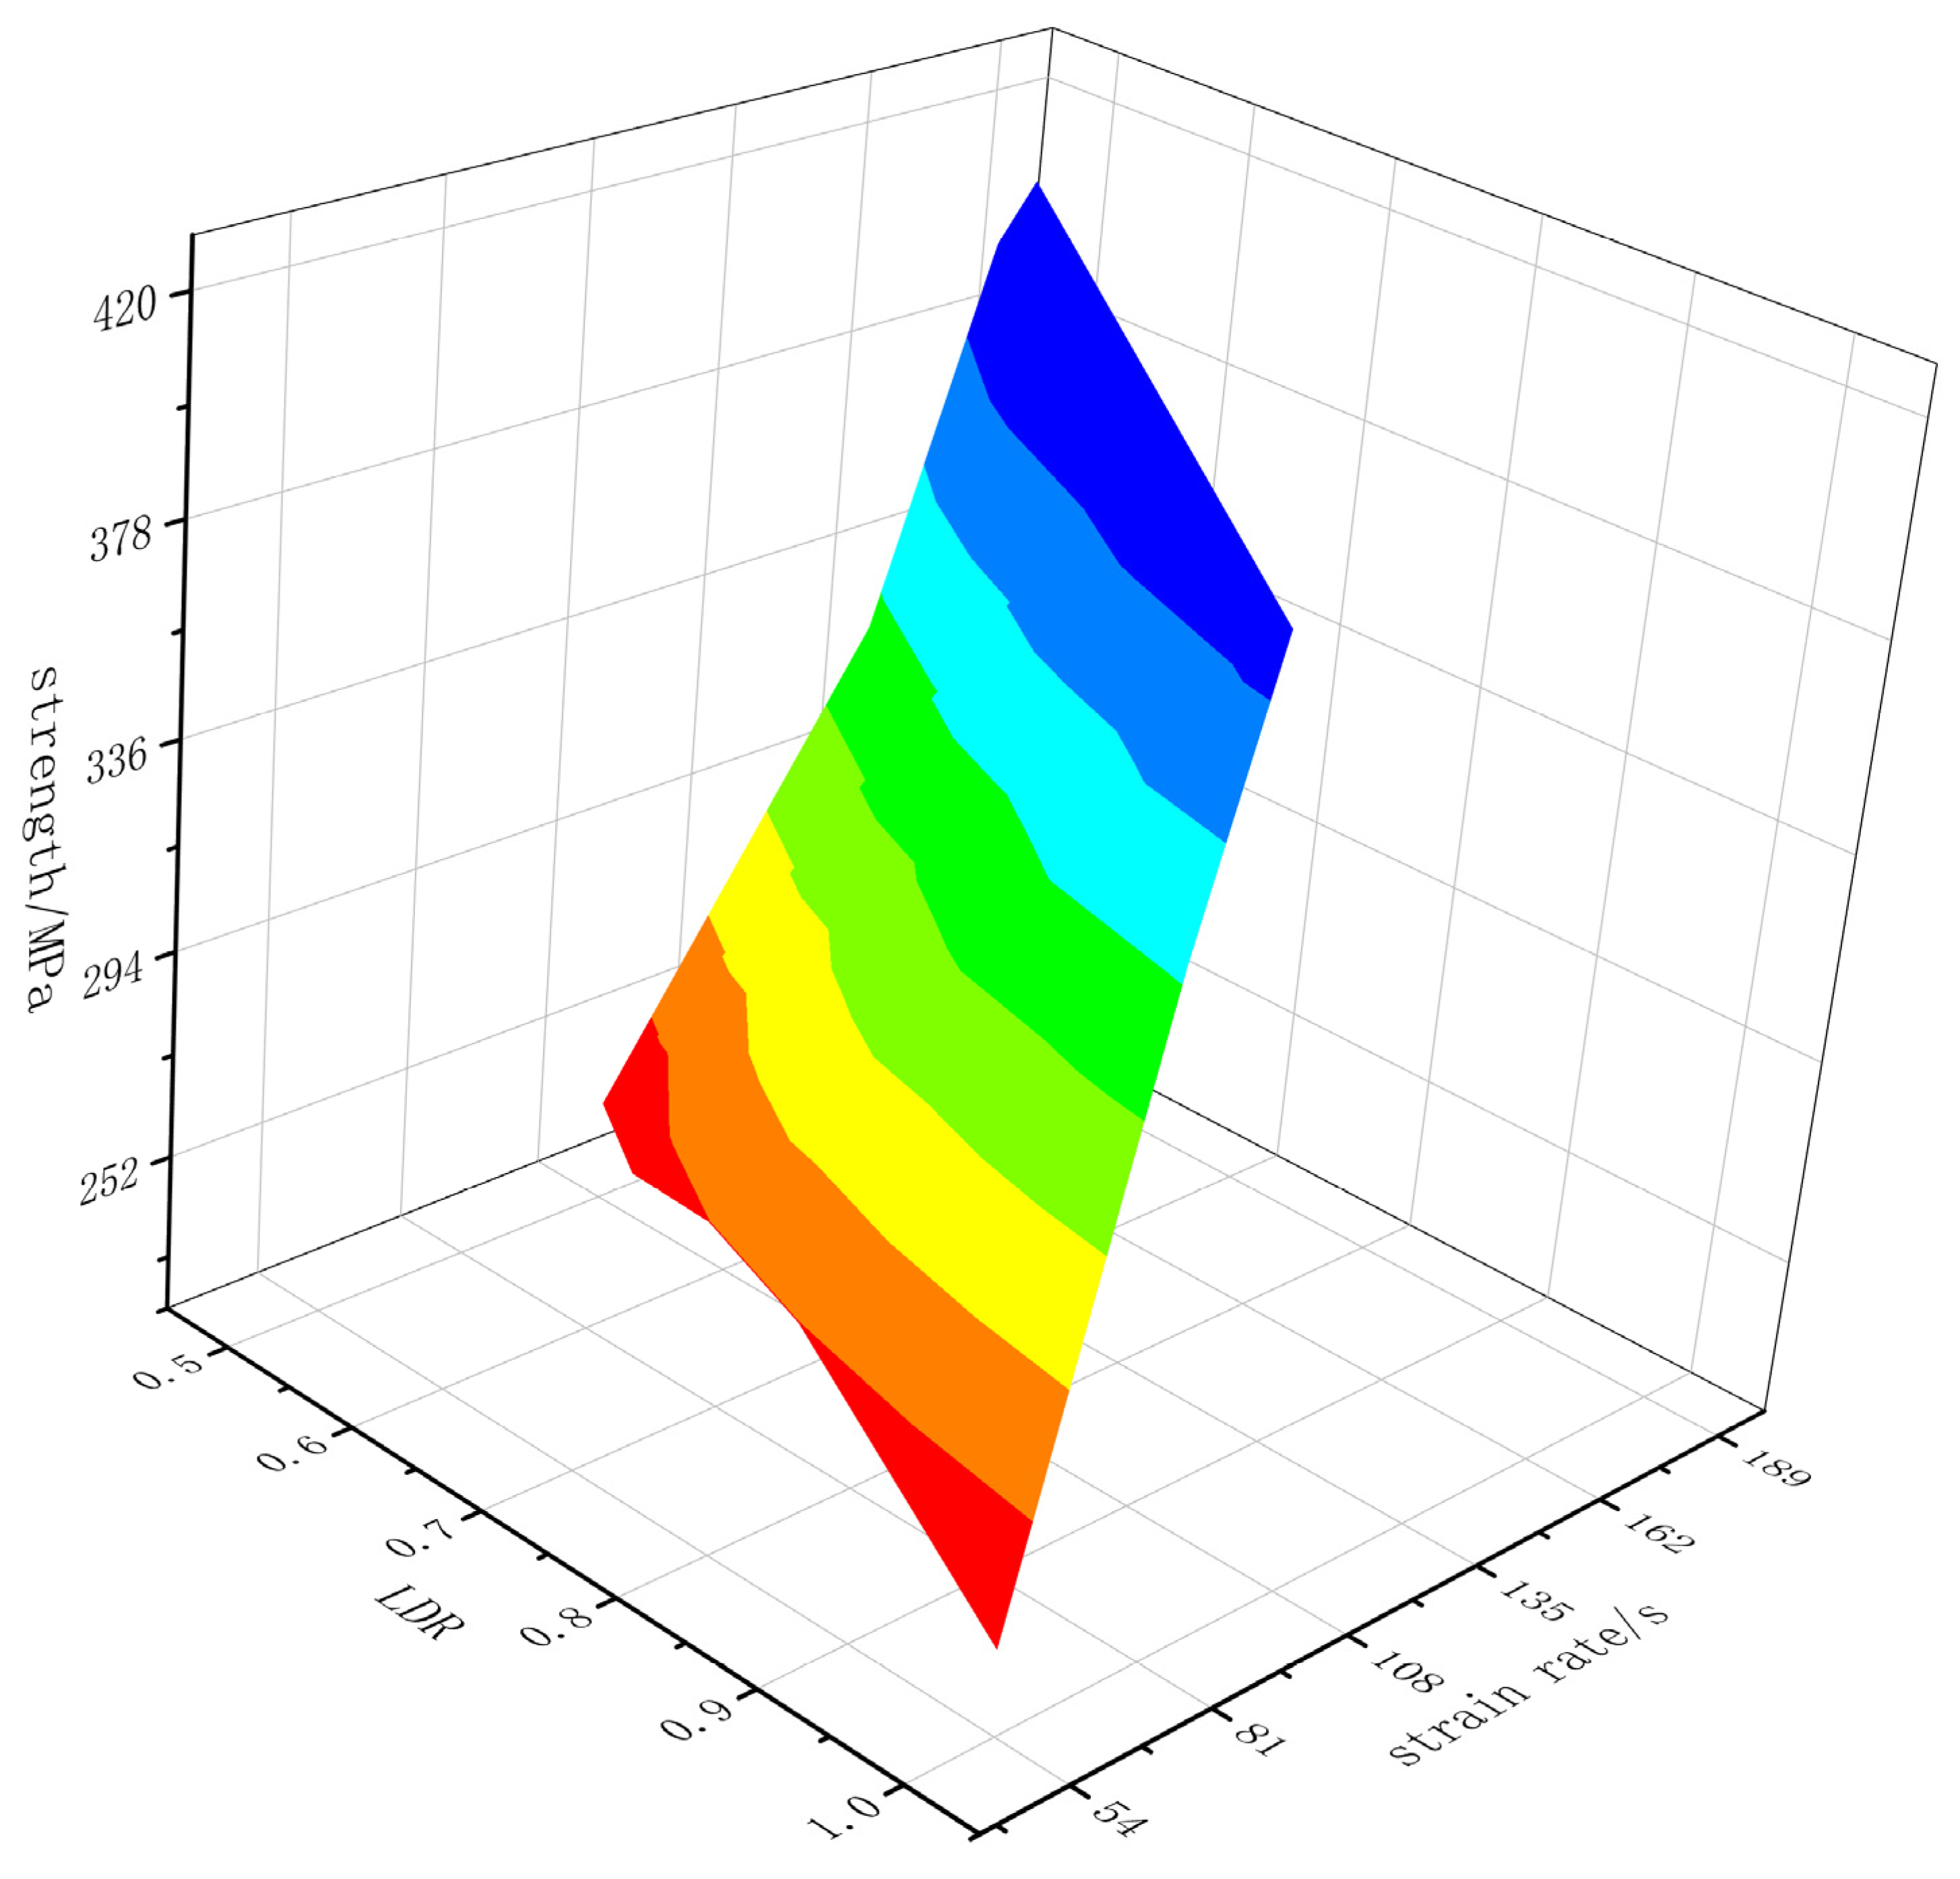
3.1. Dynamic Size Effect and Strain Rate Effect

Quasi-static compression tests were carried out on specimens with diameters of 50 mm and length-to-diameter ratios (LDR) of 1, 0.9, 0.8, 0.7, 0.6, 0.5 and 2 at the loading rate of 0.002 mm/s. The corresponding uniaxial compressive strength is shown in Figure 2.
The LDR increased from 0.5 to 1, and the rock strength decreased from 140.02 MPa to 124.924 MPa. The rock strength was inversely proportional to the size, and the decreasing trend of the rock strength becomes weaker with the increase in the size.
The SPHB impact tests were performed on granite specimens with LDRs of 1, 0.9, 0.8, 0.7, 0.6 and 0.5, respectively. The dynamic loading mechanical parameters are shown in Table 1.
Under the dynamic load condition, the dynamic increase factor (DIF) is usually used as the measurement index for the relationship between the strength and strain rate of rock materials. The dynamic strengthening factor is expressed as follows:
D I F = f d f
where f d is the dynamic compressive strength, f is the static compressive strength of the standard specimen, and here is set at 112.04 MPa.
The impact gas pressure difference means the different impact energies provided by the gas gun. The DIF values of the specimens with different sizes were significantly different under the three groups of impact gas pressure. The greater the impact energy, the greater the DIF value. This indicates that the DIF value mainly depended on the magnitude of the impact energy provided. That is, the impact energy difference plays a more significant role on rock strength than the size difference.
There are many quantitative studies on the strain rate effect on rock materials; many fitting models are widely used to illustrate the empirical relationship between strain rate and DIF [18,21,22,23]. In Figure 3, the tested DIF was compared with other calculated results from different models. The DIFs calculated by the DL model were better. With the strain rate increase, the DIF increased, which shows the strain rate effect had an obvious influence on rock strength.

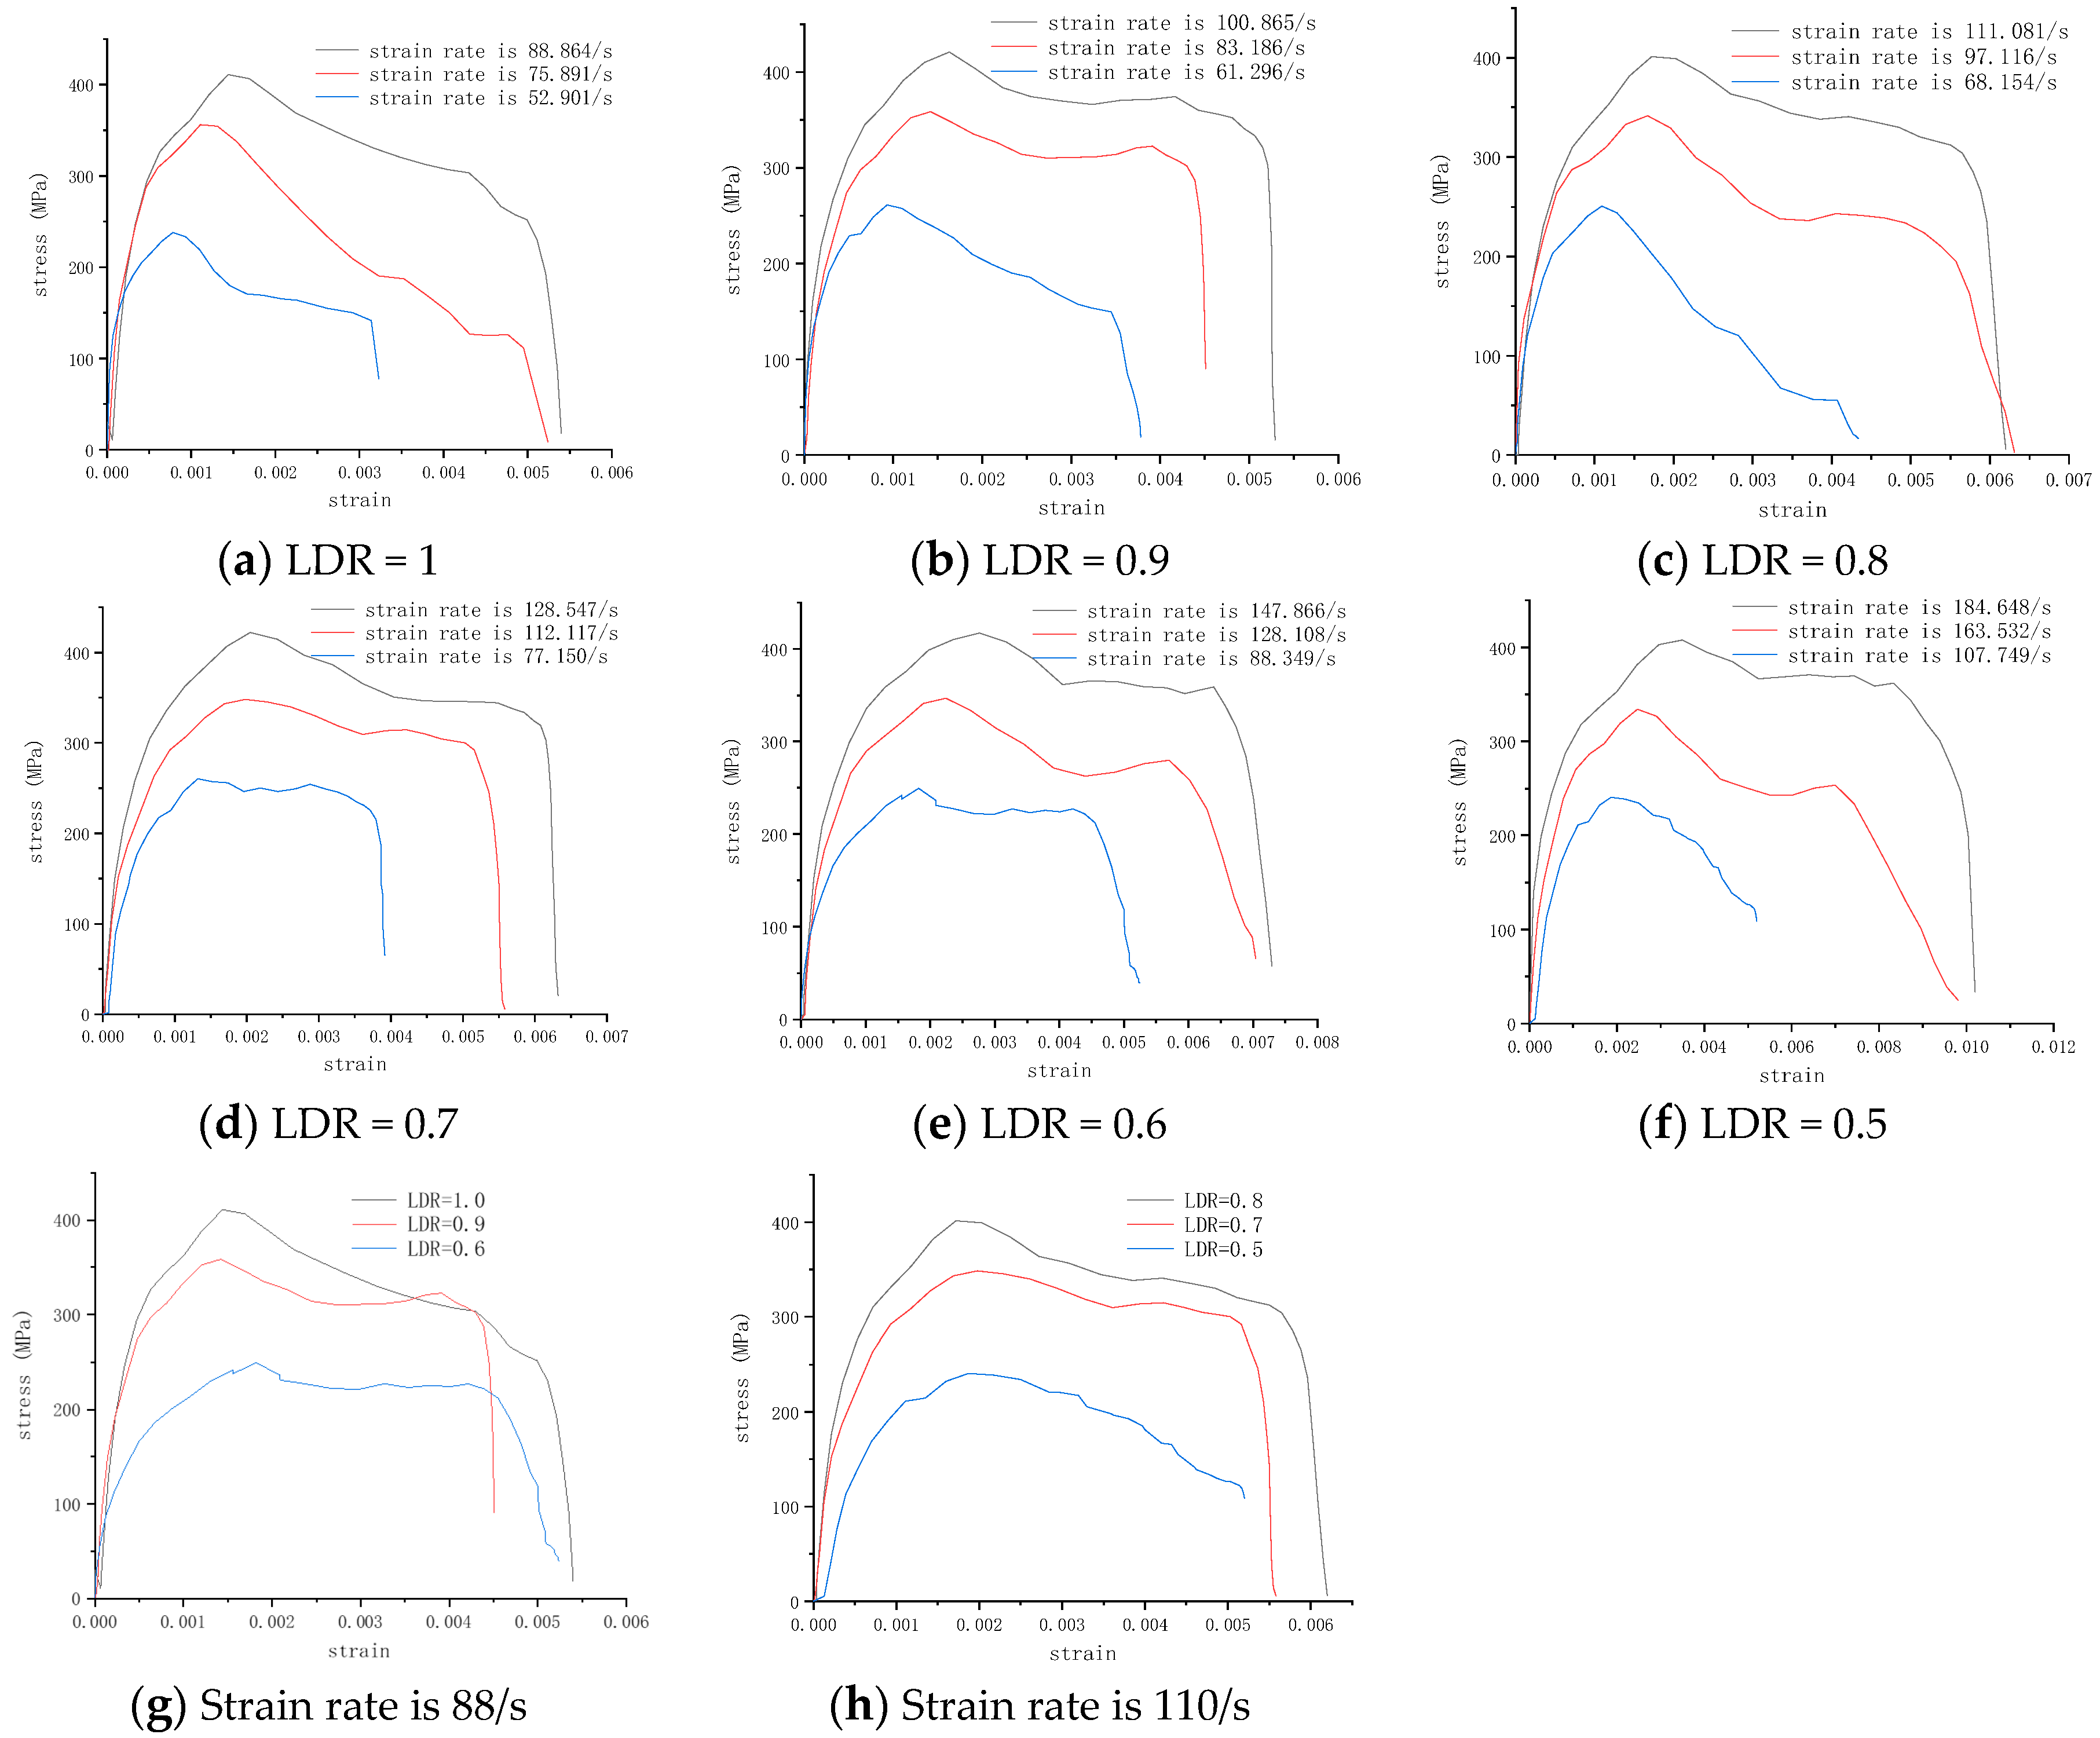
3.2. Influence of Size on Stress–Strain Curve

For specimens of the same size, the three stress–strain curves under the impact conditions of different strain rates are compared in Figure 4a–f. These illustrate the strain-rate effect on rock. The stress–strain curves of the granite specimens with different sizes have general characteristics; these curves obviously rise with the increase in strain rate. When the strain rate is higher, the value of the peak stress is greater. With the increase in strain rate, the slopes of the up curve and down curve increased. The linear part of the rising curve is called the elastic stage; that is, with the strain rate increase, the dynamic elastic modulus increased.
As shown in Figure 4g,h, the strength of different sized specimens was different with same strain rate. These differences show the character of dynamic size effect. The stress–strain curve slope of the larger specimen was steeper than that of the smaller specimen. The linear part of the rising curve was in the elastic stage of the specimen; that is, the dynamic elastic modulus increases with the size increase in the specimen. With the increase in specimen size, the peak stress also increases significantly.

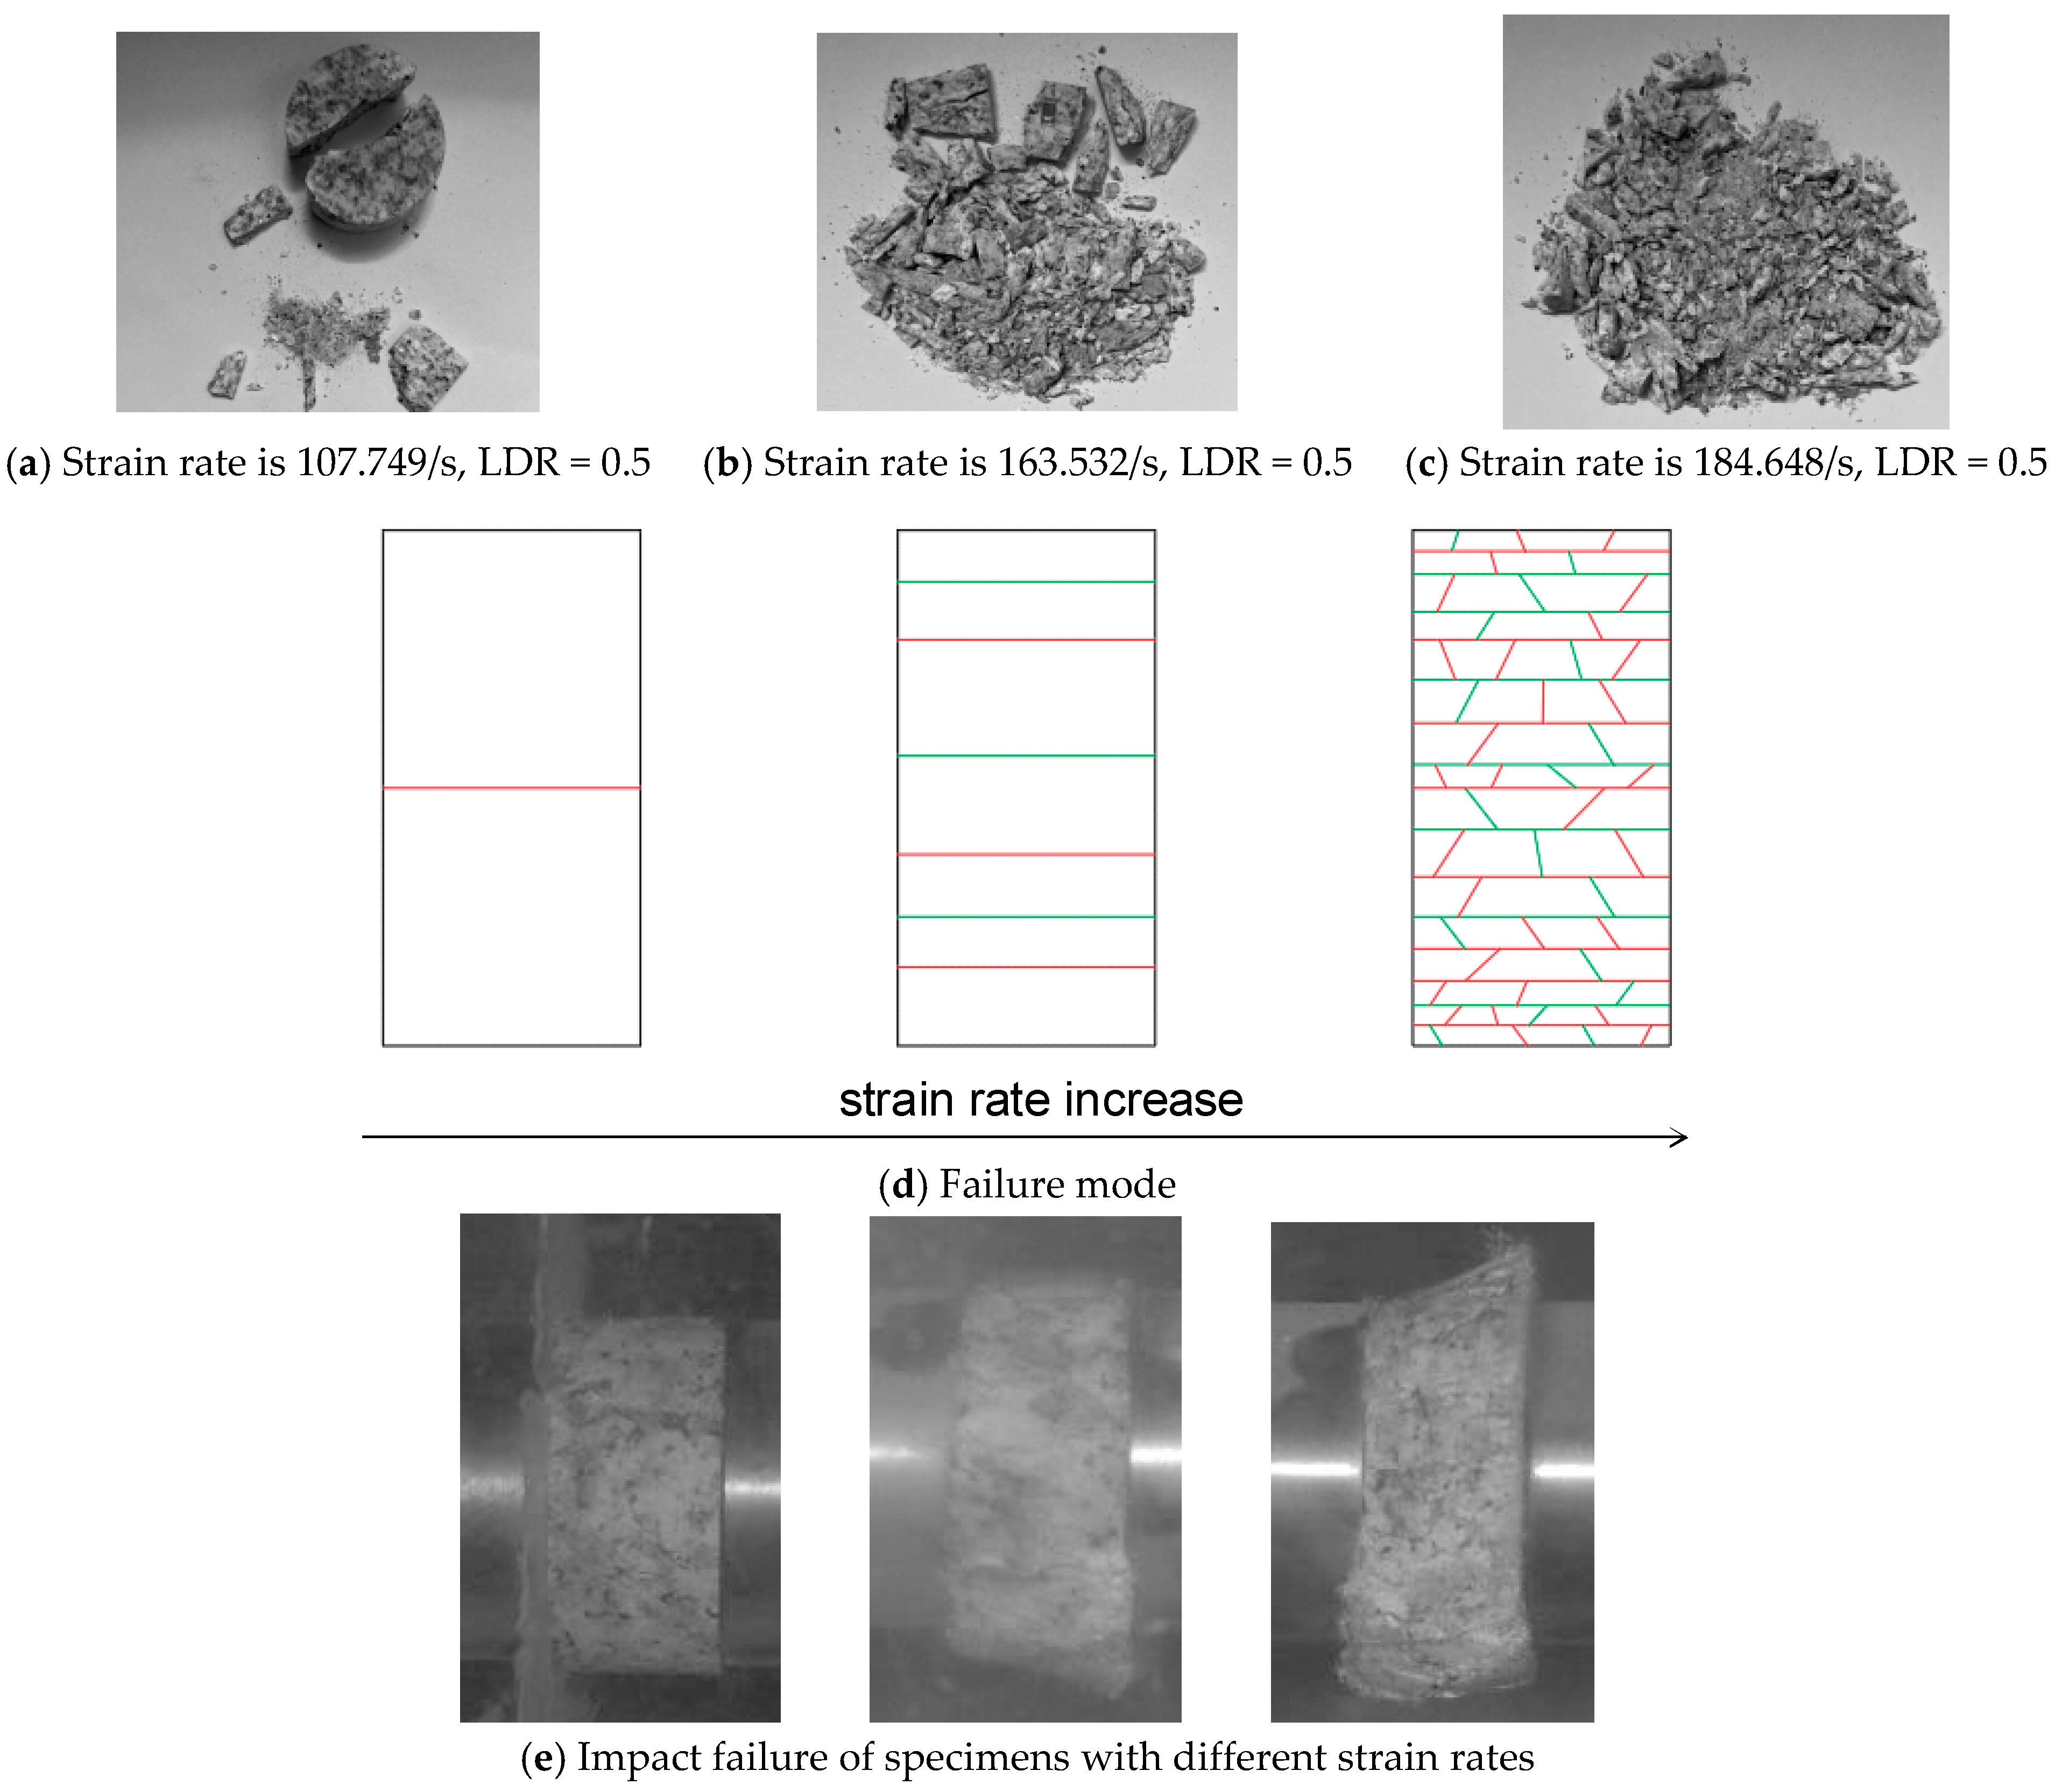
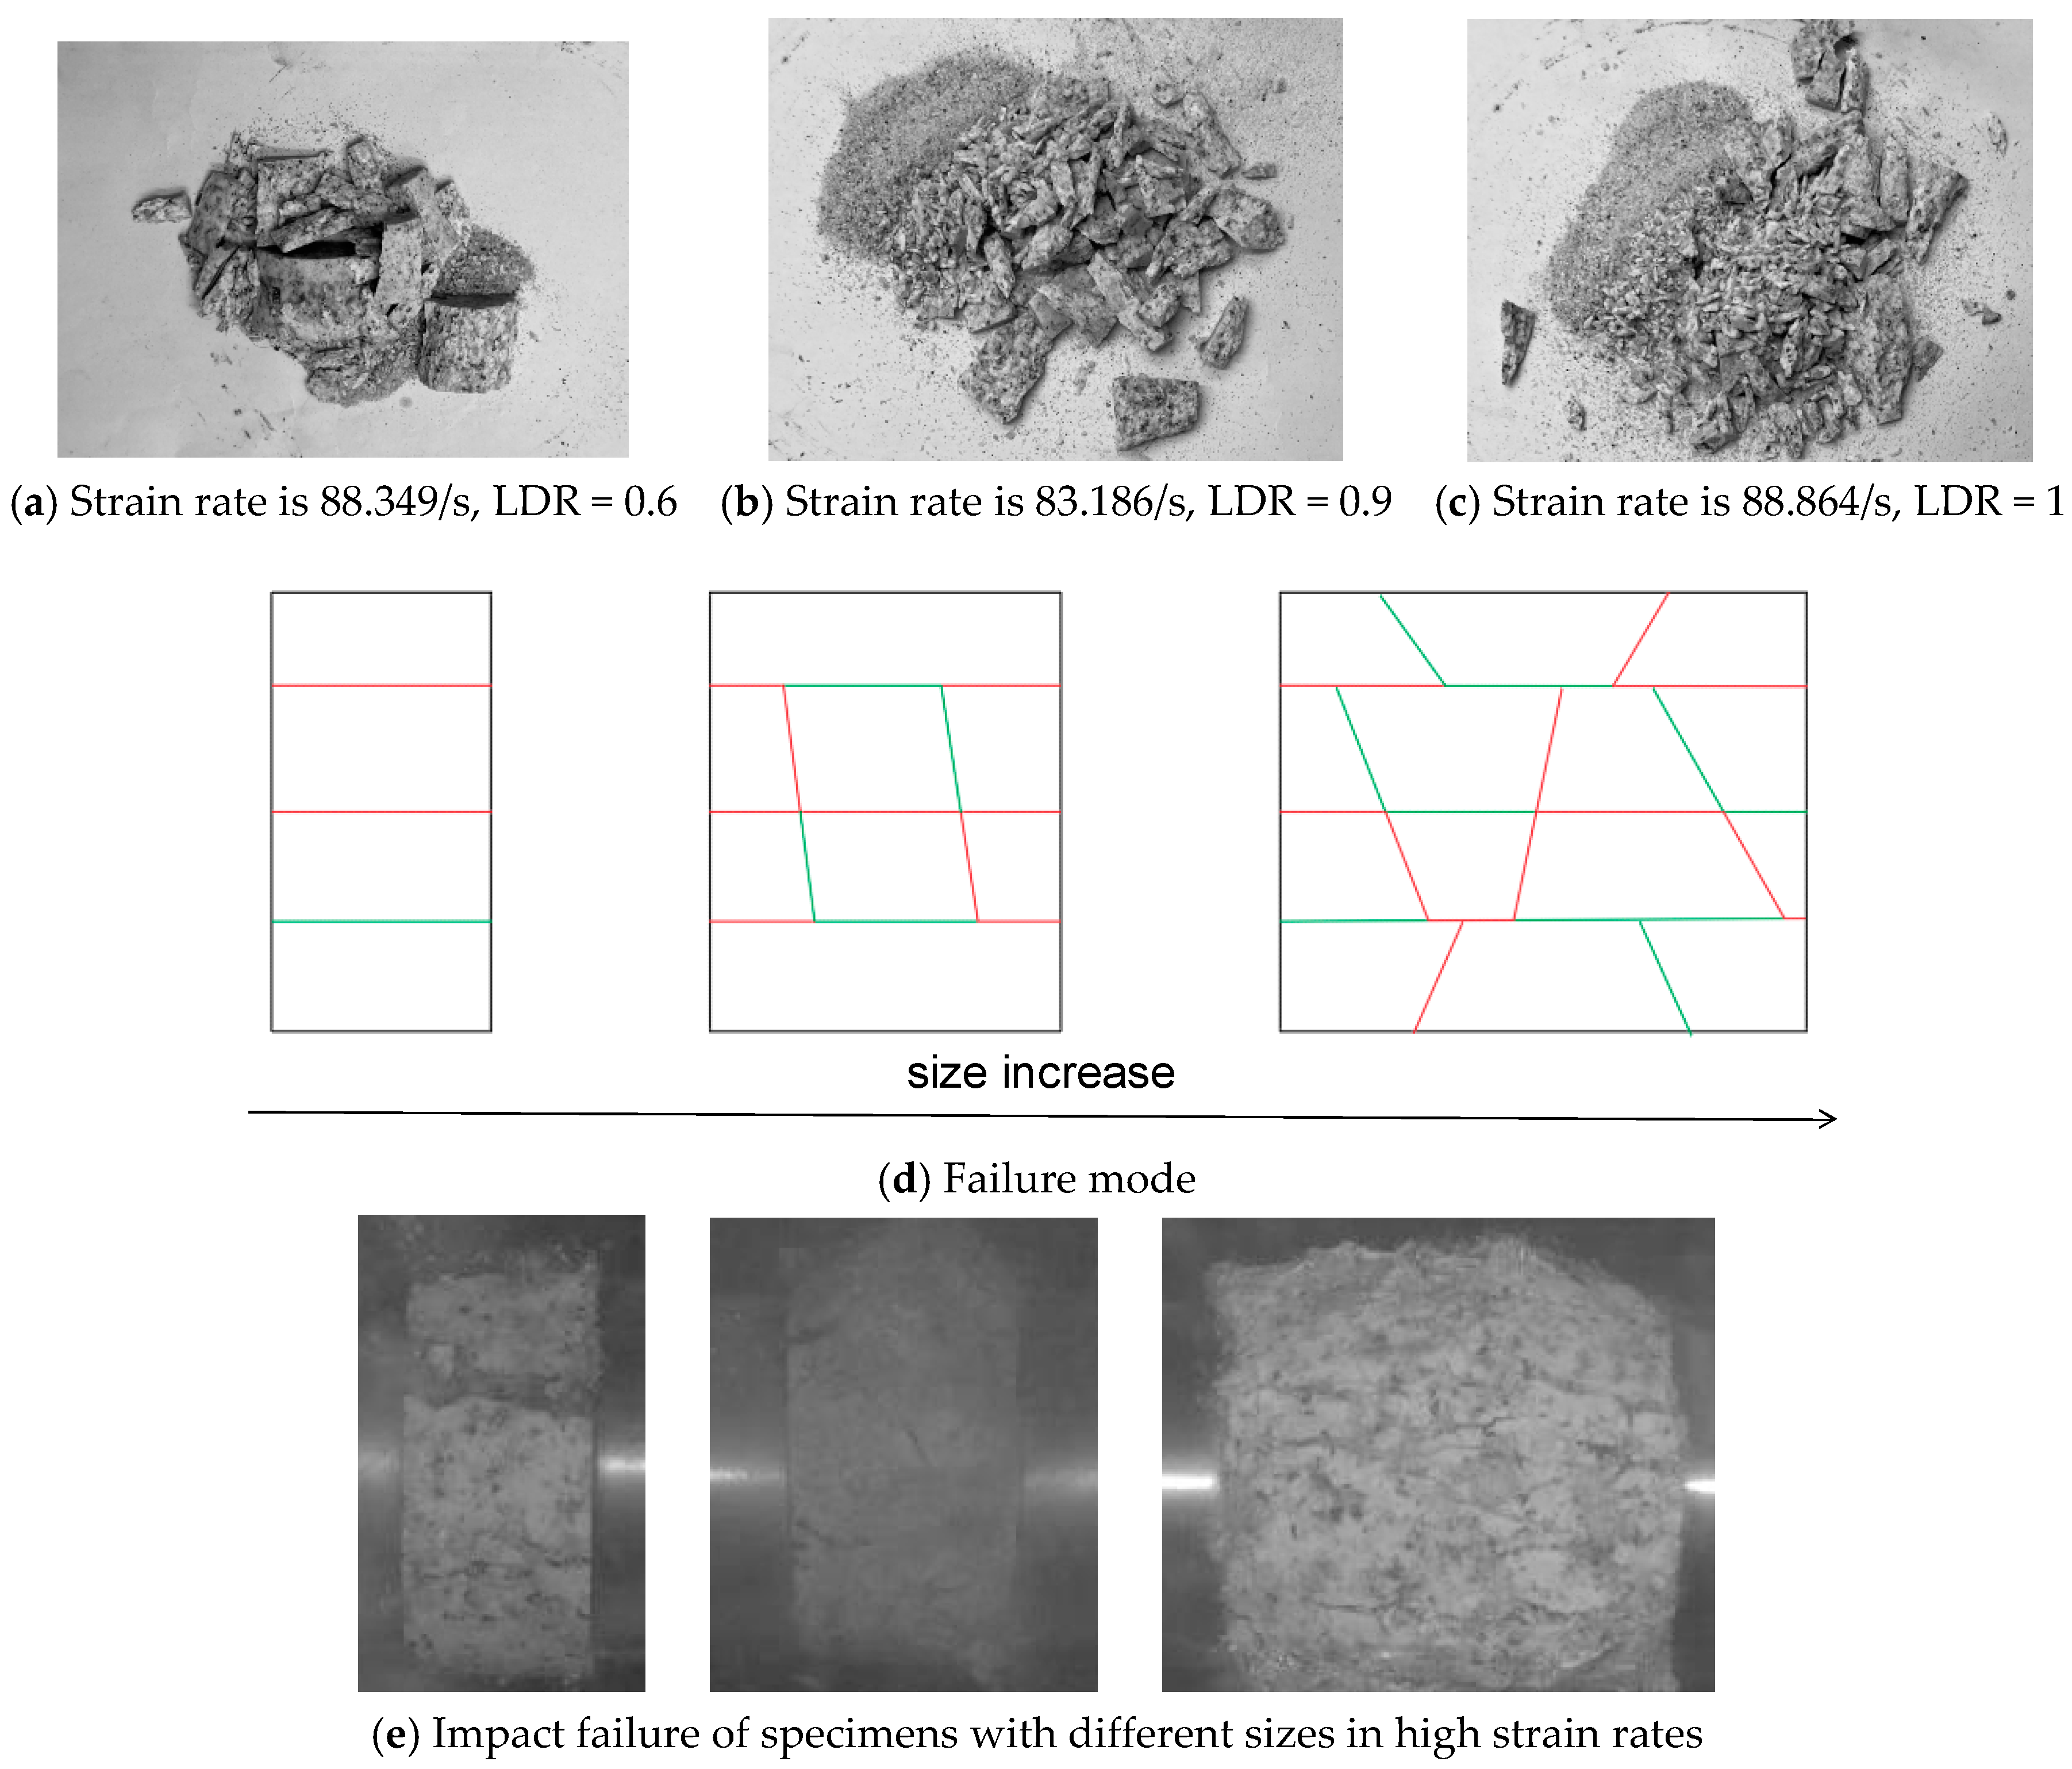
3.3. Failure Mode of Rock with Different Sizes

Comparing the failure modes of granite specimens at different strain rates, fragment size was found to have a direct influence on strain rate. The failure modes of the granite specimens with different sizes were similar [20], indicating that the size of specimen does not affect the failure mode of the specimen. As shown in Figure 5a–c, the failure mode of the rock depended on the strain rate, the higher the strain rate, the smaller the debris size of the specimens.
The fracture mechanism of granite can be explained by the crystal failure mode [24], which can be divided into two fracture types, crack penetration between one crystal and another crystal, and crack propagation within the crystal. The failure mode of the granite changed with the increase in strain rate. Under low strain rate impact conditions, intergranular cracks appeared initially through many inherent microcracks in the specimen, and the broken fragments of the specimen were split into several large pieces (Figure 5a). With the increase in strain rate, the intergranular cracks expanded greatly, and the specimen produced more fragments (Figure 5b). When the strain rate was further increased, many cracks were fully expanded, and the specimen was further broken into finer particles (Figure 5c). Figure 5d shows the schematic failure modes of granite under different strain rates. When these specimens were the same size, the strain rate of the specimens increased, the impact energy of the specimens increased. As shown in Figure 5e, the fragment sizes were also smaller.
When a specimen is impacted at the same strain rate, the larger the specimen size is, the finer the specimen fragments. The fracture of specimens with a strain rate of about 88/s and height-to-diameter ratios of 0.6, 0.9 and 1 are shown in Figure 6a–c. The three failure modes of the specimens with increasing size are shown in Figure 6d. As the size increases, the number of fragment also increases. Under certain impact conditions, the LDR change can influence the strain rate. When the strain rate is constant in these differently sized specimens, the bigger sized specimens are hit by the larger energy. As shown in Figure 6e, the fragment sizes are also smaller.
The relationship between strain rate and the size of the specimen is shown in Figure 7. Under the same strain rate, specimens of a larger size correspond to the larger impact load; that is, when a set impact has larger energy, greater energy used for the fracture of the specimen, and the size of the fragments is smaller. Under the same impact conditions, the strain rate decreases as the specimen size increases.

4. Theoretical Analysis of Granite Size Effect

By adopting probability statistics and set experiments [20,25,26,27], the dynamic strength–size effect of rock was studied. As shown in Figure 8, the rock strength law is the influence of size effect coupled with the strain rate effect. As strain rate increases, the rock strength increases. Under dynamic loading, the granite specimens were impacted. When the specimen size was different, the strain rate of the specimen changed.
This paper makes some revisions to paper [28]. The weakest-link model is widely applied to analyze the strength–size effect of brittle or quasi-brittle materials. The distribution function and probability density function are as follows [1,14],
P ( σ ) = 1 exp σ σ u σ 0 m
p ( σ ) = m σ 0 σ σ u σ 0 m 1 exp ( σ σ u σ 0 m )
The three-parameter Weibull distribution function considering the static size effect is as follows:
P ( σ ) = 1 exp [ V V V 0 σ σ u σ 0 m d V V 0 ]
Deducing the corresponding probability density is as follows:
p ( σ ) = V V 0 m σ 0 σ σ u σ 0 m 1 exp ( V V 0 σ σ u σ 0 m )
where   are Macaulay brackets, σ is the peak strength, σ 0 is the scale parameter, σ u is the lowest of σ , σ u σ , and m is the homogeneity of the material, where m > 1, V is the specimen volume, V0 is the specimen reference volume.
For calculating convenience [14], by assuming σ u = 0 , and only considering the two parameters in the formula, the failure probability density and failure probability of granite are as follows:
p ( σ ) = V V 0 σ σ 0 m exp ( V V 0 σ σ 0 m )
P ( σ ) = 1 exp ( V V 0 σ σ 0 m ) ( σ 0 )
Average failure strength of rock is as follows:
σ = σ d P ( σ )
Substituting Equation (8) into Equation (9), and working out the failure average strength of granite is as follows:
σ = σ 0 ( V / V 0 ) 1 / m Γ ( 1 + 1 / m )
where Γ represents the gamma function.
The specimens have a constant diameter, that is, Equation (10) can be written as follows,
σ = σ 0 ( L / L 0 ) 1 / m Γ ( 1 + 1 / m )
where L is the specimen length, L0 is the specimen reference length, assumed as 20 mm.
This assumes σ 1 = σ 0 Γ ( 1 + 1 m ) , by taking the logarithm on Equation (11), it can be written as follows:
ln σ = ln σ 1 1 m ln ( L / L 0 )
Taking the quasi-static compressive strength of the experimental value into formula (12), and then taking the least square method, calculated m is 6.38. The homogenization value of granite is from 4.6 to 23 [29]. After solving Equation (12), taking the calculated value to draw a curve, the law of the static rock strength–size effect is as shown in Figure 9. The test values and the theoretical values are close. When rock is under static comprehension load, the strength is inversely proportional to the size of the rock, and as the size of the rock increases, the strength gradually decreases.
Studying rock strength under dynamic loading, it is necessary to consider both the size effect of the material and the inherent strain-rate effect of material. The law of the dynamic strength–size effect is different from the static strength–size effect [30]. There is the critical-strain rate value; when the strain rate is smaller, the influence of specimen size on strength plays a leading role. When the strain rate is higher, the strain rate of the rock plays a leading role, because with an increase in strain rate, strength increases.
Considering the influence factors strain rate and size, the improved formula is introduced [17], and the failure probability density function and failure probability of granite can be modified as follows:
p ( σ ) = L L 0 α ln ( ε 0 . / ε . ) m σ a σ σ a m 1 exp [ L L 0 α ln ( ε 0 . / ε . ) σ σ a m ]
P ( σ ) = 1 exp [ V V 0 V V 0 α ln ( ε . 0 / ε . ) σ σ a m ]
where ε . is the strain rate, and ε . 0 is the critical strain rate [31], it takes 76/s. α is the strain rate effect correction factor, σ a is the dynamic scale parameter, m is not related to strain rate or rock size [17,29], m is 6.38.
Substituting Equation (14) into Equation (9) to calculate the average failure strength of granite as follows:
σ = σ a ( L L 0 ) α m ln ( ε . / ε 0 . ) Γ ( 1 + 1 / m )
ln σ = ln σ a Γ ( 1 + 1 / m ) + α m ln ( L / L 0 ) ln ( ε / ε 0 . . )
Using the test data, Equation (16) can be analyzed by linear least square method, and taking the parameter estimation method to calculate σ a is 245 MPa and α is 11.6. By substituting it into Equation (16), the rock strength can be deduced, as shown in Figure 10.
As shown in Figure 10, the regular size effect in dynamic loading is different from that in static loading. As the size increases, the rock strength increases. As the strain rate increases, the rock strength increases. For the larger sized specimens, the sensitivity of the strain rate is higher.

5. Conclusions

(1) By impacting granite specimens of different LDRs, the experimental results show that the influence of strain rate on rock strength is inversely the influence of size on rock strength; the DIF value increases with the increase in strain rate.
(2) As shown in the dynamic stress–strain curve, as size increases, the curve slope also becomes a larger of stress–strain curve of the same strain rate. As the strain rate increases, the curve slope also becomes a larger of stress–strain curve for the same size.
(3) The rock strength increases as the strain rate increases. Under the same strain-rate conditions, the rock strength also increases with the increase in specimen size, and with the increase in strain rate, the broken specimen produces more fragments.
(4) The dynamic strength of rock is the coupling of the size effect with the strain rate effect. Based on the Weibull static-size effect formula, the improved formula considers strain rate, which can explain the relationship between rock strength, size and strain rate under impact loading. The larger the size, the greater the rock strength. As the strain rate increases, the rock strength increases.

Author Contributions

Conceptualization, G.Z.; methodology, J.Z.; software, L.M.; validation, X.C. and W.X.; formal analysis, C.L.; investigation, J.Z.; resources, J.Z.; data curation, J.Z.; writing—original draft preparation, J.Z.; writing—review and editing, J.Z.; visualization, J.Z.; supervision, G.Z.; project administration, X.M.; funding acquisition, X.M. All authors have read and agreed to the published version of the manuscript.

Funding

This work was supported by the National Natural Science Foundation of China (Grants Nos. 51974009 and 52004006). Key Research and Development Projects in Anhui Province (Grant No. 201904A07020010) and Leading Talents Project of Anhui Province’s “Special Support Plan” (T00508). Research Fund for Academic and Technology Leaders of Anhui Province (2018D187).

Data Availability Statement

The data used to support the findings of this study have not been made available because the experimental data involved in the paper are all obtained based on the authors’ designed experiments and need to be kept confidential; they are still using the data for further research.

Conflicts of Interest

The authors declare that they have no conflict of interest.

References

  1. Ganji, M.; Bevrani, H.; Hami Golzar, N.; Zabihi, S. The weibull–rayleigh distribution, some properties, and applications. J. Math. Sci. 2016, 218, 269–277. [Google Scholar] [CrossRef]
  2. Man, H.K.; Mier, J. Damage distribution and size effect in numerical concrete from lattice analyses. Cem. Concr. Compos. 2011, 33, 867–880. [Google Scholar] [CrossRef]
  3. Hoover, C.G.; Bažant, Z.P. Cohesive crack, size effect, crack band and work-of-fracture models compared to comprehensive concrete fracture tests. Int. J. Fract. 2014, 187, 133–143. [Google Scholar] [CrossRef] [Green Version]
  4. Wang, X.; Kang, H.; Gao, F.; Zhao, K. Discrete element simulation of mechanical behavior of large jointed coal under uniaxial compression. J. China Coal Soc. 2018, 43, 3088–3097. [Google Scholar]
  5. Carpinteri, A. Scaling laws and renormalization groups for strength and toughness of disordered materials. Int. J. Solids Struct. 1994, 31, 291–302. [Google Scholar] [CrossRef]
  6. Wang, P.; Ren, F.; Cai, M. Direct Shear and size effect characteristics of rough jointed rock mass based on Discrete element Method. J. China Coal Soc. 2018, 43, 976–983. [Google Scholar]
  7. Bažant, Z.P. Scaling of quasi-brittle fracture and the fractal question. J. Eng. Mater. Technol. 1995, 117, 361–367. [Google Scholar] [CrossRef]
  8. Chen, P.; Liu, C.; Wang, Y. Size effect on peak axial strain and stress-strain behavior of concrete subjected to axial compression. Constr. Build. Mater. 2018, 188, 645–655. [Google Scholar] [CrossRef]
  9. Liu, F.; Li, Q.M. Strain-rate effect on the compressive strength of brittle materials and its implementation into material strength model. Int. J. Impact Eng. 2019, 130, 113–123. [Google Scholar] [CrossRef]
  10. Meng, Q.; Zhang, M.; Han, L.; Pu, H.; Li, H. Effects of size and strain rate on the mechanical behaviors of rock specimens under uniaxial compression. Arab. J. Geosci. 2016, 9, 527. [Google Scholar] [CrossRef]
  11. Kao, S.; Zhao, G.; Xu, W.; Cheng, X.; Dong, C.; Zhang, R. Experimental study of the association between sandstone size effect and strain rate effect. J. Mech. Sci. Technol. 2020, 34, 3597–3608. [Google Scholar] [CrossRef]
  12. Liu, B.; Zhang, J.; Du, Q. Size effect of rock compressive strength. Chin. J. Rock Mech. Eng. 1998, 17, 611–614. [Google Scholar]
  13. Kao, S.; Zhao, G.; Xu, W.; Cheng, X.; Dong, C.; Zhang, R. Experimental and theoretical study on size effect of rock material. Eng. Mech. 2005, 34, 112–118. [Google Scholar]
  14. Zhang, M.; Lu, Y.; Yang, Q. Failure probability and strength size effect of quasi-brittle materials. Chin. J. Rock Mech. Eng. 2010, 29, 1782–1789. [Google Scholar]
  15. Wang, C.; Chen, W.; Hao, H.; Zhang, S.; Song, R.; Wang, X. Experimental investigations of dynamic compressive properties of roller compacted concrete (RCC). Constr. Build. Mater. 2018, 168, 671–682. [Google Scholar] [CrossRef]
  16. Gong, F.; Wang, J.; Li, X. The rate effect of compression characteristics and a unified model of dynamic increasing factor for rock materials. Chin. J. Rock Mech. Eng. 2018, 37, 1586–1595. [Google Scholar]
  17. Wang, X.H.; Zhang, S.R.; Wang, C.; Song, R.; Shang, C.; Fang, X. Experimental investigation of the size effect of layered roller compacted concrete (RCC) under high-strain-rate loading. Constr. Build. Mater. 2018, 165, 45–57. [Google Scholar] [CrossRef]
  18. CEB (Comite Euro-international du Beton). Concrete Structures under Impact and Impulsive Loading; Bulletin d’Information, No. 187; CEB Comite’ Euro International du Beton: Lausanne, Switzerland, 1988. [Google Scholar]
  19. Elfahal, M.M.; Krauthammer, T.; Ohno, T.; Beppu, M.; Mindess, S. Size effect for normal strength concrete cylinders subjected to axial impact. Int. J. Impact Eng. 2005, 31, 461–481. [Google Scholar] [CrossRef]
  20. Zhao, G.; Zhou, J.; Meng, X.; Kao, S. Study on the length to diameter ratio of granite specimen and its impact dynamic characteristic. Chin. J. Rock Mech. Eng. 2021, 40, 1392–1401. [Google Scholar]
  21. Riedel, W.; Thoma, K.; Hiermaier, S. Penetration of Reinforced Concrete by BETA-B-500 Numerical Analysis Using a New Macroscopic Concrete Model for Hydrocodes; Proc 9; ISIEMS: Berlin, Germany, 1999; pp. 315–322. [Google Scholar]
  22. Li, Q.M.; Meng, H. About the dynamic strength enhancement of concrete-like materials in a split Hopkinson pressure bar test. Int. J. Solids Struct. 2003, 40, 343–360. [Google Scholar] [CrossRef]
  23. Grady, D.E.; Lipkin, J. Criteria for impulsive rock fracture. Geophys. Res. Lett. 1980, 7, 255–258. [Google Scholar] [CrossRef]
  24. Liu, L.; Li, H.; Li, H.; Zhang, G.; Wu, R. Mechanical properties of heterogeneous rock under uniaxial compression based on mineral crystal model. Chin. J. Geotech. Eng. 2020, 42, 542–550. [Google Scholar]
  25. Zhai, Y. Experimental study on size effect of probability Distribution of compressive strength in red Sandstone. Chin. J. Rock Mech. Eng. 2022, 41 (Suppl. S1), 2649–2657. [Google Scholar]
  26. Qi, C.; Wang, M.; Bai, J.; Wei, X.; Wang, H. Investigation into size and strain rate effects on the strength of rock-like materials. Int. J. Rock Mech. Min. Sci. 2016, 86, 132–140. [Google Scholar] [CrossRef]
  27. Chen, X.; Wu, S.; Zhou, J. Compressive Strength of Concrete Cores under High Strain Rates. J. Perform. Constr. Facil. 2015, 29, 06014005. [Google Scholar] [CrossRef]
  28. Zhou, J.; Meng, X.; Liu, C.; Liu, Z.; Xu, W.; Cheng, X. Study on the Rock size effect of quasistatic and dynamic compression characteristics. Adv. Mater. Sci. Eng. 2021, 2021, 9974606. [Google Scholar] [CrossRef]
  29. Bandis, S.C. Scale effects in the strength and deformability of rocks and rock joints. In Proceedings of the First International Workshop on Scale Effects in Rock Masses, Loen, Norway, 7–8 June 1990; Da, C.H., Ed.; A. A. Balkema: Avereest, The Netherlands, 1990; pp. 50–76. [Google Scholar]
  30. Yu, W. Size Effect of Dynamic Compression and tensile Failure of Concrete: Mesoscopic Simulation. Ph.D. Thesis, Beijing University of Technology, Beijing, China, 2019; pp. 27–29. [Google Scholar]
  31. Olsson, W.A. The compressive strength of tuff as a function of strain rate from 10−6 to 103/sec. Int. J. Rock Mech. Min. Sci. Geomech. Abstr. 1991, 28, 115–118. [Google Scholar] [CrossRef]
Figure 1. SPHB experimental device.
Minerals 13 00043 g001
Figure 2. Static rock strength of different sizes.
Minerals 13 00043 g002
Figure 3. Comparison between experimental DIF values and the empirical model’s values [18,21,22,23].
Minerals 13 00043 g003
Figure 4. Stress–strain curve.
Minerals 13 00043 g004
Figure 5. Influence of strain rate on specimen crushing.
Minerals 13 00043 g005
Figure 6. Influence of size on specimen crushing.
Minerals 13 00043 g006
Figure 7. Relationship between strain rate and size.
Minerals 13 00043 g007
Figure 8. Rock strength law with size effect and strain-rate effect coupled.
Minerals 13 00043 g008
Figure 9. Size effect of rock strength under static loading.
Minerals 13 00043 g009
Figure 10. Size effect of dynamic rock strength.
Minerals 13 00043 g010
Table 1. Dynamic loading mechanical parameters of specimens.
LDR.Strain Rate/s−1Strength/MPa
188.864410.903
75.891356.125
52.901237.821
0.9100.865420.875
83.186358.403
61.296257.603
0.8111.081401.27
97.116349.65
68.154260.396
0.7128.547422.273
112.117348.25
77.150260.396
0.6147.866415.975
128.108346.678
88.349249.575
0.5184.648407.925
163.532334.25
107.749240.63
Disclaimer/Publisher’s Note: The statements, opinions and data contained in all publications are solely those of the individual author(s) and contributor(s) and not of MDPI and/or the editor(s). MDPI and/or the editor(s) disclaim responsibility for any injury to people or property resulting from any ideas, methods, instructions or products referred to in the content.

