Article

Effects of Salinity and pH on Clay Colloid Aggregation in Ion-Adsorption-Type Rare Earth Ore Suspensions by Light Scattering Analysis

Department of Metallurgy, College of Vanadium and Titanium, Panzhihua University, Panzhihua 617000, China
*
Author to whom correspondence should be addressed.
Minerals 2023, 13(1), 38; https://doi.org/10.3390/min13010038
Submission received: 2 November 2022 / Revised: 13 December 2022 / Accepted: 24 December 2022 / Published: 26 December 2022

Abstract

:
Ion-adsorption-type rare earth ores (IREOs) are an indispensable strategic resource. Rare earths can be extracted from IREOs by means of in situ leaching, which is strongly influenced by the migration of clay components. In order to clarify the effect of the interaction between mineral particles on the rare earth leaching process, the aggregation of IREO colloids was investigated in suspension after NaCl concentration and pH value were disturbed based on a light scattering method. The results show that IREO colloids are prone to unstable aggregation, which can be affected by salinity and pH in suspension. Combined with the analysis of the surface acid–base properties and the zeta potential of the IREO colloids, the long-range electrostatic attraction between mineral heterogeneous charge surfaces plays a leading role in the interaction between mineral particles. In suspension, electrolyte concentration and pH can adjust the strength of the electrostatic force and the force field overlapping between the surface double electric layers to influence the aggregation of the IREO colloids. The above conclusion can enrich and supplement the rare earth extraction theory, which has a certain guiding significance for green exploitation of IREOs.

1. Introduction

As they are rich in middle and heavy rare earths, ion-adsorption-type rare earth ores (IREOs) are an indispensable strategic resource for modern science and technology [1]. Rare earth elements (REEs) in IREOs are mainly adsorbed in ionic form in kaolinite-based clay minerals [2]. The ion-exchange adsorption properties of minerals are the theoretical basis for the extraction of REEs [3].
In recent years, the rare earth leaching process has been directly approximated as a chemical exchange between ions in solution and rare earth ions on the adsorption sites on the mineral surface [4,5]. However, this reaction model can hardly explain some anomalies in the leaching process of rare earths. For example, NH4+ shows superior leaching ability compared to other high-valent ions (e.g., Fe3+ and Mg2+) [6]. The use of acidic electrolyte leaching causes a decrease in the leaching rate of rare earths, which is also contrary to the strong exchange capacity of H+ [7], etc. This indicates that the theory of rare earth leaching still needs to be improved. The clay component of IREOs is mainly kaolinite, and in addition to the chemical reaction of ions on the mineral surface, the influence of the interaction between mineral particles on the leaching process should also be considered, but there is little research in this area.
In industrial production, the in situ leaching process is mostly used for the extraction of REEs from IREOs. Numerous studies have found that ore body particles will migrate during in situ leaching, which will lead to the existence of ore body pores, thus affecting the ore body permeability [8,9]. From the existing studies, it can be determined that the generation of pores in the leaching process of ionic rare earth is the cause of the change in mineral permeability, while there is little analysis on the interaction between mineral particles, the fundamental cause of mineral migration in the leaching process. Further theoretical research is still needed to develop hard-to-permeate IREOs and to prevent the mine disasters caused by the clay particle migration.
In solution, the properties (e.g., solution viscosity and electrical conductivity) of clay minerals ranging from 1 nm to 2 μm demonstrate colloid-like characteristics. Additionally, such clay minerals are generally referred to as clay colloids [10,11]. The physical and chemical properties of clay colloids play an important role in the interaction between clay particles [12]. The interaction between particles can be analyzed based on Deryagin–Landau–Verwey–Overbeek theory (DLVO theory) [11]. The electrostatic repulsion and van der Waals force between colloidal particles govern the interaction between colloidal particles in the dispersion system. When the electrostatic repulsion between the particles is greater than the van der Waals force and is sufficient to prevent the collisional aggregation caused by the Brownian motion of colloidal particles, the colloidal particles are dispersed; when the interparticle van der Waals force is greater than the repulsive electrostatic repulsion, the aggregation of colloidal particles occurs [13]. For the analysis of the interaction between kaolinite-like clay minerals, the extended DLVO theory that takes into account hydration is frequently utilized [14].
The salinity and pH of the solution affect the interaction between clay particles. Salinity can change the thickness of the double electric layer on the mineral surface and thus affect the interaction distance between mineral particles [15,16,17]. The role of pH is relatively complex. For laminated silicate minerals, most clay particles (e.g., kaolinite and montmorillonite) are anisotropic and have two different surfaces. Therefore, three types of aggregation structure are formed with the change in solution pH, such as the face-to-face structure, the face-to-edge structure, and the edge-to-edge structure. In low-salinity solutions, this encourages the formation of relatively stable three-dimensional structures as the aggregation of minerals occurs. In kaolinite, for example, the faces of its silicon–oxygen tetrahedral crystal structures are negatively charged at pH > 4, while those of its aluminum–oxygen octahedral crystal structures were positively charged at pH < 6 and are negatively charged when pH > 8 [18,19,20,21]. Thus, under acidic or neutral conditions, different surfaces of kaolinite demonstrate a large potential difference, which leads to its agglomeration by the interaction of electric double layers among different surfaces. Under alkaline conditions, the surfaces of kaolinite have strong negative charges, and kaolinite will be dispersed due to the repulsive effect of electric double layers. For illite, it will agglomerate in a three-dimensional structure at pH 3.0 due to the mutual attraction between the crystal edges and faces. When the solution pH is 5.0, some edge-to-edge structures appear in the suspension due to the obvious reduction in repulsion energy between crystal faces and edges. When the solution pH is higher than 6.0, the illite particles are dispersed [22]. Under neutral and acidic conditions, goethite is positively charged. Zhu et al. found that when clay minerals such as montmorillonite are added to goethite, goethite adsorbs on the mineral surface to act as a bridging link for mineral agglomeration [23,24,25]. When clay minerals contain iron and aluminum oxides, the adsorption of iron and aluminum oxide on the mineral surface affects the agglomeration between minerals. Zhu et al. found that the addition of goethite to clay minerals such as montmorillonite could act as a bridging link to the agglomeration between clay particles [26].
In mineral processing studies, zero point charge (ZPC) and zeta potentials of clay minerals are commonly used to analyze mineral aggregation. For kaolinite and montmorillonite, the ZPC and zeta potential are strongly influenced by the solution pH and salinity due to the anisotropy of the mineral surface. With these two parameters, the influence of the solution environment on the surface charge properties of minerals can be analyzed, and the effect of changes to the solution environment on the aggregation of minerals can be judged accordingly [27,28]. Considering the influence of the dynamic changes from the salinity and pH on the interaction between ore particles in in situ leaching, the dynamic aggregation behavior of particles with a particle size less than 2 μm in minerals was studied by applying the light scattering technology. The aggregation mechanism of the IREO is expounded in combination with the influence of solution pH and salinity on the surface charge properties of the ore body.

2. Experiments

2.1. Materials

IREOs were collected by means of drilling from the middle of the weathering layer of Xunwu rare earth mine in Ganzhou City, Jiangxi province, southern China. The raw ore was dissolved using strong acid and then the main chemical composition was analyzed using an inductively coupled plasma tandem mass spectrometer (Agilent 8800, US) for the determination of the main mineral composition. The results are listed in Table 1, and that indicates that the mineral composition of IREOs is silico-aluminum compounds, and the total amount of rare earth oxides (TREO) is 0.16%. The grade of rare earth meets the requirements of industrial mining.

2.2. Experimental Methods

2.2.1. Extraction of Clay Colloids from IREO

The IREOs were sieved to pass the 250 µm and prepared into pulp with deionized water. After ultrasonic dispersion, the pulp was transferred into a 10 L plastic bucket to dilute its concentration to approximately 6 wt.%. Then, the pulp was stirred up and down with a stirring rod 10 times before settling to the expected time. The pulp settling time was determined according to the settling rate of 2 μm ore particles. The sedimentation rate of the ore particles can be calculated using the Stoke formula (Equation (1)):
ν = 2 9 g r 2 ρ s ρ l η
where ν is the sedimentation rate of ore particles with radius r in water (cm·s−1). g is the acceleration of gravity (cm·s−2). r is ore particle radius (cm). ρs is the mineral particle density approximately 2.6 g·cm−3 with reference to soil density. ρl is the water density (g·cm−3). ƞ is the kinematic viscosity coefficient of water (g·cm−1·s−1).
At this time, a siphon glass tube was utilized to extract the upper mineral pulp and transfer it to another container, which was collected after sedimentation and drying at 60 degrees Celsius for 72 h. This is the IREO colloids. Deionized water was unceasingly injected into the original pulp barrel to the height of the original liquid level, and we repeated the above operation to extract mineral clay particles until the pulp residue in the barrel was transparent.

2.2.2. Mineral Composition and Surface Group Analysis

The IREO colloids composition was determined using an X-ray diffraction analyzer (Empyrean, Holland). Cu Kα1 radiation was used with a continuous scanning range from 10° to 90° and a scanning speed of 4°/min.
The surface group of IREO colloids was determined using an Fourier transform infrared spectroscopy (IRTracer-100, Japan). The IREO colloids were mixed with 74 µm KBr powder and pressed into tablets. The collided was examined at a spectral resolution of 2 cm−1.

2.2.3. Aggregation of IREO Colloids

IREO colloids were prepared into 0.1 g·kg−1 suspension with deionized water, and a laser particle size analyzer (Mastersize 3000, UK) was applied to measure the colloid particle size. When the original particle size of the extracted IREO colloids was measured, approximately 1 mL of 0.1 mol·kg−1 NaOH solution was used to adjust the suspension pH to approximately 9.5 to avoid colloid aggregation. Colloid aggregation behavior in suspension was studied by measuring colloid particle size at one-minute intervals using a recirculation feed. Particle size test results were expressed as 50% of colloidal volume particle size (Dv50).

2.2.4. Measurement of ζ Potential on IREO Colloids Surface

ζ potential on IREO colloids surface in 0.1 g·kg−1 suspension was measured by utilizing micro electrophoresis apparatus (JS94H2, China). During the measurement, each sample was repeated at least 5 times, and the error range was kept within ±2 mV.

2.2.5. Measurement of Acid and Alkali Adsorption on Mineral Surface

Potentiometric titration was performed by applying a potentiometric titrator (ZDJ-5B, China Thunder and Magnetic). During the measurement, we added 0.1 mol·kg−1 HCl or 0.1 mol·kg−1 NaOH drop at the rate of 0.05 mL·min−1 after adding 0.1 g·kg−1 IREO colloids with a certain concentration of sodium chloride solution to carry out acid–base titration, and recorded the change value of pH during the titration. Subsequently, we performed acid–base titration on the blank sample of sodium chloride solution (no IREO colloids suspension was added) in the same way. For the results of three sodium chloride concentration conditions, a curve was drawn with pH as the abscess coordinate and the amount of H+/OH adsorbed after the blank sample was deducted as the ordinate coordinate, which was the adsorption curve of the acid and base amount on the mineral surface under the condition of rapid titration.

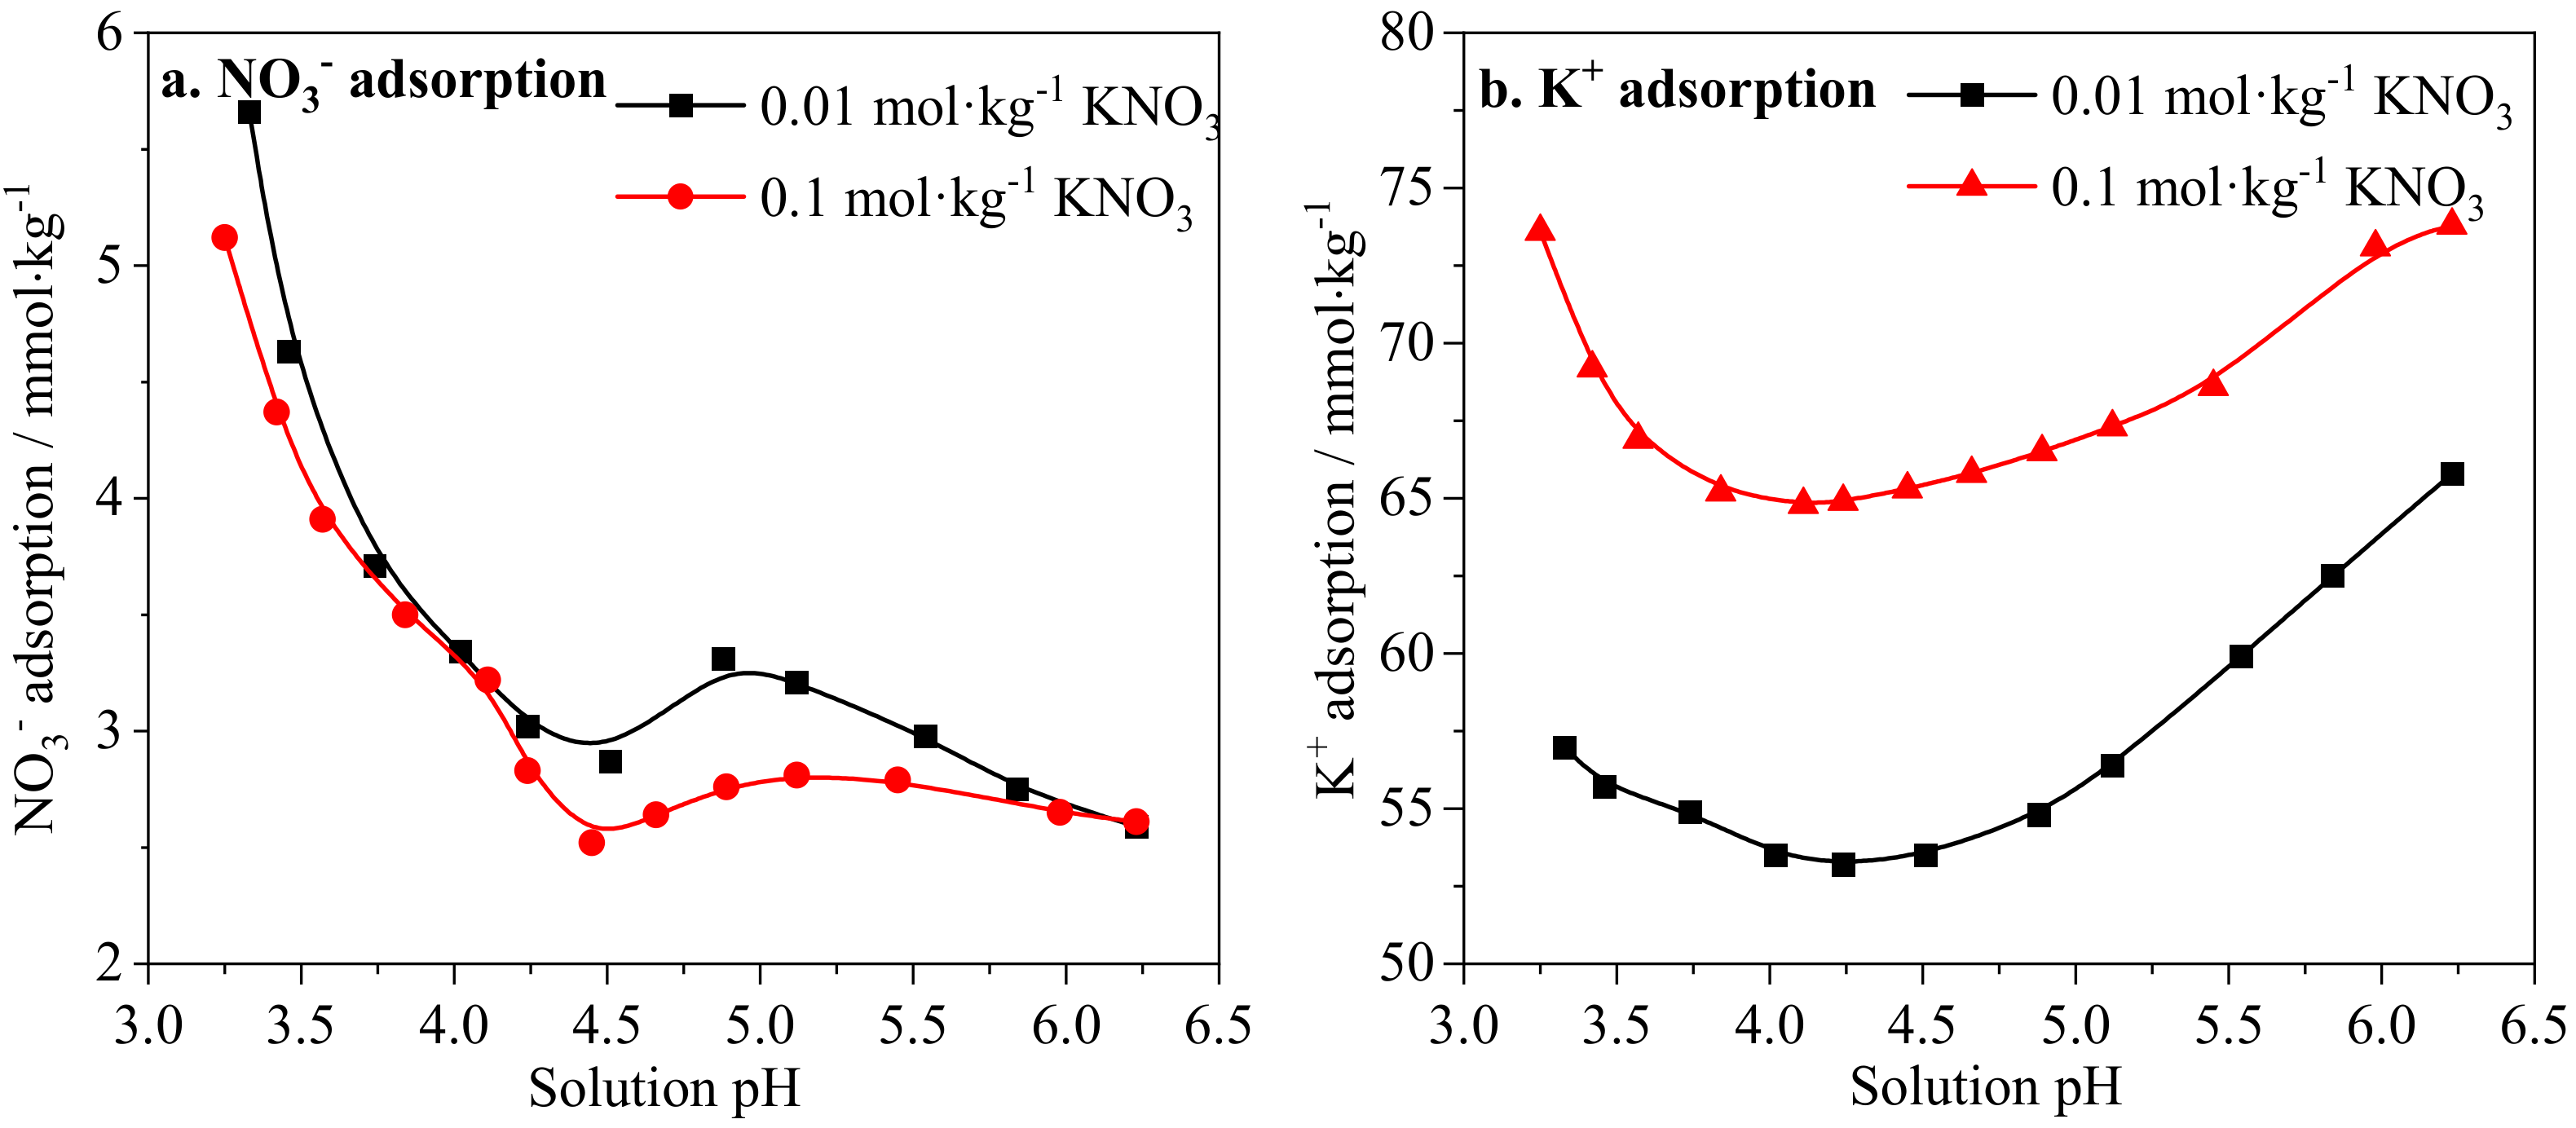
2.2.6. Ion Adsorption on IREOs

The 250 µm IREO colloids of 5.000 g were leached with 20 mL KNO3 solution approximately 10 min at room temperature by horizontal oscillation. After leaching the solid–liquid separation was carried out by centrifugation. In the leaching solution, the amount of K+ desorption was measured by ICP–MS, and NO3 desorption was determined by UV spectrometry at a wavelength of 220 nm. The amount of K+ adsorbed on the mineral surface was calculated by subtracting the amount of K+ in the solution before leaching from the amount of K+ in the solution after leaching. The amount of NO3 adsorbed on the mineral surface was used in the same way. The results of the above calculations are expressed as moles of adsorbed ions per kg of mineral soil.

3. Results and Discussions

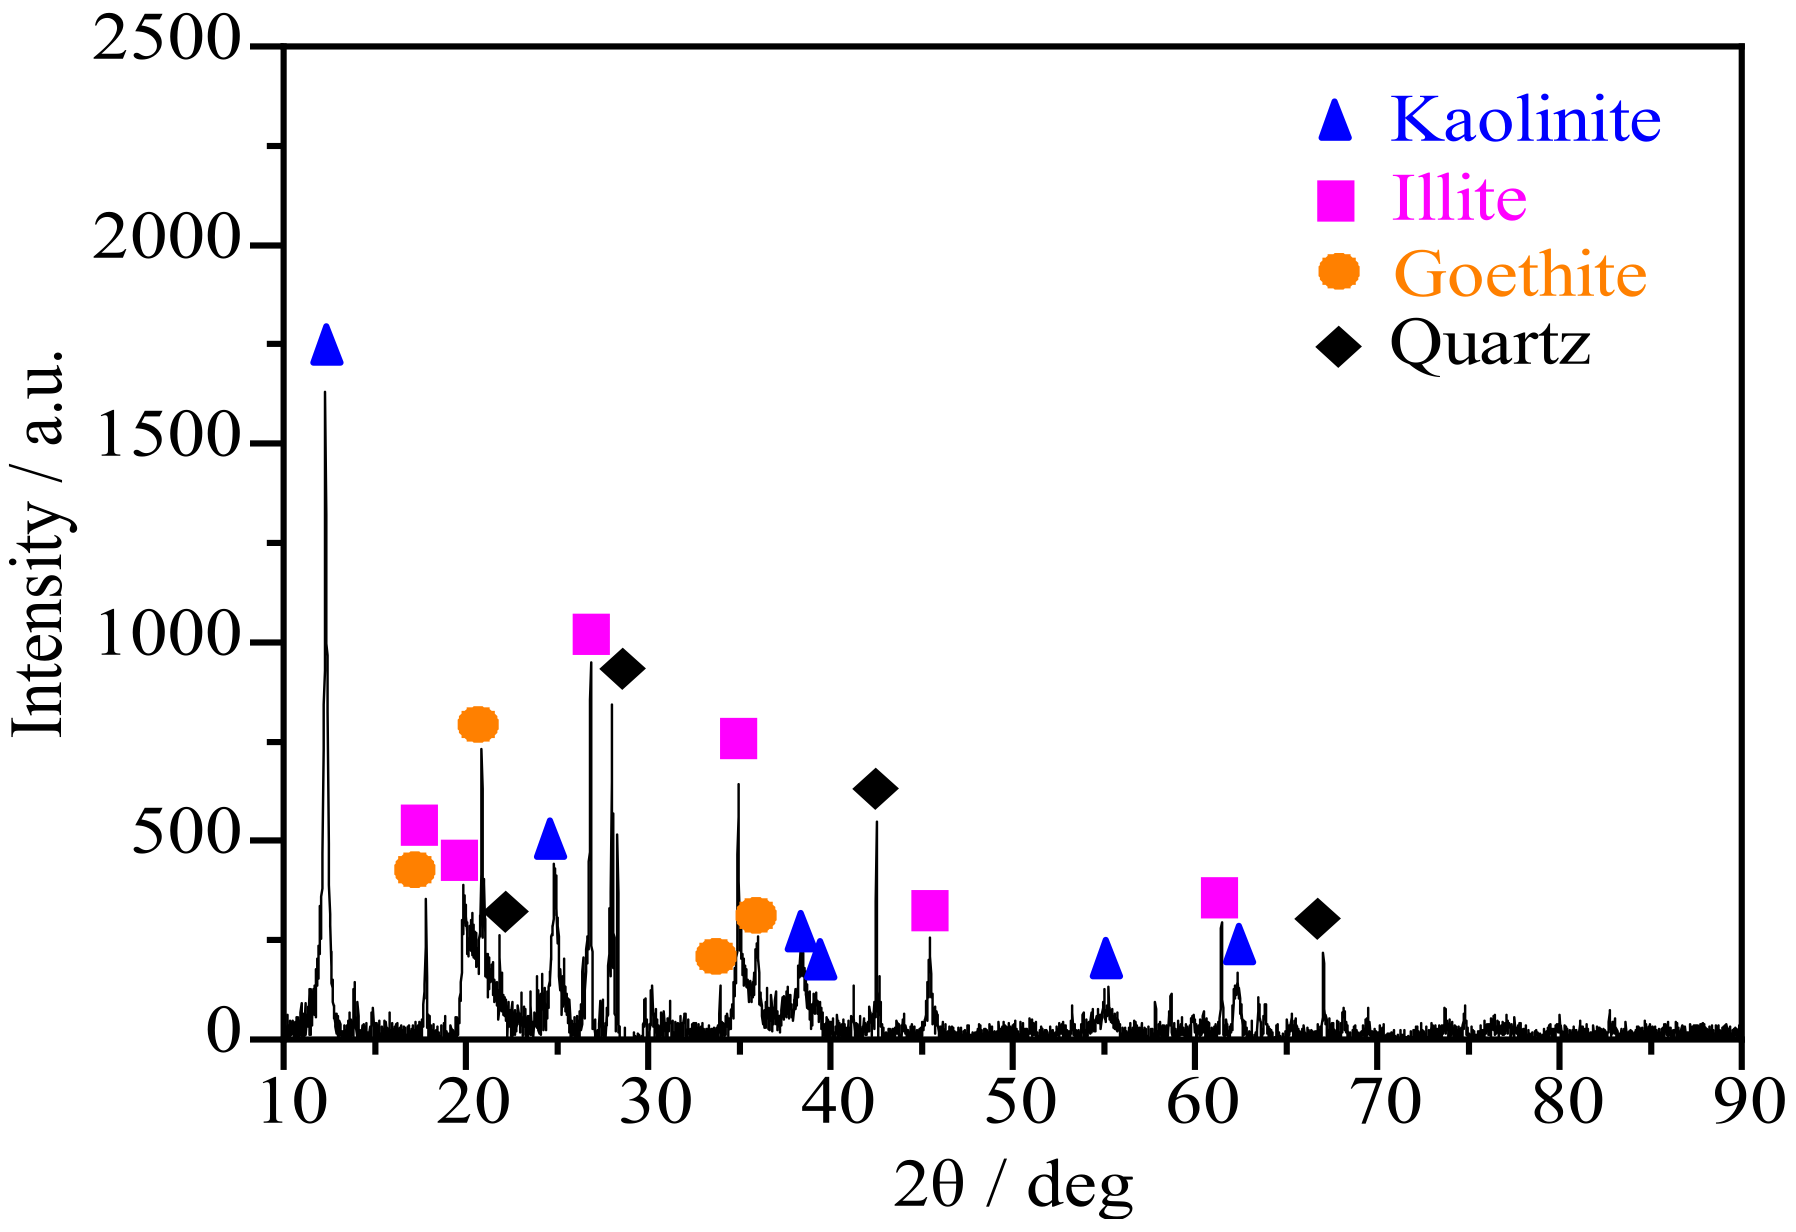
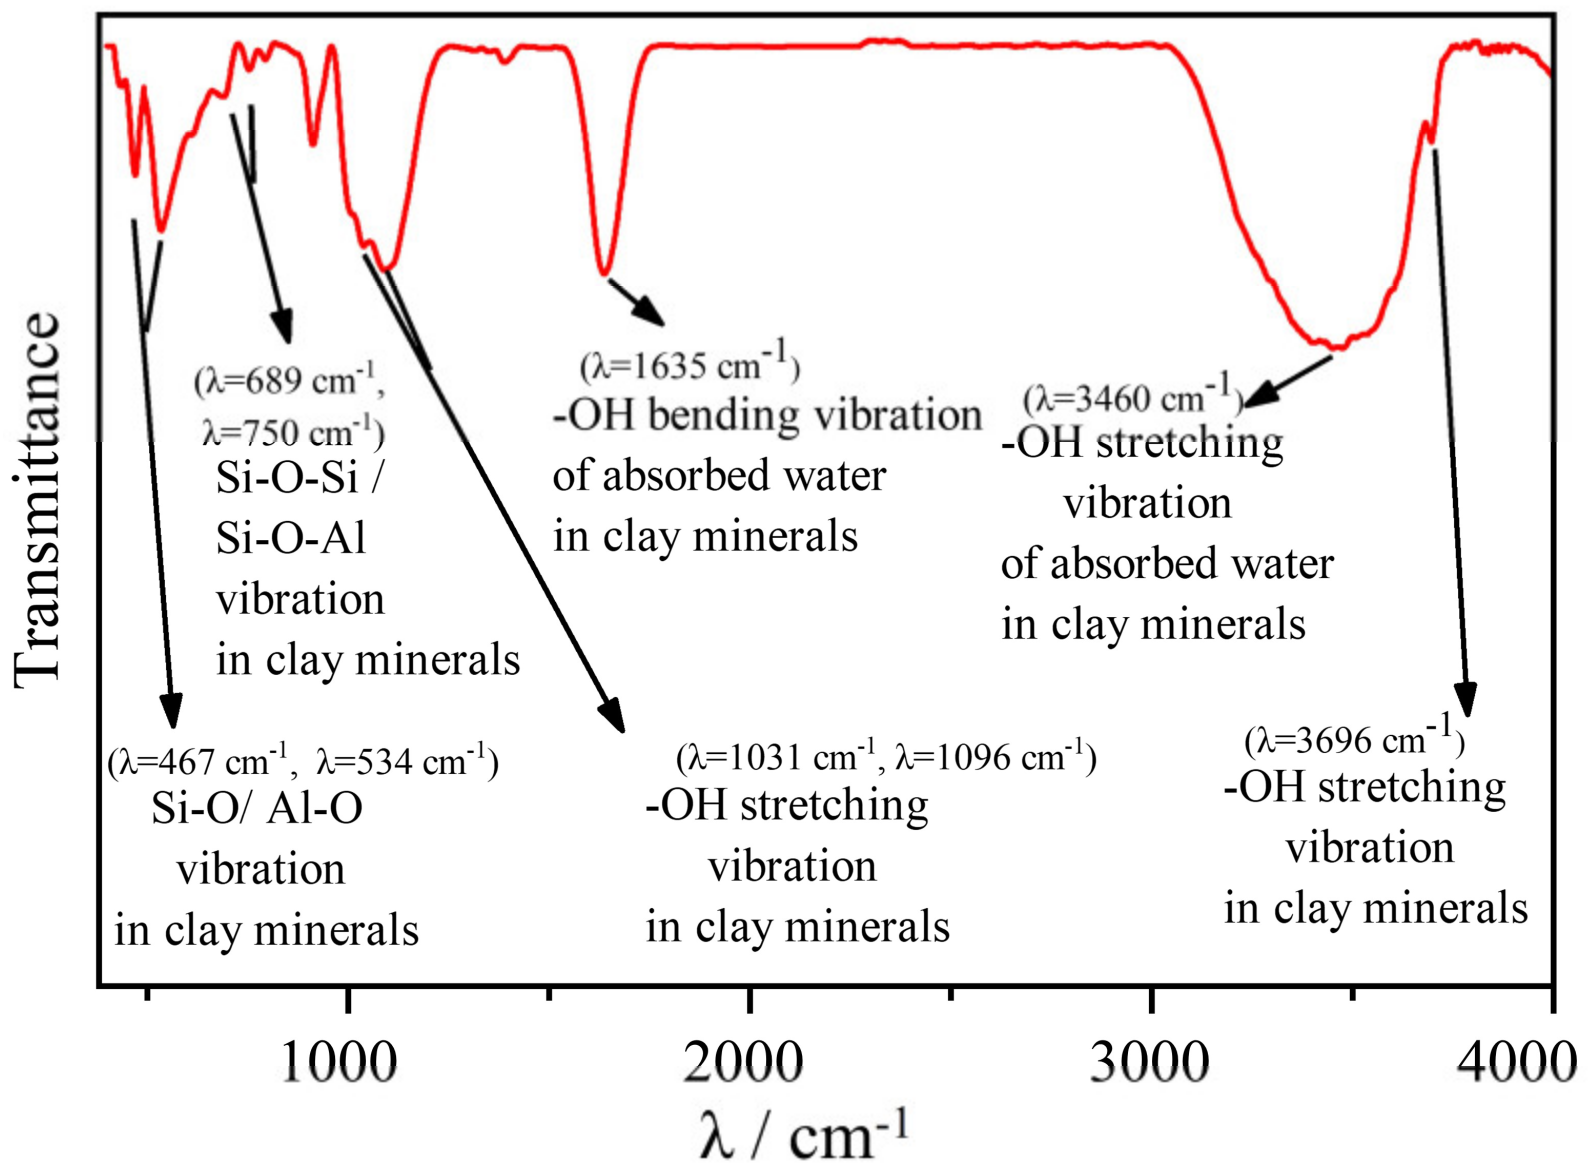
3.1. XRD and FTIR Results

Figure 1 shows the XRD patterns of ionic rare earth ore colloids extracted by the sedimentation method. The results show that the ionic rare earth ore colloid components are dominated by kaolinite and contain small amounts of illite and goethite, and it can be presumed that the IREO colloids surface reactive groups are mainly based on alcoholic hydroxyl groups [28,29]. In order to exclude the influence of other surface active groups (such as organic acid radical) in the ionic rare earth ore on the acid and alkali properties of the mineral surface, the IREO colloids surface active groups were analyzed by means of infrared spectroscopy. The results are shown in Figure 2, which further confirmed the alcohol hydroxyl group on the surface of IREO colloids is its active group, which is the site of the proton/deprotonation reaction on the mineral surface.

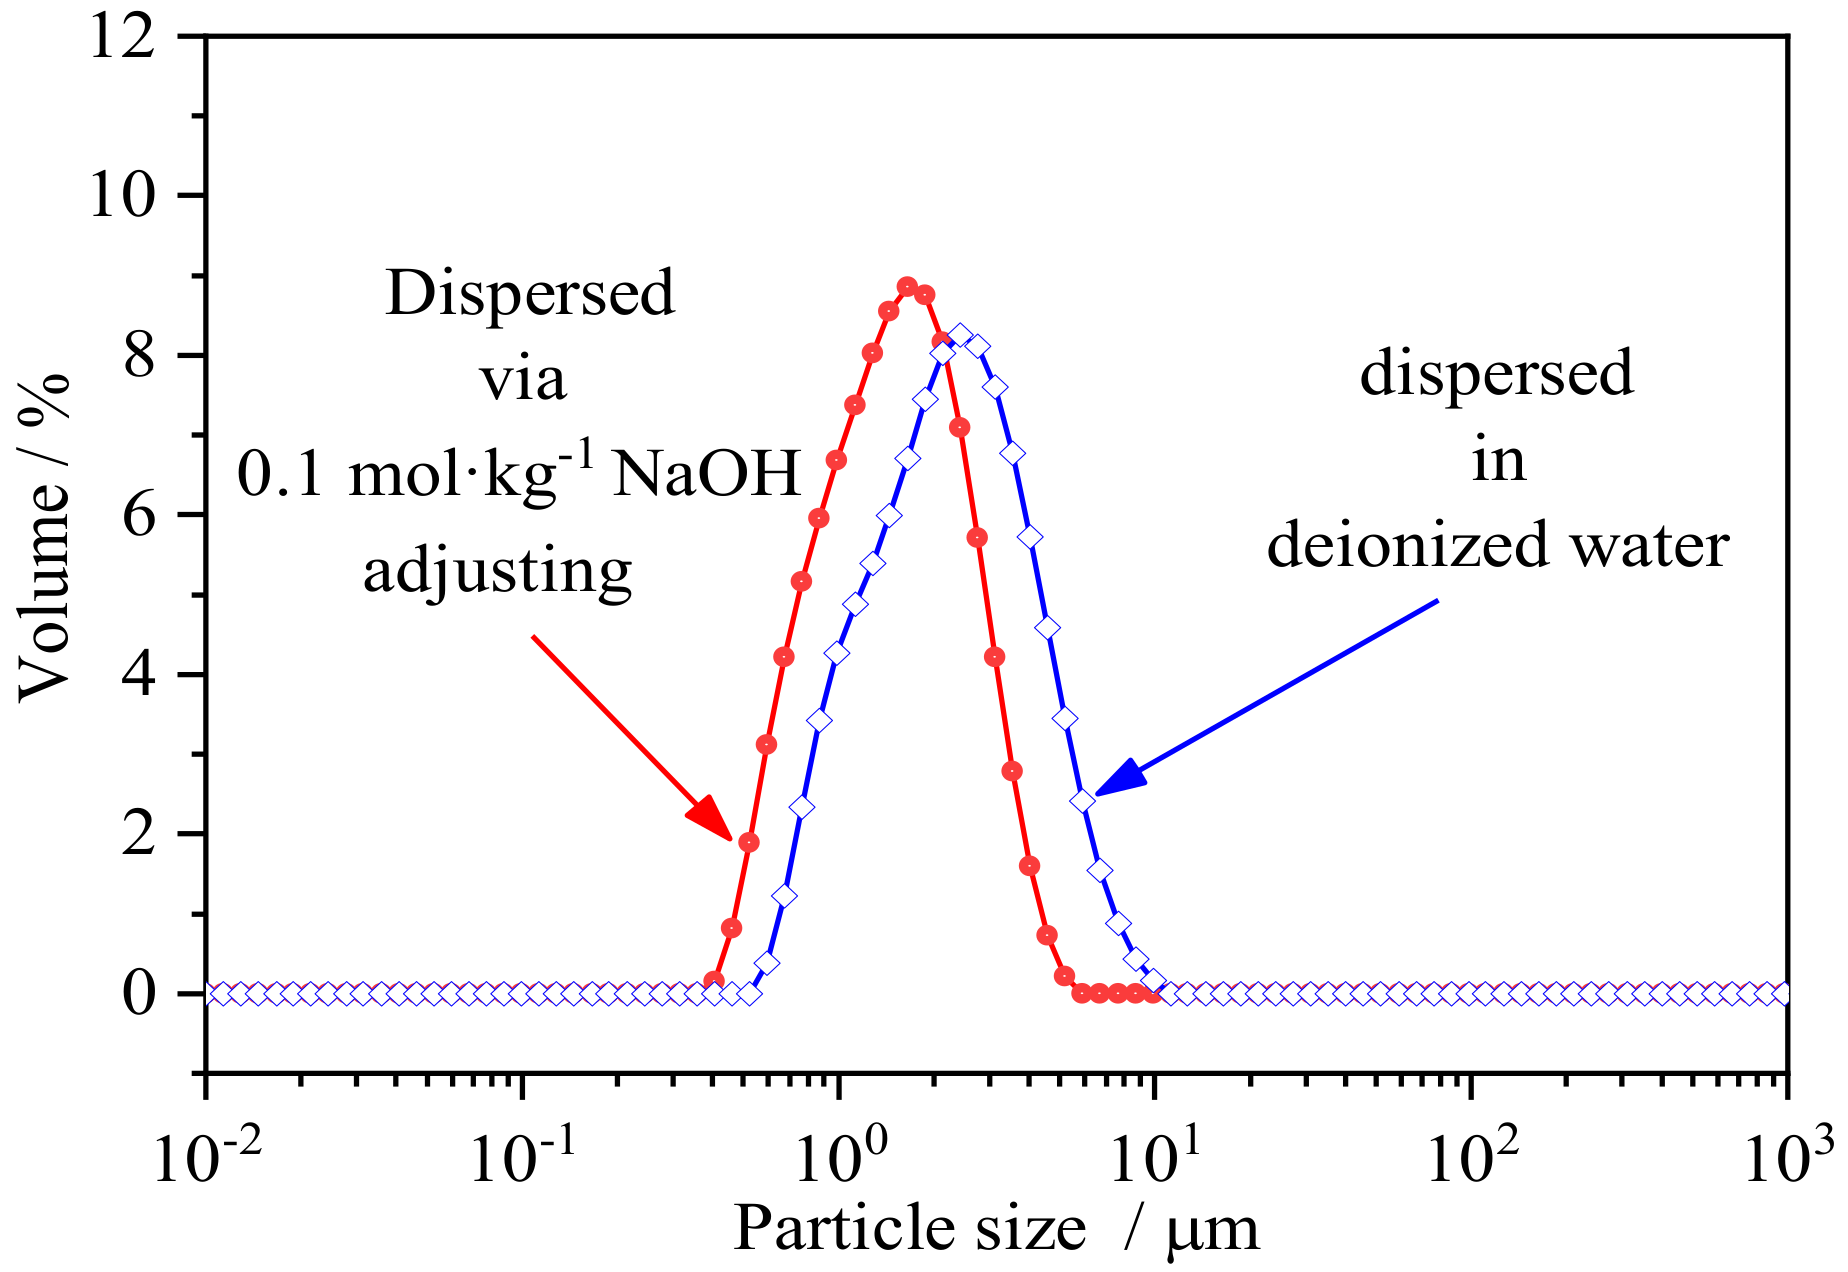
3.2. Stability Analysis on Colloidal Particle Size of IREOs in Aqueous Solution

Figure 3 shows the particle distribution of IREO colloids extracted by the sedimentation method. Colloidal particle size is mainly distributed in the range from 0.4 to 5.2 μm, and Dv50 is 1.63 μm. A small number of particles larger than 2 μm appeared in the particle size test results, indicating that there is still a small number of mineral colloids that form relatively large aggregate particles. The blue dotted line in Figure 3 illustrates the particle size distribution of IREO colloids in the suspension prepared with deionized water (no salt addition). In comparison with the suspension with pH 9.5, the blue dotted line deviates to the right. This indicates that the IREO colloids in deionized water has a higher aggregation degree.
Table 2 shows the results of multiple tests of colloidal particle size in suspensions with no salt addition and after 0.1 mol·kg−1 NaCl disturbed. It can be seen from the results that the IREO colloids Dv50 in 0.1 mol·kg−1 NaCl suspension is approximately 1.93 μm, and that in deionized water suspension is approximately 2.14 μm. The multiple measured value deviation of IREO colloids Dv50 in the two solutions is lower than 0.05 μm, indicating that the aggregation of IREO colloids changes after the electrolyte concentration disturbance, while the particle size measurement results of the aggregates are stable to a certain extent. Therefore, in the subsequent experiments, the aggregation behavior of IREO colloids can be studied and analyzed by means of electrolyte perturbation.
Among them, the Dv50 test of 0.1 mol·kg−1 NaCl suspension is conducted within half a minute after adding 0.1 mol·kg−1 NaCl to the suspension prepared by deionized water. It can be seen from the results that the IREO colloids Dv50 in 0.1 mol·kg−1 NaCl suspension is approximately 1.93 μm, and that in deionized water suspension is approximately 2.14 μm. The multiple measured value deviation of IREO colloids Dv50 in the two solutions is lower than 0.05 μm, indicating that the aggregation of IREO colloids changes after the electrolyte concentration disturbance, while the particle size measurement results of the aggregates are stable to a certain extent. Therefore, in the subsequent experiments, the aggregation behavior of IREO colloids can be studied and analyzed by means of electrolyte perturbation.

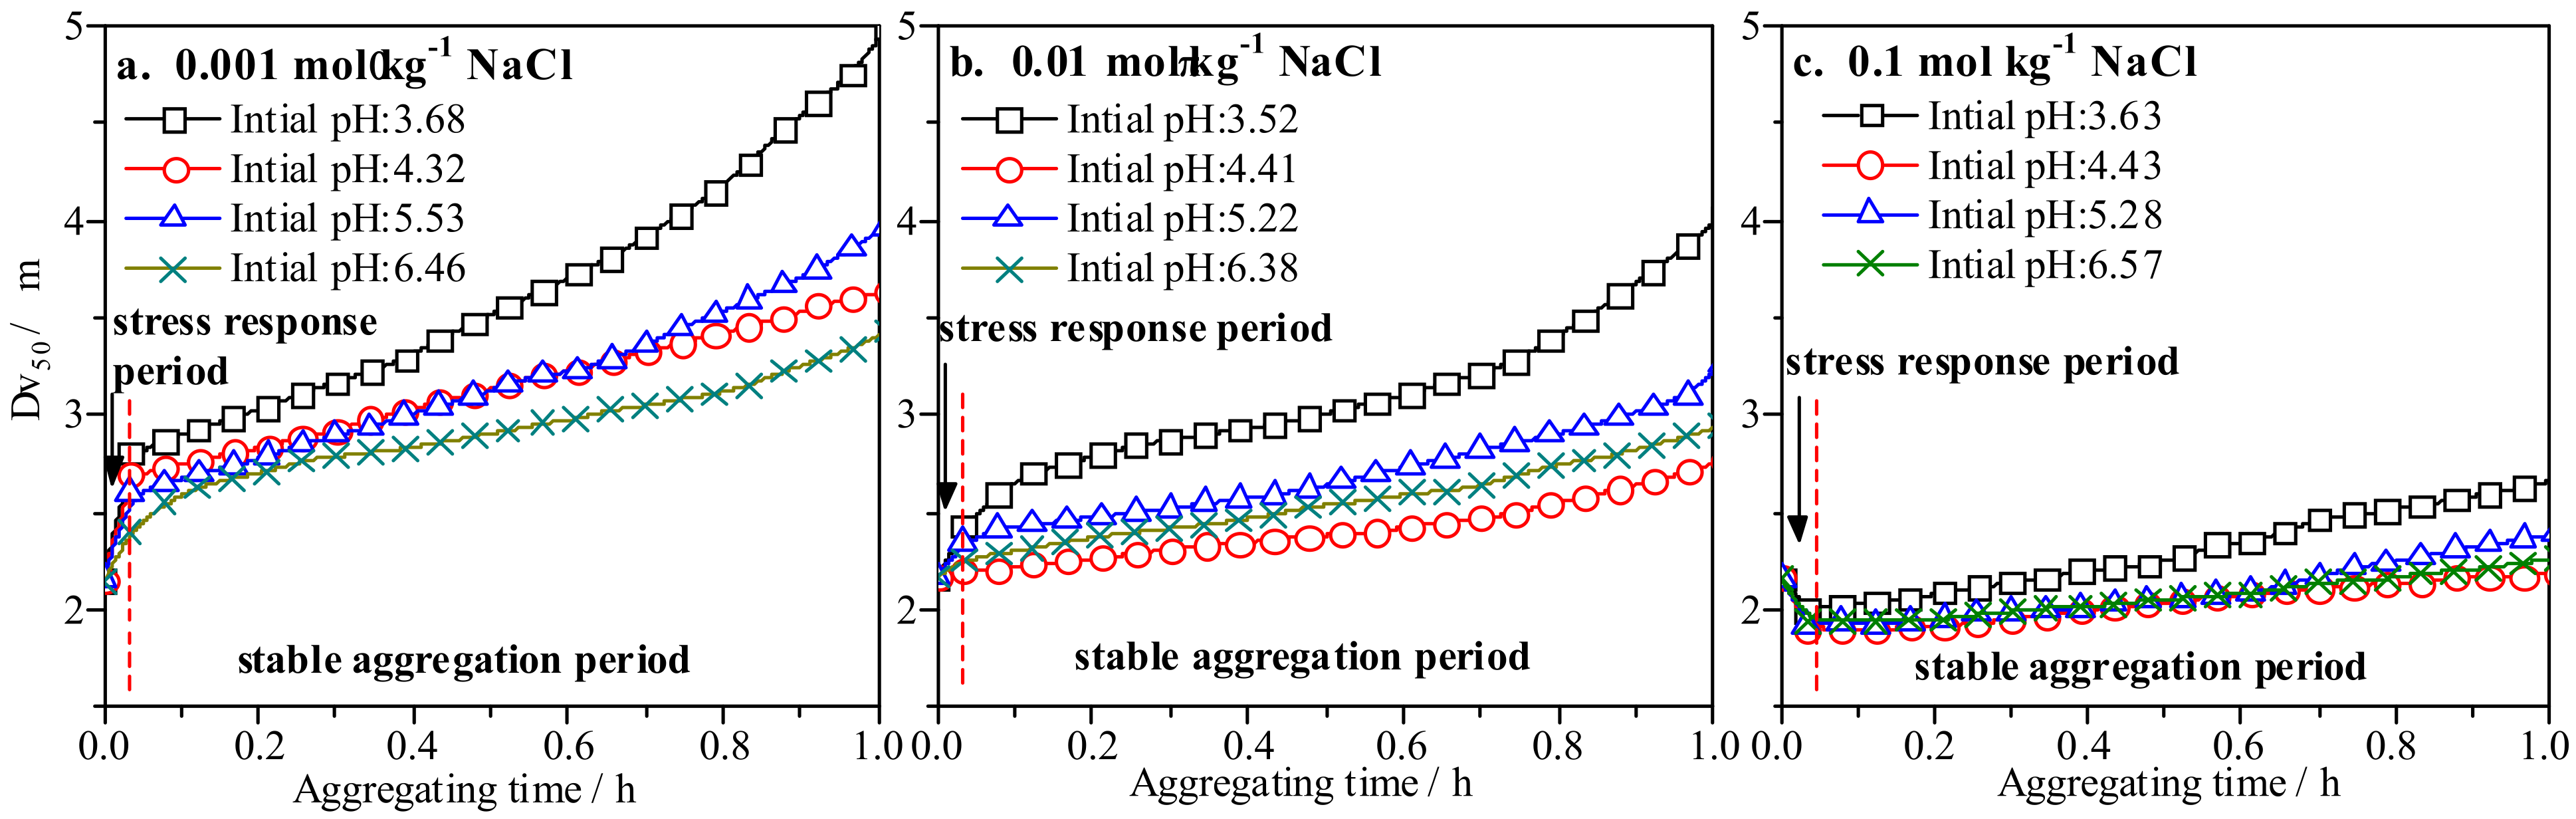
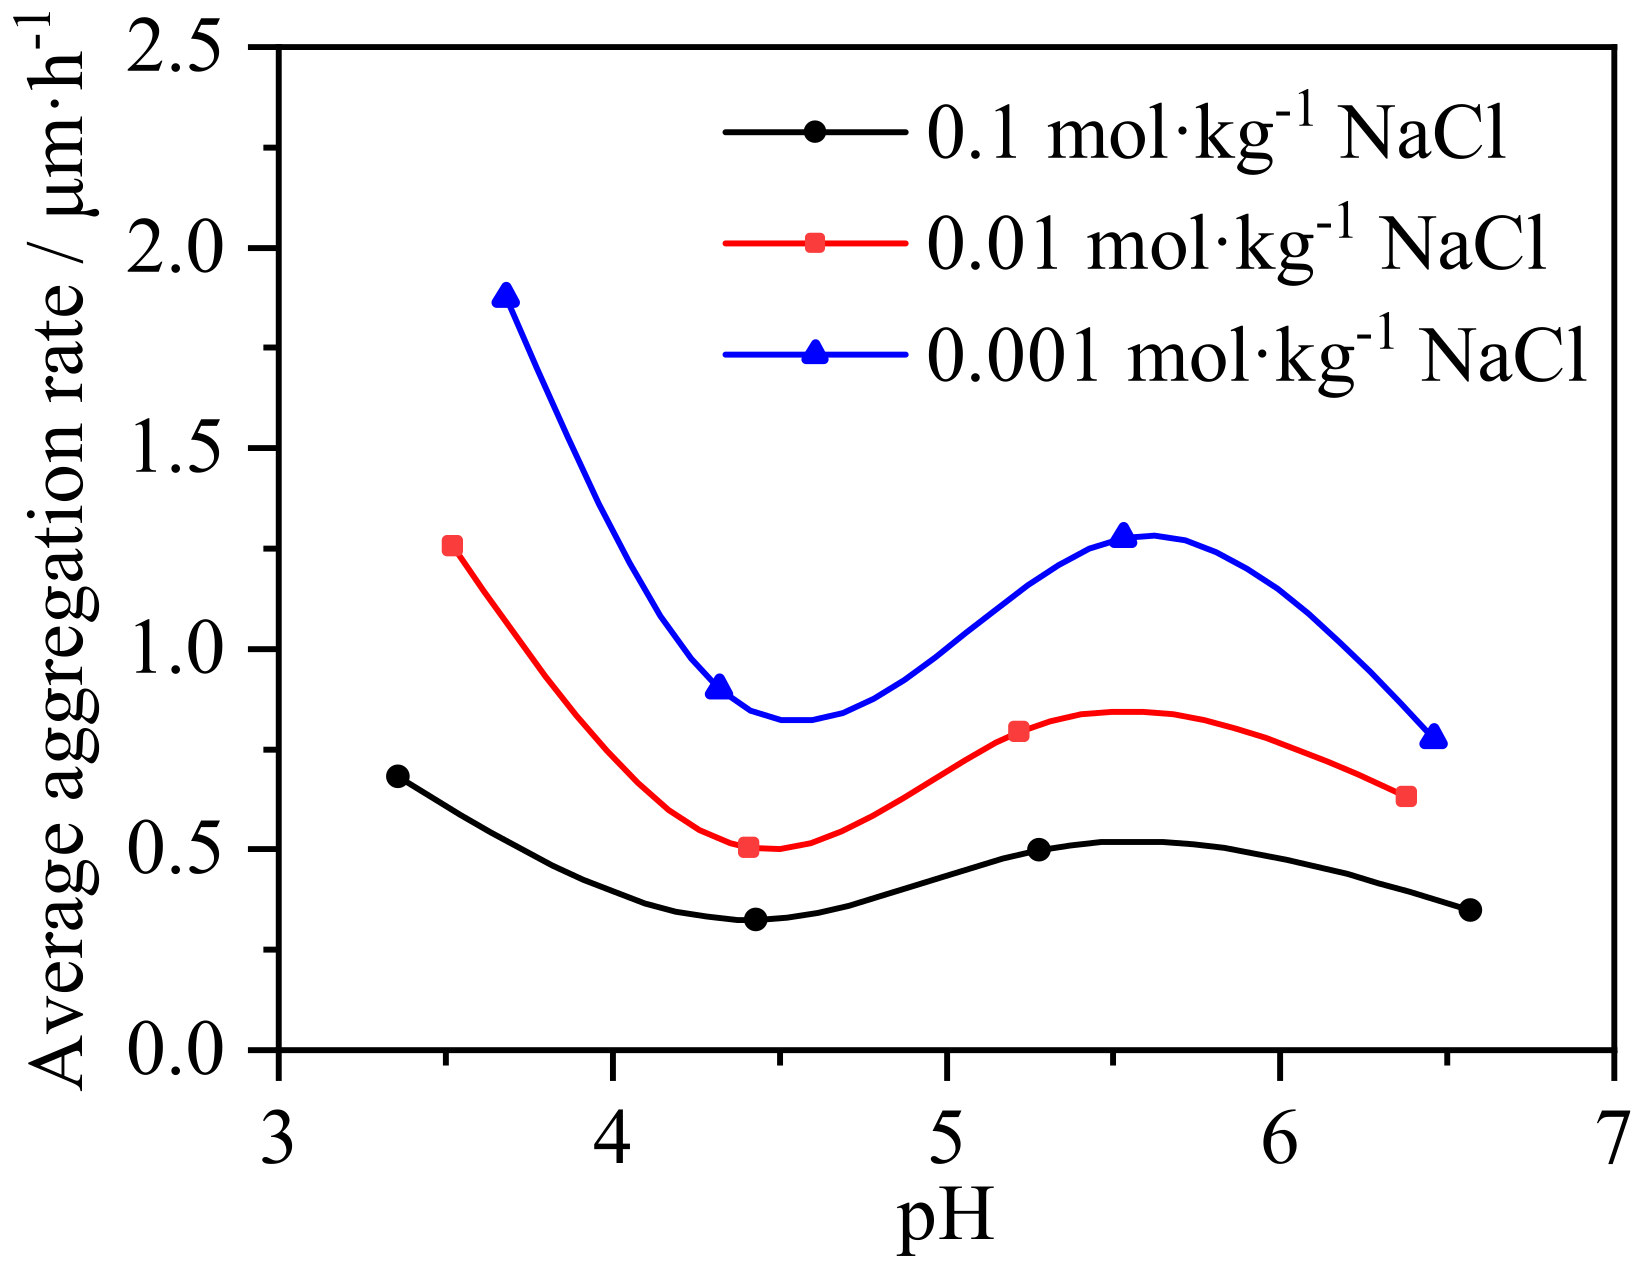
3.3. Impact of pH and Salinity Perturbation on Colloid Aggregation Behavior of IREOs

After adding a certain amount of NaCl into the suspension and adjusting the suspension, the aggregation of IREO colloids with time was studied, and the results were characterized by changes in colloidal particle size (Figure 4). In general, after suspension pH and salinity perturbation, the Dv50 of IREO colloids increases obviously with time, which indicates that the aggregation of IREO colloids is intensified. However, this aggregation is extremely unstable, and it is greatly affected by suspension pH value and salinity. However, this aggregation is extremely unstable, and it is greatly affected by the suspension’s pH value and electrolyte concentration. According to the change trend of the mineral colloid Dv50 with time, the mineral colloid aggregation process can be divided into two stages as follows: the stress response period of colloidal particles after the suspension environment changes and the stable aggregation period of colloidal particles.
During the stress response period, after salinity and pH value are disturbed, the Dv50 of IREO colloids in the suspension will increase or decrease. Labille et al. found that clay minerals would gather quickly in the initial stage of aggregation or dispersion, and pointed out that the shear force between the mineral surface and the solution medium was the main reason for mineral aggregation in a short time when the light scattering method was utilized to measure the size of clay particles [30]. In this experiment, IREO colloids Dv50 is greatly affected by the NaCl concentration and pH value of the suspension. It can be preliminarily inferred that the salinity and pH value are the main causes for the rapid aggregation or dispersion of IREO colloids at this stage. In the concentration range from 0.001 mol·kg−1 NaCl to 0.1 mol·kg−1 NaCl, IREO colloids Dv50 generally shows a downward trend with the increase in NaCl concentration during the rapid reaction period, indicating that low concentration electrolyte solution is conducive to the aggregation of IREO colloids. In a 0.001 mol·kg−1 NaCl suspension system, the initial aggregation degree of the mineral colloids is inversely proportional to the pH value of the suspension, indicating that when the electrolyte solution is low, the higher the concentration of H+ in the solution, the better the aggregation of mineral colloids. However, the initial aggregation degree of the mineral colloids at different pH conditions in 0.01 mol·kg−1 NaCl suspension was ranked from largest to smallest as follows: pH 3.52 (Dv50: 2.43μm), pH 5.22 (Dv50: 2.35 μm), pH 6.38 (Dv50: 2.26 μm) and pH 4.41 (Dv50: 2.20 μm); the same order for the 0.1 mol·kg−1 NaCl suspension system is as follows: pH 3.36 (Dv50: 2.00 μm), pH 6.57 (Dv50: 1.94 μm), pH 5.28 (Dv50: 1.92 μm) and pH 4.43 (Dv50: 1.90 μm). This indicates that the increase in salinity will affect the aggregation effect of the suspension’s pH value on IREO colloids.
After the stress reaction period, the IREO colloids enter into the stable colloid aggregation period. The particle size of the IREO colloids increases steadily with the increase in aggregation time. This change trend can be fitted by exponential function and a good result can be obtained (Table 3), and the average aggregation rate of the IREO colloids in the stable aggregation period can be calculated (Figure 5), in which the IREO colloids presents a higher aggregation rate at low salinities. This also indicates that colloids are more likely to aggregate in low-salinity solutions. In addition, there is a large correlation between the aggregation rate of colloids and solution pH in Figure 4, which shows a lower aggregation rate at approximately pH 4.5 for all salinity conditions in this experiment. This further suggests that there is an inhibitory effect of approximately pH 4.5 on mineral aggregation.
Kaolinite, illite and goethite are present in the IREO colloids. In the pH range of 3–7, the colloidal surface has both positive and negative charges. The colloidal surface shows obvious aggregation due to the electrostatic attraction between particles. When the salinity of the solution is increased, the double electric layer on the colloidal surface will be compressed. Additionally, also the collision distance between the particles becomes longer, which will reduce the chance of interparticle collision and aggregation. In addition, the densities of the aggregates formed at this time are relatively high, which also affects the formation of colloidal aggregation structure and thus reduces the stability of mineral aggregation. Therefore, colloidal aggregation weakens with the increase in salinity in Figure 4. This can explain the phenomenon that the higher the leaching agent concentration, the more IREO particles will migrate during the column leaching process.
The suspension pH affects the aggregation structure of the colloids. The main clay mineral in the colloid is kaolinite, which shows an increasing and then decreasing aggregation in the pH 3–7 range (the highest aggregation at pH 5.5). It is difficult to explain the weakening of mineral aggregation at approximately pH 4.5 in Figure 5 by considering only the aggregation of kaolinite. In the range of pH 3–7, the surface of goethite is positively charged [26]. It has been shown that goethite can electrostatically adsorb on the surface of clay minerals to play a role of adsorption bridging for mineral aggregation. This affects the structure of IREO colloidal aggregates. Additionally, illite also exhibits a transition between face-to-edge and edge-to-edge structures in the pH 4–5 range [22]. It is hypothesized that the weakening of mineral aggregation at approximately pH 4.5 is the result of the combined effect of multiple clay components.

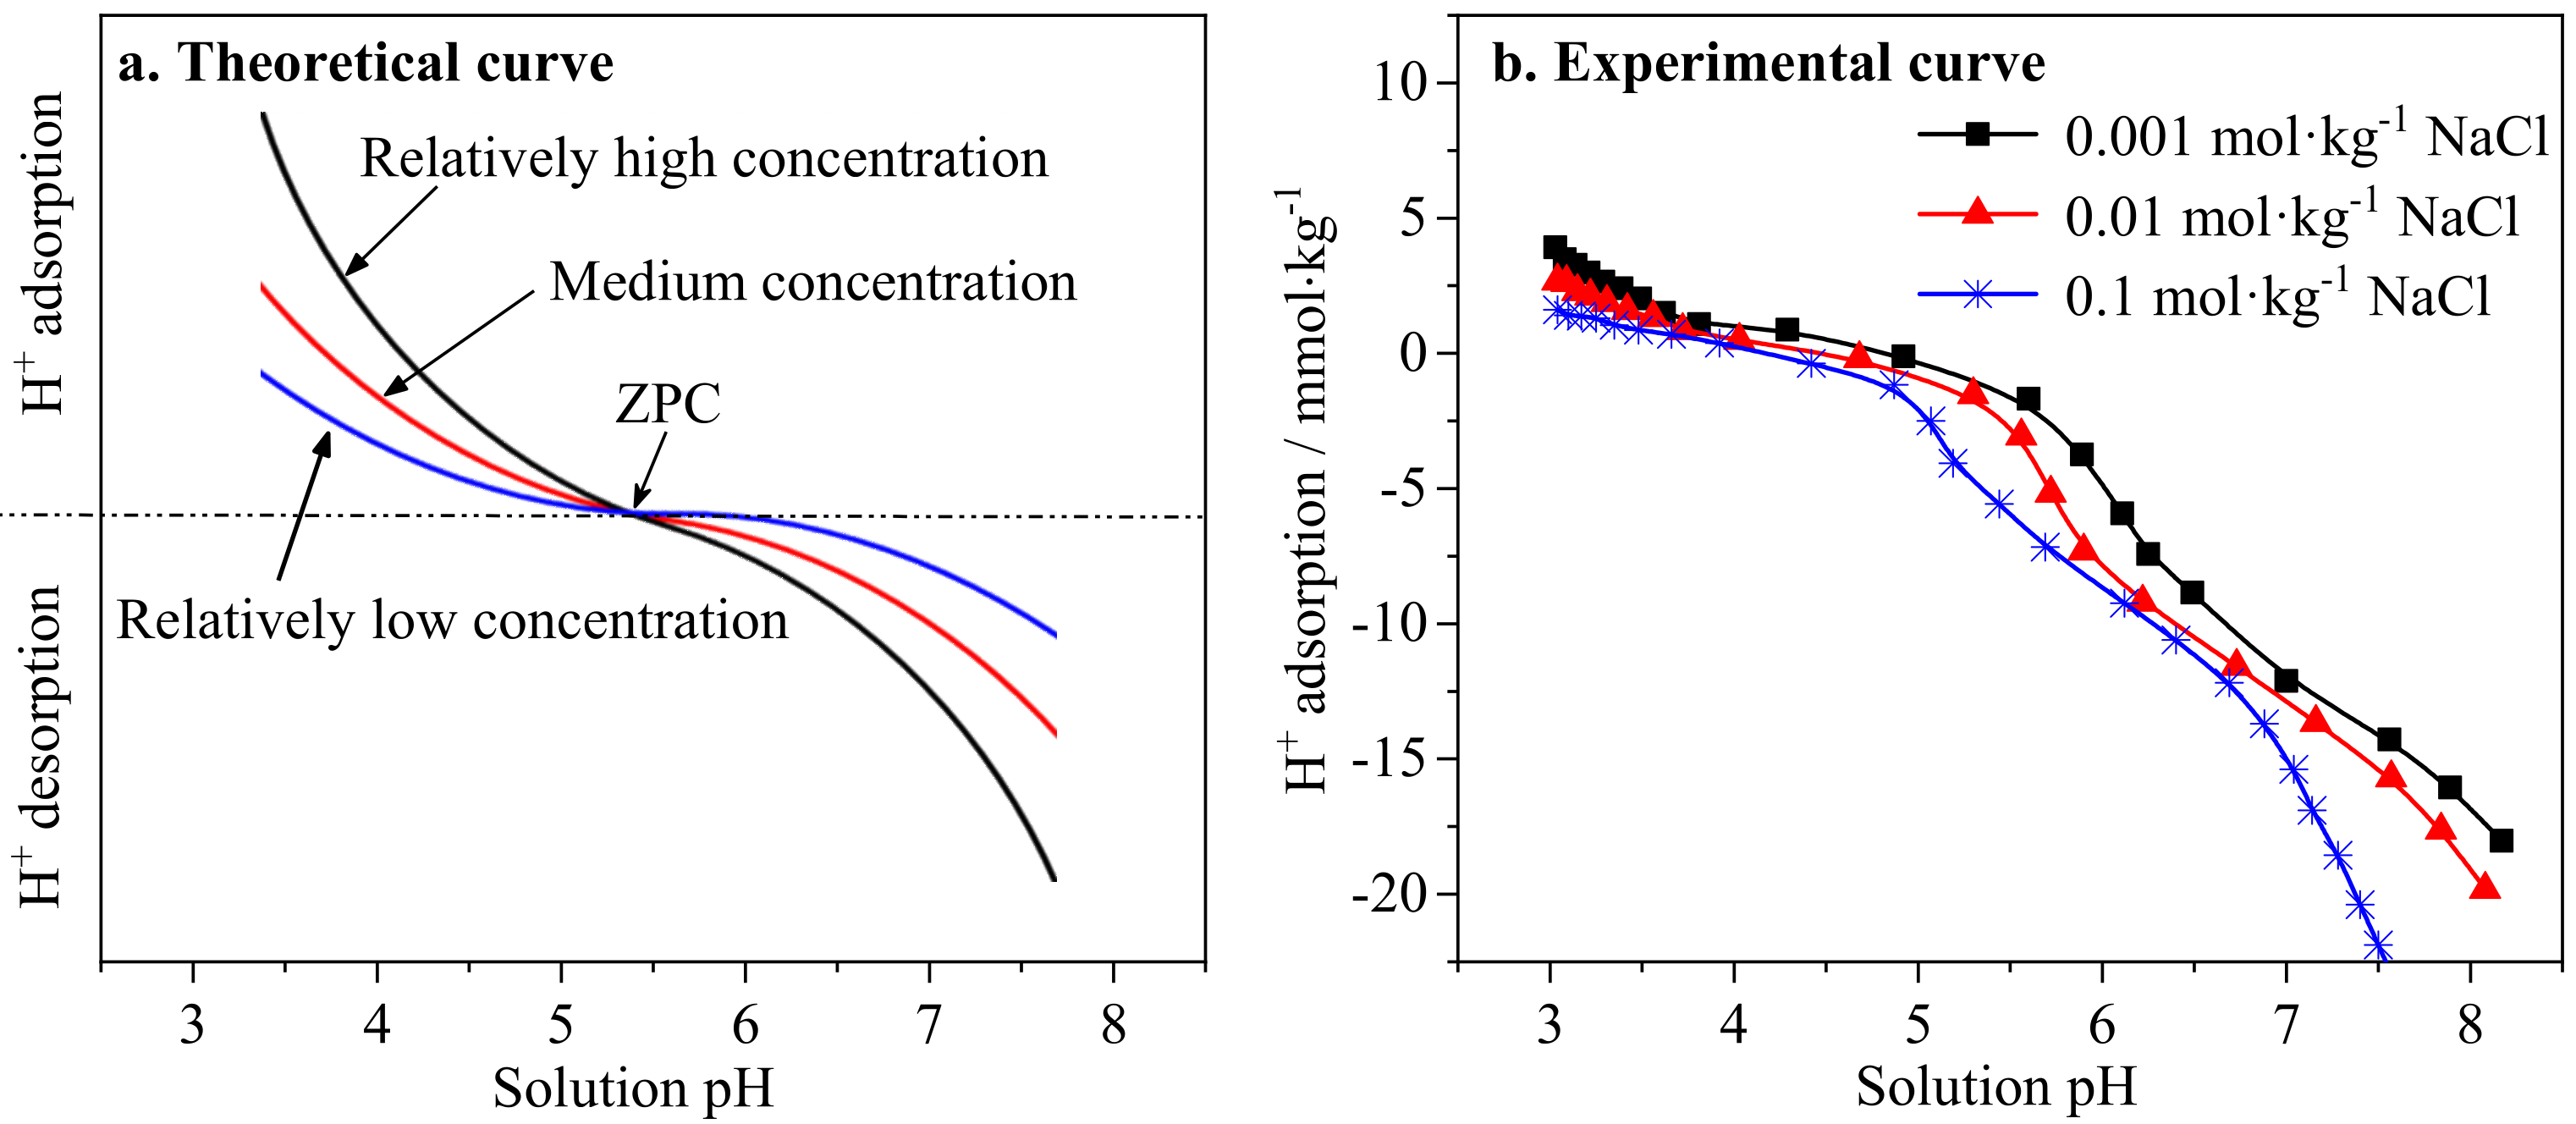
3.4. Effects of pH and NaCl Concentration on the Surface Charge Properties of Ionic Rare Earth Ore Colloids

According to charge characteristics, clay minerals can be divided into two categories: permanent charge and variable charge. Permanent charge is due to the isomorphous replacement in the lattice of clay minerals, which causes excess negative charges in the crystal cells of minerals, and the charge density is not affected by the pH value of solution and electrolyte concentration. The sources of variable charge can be divided into two categories as follows: one is that the hydration oxides (such as Al, Fe, and Si) in minerals are produced by the protonation/deprotonation reaction of surface hydroxyl groups; the other is produced by the protonation/deprotonation of the silanol and aluminol groups exposed at the bond breaking edge of the mineral basal surface.
For variable charge clay minerals, H+ and OH determine ions for their variable charge surface potential, which have a specific pH value. At this pH value, the amount of variable positive charge on the mineral surface is equal to the amount of negative charge on the surface, i.e., the amount of variable net charge on the mineral surface is 0 (ZPC). ZPC is not related to the concentration of solution ions. When the pH of the solution is less than the ZPC, the protonation reaction will occur on the mineral surface to make the mineral surface positively charged. When the pH of the solution is higher than the ZPC, the mineral surface will undergo a depolarization reaction to make the mineral surface negatively charged. The variable charge density of mineral surface can be calculated according to Equation (2) as follows [31]:
σ ν = 2 c ε R T π s i n h ( z 2 l n α H 0 + α H + )
where c is electrolyte concentration; ε is dielectric constant of solution; R is gas constant; T is absolute temperature; z is equilibrium ion valence; F is the Faraday constant; α H 0 + is the activity of H+ when σv is zero; α H + is the activity of H+ in solution.
According to Equation (2), under the same pH condition, when the concentration of solution ions is increased, the variable charge density on the mineral surface will increase, which means that the protonation/deprotonation reaction on the mineral surface will increase accordingly. At this time, the trend of the curve of H+ adsorption/desorption on the mineral surface and the pH value of the solution under different ion concentrations is shown in Figure 6a.
Figure 6b shows the total proton adsorption amount determined by the rapid potential method for the IREO colloids as a function of the pH at three different ionic strengths of NaCl. IREO colloids have ZPC values between 4 and 5, which is the result of the combined effect of net proton reactions on the surface of kaolinite (ZPC: 6–6.5), illite (ZPC < 3), and goethite (ZPC: approximately 8). In comparison with Figure 6a, When the pH value is larger than 5, the influence direction of NaCl concentration in Figure 6b on the H+ release amount on the IREO colloids surface is the same as that in Figure 6a. However, when the pH value is smaller than 5, the influence of the salt in Figure 6b on the H+ release/adsorption on the surface of IREO colloids is massively changed. Similar phenomena occurred in the acid–base titration curves of other clay minerals [32]. They showed that at a lower ionic strength, the generation of positive charges on the surface of the clay colloids could largely compensate for the permanent negative charges of the basal plane faces as the pH of the suspension decreases. However, this point contradicts Equation (2) and fails to clearly explain the source of positive charge generation on the mineral surface at low salinity. Li et al. found on variable charge soil that when the salinity is low, the positive and negative electric double layers on the mineral surface will partially overlap under the action of electrostatic attraction, and this can lead to the excessive adsorption of ions from the solution on the mineral surface [33]. It is speculated that the increase in H+ adsorption with the increase in salinity is related to the interaction between the positive and negative surface charge electric double layers of minerals.
Figure 7 shows the adsorption curves of K+ and NO3 on IREO colloids with pH change in two different concentrations of potassium nitrite solutions. Both K+ and NO3 are electrostatically adsorbed on the negative and positive charge sites on the clay mineral surfaces, respectively. Theoretically, as the solution pH increases, K+ adsorption decreases, while NO3 adsorption increases. In addition, clay minerals in high-salinity solutions can exhibit more adsorption of anions and cations under the same pH conditions. However, in this experiment, the IREOs in low-salinity solutions exhibited more NO3 adsorption, which can be attributed to the overlapping of the heterogeneous electric double layers. At pH 4.5, the aggregation of IREO colloids is relatively weak (Figure 5), indicating a low chance of overlap between heterogeneous electric double layers on the mineral surface. This makes the NO3 adsorption curve in Figure 7a show a trough at pH 4.5. In Figure 7b, a decrease in K+ adsorption with increasing pH is observed when pH is below 4. This also indicates that the IREO surface exhibits a significant excess adsorption of K+ under acidic conditions. From Figure 7a, it can be inferred that the ion excess adsorption resulting from the overlapping between positive and negative electric double layers is less than 5 mmol·kg−1. However, the K+ adsorption in Figure 7b is higher than 50 mmol·kg−1. This makes it difficult to represent the excess K+ adsorption under low-salinity conditions in Figure 7b. This suggests that the interaction between particles in IREOs affects the ion adsorption properties of mineral surfaces. When the interaction between colloidal particles is obvious, the agglomeration between the particles makes the electric double layer of positive and negative charged surfaces overlap, which will promote the transfer of ions from the solution to the mineral surface.

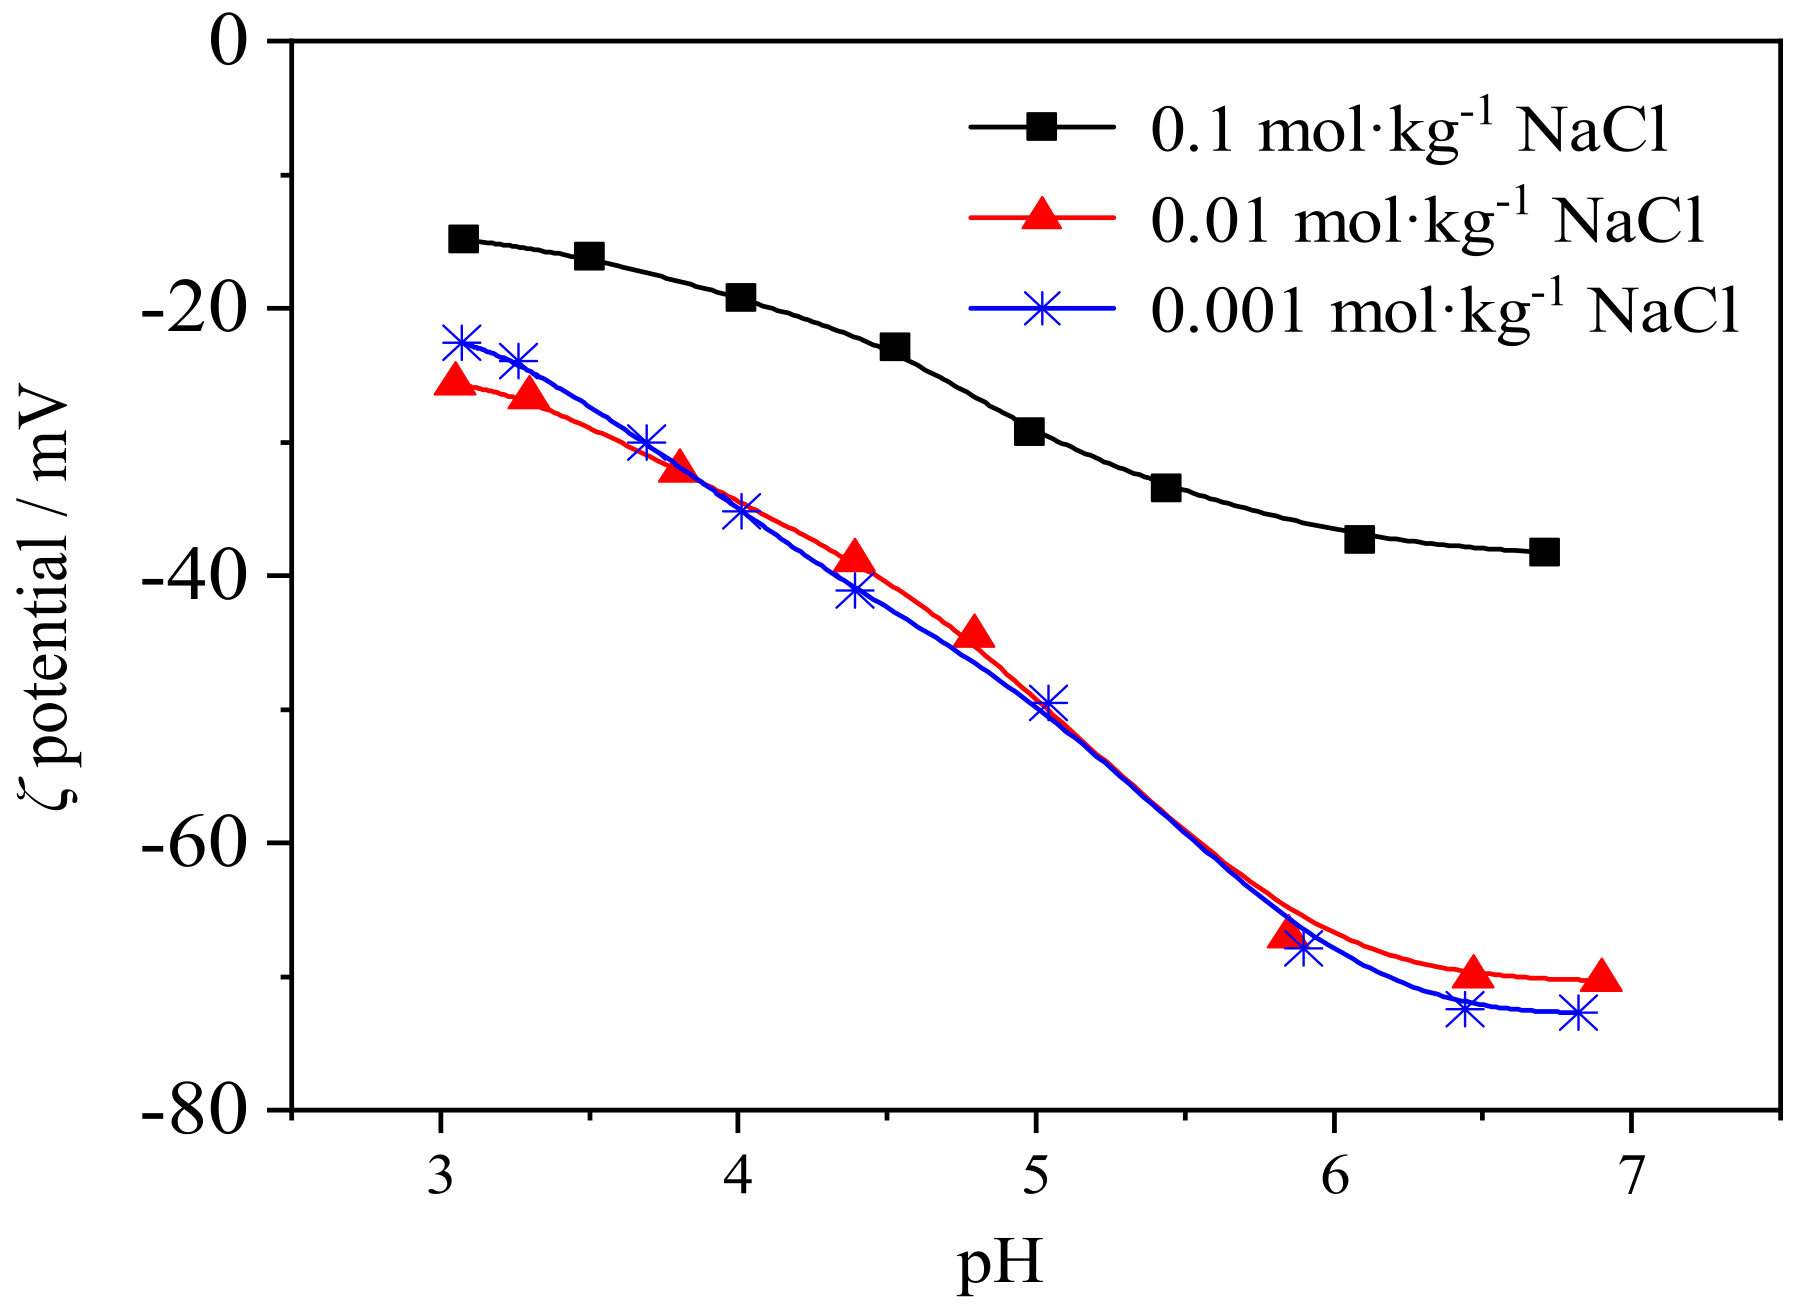
3.5. Effect of pH and Salinity on ζ Potential of the Rare Earth Ore’s Surface

The stability of the mineral colloidal dispersion in solution can be measured by ζ potential. The higher the absolute value of ζ potential, the stronger the dispersion stability of the colloidal system. Otherwise, aggregation occurs easily. Figure 8 presents the curves of ζ potential on the surface of IREO colloids in suspension with different NaCl concentrations, which changes with pH value. The ζ potential of all curves in the figure is negative, indicating that the net surface charges of IREO colloids are all negative under the experimental conditions. As the pH value of suspension decreases, the amount of variable positive charge on mineral surface increases, and the ζ potential of all curves in Figure 8 moves forward accordingly. Theoretically, when the concentration of ions in solution is increased, the absolute value of ζ potential on mineral surface will be reduced by double layer compression. In Figure 8, the ζ–pH curves of the two suspension systems (0.001 mol·kg−1 NaCl and 0.01 mol·kg−1 NaCl), are mostly coincident. Moreover, when pH < 4, the absolute value of the ζ potential of the IREO colloids in 0.001 mol·kg−1 NaCl suspension is even slightly lower than that of 0.01 mol·kg−1 NaCl system. It may be related to the stronger interaction between the double electric layers on the IREO colloids surface under the condition of low ion concentration. This is consistent with the research results of Li et al. [33]; the interaction between positive and negative charge electric double layers under low concentration conditions will promote the ζ potential on the surface of clay minerals to move forward. Therefore, the influence of pH and NaCl concentration on the surface charge properties of IREO colloids is not only related to the proton/deprotonation behavior of the mineral surface by electrolyte concentration and pH value, but also needs to consider the interaction between the positive and negative charge surface electric double layers of the mineral.

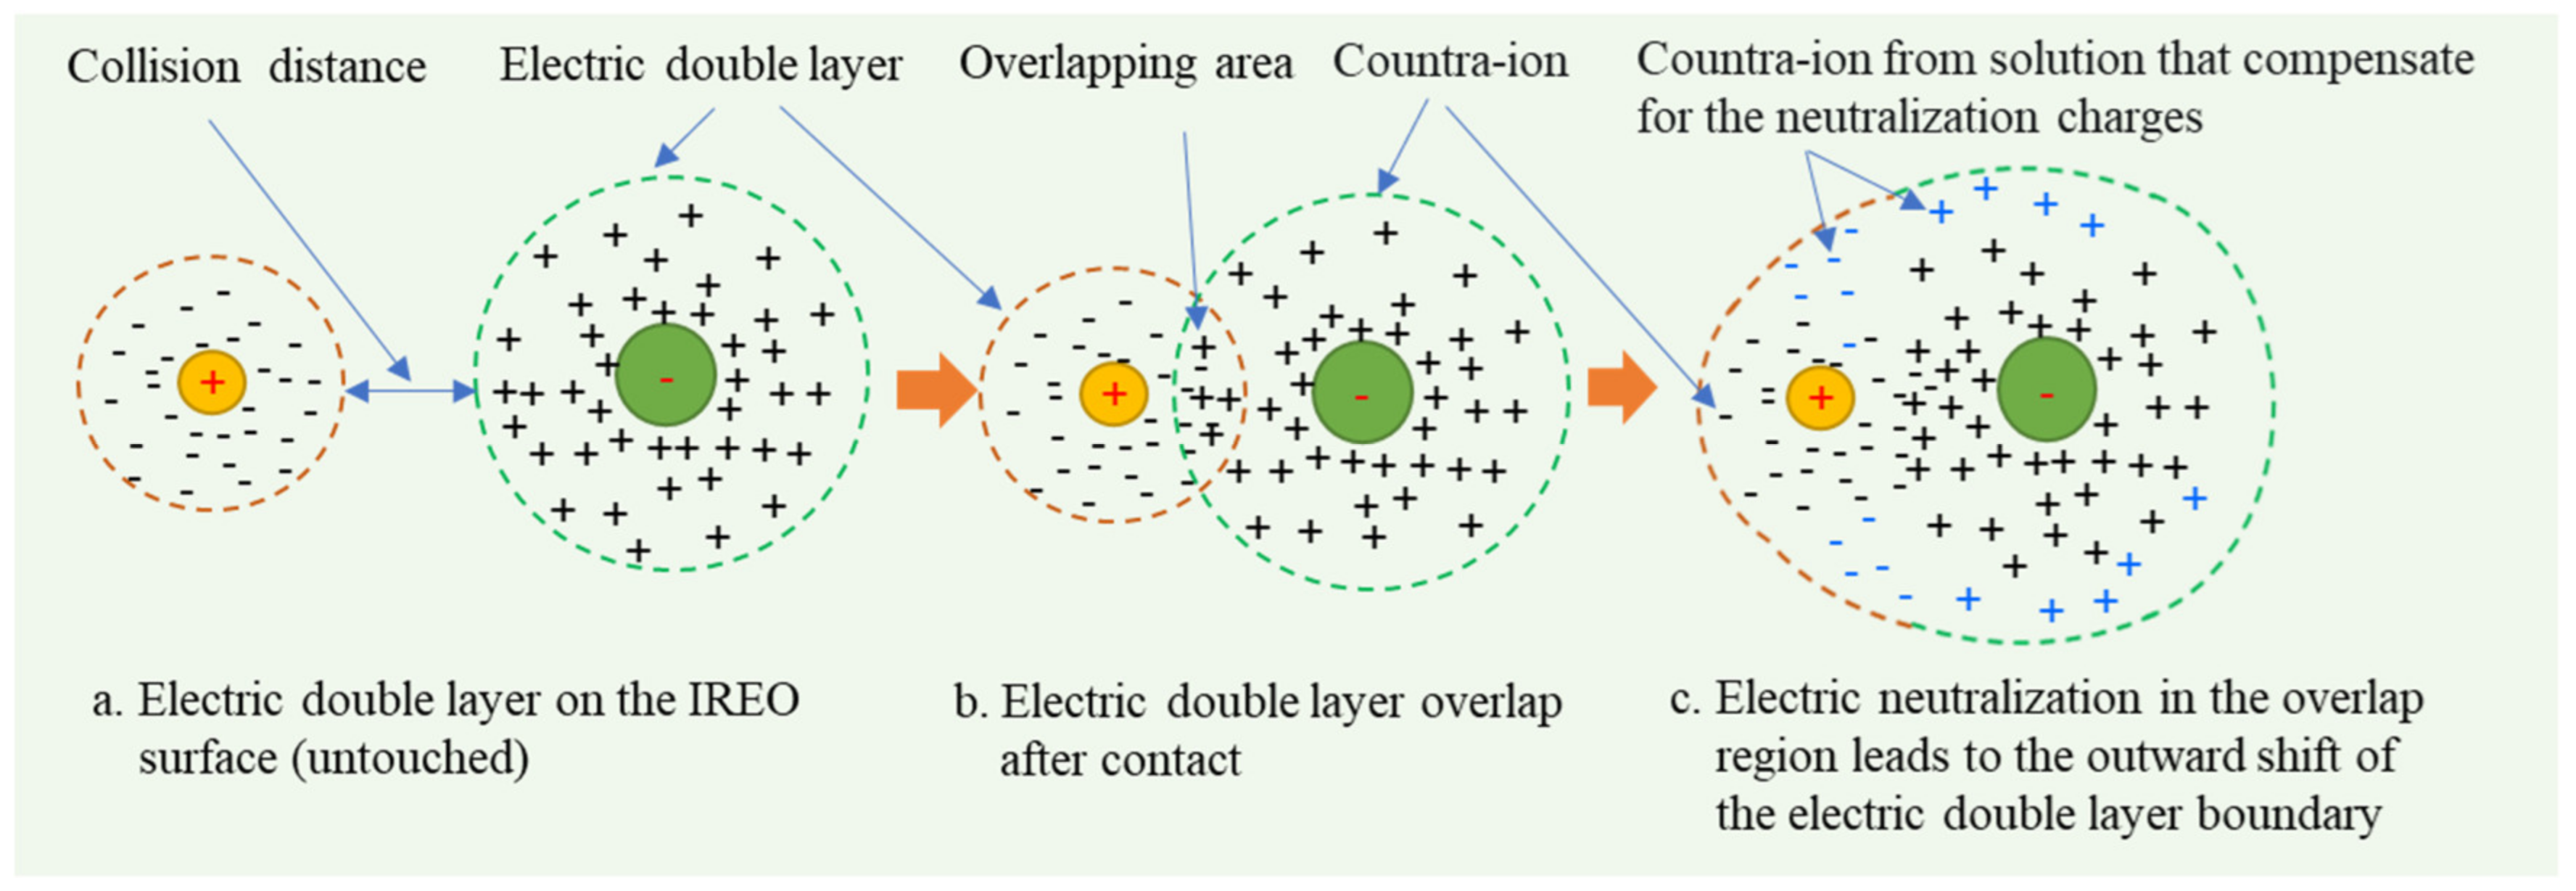
3.6. Influence Mechanism of Solution pH and Salinity Disturbance on Ionic Rare Earth Ore Aggregation

IREO colloids aggregation is the result of interaction between mineral particles. In the traditional analysis on the interaction between clay particles, the electrostatic repulsion force between minerals, the van der Waals force between minerals, and the repulsion force between the hydration membranes on the mineral surface are mainly considered. Among them, the van der Waals force and the hydration repulsion force are mainly short-range forces. In the process of IREO colloids aggregation, the electrostatic attraction of positive and negative charge surfaces of minerals is apparent. When analyzing the aggregation mechanism, we should include the electrostatic attraction between mineral surfaces for analysis. In the low electrolyte concentration, the double electric layer on the mineral colloid surface has a certain thickness, and the interaction between minerals mainly considers the long-term electrostatic force. Due to the fact that there are positive and negative charge sites on the surface of mineral IREO colloids, the electrostatic attraction between minerals is strengthened, which is the main cause for mineral aggregation in low electrolyte concentration. The resulting aggregates are relatively unstable, and vulnerable to the influence of solution pH value and ion concentration. On the basis of the above analysis, the effects of pH and electrolyte concentration on IREO colony aggregation can be summarized as follows:
The effect of electrolyte concentration on the aggregation of IREO colloids is mainly reflected in its effect on the thickness of the electric double layer. When the electrolyte concentration is increased, the surface double electric layer compresses, which will reduce the collision probability of the electric double layer on the surface of IREO colloids, thus inhibiting IREO colloids aggregation.
The effect of pH value on the aggregation of IREO colloids is relatively complex. On the one hand, the pH value of solution mainly affects the proton/deprotonation on the mineral surface, which can affect the degree of mineral aggregation by changing the variable positive and negative charges of minerals. For clay minerals mainly showing negative charges, the lower the pH value, the more positive the charges on the mineral surface, which means that the probability of aggregation of minerals by electrostatic phase force is enhanced. However, it is worth noting that when the variable positive and negative charges on the mineral surface are similar, the interaction between positive and negative charges between minerals will appear a relatively weak state, which is not conducive to mineral aggregation. When the solution concentration is increased under this condition, the electrostatic interaction between minerals will be further weakened due to the compression of the double electric layer on the mineral surface, and the restriction of mineral aggregation will be more obvious. On the other hand, due to the mineral aggregation, the electric double layers with different charges will partially overlap and appear electric neutralization in the overlapping area, which will affect the potential distribution in the double electric layer as well as the change in the adsorption of solution H+, and also affect the mineral aggregation behavior (Figure 9).

4. Conclusions

The fundamental cause for its generation is that electrostatic attraction between mineral heterogeneous charge surfaces increases the collision probability between particles in a long range. The strength of the interaction between mineral grains affects the ion exchange properties of the mineral surface. When the inter-mineral interactions are strong, the mineral surface ion exchange process is not favored. This finding can provide a relevant basis for the causes of rare earth mineralization and new ideas for the research on the theoretical aspects of rare earth leaching.
In addition, the pH value and salinity of solution can affect the degree of electrostatic attraction between positively charged and negatively charged surfaces, which affects the degree of stability of the mineral aggregate structure. This conclusion will provide relevant ideas to solve the migration phenomenon of ore particles during the leaching process.

Author Contributions

Conceptualization, L.W.; methodology, L.W. and Q.L.; investigation, L.W. and L.L.; data curation, L.W. and L.L.; validation, L.W. and Q.L.; writing—original draft preparation, L.W.; writing—review and editing, Q.L. All authors have read and agreed to the published version of the manuscript.

Funding

This research was funded by Science and Technology Planning Project of Panzhihua City, grant number 2020CY-G-6.

Data Availability Statement

All data can be obtained from the corresponding author.

Conflicts of Interest

We declare that we have no financial or personal relationships with other people or organizations that could have an inappropriate effect on our work.

References

  1. Wang, L.; Wang, C.; Liao, C.; Yang, Y. Effect of ionic interaction on leaching behavior of ion-adsorption type rare earth ore. Chin. Rare Met. 2018, 42, 1002–1008. [Google Scholar]
  2. Ni, S.; Chen, Q.; Gao, Y.; Guo, X.; Sun, X. Recovery of rare earths from industrial wastewater using extraction-precipitation strategy for resource and environmental concerns. Miner. Eng. 2020, 151, 106315. [Google Scholar] [CrossRef]
  3. Lai, A.; Lai, F.; Huang, L.; Qiu, J.; Zhou, X.; Xiao, Y. Non-ammonia enrichment of rare earth elements from rare earth leaching liquor in a magnesium salt system I: Precipitation by calcium oxide. Hydrometallurgy 2020, 193, 105318. [Google Scholar] [CrossRef]
  4. Wang, L.; Liao, C.; Yang, Y.; Xu, H.; Xiao, Y.; Yan, C. Effects of organic acids on the leaching process of ion-adsorption type rare earth ore. J. Rare Earths 2017, 35, 1233–1238. [Google Scholar] [CrossRef]
  5. Xiao, Y.; Huang, L.; Long, Z.; Feng, Z.; Wang, L. Adsorption ability of rare earth elements on clay minerals and its practical performance. J. Rare Earths 2016, 34, 543–548. [Google Scholar] [CrossRef]
  6. Moldoveanu, G.A.; Papangelakis, V.G. Recovery of rare earth elements adsorbed on clay minerals: II. Leaching with ammonium sulfate. Hydrometallurgy 2013, 131, 158–166. [Google Scholar] [CrossRef]
  7. Wang, L.; Lan, Q.; Li, L.; Yang, Y.; Liao, C. Research status on leach chemistry of ion-adsorption type rare earth ore. Chin. Rare Earths 2018, 39, 135–143. [Google Scholar]
  8. Zhou, L.; Wang, X.; Zhou, Y.; Hu, K.; Zhong, W.; Huang, G. Dynamic pore structure evolution of the ion adsorbed rare earth ore during the ion exchange process. R. Soc. Open Sci. 2019, 6, 191107. [Google Scholar] [CrossRef]
  9. Wang, J.; Wang, G.; Hong, G. Effects of Concentration of Pore Solution on Stability of Ion-Absorbed Rare Earth Ore Aggregate. Adv. Civ. Eng. 2021, 2021, 8846605. [Google Scholar] [CrossRef]
  10. Fan, T.; Wang, Y.; Li, C.; Zhou, D.; Friedman, S. Effects of Soil Organic Matter on Sorption of Metal Ions on Soil Clay Particles. Soil Sci. Soc. Am. J. 2015, 79, 794–802. [Google Scholar] [CrossRef]
  11. Alonso, U.; Missana, T.; Garcia-Gutierrez, M.; Patelli, A.; Albarran, N.; Rigato, V. Colloid diffusion coefficients in compacted and consolidated clay barriers: Compaction density and colloid size effects. Phys. Chem. Earth 2011, 36, 1700–1707. [Google Scholar] [CrossRef]
  12. Luckham, P.; Rossi, S. The colloidal and rheological properties of bentonite suspensions. Adv. Colloid Interface Sci. 1999, 82, 43–92. [Google Scholar] [CrossRef]
  13. Carstens, J.; Bzchmann, J.; Neuweiler, I. A new approach to determine the relative importance of DLVO and non-DLVO colloid retention mechanisms in porous media. Colloids Surf. A Physicochem. Eng. Asp. 2018, 560, 330–335. [Google Scholar] [CrossRef]
  14. Nabweteme, R.; Yoo, M.; Kwon, H.; Kim, Y.; Hwang, G.; Lee, C.; Ahn, I. Application of the extended DLVO approach to mechanistically study the algal flocculation. J. Ind. Eng. Chem. 2015, 30, 289–294. [Google Scholar] [CrossRef]
  15. Soler, J.; Steefel, C.; Gimmi, T.; Leupin, O.; Cloet, V. Modeling the Ionic Strength Effect on Diffusion in Clay. The DR-A Experiment at Mont Terri. ACS Earth Space Chem. 2019, 3, 442–451. [Google Scholar] [CrossRef] [Green Version]
  16. Muhammad, M.; Massimo, R. Impact of diffuse layer processes on contaminant forward and back diffusion in heterogeneous sandy-clayey domains. J. Contam. Hydrol. 2021, 237, 103754. [Google Scholar]
  17. Missana, T.; Alonso, U.; Fernandez, A.; Garcia-Gutierrez, M. Analysis of the stability behaviour of colloids obtained from different smectite clays. Appl. Geochem. 2018, 92, 10–187. [Google Scholar] [CrossRef]
  18. Kumar, N.; Zhao, C.; Klaassen, A.; van den Ende, D.; Mugele, F.; Siretanu, I. Characterization of the surface charge distribution on kaolinite particles using high resolution atomic force microscopy. Geochim. Cosmochim. Acta 2016, 175, 100–112. [Google Scholar] [CrossRef]
  19. Zhu, L.; Tian, R.; Liu, X.; Xiong, H.; Li, H. A general theory for describing coagulation kinetics of variably charged nanoparticles. Colloid Surface A 2017, 527, 158–163. [Google Scholar] [CrossRef]
  20. Alagha, L.; Wang, S.; Yan, L.; Xu, Z.; Masliyah, J. Probing adsorption of polyacrylamide-based polymers on anisotropic basal planes of kaolinite using quartz crystal microbalance. Langmuir 2013, 29, 3989–3998. [Google Scholar] [CrossRef]
  21. Hu, Y.; Liu, L.; Min, F.; Zhang, M.; Song, S. Hydrophobic agglomeration of colloidal kaolinite in aqueous suspensions with dodecylamine. Colloids Surf. A Physicochem. Eng. Asp. 2013, 434, 281–286. [Google Scholar] [CrossRef]
  22. Shao, H.; Chang, J.; Lu, Z.; Luo, B.; Grundy, J.; Xie, G.; Xu, Z.; Liu, Q. Probing Anisotropic Surface Properties of illite by atomic force microscopy. Langmuir 2019, 35, 6532–6539. [Google Scholar] [CrossRef]
  23. Baalousha, M. Aggregation and disaggregation of iron oxide nanoparticles: Influence of particle concentration, pH and natural organic matter. Sci. Total Environ. 2009, 407, 2093–2101. [Google Scholar] [CrossRef]
  24. Baalousha, M.; Manciulea, A.; Cumberland, S.; Kendall, K.; Lead, J. Aggregation and surface properties of iron oxide nanoparticles: Influence of pH and natural organic matter. Environ. Toxicol. Chem. 2008, 27, 1875–1882. [Google Scholar] [CrossRef]
  25. Tschapek, M.; Tcheichvili, L.; Wasowski, C. The point of zero charge (pzc) of kaolinite and SiO2+AI2O3 mixtures. Clay Miner. 1974, 10, 219–229. [Google Scholar] [CrossRef]
  26. Zhu, L.; Li, Z.; Tian, R.; Li, H. Specific ion effects of divalent cations on the aggregation of positively charged goethite nanoparticles in aqueous suspension. Colloids Surf. A Physicochem. Eng. Asp. 2019, 3, 442–451. [Google Scholar] [CrossRef]
  27. Sakurai, K.; Teshima, A.; Kyuma, K. Changes in zero point of charge (ZPC), specific surface area (SSA), and cation exchange capacity (CEC) of kaolinite and montmorillonite, and strongly weathered soils caused by Fe and Al coatings. Soil Sci. Plant Nutr. 1990, 36, 73–81. [Google Scholar] [CrossRef]
  28. Balan, E.; Delattre, S.; Guillaumet, M.; Salje, E. Low-temperature infrared spectroscopic study of OH-stretching modes in kaolinite and dickite. Am. Mineral. 2010, 95, 1257–1266. [Google Scholar] [CrossRef]
  29. Noneman, H.; Hollingsworth, M.; Singh, J.; White, R. A high sensitivity variable temperature infrared spectroscopy investigation of kaolinite structure changes. Spectrochim. Acta A Mol. Biomol. Spectrosc. 2021, 247, 119113. [Google Scholar] [CrossRef]
  30. Labille, J.; Thomas, F.; Bihannic, I.; Santaella, C. Destabilization of montmorillonite suspensions by Ca2+ and succinoglycan. Clay Miner. 2003, 38, 173–185. [Google Scholar] [CrossRef]
  31. Xiong, Y. Soil Colloids: The Characteristic Basis of Soil Colloids; Science Press: Beijing, China, 1983. [Google Scholar]
  32. Baik, M.; Lee, S. Colloidal stability of bentonite clay considering surface charge properties as a function of pH and ionic strength. J. Ind. Eng. Chem. 2010, 16, 837–841. [Google Scholar] [CrossRef]
  33. Li, Z.; Xu, R.; Li, J. Effect of clay colloids on the zeta potential of Fe/Al oxide-coated quartz: A streaming potential study. J. Soil Sediments 2016, 16, 2676–2686. [Google Scholar] [CrossRef]
Figure 1. X-ray diffractometry spectrum of the IREO colloids.
Minerals 13 00038 g001
Figure 2. Infrared spectroscopy of the IREO colloids.
Minerals 13 00038 g002
Figure 3. Particle size distribution of IREO colloids in the suspension before and after 0.1 mol·kg−1 NaCl disturbed.
Minerals 13 00038 g003
Figure 4. Impact of pH and salinity perturbation on Dv50 of the IREO colony. (a) 0.001 mol·kg−1 NaCl; (b) 0.01 mol·kg−1 NaCl; (c) 0.1 mol·kg−1 NaCl.
Minerals 13 00038 g004
Figure 5. Average aggregation rate of the IREO colloids after salinity and pH value disturbance.
Minerals 13 00038 g005
Figure 6. Acid–base titration curves of clay minerals with variable charge under different ionic strengths. (a) Theoretical curve; (b) Experimental curve.
Minerals 13 00038 g006
Figure 7. The adsorption curves of K+ and NO3 on IREOs with pH change in two different concentrations of potassium nitrite solutions. (a) NO3 adsorption; (b) K+ adsorption.
Minerals 13 00038 g007
Figure 8. ζ potential of the REO colloid after NaCl concentration and pH value disturbed.
Minerals 13 00038 g008
Figure 9. The overlapping of the double electric layer on the IREO colloidal surfaces during agglomeration.
Minerals 13 00038 g009
Table 1. Main chemical composition and the total amount of rare earth oxides of IREOs.
TREOMain Component Elements/wt.%
NaMgCaSiFeAlKO
0.16%0.090.0440.01915.220.7614.381.9945.22
Table 2. IREO colloid particle size test results in deionized aqueous solution before and after NaCl concentration disturbance.
Solution MediumDv50/μm
No.1No.2No.3No.4No.5No.6No.7No.8No.9No.10
Deionized Water2.142.152.132.152.142.142.142.142.152.15
0.1 mol·kg−1 NaCl Disturbed1.931.941.931.921.931.931.931.931.921.92
Table 3. Fitting equations of kinetic variations in Dv50 of the IREO colloids with the change in aggregation time after NaCl concentration and pH value disturbed.
CNaCl/mol·kg−1Initial pHFitting EquationR-Squared
0.13.63Dv50 = 1.81 + 0.22e1.39t0.977
4.43Dv50 = 1.71 + 0.19e0.98t0.962
5.28Dv50 = 1.87 + 0.06e2.20t0.984
6.57Dv50 = 1.76 + 0.16e1.14t0.993
0.013.52Dv50 = 2.46 + 0.19e2.04t0.988
4.41Dv50 = 2.24 + 0.03e2.84t0.976
5.22Dv50 = 2.20 + 0.19e1.62t0.994
6.38Dv50 = 2.29 + 0.03e3.05t0.955
0.0013.68Dv50 = 2.66 + 0.28e2.01t0.993
4.32Dv50 = 2.60 + 0.21e1.64t0.958
5.53Dv50 = 2.58 + 0.18e2.06t0.980
6.46Dv50 = 2.50 + 0.19e1.60t0.976
Disclaimer/Publisher’s Note: The statements, opinions and data contained in all publications are solely those of the individual author(s) and contributor(s) and not of MDPI and/or the editor(s). MDPI and/or the editor(s) disclaim responsibility for any injury to people or property resulting from any ideas, methods, instructions or products referred to in the content.

