Article

The Characteristics, Enrichment, and Migration Mechanism of Cadmium in Phosphate Rock and Phosphogypsum of the Qingping Phosphate Deposit, Southwest China

1
College of Earth Sciences, Chengdu University of Technology, Chengdu 610059, China
2
Sichuan Province Key Laboratory of Nuclear Techniques in Geosciences, Chengdu 610059, China
3
Chengdu Center of China Geological Survey, Chengdu 610081, China
*
Author to whom correspondence should be addressed.
Minerals 2023, 13(1), 107; https://doi.org/10.3390/min13010107
Submission received: 22 November 2022 / Revised: 28 December 2022 / Accepted: 4 January 2023 / Published: 9 January 2023
(This article belongs to the Section Environmental Mineralogy and Biogeochemistry)

Abstract

:
Sedimentary phosphate rocks are characteristically rich in organic matter, and contain sulfides and a high concentration of trace elements, including cadmium (Cd), which is harmful to the human body. The mining of phosphate rock and phosphogypsum at Qingping has expanded the release of Cd into groundwater and farmland soil. To prevent and control Cd pollution it is critical to reveal the carrier mineral phase(s) and migration mechanism of Cd and other elements in phosphate rock and phosphogypsum. The elemental and mineral composition of bulk samples were analysed by XRF, ICP-MS, and XRD, respectively. The results showed that from phosphate rock to phosphogypsum, the main constituent elements changed from CaO (49.43%) and P2O5 (36.63%) to CaO (33.65%) and SO3 (>34%), and the main mineral changed from fluorapatite to gypsum. Among all the elements, the element transfer factor (ETF) of P2O5, F, Co, U, Cd, and other elements was low; the ETF (Cd) was only 10.85%, and only a small amount of Cd entered the acidic phosphogypsum during the production process. Raman spectroscopy analysis revealed two types of apatite: the brown–black apatite with organic matter (type 1) and the yellow–light brown apatite without organic matter (type 2). LA-ICP-MS analysis showed that the Cd element content in type 2 was lower, while the organic matter and Cd element content in type 1 were higher, suggesting that Cd may be controlled by organic matter, and the relationship with apatite is not apparent. Electron probe analysis and XRD semiquantitative results show that the content of Cd in pyrite is higher (511 ppm), which is significantly higher than that of bulk rock. In addition, pyrite is rich in Co, As, Ni, Zn, and other elements. The content of Cd in phosphate ore shows a good correlation with that of pyrite. Cd in Qingping phosphate rock is mainly controlled by organic matter and pyrite, and only a small amount of Cd is transferred to phosphogypsum. Reducing the environment leads to the enrichment of Cd in phosphate rock.

1. Introduction

Cd is a trace metal element that is toxic to humans, animals, and plants [1]. Due to its extremely long biological half-life, excess Cd poses a potential contamination threat to water, soil, and air. It can accumulate in the food chain, eventually causing harm to the human body and increasing the risk of various cancers [2,3,4].
There are natural and anthropogenic sources of Cd enriched in soil. The natural source of Cd in soil is mainly the release of elements from the parent rock caused by weathering [5,6,7,8]. Its content is affected by many factors, including the mineralogy and geochemical composition of the parent rock, organic matter content, particle size, moisture conditions, and vegetation [9,10]. However, Cd has very few independent minerals in nature, and it is usually dispersed in other rock-forming minerals in the form of isomorphism or mechanical mixing. Its leading natural carriers are Zn-Fe sulfides and carbonates, which are easily weathered and release Cd into the environment [11]. In contrast, anthropogenic sources usually come from sewage irrigation, phosphate fertilizers, mining activities, metal ore processing and smelting, and atmospheric dust fall [12,13,14]. Studying the source of Cd has always been a hot topic in heavy metal research. The typical features of sedimentary phosphate rock include high organic matter, sulfide minerals, and a variety of high concentrations of trace elements, such as Ag, Sr, Ba, Cd, Zn, Ni, Sc, Cr, V, U, Y, and REE [15,16,17,18]. Compared with shale, Cd accumulation in phosphate rock is more active than all other elements and is the most enriched trace element. The average content of Cd in phosphate rock is 18 ppm, which is 60 times higher than that in shale (0.3 ppm) [19,20]. In different phosphate deposits worldwide, the Cd content is highly variable, ranging from a few ppm to several hundred ppm. The average Cd concentration in some phosphate deposits is significantly higher than the world’s average phosphate mine. The Cd content of phosphate ores in China is low, generally in the 0.1 to 4.4 mg/kg range [21].
Western Sichuan is rich in phosphate rock resources. It hosts Shifang-type phosphate deposits, Qingping-type phosphate deposits, Hanyuan-type phosphate deposits, and other marine sedimentary phosphate deposits, geologically located in the Longmen–Daba Mountain area, northwest of the upper Yangtze block, and these are the primary sources of raw materials for phosphate chemical enterprises in this region [22,23]. Phosphate mining in the area is mainly concentrated near the upper reaches of the Mianyuan River and Shiting River [24]. Due to the thickness of phosphorus-bearing strata and the limited exposed area, its distribution range is minor, and the degree of influence (e.g., content and range) is limited [25]. However, phosphate mining and production processes have expanded in scope, with sulfides, carbonates, and phosphates in the ore breaking down, releasing Cd and other impurities into the environment, and transferring into the fertilizers or remaining present in phosphogypsum [26,27]. The long-term piled phosphogypsum is eroded and leached by natural rainfall, which not only cause the Cd to migrate, entering the surrounding rivers and soil, but also cause environmental pollution, and seriously endanger the local ecological environment and the health of residents. Phosphate mining, phosphate fertilizer application, and phosphogypsum accumulation have become the primary sources of Cd pollution in groundwater and agricultural soils in this area [28,29].
Most authors have studied the relationship between Cd and P in phosphate rock, and these studies mainly focused on the geochemical characteristics [17,30] and enrichment characteristics of Cd [21,30,31,32]. Regarding the carrier phase of Cd in phosphate rocks, it is generally suggested that (1) Cd may be concentrated in apatite [33,34,35] or calcite [36] by isomorphous substitution of Ca. In this case, Cd is positively correlated with P2O5 [30]. (2) No correlation between P2O5 and Cd implies that Cd is related to organic matter [37,38], and (3) sulfide minerals such as pyrite (FeS2) are major constituents of reduced systems and thus important sources and sinks for Cd [39,40]. However, to our best knowledge, far fewer studies have focused on the carrier phase of Cd in phosphate rock from Qingping, which seriously constrains the understanding of Cd enrichment and migration mechanisms in phosphate rocks and phosphogypsum.
In this contribution, we present a detailed study investigating the in situ elemental composition of pyrite and apatite, and Raman spectral mapping characteristics of apatite and organic matter, in combination with the major and trace element contents, and the X-ray diffraction patterns of both phosphate rock and phosphogypsum, in order to reveal the carrier phase of Cd in phosphate ore and its enrichment and migration mechanisms in phosphate rock and phosphogypsum. The results are of great significance for the prevention and control of Cd pollution.

2. Sampling and Methods

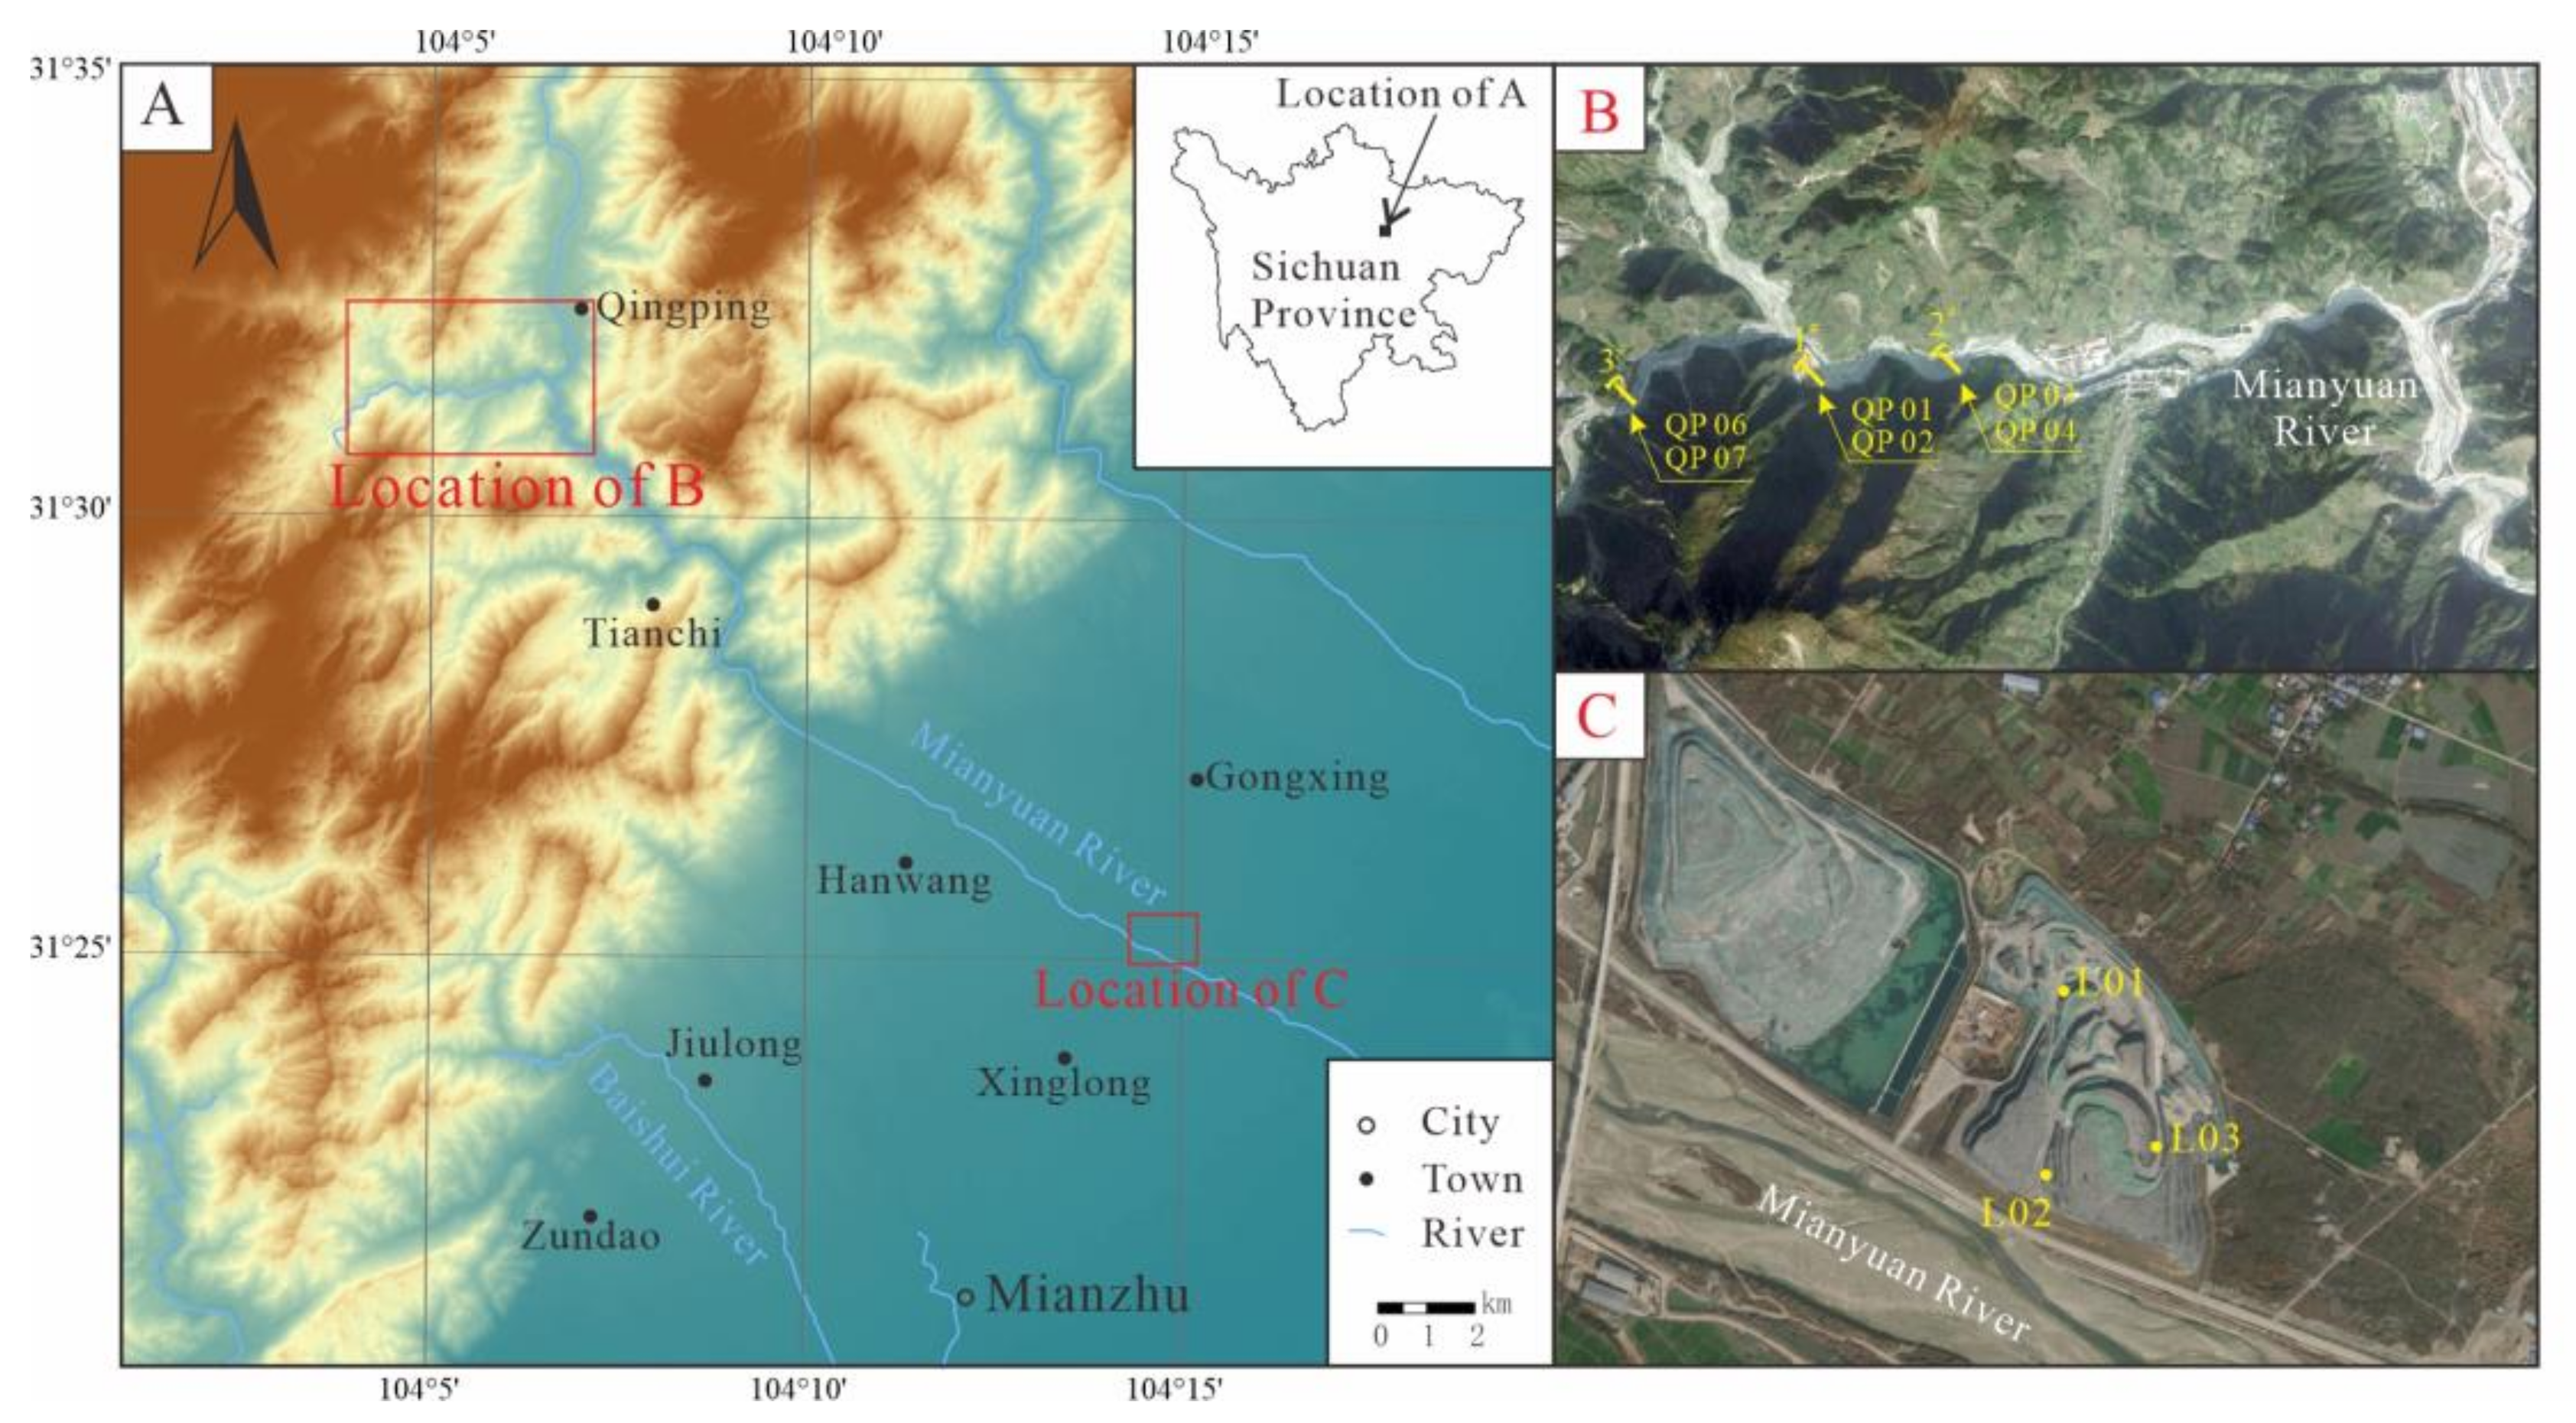
2.1. Sample Collection

The Qingping phosphate rock in the upper reaches of Mianyuan River, Qingping Town (31°30′04″ N~31°31′36″ N, 104°03′15″ E~104°66′55″ E), Mianzhu City, Sichuan Province, China. The deposit is a marine sedimentary phosphate deposit occurring at the bottom of the Upper Devonian. The main host rock is the dolomite of the Upper Devonian Shawozi Formation [41,42]. The phosphogypsum pile is located on the north bank of the Mianyuan River (31°25′1.64″ N, 104°14′58.79″ E), and is the by-product of Qingping phosphate rock produced by the wet chemical treatment to produce phosphoric acid.
The positions of all samples are shown in Figure 1. A total of 6 rock samples (3 phosphate rocks and 3 surrounding rocks) were collected in the three open pits: (1) samples QP02, QP03, and QP07 were phosphate rocks, and (2) samples QP01, QP04, and QP06 were surrounding rocks. Moreover, samples L01, L02, and L03 were phosphogypsum sampled in the phosphogypsum pile. The ore is gray–black, has a cryptocrystalline–microcrystalline structure, and brecciated structure. Samples from phosphate rock, surrounding rock, and phosphogypsum were grinded to powder, then were sieved through 200 mesh and stored in a polypropylene bag for bulk rock compositional and X-ray diffraction analyses. In addition, samples from phosphate and surrounding rocks were prepared as polished thin sections for Raman spectroscopy mapping and in situ elemental analyses.

2.2. Sample Analysis

2.2.1. pH Determination

The pH of phosphate rock and phosphogypsum was determined by mixing the samples with deionized water at a solid–water ratio of 1:2.5 and using a PHS-320 Acidity Meter(Fangzhou, Chengdu, China) to measure the pH of the supernatant after centrifugation.

2.2.2. Bulk Rock Compositional Analysis

The bulk compositional of the phosphate rock and phosphogypsum was conducted in the ALS laboratory group (ALS Minerals–ALS Chemex, Brisbane, Australia) in Guangzhou. Major element analysis was performed by X-ray fluorescence spectrometry (XRF, PANalytical Axios Adv PW4400, Almelo, Netherlands). After the samples were digested with a mixture of HCl, HNO3, HF, and HClO4, trace elements were measured using an inductively coupled plasma mass spectrometer (ICP-MS, Agilent 5110, Santa Clara, CA, USA). Quality control was performed using blanks, replicates, and reference materials. For all samples, the analytical results of the reference material were within ±10% of the certified value, and the relative standard deviation (RSD) value of the replicates was within 5%.

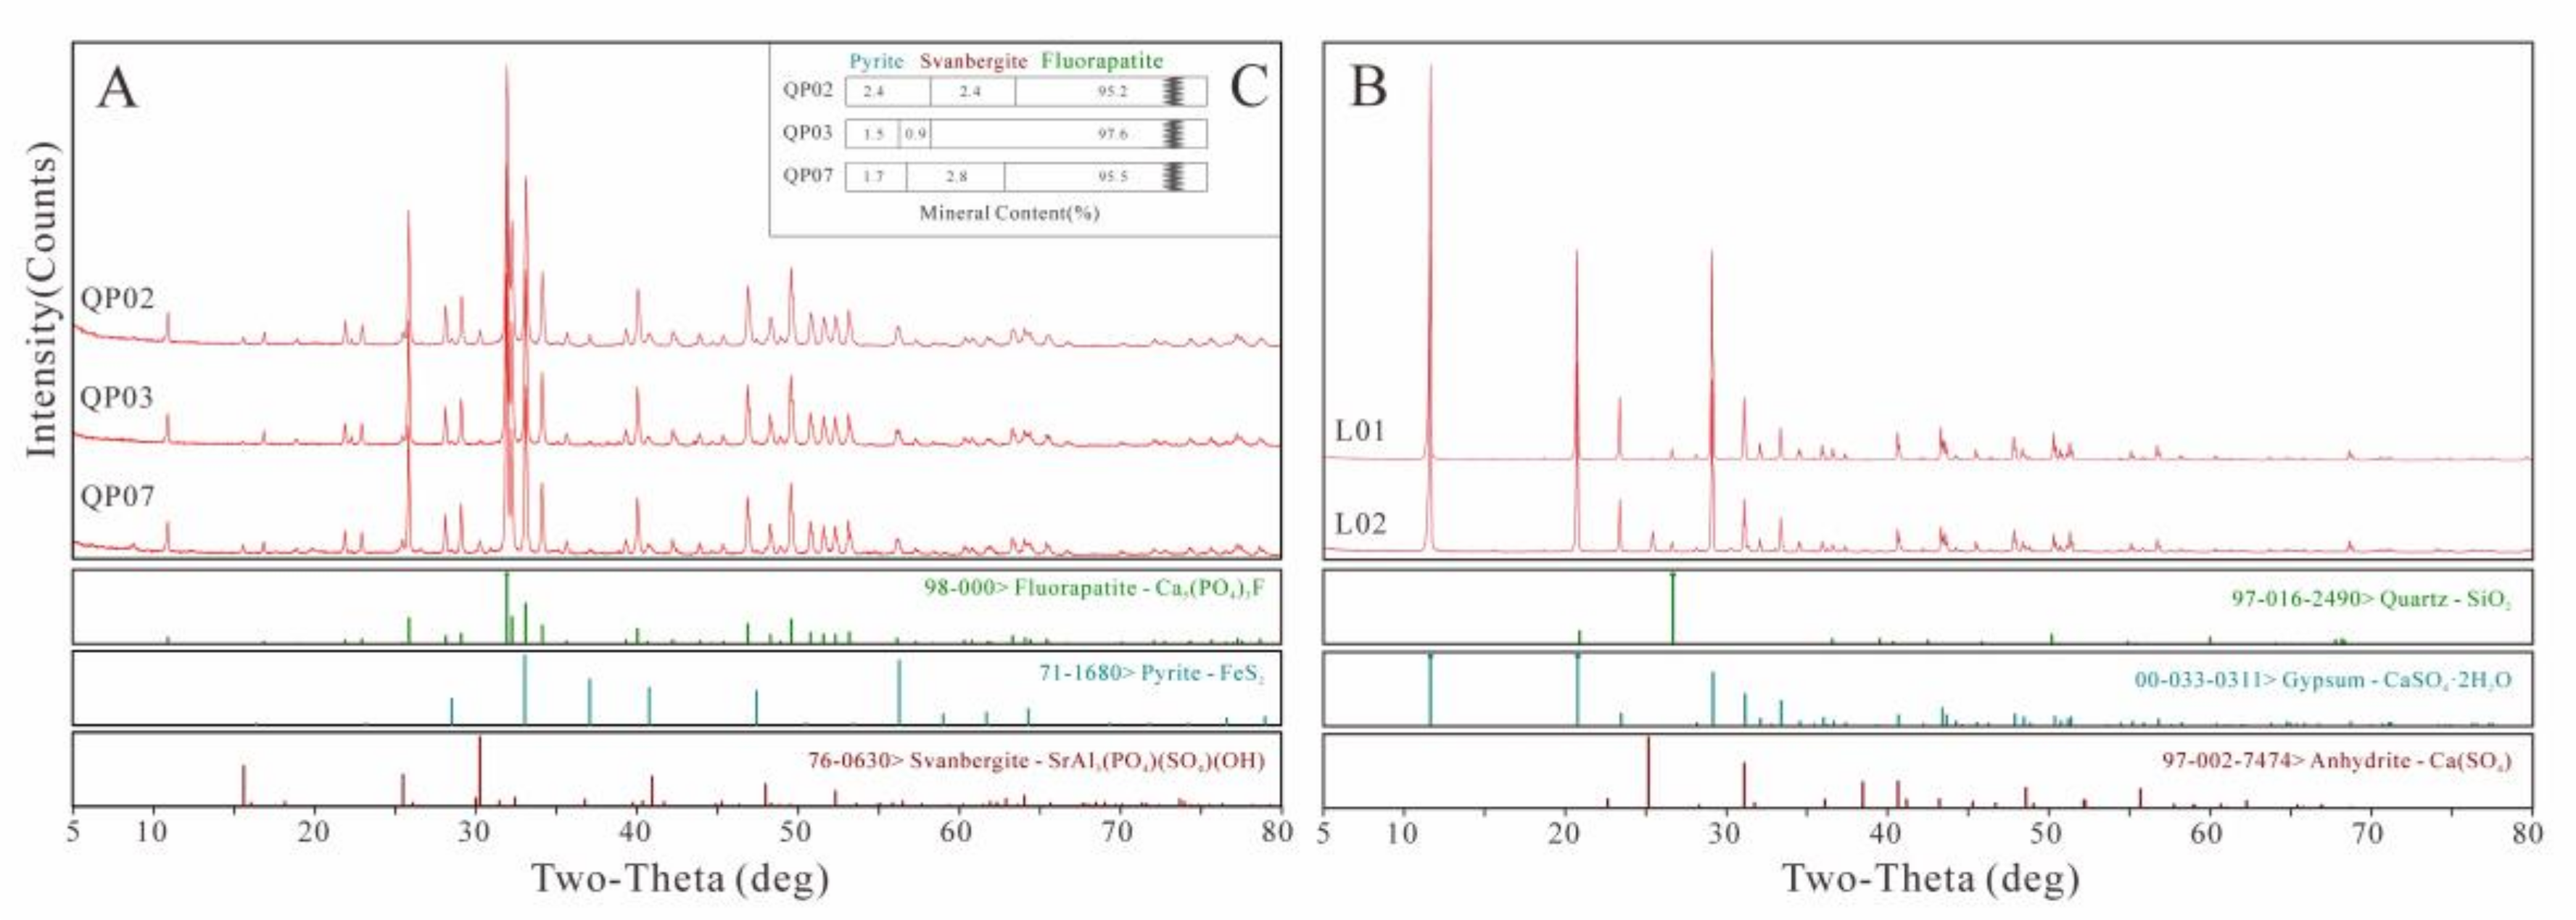
2.2.3. X-ray Diffraction Analysis

To identify the mineralogical compositions, the phosphate rock and phosphogypsum were grinded to a powder with a grain size of <40 um and analyzed by X-ray diffraction (XRD, BRUKER-D8 ADVANCE, Hannover, Germany). The analysis used Cu Kα radiation at 36 kV and 36 mA and a scan in the range of 5–70° (2θ) at Chengdu University of Technology(Chengdu, China). The bulk rock minerals were identified by the characteristic mineral diffraction peaks, and semiquantitative phase abundances were determined by Rietveld refinement using the WPF module of JADE 9.0 software [43].

2.2.4. Raman Spectroscopy Mapping Analysis

Raman analysis of apatite and organic matter in the phosphate rock was carried out at the State Key Laboratory of Ore Deposit Geochemistry (SKLODG) in Guiyang, using a LabRAM HR Evolution with an open space microscope equipped with a 20× objective (NA 0.25) to obtain LRS analyses. The laser spot was ~2 μm in diameter. A backscattering geometry was used in the 100–1600 cm−1 range, using a 600 L.mm−1 grating. The Raman spectra were acquired by a 532 nm laser, using a power of about 25 mW, and two consecutive acquisitions that lasted 20 s each. Mapping was performed under the same conditions, with a step size of 20 μm. The acquired data were restored in the LabSpec 6 Spectroscopy Suite software package, with background subtraction and modest manual correction for baseline position.

2.2.5. In Situ Elemental Analysis

The major and trace elements of apatite and pyrite in the phosphate rock were determined on a JEOL JXA-8230 electron probe microanalyzer (EPMA, Akishima-shi, Japan) of Nanjing Hongchuang Geological Exploration Technology Service Company (Nanjing, China). The accelerating voltage, beam current, and beam diameter was 15 kV, 5 nA, and 20 μm, respectively. The relative standard deviations of the analyses of standards were within 3% for the major elements. All analyses had an acceptable total (between 98 and 102%).
In situ major and trace element analysis of apatite in the phosphate rock were performed by the same company with an Agilent 7700× quadrupole ICP-MS (Santa Clara, CA, USA). The laser ablation spot is 35 μm in diameter, and the depth of the laser ablation is 20~40 μm. The Ca content in phosphate rock was measured by EPMA and used as an internal standard to correct matrix effects, signal drift, and differences in the ablation yield between samples and reference materials in ICP-MS. The external standards used for the apatite in situ analysis are G_NIST610, G_NIST612, G_BCR2G, BIR-1G, and G_BHVO2G. The LA-ICP-MS data agree well with the recommended values of the standards, and precision is higher than 5% for most elements.

3. Results

3.1. Characteristics of Major and Trace Elements in Phosphate Rock and Phosphogypsum

Table 1 summarizes the results of the chemical analysis of significant elements, measured in representative samples of phosphate rock, surrounding rock, and phosphogypsum.
The element contents among different samples are similar in the present study. CaO and P2O5 are the main components of the ore samples, and the Ca/P molar ratio ranges from 1.69 to 1.71, indicating a uniform distribution; the content reaches 46.5%–52.2% and 34.8%–38.5%, respectively, and the proportion of the total composition exceeds 80%. Other impurities (Al, S, F, Si, Fe, Sr, K, Ti, Mg, Na, and Mn) are low in content. Compared with phosphate rock, the Al2O3 and SiO2 in the surrounding rock are higher, and although the P content in the surrounding rock is lower, it also reaches 9.94%. The composition of phosphogypsum was found to be completely different from that of phosphate rock, showing an evident prevalence of CaO (33.65%) and SO3 (>34%), followed by SiO2 (4.74%), Al2O3 (2.3%), P2O5 (1.82%), and Fe2O3 (1.38%). The levels of other impurities remained lower than 1% (Table 1, Supplementary Materials Table S1). Compared with other Shifang-type phosphate rocks, the contents of CaO, P2O5, and F in Qingping phosphate rock are slightly higher.
Table 2 shows the concentrations of trace elements in phosphate rock and phosphogypsum samples (concentrations ≥ 10 ppm in PR and ≥1 ppm in PG). Ba was the most abundant trace element in the phosphate rock and phosphogypsum samples, with concentrations of 216.67 ppm and 215 ppm, respectively. The increasing order of element concentrations in the phosphate rock was found to be as follows: Zn > Cr > Ce > Y > La > Cd > V > U > Ba > Mn > Ni > Se > Cu > Th. That for phosphogypsum was found to be Ba > Li > Zn > Cr > La > Ce > Zr > Pb > Cu > V > Hg > Mn > Ni > As > U > Co > Rb > Nb > Th > Ga > Sc > Cd (Table 2, Table S1).
In particular, the Cd content in phosphate rock (1.75–5.17 ppm) was significantly higher than that in surrounding rocks (0.04–0.38 ppm) and phosphogypsum (0.15–0.58 ppm). The content of Cd in phosphate rock was similar to China’s phosphates (0.1–4.4 ppm) [21]. However, it is significantly lower than the world average phosphate rock Cd content (18 ppm) [19].
The pH is known to be a major factor that affects Cd mobility [46]. Although Cd is immobile in oxide, phosphate, and carbonate minerals under alkaline and neutral conditions, it can become mobile in acidic waters due to dissolution of its host mineral [47]. The pH of phosphate rock was very close to neutral (7.28), phosphogypsum was acidic (4.66), and the Cd content was significantly correlated with the pH of phosphogypsum. The lower the pH, the higher the Cd content. This phosphogypsum acidity may result from residual acids such as H3PO4, H2SO4, and HF that were not efficiently separated from the industrial process. In addition, the different composition and pH of the phosphogypsum samples may also be related to their weathering history, and samples leached through atmospheric precipitation may lose more residual acids and soluble trace elements than samples with relatively little contact with water.

3.2. Types and Contents of Minerals in Phosphate rock and Phosphogypsum

Figure 2 shows that the main mineral of phosphate rock is fluorapatite (95.2–97.6 wt.%). Svanbergite is also an essential P-bearing mineral (Figure 2a). In addition, there is a small amount of pyrite (1.5–2.4 wt.%). The pyrite content correlates with the Cd content. QP02 with higher pyrite content has more Cd (5.17 ppm); samples with less pyrite have relatively low Cd. In addition, all analyzed phosphogypsum samples showed the same composition, with the vast majority being gypsum, and small amounts of quartz and ankerite.

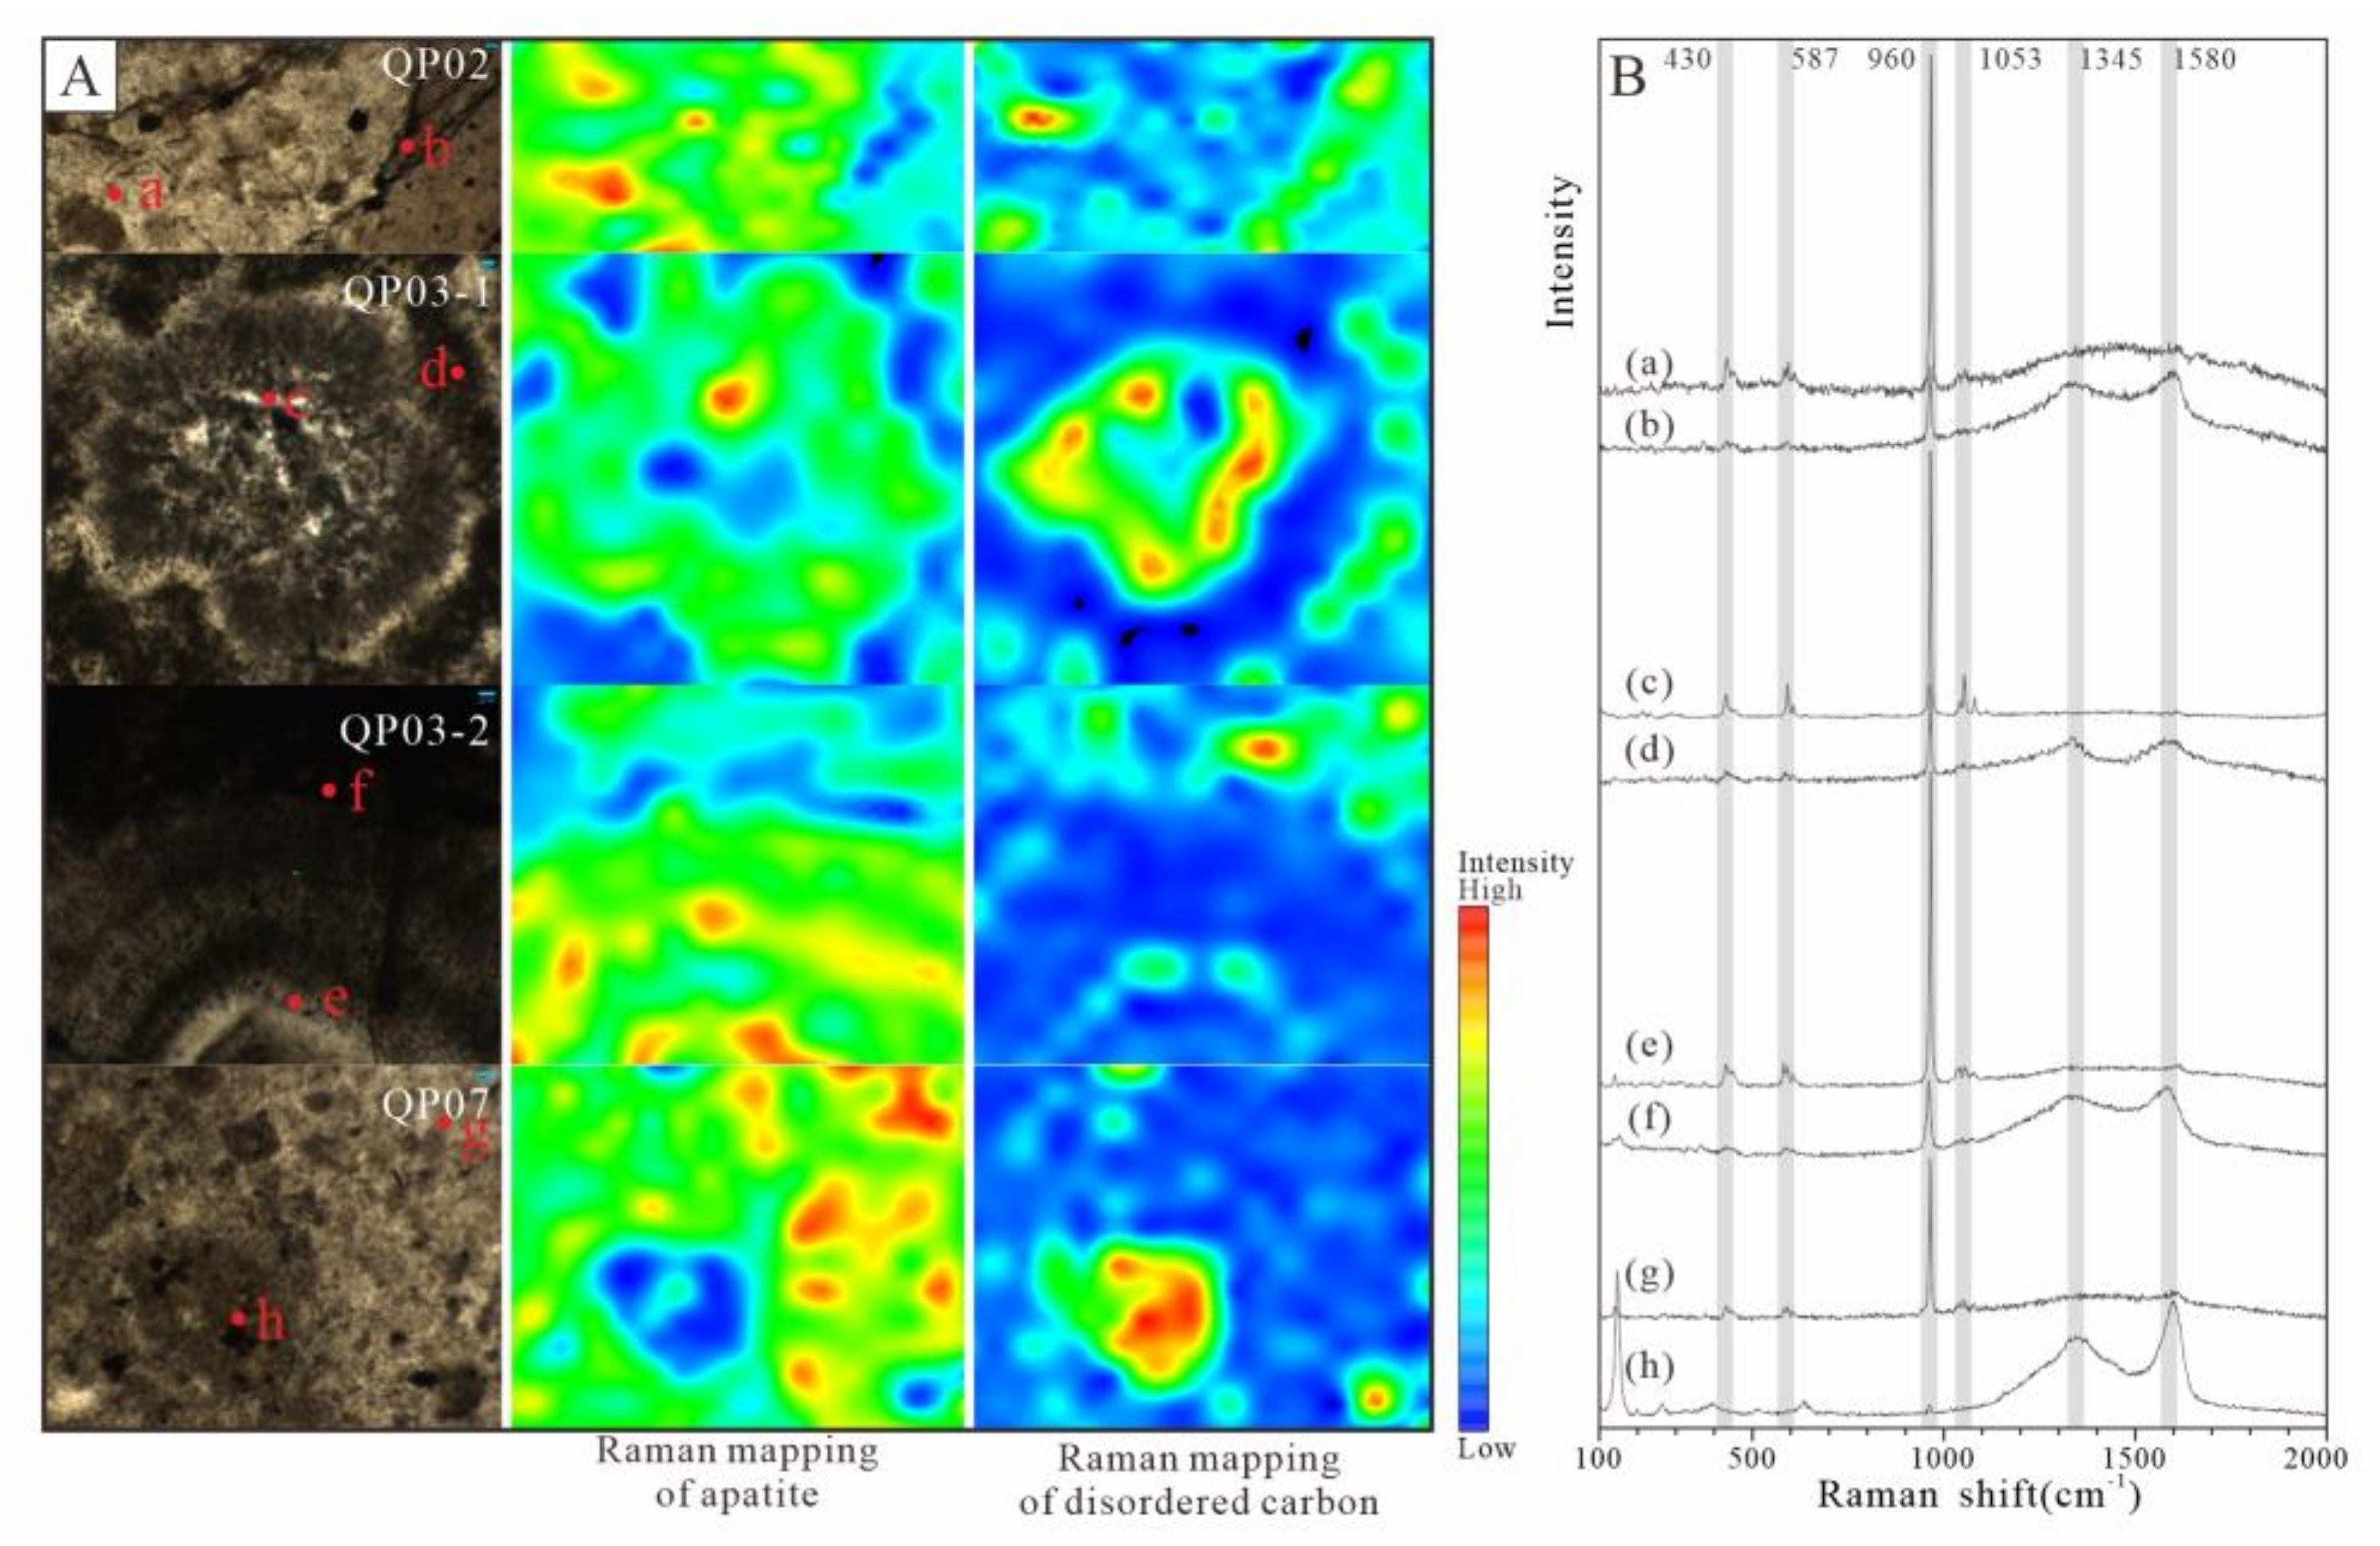
3.3. Raman Spectral Characteristics of Apatite and Organic Matter

The color of collophanite in thin sections depends on the content of impurities such as organic matter. If there are no or minor impurities, it is yellow–light brown microcrystalline with the development of fractures. In contrast, organic-matter-bearing collophanite often shows a brownish dark brown color [48]. Four regions with obvious differences were selected for Raman spectroscopy analysis.
Four distinct regions were selected and scanned with a step size of 20 μm to distinguish organic matter and phosphate minerals closely related to Cd content and then to investigate the distribution of Cd content. Figure 3 indicates that the four samples show a strong peak around 960 cm−1, corresponding to the V1(PO4) mode [49,50]; 430 cm−1 is the V₂(PO₄) mode with a broad peak; 1038 and 1053 cm−1 is assigned to the V₃(PO₄) stretching vibration, and 587 cm−1 is assigned to the V₄(PO₄) bending vibration. Except for the V₁(PO₄) mode from the measured spectra, the other three vibrational modes have lower intensities. The two peaks at 1345 and 1580 cm−1 are characteristic peaks of disordered carbon. The peak at 1345 cm−1 is the D band of disordered carbon, and 1580 cm−1 is the G band of disordered carbon [49,51]. The degree of brightness and darkness observed under the microscope correlates with the peak intensities of phosphate minerals and organic matter.
Taking Figure 3B(a,c,e,g) as an example, the spectrum has a strong peak at 960 cm−1 and is not obvious at 1345–1580 cm−1, indicating that these points are fluorapatite; the organic matter peak in Figure 3B(b,d,f,h) is strong, often accompanied by a low-intensity apatite.
The micro-distribution characteristics of organic matter and apatite were distinguished by Raman spectroscopy based on the intensity of the apatite peak at 960 cm−1 and organic matter peak at 1345–1580 cm−1. Comparing the distribution characteristics of apatite with organic matter, their peak intensity has a significant negative correlation. In the darker areas, the strength of organic matter is high, and the strength of apatite is low. The brighter area shows the opposite relationship.

3.4. In Situ Element Characteristics of Different Carriers

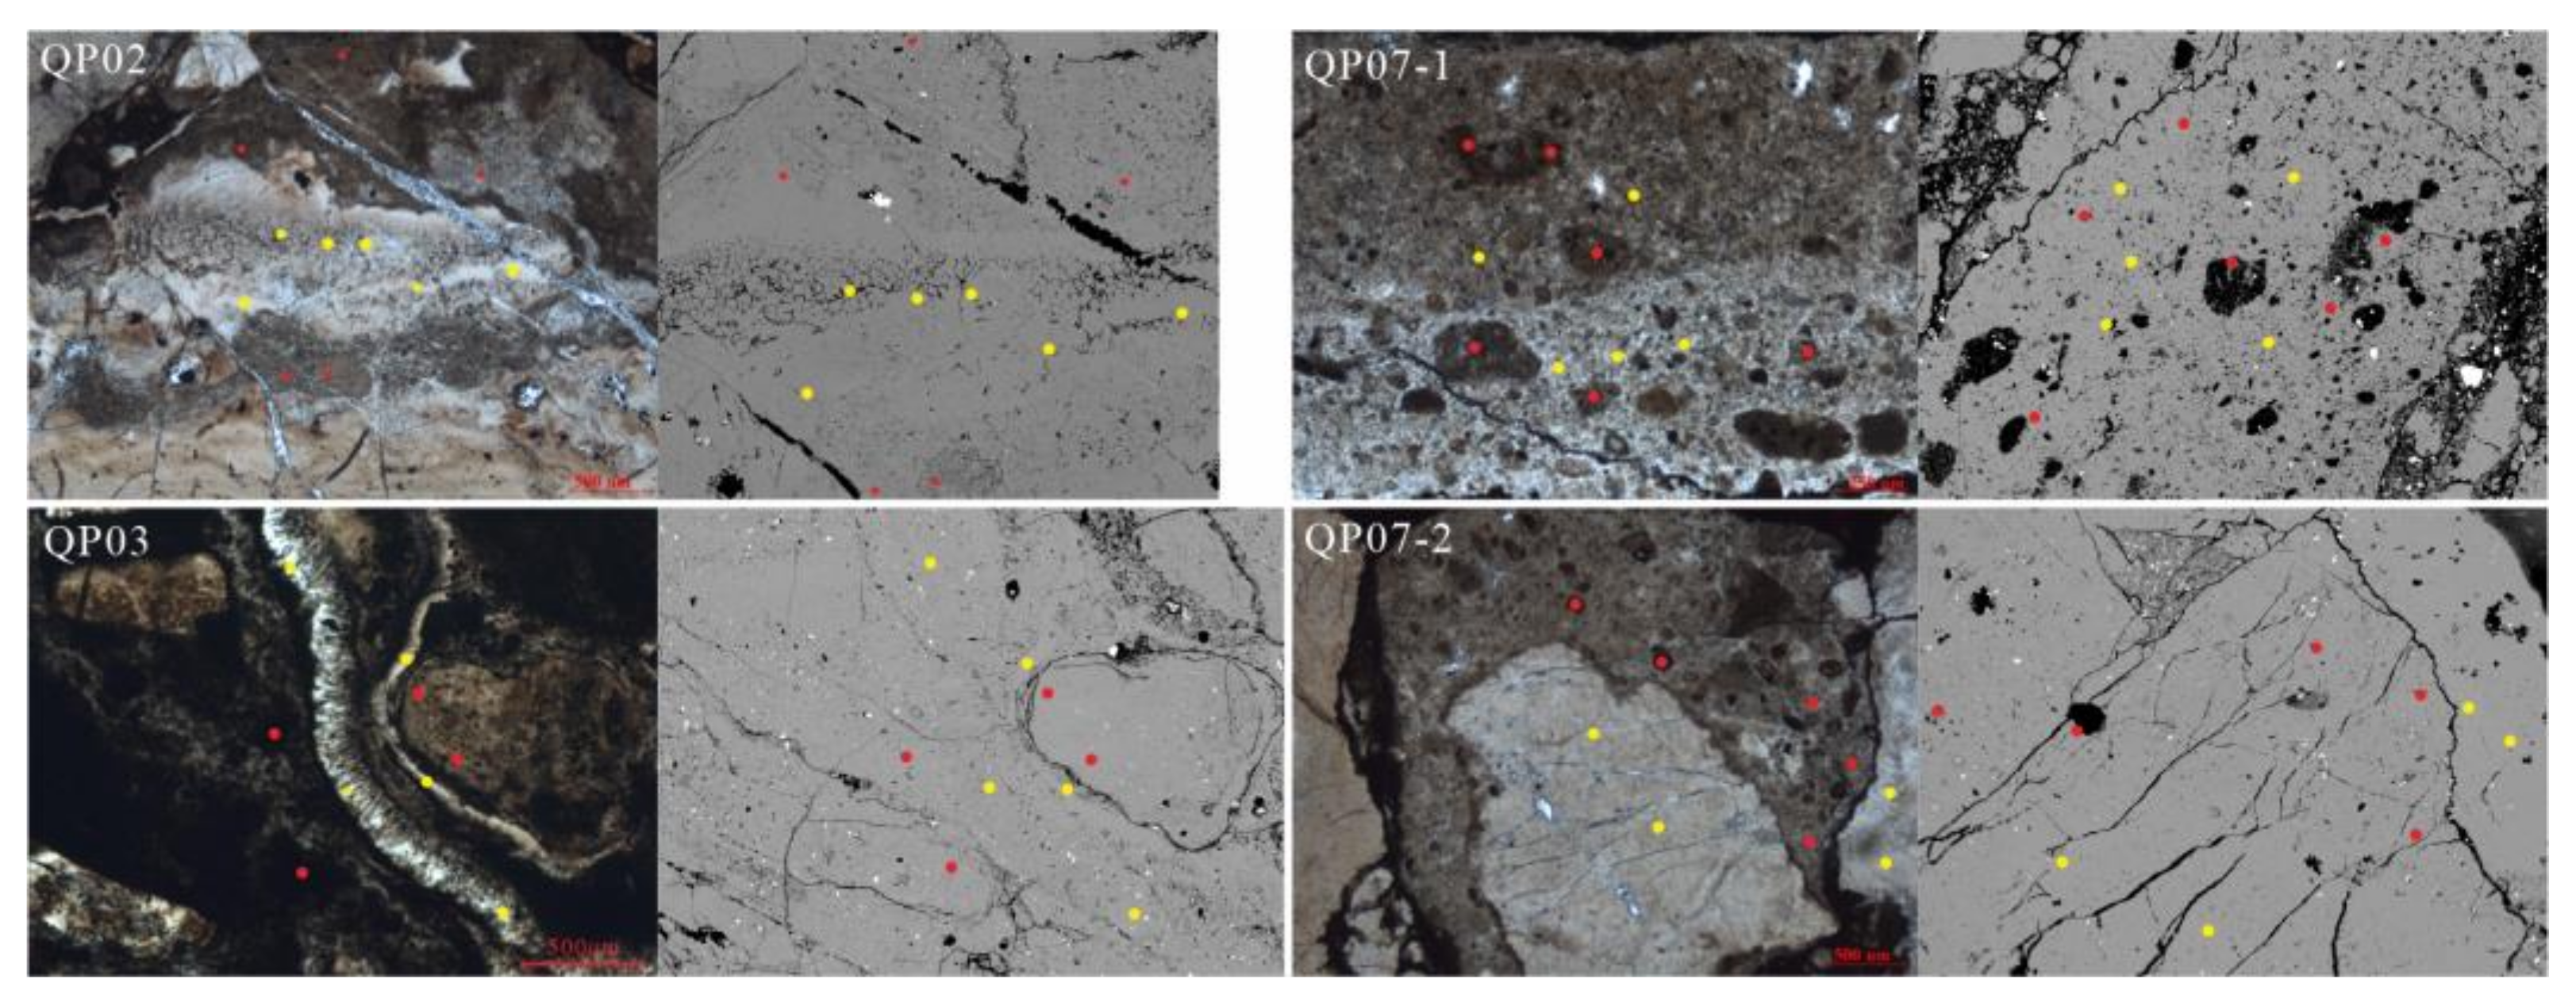
3.4.1. Element Characteristics of Apatite Tested by EPMA

According to the results of Raman spectroscopy analysis, two types of apatite are identified: type 1 is the brown–black apatite, which is mainly composed of phosphorus bands and elliptical and sub-circular phosphorus debris particles, and organic matter; type 2 is the yellow–light brown apatite without organic matter. Then we selected representative points for electron probe analysis (Figure 4).
Table 3 shows the elements having a content greater than 0.1 wt.%. The concentrations of Ca, P, and F are determined by EPMA, with ratios of Ca/P molar ratio = 1.69–1.71 and Ca/F molar ratio = 4.55–4.9 (Table S2). They differ from the theoretical stoichiometry of fluorapatite, Ca/P = 1.67 and Ca/F = 5.0, and indicate mostly a deficiency in Ca relative to P, and enrichment in Ca relative to F. Compared with the bulk rock results, the Ca/P is equal, but the Ca/F is slightly lower.

3.4.2. Element Characteristics of Apatite Tested by LA-ICP-MS

Compared to bulk rock element content measurements, laser ablation inductively coupled plasma mass spectrometry (LA-ICP-MS) enables microanalysis of specific minerals in a specific area to accurately track chemical composition changes at a microscopic scale in relationship to mineral fabric [52,53].
Due to the apparent differences in the distribution of phosphate minerals and organic matter, the in situ measurement of element content by LA-ICP-MS can establish the relationship between Cd and the content of phosphate and organic matter and then explore the primary carrier of Cd. In Table 4, analytical element contents have similar characteristics in four different regions from type 1 and 2 apatite; except for P, the average contents of the other elements are higher in type 1 (Table S3). The P content characteristic corresponds to the higher intensity of phosphate in the brighter regions indicated by Raman spectroscopy.

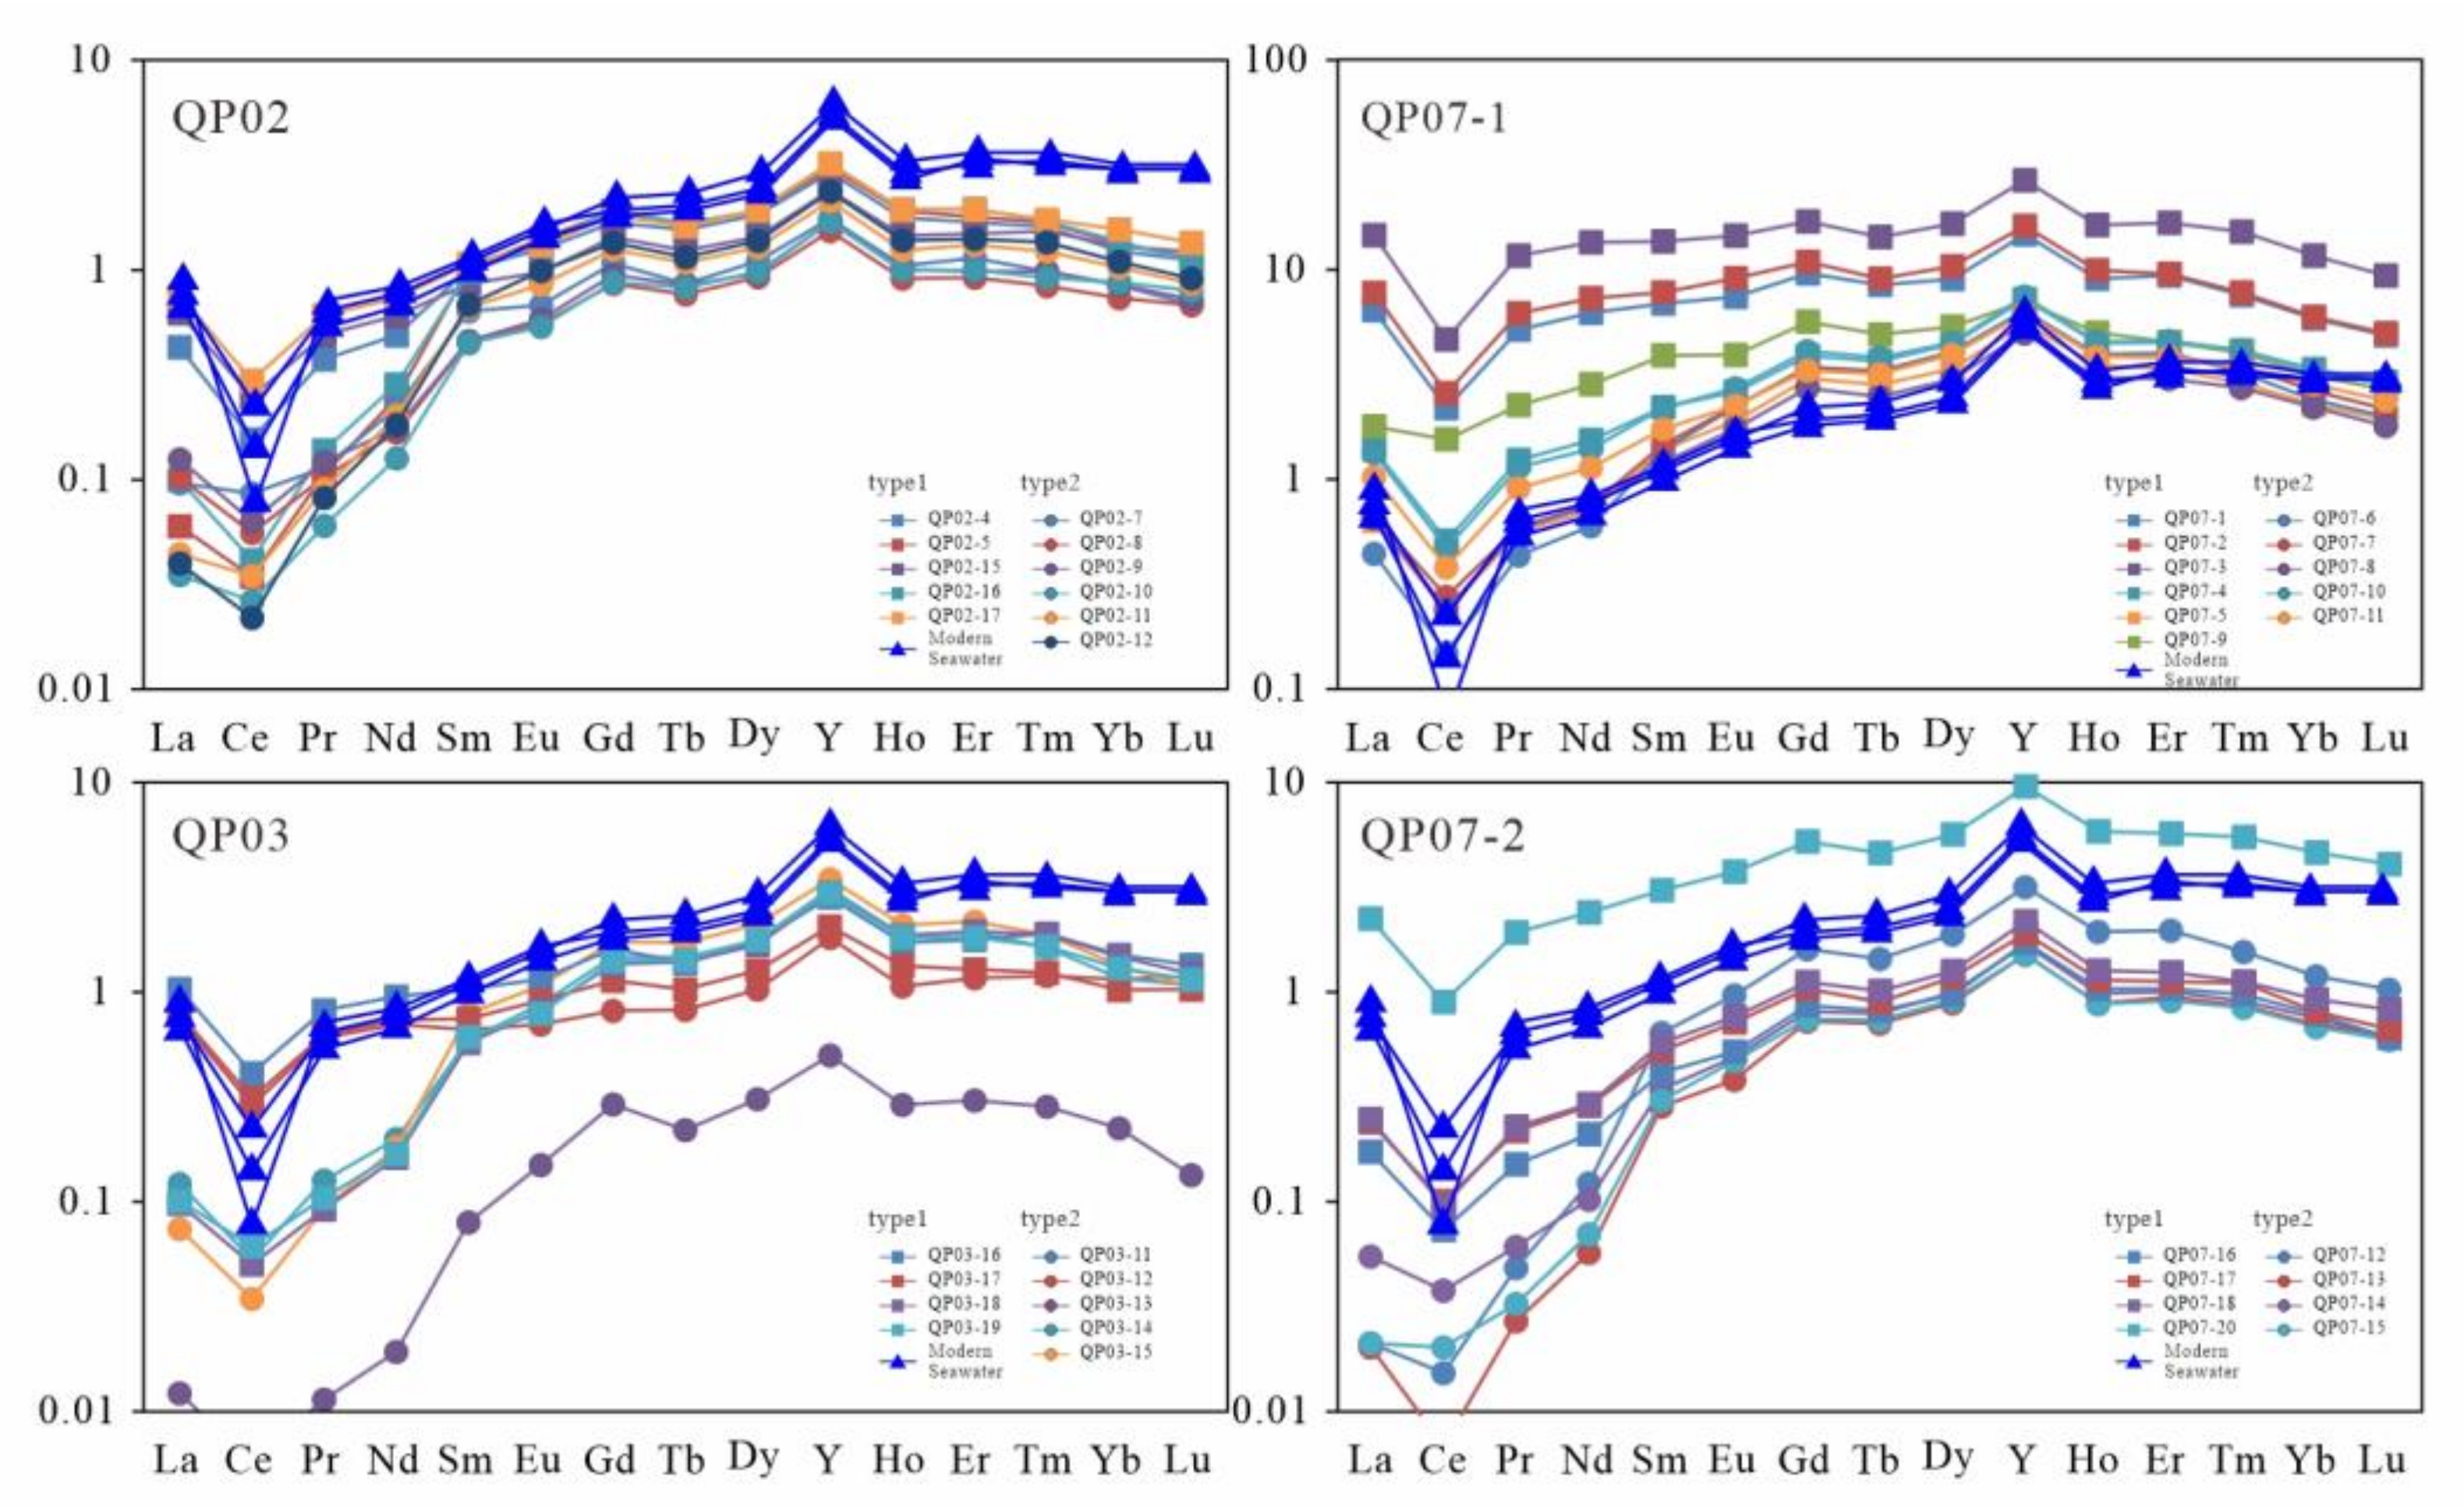
3.4.3. REE + Y Characteristics of Apatite Tested by LA-ICP-MS

Table 5 shows the content of REE+Y analysed by LA-ICP-MS. To visualize the elemental fractionation relative to the continental source and remove the even–odd variation in their natural abundances, REE concentrations are normalized to the values given in the literature for Post Archean Australian Shale (PAAS) in Figure 5 [54,55]. Ce anomaly: Ce / Ce * = Ce N / La N   ×   Pr N [56].
REE and Y patterns of samples show similar signatures, though they exhibit different enrichment factors. The REE and Y patterns are very close to the universal seawater pattern. They display negative Ce anomaly, a depletion in LREE (La-Eu), and an enhancement in HREE (Gd-Lu) with a significant positive Y anomaly.

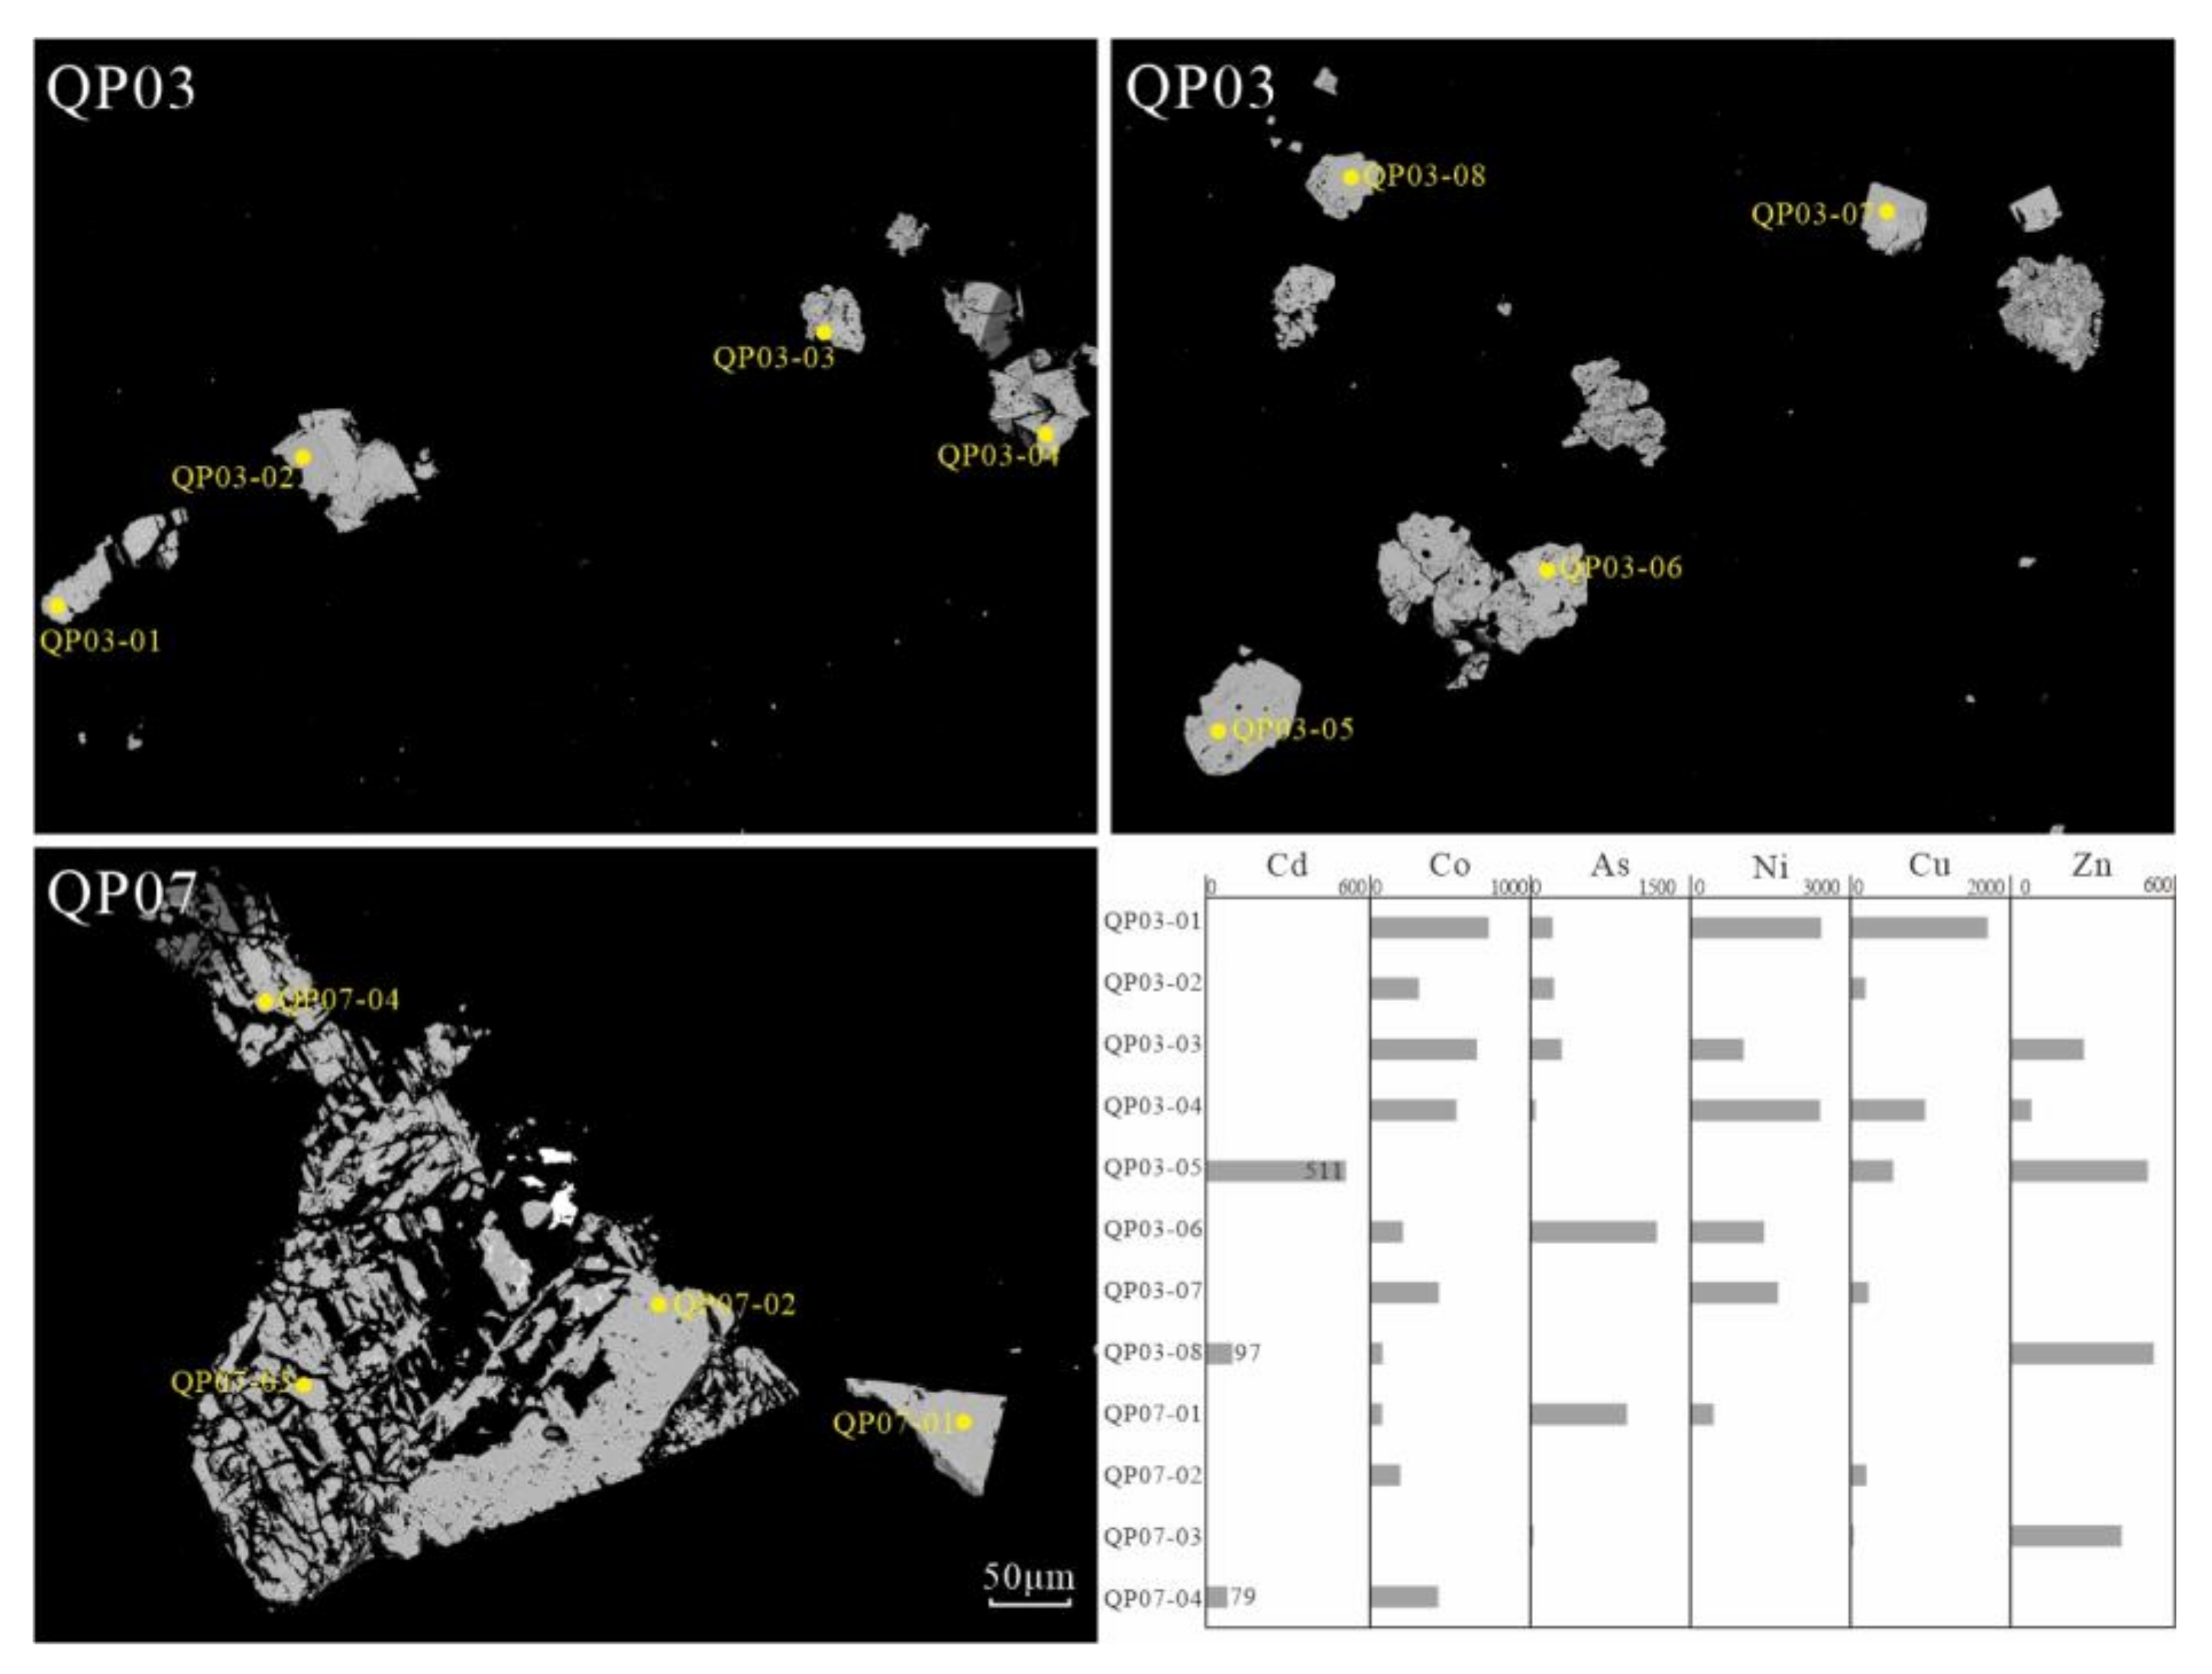
3.4.4. Element Characteristics of Pyrite Tested by EPMA

Twelve points were selected and analysed with EPMA (Figure 6), EPMA analysis provides insights into the mineral occurrence of Zn and Cd in ores on a particle (micrometer) scale. The formula FeS2 represents the ideal chemical composition of pyrite. The S/Fe ratio of iron ore is theoretically approximately 2, and the variation range is 1.8 to 2.1. However, because Fe and S are often replaced by other elements isomorphically, the S/Fe ratio of pyrite is partially different from the theoretical value 2. In addition to basic Fe and S, natural pyrite also contains a small amount of other minor and trace elements, such as Co, Ni, Cu, As, etc. Earlier studies reported a range of a few ppm to tens of ppm for the content of Cd in pyrite [57]. In our EPMA study, Cd was detected in one-quarter of the points, and the highest content was 511 ppm (Table S4).

4. Discussion

4.1. Element Transfer Factor (ETF) from Phosphate Rock to Phosphogypsum

The great majority of economically significant sedimentary phosphate deposits are marine deposits that formed in active margin basin, epicontinental sea, or shelf environments. In total, 90% of the world’s phosphate ore production is used to produce phosphate fertilizer [18]. A large number of impurities in the ore can be transferred to the fertilizer and phosphoric acid in the production process, and the remaining impurities exist in various production wastes. Phosphogypsum is the main by-product of phosphate rock produced into phosphate fertilizer by the H2SO4 wet process, in which more than 90% of the solid components are gypsum matrix (CaSO4·2H2O), and also contains a large number of insoluble impurities (such as quartz, undissolved apatite, phosphate and sulfate, etc.), organic substances, etc., released from phosphate raw materials [58], which can become the carrier of Cd. However, it is unclear what chemical form of the cadmium trace element in phosphogypsum is [26,59]. Ideally, the production process of H3PO4 is as follows:
Ca 10 ( PO 4 ) 6 F 2 + 10 H 2 SO 4 + 20 H 2 O     6 H 3 PO 4   + 10 CaSO 4 · 2 H 2 O + 2 HF
Phosphogypsum has similar physical properties to natural gypsum, with particle density ranging from 2.27 to 2.40 g/cm3 [60]. Generally, there are a large proportion of medium and fine particles, with a faster dissolution rate than the extracted natural gypsum, making the heavy metals transfer to the surrounding environment easily [61].
The elemental content of phosphogypsum depends on the nature of the phosphate rock, the type of process used, the time of stacking, and any contaminants that may introduce phosphogypsum. Although the transfer rate of Cd from phosphate rock to phosphogypsum is only 30%–54% in the process of wet process phosphoric acid, the acidity of fresh phosphogypsum can keep the trace elements dissolved from phosphate rock in a potential flow state, making phosphogypsum an easier source of heavy metals, fluoride, radionuclides, and other pollutants than the original rock. Heavy metal elements are often enriched in farmland soil and stream sediments around phosphorus chemical enterprises and phosphogypsum accumulation areas [62,63].
Many impurities in phosphate rock enter the acid product to varying degrees or are concentrated in the gypsum by-product. The element transfer factor (ETF) was estimated to determine the contaminant’s dynamic from phosphate rock to phosphogypsum. ETF was calculated according to the following equation proposed by reference [26].
ETF = 1 σ × [ Total   element   concentration ] phosphogypsum [ Total   element   concentration ] phosphate   rock × 100
where σ is a mass normalization factor, which can be estimated to be 1.5 kg of phosphogypsum per kilogram of treated phosphate rock [26,64].
As shown in Table 6, the estimated ETF value varied between 3.31% (for P2O5) and 2584.47% (for Zr), and compared to some other reports, the ETFs of CaO and P2O5 are equivalent [65,66]. The descending order is as follows: SO₃ > SiO₂ > Nb > V > MnO > Ba> SrO > Cr > MgO > TiO₂ > Fe₂O₃ > Ce > CaO > La > Pb > Na₂O > Al₂O₃ > K₂O > Rb > Ga > Th > Cu > Zn > As > Sc > Li > Mn > Ni > Cd > U > Co > F > P₂O₅. Except for Zr, SO3, and SiO2, all other elements have ETF values below 100%, indicating that these elements are directly transferred from phosphate rock to phosphogypsum through the wet process; sulfates may be derived from sulfuric acid added during industrial production. The low ETF of P2O5 (2.4) shows that P can be effectively extracted during the production process. Cd may be released during the ore roasting process with the decomposition of carbonate, sulfides, and organic matter [67]. The Cd extraction process before the production of phosphate fertilizers takes advantage of the occurrence characteristics of Cd; that is, the crystal structure of apatite is destroyed by calcination or dissolution to release Cd [68].
Phosphogypsum is acidic due to residual phosphoric, sulfuric, and fluoric acids in the pores, and the pH of phosphogypsum with longer stacking years may be close to neutral [69]. Although the transfer rate of Cd from phosphate rock to phosphogypsum is low during wet phosphoric acid, the acidity of fresh phosphogypsum keeps the dissolved trace elements from phosphate rock in a potentially fluid state, making phosphogypsum more dangerous than the original rock. It is more likely to become the emission source of heavy metal elements, fluorides, radionuclides, and other pollutants [26].
The Cd content of the Qingping phosphate rock is obviously lower than that of the average world phosphate rock and phosphate rock from other places, which basically conforms to the Cd content characteristics of phosphates in China (Table 7). However, the actual pumping capacity of a substance does not depend on the total metal content, but rather on the fraction that may potentially affect the environment, i.e., the mobile metals. The Cd in most ores is strongly related to the crystal structure (nonmobile fraction) of minerals (such as apatite, pyrite, etc.). With the destruction of the mineral structure, a part of Cd is transformed into the mobile fraction mainly for adsorption in phosphogypsum, which causes the Cd in phosphogypsum to have higher relative and absolute concentrations [26]. Phosphogypsum also contains oxidizable Cd, which is usually related to organic matter in the phosphogypsum pile and metal sulfide precipitation formed under reduction conditions [70].

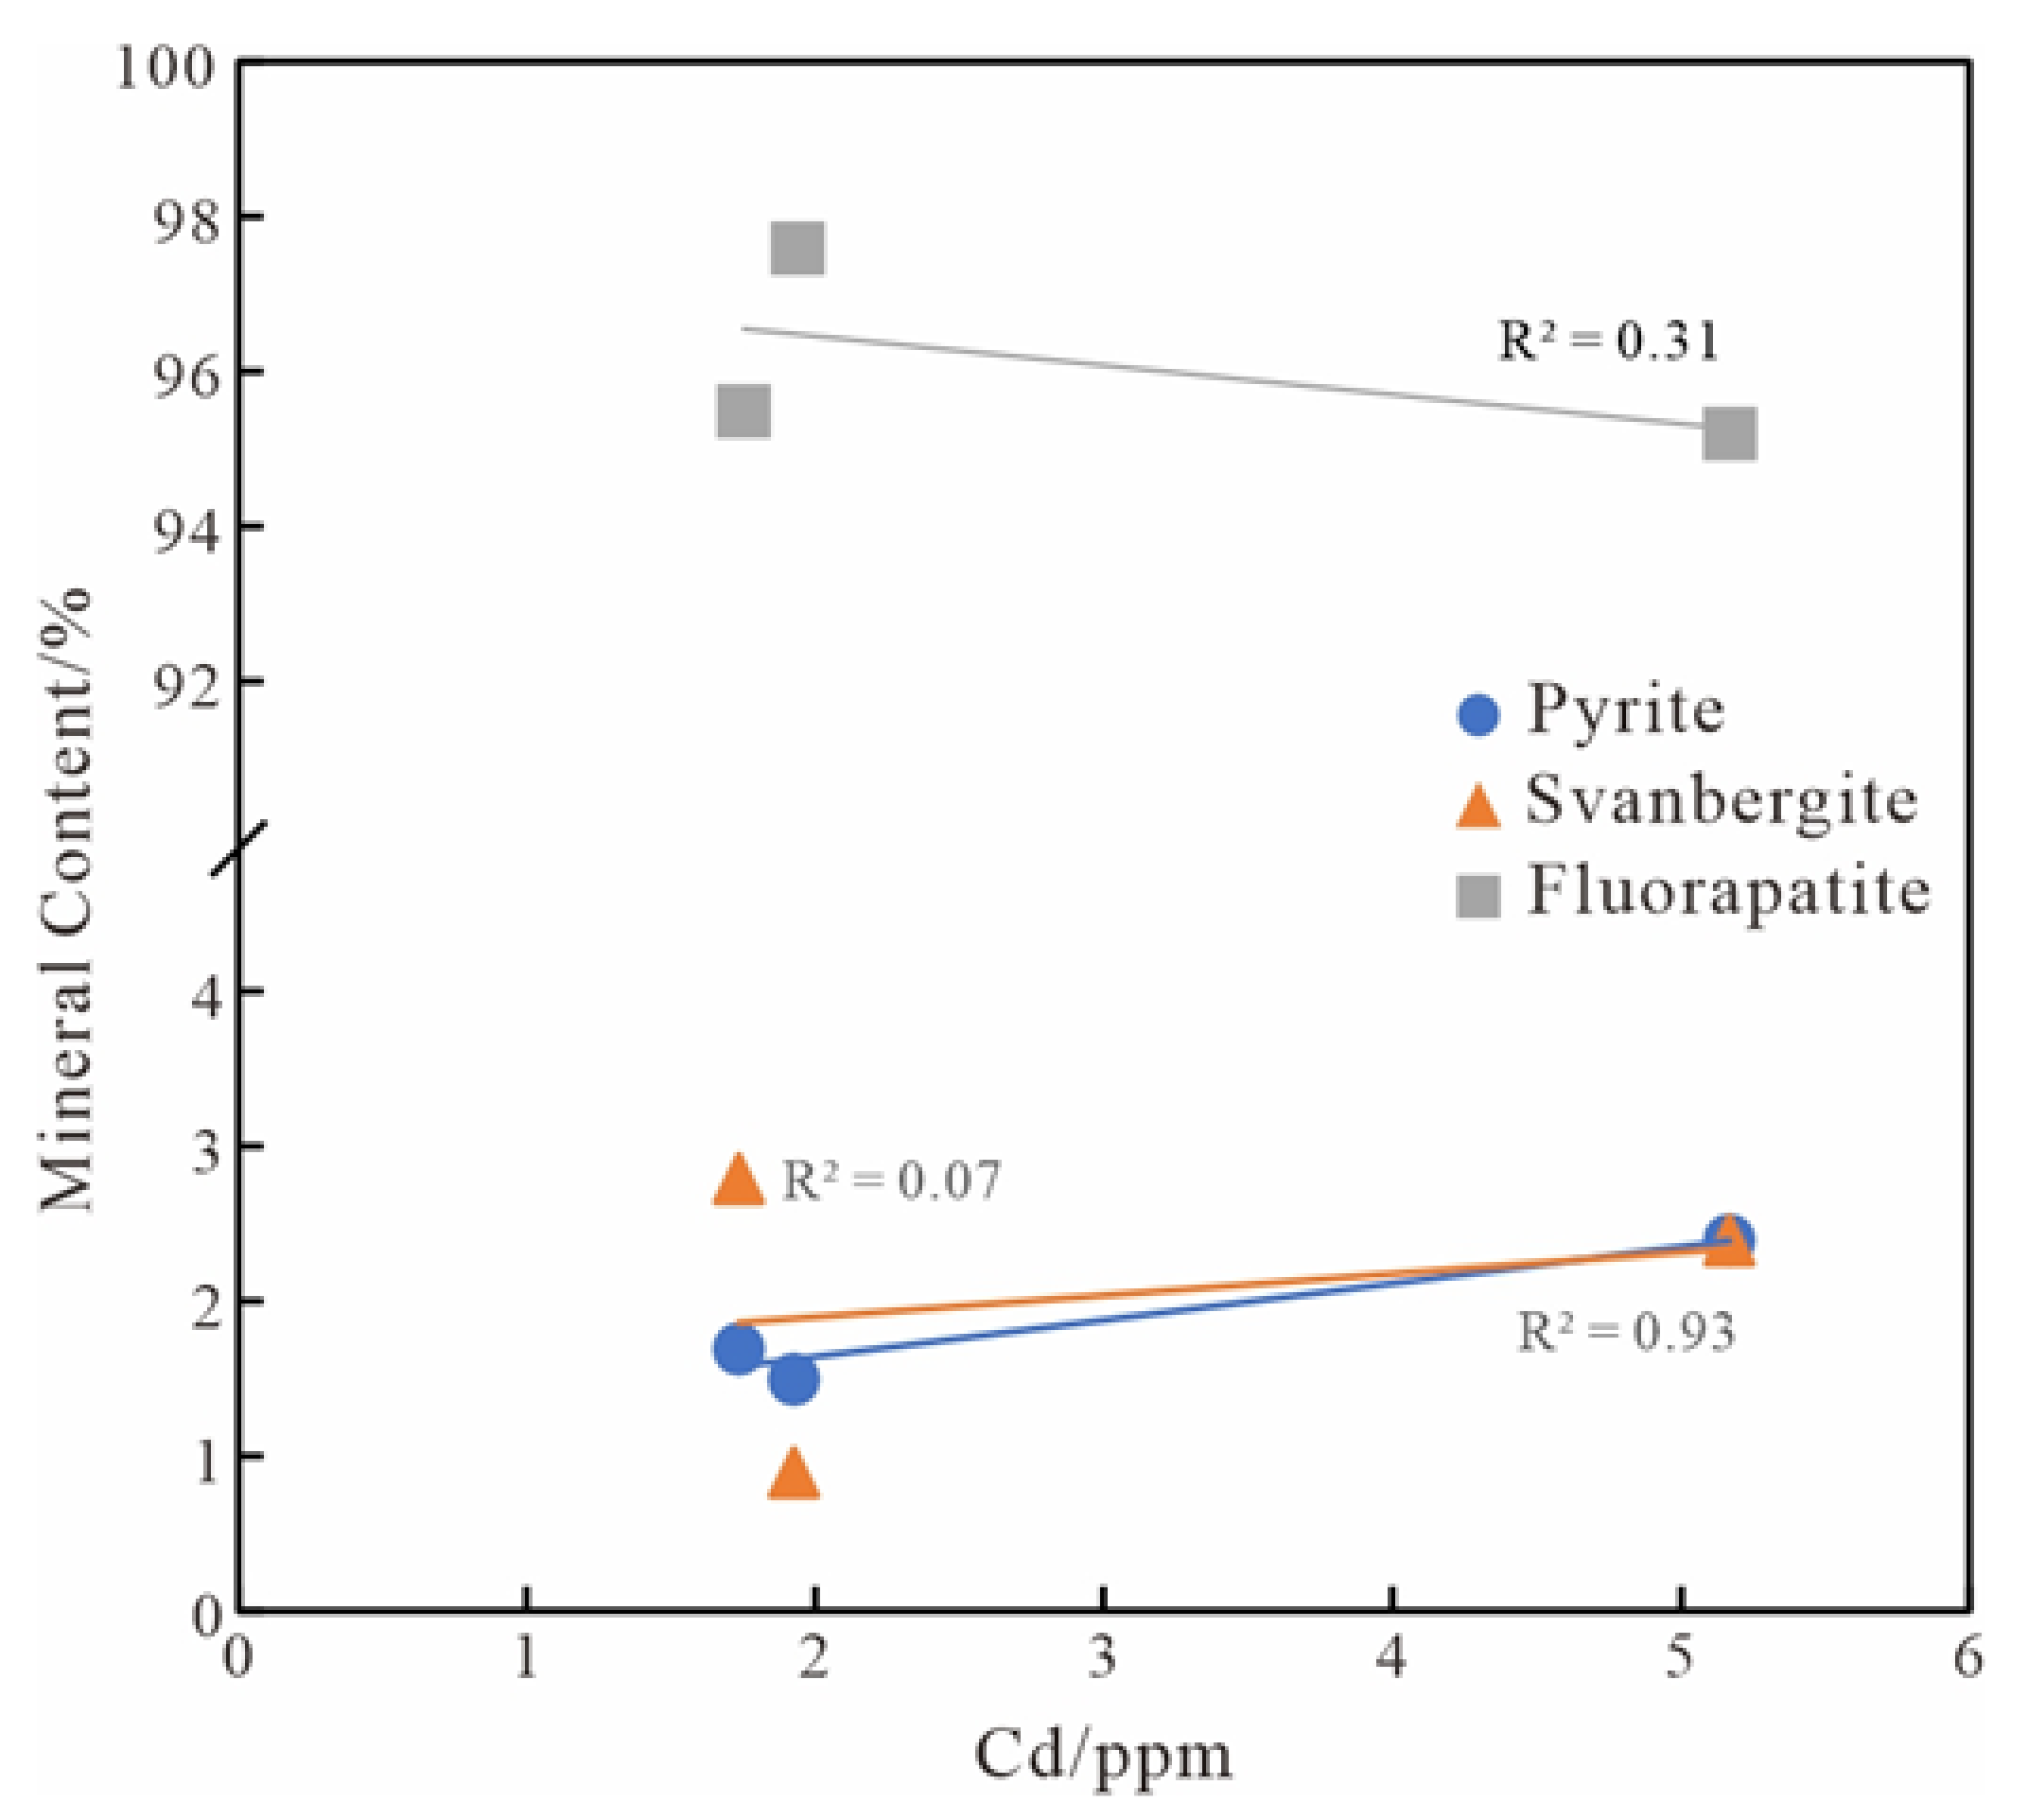
4.2. Implications for Carrier Mineral Phases of Cd

The occurrence and distribution of trace elements in phosphate ores are closely related to several rock components (i.e., apatite, matrix, organic matter, and accessory minerals) [77,78]. They can be enriched in many mechanisms, such as isomorphous substitution, adsorption, etc. Garnit et al. [79] and Kechiched et al. [80] distinguished four main components that control the chemical properties of phosphate rock: (1) Apatite and associated trace elements: REE, Sr, V; (2) clayey matrix that includes Zr, Hf, Ta, Rb, and Nb; (3) dolomitic matrix generally enhances Mo, Cs, Ni, Co, and Li; and (4): sulfide and organic matter control the presence of Cr, Pb, Th, Cd, Sc, Zn, Tl, As, and Cu. Previous studies have shown that the phosphate minerals in Shifang-type phosphate rock are collophanite, fluorapatite, and svanbergite, as well as pyrite, clay minerals, sphalerite, limonite, quartz, and other minerals [81,82]. Through XRD analysis, the main minerals in the studied phosphate ore are fluorapatite, svanbergite, and pyrite.
Due to the particular crystal–chemical characteristics of apatite, it has a wide range of isomorphic substitutions and accommodation and adsorption fixation for various metal cations, such as Cd, Cr, Zn, Zr, U, and REE [32,83,84]. This renders apatite a natural collector of metals and radionuclides [85], resulting in phosphate rock rich in various trace metals. It is generally believed that Cd exists in the crystal structure of apatite by substituting Ca, and Cd occupies both Cal and Ca2 sites and prefers the Ca2 site [86,87]. Moreover, some authors reported that in some sedimentary phosphate ores, Cd could not replace Ca in the apatite structure because no correlation was found between P2O5 and Cd [37,40]. Moreover, sedimentary phosphate rock often contains a relatively high amount of organic matter, and Cd can be firmly combined with organic matter, which makes Cd-bearing phosphate rock very common [88]. In marine phosphate rock, the redeposition of phosphate rock is accompanied by the decay of organic matter. The residual organic matter can accumulate Cd more strongly and retain its original reserves. Additionally, the release of Cd during redeposition may be accompanied by their resorption in phosphate and clay minerals. Therefore, organic matter can play an important (or even primary) role in both phosphate rocks and black shale as a natural accumulation of Cd [20].
Comparing the element content of type 1 and type 2, P (type 1/type 2), it is very close (0.974–1.004) in different regions, indicating that type 1 also contains phosphorus-containing minerals. This phenomenon is also manifested in Raman spectroscopy analysis. Type 1 not only has prominent high peaks of organic matter but also has a low peak of apatite; the light and dark differentiation is due to organic matter. The range of Cd (type 1/type 2) is 1.11–1.91, and significantly higher in QP02 and QP03. This comparison shows that organic matter increases the Cd content when the content of P is close to or less than it. The content of Cd is more affected by organic matter than by apatite in phosphate rock from Qingping. It is speculated that Cd in phosphorite is related to organic matter [20,89].
Pyrite (FeS2), a ubiquitous mineral, is prone to oxidation reactions when exposed to air, preferentially releasing S and Cd and producing acidic weathering solutions [90,91]. The released acid can promote the decomposition of organic matter and the release of Cd into the environment. Given these facts, it is possible that sulfides in phosphorites can be a source of Cd and release Cd into the environment after exposure.
Cd in pyrite is very similar to Zn, but the content is usually low, ranging from 14 to 52 ppm [92]. Rapidly precipitated pyrite, typically rich in arsenic, captures inclusions of Cd-bearing mineral phases, resulting in increased Cd content [57]. In addition, Cd-carbonate minerals may also exist in pyrite [93]. Through ion exchange and decomposition of the Cd-carbonate phase, Cd in this part can quickly be released into the environment, posing a threat to the environment [94,95].
In addition to S and Fe, pyrite contains elements such as Co, Cd, As, Ni, Cu, and Zn. The content of Cd ranges from 79 ppm to 551 ppm, which is 186.7 times higher than the average content of phosphate rock of 2.95 ppm. Due to the relatively low content of pyrite minerals in apatite, it cannot be determined that the Cd element is controlled by pyrite. However, pyrite is an essential carrier of Cd.
The change in the content of elements is closely related to the change in minerals, as shown in Figure 7. The content of apatite accounts for the absolute majority (95.2–97.6 wt.%), and the content of pyrite is low (1.5–2.4 wt.%), which is consistent with the general characteristics of Shifang-type phosphate ore [44]. Comparing the change in Cd content with the mineral content in phosphate rock, the trend of Cd and pyrite content is roughly the same, which is opposite to the content of apatite, indicating that the influence of pyrite on Cd is more potent than that of apatite. This is consistent with the conclusion of Raman analysis and in situ elemental analysis that Cd is closely related to organic matter and pyrite in phosphate rock.

4.3. Implications for Cd Enrichment Mechanism

The symbiosis of rare earth elements with apatite and phosphorite rocks is common [96], and the environment and phosphorus source at the time of the phosphorite rocks deposition can be judged by interpreting the mode in which PAAS is normalized REE + Y and the sensitive elements to redox conditions.
As shown in Figure 5, type 1 and type 2 show the same trend in all samples. The content of ΣREY for type 1 (160.24–1091.40 ppm) is obviously higher than in type 2 (80.17–330.57 ppm) (Table 5). This is consistent with the high content of various trace elements, including REE and Y, in biological apatite of sedimentary phosphate rock. In addition, microcrystalline apatite extends to collophane and forms an apatite ring around the edge of collophane (Figure 4); the phosphorous clastic particles are mostly elliptical and sub-circular under the microscope, and most of the particles have a high degree of roundness (Figure 4), which suggests that the phosphorous clastic particles are strongly affected by hydrodynamic forces in the sedimentary basin, with a high sedimentation rate and a long transportation distance, containing more organic matter and strong adsorption capacity. Cadmium of these particles exposed to seawater for a long time could explain their higher contents compared to authigenic phosphorites, it is due to the adsorption of organic matter, and Cd is more enriched than that in apatite [79,96].
The type and content of rare-earth-element-containing minerals in the geological body directly affect the Ce anomaly; for example, the biogenic apatite or phosphorite are mostly Ce negative anomalies [97,98]. In relatively reduced or anoxic seawater, Ce is soluble as positive trivalent cation, and has no obvious differentiation with other REE elements. Consequently, no negative Ce anomaly is formed. Similarly, when insoluble Ce+4 enters the reduction or anoxic environment, it will be reduced to Ce+3 and reenter the water body. Therefore, in modern aerobic seawater, shallow water (<200 m) has an obvious negative cerium anomaly [99]. A negative Ce anomaly is usually considered to reflect redox conditions, but diagenesis and later transformation may change the original characteristics. It is generally believed that a negative Ce anomaly is related to (La/Sm)N >0.35 [79] and (Dy/Sm) N > 1 [100] and is rarely affected by diagenesis, and can reflect the ancient ocean redox environment through the abnormal change in apatite Ce in the phosphorite. The content of rare earth elements from the original site shows that, except for QP02-type 2 and QP07-1-type 2, the average value of (La/Sm)N in other areas is higher than 0.35, and (Dy/Sm)N > 1, indicating that they can be used to track redox conditions. At the same time, it is shown that type 2 is characterized by more pronounced Ce anonymous and heavy REE enrichment. This indicates that sub-oxidizing to oxidizing conditions occurred beforehand, which resulted in less Cd content in type 2 [101].
Under anoxic/hydrostatic conditions, Cd can be effectively transported into sediments through the formation of sulfide [101]. The information about the sedimentary environment of pyrite formation can be determined according to the Co/Ni ratio [102]. The Co/Ni ratio of most pyrite formed by a hydrothermal solution is greater than 2. In addition, high Ni and low Co/Ni can be observed in pyrite formed in a reducing environment rich in organic matter [103,104]. Six out of the twelve analyses can be used to calculate Co/Ni, the highest Co/Ni value is 0.67, and other values are low, and the content of Ni is high, indicating that the pyrite in the samples is not of hydrothermal origin but formed under the reducing conditions in an organic-matter-rich environment, which is consistent with the conclusion that the Qingping phosphate mine is rich in organic matter. The contents of Cd, Ni, Cu, and Zn are also related to the sinking rate of organic carbon, which is usually related to productivity. These trace elements are adsorbed on organic matter and incorporated into sediments. When the organic matter is decomposed, trace elements are left, and some will enter pyrite [105].

5. Conclusions

(1)
The Cd concentration in phosphate rock from Qingping is much lower than the average world content (18 ppm) for this type of rock. Except for SiO2, SO3, and Zr, the elements in phosphogypsum are derived from phosphate rock, and only 10.58% of Cd migrates to phosphogypsum.
(2)
The strong peak of apatite is located at 960 cm−1, corresponding to the V1 (PO4) mode, and the other peaks are weak. The characteristic peak of organic matter does not appear alone, and a weak peak may appear at 960 cm−1. Compared to the Cd content in different regions of apatite to organic matter, Cd is mainly controlled by organic matter.
(3)
The main minerals in the phosphate rock are fluorapatite, svanbergite, and pyrite. The primary mineral of phosphogypsum is gypsum. Compared with apatite, pyrite has a higher Cd content and is an essential carrier of Cd. However, considering that the pyrite content in the ore is low (1.5–2.4 wt.%), it cannot be determined that pyrite has a controlling effect on Cd in the phosphate rock.
(4)
The high Cd content in type 1 is caused by the enrichment of organic matter, which is linked with Cd adsorbed on organic matter and then incorporated into sediments. Cd in pyrite is mainly controlled by the formation of pyrite under reducing conditions. Therefore, reducing the environment leads to the enrichment of Cd in phosphate rock.

Supplementary Materials

The following supporting information can be downloaded at: https://www.mdpi.com/article/10.3390/min13010107/s1, Table S1: The bulk compositional of the phosphate rock and phosphogypsum; Table S2: Representative electron probe microanalysis (EPMA) data of apatite; Table S3: Representative laser ablation–inductively coupled plasma–mass spectrometry (LA-ICP-MS) data of apatite; Table S4: Representative electron probe microanalysis (EPMA) data of pyrite from Qingping phosphate rock.

Author Contributions

Conceptualization, C.Z.; methodology, Z.S. and Y.Y., validation, Z.S., Y.H. and J.Z.; investigation, C.Z. and J.Z.; writing—original draft preparation, C.Z.; writing—review and editing, Z.S. and N.Z. All authors contributed to the writing of the manuscript. All authors have read and agreed to the published version of the manuscript.

Funding

This research was funded by the National Natural Science Foundation of China, grant number 41373120, and the Department of Natural Resources of Sichuan Province, grant number KJ-2019-3.

Data Availability Statement

The data presented in this study are available in the article.

Acknowledgments

Special thanks to Thomas Ulrich (Aarhus University) for the language polishing assistance and insightful suggestions on the manuscript. We also acknowledge the constructive reviews from two anonymous reviewers.

Conflicts of Interest

The authors declare no conflict of interest.

References

  1. Nies, D.H. Efflux-mediated heavy metal resistance in prokaryotes. FEMS Microbiol. Rev. 2003, 27, 313–339. [Google Scholar] [CrossRef] [PubMed]
  2. Waalkes, M.P. Cadmium carcinogenesis in review. J. Inorg. Biochem. 2000, 79, 241–244. [Google Scholar] [CrossRef] [PubMed]
  3. Zhao, J.; He, M. Theoretical study of heavy metal Cd, Cu, Hg, and Ni(II) adsorption on the kaolinite(001) surface. Appl. Surf. Sci. 2014, 317, 718–723. [Google Scholar] [CrossRef]
  4. Cao, X.; Hu, P.; Tan, C.; Wu, L.; Peng, B.; Christie, P.; Luo, Y. Effects of a natural sepiolite bearing material and lime on the immobilization and persistence of cadmium in a contaminated acid agricultural soil. Environ. Sci. Pollut. Res. Int. 2018, 25, 22075–22084. [Google Scholar] [CrossRef]
  5. Quezada Hinojosa, R.P.; Matera, V.; Adatte, T.; Rambeau, C.; Föllmi, K.B. Cadmium distribution in soils covering Jurassic oolitic limestone with high Cd contents in the Swiss Jura. Geoderma 2009, 150, 287–301. [Google Scholar] [CrossRef]
  6. Khan, S.; Rehman, S.; Zeb Khan, A.; Amjad Khan, M.; Tahir Shah, M. Soil and vegetables enrichment with heavy metals from geological sources in Gilgit, northern Pakistan. Ecotoxicol. Environ. Saf. 2010, 73, 1820–1827. [Google Scholar] [CrossRef]
  7. Rambeau, C.M.C.; Baize, D.; Saby, N.; Matera, V.; Adatte, T.; Föllmi, K.B. High cadmium concentrations in Jurassic limestone as the cause for elevated cadmium levels in deriving soils: A case study in Lower Burgundy, France. Environ. Earth Sci. 2010, 61, 1573–1585. [Google Scholar] [CrossRef] [Green Version]
  8. Liu, Y.; Xiao, T.; Ning, Z.; Li, H.; Tang, J.; Zhou, G. High cadmium concentration in soil in the Three Gorges region: Geogenic source and potential bioavailability. Appl. Geochem. 2013, 37, 149–156. [Google Scholar] [CrossRef]
  9. Alina, K.P. Behavioural properties of trace metals in soils. Appl. Geochem. 1993, 8, 3–9. [Google Scholar] [CrossRef]
  10. Gnandi, K.; Tobschall, H. Heavy metals distribution of soils around mining sites of cadmium-rich marine sedimentary phosphorites of Kpogamé and Hahotoé (southern Togo). Environ. Geol. 2002, 41, 593–600. [Google Scholar] [CrossRef]
  11. Schwartz, M.O. Cadmium in Zinc Deposits: Economic Geology of a Polluting Element. Int. Geol. Rev. 2000, 42, 445–469. [Google Scholar] [CrossRef]
  12. Wang, D.; Jiang, X.; Rao, W.; He, J. Kinetics of soil cadmium desorption under simulated acid rain. Ecol. Complex. 2009, 6, 432–437. [Google Scholar] [CrossRef]
  13. Acosta, J.A.; Faz, A.; Martínez-Martínez, S.; Arocena, J.M. Enrichment of metals in soils subjected to different land uses in a typical Mediterranean environment (Murcia City, southeast Spain). Appl. Geochem. 2011, 26, 405–414. [Google Scholar] [CrossRef]
  14. Li, Z.; Feng, X.; Li, G.; Bi, X.; Sun, G.; Zhu, J.; Qin, H.; Wang, J. Mercury and other metal and metalloid soil contamination near a Pb/Zn smelter in east Hunan province, China. Appl. Geochem. 2011, 26, 160–166. [Google Scholar] [CrossRef]
  15. Jarvis, I.; Burnett, W.C.; Nathan, Y.; Almbaydin, F.S.; Attia, A.K.; Castro, L.N.; Flicoteaux, R.; Hilmy, M.E.; Husain, V.; Qutawnah, A.A. Phosphorite geochemistry: State-of-the-art and environmental concerns. Eclogae Geol. Helv. 1994, 87, 643–700. [Google Scholar]
  16. Al-Hwaiti, M.; Matheis, G.; Saffarini, G. Mobilization, redistribution and bioavailability of potentially toxic elements in Shidiya phosphorites, Southeast Jordan. Environ. Geol. 2005, 47, 431–444. [Google Scholar] [CrossRef]
  17. Zanin, Y.N.; Zamirailova, A.G. Trace elements in supergene phosphorites. Geochem. Int. 2007, 45, 758–769. [Google Scholar] [CrossRef]
  18. Mehmood, T.; Chaudhry, M.M.; Tufail, M.; Irfan, N. Heavy metal pollution from phosphate rock used for the production of fertilizer in Pakistan. Microchem. J. 2009, 91, 94–99. [Google Scholar] [CrossRef]
  19. Altschuler, Z.S. The geochemistry of trace elements in marine phosphorites: Part I. Characteristic abundances and enrichment. Soc. Econ. Paleontol. Mineral. Spec. Publ. 1980, 29, 19–30. [Google Scholar]
  20. Baturin, G.N. Cadmium and zinc in Namibian shelf phosphorites. Dokl. Earth Sci. 2006, 407, 330–334. [Google Scholar] [CrossRef]
  21. Ma, R. Pay attention to the hazardous cadmium in phosphate fertilizer. Phosphate Compd. Fertil. 2002, 17, 5–6. [Google Scholar]
  22. Xue, T.; Xiong, X.; Tian, S. Discussion on the principal phosphorite-concentrated districts and the resource potential in China. Geol. Chem. Miner. 2011, 33, 9–20. [Google Scholar]
  23. He, T. Discussion on the progressive mining rule and mining sequence in the middle section of Mountain Longmen. Geol. Chem. Miner. 2022, 44, 1–9. [Google Scholar]
  24. Jia, H.; Liu, J.; Jiao, S.; Shang, P. Situation analysis and countermeasures of phosphate rock resources exploitation and ecological protection in Yangtze River Economic Belt. China Min. Mag. 2021, 30, 67–72. [Google Scholar]
  25. Wang, L.; Tang, W.; Qin, B.; Ren, L.; Bi, X.; Ma, Z. The Survey of Cd and Other Elements in River Sediments Affected by Phosphorite Deposit and Coal Mine in the Area of Longmenshan Mountain, Sichuan Province. Geol. Sci. Technol. Inf. 2007, 26, 36–41. [Google Scholar]
  26. Pérez-López, R.; Nieto, J.M.; López-Coto, I.; Aguado, J.L.; Bolívar, J.P.; Santisteban, M. Dynamics of contaminants in phosphogypsum of the fertilizer industry of Huelva (SW Spain): From phosphate rock ore to the environment. Appl. Geochem. 2010, 25, 705–715. [Google Scholar] [CrossRef]
  27. Kubier, A.; Wilkin, R.T.; Pichler, T. Cadmium in soils and groundwater: A review. Appl. Geochem. 2019, 108, 1–16. [Google Scholar] [CrossRef]
  28. Li, Y. Present situation analysis of water and soil pollution in phosphate rock and sulfur mining area of China. Geol. Chem. Miner. 2018, 40, 241–246. [Google Scholar]
  29. Zhang, J.; Shi, Z.; Ni, S.; Wang, X.; Liao, C.; Wei, F. Source Identification of Cd and Pb in Typical Farmland Topsoil in the Southwest of China: A Case Study. Sustainability 2021, 13, 3729. [Google Scholar] [CrossRef]
  30. Gnandi, K.; Boroon, M.H.R.; Dimitri, D.D. Distribution, Speciation, and Extractability of Cadmium in the Sedimentary Phosphorite of Hahotoé-Kpogamé (Southern Togo). Aquat. Geochem. 2009, 15, 485–495. [Google Scholar] [CrossRef]
  31. Demandt, I. The World Phosphate Fertiliser Industry. Research Project ‘Environmental Regulation, Globalization of Production and Technology Change’, Background Report No. 10; The United Nations University, Institute for New Technologies Maastricht: Maastricht, Netherlands, 1999. [Google Scholar]
  32. Gnandi, K.; Tobschall, H.J. The pollution of marine sediments by trace elements in the coastal region of Togo caused by dumping of cadmium-rich phosphorite tailing into the sea. Environ. Geol. 1999, 38, 13–24. [Google Scholar] [CrossRef]
  33. Perkins, R.B.; Foster, A.L. Chapter 10 Mineral affinities and distribution of selenium and other trace elements in black shale and phosphorite of the phosphoria formation. In Handbook of Exploration and Environmental Geochemistry: Life Cycle of the Phosphoria Formation; Hein, J.R., Ed.; Elsevier Science B.V: Amsterdam, The Netherlands, 2004; pp. 251–295. ISBN 1874-2734. [Google Scholar]
  34. Perkins, R.B.; Mason, C.E. The relative mobility of trace elements from short-term weathering of a black shale. Appl. Geochem. 2015, 56, 67–79. [Google Scholar] [CrossRef]
  35. Liu, Y.; Xiao, T.; Perkins, R.B.; Zhu, J.; Zhu, Z.; Xiong, Y.; Ning, Z. Geogenic cadmium pollution and potential health risks, with emphasis on black shale. J. Geochem. Explor. 2017, 176, 42–49. [Google Scholar] [CrossRef] [Green Version]
  36. Sokol, E.V.; Kozmenko, O.A.; Khoury, H.N.; Kokh, S.N.; Novikova, S.A.; Nefedov, A.A.; Sokol, I.A.; Zaikin, P. Calcareous sediments of the Muwaqqar Chalk Marl Formation, Jordan: Mineralogical and geochemical evidences for Zn and Cd enrichment. Gondwana Res. 2017, 46, 204–226. [Google Scholar] [CrossRef]
  37. Nathan, Y.; Soudry, D.; Levy, Y.; Shitrit, D.; Dorfman, E. Geochemistry of cadmium in the Negev phosphorites. Chem. Geol. 1997, 142, 87–107. [Google Scholar] [CrossRef]
  38. Prévôt, L. Geochemistry, petrography, genesis of Cretaceous-Eocene phosphorites: The Ganntour deposit (Morocco)—A type example. Soc. Geol. Fr. Mem. 1990, 158, 232. [Google Scholar]
  39. Bostick, B.C.; Fendorf, S.; Fendorf, M. Disulfide disproportionation and CdS formation upon cadmium sorption on FeS2. Geochim. Cosmochim. Acta 2000, 64, 247–255. [Google Scholar] [CrossRef]
  40. Tabelin, C.B.; Igarashi, T.; Villacorte-Tabelin, M.; Park, I.; Opiso, E.M.; Ito, M.; Hiroyoshi, N. Arsenic, selenium, boron, lead, cadmium, copper, and zinc in naturally contaminated rocks: A review of their sources, modes of enrichment, mechanisms of release, and mitigation strategies. Sci. Total Environ. 2018, 645, 1522–1553. [Google Scholar] [CrossRef]
  41. Wang, S.; Li, X. A discussion on the age and sedimentary environment of the shifang type phosphatic beds in Sichuan province. Prof. Pap. Stratigr. Palaeontol. 1988, 22, 1–8. [Google Scholar]
  42. Zheng, L.; Liu, L.; Zou, L.; Ma, Y. Geological characteristics and prospecting criteria of Shifang type phosphate deposit in Hongyan, Mianzhu, Sichuan Province. Miner. Explor. 2021, 12, 640–649. [Google Scholar]
  43. Blinova, A.I.; Zega, T.J.; Herd, C.D.K.; Stroud, R.M. Testing variations within the Tagish Lake meteorite—I: Mineralogy and petrology of pristine samples Testing variations within the Tagish Lake meteorite—I: Mineralogy and petrology of pristine samples. Meteorit. Planet. Sci. 2014, 49, 473–502. [Google Scholar] [CrossRef]
  44. He, T. Geological characteristics and metallogenic mode of Shifang-type. Geol. Chem. Miner. 2021, 43, 222–229. [Google Scholar]
  45. Li, X.; Wu, B.; Zhu, J. Study on activity and occurrence of impurities of iron and aluminum in Mianzhu collophanite, Sichuen. IM P 2017, 46, 8–12+16. [Google Scholar] [CrossRef]
  46. Anderson, P.R.; Christensen, T.H. Distribution coefficients of Cd, Co, Ni, and Zn in soils. J. Soil Sci. 1988, 39, 15–22. [Google Scholar] [CrossRef]
  47. Kubier, A.; Pichler, T. Cadmium in groundwater—A synopsis based on a large hydrogeochemical data set. Sci. Total Environ. 2019, 689, 831–842. [Google Scholar] [CrossRef] [PubMed]
  48. Ou, Y. The Research of Occurrence State of Rare-Earth Element in Typical Western Szechuan Phosphate Ore Deposit. Master’s Thesis, Chengdu University of Technology, Chengdu, China, 2015. [Google Scholar]
  49. Elgharbi, S.; Horchani-Naifer, K.; Férid, M. Investigation of the structural and mineralogical changes of Tunisian phosphorite during calcinations. J. Therm. Anal. Calorim. 2015, 119, 265–271. [Google Scholar] [CrossRef]
  50. Wang, M.; Qian, R.; Bao, M.; Gu, C.; Zhu, P. Raman, FT-IR and XRD study of bovine bone mineral and carbonated apatites with different carbonate levels. Mater. Lett. 2018, 210, 203–206. [Google Scholar] [CrossRef]
  51. Ciobotă, V.; Salama, W.; Vargas Jentzsch, P.; Tarcea, N.; Rösch, P.; El Kammar, A.; Morsy, R.S.; Popp, J. Raman investigations of Upper Cretaceous phosphorite and black shale from Safaga District, Red Sea, Egypt. Spectrochim. Acta A Mol. Biomol. Spectrosc. 2014, 118, 42–47. [Google Scholar] [CrossRef]
  52. Joosu, L.; Lepland, A.; Kirsimäe, K.; Romashkin, A.E.; Roberts, N.M.; Martin, A.P.; Črne, A.E. The REE-composition and petrography of apatite in 2Ga Zaonega Formation, Russia: The environmental setting for phosphogenesis The REE-composition and petrography of apatite in 2Ga Zaonega Formation, Russia: The environmental setting for phosphogenesis. Chem. Geol. 2015, 395, 88–107. [Google Scholar] [CrossRef]
  53. Alibert, C. Rare earth elements in Hamersley BIF minerals Rare earth elements in Hamersley BIF minerals. Geochim. Cosmochim. Acta 2016, 184, 311–328. [Google Scholar] [CrossRef]
  54. McLennan, S.M. Chapter 7. Rare earth elements in sedimentary rocks: Influence of provenance and sedimentary processes. In Geochemistry and Mineralogy of Rare Earth Elements; Lipin, B.R., McKay, G.A., Eds.; De Gruyter: Berlin, Germany, 1989; pp. 169–200. ISBN 9781501509032. [Google Scholar]
  55. Taylor, S.R.; McLennan, S.M. The Continental Crust: Its Composition and Evolution; Blackwell Scientific Publications: Palo Alto, CA, USA, 1985. [Google Scholar]
  56. Gundogar, D.Y.; Sasmaz, A. Geochemical Approach to Determine the Possible Precipitation Parameters of the Coniacian–Santonian Mazıdağı Phosphates, Mardin, Turkey. Minerals 2022, 12, 1544. [Google Scholar] [CrossRef]
  57. Abraitis, P.K.; Pattrick, R.; Vaughan, D.J. Variations in the compositional, textural and electrical properties of natural pyrite: A review. Int. J. Miner. Process. 2004, 74, 41–59. [Google Scholar] [CrossRef]
  58. Papageorgiou, F.; Godelitsas, A.; Xanthos, S.; Voulgaris, N.; Nastos, P.; Mertzimekis, T.J.; Argyraki, A.; Katsantonis, G. Characterization of phosphogypsum deposited in Schistos remediated waste site (Piraeus, Greece). In Uranium—Past and Future Challenges; Merkel, B.J., Arab, A., Eds.; Springer International Publishing: Cham, Switzerland, 2015; pp. 271–280. ISBN 978-3-319-11059-2. [Google Scholar]
  59. Pérez-López, R.; Alvarez-Valero, A.M.; Nieto, J.M. Changes in mobility of toxic elements during the production of phosphoric acid in the fertilizer industry of Huelva (SW Spain) and environmental impact of phosphogypsum wastes. J. Hazard. Mater. 2007, 148, 745–750. [Google Scholar] [CrossRef] [PubMed]
  60. Rutherford, P.M.; Dudas, M.J.; Samek, R.A. Environmental impacts of phosphogypsum. Sci. Total Environ. 1994, 149, 1–38. [Google Scholar] [CrossRef]
  61. Al-Masri, M.S.; Amin, Y.; Ibrahim, S.; Al-Bich, F. Distribution of some trace metals in Syrian phosphogypsum. Appl. Geochem. 2004, 19, 747–753. [Google Scholar] [CrossRef]
  62. Li, J.; Shi, Z.; Zheng, L.; Ni, S. Evaluation on potential ecological risk of heavy metals pollution in sediments from Tuojiang drainage. Earth Environ. 2010, 38, 481–487. [Google Scholar] [CrossRef]
  63. Li, J.; Shi, Z.; Ni, S. Study and Evaluation on Forms of Heavy Metal Elements in Farmland Soil around Phosphogypsum Pile. Acta Mineral. Sin. 2011, 31, 715. [Google Scholar] [CrossRef]
  64. Vanmarcke, H.; Paridaens, J. (Eds.) The Radiological Impact of the Belgian Phosphate Industry. In Proceedings of the Second European IRPA Congress on Radiation Protection—Radiation Protection: From Knowledge to Action, Paris, France, 15–19 May 2006. [Google Scholar]
  65. Rentería-Villalobos, M.; Vioque, I.; Mantero, J.; Manjón, G. Radiological, chemical and morphological characterizations of phosphate rock and phosphogypsum from phosphoric acid factories in SW Spain. J. Hazard. Mater. 2010, 181, 193–203. [Google Scholar] [CrossRef]
  66. El Zrelli, R.; Rabaoui, L.; Daghbouj, N.; Abda, H.; Castet, S.; Josse, C.; van Beek, P.; Souhaut, M.; Michel, S.; Bejaoui, N.; et al. Characterization of phosphate rock and phosphogypsum from Gabes phosphate fertilizer factories (SE Tunisia): High mining potential and implications for environmental protection. Environ. Sci. Pollut. Res. Int. 2018, 25, 14690–14702. [Google Scholar] [CrossRef]
  67. Wei, Y. Study on the Release, Migration, Transformation and Enrichment Mechanism of Typical Heavy Metals during CoalCombustion. Ph.D. Thesis, University of Science and Technology of China, Hefei, China, 2021. [Google Scholar]
  68. Peng, M.; Xu, H. Application of Synchrotron Radiation X-ray Absorption Spectroscopy in Environmental Mineralogy. Bull. Mineral. Petrol. Geochem. 2005, 24, 217–221. [Google Scholar]
  69. Senes C.L. An Analysis of the Major Environmental and Health Concerns of Phosphogypsum Tailings in Canada and Methods for their Reduction. In Ont. Min. Environ. Alta. Environ. Environ. Can.; Senes Consultants Limited: Richmond Hill, ON, Canada, 1987. [Google Scholar]
  70. Carbonell-Barrachina, A.; DeLaune, R.; Jugsujinda, A. Phosphogypsum chemistry under highly anoxic conditions Phosphogypsum chemistry under highly anoxic conditions. Waste Manag. 2002, 22, 657–665. [Google Scholar] [CrossRef] [PubMed]
  71. Turekian, K.K.; Wedepohl, K.H. Distribution of the Elements in Some Major Units of the Earth’s Crust. Geol. Soc. Am. Bull. 1961, 72, 175. [Google Scholar] [CrossRef]
  72. Sattouf, M. Identifying the Origin of Rock Phosphates and Phosphorus Fertilisers Using Isotope Ratio Techniques and Heavy Metal Patterns. Ph.D. Thesis, Technische Universität Braunschweig, Braunschweig, Germany, 2007. [Google Scholar]
  73. Tzifas, I.; Godelitsas, A.; Magganas, A.; Androulakaki, E.; Eleftheriou, G.; Mertzimekis, T.J.; Perraki, M. Uranium-bearing phosphatized limestones of NW Greece. J. Geochem. Explor. 2014, 143, 62–73. [Google Scholar] [CrossRef]
  74. Zmemla, R.; Chaurand, P.; Benjdidia, M.; Elleuch, B.; Bottero, J.Y. Characterization and pH Dependent Leaching Behavior of Tunisian Phosphogypsum. ASRJETS 2016, 24, 230–244. [Google Scholar]
  75. Hou, Y. Geochemical Characteristics and Chemical Speciation of Heavy Metals Elements Inareas Affected by Phosphogypsum. Master’s Thesis, Chengdu University of Technology, Chengdu, China, 2015. [Google Scholar]
  76. Saueia, C.H.R.; Mazzilli, B.P.; Le Bourlegat, F.M.; Costa, G.J.L. Distribution of potentially toxic elements in the Brazilian phosphogypsum and phosphate fertilizers. E3S Web Conf. 2013, 1, 4005. [Google Scholar] [CrossRef] [Green Version]
  77. Boumaza, B.; Kechiched, R.; Chekushina, T.V. Trace metal elements in phosphate rock wastes from the Djebel Onk mining area (Tébessa, eastern Algeria): A geochemical study and environmental implications Trace metal elements in phosphate rock wastes from the Djebel Onk mining area (Tébessa, eastern Algeria): A geochemical study and environmental implications. Appl. Geochem. 2021, 127, 104910. [Google Scholar] [CrossRef]
  78. Galfati, I.; Béji Sassi, A.; Zaier, A.; Bouchardon, J.L.; Bilal, E.; Joron, J.L.; Sassi, S. Geochemistry and mineralogy of Paleocene-Eocene Oum El Khecheb phosphorites (Gafsa-Metlaoui Basin) Tunisia. Geochem. J. 2010, 44, 189–210. [Google Scholar] [CrossRef] [Green Version]
  79. Kechiched, R.; Laouar, R.; Bruguier, O.; Kocsis, L.; Salmi-Laouar, S.; Bosch, D.; Ameur-Zaimeche, O.; Foufou, A.; Larit, H. Comprehensive REE + Y and sensitive redox trace elements of Algerian phosphorites (Tébessa, eastern Algeria): A geochemical study and depositional environments tracking. J. Geochem. Explor. 2020, 208, 106396. [Google Scholar] [CrossRef]
  80. Garnit, H.; Bouhlel, S.; Jarvis, I. Geochemistry and depositional environments of Paleocene–Eocene phosphorites: Metlaoui Group, Tunisia Geochemistry and depositional environments of Paleocene–Eocene phosphorites: Metlaoui Group, Tunisia. J. Afr. Earth Sci. 2017, 134, 704–736. [Google Scholar] [CrossRef] [Green Version]
  81. Zhang, Y. The Rare Earth Elements Characteristics and the Comprehensive Utilization Research of Devonian Shifang Phosphate Deposit. Master’s Thesis, Southwest University of Science and Technology, Chengdu, China, 2015. [Google Scholar]
  82. Zheng, L. The Study on Ore Deposit Geological Feature and Metallogenic Prediction of Red Rock Phosphate Deposit in Mianzhu City. Master’s Thesis, Southwest University of Science and Technology, Chengdu, China, 2018. [Google Scholar]
  83. Nathan, Y. Chapter 8 The Mineralogy and Geochemistry of Phosphorites. In Phosphate Minerals; Nriagu, J.O., Moore, P.B., Eds.; Springer: Berlin/Heidelberg, Germany, 1984; pp. 275–291. ISBN 978-3-642-61736-2. [Google Scholar]
  84. Mcarthur, J.M. Francolite geochemistry—Compositional controls during formation, diagenesis, metamorphism and weathering. Geochim. Cosmochim. Acta 1985, 49, 23–35. [Google Scholar] [CrossRef]
  85. Bradl, H.; Xenidis, A. Chapter 3 Remediation techniques. In Handbook of Exploration and Environmental Geochemistry: Life Cycle of the Phosphoria Formation; Hein, J.R., Ed.; Elsevier Science B.V: Amsterdam, The Netherlands, 2004; pp. 165–261. ISBN 1874-2734. [Google Scholar]
  86. Sery, A.; Manceau, A.; Greaves, G.N. Chemical state of Cd in apatite phosphate ores as determined by EXAFS spectroscopy. Am. Mineral. 1996, 81, 864–873. [Google Scholar] [CrossRef]
  87. Nounah, A.; Maroufi, N.; Ait Ichou, Y.; Lacout, J.L.; Savariault, J.M. X-ray diffraction study of cadmium hydroxyapatite. J. Phys. IV Fr. 2005, 123, 251–254. [Google Scholar] [CrossRef] [Green Version]
  88. Ye, L.; Chen, Q.; Zhao, D.; Chen, Z.; Chen, Y.; Liu, K. Phosphorite rocks of China; Science Press: Beijing, China, 1989. [Google Scholar]
  89. Baturin, G.N.; Oreshkin, V.N. Behavior of cadmium in ocean-floor bone phosphate. Geochem. Int. 1985, 22, 69–74. [Google Scholar]
  90. Chi Fru, E.; Hemmingsson, C.; Callac, N.; Perez, N.; Panova, E.G.; Broman, C.; El Albani, A. Atmospheric weathering of Scandinavian alum shales and the fractionation of C, N and S isotopes. Appl. Geochem. 2016, 74, 94–108. [Google Scholar] [CrossRef]
  91. Derkowski, A.; Marynowski, L. Binding of heavy metals by oxidised kerogen in (palaeo)weathered black shales Binding of heavy metals by oxidised kerogen in (palaeo)weathered black shales. Chem. Geol. 2018, 493, 441–450. [Google Scholar] [CrossRef]
  92. Huston, D.L.; Sie, S.H.; Suter, G.F.; Cooke, D.R.; Both, R.A. Trace elements in sulfide minerals from eastern Australian volcanic-hosted massive sulfide deposits; Part I, Proton microprobe analyses of pyrite, chalcopyrite, and sphalerite, and Part II, Selenium levels in pyrite; comparison with delta 34 S values and implications for the source of sulfur in volcanogenic hydrothermal systems. Econ. Geol. 1995, 90, 1167–1196. [Google Scholar] [CrossRef]
  93. Gujre, N.; Rangan, L.; Mitra, S. Occurrence, geochemical fraction, ecological and health risk assessment of cadmium, copper and nickel in soils contaminated with municipal solid wastes. Chemosphere 2021, 271, 129573. [Google Scholar] [CrossRef]
  94. Jung, J.; Choi, K.; Chung, C.; Kim, C.; Kim, S. Fractionation and risk assessment of metals in sediments of an ocean dumping site. Mar. Pollut. Bull. 2019, 141, 227–235. [Google Scholar] [CrossRef]
  95. Cao, J.; Ren, S.; Wang, C.; She, J.; Jiang, Y.; Liu, Y.; Zhou, Y.; Wang, L.; Wang, J.; Wang, Y.; et al. Cadmium and lead distribution in pyrite ores. Elem. Sci. Anth. 2021, 9, 00093. [Google Scholar] [CrossRef]
  96. Liang, K.; He, M.; Tian, H.; Zhang, F.; Zheng, M. The Geochemical Characterics of Rare Earth Elements in the Chuanyandong Oreblock of the Wengfu Phosphorus Deposit, Guizhou, China. Bull. Mineral. Petrol. Geochem. 2022, 41, 572–586. [Google Scholar] [CrossRef]
  97. Zhang, J.; Zhang, Q.; Chen, D. REE geochemistry of the ore-bearing REE in Xinhua phosphorite, Zhijin, Guizhou. J. Mineral. Petrol. 2003, 23, 35–38. [Google Scholar] [CrossRef]
  98. Lécuyer, C.; Reynard, B.; Grandjean, P. Rare earth element evolution of Phanerozoic seawater recorded in biogenic apatites Rare earth element evolution of Phanerozoic seawater recorded in biogenic apatites. Chem. Geol. 2004, 204, 63–102. [Google Scholar] [CrossRef]
  99. Moffett, J.W. A radiotracer study of cerium and manganese uptake onto suspended particles in Chesapeake Bay. Geochim. Cosmochim. Acta 1994, 58, 695–703. [Google Scholar] [CrossRef]
  100. Lou, F.; Gu, S. Indication of the Ce anomaly of apatite in phosphorites to the evolution of oxygen in the Earth’s atmosphere. Acta Mineral. Sin. 2019, 39, 412–419. [Google Scholar] [CrossRef]
  101. Xiao, B.; Liu, S.; Ran, B.; Yang, D.; Han, Y. Identification of organic matter enrichment factors in marine sedimentary rocks based on elements Mn, Co, Cd and Mo: Application in the northern margin of Sichuan Basin, South China. Geol. Rev. 2019, 65, 1316–1330. [Google Scholar] [CrossRef]
  102. Bajwah, Z.U.; Seccombe, P.K.; Offler, R. Trace element distribution, Co:Ni ratios and genesis of the big cadia iron-copper deposit, new south wales, australia. Miner. Depos. 1987, 22, 292–300. [Google Scholar] [CrossRef]
  103. Guy, B.M.; Beukes, N.J.; Gutzmer, J. Paleoenvironmental controls on the texture and chemical composition of pyrite from non-conglomeratic sedimentary rocks of the mesoarchean witwatersrand Supergroup, South Africa. S. Afr. J. Geol. 2010, 113, 195–228. [Google Scholar] [CrossRef]
  104. Scott, R.J.; Meffre, S.; Woodhead, J.; Gilbert, S.E.; Berry, R.F.; Emsbo, P. Development of Framboidal Pyrite During Diagenesis, Low-Grade Regional Metamorphism, and Hydrothermal Alteration. Econ. Geol. 2009, 104, 1143–1168. [Google Scholar] [CrossRef]
  105. Sundararaman, P.; Boreham, C.J. Comparison of nickel and vanadyl porphyrin distributions of sediments Comparison of nickel and vanadyl porphyrin distributions of sediments. Geochim. Cosmochim. Acta 1993, 57, 1367–1377. [Google Scholar] [CrossRef]
Figure 1. Location map of the phosphorite deposit (A,B) and phosphogypsum pile (C) along the Mianyuan River, with sampling points indicated. Image from Google Earth software(Google LLC, Santa Clara, CA, USA).
Minerals 13 00107 g001
Figure 2. The X-ray diffraction patterns of phosphate rock (A) and phosphogypsum (B). The mineral content of phosphate rock is shown in (C).
Minerals 13 00107 g002
Figure 3. (A) The representative points of Raman analysis of phosphate rock. (B) Distribution characteristics of apatite and organic matter. Notes: a,c,e,g are typical points of apatite, b,d,f,h are typical points of organic-matter-bearing collophanite.
Minerals 13 00107 g003
Figure 4. Representative points and grouping. Notes: on the left is the microscope photo and on the right is the BSE picture; The red points are typical points of Type1, yellow points are typical points of Type2.
Minerals 13 00107 g004
Figure 5. PAAS-normalized REE + Y pattern of all apatite types in the phosphate samples (Y inserted between Dy and Ho according to its ionic radius, REE of modern seawater multiplied by 107).
Minerals 13 00107 g005
Figure 6. Element content in pyrite obtained determined on EPMA.
Minerals 13 00107 g006
Figure 7. Characteristics of minerals and Cd in phosphate rock.
Minerals 13 00107 g007
Table 1. Major element analysis in phosphate rock (PR) and phosphogypsum (PG).
Major
Elements(%)
Phosphate Rock (PR)Surrounding RockHongyan 1Lanjiaping 2Mianzhu 3Phosphogypsum (PG)
CaO49.433.8343.98 39.9933.65
P₂O₅36.639.9435.2929.3727.621.82
Al₂O₃3.7832.356.81.52–11.969.972.3
SO₃3.77.89 3.0934
F3.300.32.69 2.280.3
SiO₂2.5024.884.94 7.594.74
Fe₂O₃1.734.99 0.24–7.153.111.38
SrO0.431.170.66 0.42
K₂O0.350.32 1.550.21
TiO₂0.201.61 0.17
MgO0.090.20.320.06–4.103.50.08
Na₂O0.080.08 0.110.05
MnO0.010.01 0.01
Ca/P1.71 1.58 1.83
F/P5.07 5.54 5.94
1 Zheng et al., 2021 [42]; 2 He, 2021 [44]; 3 Li et al., 2017 [45].
Table 2. Compilation of pH and trace element analysis in phosphate rock (PR) and phosphogypsum (PG).
Trace Elements (ppm)Phosphate Rock (PR)Surrounding RockPhosphogypsum (PG)
Cd2.950.160.48
Ba216.67813.33215
Li161.10306.8338.6
Zn113.76237.5
Ni98.10215.5316.6
Mn8469.6719
Cu76.40197.4327.6
La54.67175.3336.5
Co47.1776.94.55
U45.5079.84.75
Ce43.03166.1730.6
Pb42.70132.528.15
Cr40.67235.6737
V25.33192.6727.5
As22.2324.87.15
Rb6.103.33.65
Th5.25252.67
Ga4.0842.172.21
Sc3.7723.71
Nb2.5337.43.25
Zr0.7332528.3
Hg0.220.3223.23
pH7.285.84.66
Table 3. Contents of major elements in different regions of apatite.
Elements
(wt.%)
QP02QP03QP07-1QP07-2
Type 1Type 2Type 1/
Type 2
Type 1Type 2Type 1/
Type 2
Type 1Type 2Type 1/
Type 2
Type 1Type 2Type 1/
Type 2
CaO55.2754.801.0155.1955.221.0054.9155.260.9955.8255.411.01
P2O540.8540.511.0141.4141.321.0041.2241.211.0041.7041.351.01
F4.103.981.034.083.931.044.094.061.014.033.831.05
Al2O30.210.280.730.110.052.220.230.320.710.060.051.17
BaO0.080.160.480.040.100.400.050.080.600.050.130.42
FeO0.130.071.950.060.032.070.080.023.450.080.081.00
SiO20.120.280.440.140.0111.840.100.180.540.030.060.43
SO30.150.121.200.090.051.810.110.091.150.040.070.61
Ca/P1.711.71 1.691.69 1.691.70 1.691.70
Ca/F4.574.66 4.584.76 4.554.61 4.694.90
Table 4. Contents of major and trace elements in different regions of apatite.
Elements
(ppm)
QP02QP03QP07-1QP07-2
Type 1Type 2Type 1/
Type 2
Type 1Type 2Type 1/
Type 2
Type 1Type 2Type 1/
Type 2
Type 1Type 2Type 1/
Type 2
Cd3.271.771.851.760.921.911.030.921.111.171.021.15
P214,484213,6571.00202,393208,2790.97198,251202,0510.98209,322214,9500.97
Al919141972.19340213022.61100,75416,1796.2355608656.43
Si831640292.0620735004.1575,72213,1915.7442734669.18
K259612472.085291363.8912,62123465.3810242384.30
Fe10332763.7420506823.01152915510.998342413.46
Sr10134302.369845421.8171367659.335271733.05
Na545.98426.601.28496.00319.341.55554.71526.701.05313.20228.741.37
Ti365.5225.6614.24545.38132.634.112158.69543.873.97397.0914.9426.58
Mg263.92149.091.77157.51371.710.42588.56562.051.05134.2291.091.47
Ba202.90148.061.37116.6544.272.63735.09227.653.23138.0585.291.62
Mn127.0131.114.0845.2140.601.1149.0534.931.4030.6226.491.16
Zn116.1239.892.9146.73119.090.3920.2921.300.9526.1219.051.37
Y79.9150.241.5973.2148.091.52347.02167.762.07103.7653.251.95
Zr21.934.574.8024.7712.661.96104.1727.073.8523.824.025.93
Ga21.3214.701.4511.704.412.6577.2522.803.3913.458.131.65
Cr19.4814.111.3834.2529.461.16198.0525.127.8813.431.2610.68
Cu13.255.942.2311.544.082.837.692.493.093.391.432.38
Pb10.656.071.7616.146.082.6552.9621.032.5218.744.823.89
Ni5.981.145.266.671.703.9316.055.862.748.521.744.89
Rb5.082.342.171.430.403.5829.014.945.882.630.574.62
As3.010.933.224.141.392.984.011.452.762.220.484.65
Sc2.241.821.233.422.051.677.584.601.653.112.091.49
Nb1.650.1411.502.370.484.999.462.314.092.000.0727.71
Co1.070.372.931.870.365.225.472.032.691.750.563.11
Ge0.550.105.710.780.332.393.690.665.550.670.0513.08
Sn0.350.122.840.390.201.921.050.283.680.320.065.30
Table 5. Rare earth elements’ contents in different regions of apatite.
Elements
(ppm)
QP02QP03QP07-1QP07-2
Type 1Type 2Type 1Type 2Type 1Type 2Type 1Type 2
La14.922.8019.227.24205.6331.2427.521.12
Ce12.403.8316.706.03155.6924.1923.321.60
Pr3.050.843.651.4740.126.495.620.38
Nd15.085.7216.146.98171.0929.5025.452.82
Sm5.533.114.162.3633.318.896.392.21
Eu1.380.771.010.627.212.451.580.64
Gd8.224.976.484.0639.0615.849.674.57
Tb1.190.711.000.655.532.461.410.71
Dy7.934.857.134.6135.9317.039.975.16
Y79.9150.2473.2148.09347.02167.76103.7653.25
Ho1.801.101.691.068.023.842.321.17
Er5.133.264.963.2423.1211.126.613.50
Tm0.660.420.670.402.761.360.870.42
Yb3.802.533.722.1714.997.455.002.33
Lu0.510.330.510.301.910.960.660.31
δCe0.420.570.460.420.390.390.430.57
LaN/SmN0.400.130.680.450.910.520.630.07
DyN/SmN1.831.982.182.481.372.441.992.97
∑REE + Y161.5185.49160.2489.281091.4330.57230.1580.17
LREE/HREE0.480.250.610.381.280.450.640.12
Table 6. Element transfer factor (ETF) of major and trace elements.
ElementsETF (%)ElementsETF (%)ElementsETF (%)
P2O53.31Th33.9MgO59.26
F6.06Ga36.11Cr60.65
Co6.43Rb39.89SrO65.12
U6.96K2O40Ba66.15
Cd10.85Al2O340.56MnO66.67
Ni11.28Na2O41.67V72.38
Mn15.08Pb43.95Nb85.64
Li15.97La44.51SiO2126.4
Sc17.68CaO45.38SO3619.31
As21.44Ce47.41Zr2584.47
Zn21.99Fe2O353.18
Cu24.08TiO256.67
Table 7. Cd content in phosphate rock and phosphogypsum from different regions.
Origin Of Phosphate RockCd/ppmOrigin of PhosphogypsumCd/ppm (ETF)
Mianzhu (Present study) 2.95 Mianzhu (Present study) 0.48 (10.85)
Average Shale Composition 10.3Tunisia 417.70 (55.2)
Average World Phosphorite 218Tunisian 912.23
Hahotoeé/Kpogameé 32~116Deyang, China 102.26
Tunisia 448.10Morocco 61.93 (12)
Morocco 521.6Brazil 11<1.5
USA 512.5
Morocco 611
China 70.1~4.4
Greece 80.2~0.7
1 Turekian and Wedepohl, 1961 [71]; 2 Altschuler, 1980 [19]; 3 Gnandi, K, 2009 [30]; 4 El Zrelli et al., 2018 [66]; 5 Sattouf, 2007 [72]; 6 Pérez-López et al., 2010 [26]; 7 Ma R, 2002 [21]; 8 Tzifas et al., 2014 [73]; 9 Raja Zmemla et al., 2016 [74]; 10 Hou, 2015 [75]; 11 Saueia et al., 2013 [76].
Disclaimer/Publisher’s Note: The statements, opinions and data contained in all publications are solely those of the individual author(s) and contributor(s) and not of MDPI and/or the editor(s). MDPI and/or the editor(s) disclaim responsibility for any injury to people or property resulting from any ideas, methods, instructions or products referred to in the content.

