Article

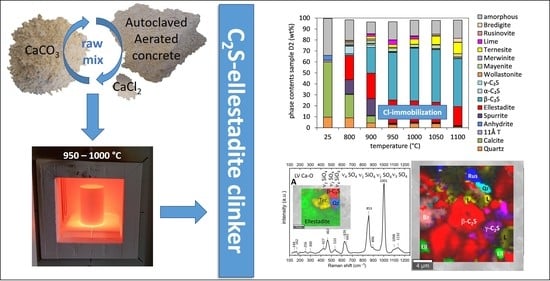
CaCl2 as a Mineralizing Agent in Low-Temperature Recycling of Autoclaved Aerated Concrete: Cl-Immobilization by Formation of Chlorellestadite

Institute for Technical Chemistry, Karlsruhe Institute of Technology, 76344 Karlsruhe, Germany
*
Authors to whom correspondence should be addressed.
Minerals 2022, 12(9), 1142; https://doi.org/10.3390/min12091142
Submission received: 8 August 2022 / Revised: 5 September 2022 / Accepted: 7 September 2022 / Published: 9 September 2022
(This article belongs to the Special Issue Cement Related Minerals—in Memory of Herbert Pöllmann)

Abstract

:
The suitability of CaCl2 as a mineralizing agent in the synthesis of a low-temperature C2S-cement clinker from wastes of autoclaved aerated concrete was investigated. As chlorellestadite is a potential host mineral for the immobilization of chlorine, the formation conditions for the highest joint content of chlorellestadite and C2S were studied in samples with different sulfate contents. Oven experiments were conducted at temperatures between 700 and 1200 °C. The samples were analyzed by X-ray diffraction in combination with chemical and thermal analysis and Raman spectroscopy. Calculation of the yield of C2S and ellestadite for all samples proves the optimum temperature range for the C2S-ellestadite clinker from 950 to 1000 °C. At lower temperatures, the formation of a carbonate-rich halogenide melt promotes the crystallization of a significant amount of spurrite at the expense of C2S. Ellestadite formation mainly depends on the sulfate content and to a lesser extent on the synthesis temperature. However, at higher temperatures, with ternesite another sulfate coexists in sulfate-rich samples at the expense of ellestadite. In addition, distinct evidence for non-stoichiometry and carbonate substitution in the structure of low-temperature ellestadite was found. Low sulfate content leads to the crystallization of Ca10[Si2O7]3Cl2 at higher temperatures. In all samples treated at temperatures above 1000 °C chlorine loss starts. Its extent decreases with increasing sulfate content.

Graphical Abstract

1. Introduction

Despite numerous investigations in the field of belite (C2S) cements as durable, low-carbon, and low-temperature binder technology, there is still a lack of data for belite-clinker synthesis at temperatures below 1000 °C (cement nomenclature: C = CaO, S = SiO2, H = H2O is used throughout this manuscript). Due to the slow hydraulic reactivity of pure C2S at early ages, the majority of approaches are focused on the activation and performance of belite-rich cement clinker synthesized at temperatures above 1200 °C [1,2,3,4,5]. However, the formation of C2S starts already at much lower temperatures of ~650–800 °C [6,7]. Besides a further reduction of the environmental impact compared to Portland cement production, the lowering of synthesis temperature has also been shown to increase the C2S reactivity [8]. In this context, hydrated cement pastes from concrete wastes proved to be valuable precursors for the production of such C2S-clinker [9]. As this material consists of nearly amorphous calcium-silicate-hydrate (C-S-H), the approach not only enables savings in primary raw materials but also promotes the formation of C2S at low temperatures. However, with the use of concrete wastes as raw material, the adaption of the molar C/S ratio by the addition of CaCO3 is imperative. Thus, the formation of C2S is additionally strongly influenced by calcination and diffusion of CaO.
Against this background, mineralizing agents play an important role in such systems [10,11] and are of vital importance for the formation of low-temperature clinkers. Mineralizers or flux agents change the properties of the melt phase in cement kilns. The components are highly electronegative, which increases the viscosity and facilitates dissolution and diffusion of CaO throughout the melt. This accelerates the clinker formation. In particular, inorganic alkali or alkaline earth salts such as CaCl2 have the potential to reduce the formation temperature of clinker phases significantly, especially in combination with CaSO4 [12]. However, the contamination of the high-temperature product with soluble chlorine must be prevented. Thus, chlorine should be immobilized by incorporation in hardly soluble crystalline phases such as chlorellestadite (Ca10(SiO4)3(SO4)3Cl2) to inhibit its release by contact with water.
The use of wastes from autoclaved aerated concrete (AAC) as raw materials for the synthesis of a C2S clinker enables the reaction of chlorine and sulfate with the Ca–silicate matrix to chlorellestadite. AAC wastes contain sulfate due to the addition of CaSO4 in the production process and due to the inevitable contamination with masonry during demolition. In the clinkering process, the presence of silicate compounds leads to the decomposition of anhydrite at low temperatures [13]. Hence, the formation of sulfate-containing phases such as ternesite or ellestadite takes place beside C2S formation at temperatures of about 900 °C already [6,14]. The bonding of chlorine in the insoluble ellestadite structure makes such C2S-chlorellestadite clinkers highly suitable for recirculation in hydrothermal processes such as the production of AAC. Alternatively, they could be used as feedstock for hydrothermally processed binders, e.g., Celitement [15,16,17].
The conditions leading to the formation of chlorellestadite during the clinkering process in cement kilns were thoroughly investigated [18,19]. The use of industrial waste materials such as PVC or other chlorine-containing polymers as alternative fuels promotes the formation of water-soluble chlorine-containing minerals such as KCl and water-insoluble chlorine-containing minerals such as chlorapatite [20] and chlorellestadite (Ca10(SiO4)3(SO4)3Cl2). In addition, the formation of ellestadite was observed during the processing of eco-cement from inorganic residues of waste incineration plants [21,22]. The chlorine-rich endmember of the ellestadite group was found to form in such chlorine- and sulfate-containing systems at temperatures around 1000 °C. Ellestadite itself belongs to the apatite supergroup with the general formula IXM14VIIM26(IVTO4)6X2 [23]. According to the nomenclature, the roman superscript denotes the coordination, M1 and M2 are two independent polyhedral cationic positions, T tetrahedrally coordinated Si, P, S, V, As, etc., and X are anions such as Cl, F, and OH. In the case of ellestadite, the six tetrahedral positions are subdivided equally among Si and S, and the M positions are occupied by Ca. The framework is built with corner-connected columns of Ca(1)O6 polyhedra and (Si/S)O4 tetrahedra that form tunnels in the (001) direction which contain Ca(2)O5(F,Cl,OH) polyhedra. Being closely related to apatite, the structure of natural and synthetic chlorellestadites shares the same hexagonal space group archetype P63/m [24,25]. As observed for apatites [23], indications for a monoclinic structure due to the ordering of Si and S atoms within the tetrahedra or the anions in the tunnels were found in natural and synthetic hydroxylellestadite [26,27]. However, this could not be confirmed in more recent studies [28,29]. The high-temperature stability of chlorellestadite was investigated by thermal analysis [30]. It shows the decomposition of the chlorosulfatosilicate at 1200 °C.
At higher temperatures (≥1200 °C), chlorellestadite partly transforms into the compound Ca10(Si2O7)3Cl2. Its formation was reported in previous studies during the incineration process of waste as a result of the combustion of ashes containing chlorine-bearing calcium silicates [31] from the burned spoil heaps of a coal mine in Russia [32] and by synthesis using the flux method [33]. The structure of a natural mineral with the same composition, known as rusinovite, was investigated using XRD with synchrotron radiation and Raman spectroscopy and is described in the space group Cmcm for samples from two locations [34,35]. It is built of Ca(1) and Ca(3) polyhedra and two half-occupied disilicate groups (Si2O7), which form undulating layers perpendicular to the b-axis. Adjacent layers are interconnected by Ca(2) polyhedra and Cl atoms.
The scope of this work includes the investigation of the formation conditions for chlorellestadite during the low-temperature synthesis process of C2S. Experiments in a laboratory oven were performed to determine the effect of CaCl2 addition on the reaction of AAC and calcite to C2S and ellestadite and to define the optimum temperature range for the synthesis of a C2S-ellestadite clinker according to the possible loss of chlorine and the phase composition.

2. Materials and Methods

2.1. Sample Preparation and Oven Experiments

Three samples of industrial waste materials with different sulfate contents were chosen for the high-temperature experiments. Two samples were demolition wastes from the solid waste management company Otto Dörner (Hannover, Germany; raw materials D1 and D2) and one sample was residue from the production process of autoclaved aerated concrete provided by Xella (Malsch, Germany; raw material P). All samples were dried at 250 °C.
The waste materials were mixed with CaCO3 (Merck, 56.2 wt% CaO, 0.8 wt% SiO2, 42.9 wt% LoI) and 2 wt% CaCl2 to receive a molar C/S ratio of 2 for the starting mixture (P, D1, D2). CaCl2·xH2O (x = 2–6, Merck) was preheated to 250 °C for complete dehydration [36]. Since the reaction rate of sulfates depends strongly on the sample composition [13], the crystallinity, and the heating rate, all phases were assumed to be potentially reactive at 1000 °C, and the share of waste AAC, calcite, and CaCl2 was calculated according to the C/S ratio determined using XRF. In addition, mixtures without CaCl2 (P-, D1-, D2-) were prepared. All mixtures were homogenized for 30 min in a planetary ball mill (Fritsch Pulverisette 5; Idar-Oberstein, Germany).
A Nabertherm oven (LHT 04/17; Lilienthal, Germany) was used to calcine samples (100 g) at temperatures between 700 and 1200 °C in air. The samples were heated up for 90 min until the respective target temperature was reached. After a residence time of 60 min, the material was slowly cooled down to room temperature by switching off the oven (HT[“sample mixture”]_”temperature”).

2.2. Chemical Analysis

Chemical analyses were performed according to DIN 51729-10 using X-ray fluorescence analysis (XRF) (Bruker AXS S8 Tiger; Karlsruhe, Germany). Repeat determination in two beads with different dilution factors (200 and 400 mg with 6 g Li-borate salt mixture) and certified cement standards are used for quality control. Before preparing the beads, loss of ignition (LoI) was determined according to DIN 196-2.
Fluoride and chlorine were analyzed using a combined combustion–ion chromatography system (a1 environscience GmbH; Düsseldorf, Germany and Thermo Fisher Scientific; Dreieich, Germany). About 20–30 mg of fine ground sample were weighed into a ceramic sample boat. Additionally, about 10–15 mg of tungsten oxide was added for better decomposition of the sample.
The oven consists of an inner ceramic tube (at 1000 °C) and a longer outer quartz tube (at 1100 °C) with separated gas supplies. The sample boat is slowly transported into the inner tube using an automated combustion program. During the first stage, hydro-pyrolysis takes place in an argon (200 mL/min)-water vapor/Ar (100 mL/min) atmosphere in the inner tube. The pyrolysis gas is combusted in the outer tube in oxygen (400 mL/min). In the second stage, the gas supply for the inner tube switches from argon to oxygen leading to the combustion of the sample. All gases are absorbed in an absorption tube filled with 3 mL of water. At the end of the combustion process, the absorption tube is filled up to 10 mL. The absorption fluid is then injected into the ion-chromatograph. Fluoride and chloride are analyzed against a calibration curve ranging from 0.1 to 30 mg/L. Therefore, concentrations between 30 and 15,000 mg/kg can be determined. Quality checks are undertaken on a daily basis using combustion of a certified standard material and at least double analysis.

2.3. X-ray Diffraction

Quantitative phase contents of the raw material samples were determined using X-ray diffraction. Approximately 2 g of the samples were measured using an Empyrean diffractometer (Malvern-PANalytical, Almelo, The Netherlands) equipped with a multistrip PIXcel3D detector (255 channels, simultaneously covering 3.347° 2θ), CuKα-radiation, and Bragg-Brentano optics. Measurements were conducted in the range of 5–120° 2θ with a step size of 0.013° 2θ, time per step 1 s, slits of 0.125° and 0.5°, Soller slits of 2.3°, and sample spinning. Phase identification was performed with the software packages HighScore Plus V. 4.9 (PANalytical) and Diffrac-Plus (Bruker-AXS, Karlsruhe, Germany) using PDF 2004 (ICDD) and COD 2019 databases.
Bulk quantitative phase analyses of the samples mixed with an internal standard (20 wt% α-Al2O3, Alfa Aesar 99.95%) were performed with the Rietveld method following the fundamental parameters approach implemented in TOPAS V6 (Bruker-AXS) to determine crystalline and X-ray amorphous contents. A detailed description of the refinement strategy is provided in the Supplementary Material S1. This includes also the structure models and the complete set of parameters for the XRD measurement and the Rietveld refinement [37,38,39,40,41,42,43,44,45,46,47,48,49,50,51,52,53,54,55,56,57,58,59,60,61,62,63,64,65,66,67].
The lattice parameters of corundum were fixed at 4.7600 and 12.9940 Å (determined using refinement with the standard reference material CeO2) during the Rietveld refinements to refine sample displacement and thereby receive comparable lattice parameters for ellestadite (supplementary material S1). The preferred orientation was refined for β-C2S with phase contents > 20 wt% (March-Dollase: MD 1 0 0 and 0 1 0), for ellestadite > 8 wt% (spherical harmonics: sh4), for ternesite and spurrite with phase contents > 10 wt% (spherical harmonics: sh4), for albite and microcline (MD 0 0 1), for calcite with phase contents >10 wt% (MD 1 0 4), and for tobermorite (MD 0 0 2 and 0 2 0) in the raw materials.

2.4. Raman Spectroscopy and Imaging

Confocal Raman spectroscopic analyses were performed on the samples D1 and P calcined at 1200 °C and D2 treated at 1100 °C. The 7 mm compacts prepared using a hand press (Table Top Quick Press S.A.F.I.R., Knokke, Belgium) were used for imaging the phase distribution in the samples. Additionally, single crystals and aggregates dusted on Au-coated specimen slides were used for the acquisition of high-quality single Raman spectra.
A WITec alpha300 R (Ulm, Germany) equipped with a UHTS300 spectrometer (300 mm focal length) and high-performance back-illuminated CCD camera combined with a Zeiss microscope was employed in this investigation. The excitation source was a 532 nm laser with an adjustable power (TruePower; WITec) operated in the range 40–45 mW (measured on the sample). The measurements were performed with a 100× objective with a NA of 0.9 using 600 grating (spectral resolution better than 3 cm−1) and 1800 grating (SR better than 1 cm−1) with acquisition times between 5 and 10 s. and 5–10 scans. The 2D Raman mapping of typical areas of 100 × 100 μm was performed in 1 μm steps. The phase identification was aided by the RRUFF mineral database [68] and the own database integrated into the WITec True Match program. The software Project 5.3 + (WITec) was used for data processing and preparation of the Raman images.

2.5. Thermal Analysis

Thermal analysis (TA) was carried out from ambient temperature to 1400 °C with an STA 449 F3 Jupiter (Netzsch, Selb, Germany) equipped with a platinum furnace (RT to 1500 °C). Measurements of 20–30 mg sample powder were performed in 85 μL Al2O3 crucibles with a heating rate of 10°/min under nitrogen flux (purge 50 mL/min, protective 20 mL/min).

3. Results and Discussion

3.1. Raw Material Composition

The results from chemical analysis, XRD, and TG of the raw mixtures are presented in Table 1. A detailed description of the raw material analyses is provided elsewhere [6]. The sulfate content for samples D2, P, and D1 is 5.0, 2.1, and 0.6 wt%, respectively, and the molar C/S ratio varies between 1.98 and 1.99. Crystalline phases determined with Rietveld refinements are tobermorite, quartz, calcite, vaterite, aragonite, feldspars, and the sulfates bassanite and anhydrite with the highest sulfate contents in sample D2. The fact that CaCl2 could not be determined in the samples can be ascribed to the hygroscopic nature of CaCl2, which transforms to sinjarite (CaCl2·2H2O) in air between 172 and 50 °C [69].
X-ray amorphous contents vary between 30 and 39 wt% and comprise amorphous carbonate, sulfate, feldspar, CaCl2, calcium silicate hydrates, and silica. The combination of RFA, TG, and the retro-calculated chemical composition of the crystalline phases (XRD based on the Rietveld refinements) provides the possibility to estimate the contents of these amorphous phases and therewith the amount of amorphous material that can be ascribed to low-crystalline tobermorite and the C-S-H binding phase. Based on the approximate composition of 1:1:1, the resulting C-S-H content varies between 10 and 25 wt%. See supplementary S2 for a detailed description of the calculation steps. All samples contain amorphous silica beside C-S-H. The difference between the amorphous content determined using XRD and the calculated sum of amorphous phases can be ascribed to minor contents of MgO and Fe2O3 (≤1.2 wt%) and H2O (≤3 wt%).

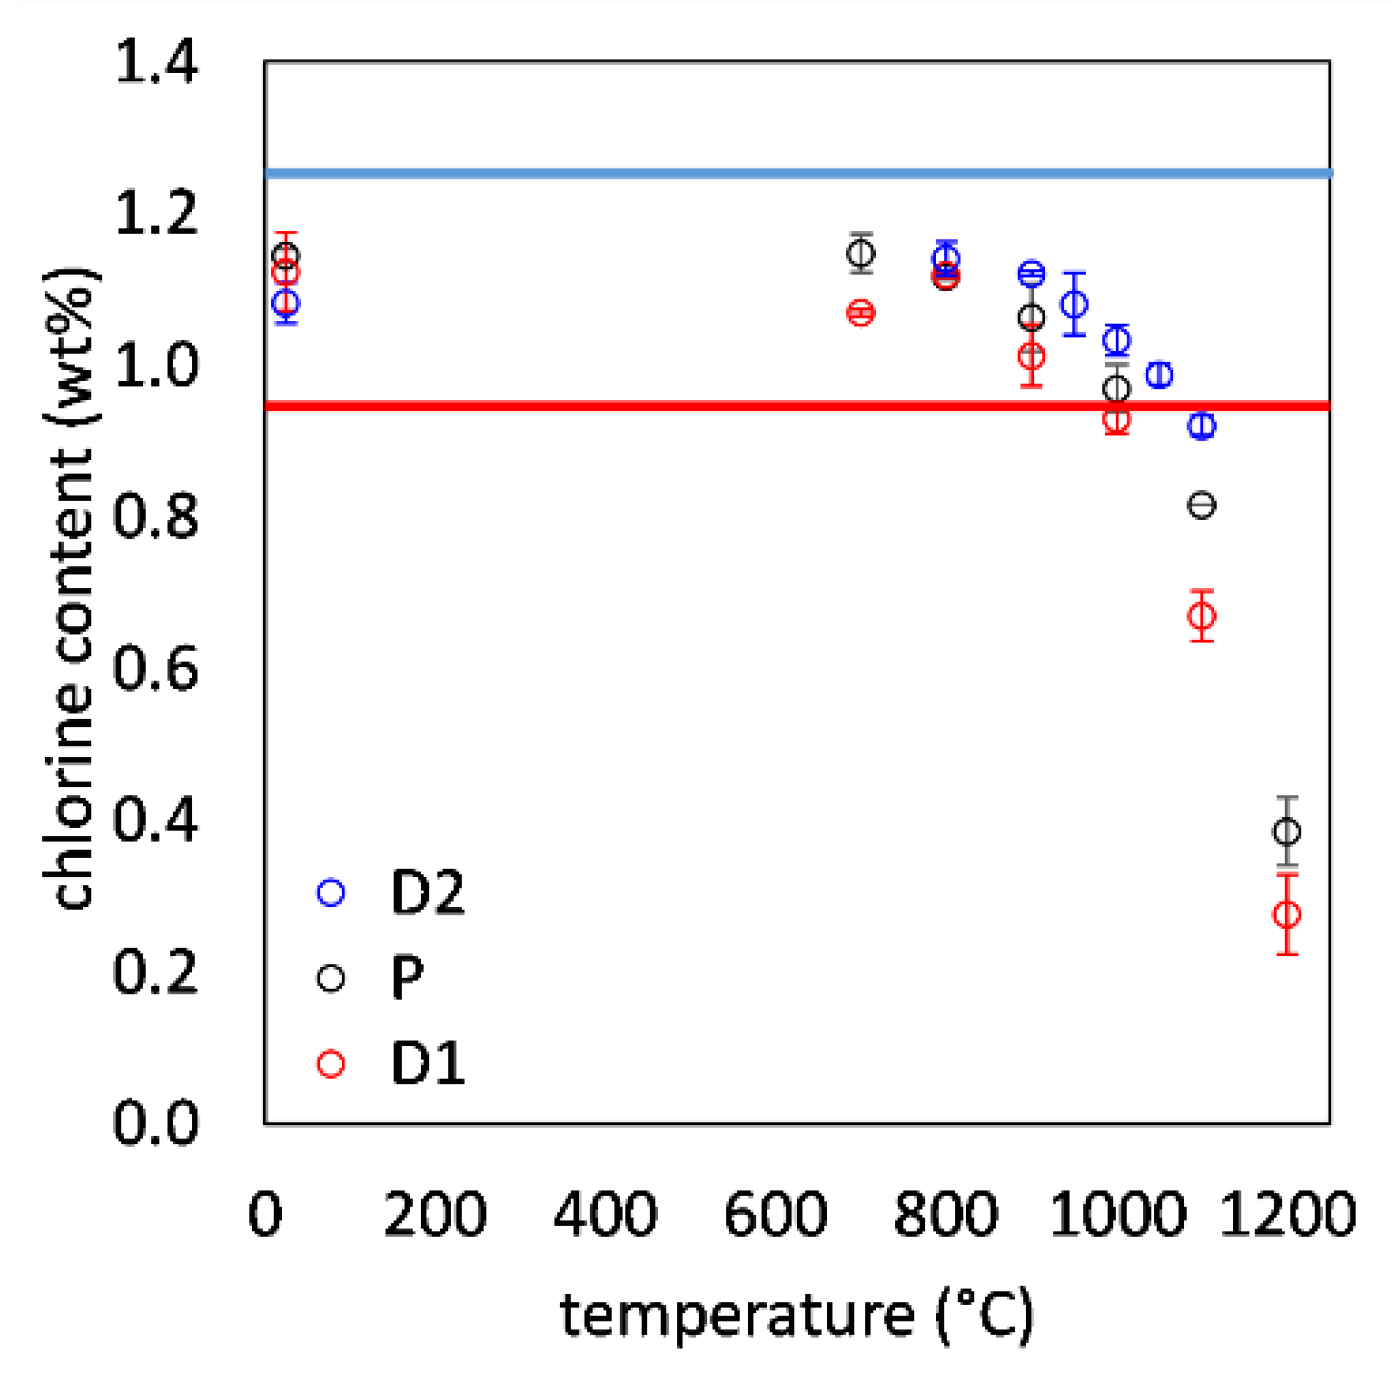
3.2. Variation in Chlorine Content with Synthesis Temperature

Figure 1 shows the variation in chlorine contents in the calcined samples. The high-temperature data (Clmeas) was normalized (Clnorm) according to the loss of ignition of the raw mixture at 25 °C (LoI25).
Cl norm = Cl meas · 100 LOI 25 100 LOI T
LoIT is the loss of ignition for the calcined sample at temperature T.
All samples were targeted at 2 wt% CaCl2 which would result in 1.25 wt% chlorine. However, the actual chlorine content is much lower due to the hygroscopic transformation of CaCl2 to CaCl2·2(H2O) (sinjarite) in air which, if completed, would reduce the chlorine content in the sample to 0.95 wt%. Both limiting chlorine contents are shown in the graph as blue (CaCl2) and red (sinjarite) lines. The normalized chlorine contents for all samples heated to temperatures between 700 and 1000 °C plot between these limits within the range of experimental errors. At 1000–1100 °C the samples start to lose chlorine. The loss of chlorine also depends on the sulfate content of the samples. High sulfate samples lose less chlorine.

3.3. X-ray Diffraction Analysis and Combined Evaluation with RFA, Combustion IC, and TG

3.3.1. Quantitative Phase Contents

Phase contents after synthesis at 1000 °C with and without a mineralizing agent are summarized in Table 2. The addition of CaCl2 leads to a better conversion of raw materials (quartz and calcite/lime) and the formation of higher amounts of the crystalline products C2S and ellestadite in all samples independent of the sulfate content. However, the amount of C2S varies according to the sulfate content. In the samples with CaCl2 addition, higher values of 68 and 64 wt% C2S were determined for the low-sulfate samples D1 and P compared to a value of 48 wt% that was refined for the high-sulfate sample D2. Accordingly, the ellestadite contents are 2 and 10 wt% in samples D1 and P and 19 wt% in sample D2 with CaCl2 addition. In the samples without CaCl2 the sulfate content results in the formation of 4–32 wt% ternesite (Ca5(SiO4)2SO4) instead of ellestadite.
In summary, these results provide distinct evidence for the suitability of CaCl2 as a mineralizing agent in the high-temperature syntheses in cementitious systems. First, the use of the mineralizer leads to an increase in C2S content by more than 50 wt%, and second, at least part of the chlorine is incorporated in the structure of chlorellestadite.
Figure 2a–c shows Rietveld refinements of the raw mixtures at 25 °C and the samples heated with CaCl2 to different temperatures. All refinements result in reasonable models for the measured data. The values for the goodness of fit range between 1.3 and 2.1 and the values for the Durbin Watson statistic between 0.32 and 0.65 (Supplementary Material S2), which are reasonable values concerning the parameters of measurement, i.e., the step size [70] and counts (~10,000). Only the fits of the low-temperature data for sample D2 result in a comparably high GoF = 2.56 and DW statistics of 0.27. This will be elaborated on in an upcoming paper.
The X-ray amorphous content decreases in all samples from values between 30 and 39 wt% for the raw mixtures, to values between 12 and 18 wt% at temperatures around 1000 °C. However, at higher temperatures, the amount of amorphous material increases again. At 1200 °C, samples D1 and P contain amorphous contents of 27 and 30 wt%, respectively. The raw material components calcite, quartz, anhydrite, and tobermorite show a continuous decrease with temperature. The evolution in D1 and P is almost similar. For the low-sulfate samples, the residues are below 3.8 wt% for all syntheses at temperatures above 900 °C whereas for the high-sulfate sample such values are not reached below 1100 °C. Between 700 and 900 °C, large amounts of CO2 are available and significant amounts of spurrite form at the expense of C2S. Therefore, the formation of larger amounts of C2S (>25 wt%) requires 900 °C. However, although the overall C2S content is small at low temperatures, larger amounts of α’H-C2S stay stable during cooling. This is probably due to the fact that the low-temperature samples (T < 900 °C) contain very small crystals of α’H-C2S and for these small crystals with a high surface, the transformation to β-C2S is less favorable [8]. Particularly for the samples with low sulfate content, even a small amount of γ-C2S (<2 wt%) was found in the products synthesized at 700 and 800 °C.
Ellestadite formation starts at 700 °C. Its quantity depends strongly on the sulfate content of the sample but less on temperature. The comparison of the structures of spurrite, Ca5(SiO4)2(CO3), and ellestadite, Ca10(SiO3)3(SO4)3Cl2 shows that both minerals are built of similar structural units, where SiO2 and CO2 are replaced by SO3. Therewith, ellestadite coexists with spurrite between 700 and 900 °C. However, at these temperatures, the CaCl2 mineralizer promotes the formation of a CO-rich C2S-melt. Ellestadites that crystallize in such a melt, are expected to also incorporate carbonate, besides sulfate [71]. Ellestadite contents vary around 1.8 ± 0.7 wt% and 8.7 ± 1.2 wt% for samples D1 and P but decrease from 23.2 wt% at 800 °C to 17.3 wt% at 1100 °C for sample D2. The phase contents of other chlorine-containing phases (mayenite and rusinovite) range below 4 wt% except for the low-sulfate sample D1 at high synthesis temperatures with an increase in rusinovite to 7.4 wt%. With reducing ellestadite quantity in the high-sulfate sample, the amount of ternesite increases from 1.0 to 10.2 wt% at 1100 °C. In this temperature range, fCO2 approaches zero whereas the SO3 release is high. In addition, the sample starts to lose Cl at high temperatures. Both effects support the formation of ternesite (Ca10(SiO4)4(SO4)2) at the expense of ellestadite.
Other high-temperature phases are bredigite, rankinite, and melilite. Bredigite (Ca7Mg(SiO4)4) forms between 1000 and 1100 °C but to a lesser extent at 1200 °C. Its amount reflects the higher MgO content in sample P compared to D1 with values of at most 7.3 and 3.1 wt% for 0.6 and 0.3 wt% MgO in the raw sample. It seems that bredigite (as Mg source) and mayenite (as Al source), otherwise stable between 1000 and 1100 °C, are converted to melilite (Ca2(Mg,Al)(Si,Al)SiO7) at 1200 °C. At this temperature, the formation of rankinite (Ca3Si2O7) is also increased. Both reactions lead to an overall decrease in the C2S content. Once again, the amounts of Al2O3 and MgO reflect in the phase contents, the quantity of melilite being the highest for sample P.

3.3.2. Unit-Cell Volume of β-C2S and Ellestadite

The unit-cell volumes of β-C2S are 345.614(8), 345.579(8), and 345.441(7) Å3 for samples HT[D2]_1000, HT[P]_1000, and HT[D1]_1000, respectively. These values are larger than the ones determined in a previous study [6] on similar sample mixtures (344.97(3), 344.31(9), 344.98(6) Å3). The discrepancy is explained by the fact that these samples were synthesized without the addition of CaCl2 in a different device (HTK1200N, Anton Paar). Furthermore, in the former study, the lattice parameters of corundum were fixed according to literature data. In the current study, they were refined with standard reference material (CeO2). The unit-cell volumes determined in the present study are consistent with the data of Pöhler et al. [72] who determined a unit-cell volume of 345.6(3) Å3 for β-C2S without foreign ion incorporation (Pechini method). However, the e.s.d. of 0.3 covers a wide range, and Figure 3a clearly demonstrates the dependency of the cell volumes on the sulfate content of the raw mixture. That points to the incorporation of sulfate in the structure of β-C2S. On the one hand, the substitution of the smaller sulfur ion for silicon in the tetrahedral position would instead be expected to lead to a decrease in unit-cell volume [72]. On the other hand, the enlargement of the unit-cell volume of belite by doping with SO3 was also observed in prior studies by Stanĕk et al. and Morsli et al. [4,73], although their unit-cell volumes are comparably high (348.72 Å3 for 4.43 wt% SO3 in belite synthesized at ~1400 °C [4]). Stanĕk et al. also demonstrated the positive correlation between Al and S and therewith the coupled replacement of Si by Al and S. Such coupled replacement is also supposable for samples D2, P, and D1 since they contain 1.24, 1.64, and 1.04 wt% Al2O3, respectively. At synthesis temperatures above 1000 °C, with starting sulfate loss, the unit-cell volumes of all samples decrease. The influence of the different sulfate amounts in the raw mixtures also declines with temperature, which manifests in the convergence of the unit-cell volumes of D2, P, and D1 towards 1200 °C. This could be explained either by the preferred incorporation of the residual sulfate in ellestadite and anhydrite at high temperatures or by stabilization of the β-C2S structure by other substitution mechanisms such as Mg for Ca [72,74]. A stabilization of the β-C2S structure by CaCl2 is unlikely as a detailed in situ investigation on the same sample mixtures without CaCl2 shows the transformation of αH-C2S to β-C2S during cooling but no transformation to γ-C2S was observed [6].
The unit-cell volumes of ellestadite were determined for the high-sulfate samples D2 and P (Figure 3b). They show a strong dependency on the synthesis temperature. According to the literature, the unit-cell volume of P63/m chlorellestadite is expected to be 555.09 Å3 (synthesis temperature: 950 °C [29]), which is much higher than the observed values. Particularly, the ellestadites synthesized at low temperatures show comparable small volumes around 546.8 Å3. In general, such small unit cell volumes indicate the incorporation of P or F [28,29]. As the samples contain no detectable amounts of F or P, we suspect the substitution of sulfate and/or the occurrence of chlorine vacancies in the low-temperature ellestadite structure [28,71]. This will be elaborated on in an upcoming paper.

3.3.3. Yield of C2S and Ellestadite

For comparison of the degree of conversion in all samples, the yield of the reaction products C2S and ellestadite was determined using a combined evaluation of all analytical methods.
In the first step, the composition of the amorphous content was determined. For this purpose, the crystalline oxide and elemental contents were retro-calculated from the phase compositions and were subtracted from the ones determined using TG (H2O, CO2, and SO3), combustion IC (Cl), and RFA (other oxides). Complemental information on the calculation procedure as well as the resultant composition of the amorphous content is provided together with the measured raw data in Supplementary S2. The resultant chemical components of the amorphous fractions show reasonable positive values within a deviation of −0.3 wt% except from the chlorine content of samples D2 synthesized at low temperatures (800–950 °C). For these samples, the calculations result in negative amorphous chlorine contents of −0.8 wt%, which again indicates an overestimation of the chlorine content in ellestadite for these samples.
In the second step, the chemical components calculated for the amorphous fractions were ascribed to phase compositions. Calcite was assumed to be the amorphous CO2-containing phase since amorphous CaCO3 was already present in the starting mixture. Spurrite which forms to a great extent between 800 and 900 °C is of high crystallinity (coherent scattering domain sizes >90 nm) and is therefore not considered amorphous. Similar assumptions were made by the assignment of Cl to low-crystalline CaCl2. Whereas ellestadite is of high crystallinity in all samples (coherent scattering domain sizes >60 nm), CaCl2 or sinjarite is hardly detectable even in the sample mixture before heating. SO3 and Fe2O3 in the amorphous fractions were supposed to be bound in low-crystalline anhydrite and brownmillerite. Final residues of MgO + Al2O3 are below 1.6 wt% and the content of amorphous C2S was calculated from the remaining amounts of CaO and SiO2. After subtraction of CaO that is incorporated in the calculated low-crystalline phases, the C/S ratio in the amorphous content is ≤2 in all samples. Therefore, the amount of amorphous C2S was calculated according to the amount of CaO, and a remainder of amorphous SiO2 was assumed.
The third step is the calculation of the yield of the reaction. For that purpose, the amounts of amorphous and crystalline C2S, as well as the amount of ellestadite, were normalized to the LoI of the raw material. As all sample mixtures were prepared with a C/S ratio = 2 and both major by-products, ternesite and ellestadite, have higher C/S ratios, CaO is the limiting component. There is no C2S or ellestadite in the reactant, therefore, the reaction yield (Y) was calculated for CaO according to:
Y = C 2 S / Ellestadite Product CaO Reactant · υ Reactant υ Product
where C2S/EllestaditeProduct is the molar amount of C2S or ellestadite in the product and CaOReactant is the molar amount of CaO in the raw material. υReactant and υProduct are the stoichiometric coefficients of CaO, C2S, and ellestadite according to the theoretical reactions:
2 CaO + SiO s   Ca 2 SiO 4 10 CaO + 3 SiO 2 + 3 SO 3 + 2 Cl     Ca 10 ( SiO 4 ) 3 ( SO 4 ) 3 Cl 2
The yields for crystalline C2S, the sum of crystalline and amorphous C2S, and the sum of all C2S and ellestadite are depicted in Figure 4a–c (datasets are provided in Supplementary S3). For the contents of C2S, only β- and α-C2S were taken into account since γ-C2S shows a very low hydration rate [5]. The yield of C2Scrystalline + amophous decreases with sulfate content, from 0.82 in sample HT[D1]_1000 to 0.62 in sample HT[D2]_1000. This could be explained by the amount of CaO that reacts to ellestadite and thus is unavailable for C2S formation. In general, the yield of amorphous C2S is small compared to the yield of crystalline C2S. Only in the low-temperature data of samples P and D1 does crystalline and non-crystalline C2S form in equal amounts.
As the formation of C2S is limited by the amount of CaO that is incorporated in ellestadite, which forms in such chlorine- and sulfur-containing cementitious systems [21,22], the yield of ellestadite was also calculated. The addition to the yield of total C2S results in similar values for all samples independent of sulfate content with a maximum of 0.86 ± 0.02 at 1000 °C. At higher temperatures, there is no increase. In the high-sulfate sample, there is even a distinct decrease in the yield of C2S and ellestadite observed which can be ascribed to the formation of significant amounts of ternesite instead of ellestadite. The yield could be increased by the adaption of the C/S ratio to the ellestadite content that is expected according to the sulfate and chlorine content. However, the ratio must be adjusted carefully since other phases such as ternesite also form and as the high-temperature samples contain different amounts of residual raw materials. For example, sample D2 contains 2.4 wt% residual CaO beside 3.8 wt% SiO2 at 1000 °C which would result in 3.8 wt% more C2S if CaO had reacted with SiO2, and yet a significant amount of ternesite (C/S ratio of 2.5) is formed instead of chlorellestadite (C/S ratio of 3.3) and C2S.

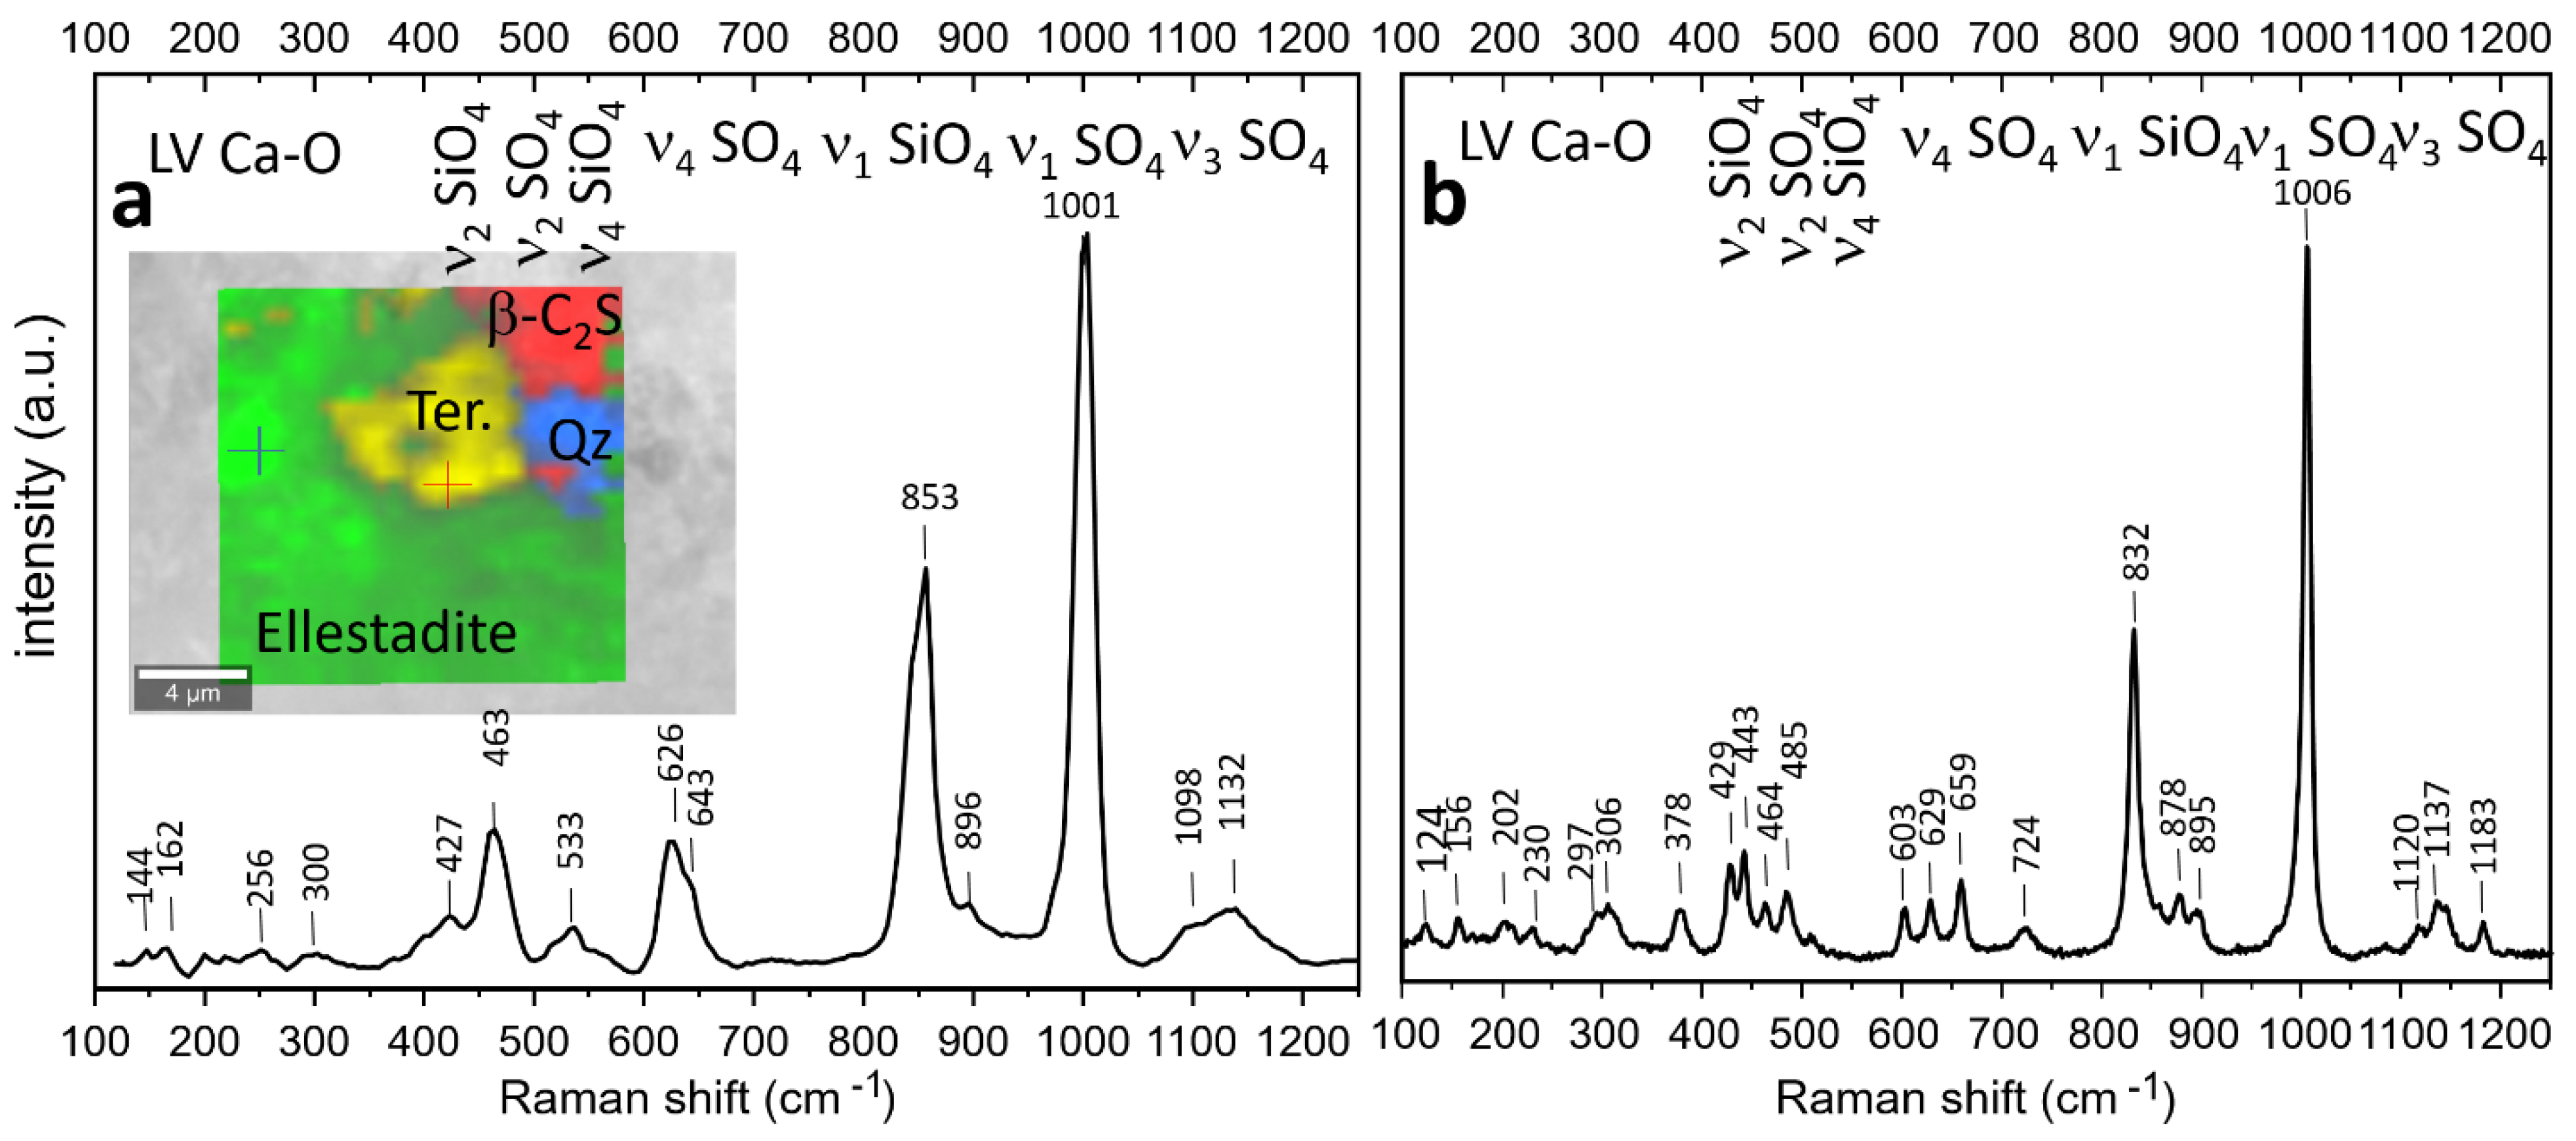
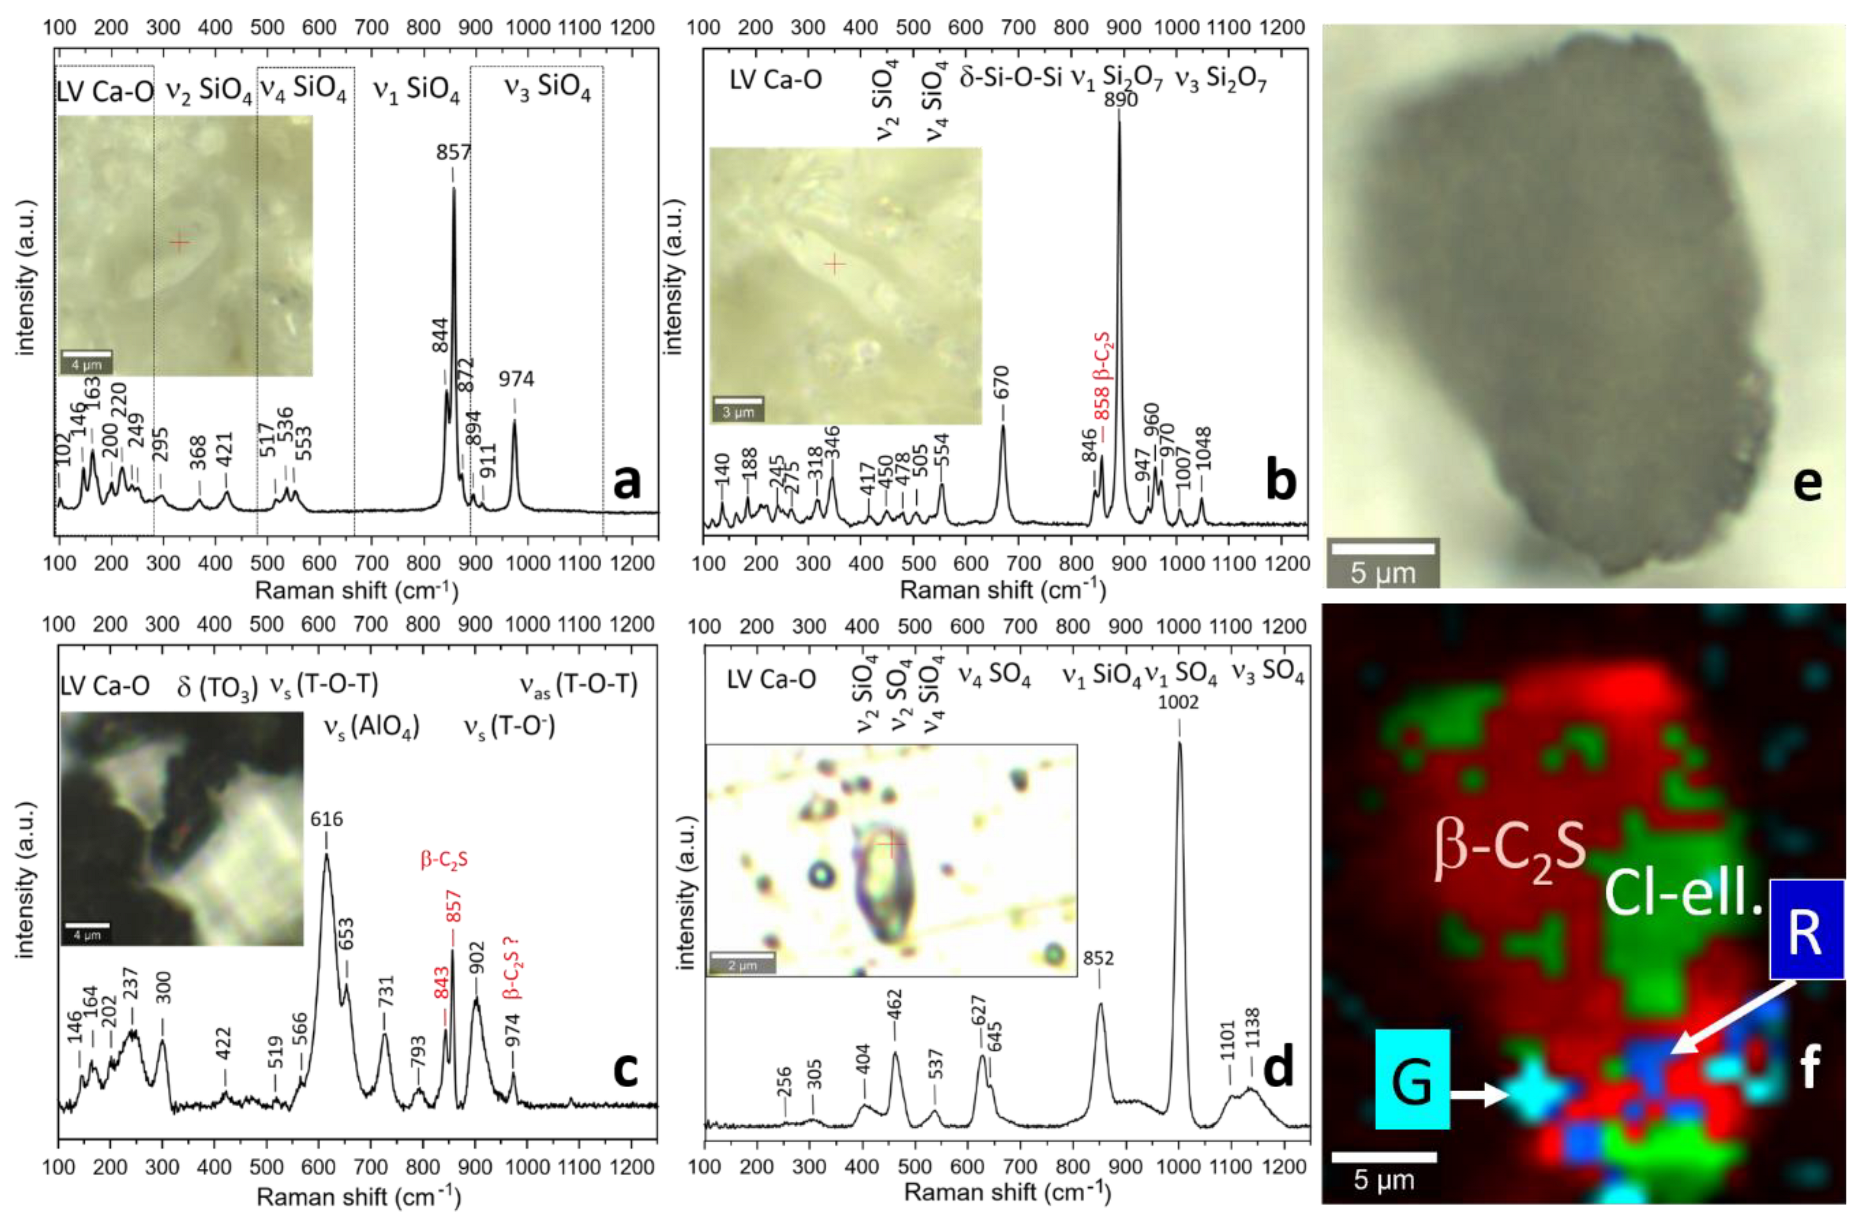
3.4. Raman Spectroscopy

3.4.1. Sample D2 1100 °C

Figure 5 shows typical spectra of chlorellestadite (a) and ternesite (b) present in sample HT[D2]_1100. Additionally, the insert in Figure 5a shows an image (15 × 15 μm) of the phase distribution of chlorellestadite, ternesite, β-C2S, and quartz. The spectrum of chlorellestadite resembles the one that was already discussed by Środek et al. in 2018 [25] and is dominated by the band at 1001 cm−1, which belongs to the ν1-SO4 mode. In addition, bands at 463 cm−1 and a double band at 626 and 643 cm−1 belong to ν2 and ν4 modes of symmetrical bending within the SO4 tetrahedra. Broader bands in the range 1050–1200 cm−1 are due to ν3 antisymmetric stretching modes of SO4. The symmetrical stretching mode ν1 of the SiO4 tetrahedron gives rise to a band at 853 cm−1. The corresponding ν2 and ν4 modes are shown by broad multiple bands around 427 and 533 cm−1, respectively. In general, the low number of the bands observed suits a highly symmetrical hexagonal cell very well. The broadening of the bands could be assigned to a high degree of disorder in the occupation of the tetrahedral sites. The spectrum of ternesite is characterized by a sharp band at 1006 cm−11-SO4). In the range between 400 and 550 cm−1, the ν2 (SO4), ν2-(SiO4), and ν4-(SiO4) modes are observed as bands at 429, 443, 464, 485, and 510 cm−1. The sharp band at 832 cm−1 is due to the symmetrical stretching within isolated SiO4 tetrahedra. The bands observed between 1050 and 1200 cm−1 are due to the asymmetrical stretching of SO4 tetrahedra. The Raman bands of ternesite observed in this study match perfectly those observed by Böhme et al. in 2020 for ternesite at room temperature [14]. The close proximity of ellestadite and ternesite in the Raman image once again supports the idea that ternesite, anhydrite, and C2S are formed at the cost of ellestadite according to the reaction:
Ca10[SiO4]3[SO4]3Cl2 → Ca5[SiO4]2[SO4] + Ca2[SiO4] + 2Ca[SO4] + CaCl2
Simultaneously at temperatures above 930 °C, available C2S and anhydrite also react to ternesite [14]:
2Ca2[SiO4] + Ca[SO4] → Ca5[SiO4]2[SO4]
Both reactions explain the decreasing quantity of ellestadite and C2S and the increased quantity of ternesite in the sulfate-rich sample treated at 1100 °C. The possible mechanisms of ternesite formation also include growth from sulfate and halogenide-bearing melts as observed in the Hatrurim complex [75].

3.4.2. Sample P 1200 °C

Figure 6 presents a single spectrum of the major components of the sample HT[P]_1200 (Figure 6a–d) and the Raman image of an aggregate showing their lateral distribution (e–f). The Raman spectrum of β-C2S (a) taken on a single crystal (10 × 4 μm) matches the results from Remy et al. (2005) [76]. The main bands due to ν1 SiO4 are observed at 844 and 857 cm1. For further band frequencies and their assignment, see Figure 6a. Figure 6b shows the Raman spectrum of a single crystal of rankinite (12 × 3 μm). Typical features are the most intense bands at 890 (ν1 (Si2O7)) and 670 cm−1 assigned to the Si-O-Si symmetrical bending mode of the silicate dimer [77,78]. Figure 6c shows the Raman spectrum of melilite taken on a single crystal (8 × 4μm). The main bands at 616 and 902 cm−1 could be assigned to symmetrical bending and symmetrical stretching of T-O-T and T-O- in linked tetrahedral sites occupied by Al, Si, and Mg. The shoulder at 653 cm−1 could be assigned to νS (AlO4) [79,80]
Both the intensity distribution and frequencies of the main bands point to a melilite with a composition closer to the gehlenite endmember [80]. As already pointed out in the XRD section, the presence of melilite in sample HT[P]_1200 reflects its higher Al and Mg content compared to the D1 and D2 samples.
Figure 6d shows the unpolarized Raman spectrum of chlorellestadite single crystal (5 × 2 μm) formed at 1200 °C.
The observed frequencies are identical (within the spectral resolution) to those of sample D2. Figure 6e,f show the optical and the Raman image of an aggregate, respectively. The distribution of the four main phases discussed above matches the XRD results very well.

3.4.3. Sample D1 1200 °C

Figure 7a shows the phase distribution of β-C2S, γ-C2S, bredigite (Br), ellestadite (Ell), rusinovite, quartz, and lime (L) in the sample HT[D1]_1200. Idiomorphic crystals (5–6 μm) of β-C2S are dominating along with smaller crystals of γ-C2S and bredigite. Ellestadite appears as small (<2 μm) scattered crystals in accordance with the very low quantity found by XRD. Some spots mostly on the surface of C2S crystals point to the presence of unreacted CaO, detected as secondary CaCO3 formed after the calcination via carbonation from the air. Additionally, irregular crystals of rusinovite are seen, once again in accordance with the XRD data. Figure 7b shows the Raman spectrum of rusinovite taken on a single crystal. Minor surface contamination with β-C2S is possible resulting in small bands at 843 and 858 cm−1. The spectrum is dominated by the band at 900 cm−1 assigned to the ν1-(Si2O7). In addition, two bands at 635 and 652 cm−1 result from the symmetrical bending of Si-O-Si of the dimeric Si2O7. To our knowledge, it is the first report of the Raman spectrum of synthetic Ca10[Si2O7]3Cl2. However, the observed frequencies and intensity ratios coincide very well with those observed for natural rusinovite [35], which implies a very stable chemical composition. The presence of a very low sulfate content in the D1 sample suppresses the formation of ellestadite. The formation of Ca10[Si2O7]3Cl2 preferentially at higher temperatures above 1000 °C and especially at 1200 °C implies crystallization from a halogenide-containing melt.

4. Summary and Conclusions

The suitability of CaCl2 as a mineralizing agent for the recycling of wastes from autoclaved aerated concrete in a low-heat C2S clinker was proven. Oven experiments reveal the formation of chlorellestadite beside C2S in sulfate-containing samples. Chlorellestadite, a mineral potentially suitable for chlorine immobilization, forms at temperatures between 700 and 1200 °C in samples with varying amounts of sulfate. Different factors influence the formation of C2S-chlorellestadite clinker.
  • The amount of ellestadite depends strongly on the sulfate content and to a lesser extent on the synthesis temperature.
  • The optimal temperature for the formation of ellestadite beside large amounts of C2S is 950–1000 °C where the decomposition of carbonate is accomplished resulting in low spurrite contents. In this range, still no loss of chlorine takes place.
  • Careful adaption of both the amount of CaCl2 addition to the sulfate content of the sample and the C/S ratio to the expected ellestadite content must be considered.
All samples synthesized at 1000 °C show a high yield for CaO in the sum of C2S and ellestadite of 0.83 ± 0.02. However, the yield of CaO in ellestadite varies from 0.18 in the high-sulfate sample to 0.01 in the low-sulfate sample. This shows the dependency of the suitability of CaCl2 as a mineralizer on the sulfate content of the raw material. However, an unanswered question is whether chlorine remains immobilized in ellestadite during the recirculation of the material in a hydrothermal process (such as the production of autoclaved aerated concrete). It must be proven in subsequent experiments.
In the low-sulfate samples, most of the chlorine is bound in low-crystalline and less-stable phases. At temperatures higher than 1000 °C and especially 1200 °C, crystallization of Ca10[Si2O7]3Cl2, most probably from melt and at the cost of C2S, takes place.
The quantity of MgO and Al2O3 determines the possible formation of mayenite and bredigite in the range of 1000–1100 °C. At higher temperatures, these minerals are transformed into melilite with a composition depending on the MgO/Al2O3 ratio. In the case of sample P, the melilite formed is close to a gehlenite composition as proven with Raman spectroscopy.
Poor-fit statistics of Rietveld refinement, negative chlorine contents in the amorphous content, and small unit-cell volumes of ellestadite, provide a distinct indication for a non-stoichiometric structure of ellestadite in the low-temperature syntheses. However, the detailed investigation of the structures of ellestadites synthesized at different temperatures, i.e., the detection of the occurrence of cation substitution and vacancies in the ellestadite framework, requires further study.
Raman spectroscopy delivers complementary information to XRD data and proves to be a very useful tool for both imaging of the distribution and space relations between different phases within the samples and detailed structural and chemical information of solid solutions. Spectra from single crystals allow the comparison with existing Raman data and provide a reliable database for further investigations.

Supplementary Materials

The following are available online at https://www.mdpi.com/article/10.3390/min12091142/s1, S1: Rietveld refinements, S2: Calculation of the composition of the amorphous content, S3: Calculation of the yield for CaO in C2S and ellestadite.

Author Contributions

Conceptualization, A.U., K.G., P.S. and U.S.; formal analysis, A.U., K.G. and M.K.; investigation, A.U., K.G., M.K., U.S. and B.B.; writing—original draft preparation, A.U. and K.G.; writing—review and editing, P.S. and B.B.; funding acquisition: P.S. All authors have read and agreed to the published version of the manuscript.

Funding

This research was funded by BMBF, grant number 033R249D (REPOST Project, 1 June 2019–31 December 2022, https://innovative-produktkreislaeufe.de/Projekte/REPOST.html, accessed on 6 September 2022).

Acknowledgments

The authors thank Stefanie Kaufmann, Julia Podszuweit for RFA and C-IC measurements. We acknowledge support by the KIT-Publication Fund of the Karlsruhe Institute of Technology.

Conflicts of Interest

The authors declare no conflict of interest. The funders had no role in the design of the study; in the collection, analyses, or interpretation of data; in the writing of the manuscript, or in the decision to publish the results.

References

  1. Chatterjee, A.K. High belite cements—Present status and future technological options: Part I. Cem. Concr. Res. 1996, 26, 1213–1225. [Google Scholar] [CrossRef]
  2. Chatterjee, A.K. Future technological options: Part II. Cem. Concr. Res. 1996, 26, 1227–1237. [Google Scholar] [CrossRef]
  3. Dienemann, W.; Schmitt, D.; Bullerjahn, F.; Haha, M.B. Belite-Calciumsulfoaluminate-Ternesite (BCT)-A new low-carbon clinker Technology. Cem. Int. 2013, 11, 100–109. [Google Scholar]
  4. Stanĕk, T.; Sulovský, P. Active low-energy belite cement. Cem. Concr. Res. 2015, 68, 203–210. [Google Scholar] [CrossRef]
  5. Cuesta, A.; Ayuela, A.; Aranda, M.A.G. Belite cements and their activation. Cem. Concr. Res. 2021, 140, 106319. [Google Scholar] [CrossRef]
  6. Ullrich, A.; Garbev, K.; Bergfeld, B. In-Situ X-ray Diffraction at High Temperatures: Formation of Ca2SiO4 and Ternesite in Recycled Autoclaved Aerated Concrete. Minerals 2021, 11, 789. [Google Scholar] [CrossRef]
  7. Taylor, H.F.W. Cement Chemistry, 2nd ed.; Thomas Telford Ltd.: London, UK, 1997. [Google Scholar]
  8. Serpell, R.; Zunino, F. Recycling of hydrated cement pastes by synthesis of α’H-C2S. Cem. Concr. Res. 2017, 100, 398–412. [Google Scholar] [CrossRef]
  9. Serpell, R.; Lopez, M. Properties of mortars with reactivated cementitious materials. Cem. Concr. Res. 2015, 64, 16–26. [Google Scholar] [CrossRef]
  10. Hunsinger, H.; Beuchle, G.; Stemmermann, P.; Schweike, U.; Giziewicz, K.; Garbev, K. Method for Producing Dicalcium Silicate. U.S. Patent 9751771B2, 5 September 2017. [Google Scholar]
  11. Yamashita, M.; Tanaka, H. Low-temperature burnt portland cement clinker using mineralizer. Cem. Sci. Concr. Technol. 2011, 65, 82–87. [Google Scholar] [CrossRef]
  12. Engelsen, C.J. Effect of Mineralizers in Cement Production; SINTEF Report: Trondheim, Norway, 2007; pp. 1–25. ISBN 9788253609843. [Google Scholar]
  13. Böhme, N.; Hauke, K.; Neuroth, M.; Geisler, T. In situ Raman imaging of high-temperature solid-state reactions in the CaSO4-SiO2 system. Int. J. Coal Sci. Technol. 2019, 6, 247–259. [Google Scholar] [CrossRef]
  14. Böhme, N.; Hauke, K.; Neuroth, M.; Geisler, T. In situ Hyperspectral Raman Imaging of Ternesite Formation and Decomposition at High Temperatures. Minerals 2020, 10, 287. [Google Scholar] [CrossRef] [Green Version]
  15. Garbev, K.; Beuchle, G.; Schweike, U.; Merz, D.; Dregert, O.; Stemmermann, P. Preparation of a Novel Cementitious Material from Hydrothermally Synthesized C-S-H Phases. J. Am. Ceram. Soc. 2014, 97, 2298–2307. [Google Scholar] [CrossRef]
  16. Stemmermann, P.; Schweike, U.; Garbev, K.; Beuchle, G.; Möller, H. Celitement-A sustainable prospect fort the cement industry. Cem. Int. 2010, 8, 52–67. [Google Scholar]
  17. Beuchle, G.; Stemmermann, P.; Schweike, U.; Garbev, K. Single-Phase Hydraulic Binder, Methods for the Production Thereof and Building/Structural Material Produced Therewith. U.S. Patent 8382892, 26 February 2013. [Google Scholar]
  18. Saint-Jean, S.J.; Jøns, E.; Lundgaard, N.; Hansen, S. Chlorellestadite in the preheater system of cement kilns as an indicator of HCl formation. Cem. Concr. Res. 2005, 35, 431–437. [Google Scholar] [CrossRef]
  19. Gerassimidou, S.; Velis, C.A.; Williams, P.T.; Castaldi, M.J.; Black, L.; Komilis, D. Chlorine in waste-derived solid recovered fuel (SRF), co-combusted in cement kilns: A systematic review of sources, reactions, fate and implications. Crit. Rev. Environ. Sci. Technol. 2020, 51, 140–186. [Google Scholar] [CrossRef]
  20. Martauz, P.; Strigáč, J.; Jamnický, M. Decreasing chloride levels in cement rotary kiln atmosphere by sorption into hydroxylapatite structure. Mat. Sci. 2007, 60, 75–86. [Google Scholar]
  21. Hashem, M. Using Eco-Cement Made from Municipal Solid Waste Incineration Residues as a Mineral Additive for Concrete. Master’s Thesis, McGill University, Montreal, QC, Canada, 2021. [Google Scholar]
  22. Ghouleh, Z.; Shao, Y. Turning municipal solid waste incineration into a cleaner cement production. J. Clean. Prod. 2018, 195, 268–279. [Google Scholar] [CrossRef]
  23. Pasero, M.; Kampf, A.R.; Ferraris, C.; Pekov, I.V.; Rakovan, J.; White, T. Nomenclature of the apatite supergroup minerals. Eur. J. Mineral. 2010, 22, 163–179. [Google Scholar] [CrossRef]
  24. Saint-Jean, S.J.; Hansen, S. Nonstoichiometry in chlorellestadite. Solid State Sci. 2005, 7, 97–102. [Google Scholar] [CrossRef]
  25. Środek, D.; Galuskina, I.O.; Galuskin, E.; Dulski, M.; Książek, M.; Kusz, J.; Gazeev, V. Chlorellestadite, Ca5(SiO4)1.5(SO4)1.5Cl, a new ellestadite-group mineral from Shadil-Khokh volcano, South Ossetia. Mineral. Petrol. 2018, 112, 743–752. [Google Scholar] [CrossRef]
  26. Sudarsanan, K. Structure of Hydroxylellestadite. Acta Cryst. 1980, B36, 1636–1639. [Google Scholar] [CrossRef]
  27. Organova, N.I.; Rastsvetaeva, R.K.; Kuz’mina, O.V. Crystal Structure of Low-Symmetry Ellestadite in Comparison with other Apatite-Like Structures. Kristallografiya 1994, 39, 278–282. [Google Scholar]
  28. Fang, Y.N.; Ritter, C.; White, T.J. Crystal chemical characteristics of ellestadite-type apatite: Implications for toxic metal immobilization. Dalton Trans. 2014, 43, 16031–16043. [Google Scholar] [CrossRef]
  29. Fang, Y.; Ritter, C.; White, T. The Crystal Chemistry of Ca10-y(SiO4)3(SO4)3Cl2-x−2yFx Ellestadite. Inorg. Chem. 2011, 50, 12641–12650. [Google Scholar] [CrossRef] [PubMed]
  30. Chen, M.; Fang, Y. The Chemical Composition and Crystal Parameters of Calcium Chlorosulfatosilicate. Cem. Concr. Res. 1989, 19, 184–188. [Google Scholar] [CrossRef]
  31. Stemmermann, P.; Pöllmann, H. The system CaO-SiO2-CaCl2-phase equilibria and polymorphs below 1000 °C. An interpretation on garbage combustion ashes. Neues Jahrb. Mineral. Monatsh. 1992, 9, 409–431. [Google Scholar]
  32. Chesnokov, B.V.; Vilisov, V.; Bushmakin, A.; Kotlyarov, V.; Belogub, E.V. New minerals from a fired dump of the Chelyabinsk coal basin. Ural Mineral. Zbor. 1994, 3, 3–34. [Google Scholar]
  33. Hermoneit, B.; Ziemer, B.; Malewski, G. Single crystal growth and some properties of the new compound Ca3Si2O7∙13CaCl2. J. Cryst. Growth 1981, 52, 660–664. [Google Scholar] [CrossRef]
  34. Galuskin, E.V.; Galuskina, I.O.; Lazic, B.; Armbruster, T.; Zadov, A.E.; Krzykawski, T.; Banasik, K.; Gazeev, V.M.; Pertsev, N.N. Rusinovite, Ca10(Si2O7)3Cl2: A new skarn mineral from the Upper Chegem caldera, Kabardino-Balkaria, Northern Caucasus, Russia. Eur. J. Mineral. 2011, 23, 837–844. [Google Scholar] [CrossRef]
  35. Środek, D.; Juroszek, R.; Krüger, H.; Krüger, B.; Galuskina, I.; Gazeev, V. New Occurrence of Rusinovite, Ca10(Si2O7)3Cl2: Composition, Structure and Raman Data of Rusinovite from Shadil-Khokh volcano, south Ossetia and Bellerberg Volcano, Germany. Minerals 2018, 8, 399. [Google Scholar] [CrossRef]
  36. Barreneche, C.; Fernandez, A.I.; Cabeza, L.F.; Cuypers, R. Thermophysical Characterization of Sorption TCM. Energy Procedia 2014, 48, 273–279. [Google Scholar] [CrossRef]
  37. National Institute of Standards and Technology. Certificate of Analysis Standard Reference Material® 640e, Line Position and Line Shape Standard for Powder Diffraction (Silicon Powder); Department of Commerce: Gaithersburg, MD, USA, 2015.
  38. National Institute of Standards and Technology. Certificate of Analysis Standard Reference Material® 674b, X-ray Powder Diffraction Intensity Set (Quantitative Powder Diffraction Standard); Department of Commerce: Gaithersburg, MD, USA, 2017.
  39. Marchbank, H.R.; Clark, A.H.; Hyde, T.I.; Playford, H.Y.; Tucker, M.G.; Thompsett, D.; Fisher, J.; Chapman, K.W.; Beyer, K.A.; Monte, M.; et al. Structure of nano-sized CeO2 material: A combined scattering and spectroscopic investigation. ChemPhysChem 2016, 17, 3494–3503. [Google Scholar] [CrossRef] [PubMed]
  40. Pederson, B.M.; Schaible, K.J.; Winburn, R.S. Minimization of errors due to microabsorption or Absorption contrast. Adv. X-ray Anal. 2004, 47, 200–205. [Google Scholar]
  41. Le Page, Y.; Donnay, G. Refinement of the crystal structure of low-quartz. Acta Cryst. 1976, 32, 2456–2459. [Google Scholar] [CrossRef]
  42. Liu, S.; Li, H.; Liu, J. Obtaining optimal structural data from X-ray powder diffraction using the Rietveld method. Powder Diffr. 2014, 29, 396–403. [Google Scholar] [CrossRef]
  43. Merlino, S.; Bonaccorsi, E.; Armbruster, T. The real structure of tobermorite 11 A: Normal and anomalous forms, OD character and polytypic modifications. Eur. J. Mineral. 2001, 13, 577–590. [Google Scholar] [CrossRef]
  44. De Villiers, J.P.R. Crystal structures of aragonite, strontianite, and witherite. Am. Mineral. 1971, 56, 758–766. [Google Scholar]
  45. Kamhi, S.R. On the structure of vaterite, CaCO3. Acta Cryst. 1963, 16, 770–772. [Google Scholar] [CrossRef]
  46. Hawthorne, F.C.; Ferguson, R.B. Anhydrous Sulfates II. Refinement of the Crystal Structure of Anhydrite. Can. Mineral. 1975, 13, 289–292. [Google Scholar]
  47. Ballirano, P.; Maras, A.; Meloni, S.; Caminiti, R. The monoclinic I2 structure of bassanite, calcium sulphate hemihydrate (CaSO4*0.5(H2O)). Eur. J. Mineral. 2001, 13, 985–993. [Google Scholar] [CrossRef]
  48. Allan, D.R.; Angel, R.J. A high-pressure structural study of microcline (KAlSi3O8) to 7 GPa. Eur. J. Mineral. 1997, 9, 263–275. [Google Scholar] [CrossRef]
  49. Winter, J.K.; Okamura, F.P.; Ghose, S. A high temperature structural study of high albite, monalbite, and the analbite-monalbite phase transition. Am. Mineral. 1979, 64, 409–423. [Google Scholar]
  50. Leclaire, A.; Borel, M.M. Le dichlorure de calcium dehydrate. Acta Cryst. 1977, 33, 1608–1610. [Google Scholar] [CrossRef]
  51. Mumme, W.G.; Hill, R.J.; Bushnell, G.W.; Segnit, E.R. Rietveld crystal structure refinements, crystal chemistry and calculated powder diffraction data for the polymorphs of dicalcium silicate and related phases. Neues Jahrb. Mineral. 1995, 169, 35–68. [Google Scholar]
  52. Mumme, W.G.; Cranswick, L.; Chakoumakos, B. Rietveld crystal structure refinement from high temperature neutron powder diffraction data for the polymorphs of dicalcium silicate. Neues Jahrb. Mineral. Abh. 1996, 170, 171–188. [Google Scholar]
  53. Galuskin, E.V.; Kusz, J.; Armbruster, T.; Bailau, R.; Galuskina, I.O.; Ternes, B.; Murashko, M. A reinvestigation of mayenite from the type locality, the Ettringer Bellerberg volcano near Mayen, Eifel district, Germany. Mineral. Mag. 2012, 76, 707–716. [Google Scholar] [CrossRef]
  54. Ruilun, Y.; Wang, X.; Zhang, Z. Crystal structure of the new compound Ca8Mg(SiO4)4Cl2. Guisuanyan Xuebao 1987, 15, 309–314. [Google Scholar]
  55. Anselment, B. Die Dynamik der Phasenumwandlung vom Rutil-in den CaCl2-Typ am Beispiel des CaBr2 and zur Polymorphie des CaCl2; Dissertation Universität Karlsruhe: Karlsruhe, Germany, 1985; pp. 1–195. [Google Scholar]
  56. Golovastikov, N.I.; Kazak, V.F. The crystal structure of calcium chlorosilicate Ca2SiO3Cl2. Kristallografiya 1977, 22, 962–965. [Google Scholar]
  57. Irran, E.; Tillmanns, E.; Hentschel, G. Ternesite, Ca5(SiO4)2SO4, a new mineral from the Ettringer Bellerberg/Eifel, Germany. Mineral. Petrol. 1997, 60, 121–132. [Google Scholar] [CrossRef]
  58. Huang, Q.; Chmaissem, O.; Caponi, J.J.; Chaillout, C.; Marezio, M.; Tholence, J.L.; Santoro, A. Neutron powder diffraction study of the crystal structure of HgBa2Ca4Cu5O12+d at room temperature and at 10K. Physica C 1994, 227, 1–9. [Google Scholar] [CrossRef]
  59. Hesse, K.F. Refinement of the crystal structure of wollastonite-2M (parawollastonite). Zeitschr. Kristallogr. 1984, 168, 93–98. [Google Scholar] [CrossRef]
  60. Merlini, M.; Gemmi, M.; Cruciani, G.; Artioli, G. High-temperature behaviour of melilite: In situ X-ray diffraction study of gehlenite-åkermanite-Na melilite solid solution. Phys. Chem. Miner. 2008, 35, 147–155. [Google Scholar] [CrossRef]
  61. Grice, J.-D. The structure of spurrite, tilleyite and scawtite, and relationships to other silicate-carbonate minerals. Can. Mineral. 2005, 43, 1489–1500. [Google Scholar] [CrossRef]
  62. Colville, A.A.; Geller, S. The crystal structure of brownmillerite, Ca2FeAlO5. Acta Cryst. 1971, 27, 2311–2315. [Google Scholar] [CrossRef]
  63. Cuesta, A.; de la Torre, A.G.; Losilla, E.R.; Santacruz, I.; Aranda, M.A.G. Pseudocubic crystal structure and phase transition in doped ye’elimite. Cry. Growth Des. 2014, 14, 5158–5163. [Google Scholar] [CrossRef]
  64. Desgranges, L.; Grebille, D.; Calvarin, G.; Chevrier, G.; Floquet, N.; Niepce, J.C. Hydrogen thermal motion in calcium hydroxide: Ca(OH)2. Acta Cryst. Sect. B 1993, 49, 812–817. [Google Scholar] [CrossRef]
  65. Moore, P.B.; Araki, T. Atomic arrangement of merwinite, Ca3Mg(SiO4)2, an unusual dense-packed structure of geophysical interest. Am. Mineral. 1972, 57, 1355–1374. [Google Scholar]
  66. Kusachi, I.; Henmi, C.; Kawahara, A.; Henmi, K. The structure of rankinite. Mineral. J. 1975, 8, 38–47. [Google Scholar] [CrossRef]
  67. Moore, P.B.; Araki, T. The crystal structure of Bredigite and the genealogy of some alkaline earth orthosilicates. Am. Mineral. 1976, 61, 74–87. [Google Scholar]
  68. Lafuente, B.; Downs, R.T.; Yang, H.; Stone, N. The power of databases: The RRUFF project. In Highlights in Mineralogical Crystallography; Armbruster, T., Danisi, R.M., Eds.; W. De Gruyter: Berlin, Germany, 2015; pp. 1–30. [Google Scholar]
  69. Schmit, H.; Pfeffer, W.; Rathgeber, C.; Hiebler, S. Experimental Investigation of the Concentration Dependent Maximum Storage Capacity of two Inorganic Phase Change Materials. Energy Procedia 2015, 73, 231–238. [Google Scholar] [CrossRef]
  70. Hill, R.J.; Flack, H.D. The Use of the Durbin-Watson d Statistic in Rietveld Analysis. J. Appl. Cryst. 1987, 20, 356–361. [Google Scholar] [CrossRef]
  71. Banno, Y.; Miyawaki, R.; Momma, K.; Bunno, M. A CO3-bearing member of the hydroxylapatite-hydroxylellestadite series from Tadano, Fukushima Prefecture, Japan: CO3-SO4 substitution in the apatite-ellestadite series. Mineral. Mag. 2016, 80, 363–370. [Google Scholar] [CrossRef]
  72. Pöhler, K. Fremdionenstabilisierte Dicalciumsilicate: Synthese und Hydraulische Reaktion. Ph.D. Thesis, Martin-Luther-Universität Halle-Wittenberg, Halle, Germany, 2016. [Google Scholar]
  73. Morsli, K.; De la Torre, A.G.; Zahir, M.; Aranda, M.A.G. Mineralogical phase analysis of alkali and sulfate bearing belite rich laboratory clinkers. Cem. Concr. Res. 2007, 37, 639–646. [Google Scholar] [CrossRef]
  74. Zhao, Y.; Lu, L.; Wang, S.; Gong, C.; Huang, Y. Modification of Dicalcium Silicates Phase Composition by BaO, SO3 and MgO. J. Inorg. Organomet. Polym. 2013, 23, 930–936. [Google Scholar] [CrossRef]
  75. Galuskin, E.V.; Galuskina, I.O.; Gfeller, F.; Krüger, B.; Kusz, J.; Vapnik, Y.; Dulski, M.; Dzierżanowski, P. Silicocarnotite, Ca5 [(SiO4)(PO4)](PO4), a new “old” mineral from the Negev Desert, Israel, and the ternesite–silicocarnotite solid solution: Indicators of high-temperature alteration of pyrometamorphic rocks of the Hatrurim Complex, Southern Levant. Eur. J. Mineral. 2016, 28, 105–123. [Google Scholar] [CrossRef]
  76. Remy, C.; Reynard, B.; Madon, M. Raman Spectroscopic Investigations of Dicalcium Silicate: Polymorphs and High-Temperature Phase Transformations. J. Am. Ceram. Soc. 2005, 80, 413–423. [Google Scholar] [CrossRef]
  77. Pilz, W. Raman spectra of silicates. Acta Physica Hungarica 1987, 61, 27–30. [Google Scholar] [CrossRef]
  78. Dowty, E. Vibrational interactions of tetrahedra in silicate glasses and crystals. Phys. Chem. Miner. 1987, 14, 542–552. [Google Scholar] [CrossRef]
  79. Burshtein, Z.; Shimony, Y.; Morganau, S.; Henderson, D.O.; Mu, R.; Silberman, E. Symmetry Lowering due to Site-Occupation Disorder in Vibrational Spectra of Gehlenite, Ca2(AlSi)AlO7. Phys. Chem. Solids 1993, 54, 1043–1049. [Google Scholar] [CrossRef]
  80. Sharma, S.K.; Yoder, H.S., Jr.; Matson, D.W. Raman study of some melilites in crystalline and glassy states. Geochim. Cosmochim. Acta 1988, 52, 1961–1967. [Google Scholar] [CrossRef]
Figure 1. Variation in chlorine content in samples treated at different temperatures. The blue line and the red line correspond to the expected chlorine content for CaCl2 and CaCl2·2(H2O), respectively.
Minerals 12 01142 g001
Figure 2. Variation in phase contents with heating temperature in samples with 2 wt% CaCl2 and different sulfate amounts: (a) high-sulfate sample D2, (b) sample P with intermediate sulfate content, and (c) low-sulfate sample D1. Additional phase contents are ≤1.5 wt%: brownmillerite and melilite (D2); ≤1 wt%: CaCl2, rankinite (D1 + D2), albite, microcline, lime (D1 + P), ternesite (D1 + P) and rondorfite (P + D2); <0.5 wt%: Ca2SiO3Cl2, ye’elimite and anhydrite (D1).
Minerals 12 01142 g002
Figure 3. Variation in the unit-cell volumes of β-C2S with synthesis temperature for phase contents > 25 wt% (a). Maximum e.s.d.s of Rietveld refinements are provided as error bars. Variation in the unit-cell volumes of ellestadite contents in samples D2 and P (b). E.s.d.s ≤ symbols.
Minerals 12 01142 g003
Figure 4. Yield calculated for the reaction to crystalline C2S, crystalline, and amorphous C2S and C2S + Ellestadite for samples D2 (a), P (b), and D1 (c) heated to temperatures from 700 to 1200 °C. C2S cry = sum of β- and α-C2S.
Minerals 12 01142 g004
Figure 5. (a) Raman spectrum of chlorellestadite in sample D2 calcined at 1100 °C. The insert shows a Raman image of the distribution of chlorellestadite, ternesite, β-C2S, and quartz. (b) Raman spectrum of ternesite in the same sample. The crosses in the insert show the points where the corresponding single spectra were taken.
Minerals 12 01142 g005
Figure 6. Raman spectra of β-C2S (a), rankinite (b), melilite (gehlenite) (c), and chlorellestadite (d) in sample P. (e) Optical image of an aggregate of sample P calcined at 1200 °C. (f) Raman image of the phase distribution of β-C2S, chlorellestadite, rankinite (R), and mellilite (G).
Minerals 12 01142 g006
Figure 7. (a) Raman image of sample D1 calcined at 1200 °C showing the phase distribution of β-C2S, γ-C2S, bredigite (Br), ellestadite (Ell), rusinovite (Rus), quartz (Qz), and lime (L). (b) Raman spectrum of rusinovite taken from a single crystal (10 × 4 μm) on an Au foil.
Minerals 12 01142 g007
Table 1. Share of waste AAC and calcite, chemical composition, quantitative phase content, and gas release from thermal analysis of the raw mixtures in wt%. Loss of Ignition-LoI. Additional oxide contents are below 0.1 wt%, n.d. -not detectable. E.s.d.s of Rietveld refinement are provided in parentheses. The samples contain additionally <1 wt% feldspar. Weight losses (WL) between 30 and 500 °C, 500 and 900 °C, and 900 and 1400 °C are assumed to be representative for the weight losses due to the release of H2O, CO2, and SO3 (chlorine content subtracted), respectively, with errors of ±0.5 wt% that result from overlap in the ranges 450–500 °C and 830–900 °C. X-ray amorphous phases (Am) were calculated from the results of TG, RFA, and XRD.
D2PD1
Waste AAC46.847.740.8
calcite53.252.359.2
LoI27.5725.7431.40
SiO222.5523.9122.83
CaO41.844.2842.42
SO35.042.110.58
Al2O31.241.641.04
Fe2O30.500.710.45
MgO0.380.60.33
Cl1.081.141.12
Na2O<0.1n.d.n.d.
K2O<0.3<0.1<0.1
Amorphous33.7(9)39.2(6)30.1(6)
Quartz9.6(1)6.98(7)10.78(8)
Calcite47.5(4)44.8(3)52.3(3)
Vaterite1.5(1)1.15(9)1.65(8)
Aragonite1.4(2)0.4(1)1.8(1)
Tobermorite1.6(2)4.3(2)2.3(1)
Anhydrite4.3(1)1.94(9)0.51(7)
Bassanite0.3(1)0.42(9)0.18(6)
Sinjarite0.3(1)0.7(1)0.40(8)
WL 30–950 °C28.226.432.2
H2O3.73.84.7
CO224.422.427.3
SO35.42.30.7
AmCaCO35.04.56.2
Am CaSO44.61.60.5
Am CaCl2(+xH2O)1.41.21.4
Am Feldspar3.34.42.8
Am C-S-H10.224.710.4
Am SiO25.81.54.7
Table 2. Phase contents in wt% for samples heated to 1000 °C with and without the addition of CaCl2. The samples contain additionally ≤0.5 wt%: CaCl2, Ca2SiO3Cl2; ≤1 wt%: γ-C2S, anhydrite, spurrite, feldspar; ≤2 wt%: rusinovite, brownmillerite, merwinite, rondorfite. E.s.d.s of Rietveld refinements are given in parentheses.
HT[D2-]_1000HT[D2]_1000HT[P-]_1000HT[P]_1000HT[D1-]_1000HT[D1]_1000
Amorphous11.8(6)14.2(9)16.6(6)15.0(7)17.1(7)18.2(9)
β-C2S31.4(3)48.0(3)45.6(4)63.8(4)40.1(5)67.7(5)
Ellestadite019.4(2)09.9(1)01.5(9)
Ternesite32.4(3)4.7(1)10.7(2)0.12(7)4.3(2)0.16(7)
Quartz7.05(7)3.81(5)4.82(6)2.11(4)9.72(8)1.06(5)
Lime9.51(7)2.44(4)9.83(7)0.17(5)18.4(1)0.07(2)
Wollastonite1.1(1)0.5(1)6.2(2)0.6(1)5.0(1)0.4(1)
Portlandite0.51(5)01.14(8)02.62(8)0
α’H-C2S2.5(2)0001.2(2)0
Melilite0.9(1)0.08(5)2.8(1)0.06(5)00
Chlormayenite02.60(7)03.90(9)02.56(9)
Publisher’s Note: MDPI stays neutral with regard to jurisdictional claims in published maps and institutional affiliations.

