Article

A Study of Respirable Silica in Underground Coal Mines: Sources

1
Mining & Minerals Engineering, Virginia Polytechnic Institute and State University, Blacksburg, VA 24061, USA
2
Civil & Environmental Engineering, Virginia Polytechnic Institute and State University, Blacksburg, VA 24061, USA
*
Author to whom correspondence should be addressed.
Minerals 2022, 12(9), 1115; https://doi.org/10.3390/min12091115
Submission received: 16 August 2022 / Revised: 30 August 2022 / Accepted: 30 August 2022 / Published: 31 August 2022
(This article belongs to the Special Issue Mineralogic Analysis of Respirable Dust)

Abstract

:
An ongoing resurgence of occupational lung disease among coal miners in the United States has been linked to respirable crystalline silica (RCS). To better protect miners, a deeper understanding of key exposure factors is needed. As part of a larger investigation of RCS in 15 coal mines, this paper describes analysis of silica mass content in two types of samples: (1) respirable coal mine dust (RCMD) collected in standardized locations in each mine; and (2) respirable dust generated in the laboratory from primary source materials, including coal and rock strata being mined at the production face, material obtained from the dust collection system on roof bolter machines, and rock dust products being applied by the mine. As expected, results indicate that rock strata drilled for roof bolting or being extracted along with the coal are a major source of RCS in many coal mines—although the coal seam itself can contain significant silica in some mines. While silica content of rock strata encountered in central Appalachian mines is not necessarily higher than in other regions, the sheer abundance of rock being extracted in thin-seam central Appalachian mines can explain the relatively higher silica content typically observed in RCMD from this region.

1. Introduction

Respirable crystalline silica (RCS), which generally occurs as quartz in underground coal mines, is well established as an occupational health hazard [1,2]. It is considered a key agent in the most severe forms of coal mine dust lung diseases such as progressive massive fibrosis (PMF) and silicosis [3,4,5,6,7,8,9,10]. In the US, exposures to respirable coal mine dust (RCMD) and RCS, specifically, have been regulated since the 1969 Coal Mine Safety and Health Act (CMSHA, 30 CFR part 70) took effect [11]. The basis of regulation has been monitoring RCMD concentrations and the quartz content (mass%) in the RCMD, targeting an effective RCS exposure limit of 100 µg/m3 [11].
After decades of declining lung disease prevalence among US coal miners, this trend unexpectedly reversed in the late 1990s, particularly in parts of central Appalachia [12]. The most recent reports of disease in this region are alarming, with contemporary PMF rates estimated to exceed pre-CMSHA rates [3,13,14]—affecting even relatively young and short-tenured miners [15,16,17]. Radiographic evidence indicates that heavy RCS exposures are a primary factor in this new era of disease [4,16]. Moreover, a recent pathology study showed higher silica dust burden in lung tissue specimens from contemporary coal miners with PMF than from their historical counterparts [18]. Although the available mine monitoring data show quartz, as well as RCMD, concentrations have generally been decreasing since the mid-1980s across all regions [19,20], linking individual exposures and health outcomes is typically not possible. This uncertainty has prompted speculation about the range of exposure factors that might be significant, including the role of RCS characteristics such as particle size and surface condition [21], both of which could affect RCS toxicity [22,23,24,25,26,27,28]. Another critical factor is pinpointing the RCS source(s) in mines [21].
The composition of RCMD is heterogeneous and variable based on the specific sources of dust in the mine environment [29,30]. These typically include the coal seam being mined; the surrounding roof, floor, or interburden rock strata that is mined with the coal or otherwise drilled for roof support; and rock dusting products such as high purity limestone, which are applied to mine surfaces to mitigate explosion hazards. Respirable particulates can additionally include engine emissions in mines operating diesel equipment. In US underground coal mines, the primary source of RCS is generally expected to be the rock strata [31,32,33,34]. Indeed, this is a primary explanation for the relatively high quartz content commonly observed in RCMD samples from central Appalachian mines [20], which are often characterized as “thin seam” operations [35]. That said, the coal seam itself might also contain significant crystalline silica depending on local geology [36,37,38]. Furthermore, rock dust products can contain some too—up to 4% (measured as free and combined silica) is allowed by US regulations (see 30 CFR part 75.2) [39]. However, few studies have actually pinpointed the source of RCS in particular mines.
To address this gap, the current study evaluates the relative abundance of silica in respirable dust generated from primary dust-source materials, as well as RCMD samples, from 15 underground coal mines, representing four distinct regions of the US. This work is part of a larger investigation of respirable silica characteristics in these mines.

2. Materials and Methods

Bulk samples of primary dust-source materials and RCMD samples were collected from 15 US underground coal mines in 2018. Table 1 summarizes key details about each mine including geographic region and state, designated Mine Safety and Health Administration (MSHA) district, mining method, coal and mining heights, and type of roof strata being mined or drilled (see also Figure S1 in Supplementary Materials). Eight mines are located in the central-Appalachian (CA) region of the US, three in northern-Appalachia (NA), two in the mid-west/Illinois basin (MW), and two in the western basin (W). Four of the mines were using the longwall mining method and the rest of the mines were using the room and pillar method with continuous miners. (It is noted that these 15 mines represent a subset of a larger group mines which have been the subject of previous studies of RCMD by the authors, see [34,40]. However, the dust-source materials were only collected in the 15 mines represented by the current study, and respirable silica analysis on these materials has not been published elsewhere. The source material and RCMD results are presented together here for comparison).

2.1. RCMD Samples

RCMD samples were collected in sets (i.e., multiple samples collected simultaneously) in standardized locations: the intake airway to a producing mine section (I), adjacent to the feeder breaker (F), just downwind of the active production face (P), just downwind of an active roof bolter (B), and in the return airway (R). (See schematic diagrams in Figure S2 for approximate sampling locations). Table 1 shows the number of sample sets collected in each mine by location; in total, 75 sample sets were available for this study. While the goal was to sample all five locations in each mine, this was not always possible due to unexpected changes in mining conditions or limited time of the sampling team underground. In some mines, more than one sample set was collected in particular location(s) (e.g., on different shifts). RCMD samples were collected directly onto 37-mm filters in two-piece styrene cassettes using 10-mm Dorr Oliver nylon cyclones and Escort ELF air sampling pumps (Zefon International, Ocala, FL, USA) operated at 2.0 L/min over a total duration of approximately 2–4 h. The sampling apparatuses were stationary, with the cyclone inlets positioned at approximately head-height and oriented parallel to one another such that all samples in a set can be considered replicates. From each set, two samples were utilized for this study: one was collected onto a polycarbonate filter (PC; track etched, 0.4 µm nominal pore size) for microscopy analysis and the other was collected onto a pre-weighed polyvinyl chloride filter (PVC; 5 µm pore size) for infrared (IR) spectroscopy analysis (analytical methods described below). In both cases, a standard cellulose support pad was used under the filter.

2.2. Respirable Dust Samples Generated from Primary Source Materials

During the RCMD sampling in each mine, bulk samples of primary dust-source materials were also obtained. These included: run-of-mine (ROM) material from the main production belt, from which coal and rock were later hand-sorted in the laboratory; material taken from the roof bolter dust collection system (i.e., primarily expected to contain dust generated as the roof strata, generally rock, was drilled ahead of bolt installation); and grab samples of the rock dusting product the mine was applying, taken from the duster machine product compartment or the original product sacks. (See schematic diagrams in Figure S2 for approximate locations for dust source materials).
Each of the source materials was used to generate respirable dust samples in the laboratory (Table 1). ROM materials were transported in lidded buckets or sealed plastic bags, and the roof bolter materials and rock dust products were transported in sealed plastic bottles to minimize contamination. The ROM coal and ROM rock were pulverized and sieved to −230 mesh (i.e., less than about 63 µm) prior to sampling, whereas the roof bolter material and rock dust products were already sufficiently fine and required no processing. To generate the samples, a small mass of material was placed in a small enclosure and aerosolized using compressed high-purity air. The respirable fraction of the dust was sampled inside the enclosure using the same sampling pumps, cyclones and cassettes as for the RCMD samples. For each material, samples were collected in pairs: one on a PC filter and the other on a PVC filter. To limit particle loading on the PC filter, which can challenge microscopy analysis, the sampling duration was relatively short (on the order of seconds). On the other hand, longer duration was used for the PVC filter (on the order of minutes) to ensure sufficient mass for IR analysis.

2.3. Analytical Methods

In this study, three analytical methods were utilized to determine silica (or α-quartz) content in the RCMD and lab-generated dust samples: (1) Scanning electron microscopy with energy dispersive X-ray spectroscopy (SEM-EDX), (2) direct-on-filter Fourier Transform infrared spectroscopy (FTIR), and (3) NIOSH Method 7603 from the Manual of Analytical Methods (NMAM 7603), which is also based on infrared (IR) spectroscopy. SEM-EDX was mainly used to investigate silica particle characteristics as part of the aforementioned larger study. However, the method does allow for estimation of silica content (mass%) based on the size and number of silica particles observed in a sample relative to the total particles observed in the sample. IR methods are more commonly used for measurement of silica in dust samples. In fact, NMAM 7603 is analogous to MSHA Method P7, which is used for determination of compliance with quartz standards in underground coal mines in the US. The FTIR method is being developed by NIOSH as an “end-of-shift” or rapid silica analysis method for RCMD samples, and should be well correlated to NMAM 7603 [41]. Here, the combination of these three methods enabled inclusion of all available RCMD samples in the study; as mentioned, the RCMD samples had already been collected, and thus sample mass could not be controlled. Whereas very low-mass samples could not be analyzed by the IR methods, they could be analyzed by SEM-EDX. For higher-mass samples, results yielded by multiple methods can be compared.

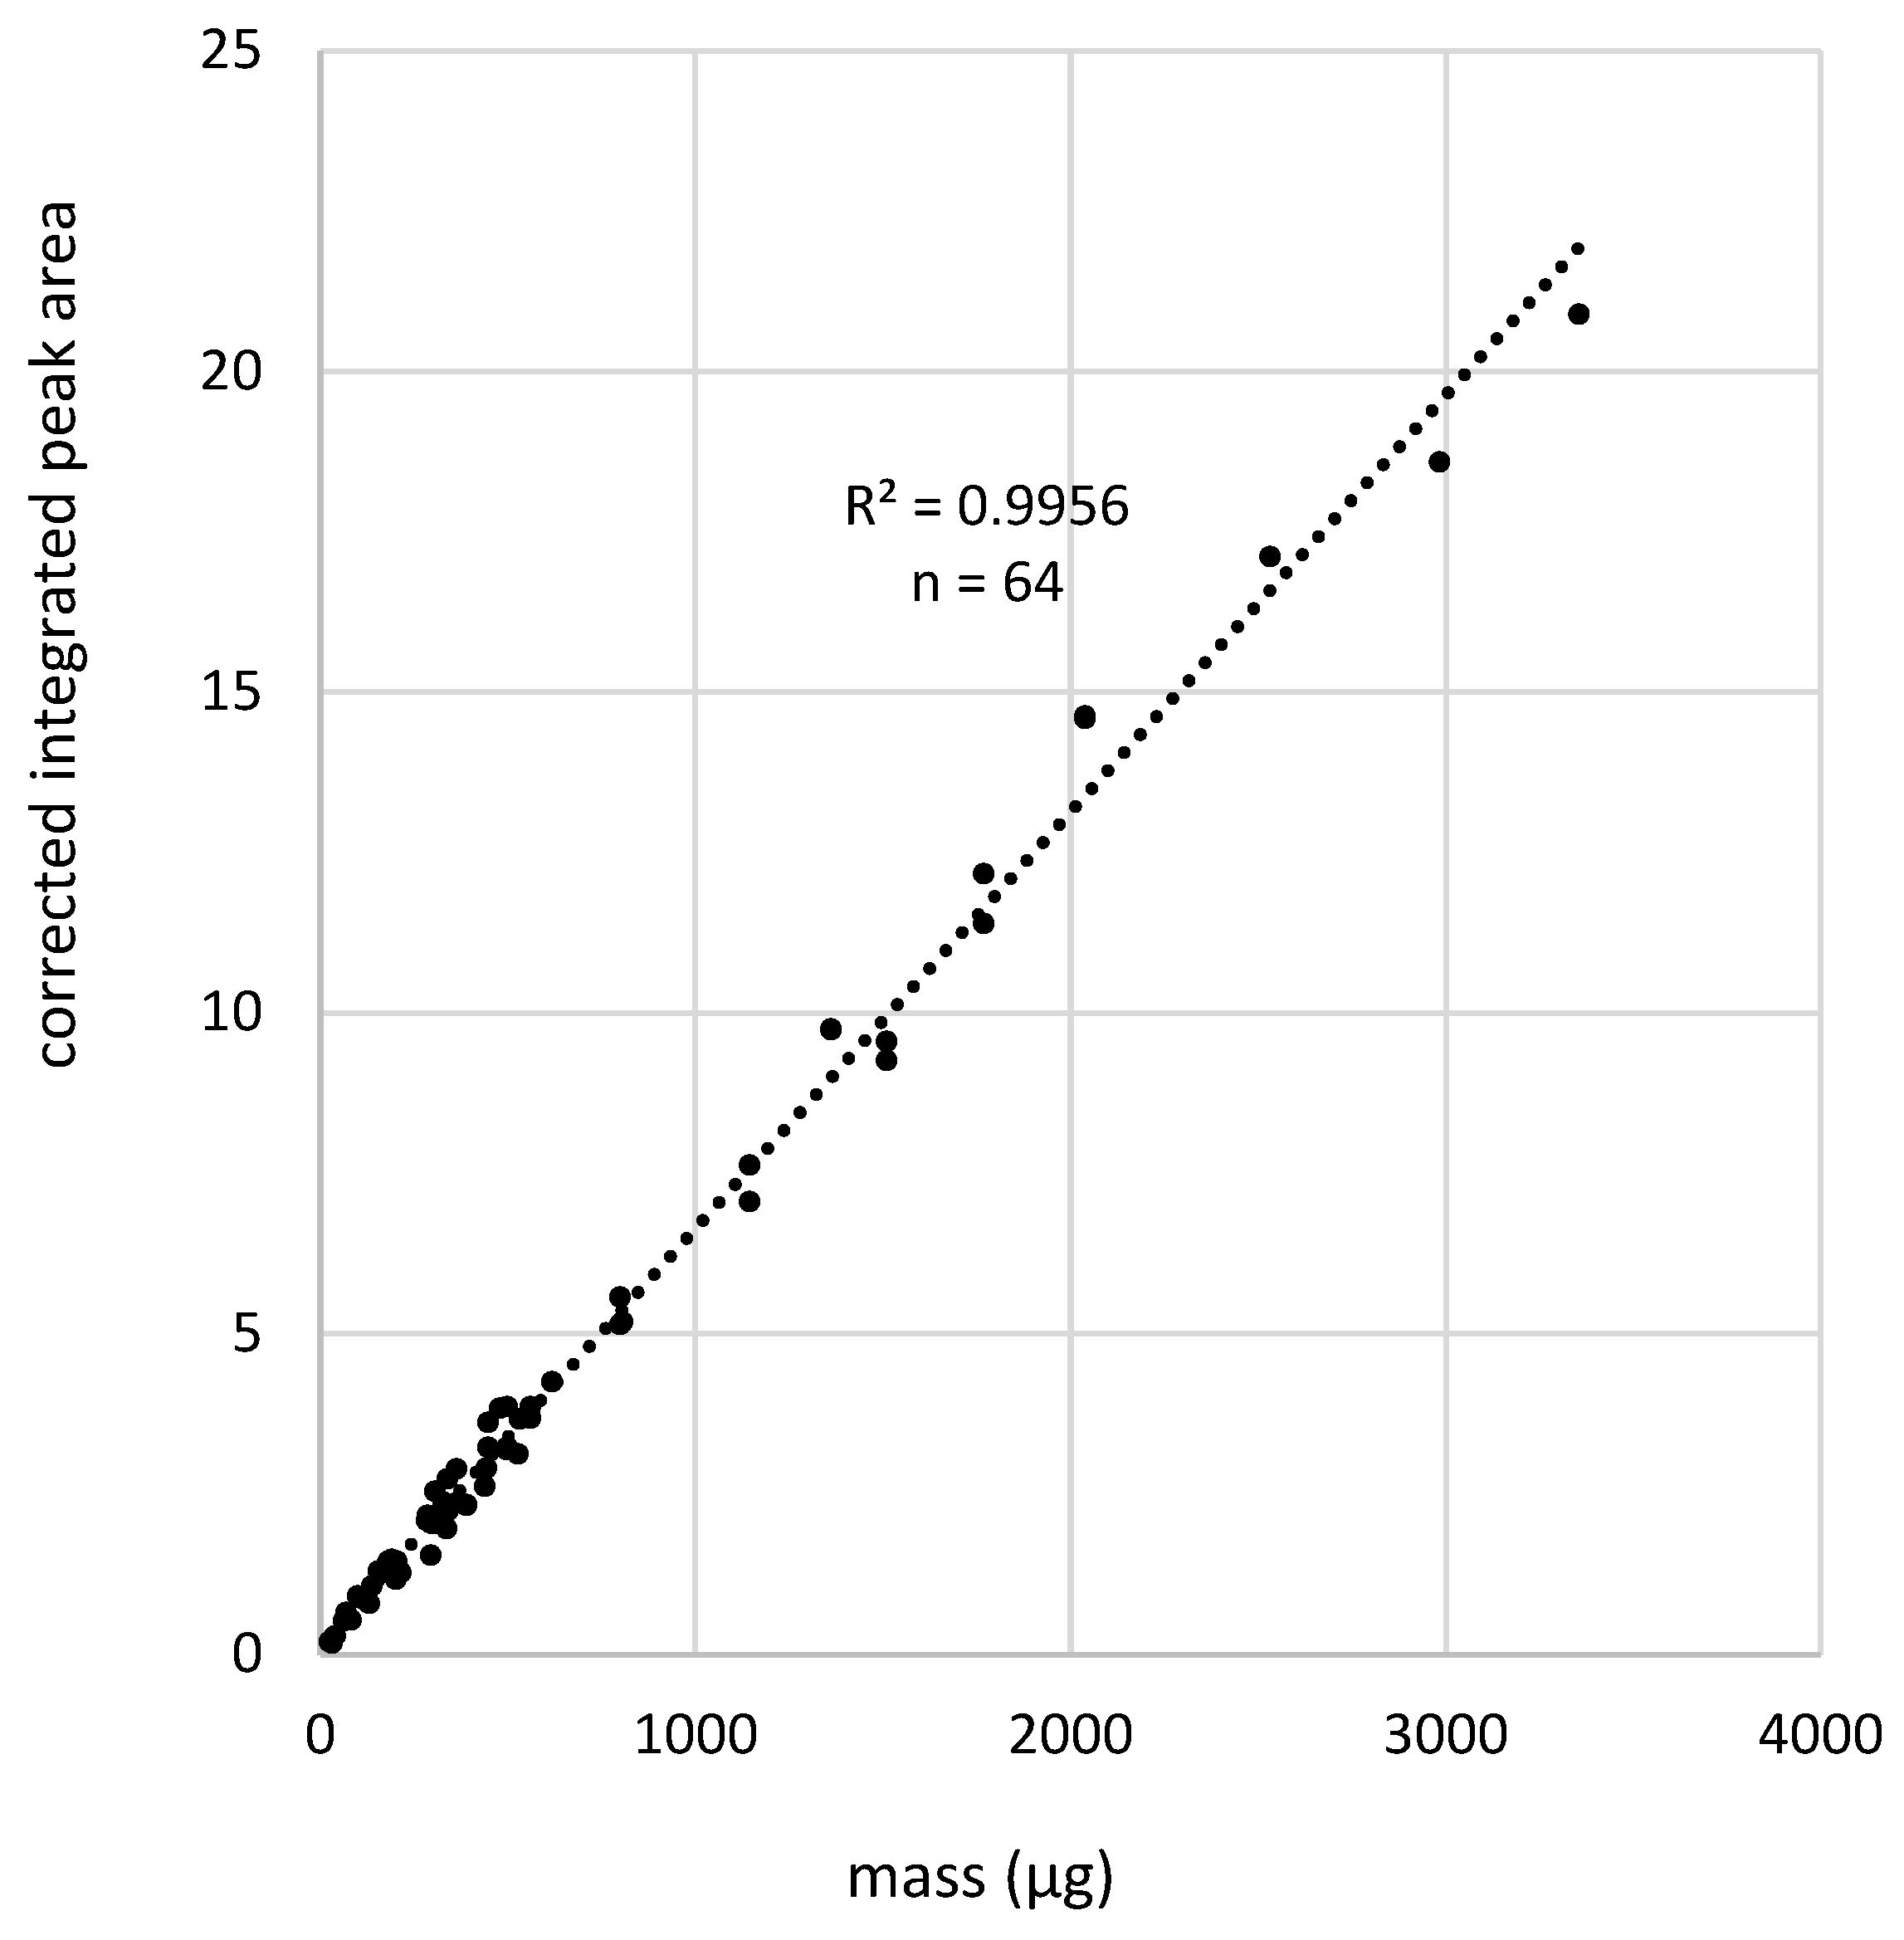
2.3.1. SEM-EDX Analysis

Samples collected on PC filters were used for particle-based analysis by SEM-EDX. For this, a circular subsection of the filter (8–9 mm in diameter) was carefully cut using a stainless-steel trephine. Since dust deposits more heavily on the center of the filter in two-piece cassettes, the subsection was generally cut off-center to minimize loading density of particles for the microscopy analysis. Subsections were mounted on pre-labeled aluminum SEM stubs using double sided tape, and sputter coated (Au/Pd) to protect the dust particles and render the sample conductive.
The SEM-EDX system consisted of an FEI Quanta 600 FEG environmental scanning electron microscope (ESEM) (Hillsboro, OR, USA) equipped with a backscatter electron detector (BSD) and a Bruker Quantax 400 EDX spectroscope (Ewing, NJ, USA). Bruker’s Esprit software (version 1.9.4) was used to program and run a computer-controlled routine, based on work by Johann-Essex et al. [42], to locate, size and classify supramicron particles (in the range of about 1–10 µm) into pre-defined mineralogy classes: Carbonaceous, mixed carbonaceous, aluminosilicates, silica, carbonates, heavy minerals, and other (meaning the particle did not fit any of the other classes). The routine used here has been described in detail by Sarver et al. [34], including the particle classification criteria based on normalized elemental percentages (C, O, Al, Si, Mg, Ca, Ti, Fe) derived from EDX data (See Figure S3 for a typical EDX spectra from a silica particle on PC filter). (It is noted that since classification is tied to geo-chemistry, rather than mineral structure per se, the defined classes represent inferred mineralogy based on expectations for RCMD constituents.) For each sample, the routine sought to analyze a total of 500 particles, with no more than 50 particles in each frame of analysis; rarely, if 500 particles could not be located after 40 frames were scanned, the routine was stopped (and results are based on less than 500 particles).
The SEM-EDX routine yielded size and mineralogy class data on individual particles, which can be used to compute distributions for each sample based on particle counts (i.e., number%). Here, the data were used to estimate mineralogy distributions on the basis of mass% as described by Sarver et al. [34] and Pokhrel et al. [40]. Briefly, the dimensions and mineralogy class of each particle were used to estimate its volume and mass based on assumptions for specific gravity and shape (i.e., short-to-intermediate length ratio per class). Ultimately, the silica mass% for each sample was computed as the estimated mass of all particles classified as silica relative to the estimated mass of all particles analyzed in the sample.
During the SEM-EDX work, the particle loading density (PLD)—defined as number of particles per analyzed area (#/µm2)—was also recorded. This quantity can be important for interpretation of data since particles can interfere with one another when PLD is too high. Based on extensive experience with analysis of RCMD samples, the authors have observed that when PLD is greater than about 0.03–0.04 #/µm2, respirable-sized particles can be misclassified—especially when mineral content in the sample is high.

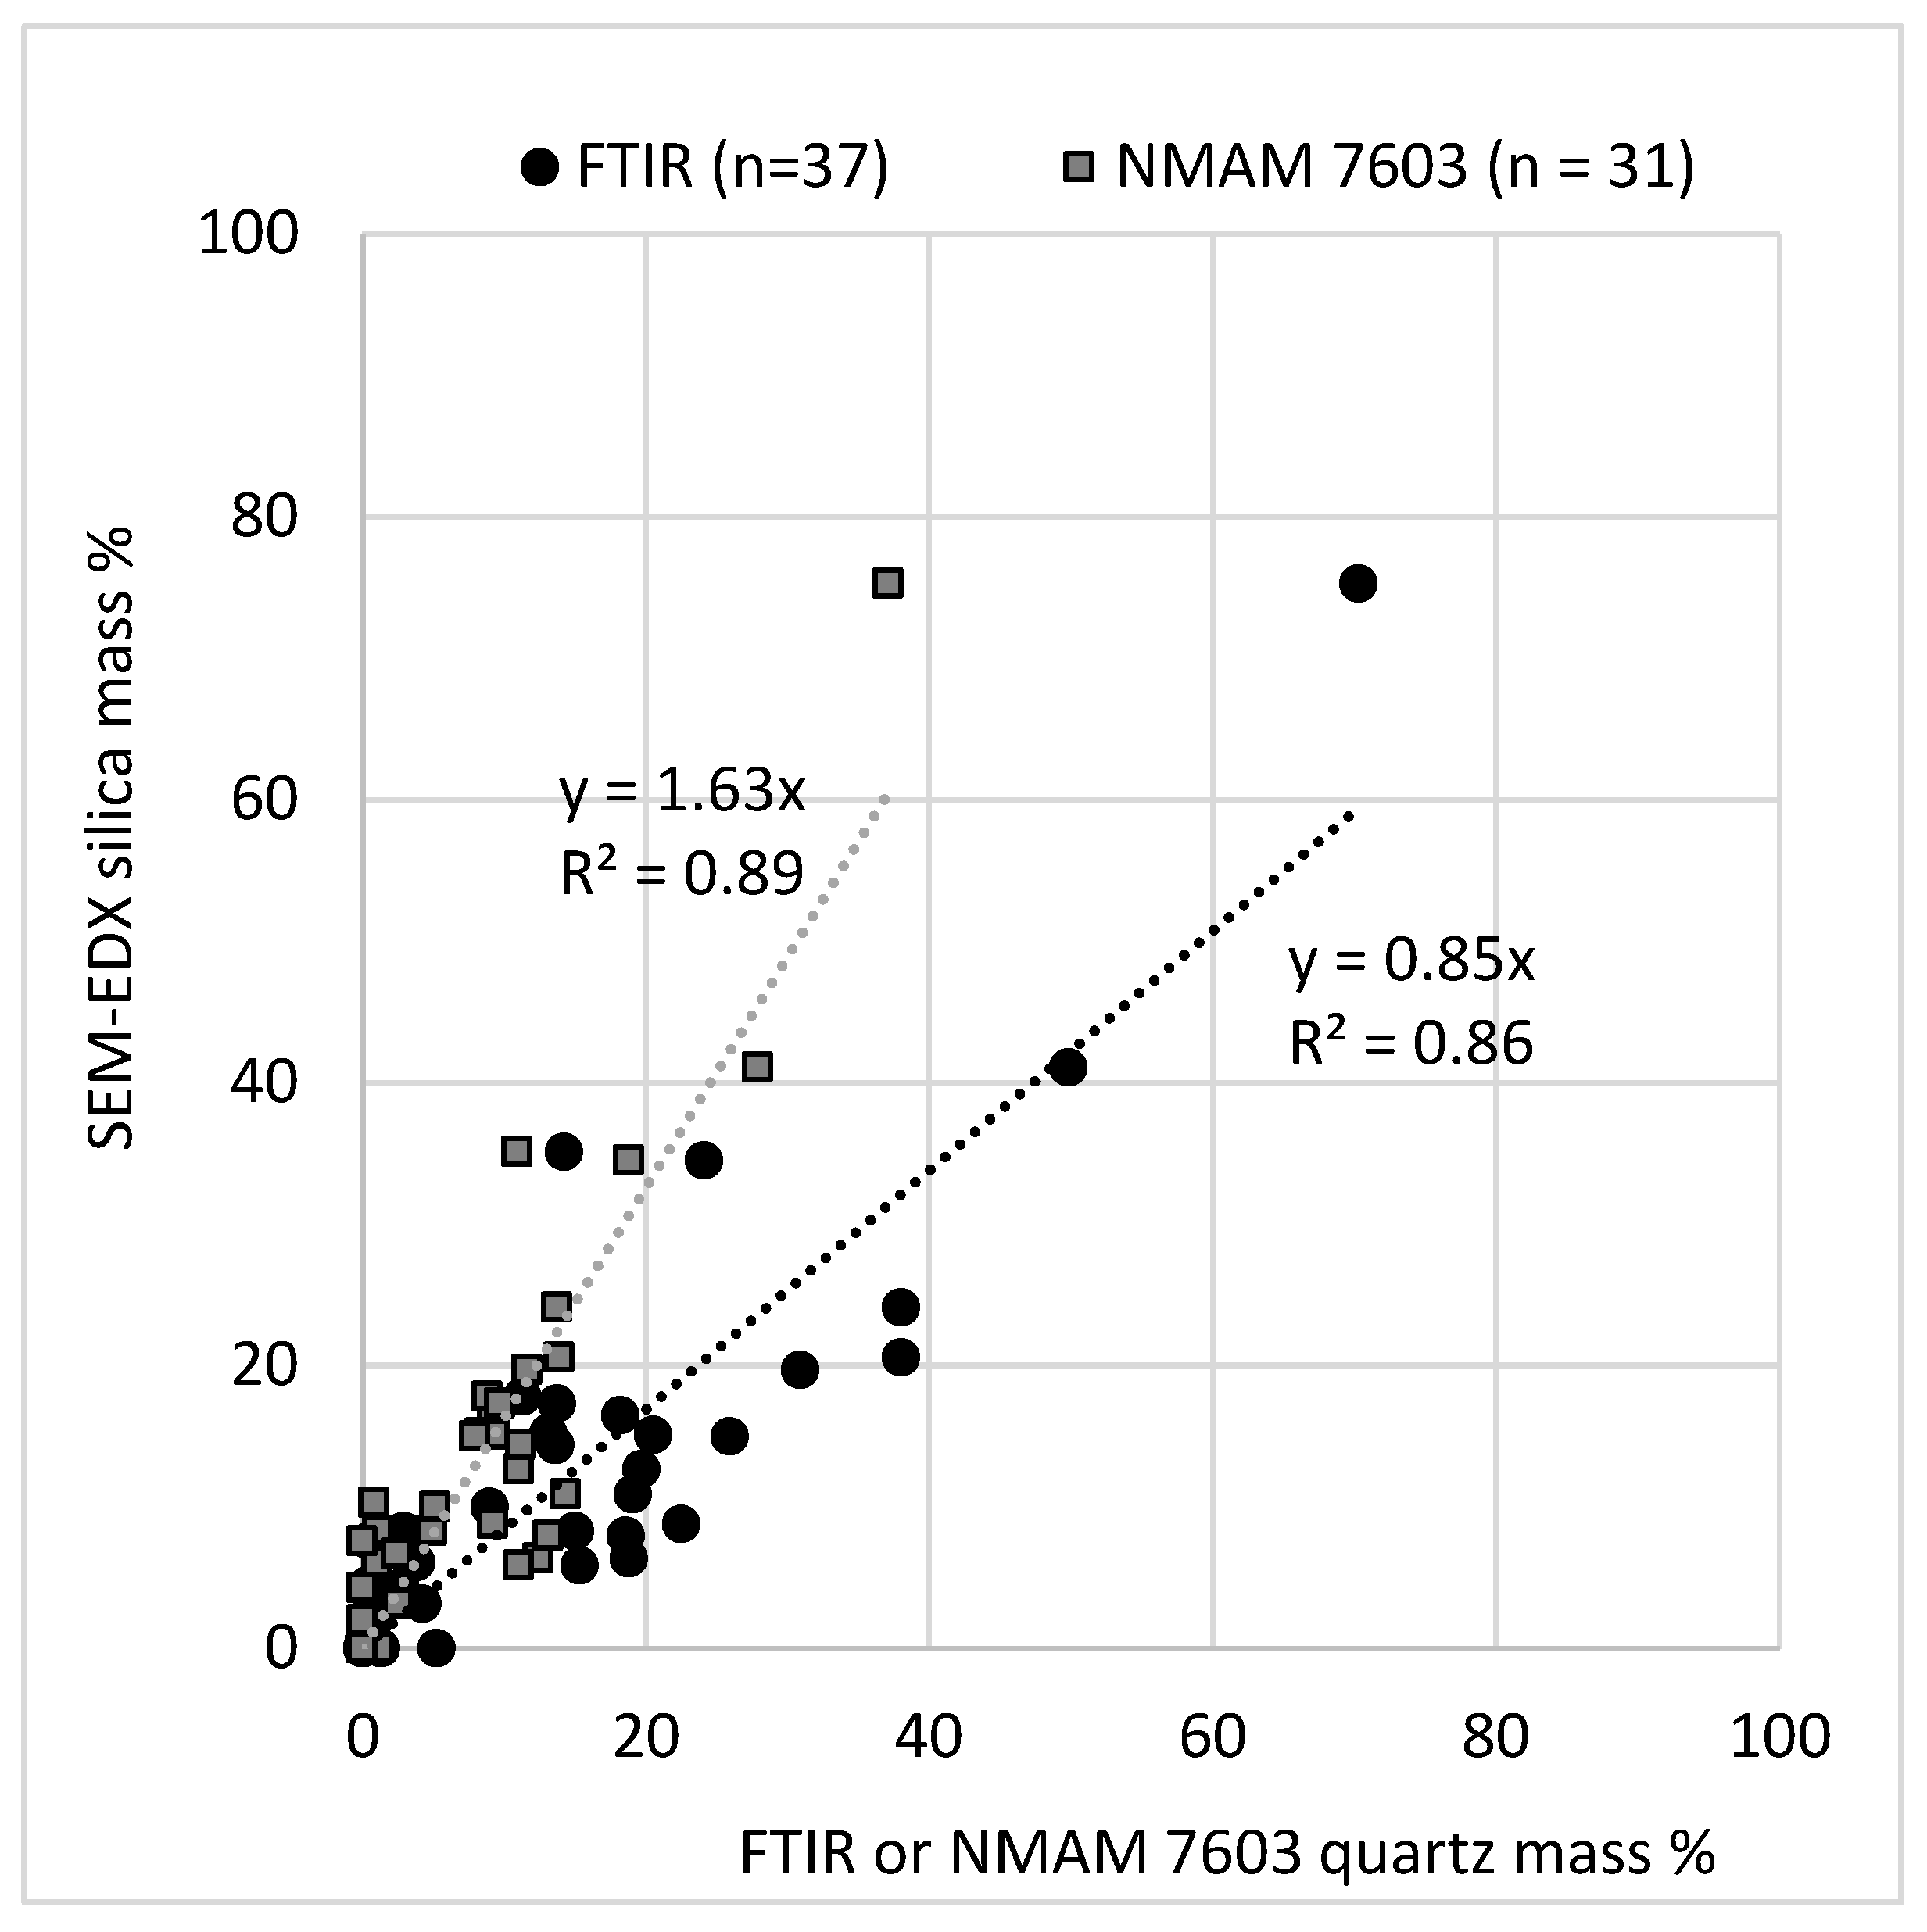
2.3.2. FTIR Analysis

The PVC filters were used for quartz mass analysis by direct-on-filter Fourier Transform infrared spectroscopy (FTIR), and some were also analyzed by the standard NIOSH Method 7603 (see below). (Both of these methods measure α-quartz, which is the dominant form of crystalline silica, and thus results from either method serve a proxy for crystalline silica mass.) Total sample mass on each filter was determined as the difference between the filter weight pre- and post-sample collection using a microbalance (Sartorius MSE6.6S, Gottingen, Germany). Then, quartz mass% was computed as the quartz mass relative to the total sample mass.
The FTIR analysis method was based on work by Miller et al. [36] and was described in detail by Pokhrel et al. [40]. Briefly, an ALPHA II FTIR Spectrometer (Bruker Optics, Billerica, MA, USA) was used to measure the absorbance spectra between 4000 cm−1 to 400 cm−1. (See Figure S4 for a typical FTIR spectrum from a silica particle on PVC filter). Sixteen scans per filter were recorded from a 6-mm diameter area in the center of the filter. Following background correction (i.e., based on blank filter subtraction), the integrated peak area for α-quartz was measured from its characteristic doublet peak (between 816 and 767 cm−1). Notably, since kaolinite—another a common mineral in RCMD and dust-source materials—also exhibits a secondary peak in this range, the quartz peak area was corrected per Miller et al. [36,43].
The corrected quartz peak area was then used to estimate mass using a calibration model. For the RCMD samples, the peak area-to-mass calibration was established by NIOSH researchers [43,44,45]. However, since that work was conducted using filters collected in 3-piece cassettes, which have a slightly different dust deposition pattern than 2-piece cassettes, a correction factor derived by Miller et al. [46] was applied. For the dust samples generated from source materials in the laboratory, a calibration model was developed in-house. This is because the lab-generated samples were collected in a small enclosure under high concentration conditions, which can also affect the dust deposition pattern. The in-house calibration curve is shown in Figure 1. It was created by collecting respirable dust samples containing known masses of pure crystalline silica (i.e., Min-U-Sil® 5, obtained from US Silica, Katy, TX, USA) in the same 2-piece cassettes and enclosure as used for the source materials samples.

2.3.3. NIOSH Method 7603 Analysis

Samples on PVC filters for which the FTIR analysis indicated quartz mass greater than 5 µg (i.e., slightly above the limit of detection, LOD, for the RCMD samples), were additionally analyzed by the standard NIOSH Method 7603 (NMAM 7603) [47]. Using this criterion, a total of 14 RCMD samples and 31 respirable dust samples generated from source material samples were sent to RJ Lee Group (Monroeville, PA, USA) on their original PVC filters and in their original cassettes. Like the FTIR, NMAM 7603 is an IR method. However, rather than being conducted directly on the PVC filter, the sample is prepared by low temperature ashing and then, the residue is redeposited for IR scanning to determine quartz mass. For ashing, each filter is transferred to a beaker and ashed 2 h at 300 watts radio frequency (RF) power in a RF plasma asher. After ashing, isopropyl alcohol is added to the beaker, and then the residue is redeposited on a polypropylene (PP) filter using a filtration apparatus. After the redeposited filter completely dry, it is placed in an IR spectrometer. In the absence of kaolinite, the quartz mass is determined directly from the calibration graph (i.e., measured absorbance at 800 cm−1). If kaolinite is present in the sample, then quartz mass needs to be corrected similar to the approach described above for the FTIR method. Details of this procedure can be found in NMAM 7603 document [47].

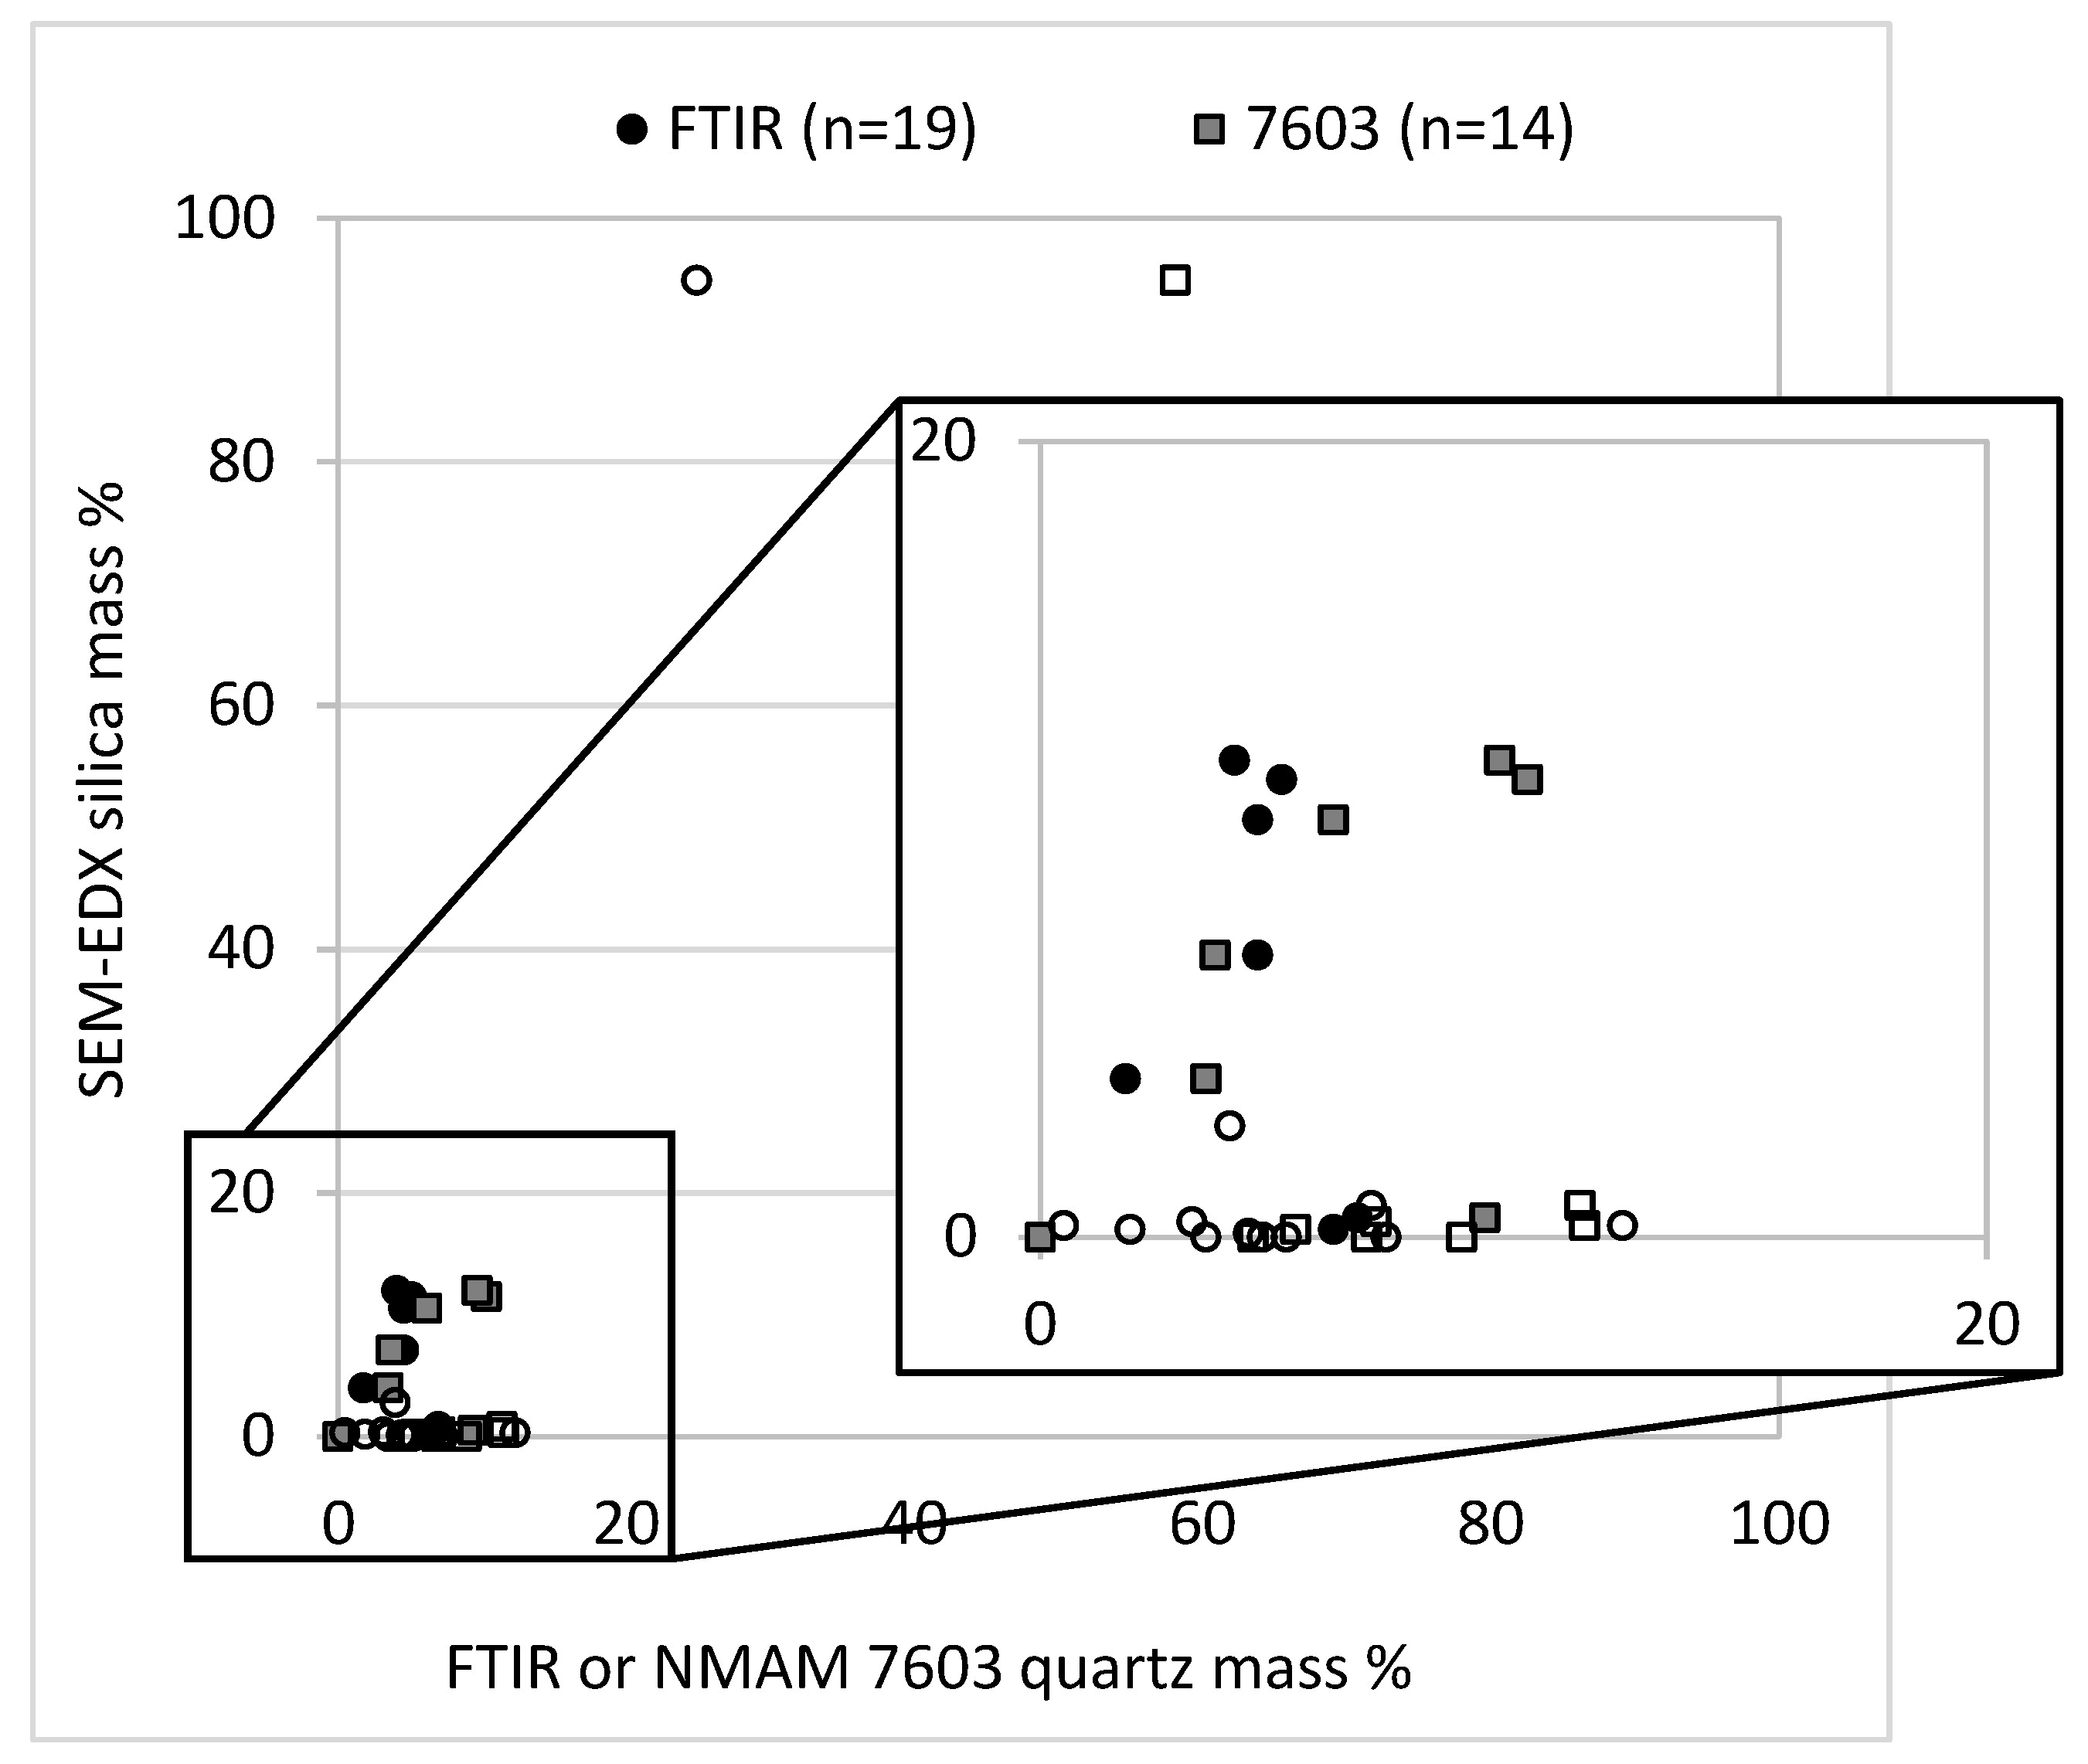
3. Results and Discussion

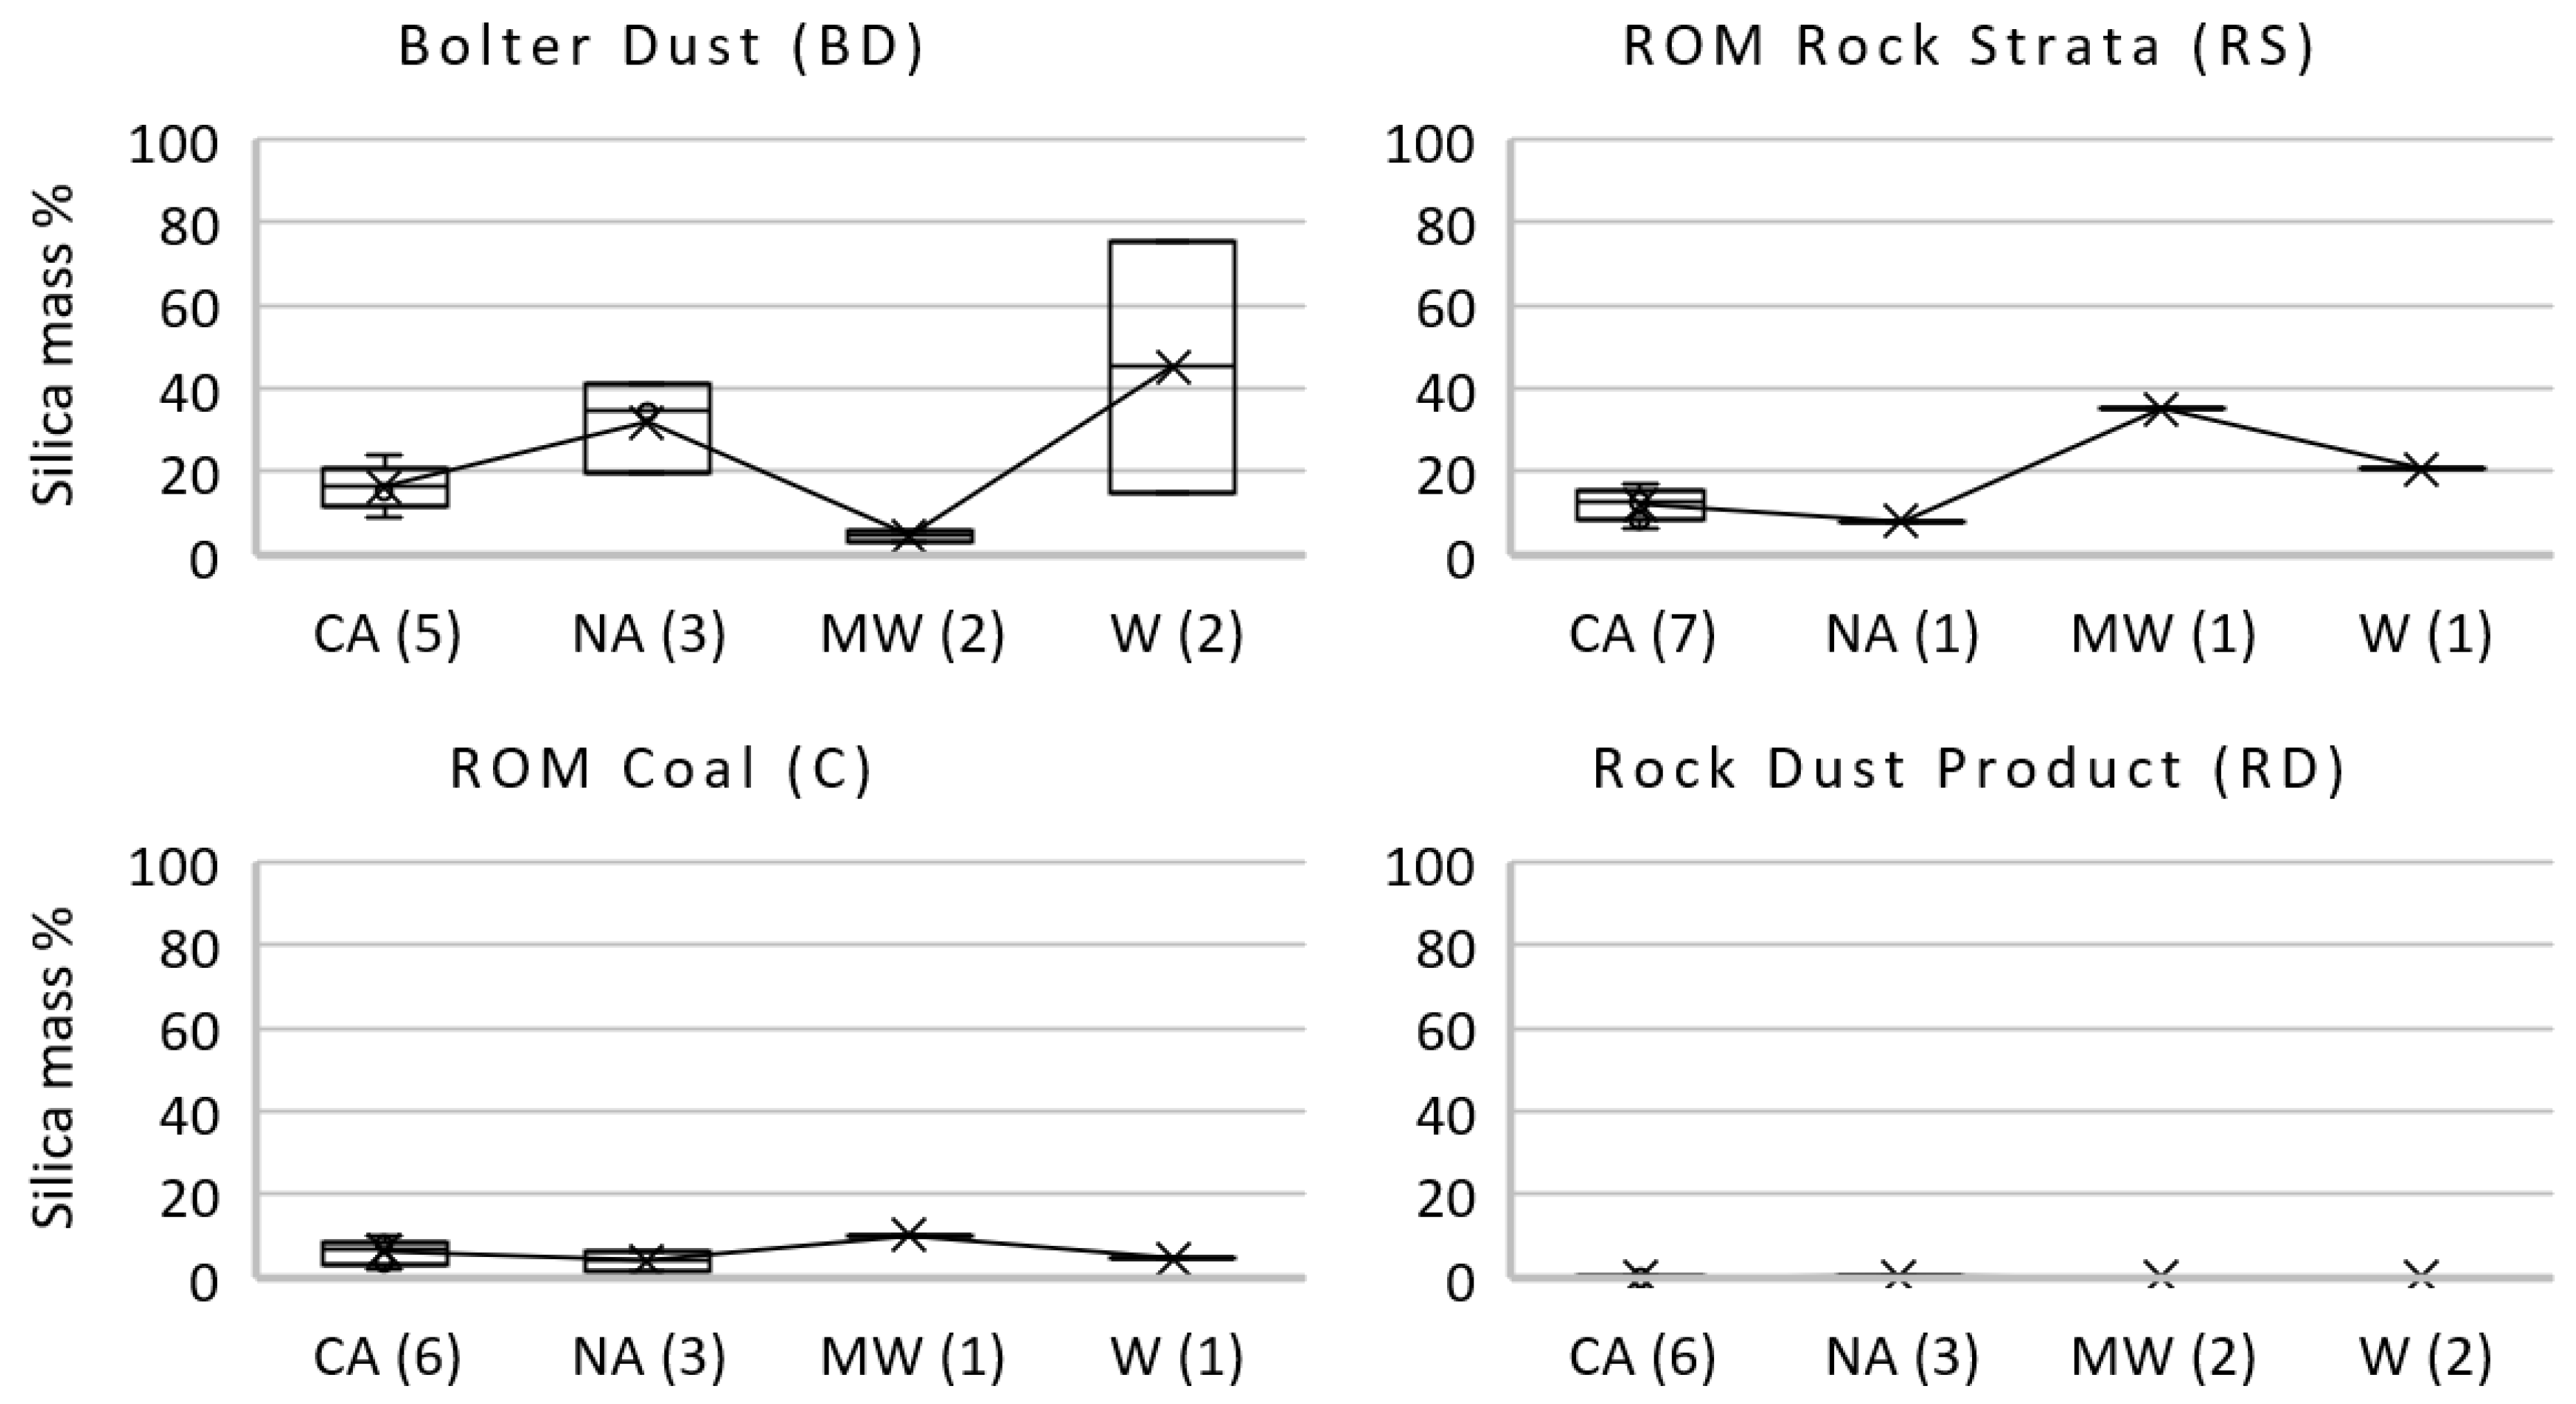
3.1. Dust Generated from Primary Source Materials
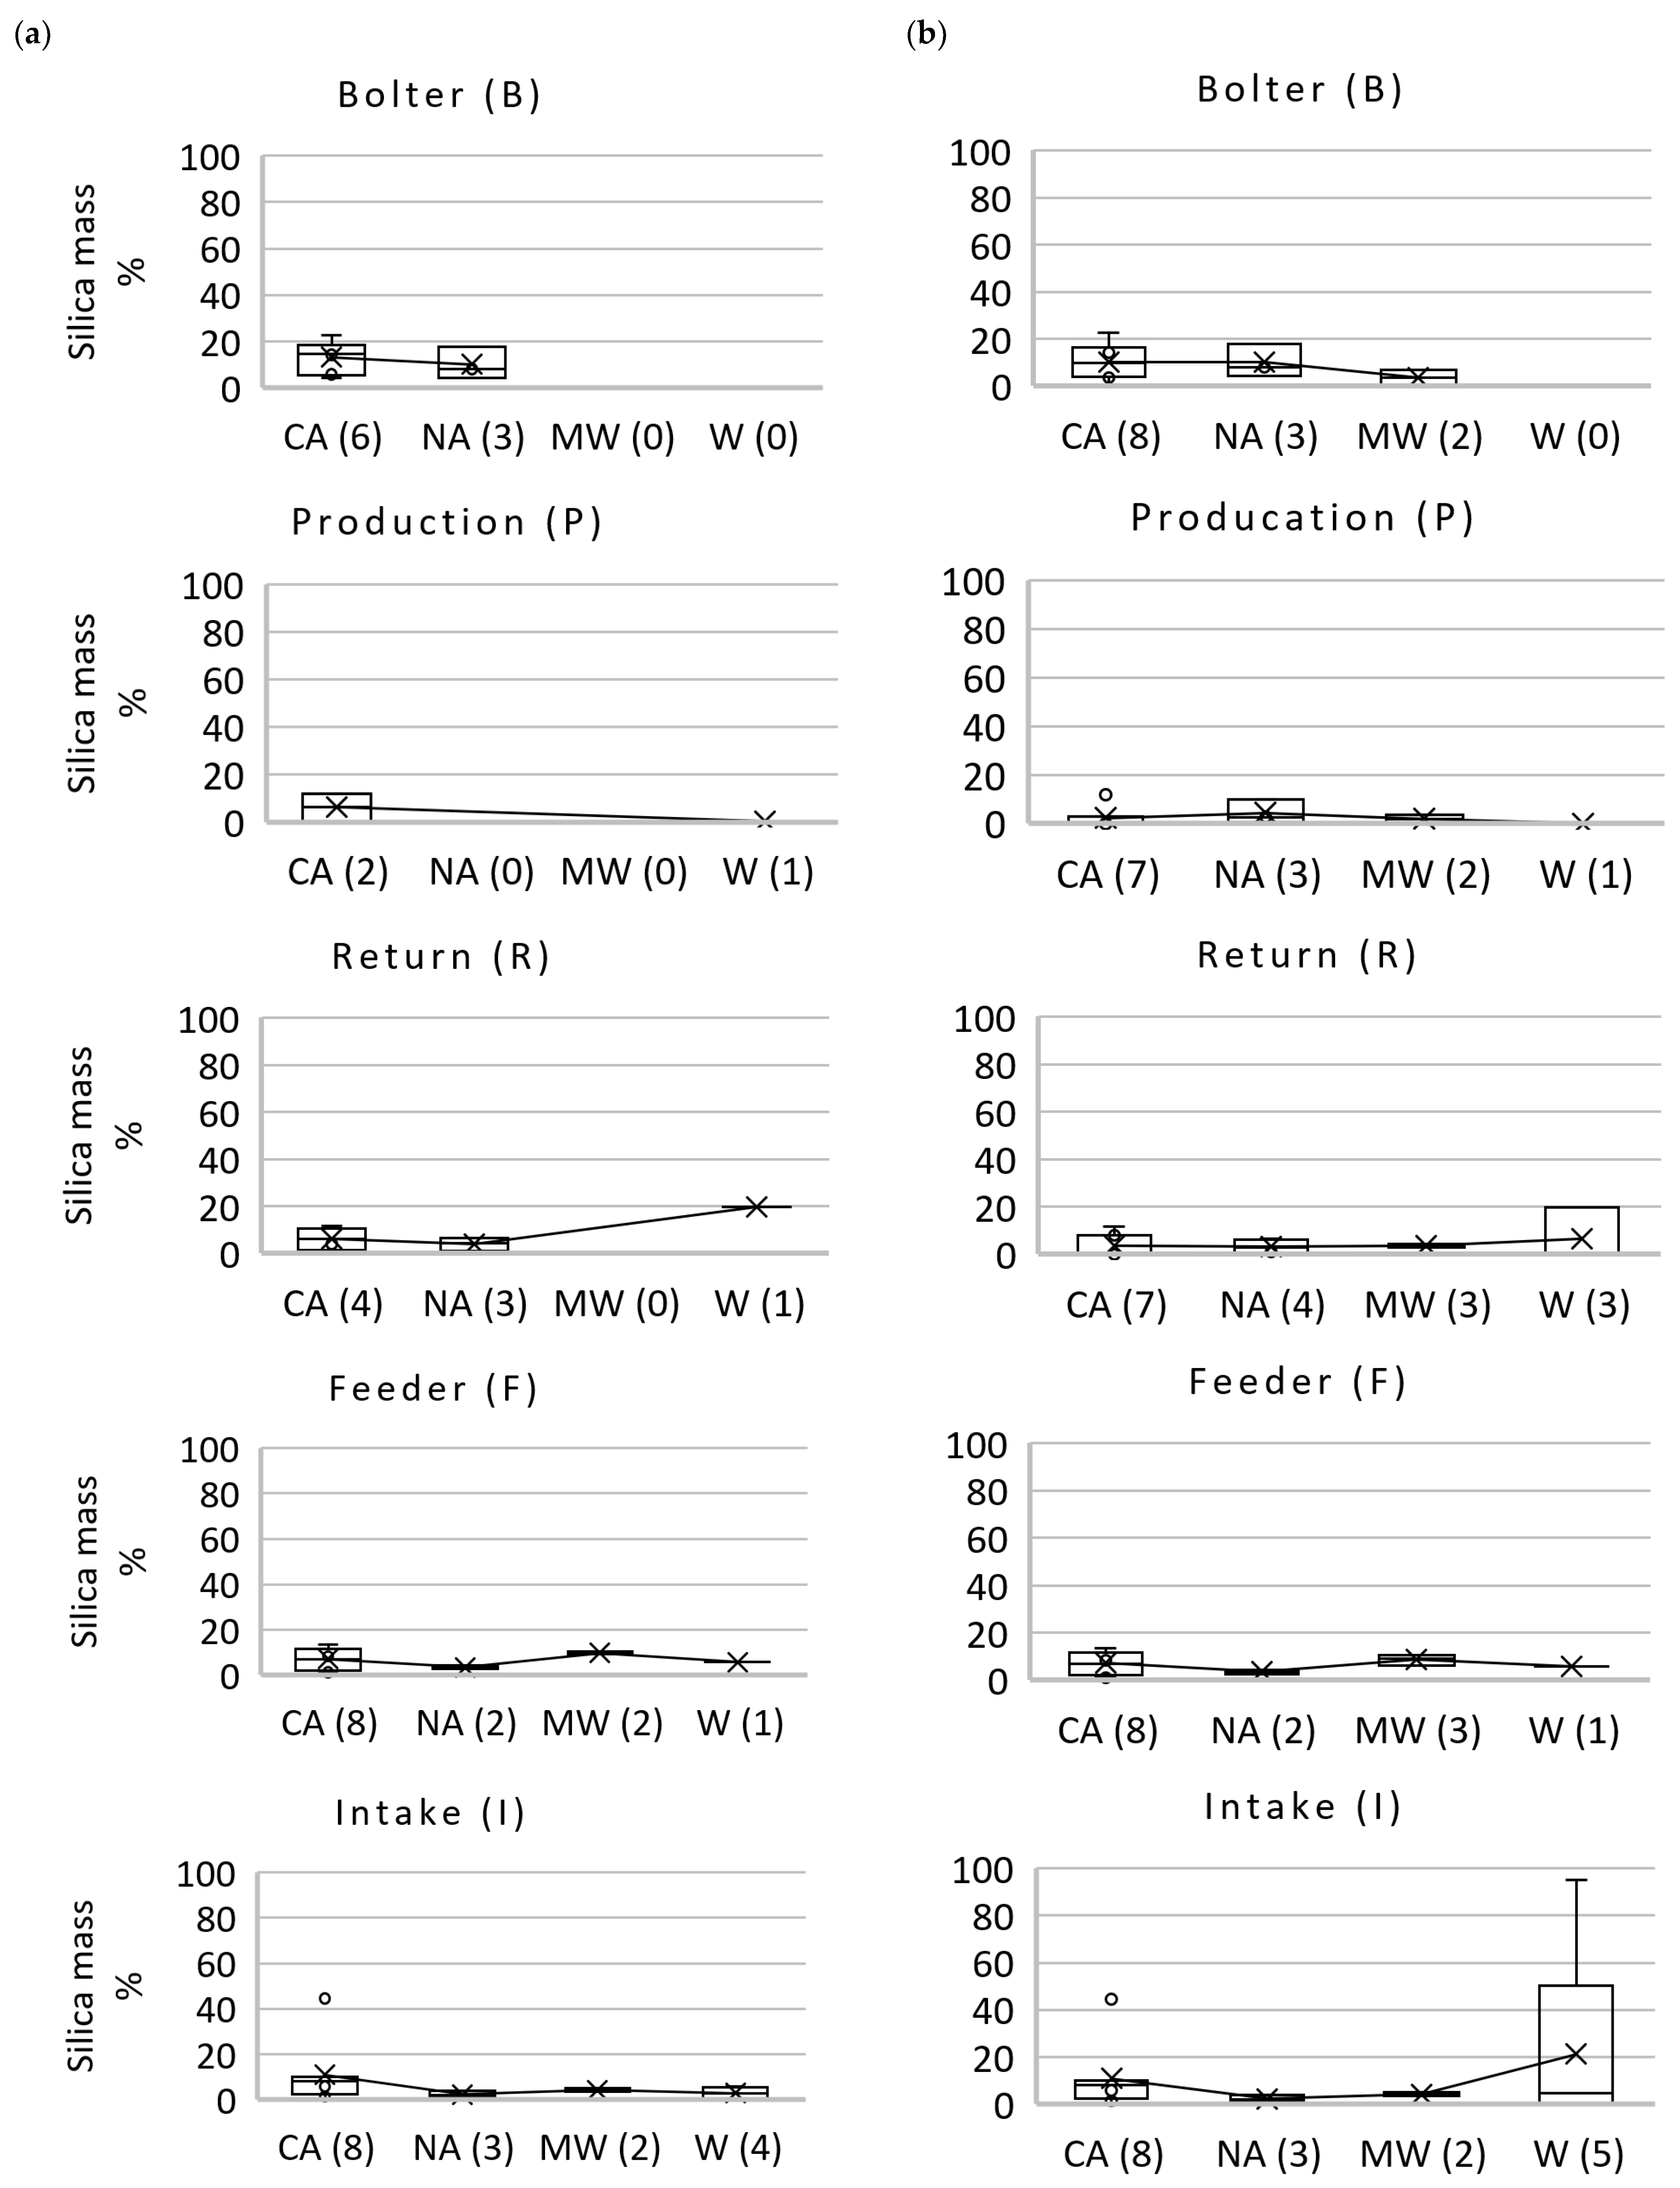
For the 46 respirable dust sample pairs generated from source materials, Table 2 summarizes the results of the SEM-EDX and FTIR analysis by material type and mine region. (The NMAM 7603 results are discussed below, and all data on a per sample basis is provided in Table S1.) As mentioned earlier, PLD can sometimes affect particle classification by SEM-EDX. For this study, a PLD threshold of 0.035 #/µm2 was used to screen results—though the short sampling durations used for the lab-generated PC filters did ensure that PLD was sufficiently low on all samples. For the FTIR results, Table 2 shows the number of samples with quartz mass above and below the LOD. Five of the eight samples from RD materials and one of the 11 samples from C materials had below-LOD results, despite total sample masses of nearly 1 mg (i.e., due to the longer sampling durations on the PVC filters).
Figure 2 shows the distribution of silica mass% as estimated from the SEM-EDX data for each source material type by mine region. These results strongly suggest that, for the mines represented by this study, the rock strata encountered during coal production and/or drilling for roof bolting operations is the main source of respirable silica. Notably, the RS and BD samples from central Appalachia did not necessarily generate more respirable silica than their counterparts from other regions. Instead, the typically higher silica content in RCMD samples in central Appalachia [20] is likely an artifact of the sheer abundance of rock that is extracted in many mines in this region. For example, Table 1 demonstrates that some mines (i.e., mines 10–15, 21, and 22 at the time of field sampling) were extracting roughly as much rock as coal in terms of total mining height—which means that a substantial portion of the respirable dust coming off the production face is generated from a potentially high-silica source. Indeed, recent work by Jaramillo et al. [48] has suggested that mining into rock strata may generate twice as much respirable dust as mining into the coal seam itself. The above example could be contrasted by that in another mine (e.g., Mine 23) where the rock strata still contain significant silica but there is simply less rock being extracted during mining.
Incidentally, Figure 2 also suggests important differences in the rock strata (RS) that is being mined along with the coal and that which is contacted during bolting (BD). Respirable dust generated from BD source materials in the central and northern Appalachian and western mines typically had higher silica mass% than dust generated from the RS materials. This might be due to somewhat higher silica content in the roof rock drilled for bolting versus the rock immediately above, below or within the target coal seam. Interestingly, the opposite trend was observed for dust samples generated from the midwestern source materials. This is attributed to the geology in the two midwestern mines represented here, which was characterized by a thin layer of shale just above the coal seam, and primarily limestone above the shale (Table 1).
While respirable silica content was clearly highest in the dust generated from BD and RS materials, Figure 2 indicates that the C materials also had some respirable silica content (i.e., between about 2%–10% by mass per the SEM-EDX data). This is consistent with previous reports in the literature surrounding silica in the coal seam itself [36,37,38], and underscores the complexity of understanding respirable silica sources in coal mines. All 13 RD materials represented by this study generated very low or undetectable respirable silica content (i.e., SEM-EDX data indicated no more than 0.5% silica). This is unsurprising since rock dust products should contain minimal silica per MSHA regulations.
Figure 3 presents the correlation between the SEM-EDX derived silica mass% and FTIR or NMAM 7603 quartz% for all pairs of respirable samples generated from the source materials. Per Table 2, only 37 of the samples on PVC filters had an above-LOD FTIR result and, as mentioned earlier, only 31 of these were selected for NMAM 7603 analysis; of the nine samples with below-LOD FTIR results, the SEM-EDX results also indicated minimal silica mass%. The data clearly track together, and thus the IR-based methods confirm the general trends shown in Figure 2. While scatter in the correlation plots is observed, it is not unexpected, especially considering the nature of the samples and analytical methods used here. Indeed, none of dust source materials are pure and the each of the analyses require multiple steps and assumptions to arrive at a final silica or quartz mass% value per sample.
From Figure 3, the SEM-EDX and FTIR methods generally yielded more similar results. Although the NMAM 7603 is well correlated, it appears to underestimate both of the other methods for most samples. However, this is attributed to significant sample mass loss from the PVC filters during transport for the NMAM 7603 analysis. While mass loss is not typically a problem for field samples collected on PVC, the high dust concentration in the lab sampling enclosure used here led to heavy loading on the filter center. This likely resulted in substantial surface caking of particles, rather than more typical embedding into the filter, and thus a more fragile deposit. This was not the case for the RCMD samples (see below), and could have been avoided for the lab-generated samples by using a more realistic dust concentration in the sampling enclosure—or at least mitigated by re-weighing the filter just prior to the NMAM 7603 analysis.

3.2. RCMD Samples

Table 3 summarizes the results of the SEM-EDX and FTIR analysis by sampling location and mine region for the 75 pairs of RCMD samples. Data for NMAM 7603 samples and data summarized in Table 3 are available per samples in Table S2 in the Supplementary Materials. As mentioned earlier, the RCMD samples included in this study were previously included in Pokhrel et al. [40] to compare analytical methods and/or Sarver et al. [34] to discuss RCMD mineralogy distributions. As in Table 2, a PLD threshold of 0.035 #/µm2 was used to split the SEM-EDX results, and the breakdown of samples with FTIR results above and below LOD is also shown. In total, 25 of the RCMD samples collected on PC filters had high PLD, which could cause misclassification of particles. High PLD was especially prevalent for samples collected in the P (10 of 13 samples) and R locations (nine of 17 samples), and was also observed for four of 13 samples in the B location. These locations, in contrast to F and I, tend to be dominated by relatively fine particles [34] and have higher dust concentrations. Comparing the mean silica mass% values for the high PLD versus low PLD sample groups (where possible), the data suggest that that high PLD probably did affect silica classification—apparently leading to an underestimation of silica mass% in most cases. On the other hand, low sample mass also appears to have affected a substantial number of the RCMD samples. In total, just 19 of the samples collected on PVC filters had an above-LOD FTIR result, and their mean sample masses were generally much higher than samples with a below-LOD result. A careful inspection of Table 3 illustrates that high PLD and low sample mass were often competing issues for the RCMD samples available for this study since dust particle loading on a filter is often well correlated with mass loading. The sampling duration was not varied in the field between the PC and PVC filters (i.e., as it was for the lab-generated samples).
Figure 4 shows the distribution of silica mass% estimated from the SEM-EDX data for the RCMD samples. High-PLD samples (i.e., PLD > 0.035 #/µm2) are excluded from the left column of plots, but all samples are included in the right column for comparison. In the central and northern Appalachian mines (where multiple samples were still available for most locations even after excluding those with high PLD), the samples from the B location generally had more silica content than samples from other locations. This is consistent with findings shown in Figure 2 for the dust generated from the source material samples (i.e., dust from the BD materials tended to have higher respirable silica than dust from the other materials). Moreover, the central Appalachian RCMD samples typically had more silica overall than samples from other regions. This is also consistent with expectations based the available mine monitoring data [20], and fits with the understanding of thin-seam mining practices wherein more rock (potentially with high silica content) is mined along with the coal. In the P, R and F locations, the central Appalachian samples had similar ranges of silica content, which were typically lower than the B location samples—likely due higher proportions of dust from lower-silica sources (e.g., the coal material). Notably, the highest silica content in any of the RCMD samples from the midwestern mines (based on both SEM-EDX and the IR methods) was observed in the F location, where the coal material is expected to generate a large proportion of the respirable dust [32]. The single C material available from the midwestern region also had the highest respirable silica content of any of the C materials studied here.
From Figure 4 it is also evident that the I location samples generally had some of the lowest silica content per region, although two exceptional data points can be seen: one I sample in central Appalachia (Mine 10) showed 45% silica based on the SEM-EDX data, but the FTIR result was below LOD; another I sample from a western mine (Mine 24) showed 95% silica based on SEM-EDX and 25%–58% quartz based on the IR methods. While the other RCMD samples from these two mines did not show exceptionally high silica/quartz content, the dust generated from the BD material in Mine 24 did contain about 75% silica based on the SEM-EDX and 37%–70% quartz based on the IR methods. These observations underscore the wide variability of silica content that can occur in RCMD, whether or not the specific source can be identified.
While relatively few of the RCMD samples collected on PVC filters had sufficient mass for either of the IR analyses, it is still prudent to compare these results to those derived from the SEM-EDX data. Figure 5 shows the correlation for all RCMD sample pairs with FTIR (n = 19) or NMAM 7603 (n = 14) results. For samples that did not exhibit high PLD (i.e., the filled data points), the results do trend together—and the FTIR and NMAM 7603 results were typically similar as expected. On the other hand, the SEM-EDX data tend to predict minimal silica content in the samples with high-PLD regardless of the FTIR or NMAM 7603 results. This is explained by the fact that when particles are in close proximity, their EDX data can interfere with one another. As noted, most of the high-PLD samples were from the P, R and B sampling locations and they were generally abundant in very fine aluminosilicate particles. The Al signal from such particles can sometimes be picked up by the EDX detector when data is gathered on a target particle (e.g., such as silica or coal), causing misclassification of the target particle. A notable exception to the problem of SEM-EDX underestimation of silica due to high PLD is illustrated by the data points at the very top of Figure 5. These points are associated with the aforementioned very-high silica sample collected in the I location of Mine 24. In this case, the silica particles were relatively abundant and fine, and likely caused misclassification of coal dust particles in the sample (i.e., leading to overestimation of silica content by the SEM-EDX relative to the IR methods.) Silica mass% difference in SEM-EDX versus the FTIR as a function of observed PLD is also shown in Figure S5 in Supplementary Materials.

4. Conclusions

An accurate understanding of RCS sources is an important first step for improving dust and exposure controls in coal mines. Until now, however, few studies have directly linked specific sources to the silica content in RCMD. For the mines represented here, results clearly implicate the rock strata being drilled or mined along with the coal as a primary source of respirable silica. These findings reinforce targeted protection for miners working in and around roof bolting operations, and they validate long-standing speculation that significant rock extraction at the production face can significant silica that adds to the RCMD. In addition to identifying silica sources, a better understanding of particle characteristics such as size and surface condition could also be important in mitigating exposure hazards. Study of these characteristics will be the subject of future work.

Supplementary Materials

The following supporting information can be downloaded at: https://www.mdpi.com/article/10.3390/min12091115/s1, Table S1: SEM-EDX, FTIR and NMAM 7603 results for respirable dust samples generated from source materials.; Table S2: SEM-EDX, FTIR and NMAM 7603 results for RCMD samples.; Figure S1: General geographic regions of the sampled mines.; Figure S2: Schematic diagrams illustrating approximate sampling locations for RCMD samples and source materials in (a) continuous miner, and (b) longwall mine operations; Figure S3: Example elemental spectrum obtained during SEM-EDX analysis of a silica particle on PC filter; Figure S4: Example infrared spectrum on a pure silica dust sample using the portable Bruker Alpha II FTIR instrument and OPUS software.; Figure S5: Difference between the silica mass% derived from SEM-EDX and FTIR results versus particle loading density for the RCMD samples with FTIR result > LOD (n = 19).

Author Contributions

Conceptualization, E.S. and C.K.; methodology, E.S. and C.K.; validation, E.S. and C.K.; formal analysis, E.S., C.K. and N.P.; investigation, E.S., C.K. and N.P.; resources, E.S.; writing—original draft preparation, C.K.; writing—review and editing, E.S. and C.K.; supervision, E.S.; project administration, E.S. and C.K.; funding acquisition, E.S. All authors have read and agreed to the published version of the manuscript.

Funding

This research was funded by National Institute for Occupational Safety and Health (NIOSH), grant number 75D30119C05528.

Data Availability Statement

The data presented in this study are available in Tables S1 and S2, as Supplementary Materials.

Acknowledgments

The authors would like to thank NIOSH for funding this work. We kindly acknowledge our industry partners and mine personnel for arranging mine access and providing logistical support for dust sampling. We also thank Alex Norris, Kyle Louk, Eleftheria Agioutanti, Lizeth Jaramillo, Jonathan Gonzalez, Baxter Jones and Setareh Afrouz for their assistance with dust sampling. We are also grateful to RJ Lee group for the NMAM 7603 analysis.

Conflicts of Interest

The authors declare no conflict of interest. The funders had no role in the design of the study; in the collection, analyses, or interpretation of data; in the writing of the manuscript, or in the decision to publish the results.

References

  1. IARC. Monographs on the Evaluation of Carcinogenic Risks to Humans: Silica and Some Silicates; IARC: Lyon, France, 1987; Volume 42. [Google Scholar]
  2. IARC. Monographs on the Evaluation of Carcinogenic Risks to Humans: Silica, Some Silicates, Coal Dust and Para-Aramid Fibrils; IARC: Lyon, France, 1997; Volume 68. [Google Scholar]
  3. Hall, N.B.; Blackley, D.J.; Halldin, C.N.; Laney, A.S. Pneumoconiosis progression patterns in US coal miner participants of a job transfer programme designed to prevent progression of disease. Occup. Environ. Med. 2020, 77, 402–406. [Google Scholar] [CrossRef]
  4. Hall, N.B.; Blackley, D.J.; Halldin, C.N.; Laney, A.S. Current Review of Pneumoconiosis Among US Coal Miners. Curr. Environ. Heal. Rep. 2019, 6, 137–147. [Google Scholar] [CrossRef]
  5. Reynolds, L.E.; Blackley, D.J.; Colinet, J.F.; Potts, J.D.; Storey, E.; Short, C.; Carson, R.; Clark, K.A.; Laney, A.S.; Halldin, C.N. Work Practices and Respiratory Health Status of Appalachian Coal Miners With Progressive Massive Fibrosis. J. Occup. Environ. Med. 2018, 60, e575–e581. [Google Scholar] [CrossRef]
  6. Cohen, R.A.; Petsonk, E.L.; Rose, C.; Young, B.; Regier, M.; Najmuddin, A.; Abraham, J.L.; Churg, A.; Green, F.H.Y. Lung Pathology in U.S. Coal Workers with Rapidly Progressive Pneumoconiosis Implicates Silica and Silicates. Am. J. Respir. Crit. Care Med. 2016, 193, 673–680. [Google Scholar] [CrossRef]
  7. Blanc, P.D.; Seaton, A. Pneumoconiosis Redux. Coal Workers’ Pneumoconiosis and Silicosis Are Still a Problem. Am. J. Respir. Crit. Care Med. 2016, 193, 603–605. [Google Scholar] [CrossRef]
  8. Joy, G.J.; Listak, J.M.; Beck, T.W. Respirable quartz hazards associated with coal mine roof bolter dust. In Proceedings of the 13th U.S./North American Mine Ventilation Symposium, Sudbury, ON, Canada, 13–16 June 2010; pp. 59–64. [Google Scholar]
  9. Cohen, R.A.C.; Patel, A.; Green, F.H.Y. Lung Disease Caused by Exposure to Coal Mine and Silica Dust. Semin. Respir. Crit. Care Med. 2008, 29, 651–661. [Google Scholar] [CrossRef]
  10. Almberg, K.S.; Halldin, C.N.; Blackley, D.J.; Laney, A.S.; Storey, E.; Rose, C.S.; Go, L.H.T.; Cohen, R.A. Progressive Massive Fibrosis Resurgence Identified in U.S. Coal Miners Filing for Black Lung Benefits, 1970–2016. Ann. Am. Thorac. Soc. 2018, 15, 1420–1426. [Google Scholar] [CrossRef]
  11. Code of Federal Regulations (CFR). Title 30—Mineral Resources, Part 70—Mandatory Health Standards-Underground Coal Mines; last amended 2022; Office of the Federal Register: Washington, DC, USA, 1977.
  12. Antao, V.C.D.S.; Petsonk, E.L.; Sokolow, L.; Wolfe, A.L.; Pinheiro, G.A.; Hale, J.M.; Attfield, M.D. Rapidly progressive coal workers’ pneumoconiosis in the United States: Geographic clustering and other factors. Occup. Environ. Med. 2005, 62, 670–674. [Google Scholar] [CrossRef]
  13. Blackley, D.J.; Reynolds, L.E.; Short, C.; Carson, R.; Storey, E.; Halldin, C.N.; Laney, A.S. Progressive Massive Fibrosis in Coal Miners From 3 Clinics in Virginia. JAMA 2018, 319, 500–501. [Google Scholar] [CrossRef]
  14. Blackley, D.J.; Crum, J.B.; Halldin, C.N.; Storey, E.; Laney, A.S. Resurgence of Progressive Massive Fibrosis in Coal Miners—Eastern Kentucky. MMWR. Morb. Mortal. Wkly. Rep. 2016, 65, 1385–1389. [Google Scholar] [CrossRef] [Green Version]
  15. Graber, J.M.; Harris, G.; Almberg, K.S.; Rose, C.S.; Petsonk, E.L.; Cohen, R.A. Increasing Severity of Pneumoconiosis Among Younger Former US Coal Miners Working Exclusively Under Modern Dust-Control Regulations. J. Occup. Environ. Med. 2017, 59, e105–e111. [Google Scholar] [CrossRef] [PubMed]
  16. Laney, A.S.; Weissman, D.N. Respiratory Diseases Caused by Coal Mine Dust. J. Occup. Environ. Med. 2014, 56 (Suppl. S10), S18–S22. [Google Scholar] [CrossRef] [PubMed]
  17. Kuempel, E.D.; Attfield, M.D.; Vallyathan, V.; Lapp, N.L.; Hale, J.M.; Smith, R.J.; Castranova, V. Pulmonary inflammation and crystalline silica in respirable coal mine dust: Dose-response. J. Biosci. 2003, 28, 61–69. [Google Scholar] [CrossRef] [PubMed]
  18. Cohen, R.A.; Rose, C.S.; Go, L.H.T.; Zell-Baran, L.M.; Almberg, K.S.; Sarver, E.A.; Lowers, H.A.; Iwaniuk, C.; Clingerman, S.M.; Richardson, D.L.; et al. Pathology and Mineralogy Demonstrate Respirable Crystalline Silica is a Major Cause of Severe Pneumoconiosis in US Coal Miners. Ann. Am. Thorac. Soc. 2022. [Google Scholar] [CrossRef]
  19. Agioutanti, E.; Keles, C.; Sarver, E. A thermogravimetric analysis application to determine coal, carbonate, and non-carbonate minerals mass fractions in respirable mine dust. J. Occup. Environ. Hyg. 2020, 17, 47–58. [Google Scholar] [CrossRef]
  20. Doney, B.C.; Blackley, D.; Hale, J.M.; Halldin, C.; Kurth, L.; Syamlal, G.; Laney, A.S. Respirable coal mine dust in underground mines, United States, 1982–2017. Am. J. Ind. Med. 2019, 62, 478–485. [Google Scholar] [CrossRef]
  21. National Academies of Sciences, Engineering, and Medicine. Monitoring and Sampling Approaches to Assess Underground Coal Mine Dust Exposures; The National Academies Press: Washington, DC, USA, 2018. [Google Scholar] [CrossRef]
  22. Trechera, P.; Moreno, T.; Córdoba, P.; Moreno, N.; Zhuang, X.; Li, B.; Li, J.; Shangguan, Y.; Kandler, K.; Dominguez, A.O.; et al. Mineralogy, geochemistry and toxicity of size-segregated respirable deposited dust in underground coal mines. J. Hazard. Mater. 2020, 399, 122935. [Google Scholar] [CrossRef]
  23. Mischler, S.E.; Cauda, E.G.; Di Giuseppe, M.; McWilliams, L.J.; Croix, C.S.; Sun, M.; Franks, J.; Ortiz, L.A. Differential activation of RAW 264.7 macrophages by size-segregated crystalline silica. J. Occup. Med. Toxicol. 2016, 11, 57. [Google Scholar] [CrossRef]
  24. Vallyathan, V.; Shi, X.L.; Dalal, N.S.; Irr, W.; Castranova, V. Generation of free radicals from freshly fractured silica dust. Potential role in acute silica-induced lung injury. Am. Rev. Respir. Dis. 1988, 138, 1213–1219. [Google Scholar] [CrossRef]
  25. Pavan, C.; Piane, M.D.; Gullo, M.; Filippi, F.; Fubini, B.; Hoet, P.; Horwell, C.J.; Huaux, F.; Lison, D.; Giudice, C.L.; et al. The puzzling issue of silica toxicity: Are silanols bridging the gaps between surface states and pathogenicity? Part. Fibre Toxicol. 2019, 16, 32. [Google Scholar] [CrossRef]
  26. Pavan, C.; Fubini, B. Unveiling the Variability of “Quartz Hazard” in Light of Recent Toxicological Findings. Chem. Res. Toxicol. 2017, 30, 469–485. [Google Scholar] [CrossRef] [PubMed]
  27. Turci, F.; Pavan, C.; Leinardi, R.; Tomatis, M.; Pastero, L.; Garry, D.; Anguissola, S.; Lison, D.; Fubini, B. Revisiting the paradigm of silica pathogenicity with synthetic quartz crystals: The role of crystallinity and surface disorder. Part. Fibre Toxicol. 2015, 13, 3. [Google Scholar] [CrossRef]
  28. Stone, V.; Jones, R.; Rollo, K.; Duffin, R.; Donaldson, K.; Brown, D. Effect of coal mine dust and clay extracts on the biological activity of the quartz surface. Toxicol. Lett. 2004, 149, 255–259. [Google Scholar] [CrossRef] [PubMed]
  29. Walton, W.H.; Dodgson, J.; Hadden, G.G.; Jacobsen, M. The effect of quartz and other non-coal dusts in coal workers’ pneumoconiosis. In Inhaled Particles IV; Walton, W.H., Ed.; Unwin Brothers: Surrey, UK, 1977; pp. 669–689. [Google Scholar]
  30. United States National Institute for Occupational Safety and Health. Criteria for a Recommended Standard—Occupational Exposure to Respirable Coal Mine Dust (DHHS (NIOSH); Publ. No. 95-106; United States National Institute for Occupational Safety and Health: Cincinnati, OH, USA, 1995.
  31. Schatzel, S.J. Identifying sources of respirable quartz and silica dust in underground coal mines in southern West Virginia, western Virginia, and eastern Kentucky. Int. J. Coal Geol. 2009, 78, 110–118. [Google Scholar] [CrossRef]
  32. Sarver, E.; Keles, C.; Rezaee, M. Beyond conventional metrics: Comprehensive characterization of respirable coal mine dust. Int. J. Coal Geol. 2019, 207, 84–95. [Google Scholar] [CrossRef]
  33. Sarver, E.; Keles, C.; Rezaee, M. Characteristics of respirable dust in eight appalachian coal mines: A dataset including particle size and mineralogy distributions, and metal and trace element mass concentrations. Data Brief 2019, 25, 104032. [Google Scholar] [CrossRef]
  34. Sarver, E.; Keleş, Ç.; Afrouz, S.G. Particle size and mineralogy distributions in respirable dust samples from 25 US underground coal mines. Int. J. Coal Geol. 2021, 247, 103851. [Google Scholar] [CrossRef]
  35. Pollock, D.E.; Potts, J.D.; Joy, G.J. Investigation into dust exposures and mining practices in mines in the southern Appalachian region. Min. Eng. 2010, 62, 44–49. [Google Scholar]
  36. Miller, A.L.; Drake, P.L.; Murphy, N.C.; Noll, J.D.; Volkwein, J.C. Evaluating portable infrared spectrometers for measuring the silica content of coal dust. J. Environ. Monit. 2011, 14, 48–55. [Google Scholar] [CrossRef]
  37. Oman, C.L.; Finkelman, R.B.; Talley, R.T. Analysis of Ten Coal Samples from the Michigan Basin; U.S. Geologic Survey Open-File Report; U.S. Geological Survey: Reston, VA, USA, 1992; pp. 92–180. [CrossRef]
  38. Trent, V.A.; Medlin, J.H.; Coleman, S.L.; Stanton, R.W. Chemical Analyses and Physical Properties of 12 Coal Samples from the Pocahontas Field, Tazewell County, Virginia, and McDowell County, West Virginia; Geological Survey Bulletin 1528; U.S. Government Printing Office: Washington, DC, USA, 1982.
  39. Code of Federal Regulations (CFR). Title 30—Mineral Resources, Part 75.2—Mandatory Safety Standards-Underground Coal Mines; Office of the Federal Register: Washington, DC, USA, 1969.
  40. Pokhrel, N.; Agioutanti, E.; Keles, C.; Afrouz, S.; Sarver, E. Comparison of Respirable Coal Mine Dust Constituents Estimated using FTIR, TGA, and SEM–EDX. Min. Met. Explor. 2022, 39, 291–300. [Google Scholar] [CrossRef]
  41. Farcas, D.; Lee, T.; Chisholm, W.P.; Soo, J.-C.; Harper, M. Replacement of filters for respirable quartz measurement in coal mine dust by infrared spectroscopy. J. Occup. Environ. Hyg. 2016, 13, D16–D22. [Google Scholar] [CrossRef] [PubMed]
  42. Johann-Essex, V.; Keles, C.; Sarver, E. A Computer-Controlled SEM-EDX Routine for Characterizing Respirable Coal Mine Dust. Minerals 2017, 7, 15. [Google Scholar] [CrossRef]
  43. Miller, A.L.; Weakley, A.T.; Griffiths, P.R.; Cauda, E.G.; Bayman, S. Direct-on-Filter α-Quartz Estimation in Respirable Coal Mine Dust Using Transmission Fourier Transform Infrared Spectrometry and Partial Least Squares Regression. Appl. Spectrosc. 2016, 71, 1014–1024. [Google Scholar] [CrossRef] [PubMed]
  44. Cauda, E.; Miller, A.; Drake, P. Promoting early exposure monitoring for respirable crystalline silica: Taking the laboratory to the mine site. J. Occup. Environ. Hyg. 2016, 13, D39–D45. [Google Scholar] [CrossRef]
  45. NIOSH. FAST (Field Analysis of Silica Tool), Build 1.0.7.2 ed.; NIOSH-CDC: Pittsburgh, PA, USA, 2019.
  46. Miller, A.L.; Drake, P.L.; Murphy, N.C.; Cauda, E.G.; LeBouf, R.; Markevicius, G. Deposition Uniformity of Coal Dust on Filters and Its Effect on the Accuracy of FTIR Analyses for Silica. Aerosol Sci. Technol. 2013, 47, 724–733. [Google Scholar] [CrossRef]
  47. NIOSH. Method 7603, Quartz in coal mine dust, by IR (Redeposition). In NIOSH Manual of Analytical Methods (NMAM), 5th ed.; Department of Health and Human Services, Centers for Disease Control and Prevention, National Institute for Occupational Safety and Health: Cincinnati, OH, USA, 2017. [Google Scholar]
  48. Jaramillo, L.; Agioutanti, E.; Afrouz, S.G.; Keles, C.; Sarver, E. Thermogravimetric Analysis of Respirable Coal Mine Dust for Simple Source Apportionment. J. Occup. Environ. Hyg. 2022, 1–14. [Google Scholar] [CrossRef]
Figure 1. Calibration curve for determining quartz mass in lab-generated respirable dust samples collected in 2-piece cassettes from a small enclosure with high dust concentration. The curve was created by correlating the FTIR-derived integrated peak area for quartz to Min-U-Sil® 5 mass (µg) on the filter (determined gravimetrically).
Minerals 12 01115 g001
Figure 2. Distribution of silica mass% estimated from SEM-EDX for the respirable dust samples generated from primary source materials. Plots are shown by mine region for each material type. Number of samples per mine region are given in parentheses.
Minerals 12 01115 g002
Figure 3. Correlation between the silica mass% estimated from SEM-EDX and quartz% measured by FTIR or NMAM 7603 for the pairs of respirable dust samples generated from primary source materials.
Minerals 12 01115 g003
Figure 4. Distribution of silica mass% estimated from SEM-EDX for the RCMD samples, with plots shown by mine region for each sampling location. In (a) high-PLD samples are excluded, in (b) all samples are included regardless of PLD.
Minerals 12 01115 g004
Figure 5. Correlation between the silica mass% estimate from SEM-EDX and quartz% measured by FTIR or NMAM 7603 for the RCMD sample pairs. Filled points indicate an observed PLD < 0.035 particles/µm2; open points indicate a greater PLD. The data cluster in the lower left of the plot is magnified to visualize the effect of PLD on the SEM-EDX estimation of silica%.
Minerals 12 01115 g005
Table 1. Summary of available RCMD and source material samples from 15 underground coal mines.
MineMine Reg. 1MSHA DistrictStateMining Method 2Coal Ht. (m)Mining Ht. (m)Roof Strata 3Mine Dust SamplesSource Materials
Location 4TotalMaterial Type 5Total
BPRFIBDRSCRD
10CA5KYCM1–1.21.8–1.9Sh/Sn21121711002
11CA5VACM0.81.2–1.3Sh11110401012
12CA5VACM0.8–1.51.9–2.0Sh/Sn11101401113
13CA5VALW1.5–1.81.8–2.0Sn/Sh10212610113
14CA5VACM0.6–0.91.5–1.9Sh11011411114
15CA4WVCM0.9–1.22.0Sh11111501113
16NA3WVCM2.72.1Sh11110410113
17NA3WVLW1.5–1.82.0–2.3Sh11202610113
18NA3WVCM0.7–0.81.5–1.8Sh11111511114
19MW8ILCM1.8–2.01.9–2.3Sh/Lm11211611114
20MW8ILCM1.8–1.91.8–2.0Sh/Lm11121610012
21CA12WVCM0.8–1.02.0Sh/Sn11111511103
22CA12WVCM0.81.4Sh01011311114
23W9COLW6.14.3Sh01102411114
24W9COLW1.82.1–2.4Sh/Sn00213610012
BPRFITotalBDRSCRDTotal
Total131317141875 61210111346 7
1 Mine region: CA = central Appalachia; NA = northern Appalachia; MW = mid-west; W = west. 2 Mining method: CM = continuous miner; LW = longwall. 3 Roof strata: Description based on observations during RCMD sampling. Sh = shale; Sn = sandstone; Lm = limestone. 4 Sampling location: I = intake; R = return; P = production; B = roof bolter; F = feeder breaker. 5 Material type: BD = roof bolter dust; RS = rock strata from ROM; C = raw coal from ROM; RD = rock dust product. 6 Total sets of samples collected, including one PC and one PVC filter for this study. 7 Total pairs of polycarbonate (PC) and polyvinyl chloride (PVC) samples generated in lab from source materials.
Table 2. SEM-EDX and FTIR results for respirable dust samples generated from source materials summarized by material type and mine region.
Mine
Region 1
Source
Material 2
TotalSEM-EDXFTIR
PLD 3 < 0.035PLD > 0.035>LOD 4<LOD
nnMean
PLD (#/µm2)
Mean
Silica%
nMean
PLD (#/µm2)
Mean
Silica%
nMean
Sample
Mass 5 (mg)
Mean
Quartz
%
nMean
Sample
Mass (mg)
CABD550.00716.50--50.9722.10-
RS760.01213.10--71.0416.10-
C660.0056.40--61.012.80-
RD660.0060.10--0--61.077
NABD330.01331.80--31.1134.90-
RS110.0058.00--11.9418.60-
C330.0034.00--30.952.30-
RD330.0090.30--20.980.310.830
MWBD220.0084.60--21.059.80-
RS110.01435.10--11.0114.20-
C110.00910.30--0--10.800
RD220.0160.00--20.952.70-
WBD220.00945.20--20.9448.10-
RS110.01320.60--10.8338.00-
C110.0034.50--10.890.40-
RD220.0070.10--10.961.310.870
all
samples
BD12120.00923.10--121.0127.60-
RS1090.01115.80--101.1118.40-
C11110.0055.90--100.982.410.800
RD13130.0080.10--50.961.481.020
1 Region: CA = central Appalachia; NA = northern Appalachia; MW = mid-west; W = west. 2 Material type: BD = bolter dust; RS = run-of-mine (ROM) rock strata; RD = rock dust; C= ROM coal. 3 PLD: Particle loading density = number of particles/analyzed area (#/µm2). 4 LOD: limit of detection for quartz mass = 3.74 µg (= 0.026/0.00695, Integrated peak area/calibration factor for lab generated samples in two-piece cassette). 5 mean sample mass (mg) = averaged dust mass on PVC filter.
Table 3. SEM-EDX and FTIR results for RCMD samples summarized by sampling location and mine region.
Mine
Region 1
Sampling
Location 2
TotalSEM-EDXFTIR
PLD 3 < 0.035PLD > 0.035>LOD 4<LOD
nnMean PLD (#/µm2)Mean
Silica%
nMean PLD (#/µm2)Mean
Silica%
nMean Sample
Mass 5 (µg)
Mean Quartz%nMean Sample Mass (µg)
CAB860.01513.220.0492.012.5412.370.115
P720.0246.150.0430.761.625.611.494
R740.0226.030.0420.261.834.310.038
F880.0157.20--0--80.124
I880.00810.90--10.704.670.023
NAB330.01110.10--0--30.076
P30--30.0434.40--30.279
R430.0194.010.0560.210.761.930.297
F220.0123.50--0--20.046
I330.0032.30--0--30.030
MWB20--20.0473.60--20.356
P20--20.0442.010.760.510.277
R30--30.0433.40--30.366
F320.0179.810.0496.112.614.620.167
I220.0044.20--0--20.017
WB00--0--0--0-
P110.0280.10--0--10.349
R310.03219.720.0490.115.363.520.527
F110.0155.70--0--10.068
I540.0172.810.05194.911.5524.940.097
all
samples
B1390.01412.140.0482.812.5412.3120.146
P1330.0254.1100.0432.171.494.960.493
R1780.0227.090.0461.282.133.990.342
F14130.0156.910.0496.112.614.6130.114
I18170.0096.710.05194.921.1214.8160.042
1 Mine region: CA = central Appalachia; NA = northern Appalachia; MW = mid-west; W = west. 2 Sampling location: I = intake; R = return; P = production; B = roof bolter; F = feeder breaker. 3 PLD: Particle loading density = number of particles/analyzed area (#/µm2). 4 LOD: limit of detection for quartz mass = 4.31 µg (= 0.026/0.00604, Integrated peak area/calibration factor for mine samples in two-piece cassette). 5 mean sample mass (mg) = averaged dust mass on PVC filter.
Publisher’s Note: MDPI stays neutral with regard to jurisdictional claims in published maps and institutional affiliations.

