Article

The Effects of Soil Porosity and Mix Design of Volcanic Ash-Based Geopolymer on the Surface Strength of Highly Wind Erodible Soils

by
Hamid Reza Mohebbi
1,
Akbar A. Javadi
2,* and
Alireza Saeedi Azizkandi
1
1
School of Civil Engineering, Iran University of Science and Technology (IUST), Narmak, Tehran 16844, Iran
2
Department of Engineering, University of Exeter, Exeter EX4 4QF, UK
*
Author to whom correspondence should be addressed.
Minerals 2022, 12(8), 984; https://doi.org/10.3390/min12080984
Submission received: 27 June 2022 / Revised: 26 July 2022 / Accepted: 27 July 2022 / Published: 2 August 2022

Abstract

:
Surface stabilization of loose, non-cohesive, and fine soils has always been a challenging task for geotechnical engineers. These soils show meager mechanical behavior and are very vulnerable to wind erosion. Many attempts have been made to combat wind erosion of soils. These attempts, including a variety of soil surface amendment methods, have faced complications in terms of financial efficacy, reduced long-term behavior at elevated temperatures, and limitations in stabilization of a wide range of soil types. The application of geopolymers for surface stabilization is a novel approach, which has its own challenges in terms of selecting an appropriate precursor type, mix design, and preparation method. This study evaluated the challenges of using volcanic ash (VA)-based geopolymer, through the 1 Phase (1P) method for stabilization of two silty and sandy soils. A series of uniaxial compressive strength (UCS) and penetrometer tests were performed on cylindrical specimens and soil surface-treated samples, respectively, to evaluate the resistance of treated samples with different porosities. Moreover, the rheological behavior of geopolymer paste having various binder-to-activator ratios is discussed. The available rheological characteristics of geopolymer in this study fit well with the Bingham model. It was found that, despite the minimal crust thickness formed on the topsoil, significant surface resistance is acquired. The results show notable performance of the 1P method for surface amendment of both the silty and sandy soil samples.

1. Introduction

Aeolian soils comprise extensive soil types having a large amount of fine sand and non-plastic silt grains [1]. Wind erosion of these soil types is responsible for widespread environmental challenges throughout many arid and semi-arid areas of the world [2]. Soil surface crust, density, soil particle size, and shape are some of the most important geotechnical characteristics of the topsoil structure assumed to be effective in terms of its wind erodibility [3,4]. Many approaches and materials have been employed to mitigate wind-induced soil erosion by binding topsoil particles through developing a surface crust. Geopolymeric surface treatment is one of these methods, and has drawn researchers’ attention in recent years [5,6,7]. Despite the numerous adverse environmental and health issues associated with volcanic ash, its application as a construction material or soil stabilizer deals with many problems with the aim of achieving a greener environment and better human health [8,9,10]. Additionally, this material shows a favorable application for soil stabilization and a promising role as a geopolymer binder due to its chemical composition [5,10]. The developed performance of geopolymers at elevated curing conditions [11] is another advantage of using this material as a soil stabilizer in warm climates such as deserted areas, and arid and semi-arid lands, where the frequency of wind-induced soil erosion is significant [12,13].
Numerous studies have been performed on the rheological characteristics of geopolymers. Both the type and amount of binder in proportion to activator solution have been shown to be effective parameters influencing the rheological behavior of geopolymer pastes [14]. The workability of geopolymers is significantly affected by their rheological characteristics [15]. Since the viscosity is highly dependent on the employed aluminosilicate precursors [16], more investigation is needed to understand the rheological features of volcanic ash-based geopolymers. Many mathematical models have been introduced to describe the rheological behavior of fluids. These models involve different relationships between yield stress, shear rate, and plastic viscosity of various materials [17]. Despite the same pseudoplastic behavior, dissimilar apparent viscosity and yield stress have been discovered for different volcanic ash (VA)-based geopolymer pastes. This can be attributed to the variations in specific surface area, particle size, mineralogy, and chemical composition [10]. Consequently, because the function and behavior of VA-based geopolymers are greatly reliant on their microstructural and chemical characteristics, understanding the mechanisms and function of each binder deposit is of some significance. Another goal of this study was to measure the influence of binder-to-activator ratios on the rheological behavior of geopolymer paste and the infiltration depth of the paste into the soil surface.
Porosity is widely accepted as a prominent geotechnical parameter of soils that affects both the wind erodibility of untreated lands and the compressive strength of cemented soil [4,18]. Despite wide-ranging investigations into the effects of soil porosity on the compressive strength of artificially stabilized soils, to the authors’ knowledge, no study has been performed to scrutinize the strength of geopolymeric surface-treated soils having different values of porosity. Thus, although multiple studies have reported an increase in the unconfined compressive strength of cemented soils by increasing the soil porosity [19], the effect of soil porosity on the surface strength of artificially crusted soils has not been elucidated.
Limited geopolymeric crust formation caused by poor penetration of alkaline activated precursor into the topsoil surface has been reported as a challenging concern for the employment of the 1 phase (1P) method for soil surface stabilization [5]. This study was an attempt to address this complexity of the 1P method. To achieve this, the rheological parameters of five different geopolymer mix designs were assessed. Moreover, the developed crust thicknesses of surface-treated samples and their surface strength were studied.
Uniaxial compressive strength and surface resistance are two prominent features used for indirect evaluation of the resistance of crusted soils against wind erosion [20]. In this study, the surface resistance and compressive strength of two soil samples having high wind erosion vulnerability, prepared at different porosity values, were investigated by surface penetrometer and uniaxial compressive strength tests, respectively.
The packing structures of different soil samples show diverse trends after mixing with various types of soil additives [21,22,23,24,25]. In this paper, the results of the Proctor compaction tests on the soils modified with binders are discussed to investigate the effect of adding volcanic ash to the silty sand sample in terms of the fluctuation in maximum dry unit weight and optimum moisture content.

2. Materials and Methods
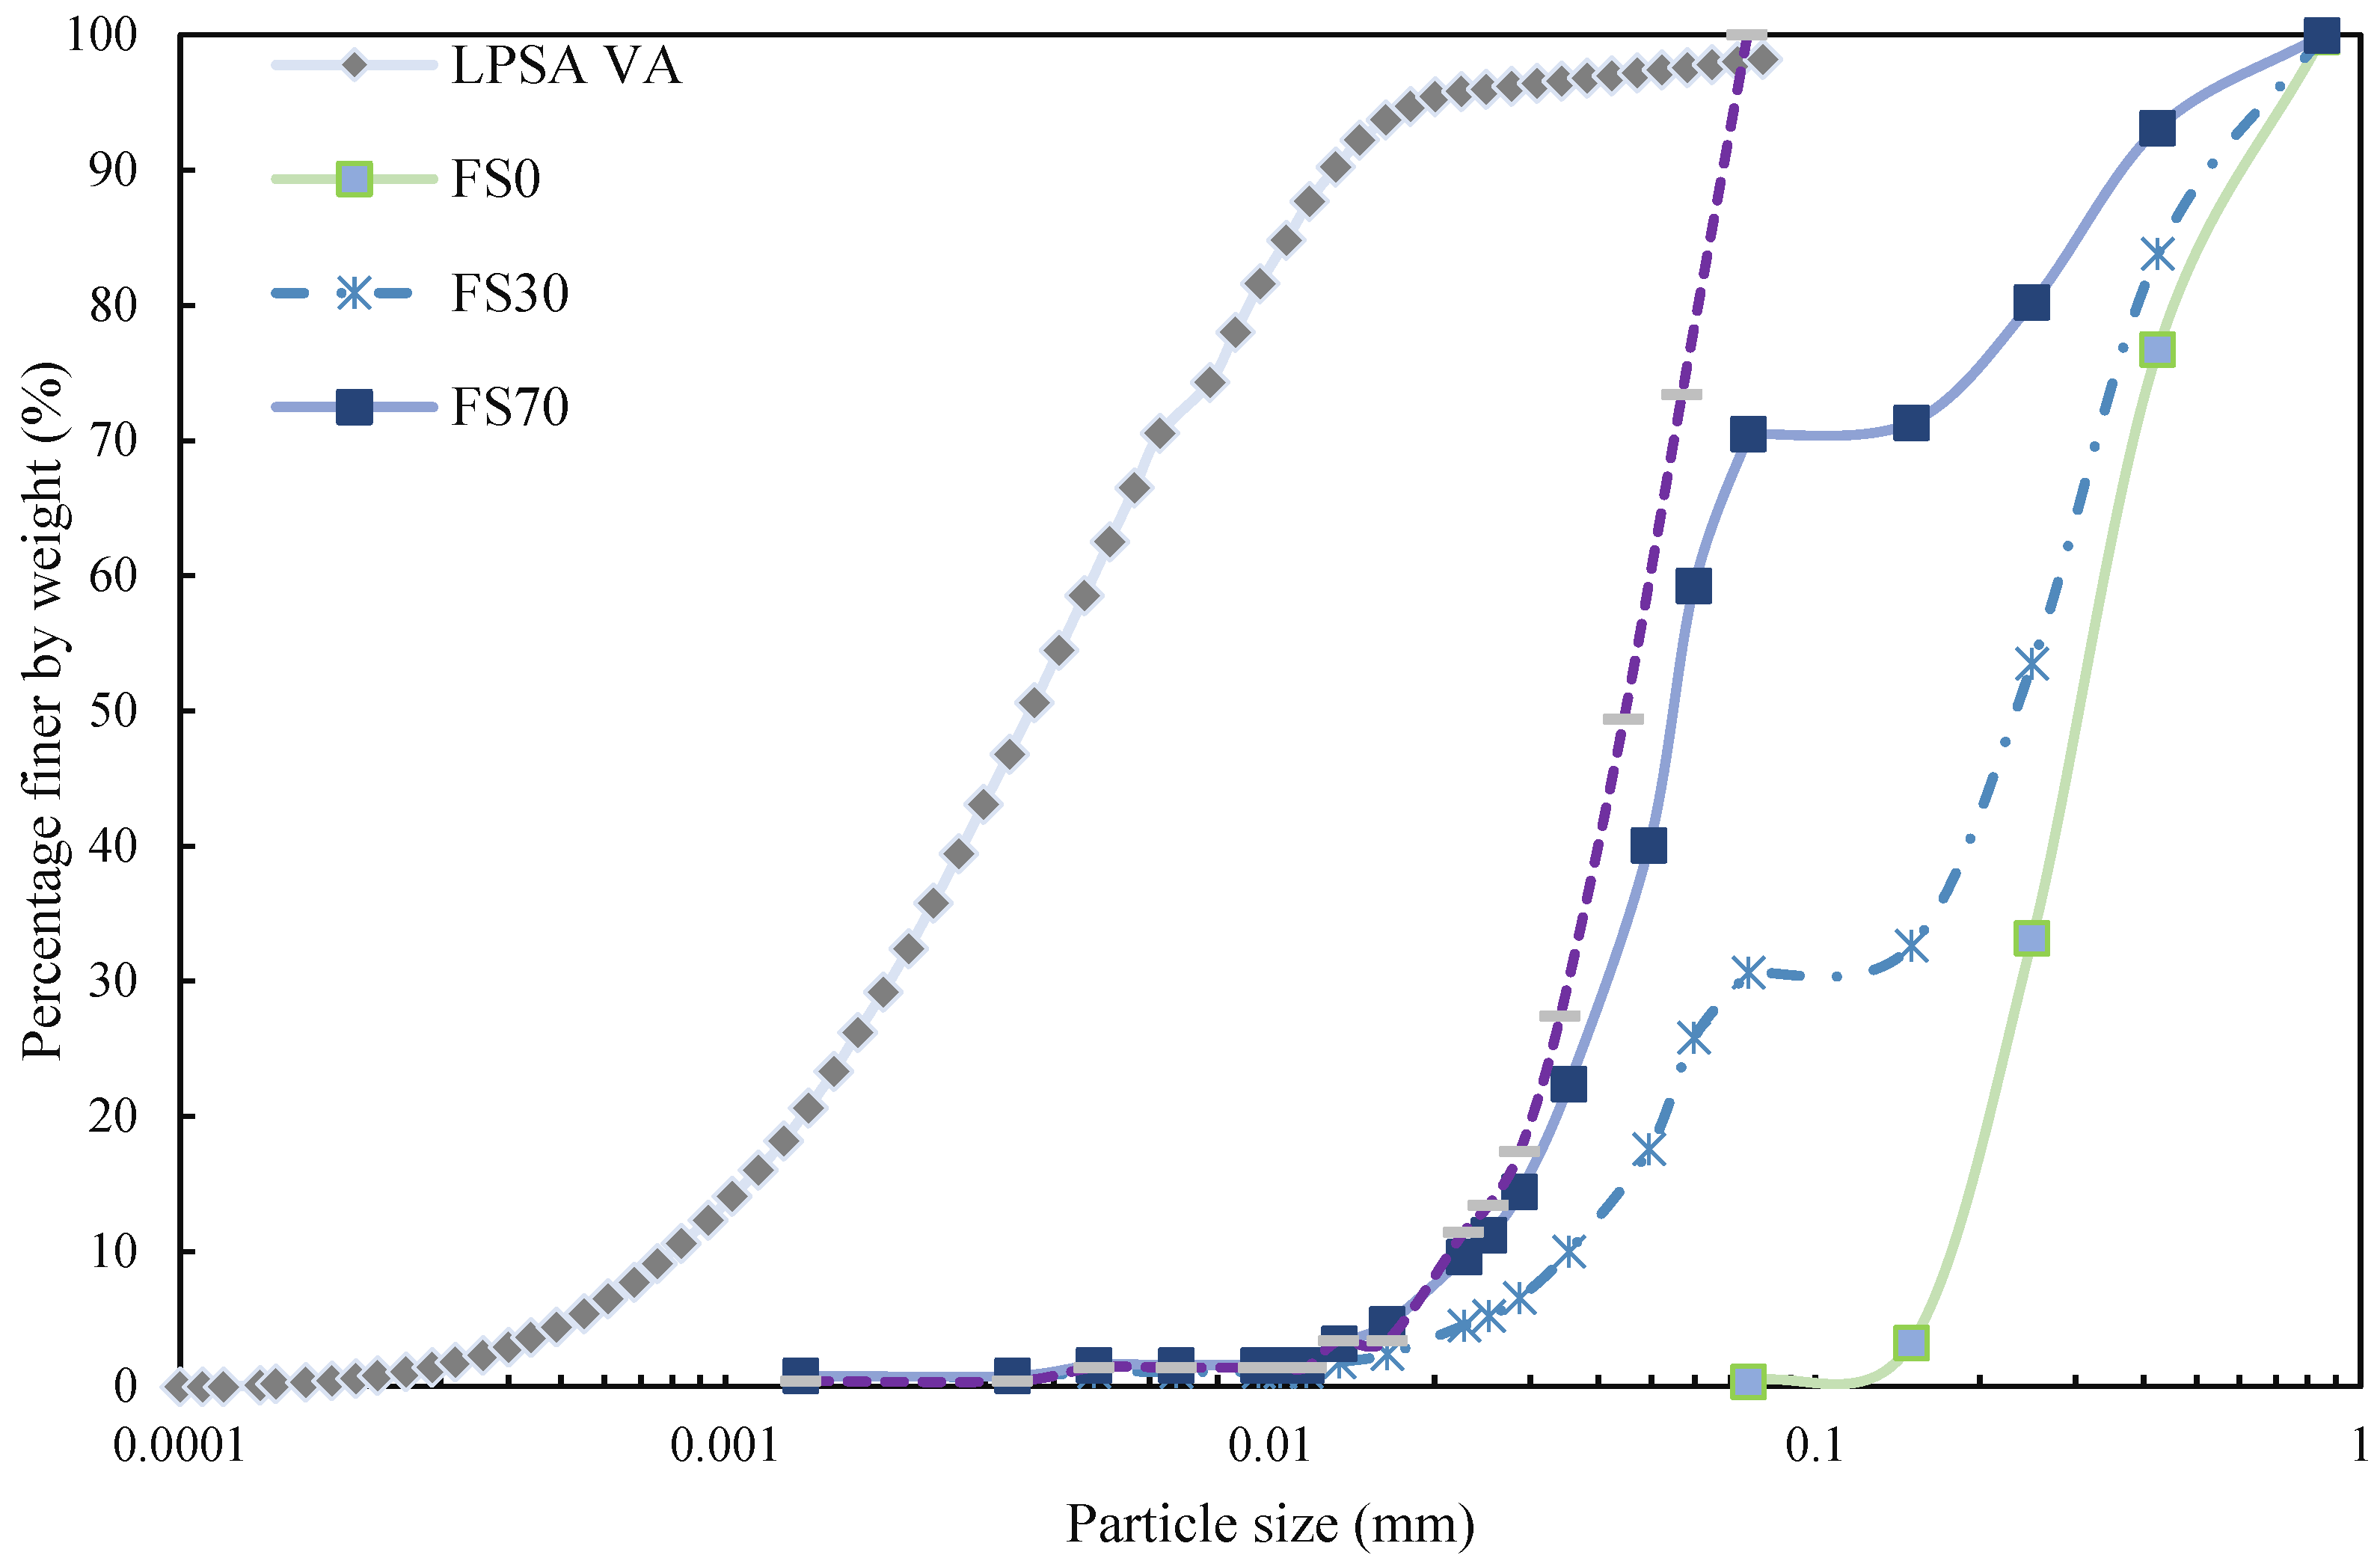
2.1. Materials

Soil mineralogy, particle size, and particle shape are the parameters that may affect the strength of artificially cemented soils [26]. To evaluate the effect of variation in porosity on the strength of the cemented soil, two different geopolymeric-treated soil samples (having diverse gradation curves and fines contents) were used. The two soils used were fine silty sand and non-plastic silt that originated from the same source, and hence had the same mineralogy and particle shape. The soil samples were prepared by mixing a non-plastic silt and standard Firoozkuh sand from the same origin. The soils were named based on the amounts of their fines content (30 and 70 percent) as the percentage of the total soil weight, following the term FS (Firoozkuh Soil). The particle size gradation curves for silt and sand were determined by hydrometer (ASTM D7928-17) and sieve analysis (ASTM D6916-04) tests, respectively (Figure 1).
The volcanic ash (VA) used as the aluminosilicate precursor of geopolymer was collected from the Taftan mountain, southeast of Iran. The gradation curve for the volcanic ash was determined by performing laser particle size analysis (LPSA) (Figure 1). The chemical composition for the sand and volcanic ash is summarized in Table 1.
The alkaline activator (AA) used in this study was an 8 molar sodium hydroxide solution prepared by gradual addition of distilled water to sodium hydroxide powder at their predetermined weights. Due to the exothermic nature of the reaction, it was prepared 24 h before geopolymer paste preparation to allow enough time to adapt to the ambient temperature (25 ± 2 °C). The geopolymer paste was prepared by adding the predetermined amount of volcanic ash to the alkaline activator and mixing for 5 min to obtain a homogenous mixture. The conventional 1 phase (1P) method, in which the alkaline activated binder and soil are mixed together, was employed for geopolymer preparation and soil treatment [5].

2.2. Methods

Modified Proctor compaction tests were performed on the FS30 soil and its combination with different amounts (2.5, 5, and 10 percent) of volcanic ash by the weight replacement method (ASMT D 1557-12e1).
Soil trays (having dimensions 100 × 100 × 40 mm) were filled with soil by the air-pluviation method based on the calculated soil content, and the surface of the soil was smoothed to the highest level. The porosity of each soil sample is identified in Table 2. Then, the predetermined weight of geopolymer paste was sprayed vertically at a steady rate and from a constant distance to the soil’s final surface. In this study, all the geopolymerically treated samples (either cylindrical specimens or tray soils) were placed in an oven having a temperature of 60 °C and 5% relative humidity to be cured for 7 days. A cylindrical needle (penetrometer) having a diameter of 6 mm was attached to a loading machine to perform surface penetration tests at a loading rate of 1 mm/min. The surface penetration tests lasted until a failure or rupture occurred in the surface-crusted samples (soil trays). The final results of surface penetrometer tests include the average of three different surface penetration tests and the standard deviation of each result is specified for the data.
To measure the viscosity of paste with various binder/activator ratios (ranging from 0.17 to 0.67 as mentioned in Table 3), a rotational rheometer (DVII+pro, Brookfield Engineering Laboratories, MA, USA) was employed. By pouring the alkaline activator in a cup and gradual addition of volcanic ash, the mixture was mixed for 5 min to reach a uniform combination. The viscosity of the uniform geopolymeric mixture was measured after a one-minute resting period. Using the rotational speed of the rheometer escalating from 0 to 44 (1/s) at a constant rate and for 10 min, the viscosity of the mixtures was measured at specific rotational rates that were kept constant for 10 s. The exerted shear rate of the fluid was increased in steps until it reached the highest rate of 44 (1/s). Thereafter, it decreased in the same steps. This procedure was performed in accordance with previous studies [27,28,29]. The average value for ascending and descending phases for each sample (2 phases) is reported as the result for geopolymer viscosity [10]. The cylindrical specimens were prepared for studying the uniaxial compressive strength of geopolymerically treated soil samples at different porosities. The two-half cylindrical lubricated molds having a diameter-to-height ratio of 1:2 (height = 76 mm and diameter = 38 mm) were attached to each other using a metal fastener, which facilitated unmolding the cylindrical soil-geopolymer specimens. The method used was the same as that for the soil surface treatment, except that, for cylindrical specimens, the activated precursors were added to the soil by hand mixing instead of surface spraying.
To study the effect of porosity on the crust thickness, and the surface strength of geopolymer-stabilized soils, different porosity values were selected (Table 2). A range of 34%–40% was previously reported as a common index for the porosity of sandy soils susceptible to wind erosion [4]. The studied porosities were chosen in a way to include the mentioned range for porosity of wind erosive soils.
The soil porosity should be kept constant when studying other parameters in geopolymer mix design. Therefore, both the surface and cylindrical specimens were prepared based on their dry unit weight, which was calculated by Equations (1) and (2):
e = n 1 n
γ d = ( G s   Y w e + 1   )
where n is the porosity of the soil-binder, Gs is the specific gravity of the soil-binder, γ w . is the unit weight of water, γ d is the dry unit weight of the soil-binder, and e is the void ratio of the soil-binder. Based on the estimated dry unit weight, the soil weight was calculated according to the binder content and the employed mold dimensions (cylindrical mold for compressive strength and trays for surface penetrometer tests). Soil geopolymer pastes were hand mixed for 5 min to make a homogenous combination. Afterward, the geopolymer-treated specimens were prepared in 5 layers in a cylindrical steel mold. The samples were then removed from the mold one hour after preparation and cured in an oven (60 °C and 5% relative humidity). Using a monotonic displacement control method with a constant loading rate of 0.5 mm/min, the cylindrical soil-geopolymer specimens were loaded. Each reported final UCS result is the average of three identical maximum compressive strength values of cylindrical specimens. The procedures, material, and equipment used for preparation of both the surface and cylindrical specimens in this study are the same as those used in a previous study [5].
Scanning Electron Microscopy (SEM) (XMU, VEGA\\TESCAN, Brno, The Czech Republic) was used to study the morphology and microstructural characteristics of the geopolymer-treated FS70 soil sample. Moreover, the results of Energy-Dispersive X-ray Spectroscopy (EDX) (EDS, VEGA\\TESCAN, Brno, The Czech Republic) were employed for a quantitative chemical analysis of the available elements in the soil.

3. Results and Discussion

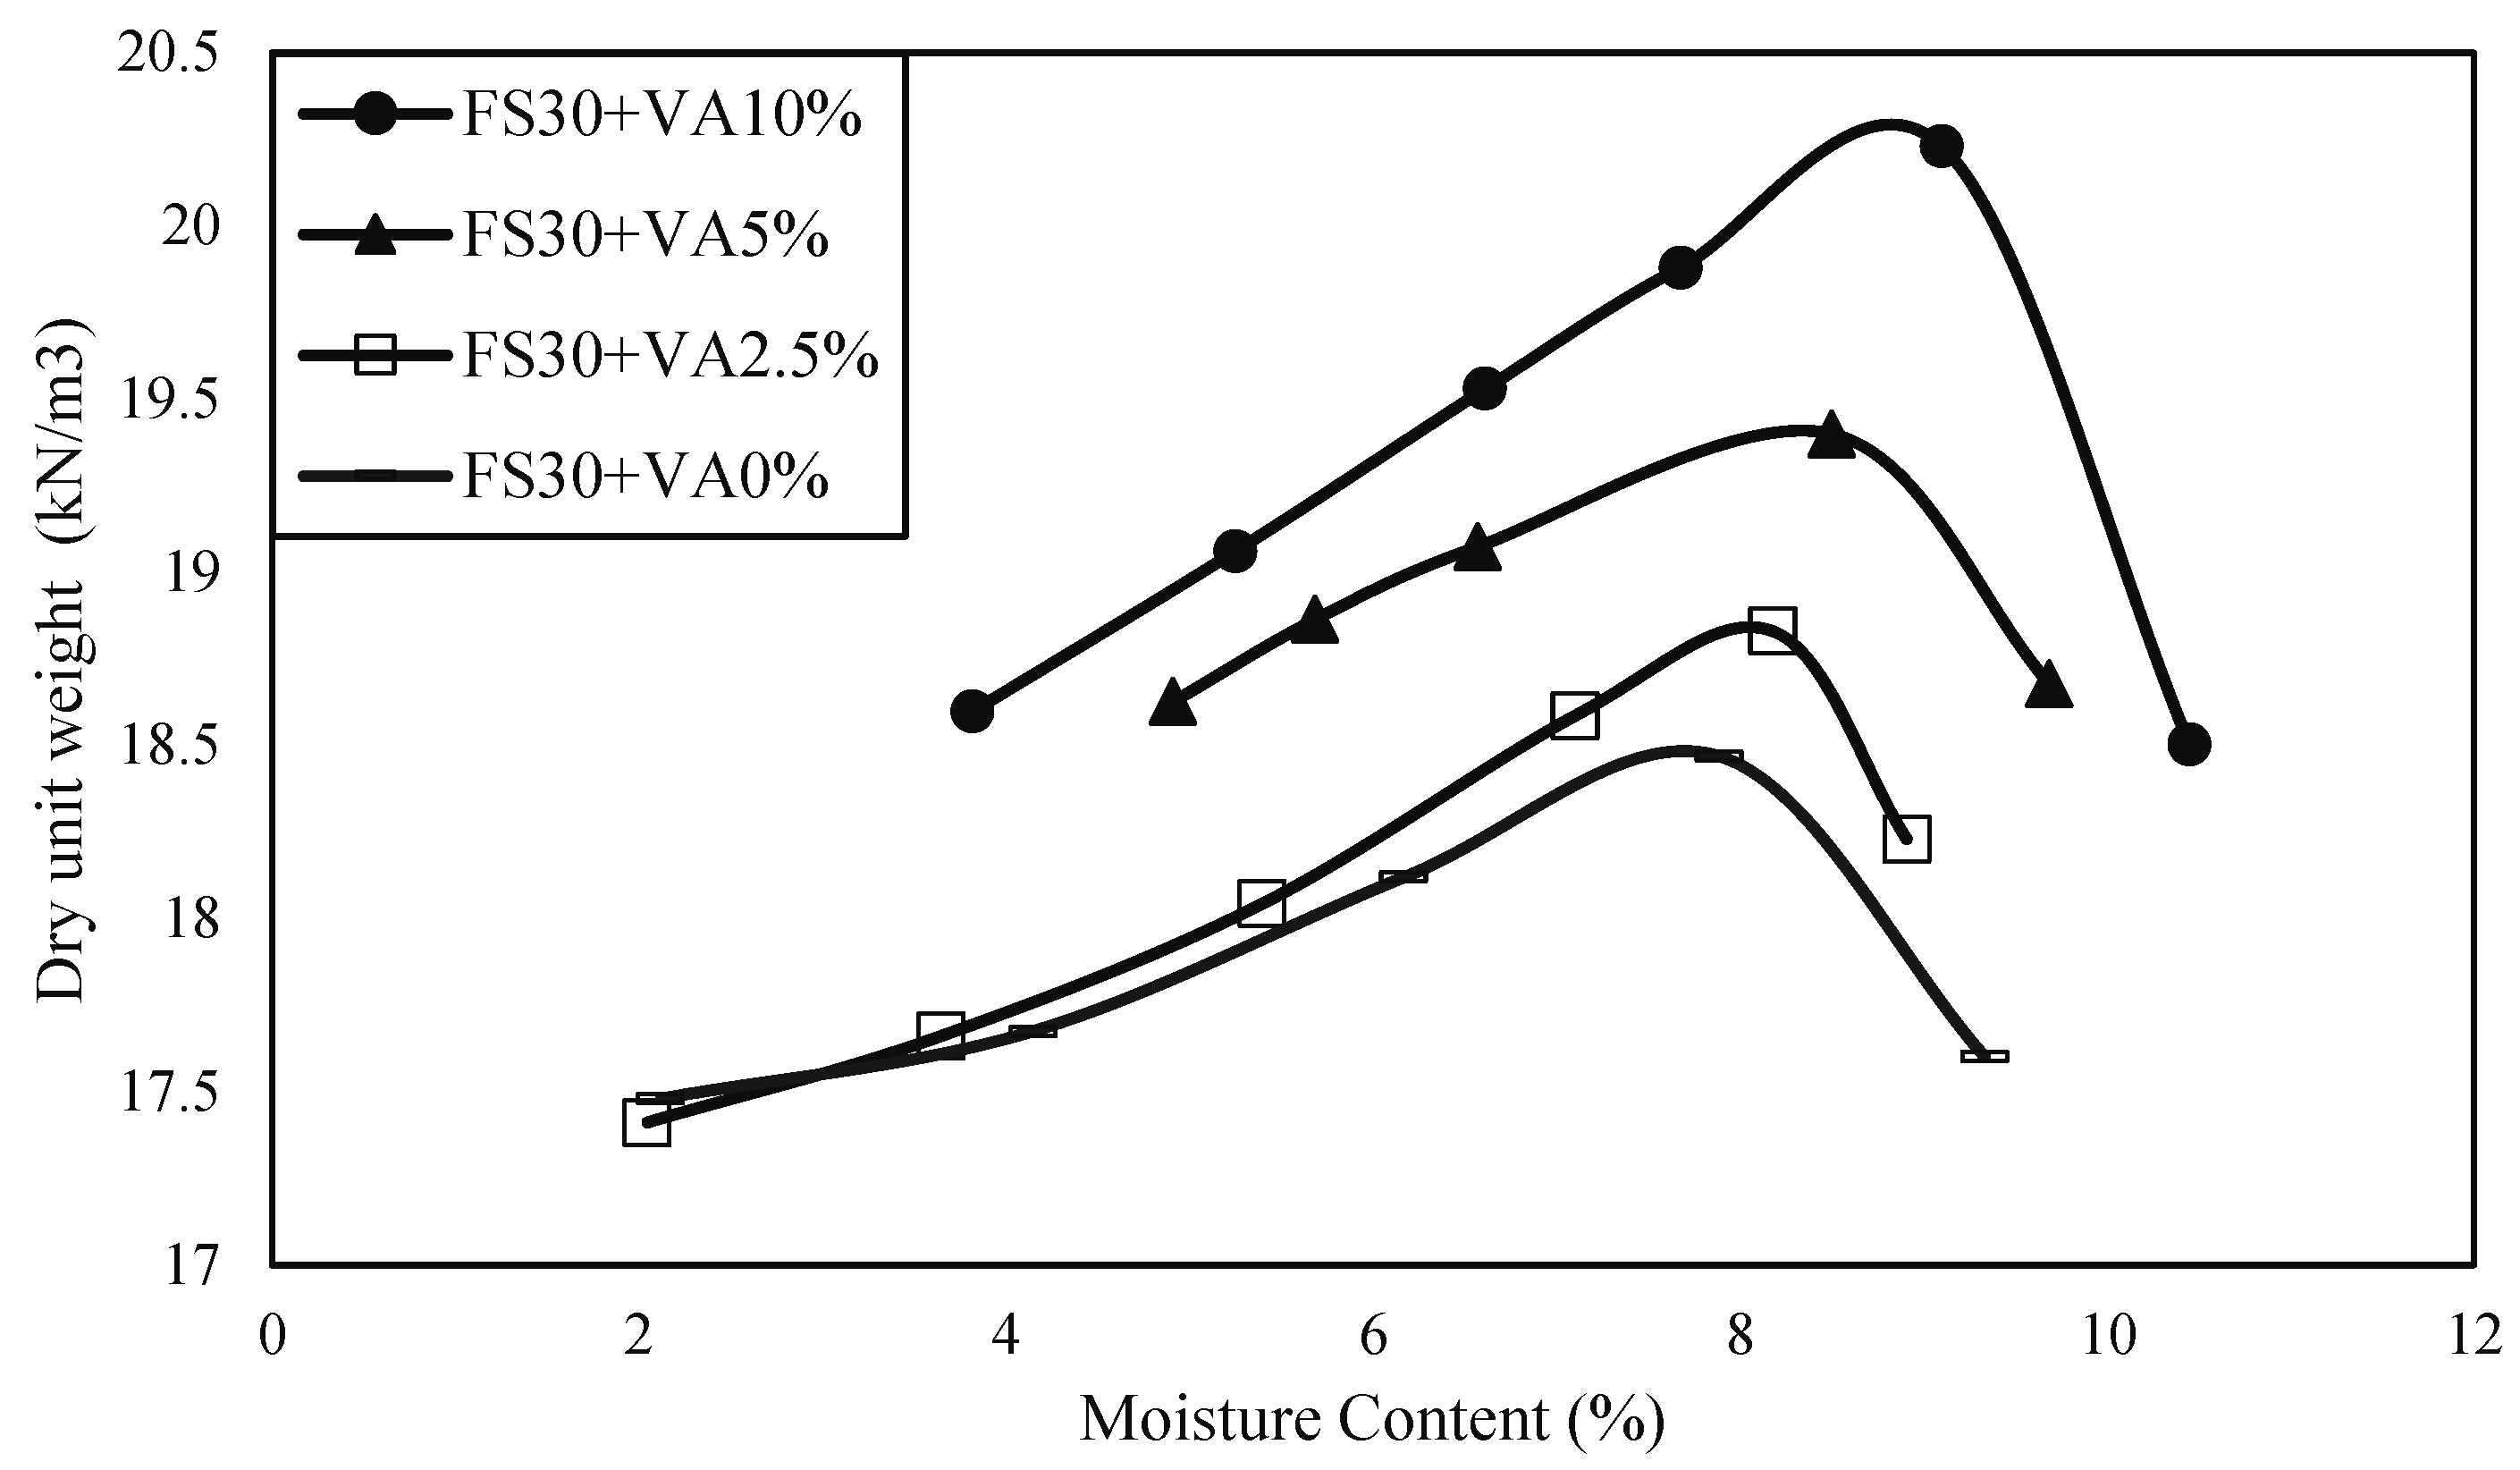
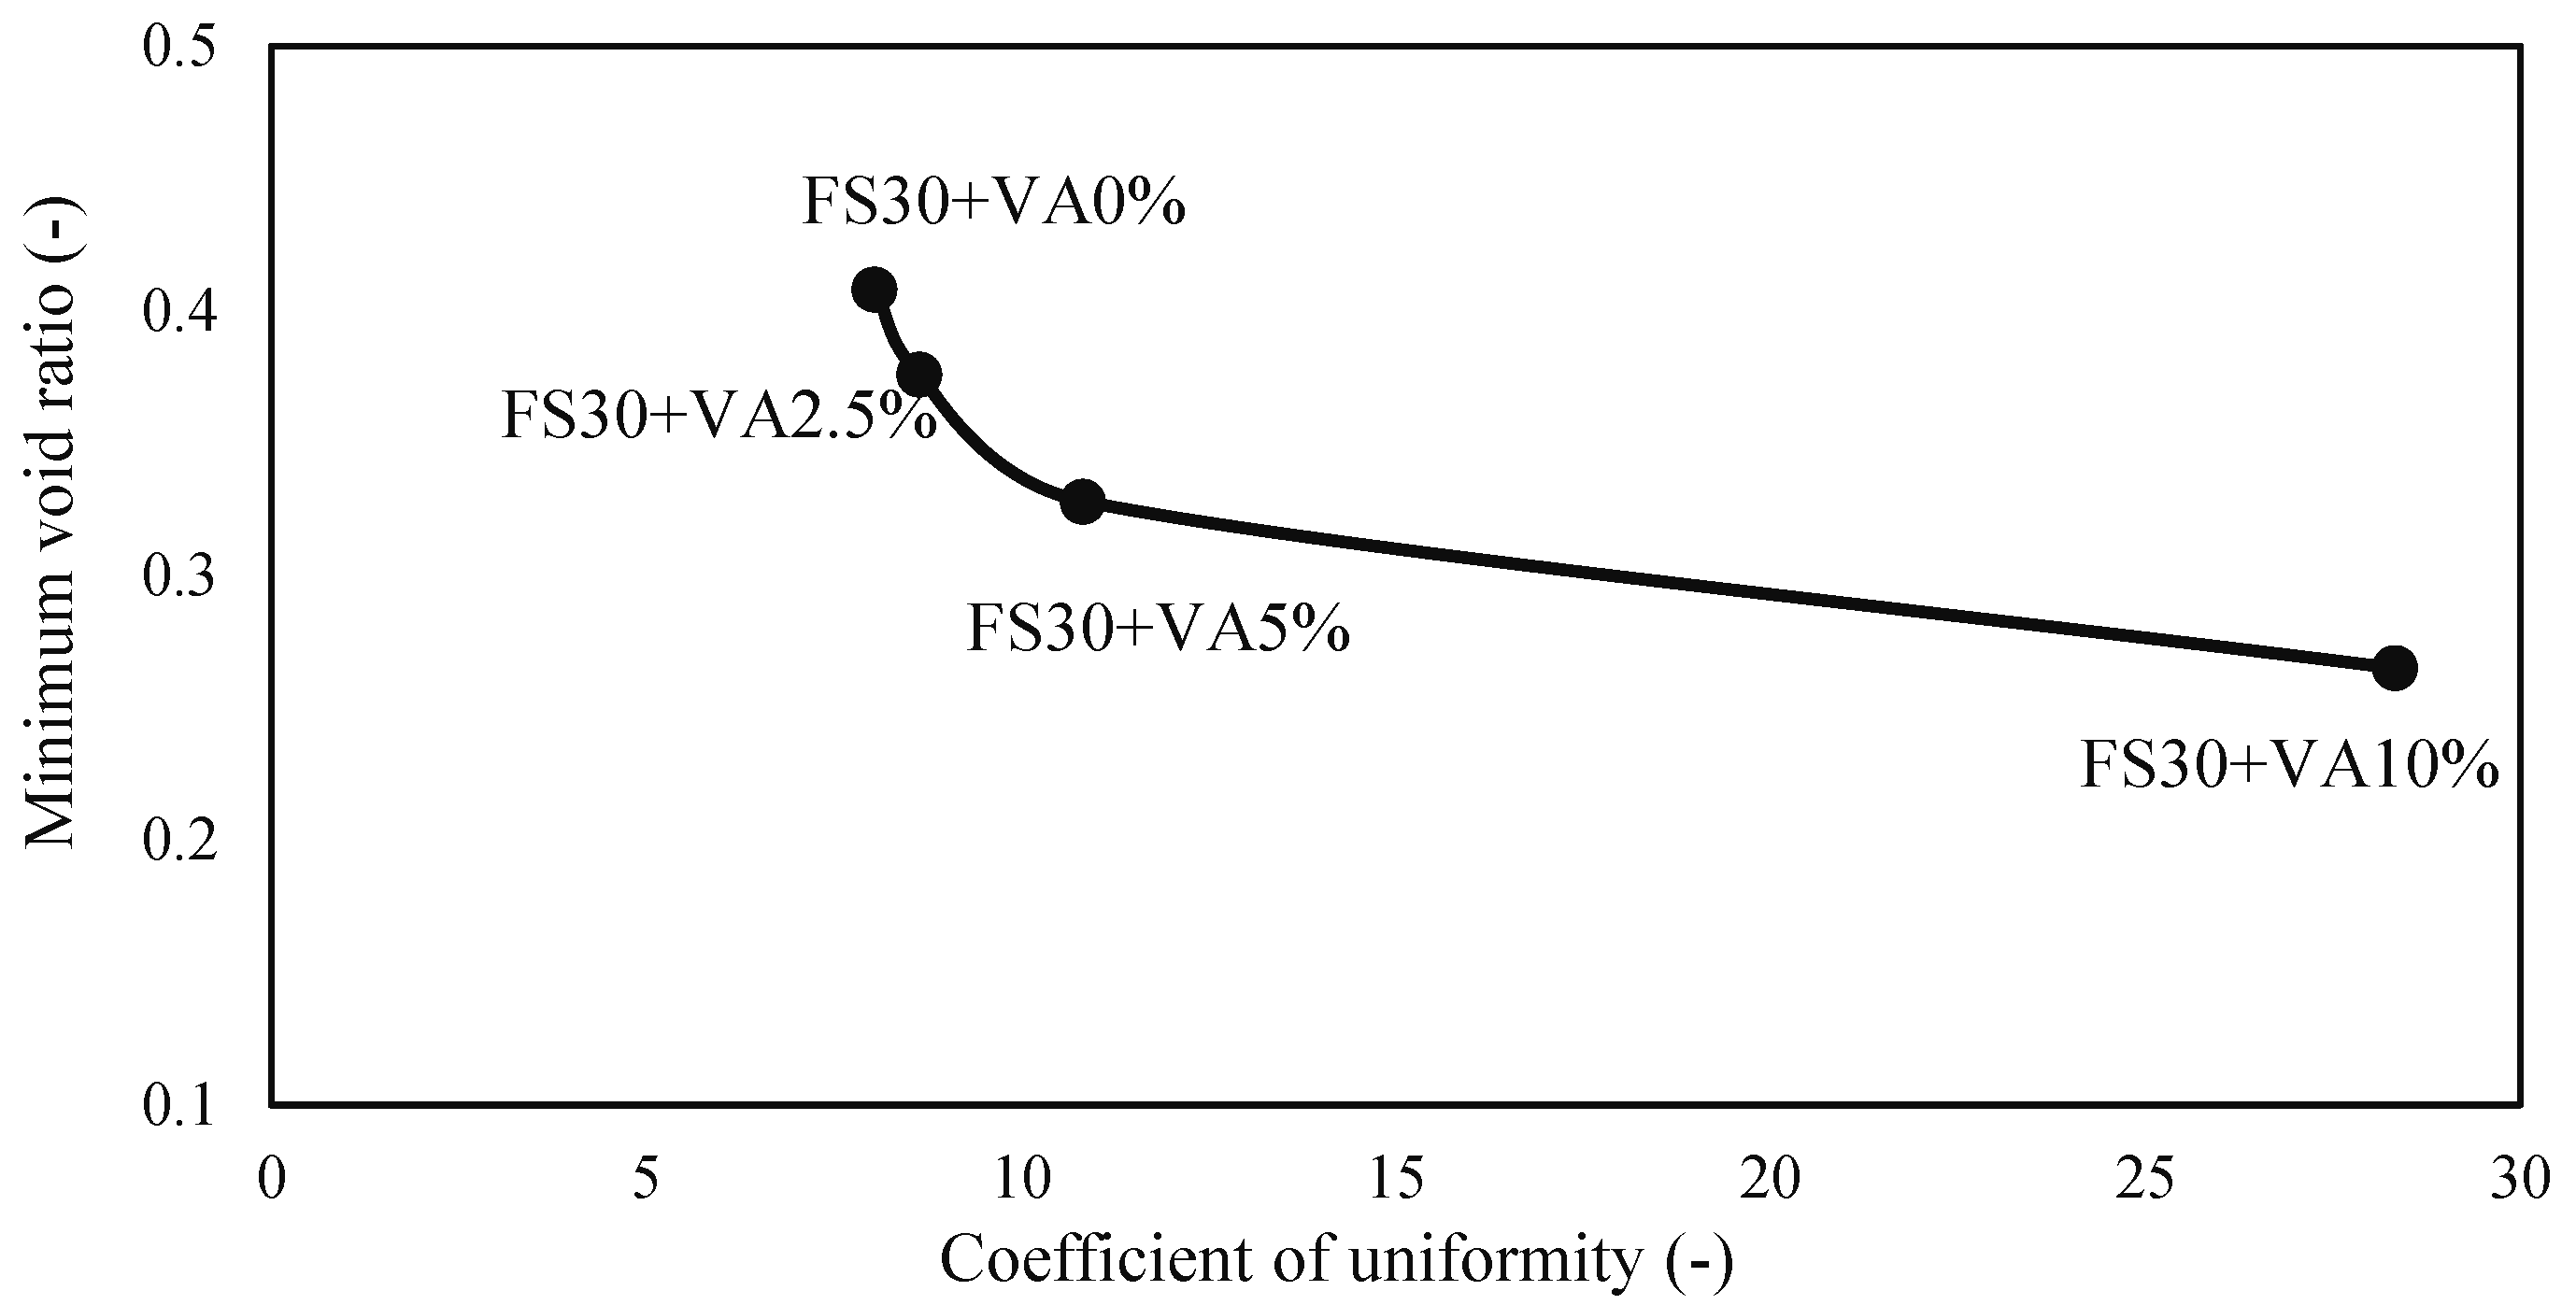
3.1. Modified Proctor Tests (Effects of Binder Addition)

Adding assorted amounts of volcanic ash (2.5%, 5%, 10%) to FS30 is influential on the packing structure of the specimens (Figure 2). The ascending trend for the maximum dry unit weight is discernible by the growth in the binder content (Figure 2). The discrepancies in the maximum dry unit weight can be explained by the coefficient of uniformity for FS30 samples with different amounts of binder, as depicted in Figure 3. The addition of binder resulted in an increase in the maximum dry unit weight (and hence a decrease in minimum void ratio) due to the increase in the value of coefficient of uniformity; that is, by adding the fine binder to the soil, its capability of being compacted was amplified and the volcanic ash particles acted as a soil void filler. Moreover, a minor increase in optimum moisture content may be related to the rising of water demand of the soil-binder mixture by the addition of volcanic ash to the soil. The minor moisture content increments may be attributed to the negligible amount of CaO in the volcanic ash chemical composition [22].

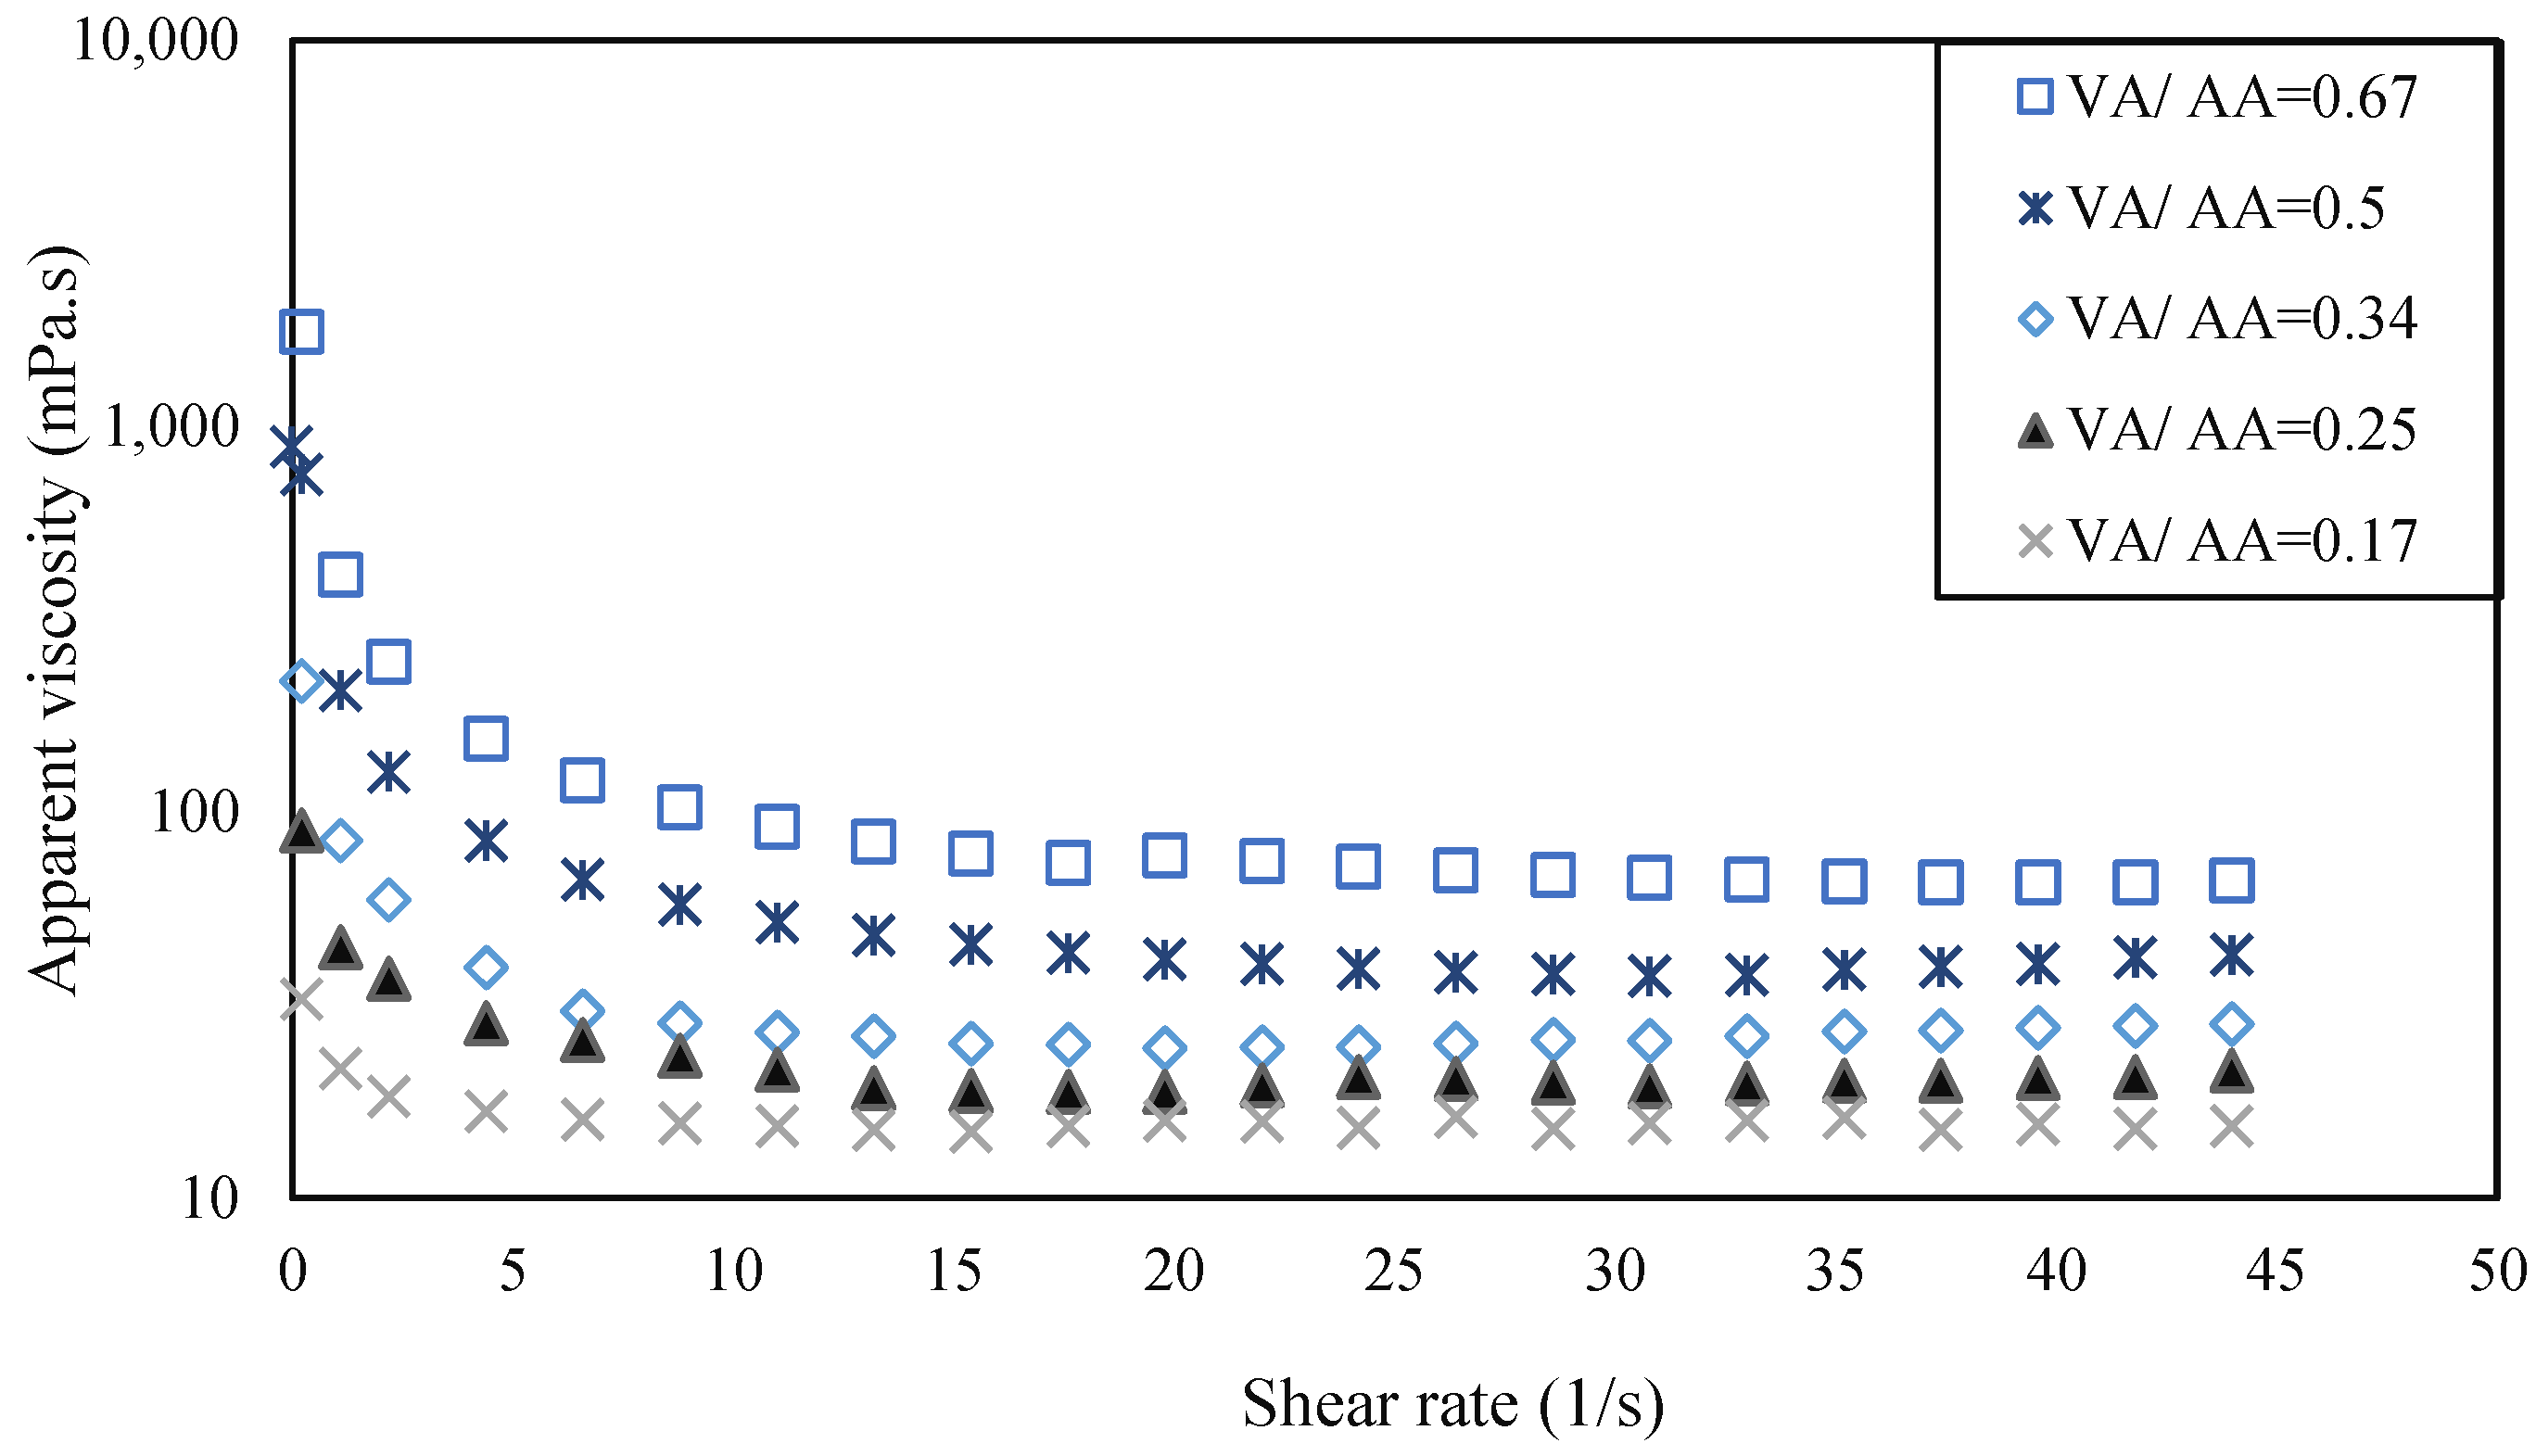
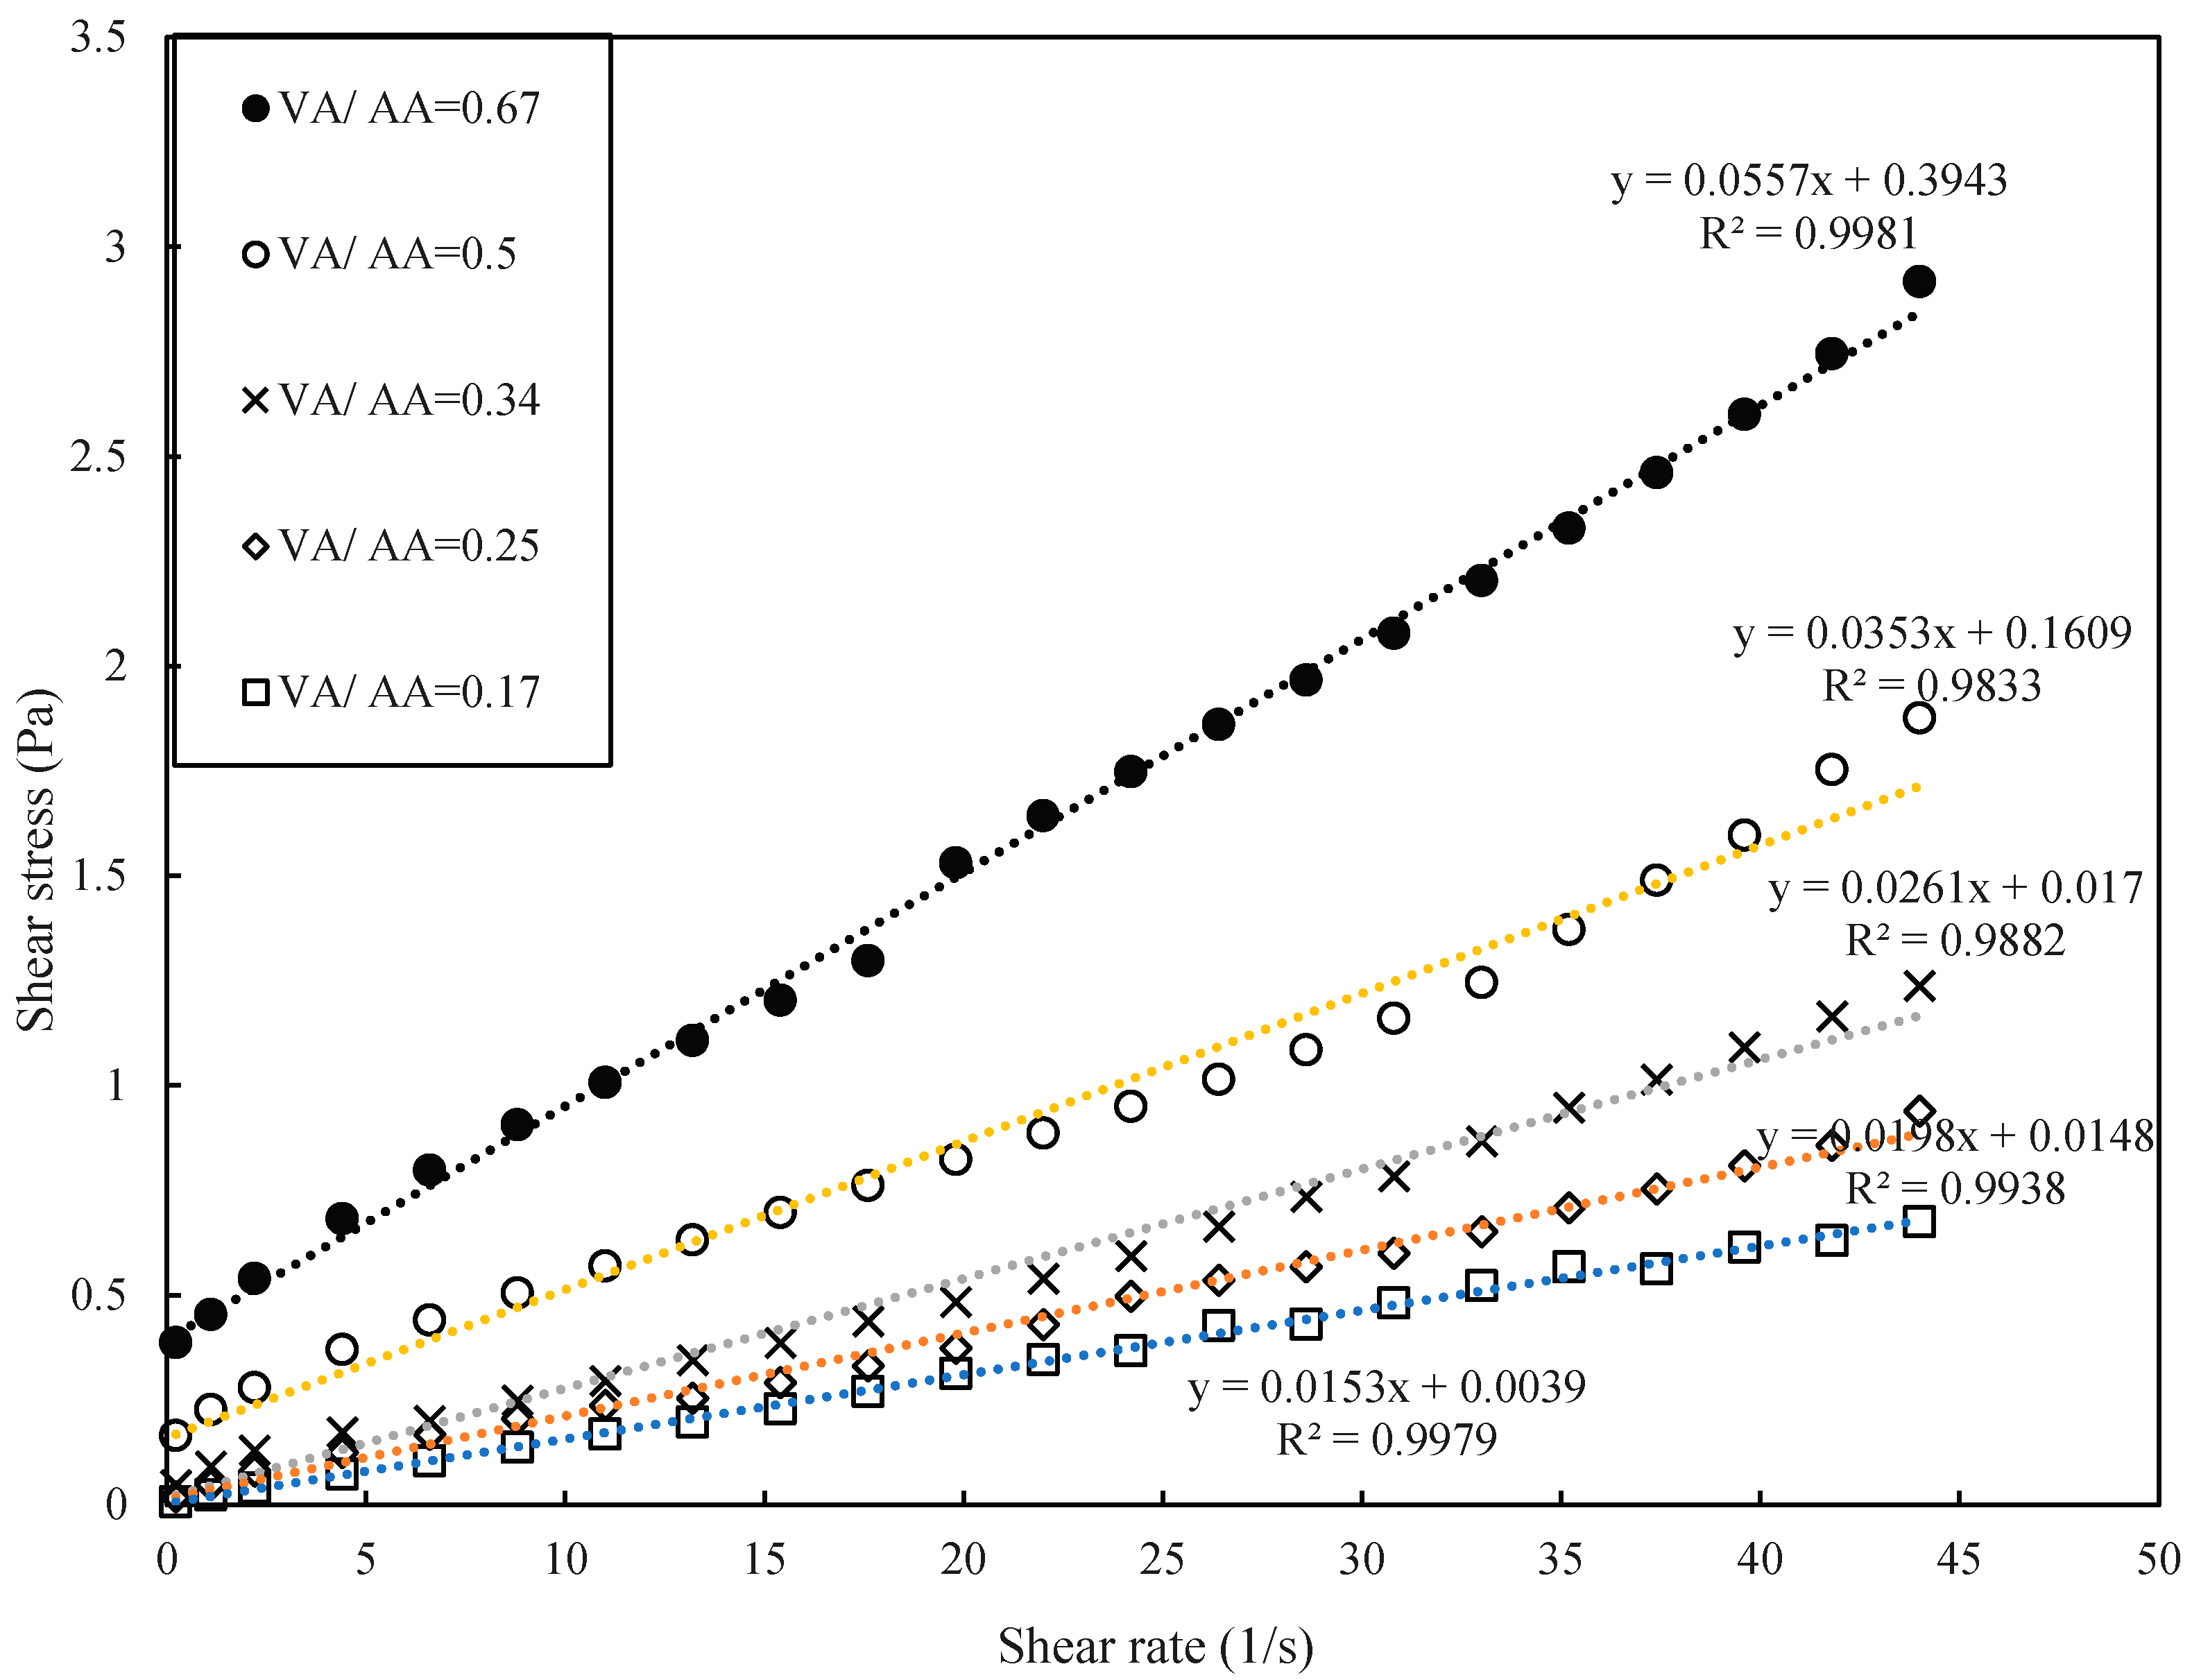
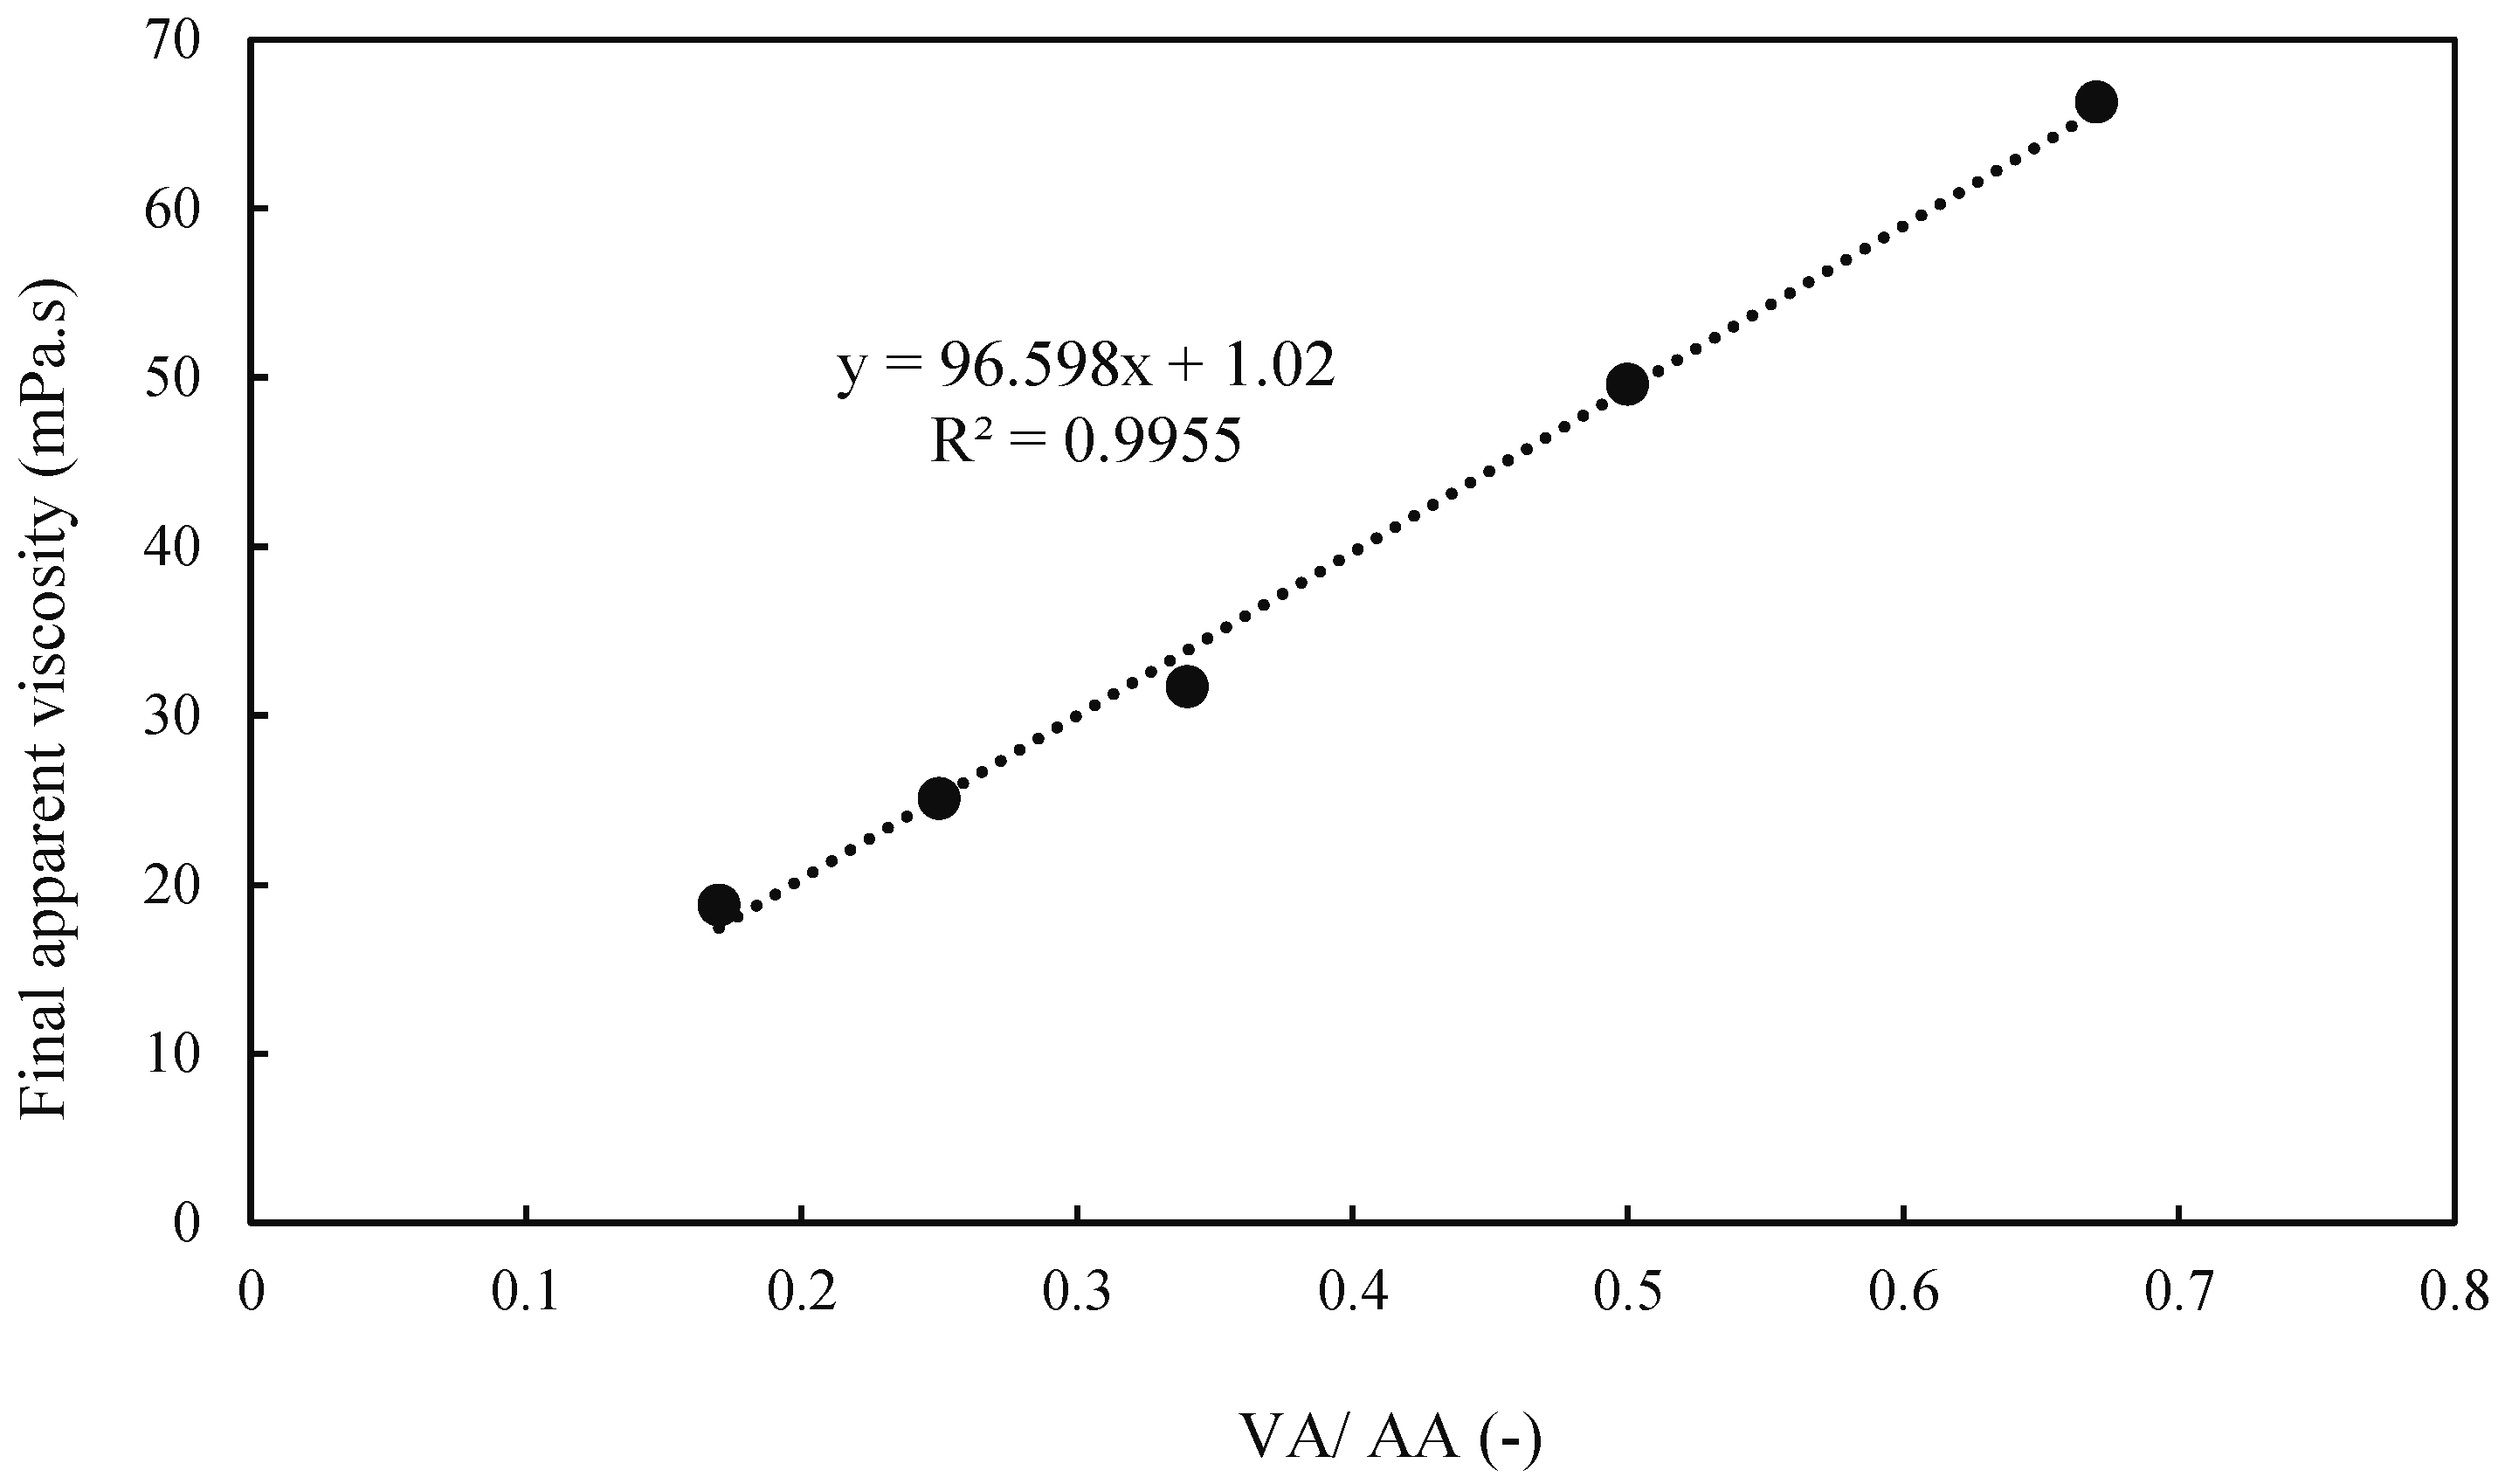
3.2. Rheological Examination

The penetration depth of a stabilizer inside soil voids is highly dependent on its rheological features [30]. In this section, the rheological parameters of geopolymers having different mix designs (assorted volcanic ash to alkaline activator solution ratios of 0.65, 0.5, 0.34, 0.25, 0.17) are evaluated. The effects of mix design variation on the apparent viscosity and shear stress of studied paste samples are depicted in Figure 4 and Figure 5, respectively. For all the existing volcanic ash-based geopolymer samples, non-Newtonian behavior is apparent, which signifies viscosity reduction by increasing the shear rate (Figure 4). Due to the reduction in viscosity by increasing the shear rate, the observed shear-thinning trend seems to be a favorable rheological behavior for pastes.
By increasing the shear rate exerted on the fluid through mixing machines during the process of using geopolymer for soil surface stabilization, the fluid’s viscosity is diminished and this may decrease the energy required for pumping the stabilizer on the soil surface.
By observing the variations in shear stress–shear rate, a shear-thinning behavior for all the studied geopolymeric specimens is clear. In this manner, the escalation of the shear stress by increasing the shear rate is evident (Figure 5). The overall behavior of the considered volcanic ash-based geopolymer is in agreement with the previous studies in terms of the rheological behavior of geopolymers with various types of precursors [30,31]. The reduction of plastic viscosity and yield stress of VA-based geopolymer pastes by increasing the amount of NaOH alkaline activator may be ascribed to the trellis effect of volcanic ash particles [10].
A linear correlation between final apparent viscosity and the ratio of volcanic ash to alkaline activator (VA/AA) with a COD (coefficient of determination) value of 0.99 is shown in Figure 6. It is evident from the figure that the apparent viscosity of geopolymeric pastes increased by increasing the binder to solution ratio. Many models have been developed to represent the behavior of non-Newtonian fluids [29]. It was stated earlier in this study that different types of alkaline-activated pastes do not adhere to the same rheological model. The Bingham model (Equation (3)) is a popular model that has shown great consistency with the behavior of alkali-activated cement having various types of precursors [32,33].
τ = τ 0 + μ . γ ˙
In this equation, γ ˙ , µ, τ, and τ0 are shear rate (1/s), plastic viscosity (Pa.s), shear stress (Pa), and yield stress (Pa). As shown in Figure 5 and Table 4, it is evident that the rheological behavior for all the studied geopolymeric pastes is compatible with the Bingham model having COD of more than 0.98.

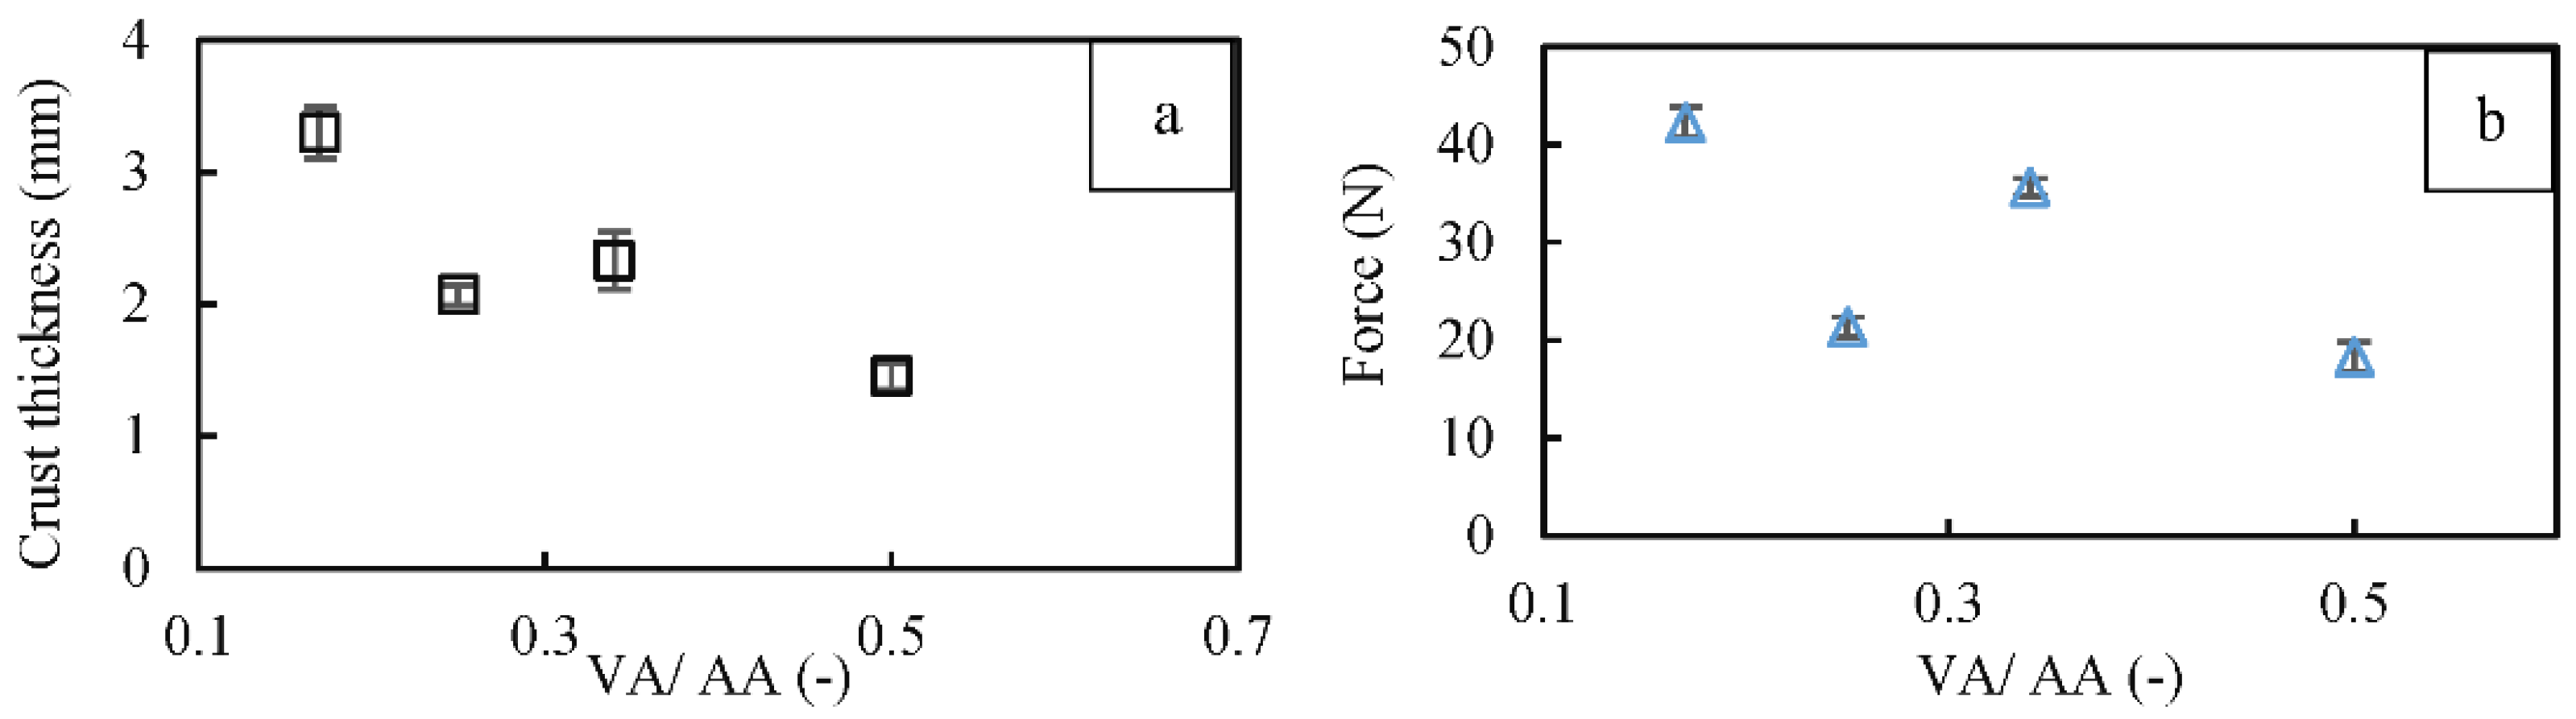
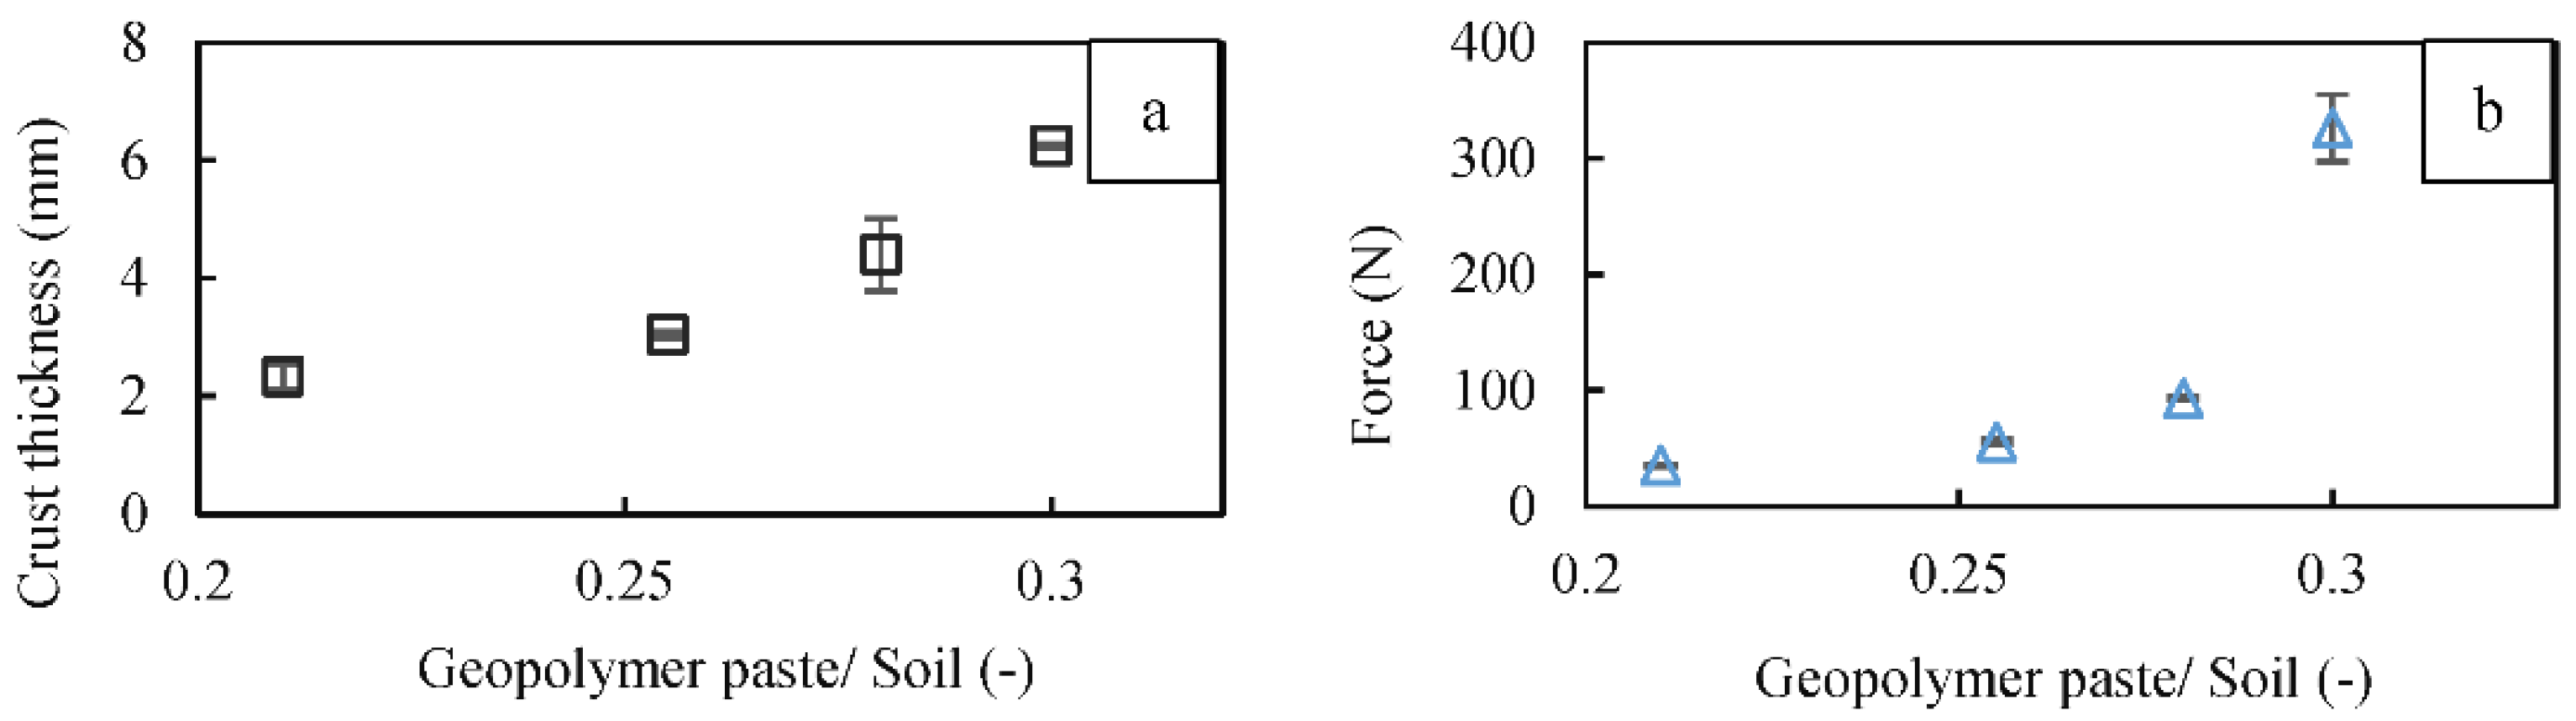
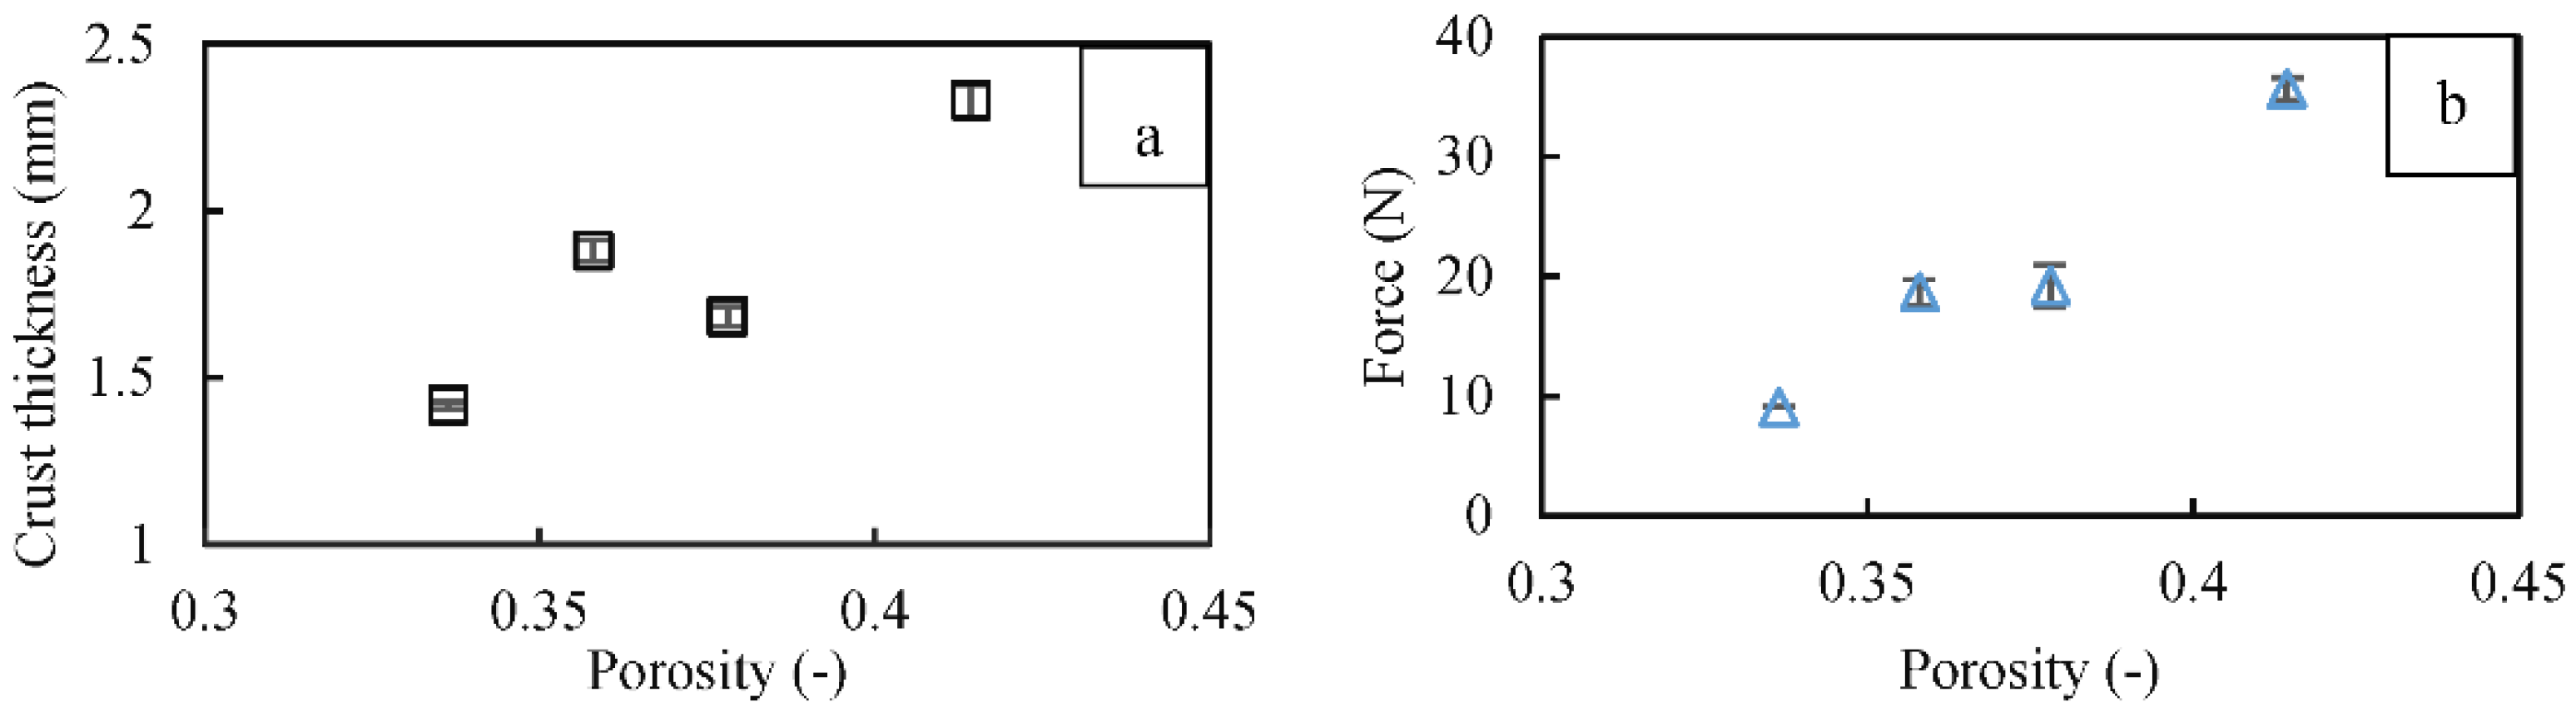
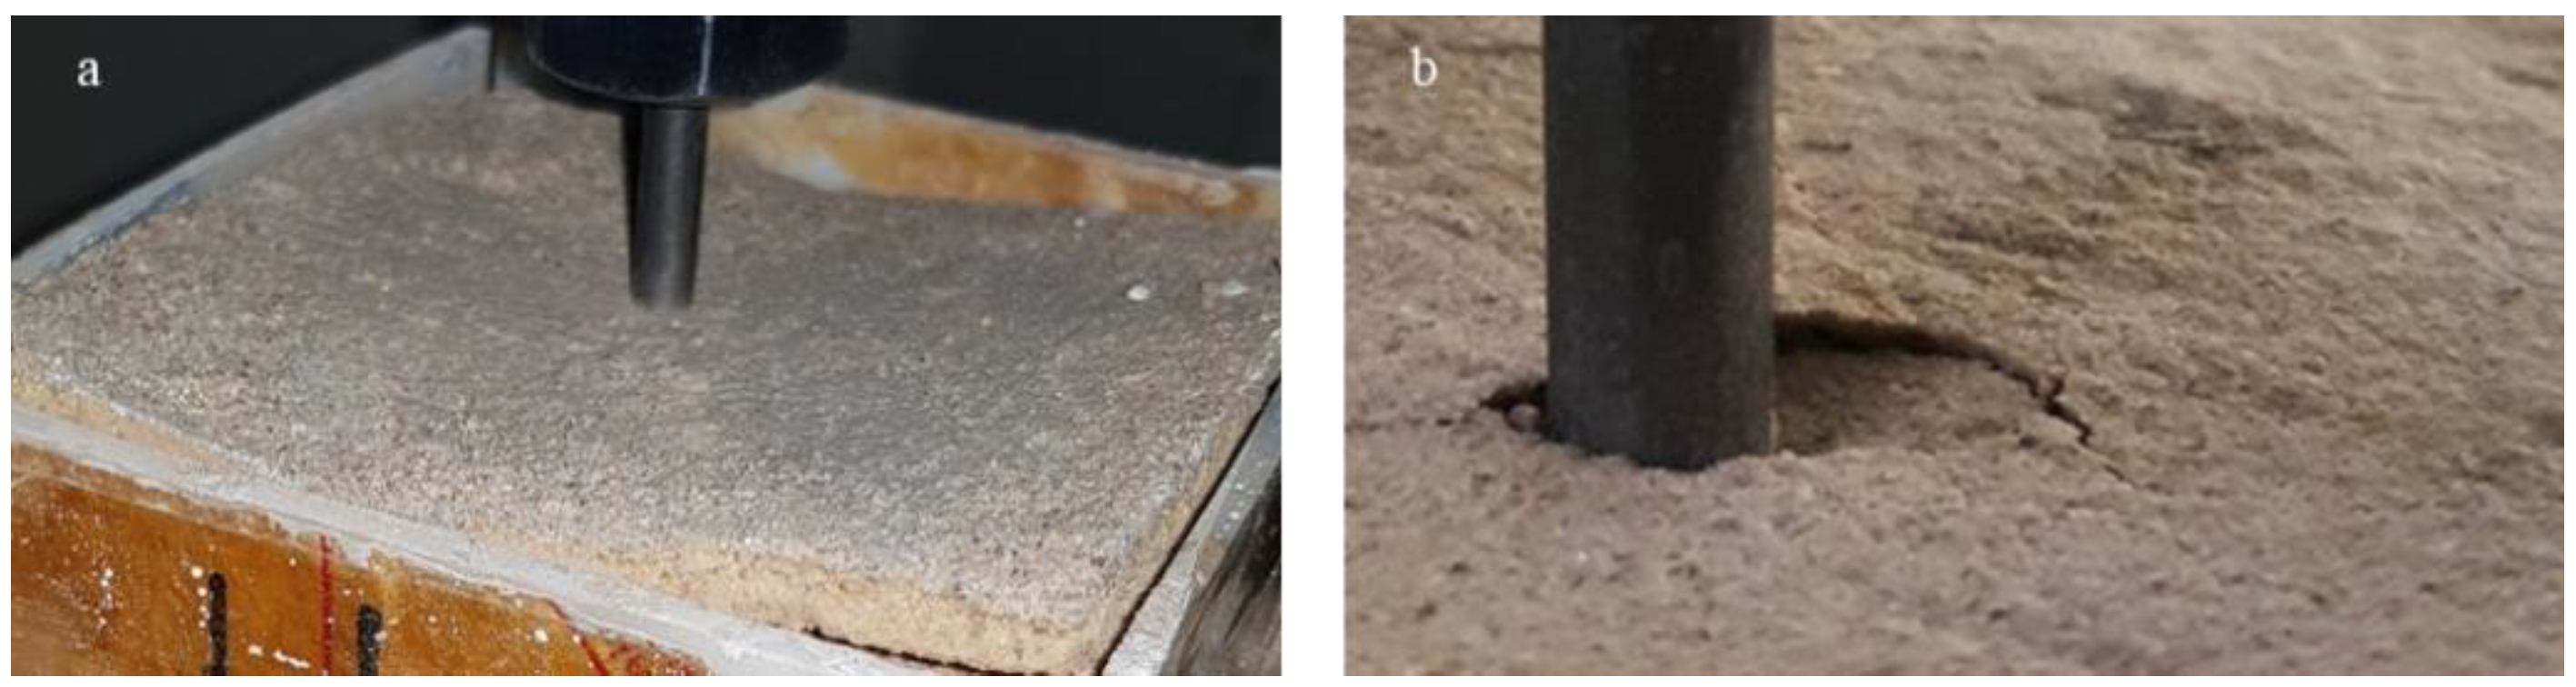
3.3. Surface Penetrometer Tests

The surface penetration test has been widely recognized as a simple, precise, and applicable method for the quantification of topsoil crust strength [34]. The surface strength of a crusted soil plays a significant role in its wind erodibility [34,35]. Moreover, the infiltration depth of soil stabilizer agents is a key factor for soil surface treatment against wind erosion [34].
As the geopolymer paste was condensed by the addition of extra volcanic ash in proportion to the alkaline activator, the paste permeation into the soil voids was limited and the formed crust was diminished (Figure 7a). No vivid trend was found when studying the variation in surface strength of treated samples in surface penetrometer tests by changing the VA/AA ratio, as shown in Figure 7b. Consequently, it can be concluded that the surface strength of soils treated by the 1P method is not just influenced by the developed crust thickness.
It seems that the strength of the developed inter-particle bonds and the formed crust thickness affect the final strength of soil surface formations. Figure 7b also shows a greater surface strength for the samples having 15% alkaline activator (those with the VA/AA ratios of 0.17 and 0.34), compared to the other specimens (with 10% alkaline activator). The pronounced development of geopolymeric bonds between soil grains improved by increasing alkaline activator content at elevated temperature curing conditions was reported earlier. The present finding regarding the increased surface strength of specimens with 15% activator is in agreement with the results of uniaxial compressive strength of geopolymer-treated sandy soil samples [5].
The porosity and the binder content are influential parameters of the compressive strength of artificially treated soils with the same mineralogical characteristics [19,26]. Considering the available data and the ease of paste employment, the mix design including VA/AA equal to 0.34 was selected for the remaining tests to study the effect of geopolymer amounts and soil porosity on the crust and surface strength of stabilized soil samples. The effects of total amounts of geopolymer paste in proportion with topsoil weight on the crust development and the strength of surface-treated specimens are illustrated in Figure 8a,b, respectively. There is a clear increase in crust thickness with the addition of extra geopolymer to the soil surface (Figure 8a). Similarly, the crust development amended the surface strength of samples (Figure 8b). An almost 20 percent increase in the geopolymer content tripled both the formed crust thickness and the surface strength from circa 2 to 6 mm, and 50 to more than 300 N, respectively. This clarifies the importance of geopolymer content compared with the other considered factors.
As stated earlier in Section 2 (Methods and Materials), sandy soil trays having four different dry densities (different porosities) were prepared by the air pluviation method (Table 2). The permeation depth of geopolymeric paste into the soil surface was evaluated by the measurement of soil crust formations. It is clear from Figure 9a that increasing the porosity of the sandy soil improved the formed geopolymeric crust on the topsoil surface. The penetration resistance of soil crust was also evolved as depicted in Figure 9b. A decrease in the soil void ratio and porosity limited the required aperture for infiltration of alkaline activated volcanic ash particles into the soil surface and reduced the developed surface crust.
From Figure 7, Figure 8 and Figure 9 it can be concluded that the mix design and the formed topsoil crust are two major parameters that directly influence the soil surface strength. Accordingly, the effects of total geopolymer amount and soil porosity are reliant on the crust thickness.
By visual inspection of surface stabilized specimens during the penetrometer loading tests, two different failure modes were distinguished. All the samples with crust thickness of 2.35 mm or less, experienced a punching (local) failure mode, while for the remaining samples with crust thicknesses of more than 2.35 mm the failure mode was completely different. The complete failure which divided the entire developed surface crust into two or more pieces was seen to be the dominant failure mode for samples having more than 2.35 mm thicknesses. From Figure 10-a it is evident that the loading needle did not penetrate into the crusted topsoil layer, but made it twisted and distorted. On the other hand, the needle broke up and punched the thin crust into the intact soil layer beneath (Figure 10b). It is worth noting that the mentioned failure modes are the dominant failure modes that may be influenced by one another. For instance, the initiation of a punching failure may be followed by a whole failure across a crusted soil surface and vice versa.
No meaningful difference was found between the crust thickness and strength of FS30 and FS70 surface-treated samples with the same dry unit weight and geopolymeric mix design and concentration. The developed crusts for both the FS30 and FS70 soil samples were almost the same, having a thickness of 2.34 mm. The reason for this may be ascribed to the same porosity value of the two soil types, which provides identical passage for infiltration of geopolymer paste throughout the soil voids.

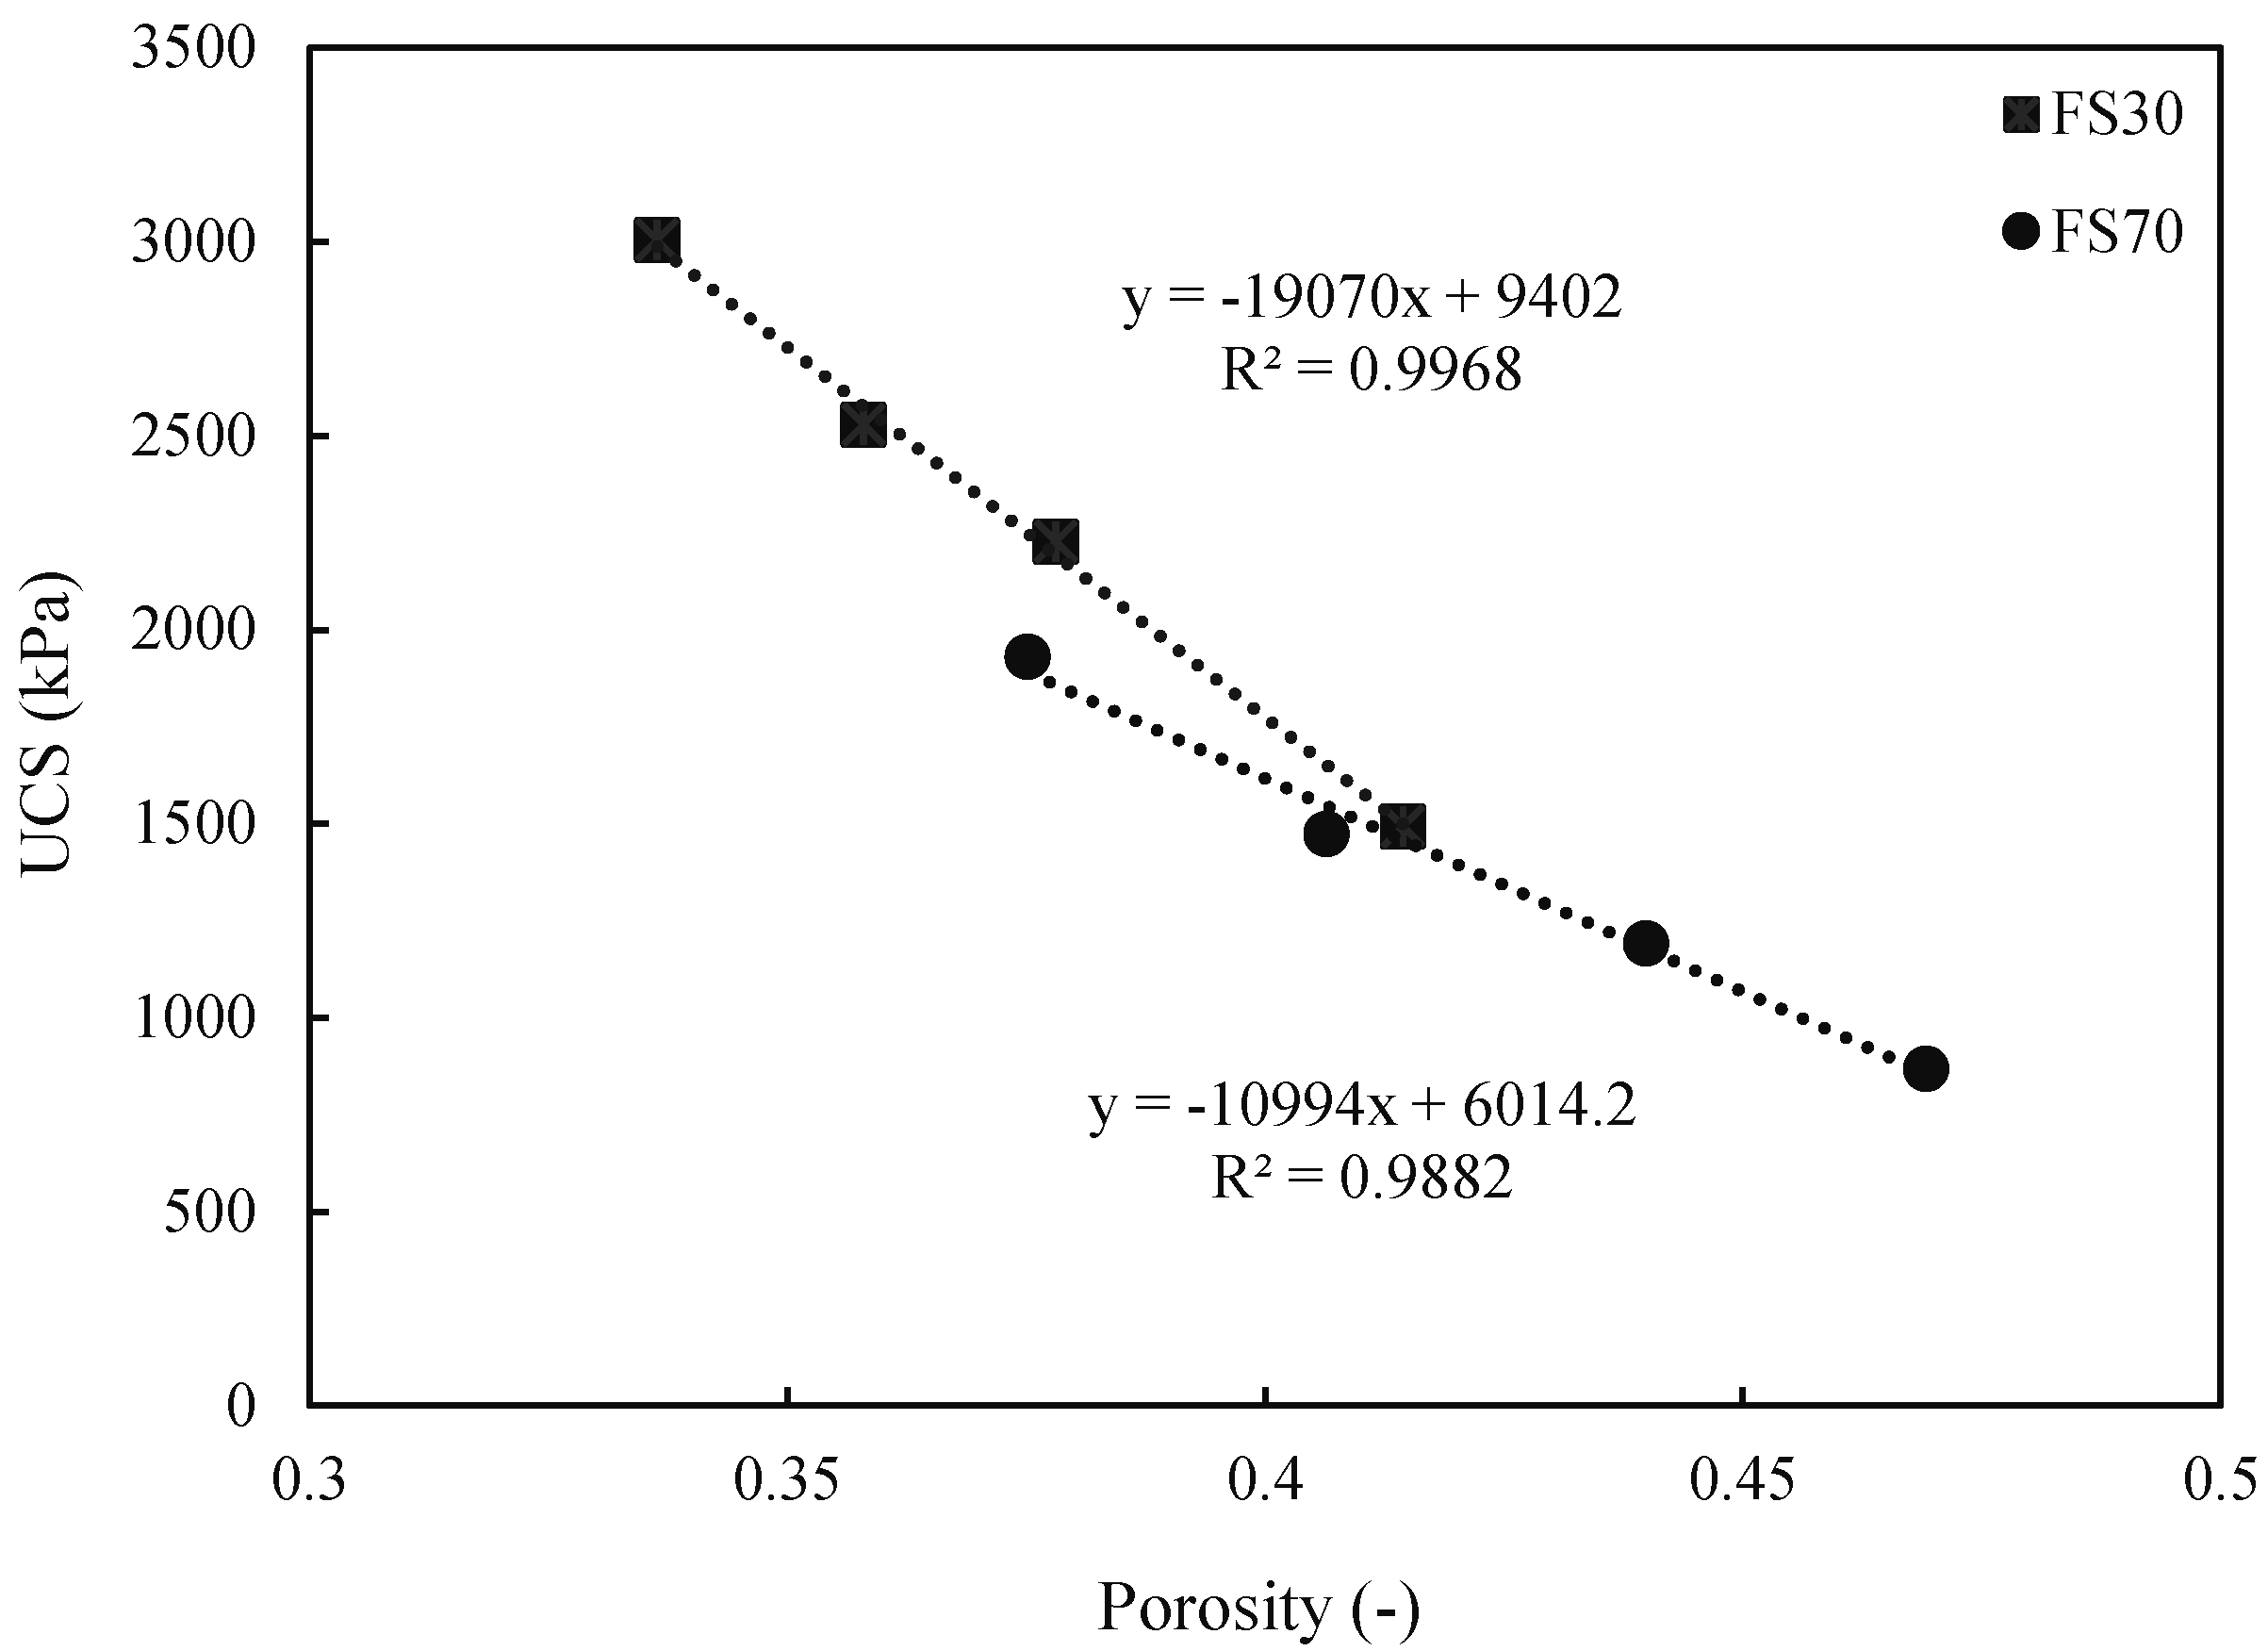
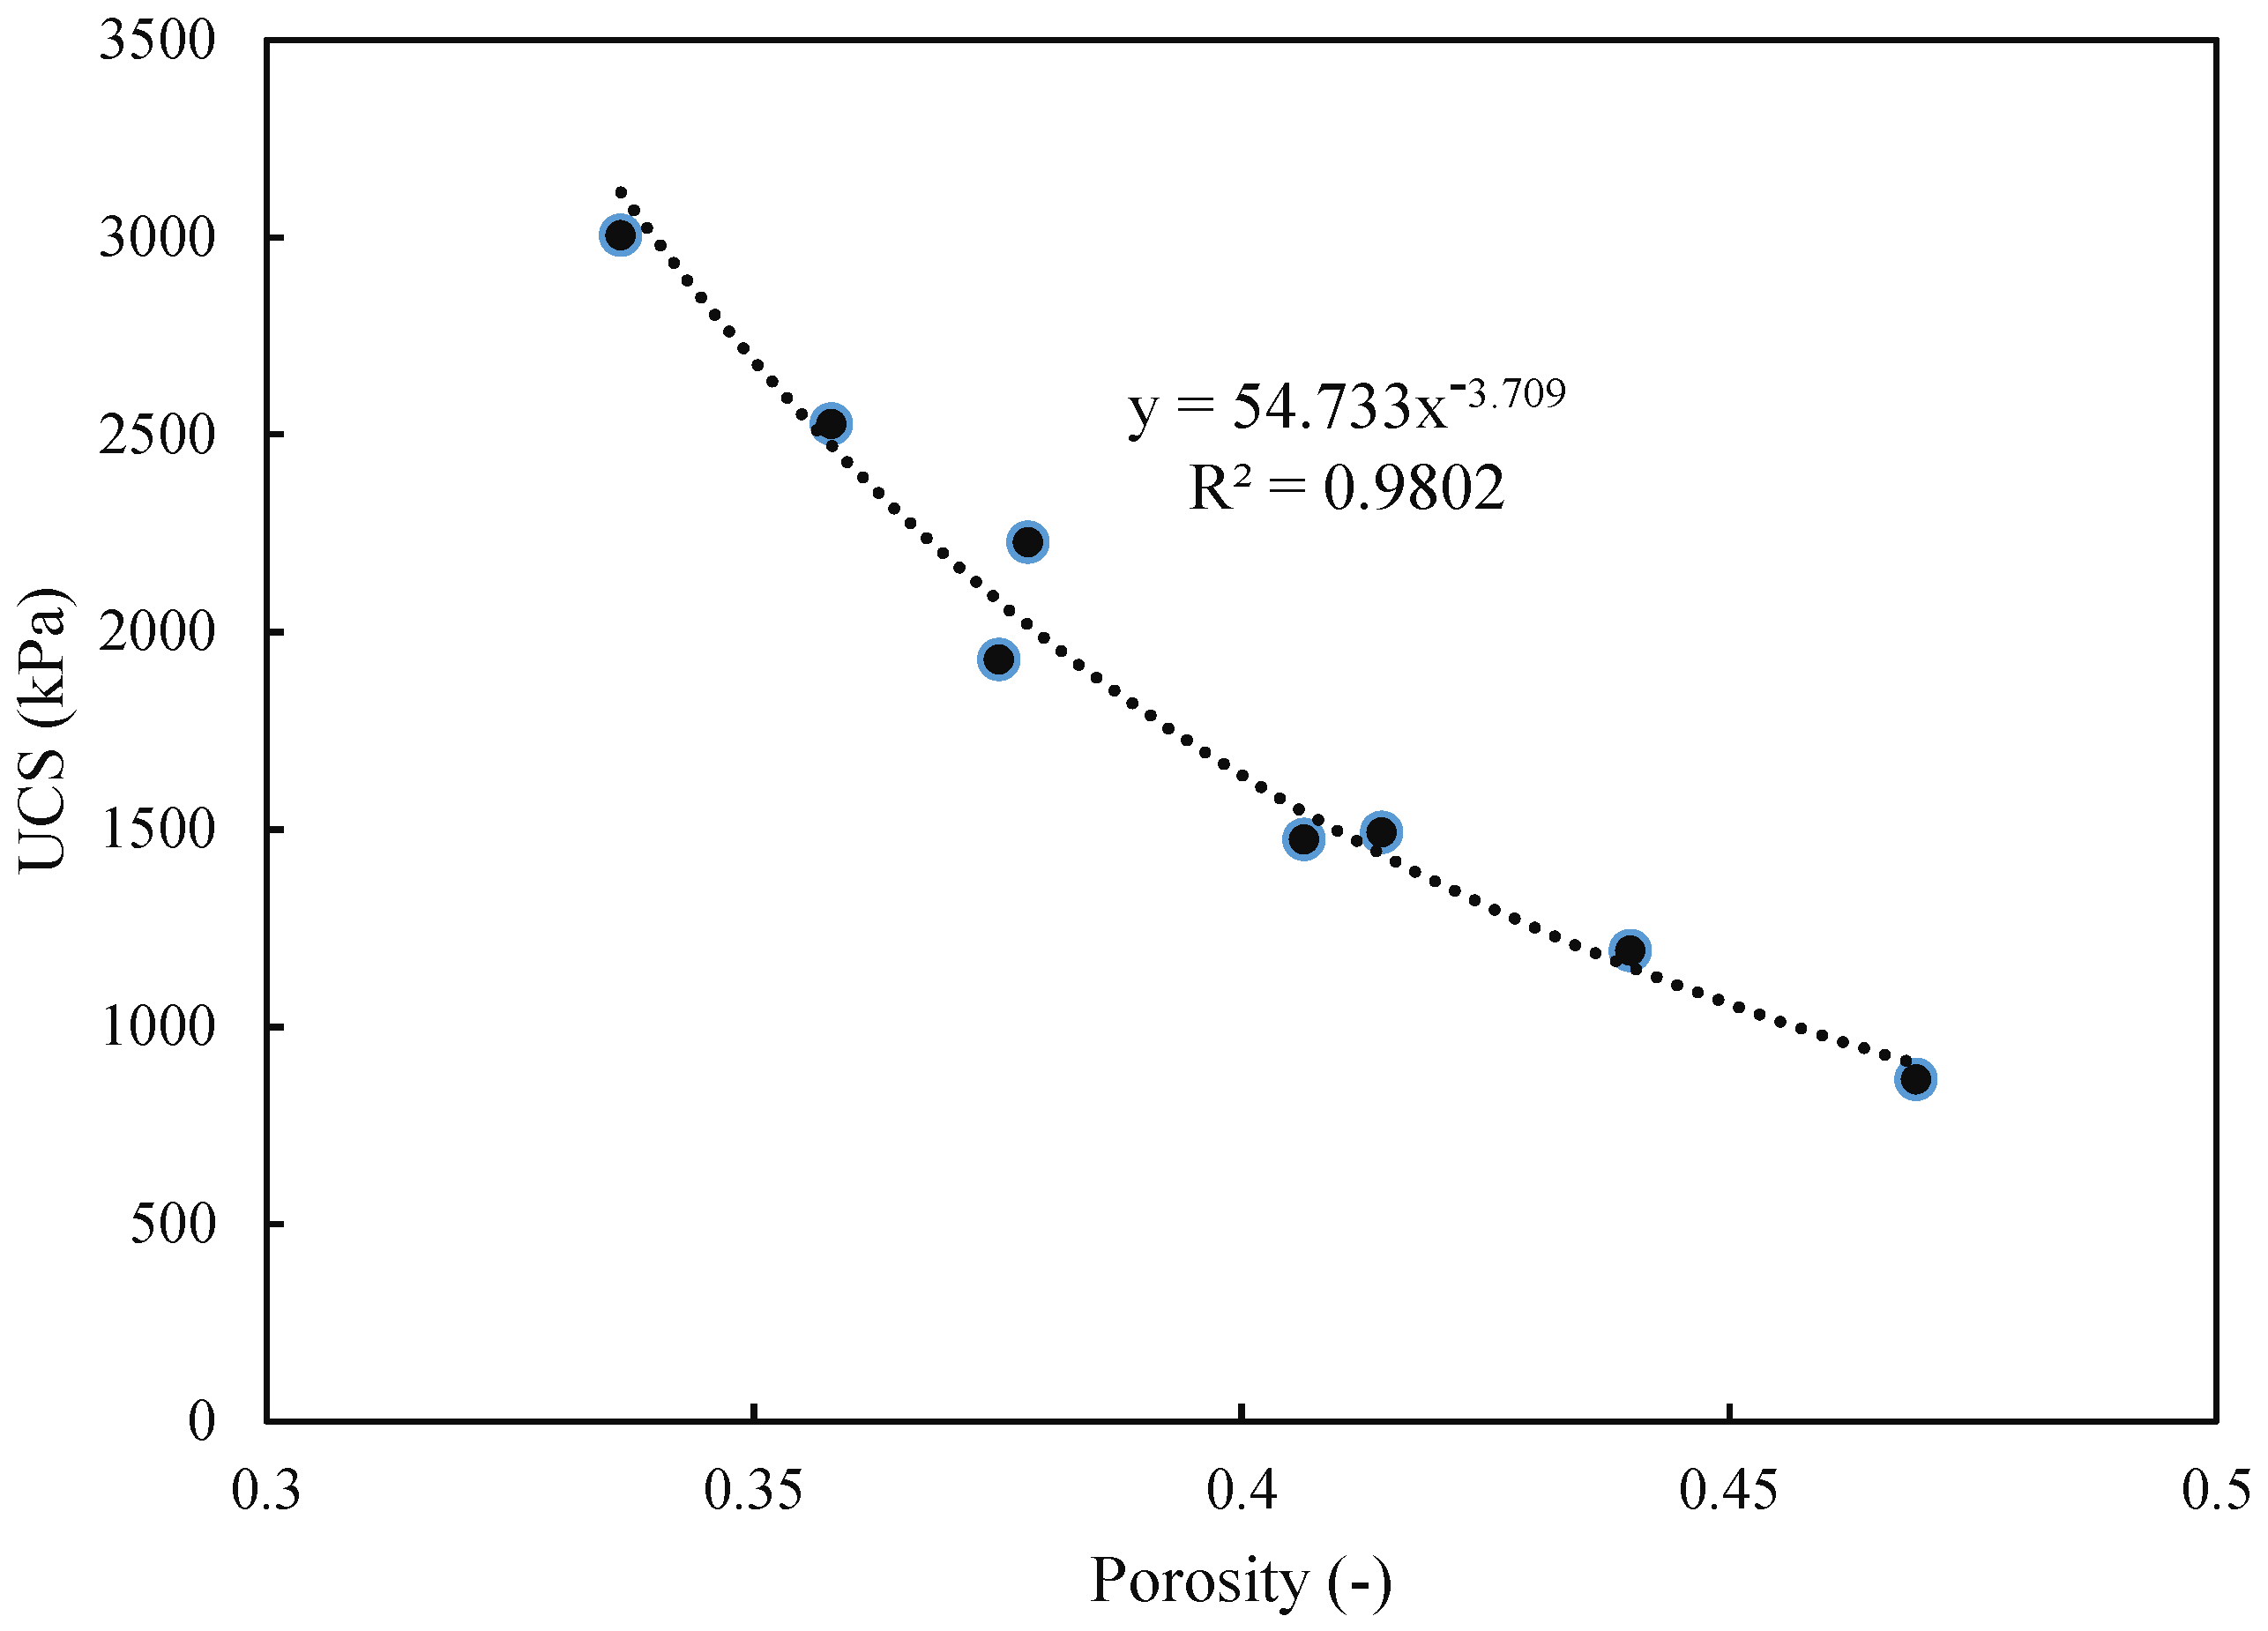
3.4. Uniaxial Compressive Strength Tests (Effects of Soil Porosity)
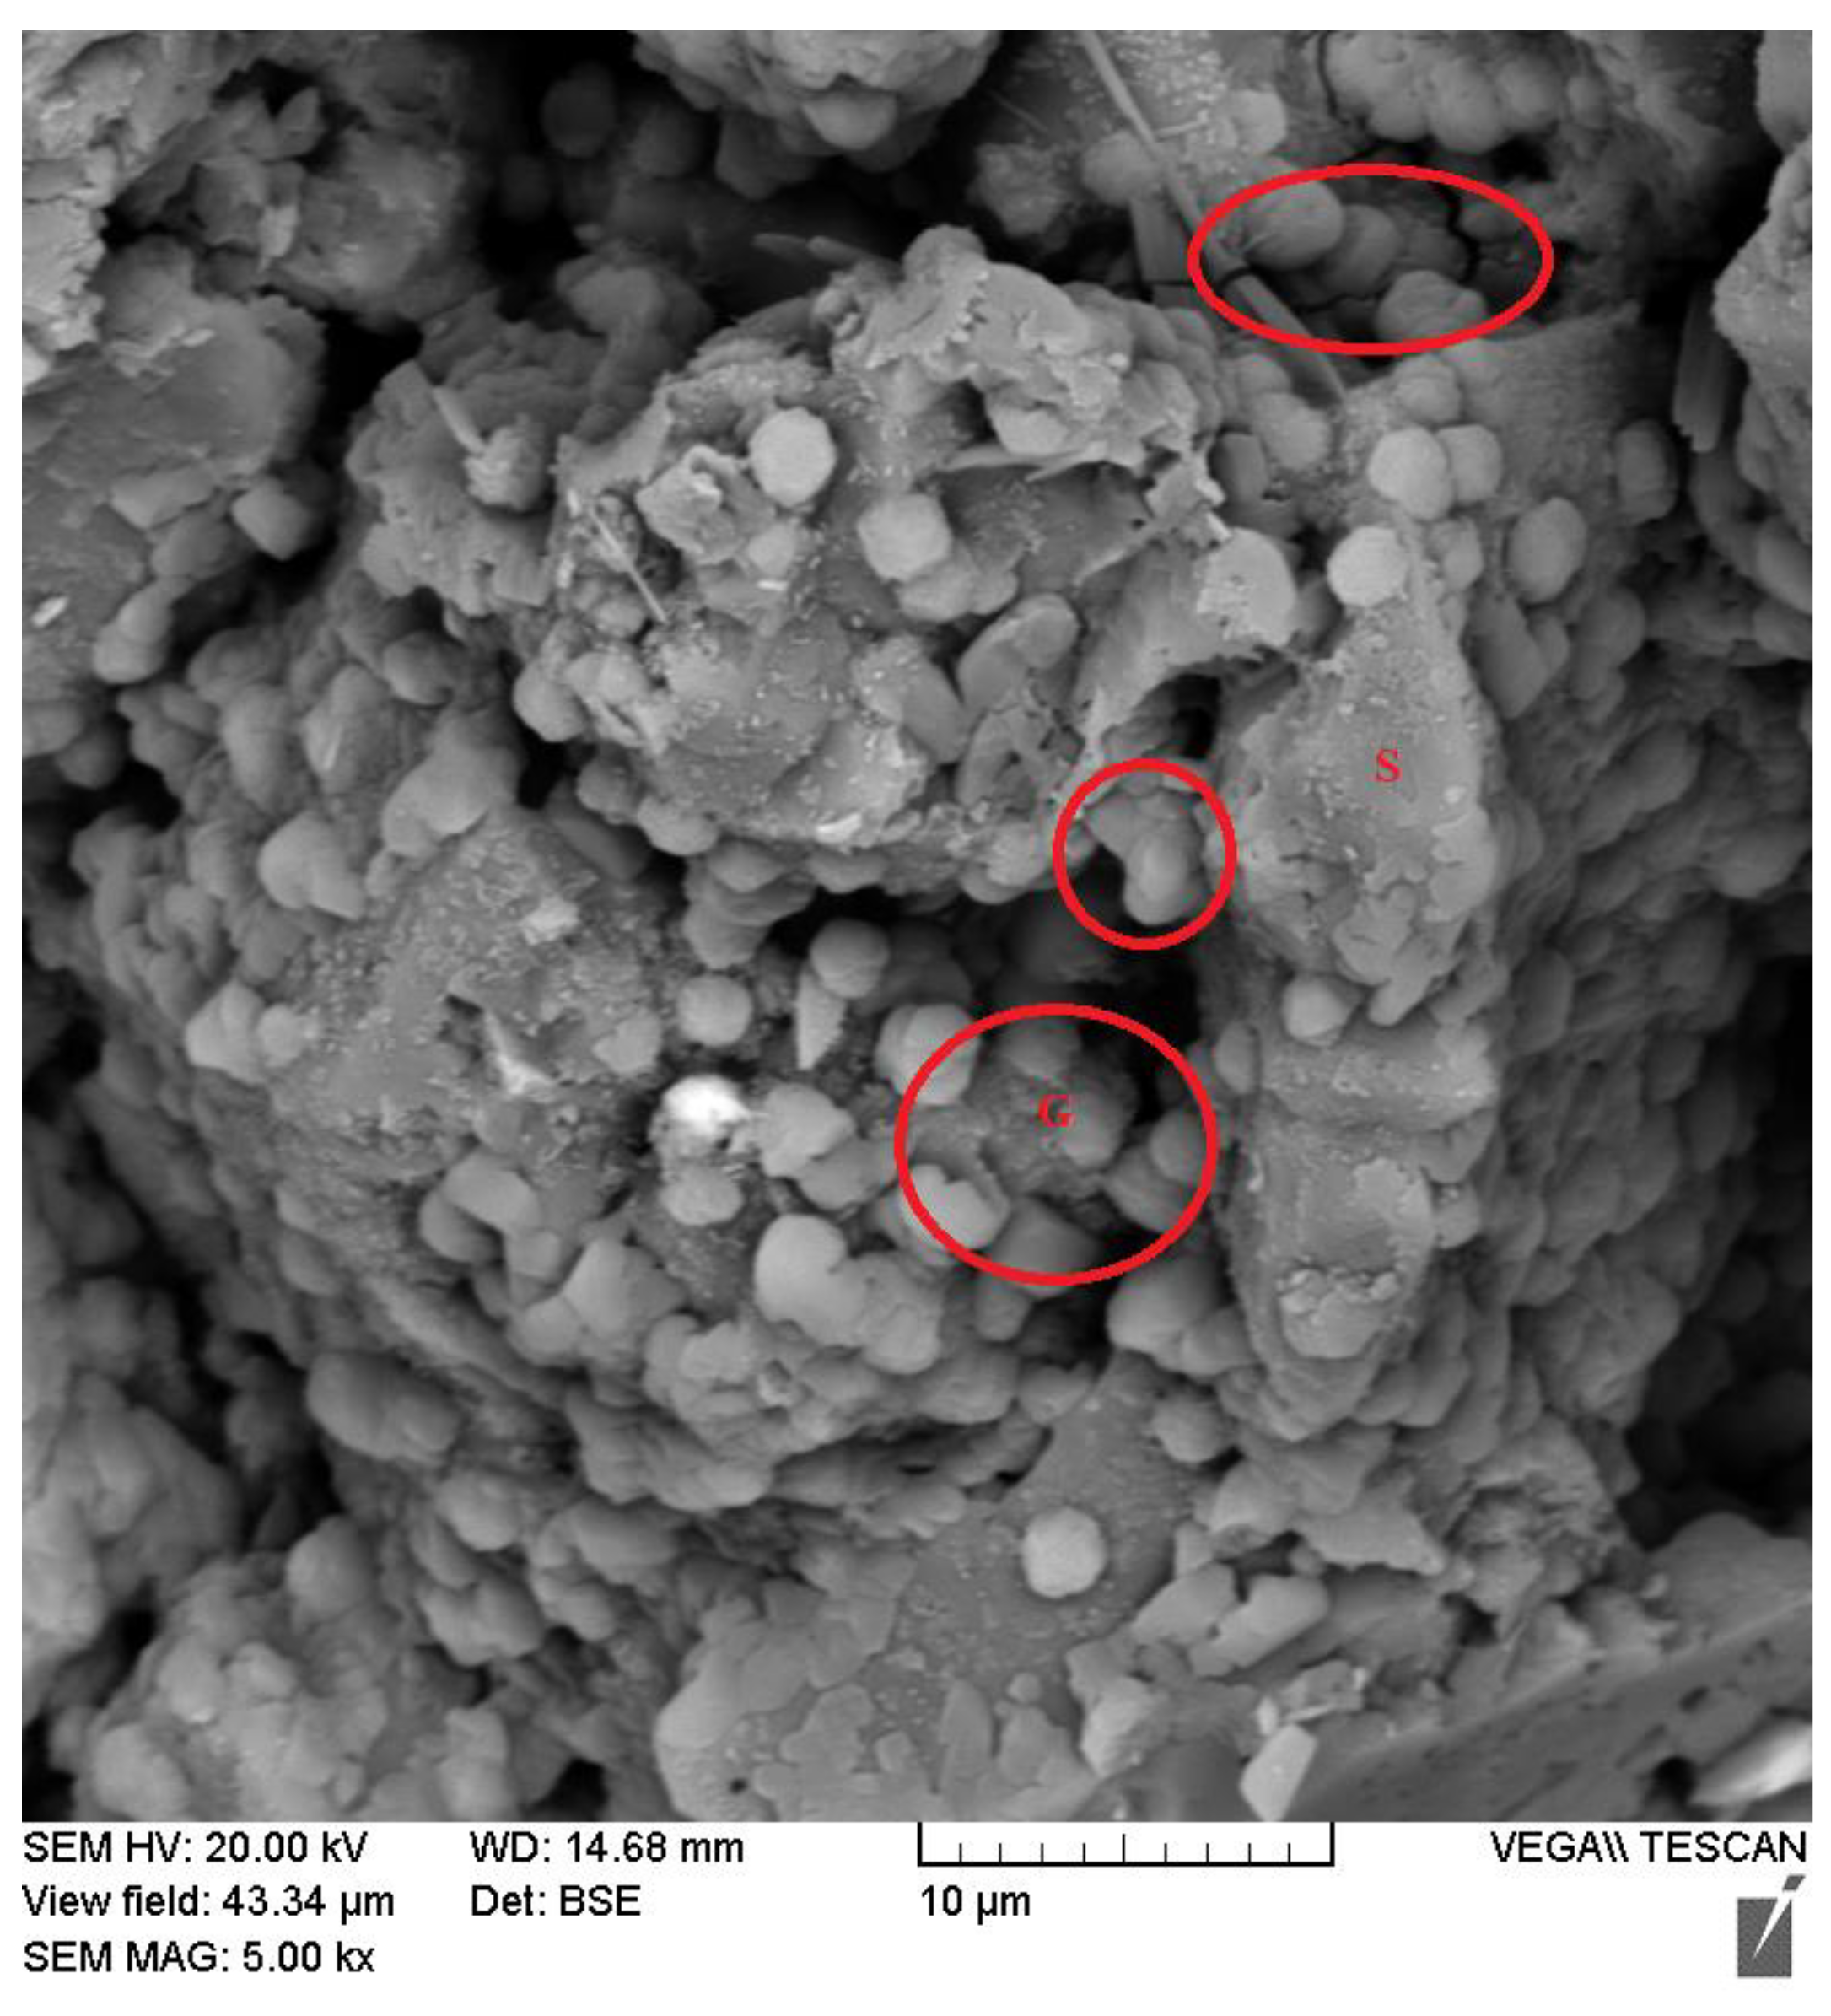
To study the effect of porosity on the mechanical behavior of treated soils, four different porosities were selected for each of the two examined soil samples (as mentioned in Table 2), which were treated by 5% VA and 15% alkaline activator (VA/ AA = 0.34).
Figure 11 shows the variation in Uniaxial Compressive Strength (UCS) for the two geopolymer-treated soil specimens (FS30 and FS70) with different values of porosity. It is evident from Figure 11 that the compressive strength decreased by increasing the porosity of both soils. Two linear correlations between compressive strength and porosity were found for FS30 and FS70 soil specimens with the COD values of 0.99 and 0.98, respectively. The gradient of the trendline for FS30 was almost twice that for FS70; that is, the compressive strength of FS30 was approximately two times more pronounced by the variation in porosity, compared to its silty soil counterpart (FS70). This discrepancy can be explained by the higher uniformity coefficient and specific surface area for the silty sand (FS30) in comparison with FS70. The developed compressive strength by the reduction of soil porosity was induced by growing soil inter-particle contacts [19].
Considering the same origin but different particle size gradation curve of the examined soil specimens, the strength–porosity relationships for both soils follow a power-law equation with COD of 0.98 (Figure 12). This unique power correlation between porosity and compressive strength for the two studied soils may be caused by the same origin and particle shapes of the soil samples, as suggested earlier [26]. The effect of different VA-based geopolymer mix designs on the compressive strength of treated soil samples was previously discussed in [5].

3.5. SEM-EDX

An SEM image for the geopolymer-treated soil is depicted in Figure 13. The geopolymer bonds between soil particles are evident in the figure, as shown by the red oval mark. From the results of EDX analysis (Table 5), it is seen that zone S (soil) is mostly comprised of O (53.04%) and Si (43.52%), which is attributed to the soil, whereas analysis of zone G (geopolymer) indicates elements of O (45.53), Na (23.65), Si (23.60), and Al (7.21). Accordingly, the formation of sodium aluminosilicate hydrate gel (NASH), as the principal product of geopolymer reaction, is apparent from the analysis, as also reported by [36,37,38].

4. Conclusions

This study evaluated the applicability of a volcanic ash-based geopolymer as a surface stabilizer. To achieve this, the rheological behavior of different geopolymer mix designs was studied in terms of apparent viscosity and shear stress. A shear-thinning behavior was identified as characterizing the overall rheological performance of all geopolymer samples. This behavior is consistent with previous studies on VA-based geopolymers. Furthermore, a linear correlation was found between the final apparent viscosity and the binder-to-activator ratio of volcanic ash-based geopolymer.
The results of surface penetrometer tests provided a qualitative criterion that shed light on the strength of the topsoil crust formed by geopolymeric treatment. The surface treatment by 1P method shows very good performance in soils having high porosity. This method is effective in the stabilization of non-cohesive loose soils that are highly vulnerable to wind erosion [5,39,40].
Although increasing the soil dry unit weight improved the uniaxial compressive strength of treated soil specimens, it had a reverse effect on the strength of surface-treated samples. By reducing the soil surface porosity, the capability of the soil to take in the alkaline-activated volcanic ash particles into the pores was significantly reduced. Consequently, the developed crust thickness and the surface strength of treated samples were diminished. Amongst the three studied parameters, the total geopolymer quantity had the most significant influence on the formed crust and surface strength of geopolymerically treated samples. Based on the developed crust thickness, two different dominant failure modes were distinguished for surface-treated samples in the penetrometer tests.
By analyzing the results of the surface strength tests, it can be concluded that, regardless of the effect of binder content on the packing structure of soil-binder mixtures, the chemical features of mix design and infiltration depth have a superior influence on the final resistance of geopolymer-treated soils, which eliminates the possible effects of maximum dry unit weight and optimum moisture content on the fluctuations in strength of geopolymer-treated soils.

Author Contributions

Conceptualization, H.R.M. and A.A.J.; methodology, H.R.M.; software, H.R.M. and A.A.J.; validation, H.R.M. and A.A.J.; formal analysis, H.R.M.; investigation, H.R.M.; resources, H.R.M.; data curation, H.R.M.; writing—original draft preparation, H.R.M.; writing—review and editing, H.R.M., A.A.J. and A.S.A.; visualization, H.R.M. and A.A.J.; supervision, A.A.J. and A.S.A.; project administration, A.A.J.; funding acquisition, A.A.J. All authors have read and agreed to the published version of the manuscript.

Funding

This research was funded by the European Union’s Horizon 2020 research and innovation programme under the Marie Sklodowska-Curie, grant number [778120]. The APC was funded by The University of Exeter.

Data Availability Statement

Data that support the findings of this study are available from the corresponding author upon reasonable request.

Conflicts of Interest

The authors declare no conflict of interest.

References

  1. Liu, J.; Zhu, K.; Shen, Y.; Ren, Y.; Zuo, J.; Zhang, X. Experimental Investigation on the Deformation and Noncoaxial Characteristics of Fiber-Reinforced Aeolian Soil under Traffic Load. Int. J. Géoméch. 2022, 22, 04022054. [Google Scholar] [CrossRef]
  2. Dupont, S.; Rajot, J.; Labiadh, M.; Bergametti, G.; Lamaud, E.; Irvine, M.R.; Alfaro, S.C.; Bouet, C.; Fernandes, R.; Khalfallah, B.; et al. Dissimilarity Between Dust, Heat, and Momentum Turbulent Transports During Aeolian Soil Erosion. J. Geophys. Res. Atmos. 2019, 124, 1064–1089. [Google Scholar] [CrossRef]
  3. Zobeck, T.M.; Baddock, M.; Van Pelt, R.S.; Tatarko, J.; Acosta-Martinez, V. Soil property effects on wind erosion of organic soils. Aeolian Res. 2013, 10, 43–51. [Google Scholar] [CrossRef]
  4. Pye, K.; Tsoar, H. Aeolian Sand and Sand Dunes; Springer Science & Business Media: Berlin, Germany, 2008; Volume 23. [Google Scholar]
  5. Shariatmadari, N.; Mohebbi, H.; Javadi, A.A. Surface Stabilization of Soils Susceptible to Wind Erosion Using Volcanic Ash–Based Geopolymer. J. Mater. Civ. Eng. 2021, 33, 04021345. [Google Scholar] [CrossRef]
  6. Koohestani, B.; Darban, A.K.; Mokhtari, P.; Darezereshki, E.; Yilmaz, E. Geopolymerization of soil by sodium silicate as an approach to control wind erosion. Int. J. Environ. Sci. Technol. 2020, 18, 1837–1848. [Google Scholar] [CrossRef]
  7. Hanegbi, N.; Katra, I. A Clay-Based Geopolymer in Loess Soil Stabilization. Appl. Sci. 2020, 10, 2608. [Google Scholar] [CrossRef]
  8. Arnalds, O.; Thorarinsdottir, E.F.; Thorsson, J.; Waldhauserova, P.D.; Agustsdottir, A.M. An extreme wind erosion event of the fresh Eyjafjallajökull 2010 volcanic ash. Sci. Rep. 2013, 3, 1257. [Google Scholar] [CrossRef] [Green Version]
  9. Wilson, T.M.; Stewart, C.; Sword-Daniels, V.; Leonard, G.S.; Johnston, D.M.; Cole, J.W.; Wardman, J.; Wilson, G.; Barnard, S.T. Volcanic ash impacts on critical infrastructure. Phys. Chem. Earth Parts A/B/C 2012, 45–46, 5–23. [Google Scholar] [CrossRef]
  10. Zhou, S.; Lu, C.; Zhu, X.; Li, F. Upcycling of natural volcanic resources for geopolymer: Comparative study on synthesis, reaction mechanism and rheological behavior. Constr. Build. Mater. 2021, 268, 121184. [Google Scholar] [CrossRef]
  11. Yaghoubi, M.; Arulrajah, A.; Disfani, M.M.; Horpibulsuk, S.; Darmawan, S.; Wang, J. Impact of field conditions on the strength development of a geopolymer stabilized marine clay. Appl. Clay Sci. 2019, 167, 33–42. [Google Scholar] [CrossRef]
  12. Katebi, H.; Fahmi, A.; Kafil, H.S.; Bonab, M.H. Stabilization of calcareous sand dunes using phosphoric acid mulching liquid. J. Arid Environ. 2018, 148, 34–44. [Google Scholar] [CrossRef]
  13. Middleton, N.; Kang, U. Sand and Dust Storms: Impact Mitigation. Sustainability 2017, 9, 1053. [Google Scholar] [CrossRef] [Green Version]
  14. Santa, R.A.A.B.; Kessler, J.C.; Soares, C.; Riella, H.G. Microstructural evaluation of initial dissolution of aluminosilicate particles and formation of geopolymer material. Particuology 2018, 41, 101–111. [Google Scholar] [CrossRef]
  15. Koutník, P.; Soukup, A.; Bezucha, P.; Šafář, J.; Kohout, J. Low viscosity metakaolinite based geopolymer binders. Constr. Build. Mater. 2020, 230, 116978. [Google Scholar] [CrossRef]
  16. Dadsetan, S.; Siad, H.; Lachemi, M.; Sahmaran, M. Extensive evaluation on the effect of glass powder on the rheology, strength, and microstructure of metakaolin-based geopolymer binders. Constr. Build. Mater. 2021, 268, 121168. [Google Scholar] [CrossRef]
  17. Geng, J.; He, L.; Chen, M.; Niu, Y. Applicability of rheological properties of superabsorbent polymer cement-based materials using apparent viscosity. Mater. Struct. 2022, 55, 79. [Google Scholar] [CrossRef]
  18. Consoli, N.C.; Foppa, D.; Festugato, L.; Heineck, K.S. Key Parameters for Strength Control of Artificially Cemented Soils. J. Geotech. Geoenviron. Eng. 2007, 133, 197–205. [Google Scholar] [CrossRef]
  19. Consoli, N.; Fonseca, A.; Silva, S.; Cruz, R.; Fonini, A. Parameters controlling stiffness and strength of artificially cemented soils. Géotechnique 2012, 62, 177–183. [Google Scholar] [CrossRef] [Green Version]
  20. Zang, Y.-X.; Gong, W.; Xie, H.; Liu, B.-L.; Chen, H.-L. Chemical sand stabilization: A review of material, mechanism, and problems. Environ. Technol. Rev. 2015, 4, 119–132. [Google Scholar] [CrossRef]
  21. Turan, C.; Javadi, A.; Consoli, N.C.; Turan, C.; Vinai, R.; Cuisinier, O.; Russo, G. Mechanical Properties Of Calcareous Fly Ash Stabilized Soil. Eurocoalash 2019, 1, 184–194. [Google Scholar]
  22. Jafer, H.M.; Atherton, W.; Sadique, M.; Ruddock, F.; Loffill, E. Development of a new ternary blended cementitious binder produced from waste materials for use in soft soil stabilisation. J. Clean. Prod. 2018, 172, 516–528. [Google Scholar] [CrossRef]
  23. Rios, S.; Ramos, C.; da Fonseca, A.V.; Cruz, N.; Rodrigues, C. Mechanical and durability properties of a soil stabilised with an alkali-activated cement. Eur. J. Environ. Civ. Eng. 2019, 23, 245–267. [Google Scholar] [CrossRef]
  24. Hossain, K.; Mol, L. Some engineering properties of stabilized clayey soils incorporating natural pozzolans and industrial wastes. Constr. Build. Mater. 2011, 25, 3495–3501. [Google Scholar] [CrossRef]
  25. Mirzababaei, M.; Karimiazar, J.; Teshnizi, E.S.; Arjmandzadeh, R.; Bahmani, S.H. Effect of Nano-Additives on the Strength and Durability Characteristics of Marl. Minerals 2021, 11, 1119. [Google Scholar] [CrossRef]
  26. Rios, S.; Viana da Fonseca, A.; Consoli, N.C.; Floss, M.; Cristelo, N. Influence of grain size and mineralogy on the porosity/cement ratio. Géotechnique Lett. 2013, 3, 130–136. [Google Scholar] [CrossRef] [Green Version]
  27. Brookfield Engineering Laboratories. BROOKFIELD DV2T Viscometer Operating Instructions. Manual No. M13-167-B0614. 2015, Volume 8139. Available online: https://www.brookfieldengineering.com/-/media/ametekbrookfield/manuals/lab%20viscometers/dv2t%20instructions.pdf?la=en (accessed on 3 November 2015).
  28. Aboulayt, A.; Jaafri, R.; Samouh, H.; El Idrissi, A.C.; Roziere, E.; Moussa, R.; Loukili, A. Stability of a new geopolymer grout: Rheological and mechanical performances of metakaolin-fly ash binary mixtures. Constr. Build. Mater. 2018, 181, 420–436. [Google Scholar] [CrossRef]
  29. Pacheco-Torgal, F.; Labrincha, J.; Leonelli, C.; Palomo, A.; Chindaprasit, P. (Eds.) Handbook of Alkali-Activated Cements, Mortars and Concretes; Elsevier: Amsterdam, The Netherlands, 2015; Volume 7. [Google Scholar]
  30. Güllü, H.; Cevik, A.; Al-Ezzi, K.M.; Gülsan, M.E. On the rheology of using geopolymer for grouting: A comparative study with cement-based grout included fly ash and cold bonded fly ash. Constr. Build. Mater. 2019, 196, 594–610. [Google Scholar] [CrossRef]
  31. Nikvar-Hassani, A.; Manjarrez, L.; Zhang, L. Rheology, Setting Time, and Compressive Strength of Class F Fly Ash–Based Geopolymer Binder Containing Ordinary Portland Cement. J. Mater. Civ. Eng. 2022, 34, 04021375. [Google Scholar] [CrossRef]
  32. Mehdizadeh, H.; Kani, E.N. Rheology and apparent activation energy of alkali activated phosphorous slag. Constr. Build. Mater. 2018, 171, 197–204. [Google Scholar] [CrossRef]
  33. Abed, M.H.; Abbas, I.S.; Hamed, M.; Canakci, H. Rheological, fresh, and mechanical properties of mechanochemically activated geopolymer grout: A comparative study with conventionally activated geopolymer grout. Constr. Build. Mater. 2022, 322, 126338. [Google Scholar] [CrossRef]
  34. Chen, R.; Ding, X.; Ramey, D.; Lee, I.; Zhang, L. Experimental and numerical investigation into surface strength of mine tailings after biopolymer stabilization. Acta Geotech. 2016, 11, 1075–1085. [Google Scholar] [CrossRef]
  35. Rice, M.A.; Willetts, B.B.; Mcewan, I.K. Wind erosion of crusted soil sediments. Earth Surf. Processes Landf. 1996, 21, 279–293. [Google Scholar] [CrossRef]
  36. Nagajothi, S.; Elavenil, S. Effect of GGBS Addition on Reactivity and Microstructure Properties of Ambient Cured Fly Ash Based Geopolymer Concrete. Silicon 2021, 13, 507–516. [Google Scholar] [CrossRef]
  37. Yadollahi, M.M.; Benli, A.; Demirboğa, R. Effects of elevated temperature on pumice based geopolymer composites. Plast. Rubber Compos. 2015, 44, 226–237. [Google Scholar] [CrossRef]
  38. Khan, M.Z.N.; Shaikh, F.U.A.; Hao, Y.; Hao, H. Effects of Curing Conditions and Sand-to-Binder Ratios on Compressive Strength Development of Fly Ash Geopolymer. J. Mater. Civ. Eng. 2018, 30, 04017267. [Google Scholar] [CrossRef]
  39. Shao, Y. (Ed.) Physics and Modelling of Wind Erosion; Springer Netherlands: Dordrecht, The Netherlands, 2008; Volume 37. [Google Scholar]
  40. Chae, S.H.; Chung, H.; Nam, K. Evaluation of microbially Induced calcite precipitation (MICP) methods on different soil types for wind erosion control. Environ. Eng. Res. 2020, 26, 190507. [Google Scholar] [CrossRef]
Figure 1. Particle size gradation curves of different soil samples (FS0, FS30, FS70, and FS100), and volcanic ash.
Minerals 12 00984 g001
Figure 2. Modified Proctor compaction test results of FS30 and different amounts of binder (0, 2.5, 5, 10%).
Minerals 12 00984 g002
Figure 3. Variation of minimum void ratio (e min) with the coefficient of uniformity (Cu) of FS30 and different binder contents.
Minerals 12 00984 g003
Figure 4. Variations in apparent viscosity with shear rate for different geopolymeric pastes (different VA/AA).
Minerals 12 00984 g004
Figure 5. Variations in shear stress with shear rate for different geopolymeric pastes.
Minerals 12 00984 g005
Figure 6. Relationship between final apparent viscosity and ratio of volcanic ash to alkaline activator.
Minerals 12 00984 g006
Figure 7. Variations in (a) crust thickness and (b) penetration failure force for FS30-treated samples with different VA/AA ratios.
Minerals 12 00984 g007
Figure 8. Variations in (a) crust thickness and (b) penetration failure force for FS30-treated samples with different geopolymer/soil ratios.
Minerals 12 00984 g008
Figure 9. Variations in (a) crust thickness and (b) penetration failure force for FS30-treated sample with different soil porosity values.
Minerals 12 00984 g009
Figure 10. Two different failure modes in terms of (a) Complete failure, (b) Punching failure.
Minerals 12 00984 g010
Figure 11. Relationships between porosity and compressive strength of FS30 and FS70 geopolymer-stabilized specimens.
Minerals 12 00984 g011
Figure 12. A common relationship between porosity and compressive strength of FS30 and FS70 geopolymer-stabilized specimens.
Minerals 12 00984 g012
Figure 13. SEM images of FS70 geopolymer-treated sample G (Geopolymer), S (Soil).
Minerals 12 00984 g013
Table 1. Chemical composition for sand and volcanic ash.
Oxides Wt.%SiO2CaOAl2O3Fe2O3K2ONa2OMgOTiO2SrOSO3P2O5LOI
Volcanic Ash53.898.9720.313.451.925.151.420.510.070.260.233.80
Sand94.331.052.030.900.210.49-0.12---0.86
Table 2. Soil porosity for preparation of different soil samples (soil trays and cylindrical specimens).
ParameterSoilPorosityNumber of TestsTestsSample Type
Penetration force (N) and
Crust thickness (mm)
FS300.41, 0.38, 0.37, 0.33 3Soil surface penetrometer, topsoil crust measurementSoil trays
FS700.383
Compressive strength (kPa)FS300.41, 0.38, 0.37, 0.33 3Uniaxial compressive strength testsCylindrical specimens
FS700.47, 0.44, 0.40, 0.38 3
Table 3. Tests performed on each of the geopolymer mix designs.
VA%AA%VA/AAViscosity TestsUCSSurface Penetrometer Tests
2.5150.17
2.5100.25
5150.34
5100.5
10150.67
Table 4. Rheological parameters of geopolymeric pastes with different binder-to-activator ratios.
VA/AACorrelationCODPlastic Viscosity (Pa.s)Yield Stress (Pa)
0.67y = 0.0557x + 0.39430.99810.05570.3943
0.5y = 0.0353x + 0.16090.98330.03530.1609
0.34y = 0.0261x + 0.0170.98820.02610.017
0.25y = 0.0198x + 0.01480.99380.01980.0148
0.17y = 0.0153x + 0.00390.99790.01530.0039
Table 5. EDX analysis results for G and S zones.
ElementG (Wt.%)S
(Wt.%)
O45.5353.04
Na23.652.66
Al7.210.77
Si23.643.52
Publisher’s Note: MDPI stays neutral with regard to jurisdictional claims in published maps and institutional affiliations.

