Article

Constraints on Sandstone-Type Uranium Deposits by the Tectonic Uplift and Denudation Process in the Eastern Junggar Basin, Northwest China: Evidence from Apatite Fission Track and Detrital Zircon U-Pb Ages

1
State Key Laboratory of Coal Resources and Safe Mining, China University of Mining and Technology (Beijing), Beijing 100083, China
2
Beijing Research Institute of Uranium Geology, China National Nuclear Corporation (CNNC), Beijing 100029, China
*
Author to whom correspondence should be addressed.
Minerals 2022, 12(7), 905; https://doi.org/10.3390/min12070905
Submission received: 16 June 2022 / Revised: 5 July 2022 / Accepted: 9 July 2022 / Published: 19 July 2022
(This article belongs to the Special Issue Geochemistry, Mineral Chemistry and Geochronology of Uranium Deposits)

Abstract

:
The uplift and denudation history of the orogenic belt and the basin–mountain coupling process have directly or indirectly affected the generation, scale, and preservation of sandstone-type uranium deposits in the eastern Junggar Basin by controlling the uranium source, lithology, facies, hydrogeology, post-generation modification, and other mineralization conditions. Taking the eastern Junggar Basin as the research area, this study proposes the constraints on sandstone-type uranium deposits by the tectonic uplift and denudation history of the orogenic belt in the basin using the apatite fission track (AFT), detrital zircon geochronology, and other methods. The results of the AFT age test and thermal path simulation indicate that the orogenic belt in the eastern Junggar Basin underwent four rapid uplifts; (from approximately 300 Ma to approximately 250 Ma, from approximately 130 Ma to approximately 90 Ma, from approximately 65 Ma to approximately 30 Ma, and from approximately 20 Ma to 0 Ma). Moreover, the timing of the uplift has a spatial trend of gradually becoming younger from south to north. The detrital zircon U-Pb age test showed that the sediment source area of the basin is mainly distributed in three age intervals, i.e., 460–390, 360–270, and 190–170 Ma. The comprehensive evaluation of the clastic sediment composition, stratigraphic distribution of the erosion source area, and thermal history showed that a large amount of exposed Carboniferous–Permian granites in the Qinglidi and Karameri Mountain erosion source areas contributed dominant sediment material and uranium sources for the Triassic and Middle and Lower Jurassic strata in the basin. The Ordovician–Early Devonian granites only provided sediment sources for the Upper Triassic and Lower Jurassic strata in the basin. Altay Mountain contributed some sediment sources for the Middle and Upper Jurassic strata after the magmatic activity and rapid uplift occurred in the Middle Jurassic. Based on the comprehensive analysis of the influence of the tectonic uplift process of the orogenic belt and the transformation of material source areas on uranium mineralization, the granites in the erosion source areas are proposed to contribute both external and internal uranium sources for uranium mineralization. Uranium mineralization mainly occurred in the tectonic retreat period after the rapid uplifts of the Cretaceous and Paleogene. It was terminated by the intensive uplift-induced stratigraphic deformation in the Miocene.

1. Introduction

Sandstone-type uranium deposits are formed by epigenetic oxidation because of basin margin tectonic uplift, causing the target layer to lift obliquely to receive oxygenated uranium-bearing fluids [1,2]. The formation, preservation, and denudation of the deposits are closely related to the basin–mountain coupling process [3]. The uplift and denudation history of the orogenic belt and basin–mountain coupling process play a prominent role in sandstone-type uranium mineralization [4,5,6]. By constraining the uranium source, lithology, facies, hydrogeology, post-generation modifications, and various other metallogenic conditions, the formation, scale, and preservation of uranium mineralization can be explained. Before mineralization, the uplift and denudation of the erosion source areas can provide abundant material and uranium sources for the basin [7,8], and the continuous settlement of the mountain front zones can provide sufficient deposition space, which determines the lithology and facies characteristics of the ore-bearing strata [9]. During the mineralization period, the long-term slow uplift of the basin margin enables the sustainable development of the tectonic slope zone, groundwater recharge–runoff–drainage system, and interlayer oxidation [10], and controls the formation and development scale of the U mineralization [11,12].
Moreover, the intensity of tectonic activity after mineralization directly determines the spatial distribution and final location of the U mineralization [12]. For example, rapid uplift would lead to the denudation of the ore body, and tectonic inversion would lead to overthrusting and deep burial of the ore body [13]. The precise uplift and denudation process history reconstruction in uranium deposits not only establishes the uranium mineralization model logically but also constrains the uranium mineralization era [14,15]. Therefore, accurately determining the period and time of major tectonic events in uranium-producing regions, quantitatively analyzing the rate and magnitude of tectonic uplift or subsidence at different stages, and inverting the basin–mountain coupling process are of great significance for analyzing the uranium mineralization potential at the basin margin and investigating the mechanism of tectonic uranium mineralization [8,16].
The Junggar Basin is an important multi-energy (e.g., oil, gas, and coal) superimposed basin in Northwest China and is also one of the important uranium-producing basins. It is located in the Central Asian sandstone-type uranium formation belt. The extensive sandstone-type uranium mineralization belt in Central Asia is approximately 4000 km long from east to west and 1000–1200 km wide from north to south, with a total area of approximately 5 million km2. Its genesis is closely related to the Mesozoic–Cenozoic intracontinental orogenic process of the Central Asian Orogenic Belt (CAOB). The Junggar Basin adjoins the main Central Asian uranium mineralization area, has a favorable tectonic background of “sub-orogeny” for uranium mineralization, and has good mineralization potential. However, the relationship between the Mesozoic–Cenozoic intracontinental orogenic process and sandstone-type uranium ore formation has seldom been reported due to the lack of large uranium deposits.
The discovery of the Kamust uranium deposit in the eastern Junggar Basin is a breakthrough in deep U-ore prospecting in the overlying mudstone area of Mesozoic–Cenozoic basins in China in recent years [8,17,18,19]. The deposit is a typical sandstone-type uranium deposit formed by interlayer oxidation [20,21,22]. The interlayer oxidation extends approximately 10 km from Karameri Mountain to Junggar Basin, and the front line is approximately parallel to Karameri Mountain. The uplift after the formation of the ore-bearing strata caused the denudation of the overlying mudstone area in the basin margin, creating a “window” for groundwater infiltration. Consequently, the tectonic uplift and denudation process is not only the prerequisite for the formation of regional interlayer oxidation but also the most crucial factor in controlling the formation and location of uranium mineralization in this area. Therefore, taking the eastern Junggar Basin as the study area, based on apatite fission track (AFT), detrital zircon age analysis, and other methods, this study delineates the complete progress of the formation and preservation of the sandstone-type uranium deposit from the perspective of tectonic evolution and proposes the constraints on sandstone-type uranium mineralization by the tectonic uplift and denudation history.

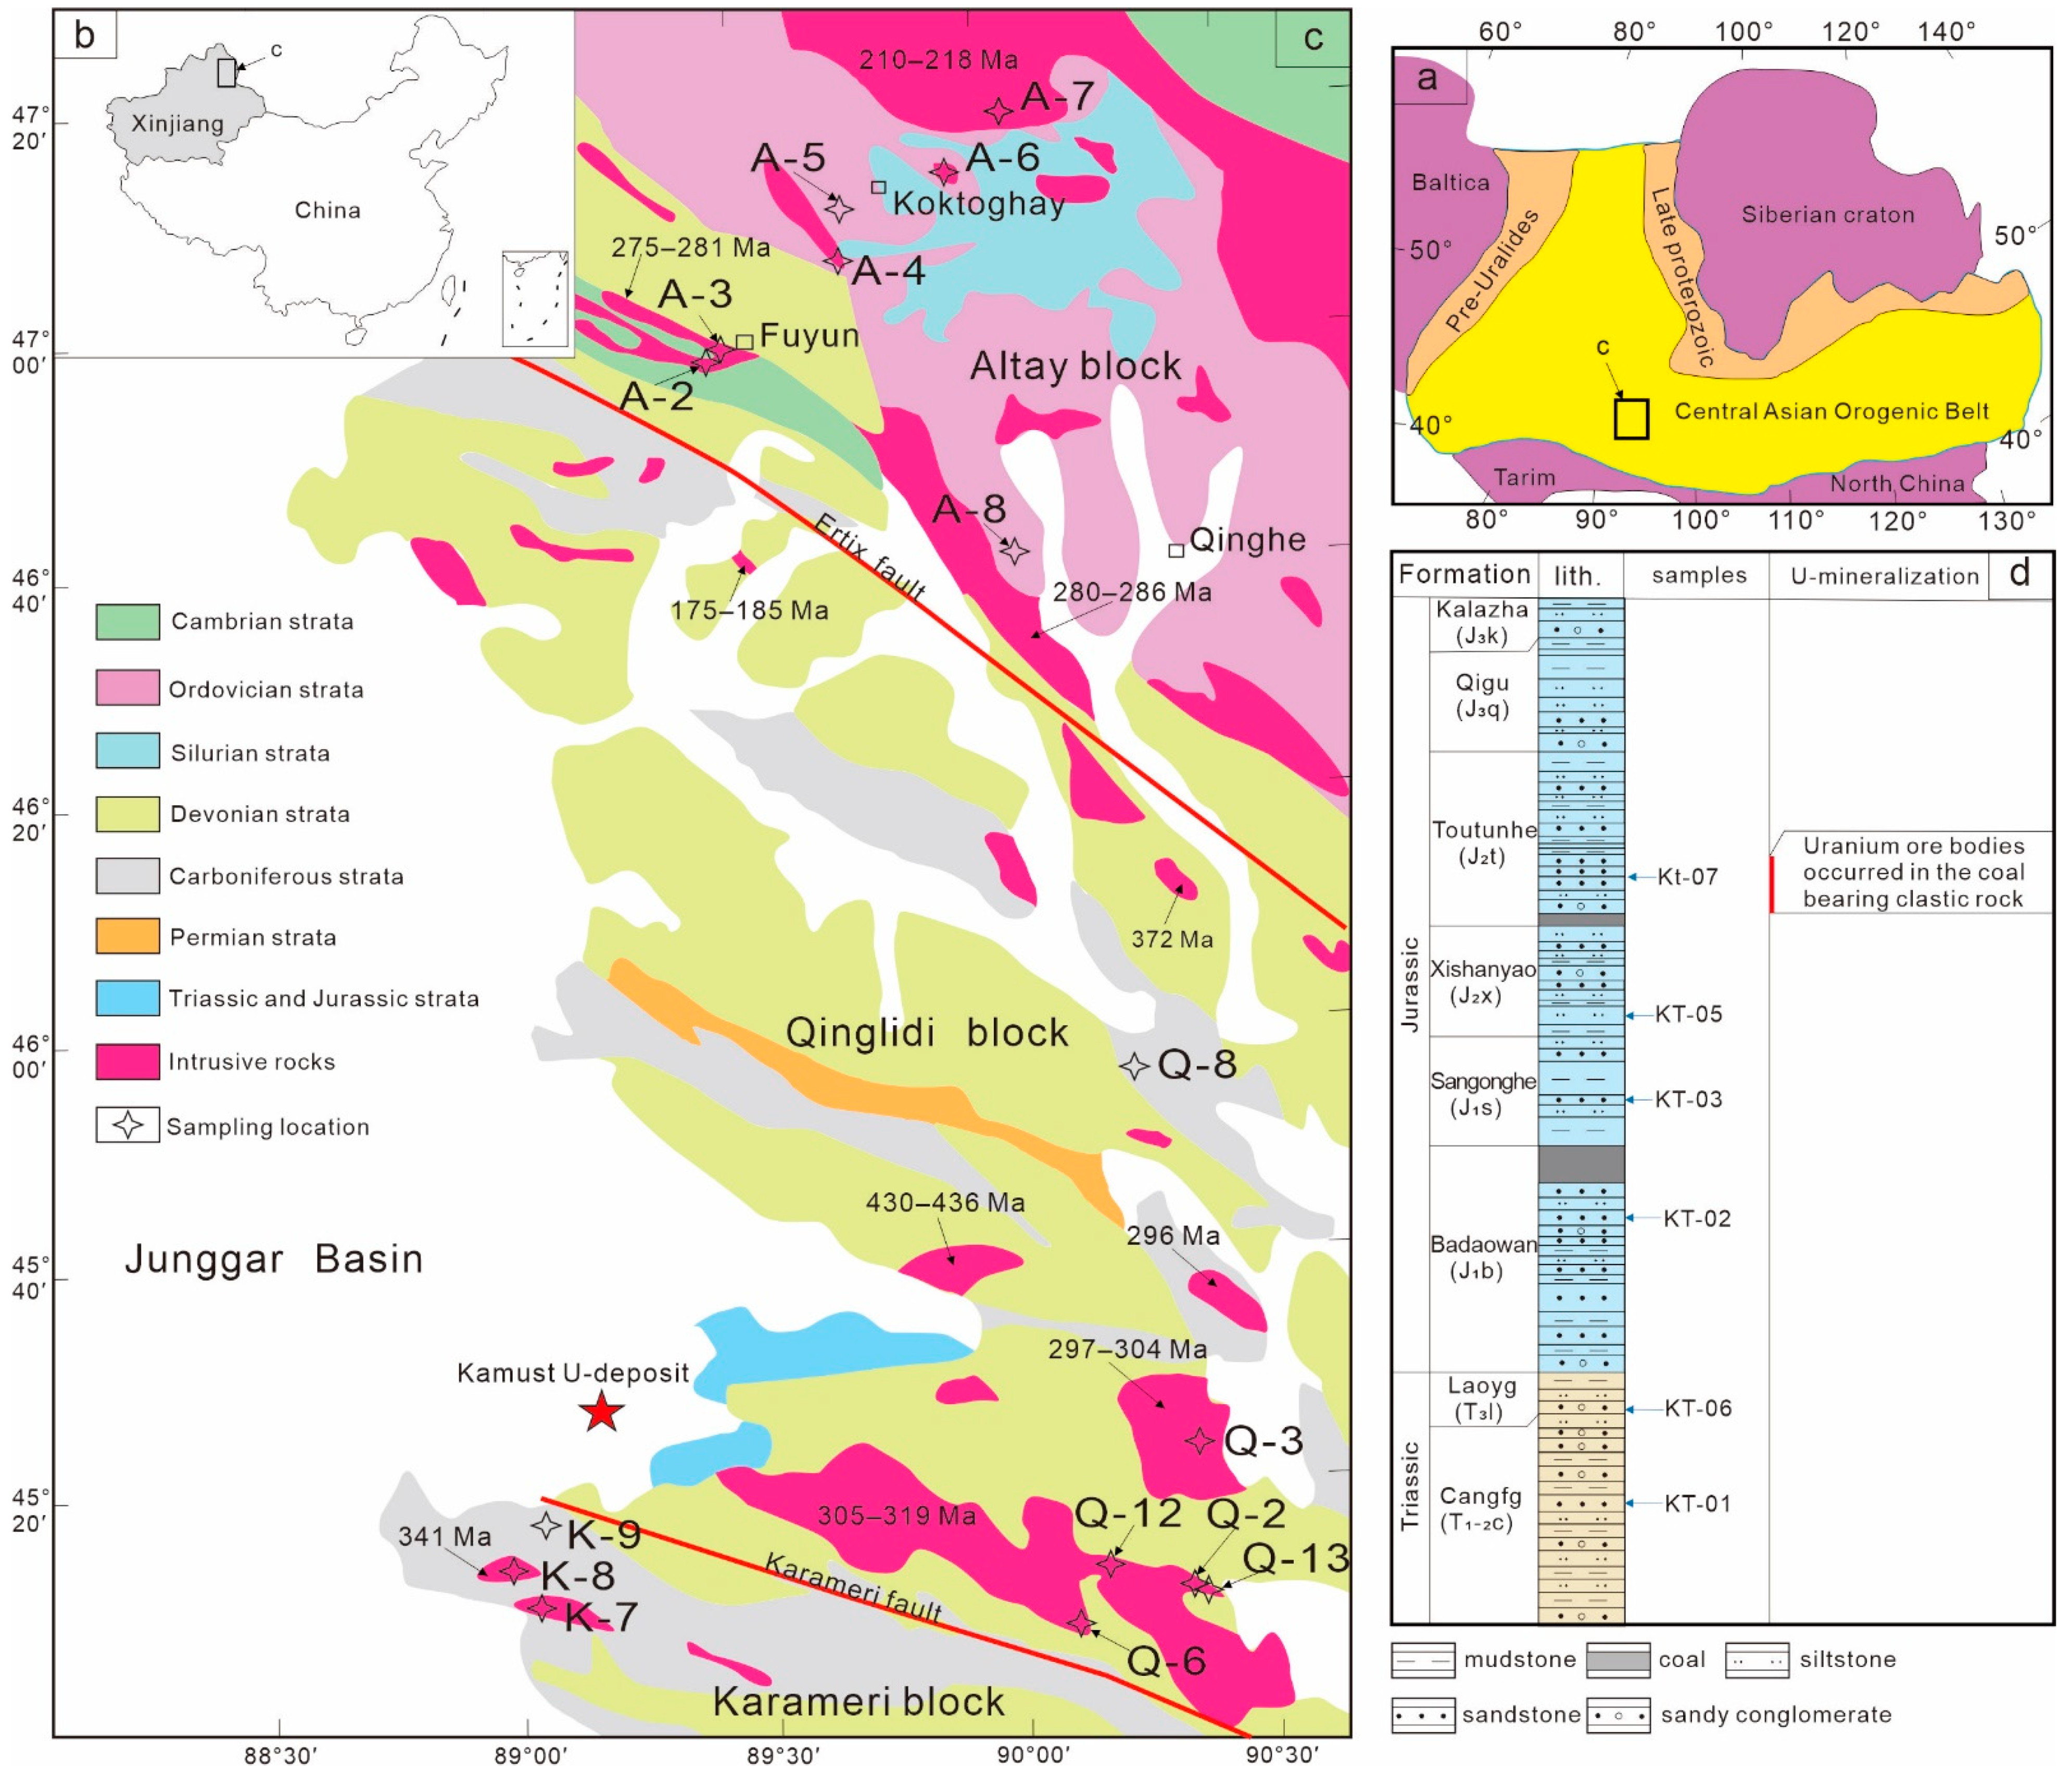
2. Geological Background

2.1. Tectonic Setting

The Junggar Basin is located in the middle of the western section of the CAOB, at the intersection of the Kazakhstan block to the west, the Siberian craton to the south, and the North Tianshan Orogenic Belt to the north [23,24,25] (Figure 1a). It is an important part of the CAOB, and an intraplate sedimentary basin surrounded by Paleozoic suture lines and fold belts developed from the late Carboniferous to Quaternary [18,24,26]. The northeast and east boundaries of the basin are the Altay fold belt, particularly the southern margin of the ancient Siberian plate, and the East Junggar fold orogenic belt, respectively. They are divided into three orogenic belts, i.e., Altay, Qinglidi, and Karameri belts, by the Ertix and Karameri faults (Figure 1b,c). The Ertix and Karameri faults are significant sutures in the CAOB, with a large amount of ophiolites distributed on both sides, indicating the closure of the Paleo-Asian Ocean. The zircon U-Pb ages of the ophiolites in the two sutures are between 503 Ma and 373 Ma [27,28,29,30], indicating the timing of the incipient closure of the Paleo-Asian Ocean at the eastern Junggar Basin. It showed a collage of remnant ocean basins and island arcs with accretionary orogens in the Carboniferous–Early Permian. The Junggar Basin then began transforming from an open marine basin into a closed inland basin [31,32]. The Hercynian tectonic movement in the Late Permian was the most critical for the formation and evolution of the depression–uplift structural pattern in the Junggar Basin and the fault–depression development stage of the basin [33]. Since the Mesozoic, the Junggar Basin underwent intracontinental evolution [34], in which the Triassic was the transition stage of the depression–rift basin. Under compression and shrinking conditions, the foreland basin in the eastern Junggar Basin was formed. In the Jurassic, the Junggar Basin, as a whole, was in a weak extensional environment, and peripheral orogenic belts subsided with the basin. In the Cretaceous–Quaternary, the basin gradually shrank. Moreover, denudation of the strata mainly occurred in the margin of the basin. However, with gentle deformation, the uplift and denudation of the orogenic belt in the eastern Junggar Basin were relatively intense.

2.2. Stratigraphy

In response to the intracontinental tectonic development since the Mesozoic, the basement of the Junggar Basin was formed prior to the Permian, and the sedimentary cover of the basin was developed since the Late Permian [46]. As the plate converged from Devonian to Early Permian, the continental crust continuously thickened, and the oceanic crust shrunk. Volcanic eruption, magma intrusion, and metamorphism were intensive, forming widely distributed uranium-rich igneous rock units. Notably, the basement of the basin and the eastern margin orogenic belt have better uranium source conditions, which are conducive to sandstone-type uranium mineralization. The sedimentary cover of the eastern part of the basin is of the Triassic, Jurassic, Neogene, and Quaternary ages. In particular, the Jurassic strata consist of the Badaowan Formation (J1b) of the Lower Jurassic, Sangonghe Formation (J1s) of the Lower Jurassic, Xishanyao Formation (J2x) of the Middle Jurassic, Toutunhe Formation (J2t) of the Middle Jurassic, Qigu Formation (J3q) of the Upper Jurassic, and Kalazha Formation (J3k) of the Upper Jurassic (Figure 1d). During the Jurassic, the eastern Junggar Basin was an alluvial basin that sank from east to west, with alluvial fans at the basin’s edge, which gradually changed into braided and meandering rivers and lake swamp facies toward the inner basin. In the Early Jurassic, the basin subsided rapidly, and medium-grained to coarse-grained braided fluvial facies were deposited in the basin margin. In the Middle Jurassic, because of the decrease in the basin–mountain height difference, the sedimentary range expanded, and large-scale river–swamp facies with flat terrain were developed, forming a thick layer of clastic rock formation with reduced components, such as organic carbon and pyrite, which is a favorable metallogenic space for uranium mineralization. In the Late Jurassic, because of the increase in the basin–mountain height difference, sediments were absent in a wide range of the basin margin, indicating the enhancement of the tectonic uplift and denudation process.

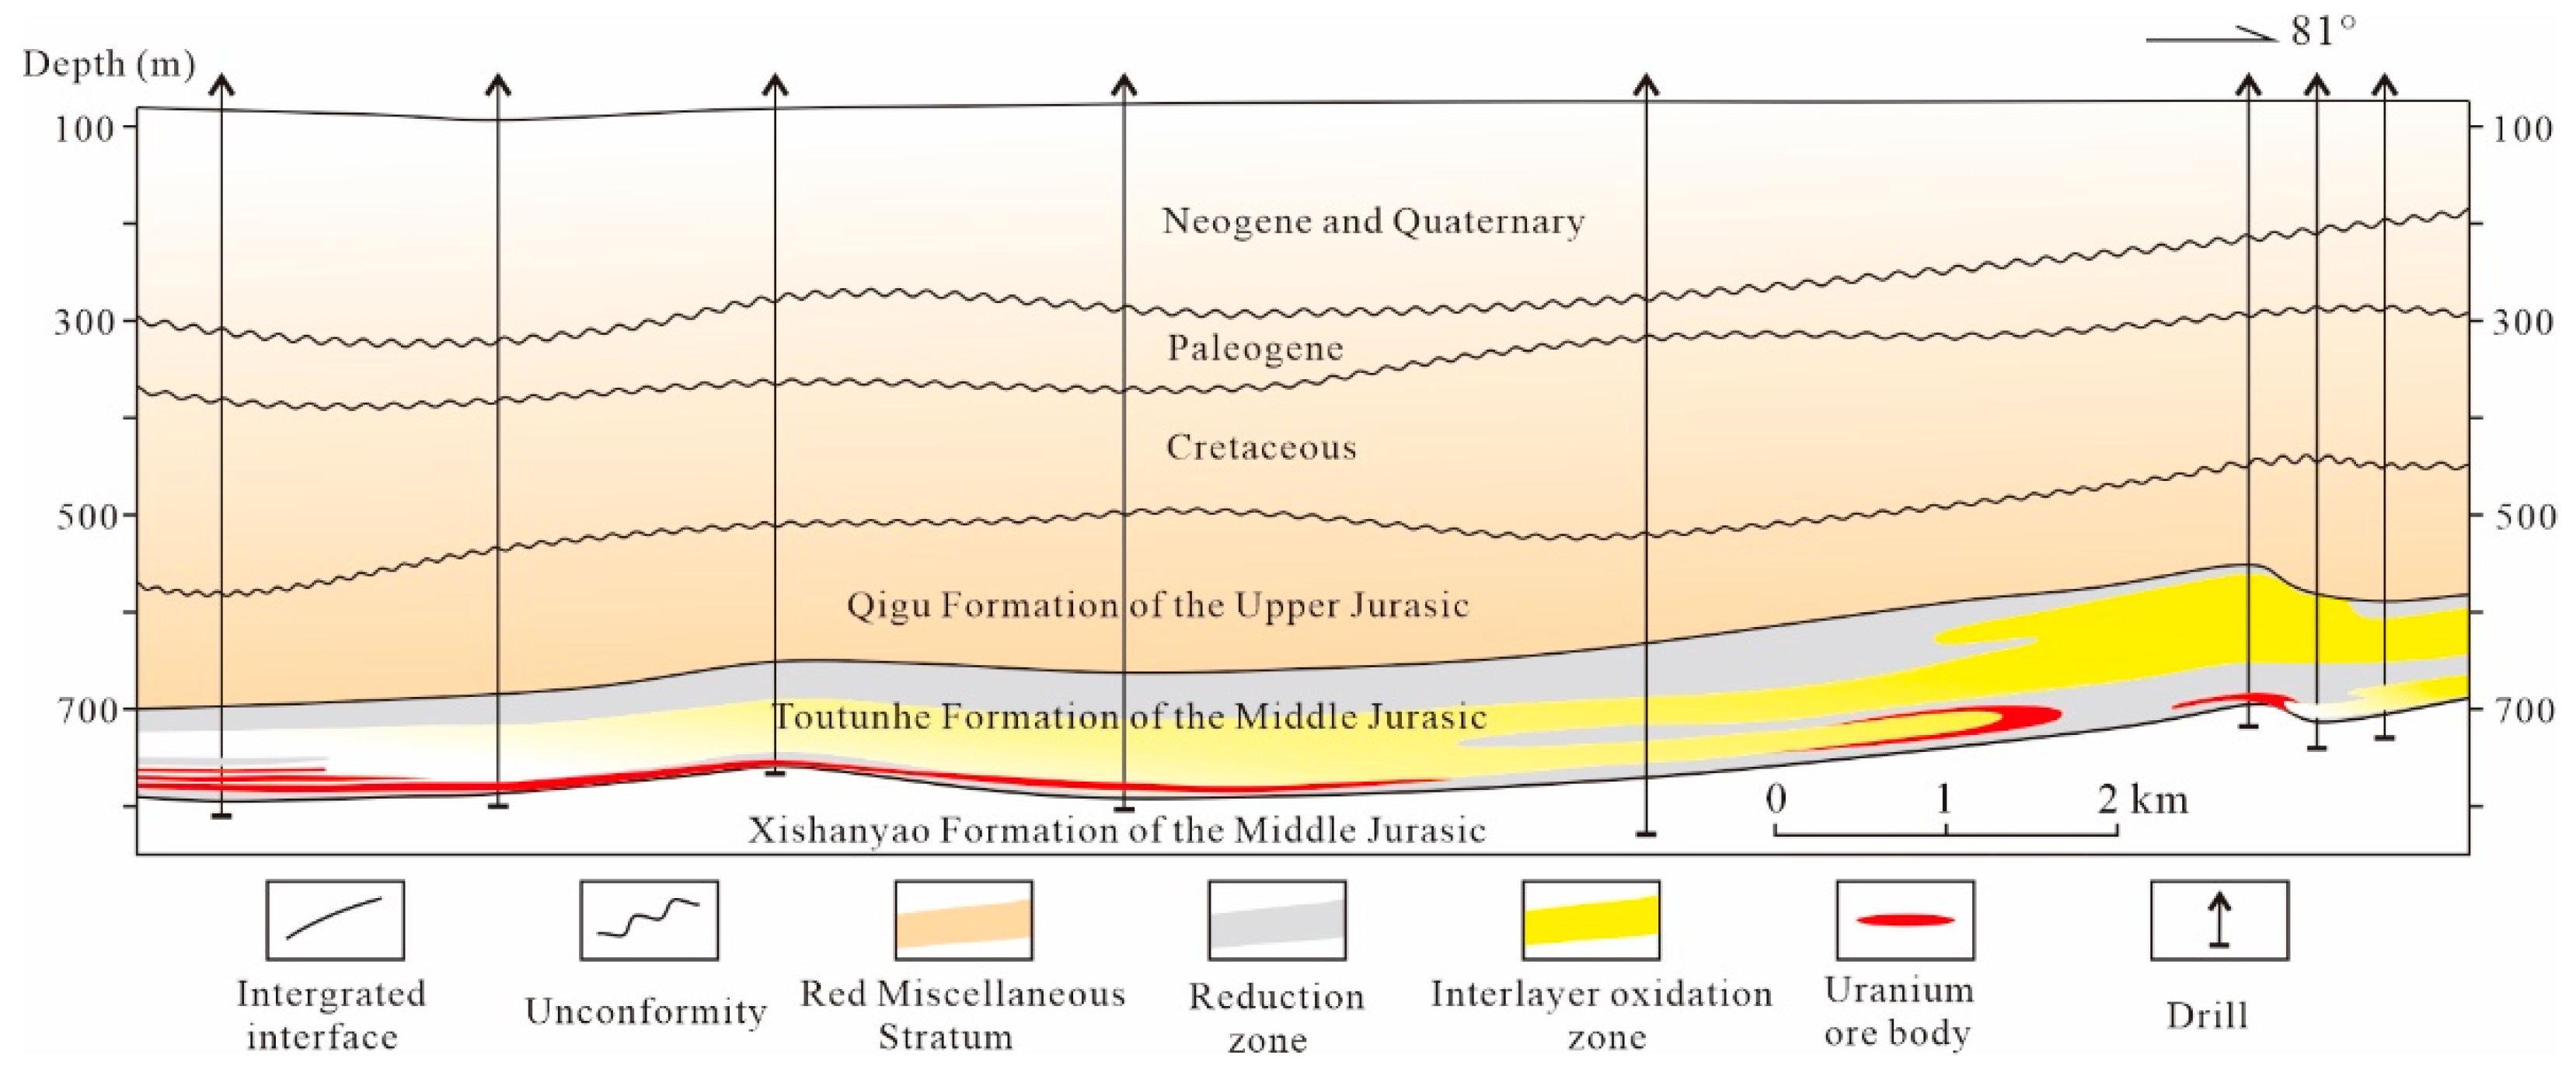
2.3. Uranium Mineralization

The Kamust U deposits occur in the Toutunhe Formation (J2t). The total length of the interlayer oxidation zone is approximately 110 km, with a width of 200–600 m, and the interlayer oxidation zone is approximately 5–30 km from the current provenance area [22]. Thus far, several industrial uranium and mineralized holes have been detected along the front of the interlayer oxidation zone, constituting a uranium mineralized zone approximately 100 km long. Mineralization with roll-like or tabular shapes occurs at the lower flank of the interlayer oxidation zone, and some occur at the upper flank and pinch-out site of the interlayer oxidation zone, which are controlled by the oxidation zone (Figure 2).
The uranium ore grade ranges from 0.0100 % U to 0.1103 % U. The thickness of the mineralized intervals ranges from 0.2 m to 3.1 m, and the burial depth ranges from 600 m to 900 m [21]. The U mineralization-hosting strata consist of sandstone - composed of gray-colored fine- to medium-grained sandstone and sandy conglomerate, and was formed in braided river delta facies. The sand grains have good sorting, medium roundness, and subangular sphericity and are mainly composed of lithic grains, quartz, and feldspar, with clay cementation and loose consolidation. The lithic grains of sandstone are mainly composed of a large number of acid magmatic lithologies (Figure 3), of which granite porphyry and granite material account for more than 50%, rhyolite, andesite, and pyroclastic material account for approximately 20%. Metamorphic material accounts for approximately 10%, with a small amount of sedimentary material. The sandstone lithology shows that the sediment source of the Toutunhe Formation (J2t) is mainly composed of intermediate–acid magmatic rocks, such as granite, granite porphyry, rhyolite, and andesite.
Uranium mineralization is rich in carbon detritus and pyrite, which contribute to uranium mineral precipitation [22]. The occurrences of uranium are mainly pitchblende, followed by a small amount of coffinite, adsorption-state uranium, and other uranium-bearing minerals. Uranium minerals are mostly distributed in the dissolution pores of rock fragments and around pyrite. Intergranular pores of the mineralization are filled with a large number of clay minerals composed of kaolinite and illite, which are mainly eroded from acidic rock material. Pitchblende mostly fills the dissolution pores of fragments, particularly the dissolution pores or edges of granite (Figure 4a) and feldspar (Figure 4b). Locally, pitchblende can replace granite fragments along the microfractures (Figure 4c–e) and are wrapped by anhedral pyrite (Figure 4f), indicating that pyrite may be formed simultaneously or after the uranium minerals. Furthermore, pitchblende also can replace rutile with residually recognizable crystal structure, forming uranium-bearing rutile (Figure 4g). Nano-sized spherical coffinite can coexist with clay minerals and are often attached to (in the form of globules) illite (Figure 4h). Adsorption-state uranium is usually adsorbed by illite (Figure 4i) and organic matter. According to the electron probe microanalysis, the average composition of pitchblende is 80.18% UO2, 2.6% SiO2, 3.69% CaO, 2.17% TiO2, and 1.1% MnO, while the average composition of coffinite is 61.58% UO2, 17.04% SiO2, 3.46% CaO, 3.32% P2O5, 1.44% Al2O3, 0.46% Na2O, 0.23% Yb2O3, 2.23% Y2O3 [22]. In situ rare trace element compositions from a single uranium mineral grain demonstrate that both pitchblende and coffinite are strongly enriched in REE.

3. Sampling and Analysis Methods

3.1. Apatite Fission Track (AFT) Analysis

Sandstone-type uranium deposits in sedimentary basins were generally formed in the Mesozoic and Cenozoic—young metallogenic ages [47,48]. Apatite low-temperature thermochronology is characterized by simultaneous records of cooling age and thermal history, which provides scientific proof for the quantitative study of orogenic uplift and denudation. Because of the low closure temperature of the AFT system, it is sensitive to geothermal events. This method can record the latest tectonic thermal activity age and effectively analyze the uplift and denudation of the Mesozoic–Cenozoic orogen. To investigate the Mesozoic–Cenozoic tectonic uplift and denudation history of the orogenic belt in the eastern Junggar Basin, seven, six, and three samples were collected from Altay, Qinglidi, and Karameri Mountains, respectively (Figure 1c). Each sample weighed more than 5 kg, and apatites were selected for the AFT test. All samples were collected from the original location and fresh intermediate-acid magmatic rocks. The external detector method was employed to perform the AFT analysis. The analysis was conducted at the China University of Geosciences (Beijing). The specific testing process is summarized as follows: First, apatite grains were mounted on epoxy resin and polished to expose the internal grain surfaces, and spontaneous tracks were revealed by etching using HNO3 solution (5.5 mol/L) for 20 s at 25 °C. Then, low-uranium polysilicon muscovite was packed with the thin polished section, and the muscovite outer detector was irradiated with thermal neutrons. After irradiation, the cooled muscovite outer detector was eroded in HF (hydrogen fluoride) (40%) for 20 s at 25 °C to expose its induced fission tracks and complete the neutron flux calibration. Finally, the FTD-AS3000B system manufactured by the Autoscan Systems Pty. Ltd., Victoria, Australia, was used to measure the fission track length, and the zeta (ζ) constant was used to calculate the age. To analyze the annealing kinetic characteristics of apatite with different components, the confined track length, Dpar value, and C-axis angle of apatite were measured while obtaining the fission track statistics. Based on these data, the fission track time-temperature history was simulated by the HeFTy (V1. 9.3) software developed by Apatite to Zircon, Inc., Idaho, United States [49]. The simulation conditions are as follows: (i) The multivariate dynamic annealing model was used [50]; (ii) The Dpar value was used to determine the thermokinetic parameters [51]; (iii) The estimated value of the initial track length was based on the Dpar value according to the formula Lo = 0.283 + 15.63 × Dpar; (iv) The Kolmogorov-Smirnov (K-S) test was selected as the optimal equation for length fitting; (v) The direct simulation Monte Carlo was selected as the simulation method; and (vi) The number of fitting curves was 10,000. The goodness-of-fit (GOF) function was used to evaluate the fitting effect between simulation and observation. When the GOF values of the fission track age and track length exceeded 0.05, the simulation results were considered acceptable. When the GOF values of the fission track age and track length exceeded 0.5, the simulation results would be considered high quality.

3.2. Detrital Zircon U-Pb Dating Analysis

The uranium minerals in the Kamust uranium deposit are genetically closely-related to granite fragments. Granite is one of the dominant rocks in the provenance areas of the eastern Junggar Basin. To identify the provenance areas of the U mineralization-bearing strata and analyze the influence of the tectonic uplift and denudation process of the orogenic belt on the mineral composition of sediments in the Kamust uranium deposit, a total of six sandstone samples were uniformly collected from each formation of the Triassic and Jurassic strata. Samples KT-01 and KT-06 were collected from the Cangfg Formation (T1–2c) of the Middle–Lower Triassic and the Laoyg Formation (T3l) of the Upper Triassic, respectively. Samples KT-02, KT-03, KT-05, and KT-07 were collected from the Badaowan, Sangonghe, Xishanyao, and Toutunhe Formations, respectively (Figure 1d). Approximately 90–120 zircons were randomly selected from each sample for U-Pb and Hf isotope tests. The internal structures were examined under transmitted and reflected light and imaged by cathodoluminescence. U-Pb dating of zircon was conducted by LA-ICP-MS. The detailed operating conditions for the laser ablation system and the ICP-MS instrument and data reduction were the same as reported by Wu et al. [52]. The experiment was conducted at the Beijing Research Institute of Uranium geology. The Excel-based software ICPMSDataCal (V9.5) developed by China University of Geosciences (Wuhan), China, was used to perform the off-line selection and integration of background and analyzed signals, time drift correction, and quantitative calibration for U-Pb dating [53,54]. Concordia diagrams and weighted mean calculations were made using Isoplot/Ex_ ver3 which was developed by Ludwig (2012) from the Berkeley Geochronology Center, United States [55]. In situ Hf isotope tests of zircon and zircon U-Pb dating were conducted on the same ICP-MS system, and the samples were denuded only once. For the specific method, refer to the study of Yuan et al. [56].

4. Analysis Results

4.1. AFT Ages

Among the 16 samples collected in this study, more than 20 single-grain AFT ages were obtained from each sample. The number of single-grain AFTs of A-7 is small, and its fission track ages are only for reference. The single-grain track length test number of most samples is more than 100. The P2) (AFT age test probability) values of five samples (i.e., Q-6, Q-13, A-2, A-4, and A-5) are less than 5%, indicating that the single-grain AFT age of the samples is dispersed and the median age should be used. The P2) values of the other samples exceed 5%, indicating that the age difference among grains of the sample has a statistical error and a single-grain average AFT age; thus, the pooled age should be used. The AFT ages of all samples ranged from 247.5 ± 7.3 Ma to 54 ± 3.2 Ma (Table 1), which are less than the formation age of the samples. They are distributed from the Early Triassic to the Eogene, representing the period of sample uplift to the AFT closure temperature.
The AFT ages of the Karameri Mountain range from 123 ± 11 Ma to 197 ± 13 Ma, and the track lengths range from 13.4 ± 2.1 µm to 14.6 ±1.8 µm. The AFT ages of the Qinglidi Mountain range from 52 ± 42 Ma to 250.8 ± 7.5 Ma, and the track lengths range from 11.2 ± 2.6 µm to 13.5 ± 2.4 µm, including the data from Li et al. [57] and Li et al. [34]. The AFT ages of the Altay Mountains range from 38 ± 7.1 Ma to 92 ± 5.6 Ma, and the track lengths range from 10.4 ± 2.8 µm to 13.2 ± 1.9 µm. The data of the samples from the three mountains show similar characteristics. The track length distribution is slightly wider and has a single-peak trend, which is an undisturbed bedrock type, showing that the samples underwent a relatively simple uplift thermal–cooling path. The AFT ages show a younging trend from south to north in space, whereas the track length data show a trend of becoming shorter, indicating that the apatite of the Karameri Mountain underwent annealing earlier and the apatite of the Altay Mountains underwent annealing later.

4.2. Uplift Thermal Path of the Orogenic Belt

The thermal path evolution simulations of 10 samples were obtained with satisfactory results. Among the 10 samples, the thermal path of only one sample (i.e., K-9) from Karameri Mountain was obtained. Its GOF values of the AFT age and track length exceed 0.5, indicating a high-quality simulation result with a best-fit line. The GOF values of five samples (i.e., Q-2, Q-3, Q-8, Q-12, and Q-13) from the Qinglidi Mountain and four samples (i.e., A-2, A-3, A-4, and A-5) from the Altay Mountains also exceed 0.5.

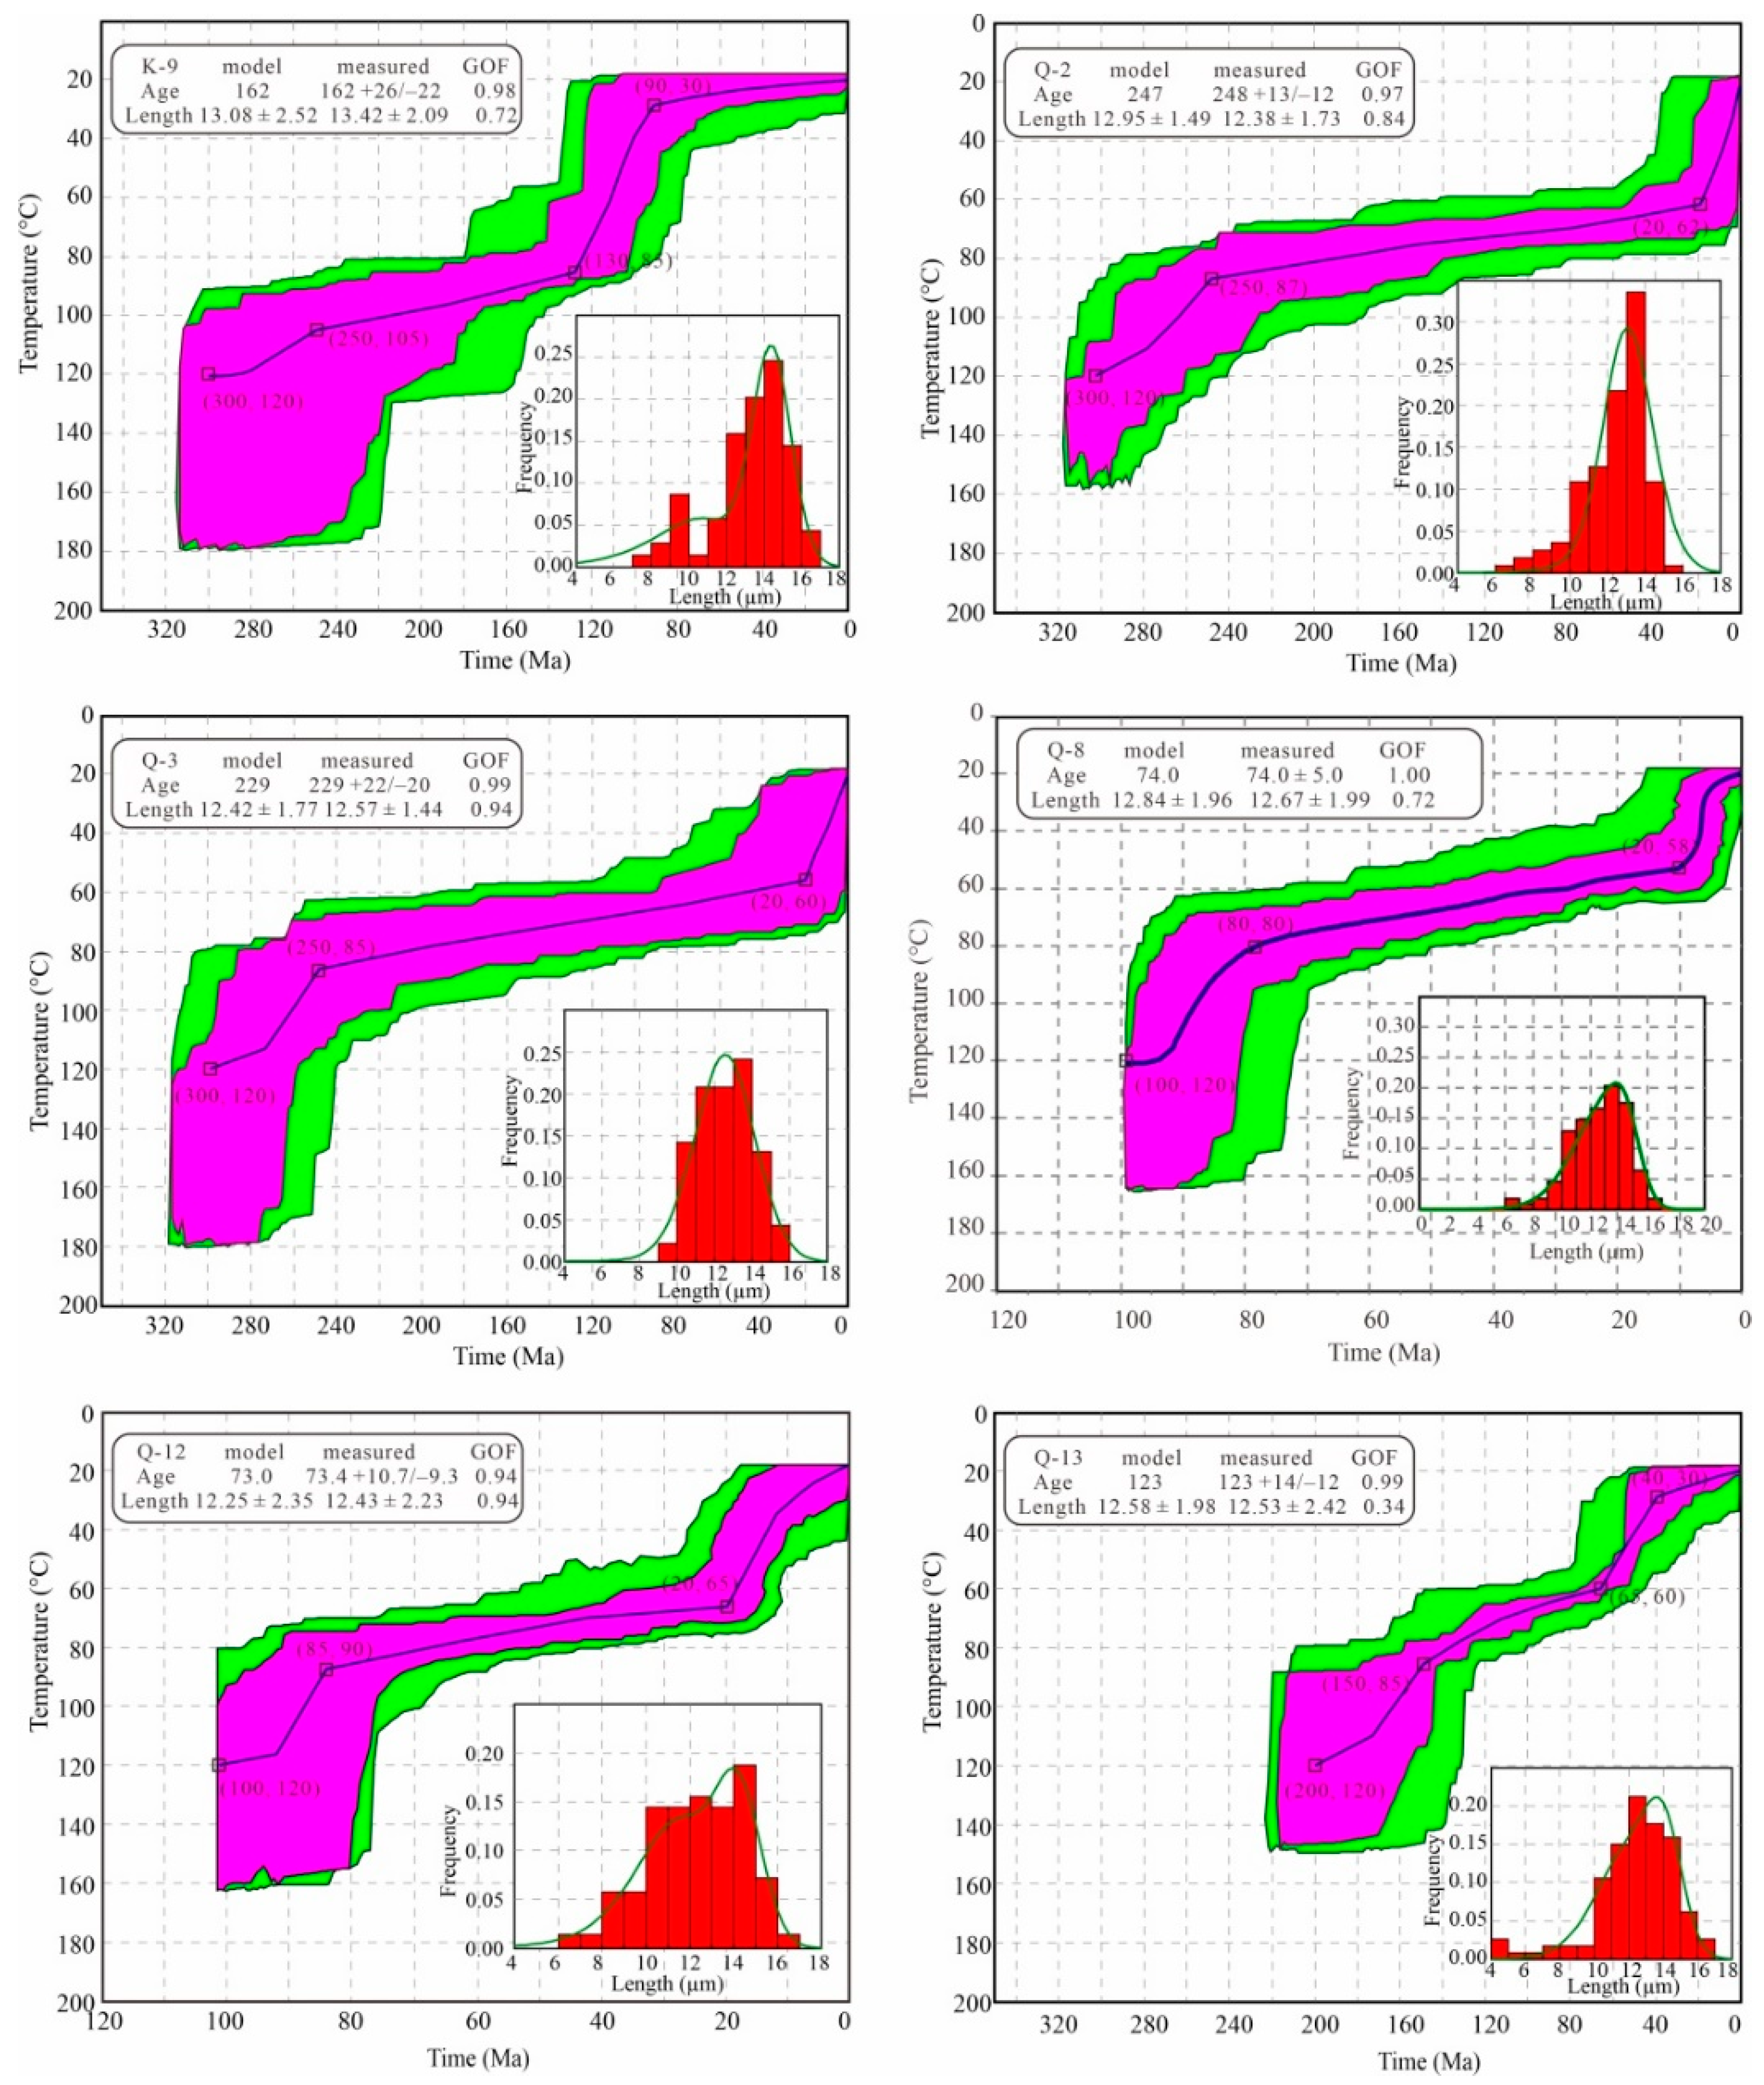
4.2.1. Karameri Mountain

The cooling path of the sample K-9 can be divided into four stages (Figure 5). Stage I is from approximately 300 Ma to approximately 250 Ma, with rapid cooling from 120 °C to 105 °C and a cooling rate of 0.3 °C/Ma. Stage II is from approximately 250 Ma to approximately 130 Ma, with slow cooling to 85 °C and a cooling rate of 0.17 °C/Ma. Stage III is from approximately 130 Ma to approximately 90 Ma, with rapid cooling to 30 °C and a cooling rate of 1.38 °C/Ma. Stage IV is from approximately 90 Ma to the present, with slow cooling to near-surface temperature and a cooling rate of 0.11 °C/Ma.

4.2.2. Qinglidi Mountain

The cooling paths of the samples Q-2 and Q-3 are similar and can be divided into three stages (Figure 5). Stage I is from approximately 300 Ma to approximately 250 Ma, with rapid cooling from 120 °C to 85 °C and a cooling rate of 0.7 °C/Ma. Stage II is from approximately 250 Ma to approximately 20 Ma, with slow cooling to 60 °C and a cooling rate of 0.11 °C/Ma. Stage III is from approximately 20 Ma to the present, with rapid cooling to near-surface temperature and a cooling rate of 2 °C/Ma.
The cooling paths of samples Q-8 and Q-12 are similar and can be divided into three stages. Stage I is from approximately 100 Ma to approximately 80 Ma, with rapid cooling from 120 °C to 80 °C and a cooling rate of 2 °C/Ma. Stage II is from approximately 80 Ma to approximately 20 Ma, with slow cooling to 58 °C and a cooling rate of 0.37 °C/Ma. Stage III is from approximately 20 Ma to the present, with slow cooling to near-surface temperature and a cooling rate of 1.9 °C/Ma.
The cooling path of the sample Q-13 can be divided into four stages. Stage I is from approximately 200 Ma to approximately 150 Ma, with rapid cooling from 120 °C to 85 °C and a cooling rate of 0.7 °C/Ma. Stage II is from approximately 150 Ma to approximately 65 Ma, with slow cooling to 60 °C and a cooling rate of 0.29 °C/Ma. Stage III is from approximately 65 Ma to approximately 40 Ma, with rapid cooling to 30 °C and a cooling rate of 1.2 °C/Ma. Stage IV is from approximately 40 Ma to the present, with slow cooling to near-surface temperature and a cooling rate of 0.25 °C/Ma.

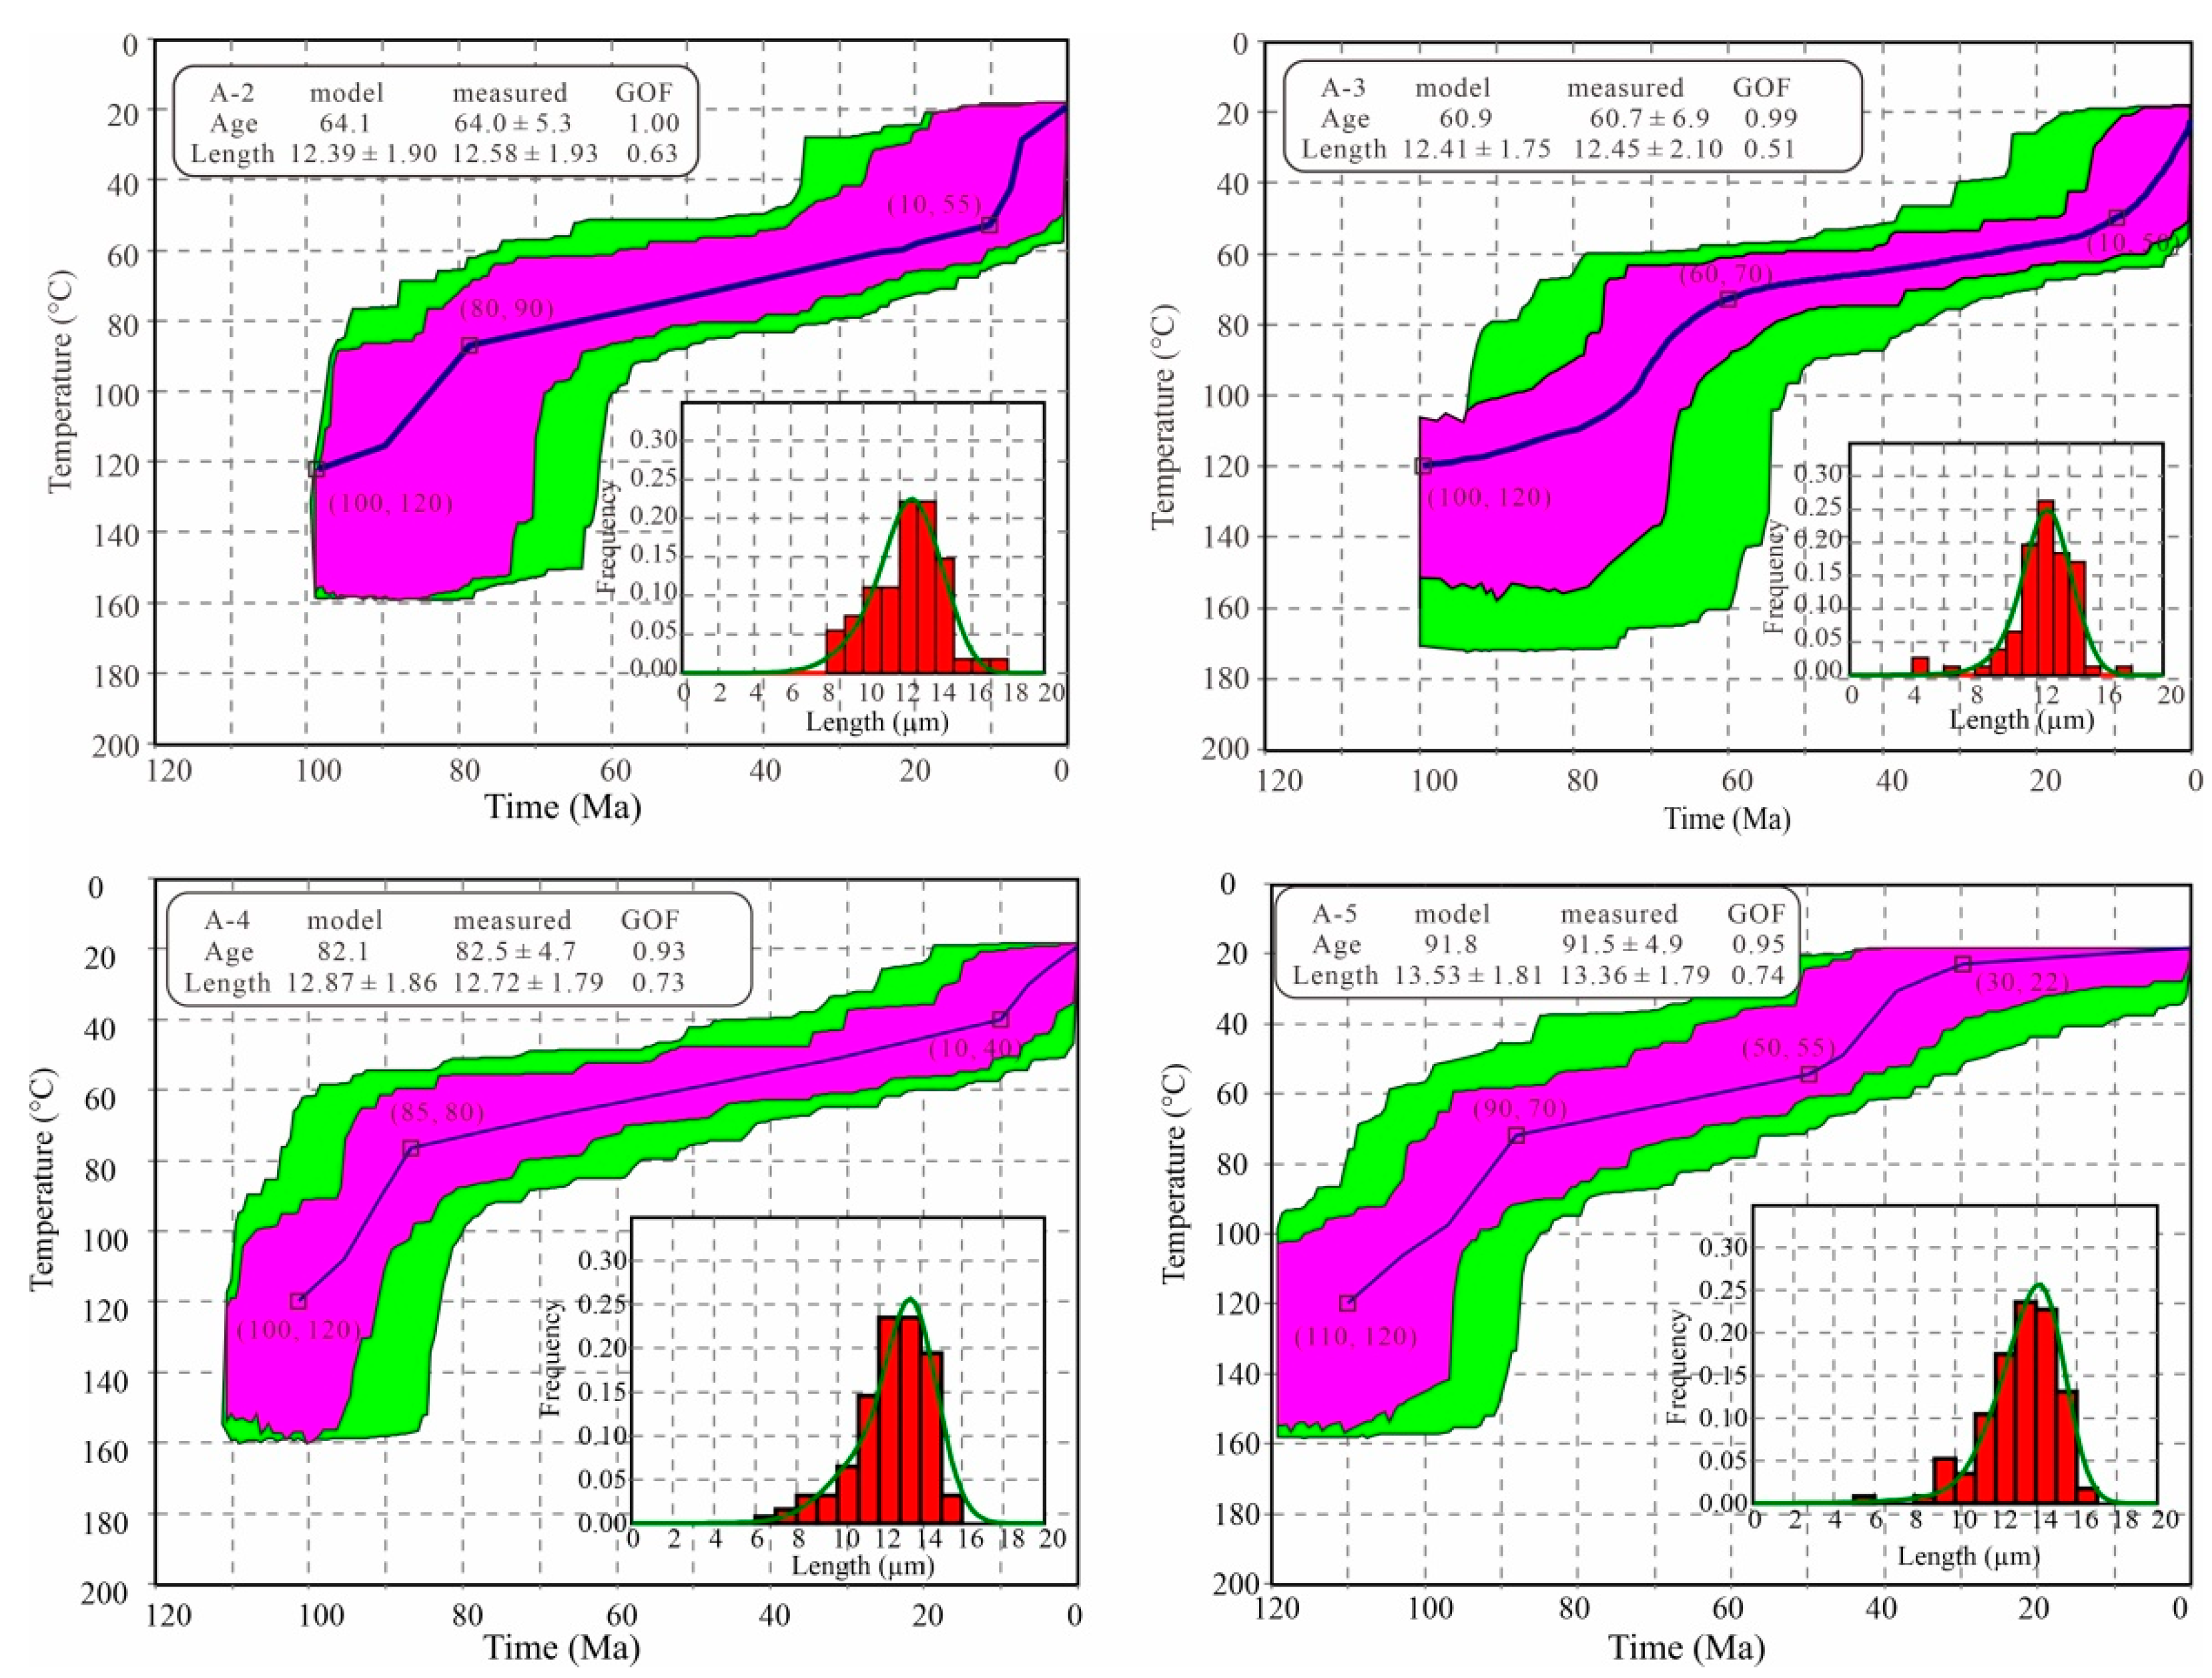
4.2.3. Altay Mountain

The cooling paths of samples A-2 and A-4 are similar and can be divided into three stages (Figure 6). Stage I is from approximately 100 Ma to approximately 80 Ma, with rapid cooling from 120 °C to 90 °C and a cooling rate of 1.5 °C/Ma. Stage II is from approximately 80 Ma to approximately 10 Ma, with slow cooling to 55 °C and a cooling rate of 0.57 °C/Ma. Stage III is from approximately 10 Ma to the present, with rapid cooling to near-surface temperature and a cooling rate of 3.5 °C/Ma.
The cooling path of sample A-3 can also be divided into three stages. Stage I is from approximately 100 Ma to approximately 60 Ma, with rapid cooling from 120 °C to 70 °C and a cooling rate of 1.75 °C/Ma. Stage II is from approximately 60 Ma to approximately 10 Ma, with slow cooling to 50 °C and a cooling rate of 0.4 °C/Ma. Stage III is from approximately 10 Ma to the present, with rapid cooling to near-surface temperature and a cooling rate of 3 °C/Ma.
The cooling path of sample A-5 can be divided into four stages. Stage I is from approximately 110 Ma to approximately 90 Ma, with rapid cooling from 120 °C to 70 °C and a cooling rate of 3.5 °C/Ma. Stage II is from approximately 90 Ma to approximately 50 Ma, with slow cooling to 55 °C and a cooling rate of 0.38°C/Ma. Stage III is from approximately 50 Ma to approximately 30 Ma, with rapid cooling to 22 °C and a cooling rate of 1.65 °C/Ma. Stage IV is from approximately 30 Ma to the present, with slow cooling to near-surface temperature and a cooling rate of 0.07 °C/Ma.

4.3. Detrital Zircon U-Pb Dating Results

Most detrital zircons from the samples are light yellow, colorless, light pink, and brown, with rounded or subangular shapes, indicating long-distance transportation or the occurrence of erosion and sedimentation. A small proportion of zircon grains is angular with low textural maturity, indicating a near-source deposition. The internal structure of zircons is characterized by alternately bright–dark oscillatory zones (Figure 7), with Th/U ratios of more than 0.4 (Figure 8), indicating the characteristics of typical magmatic origin [58]. Most older zircons (>1.0 Ga) exhibit loss of Pb; therefore, the 207Pb/206Pb ages can more reliably represent the diagenetic age of the rock [59]. In terms of zircons less than 1.0 Ga, the 206Pb/238U ages represent the diagenetic age. The ages with a concordance rate of less than 90% are not accepted nor discussed.

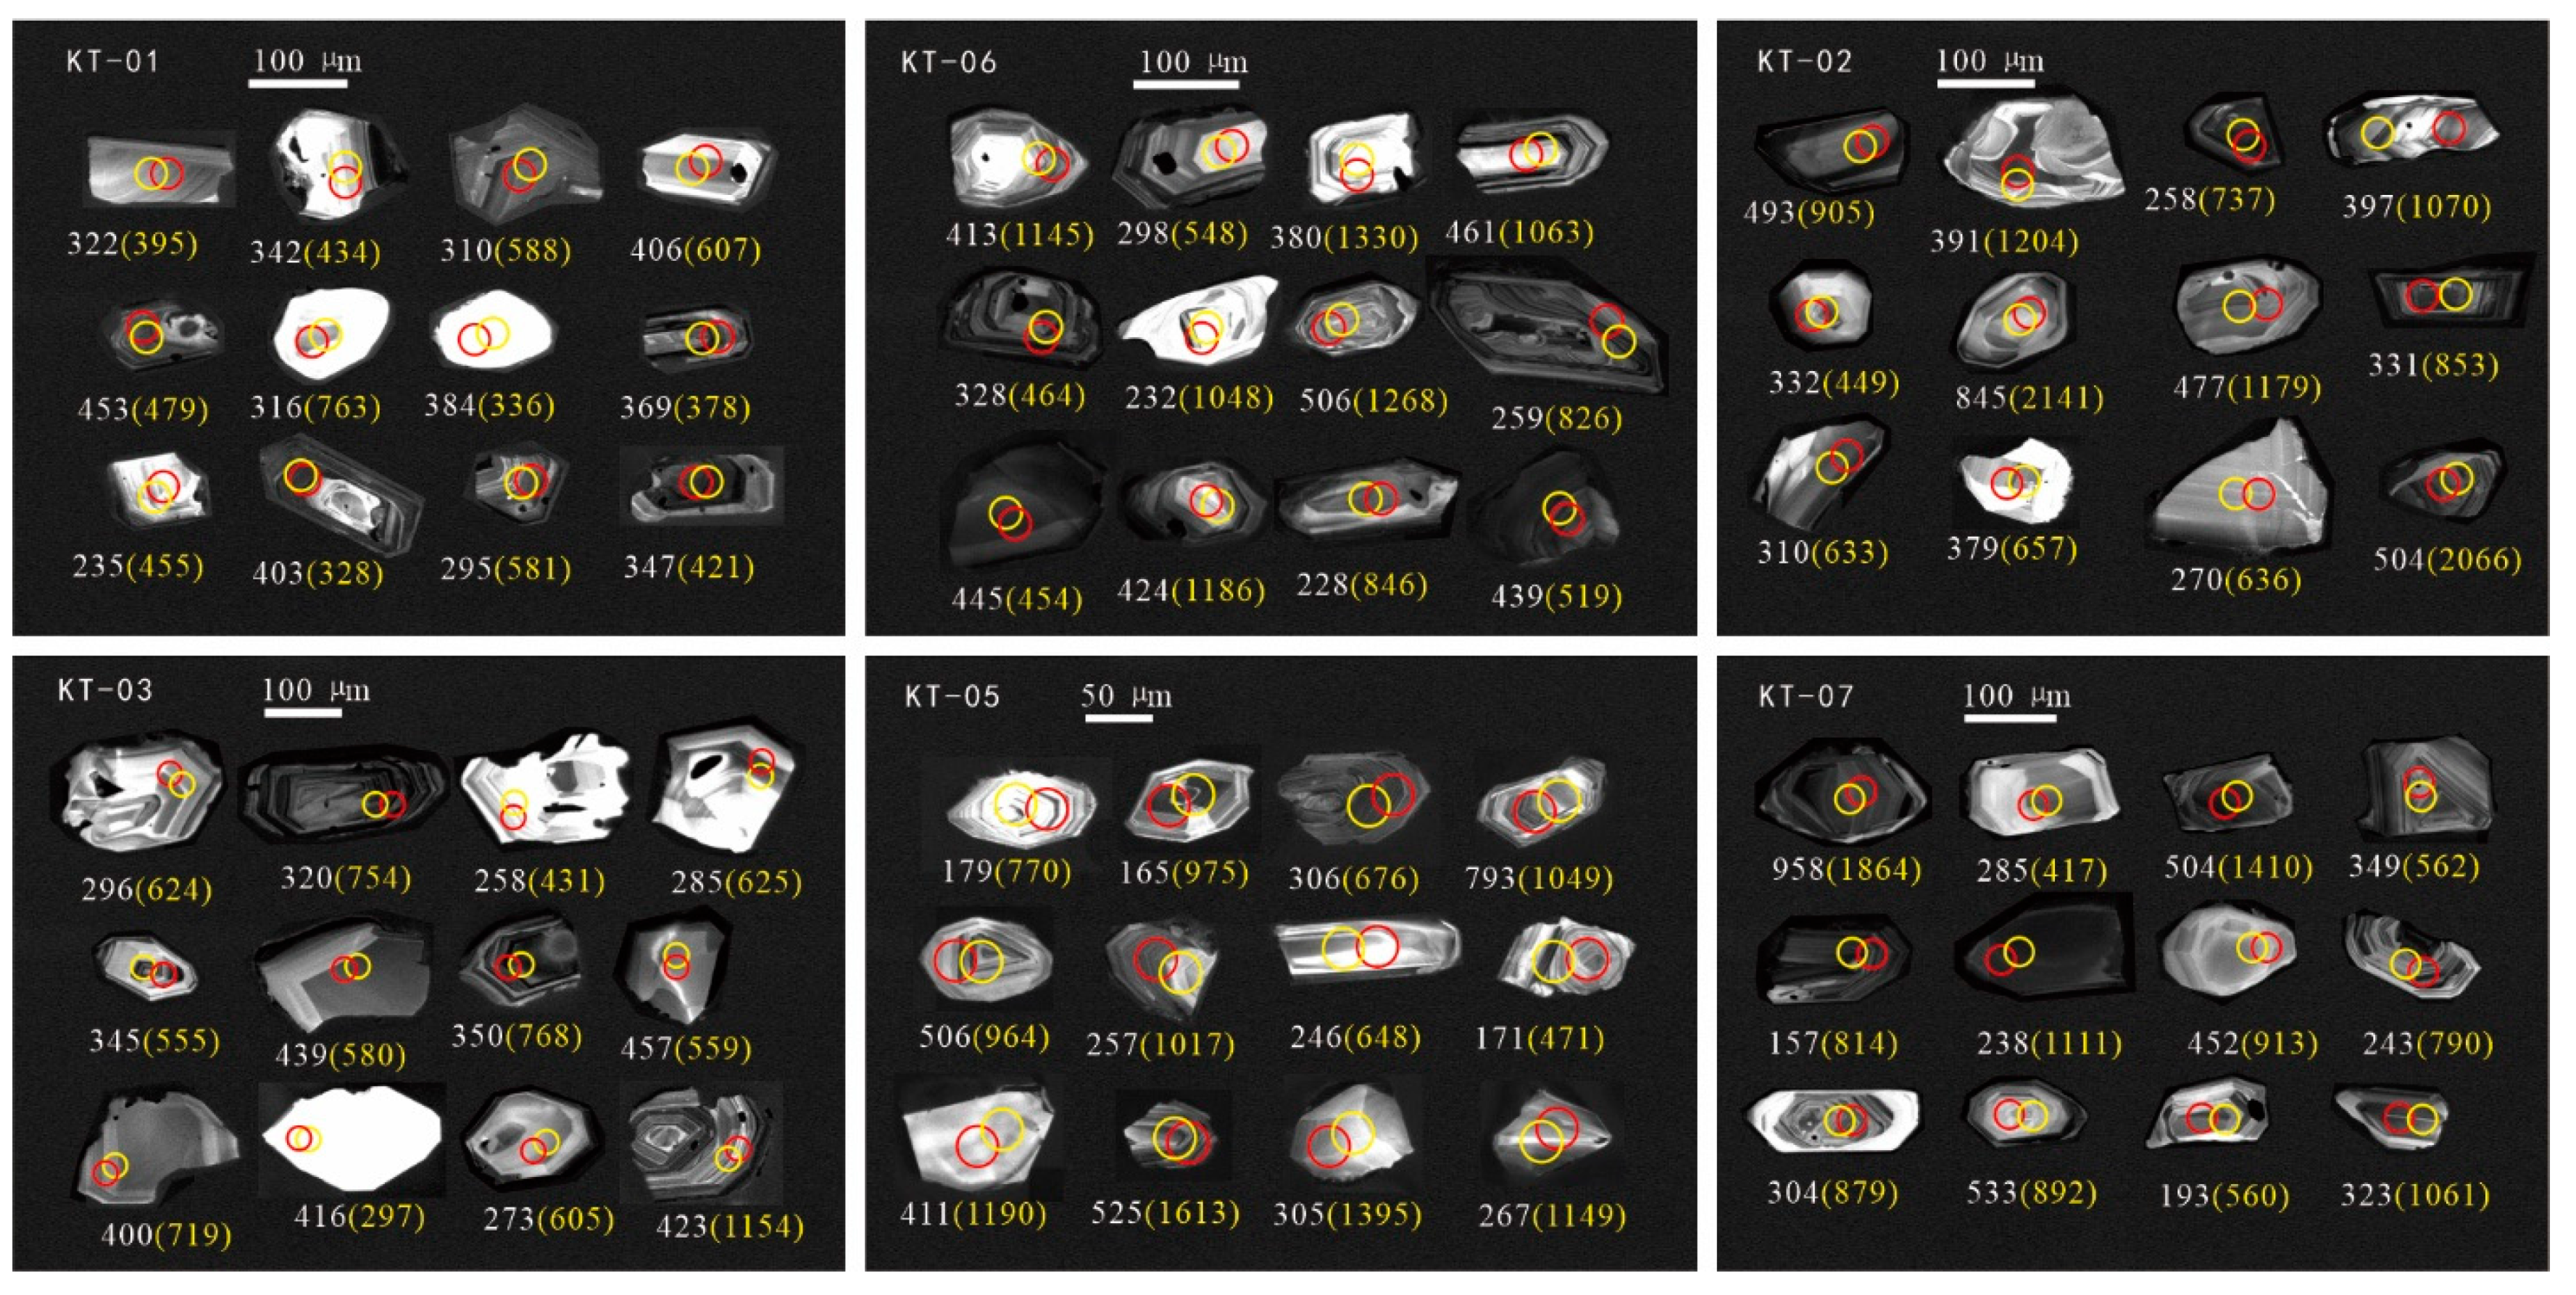
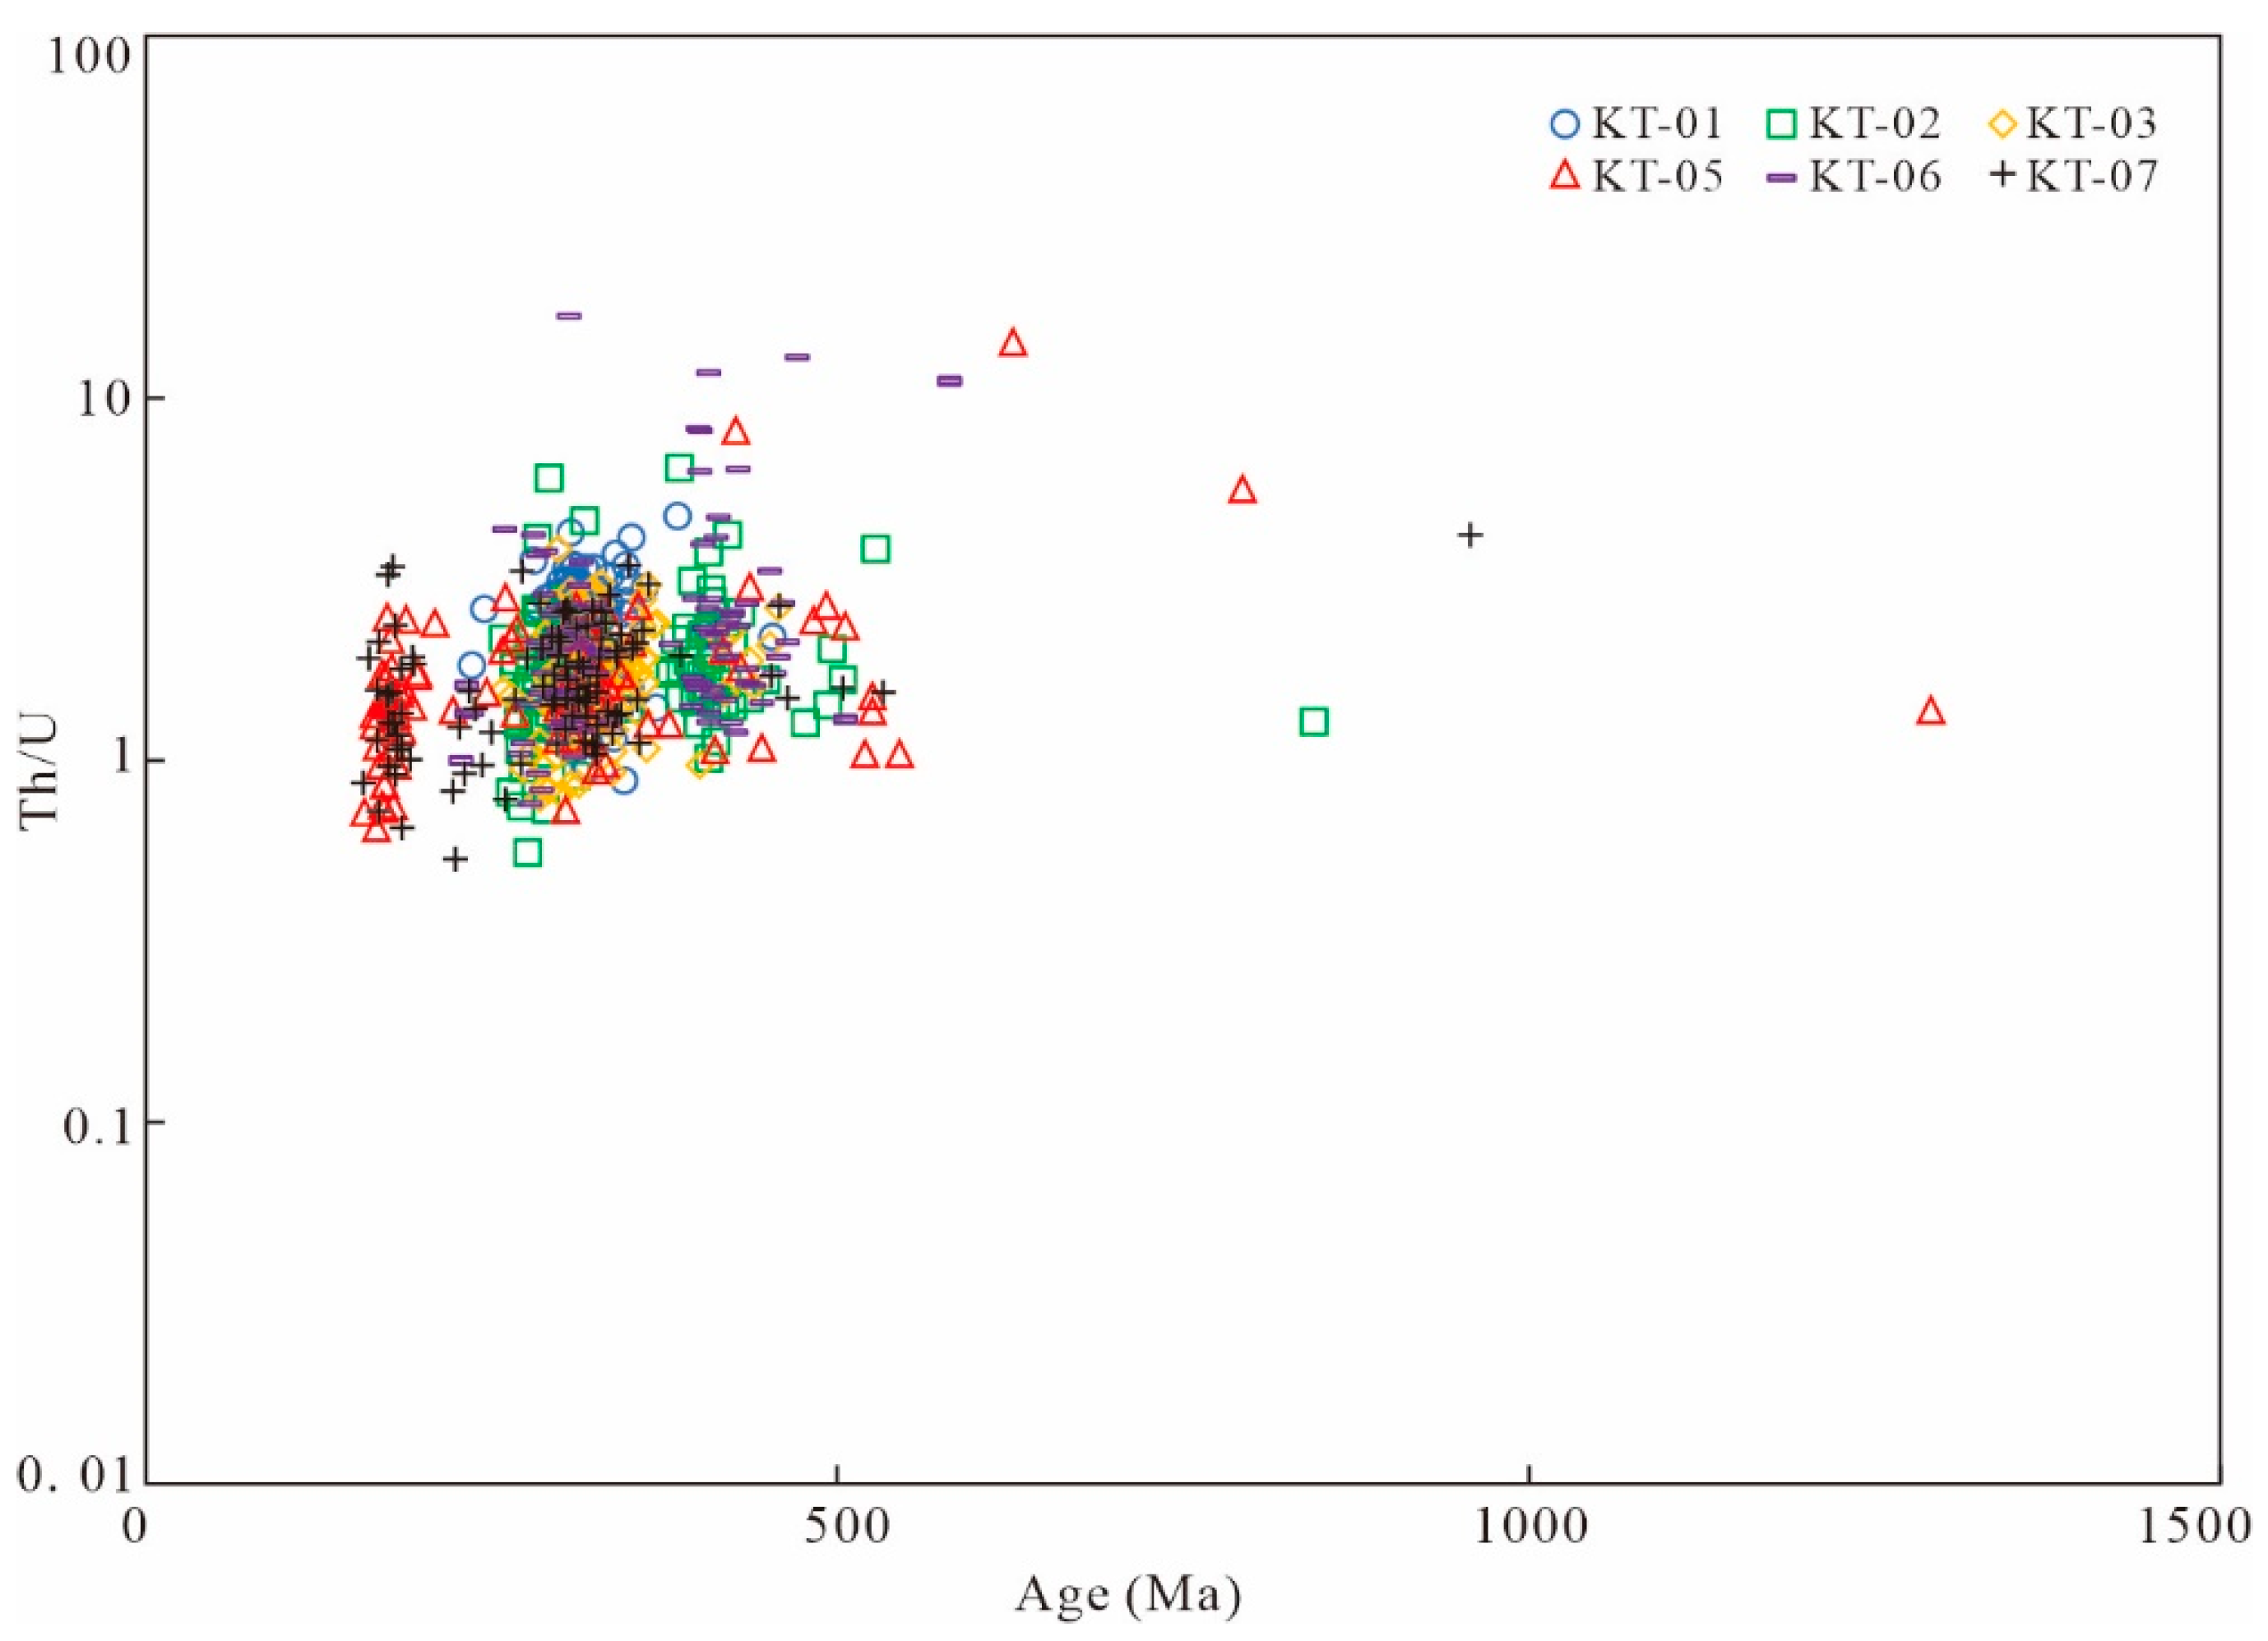
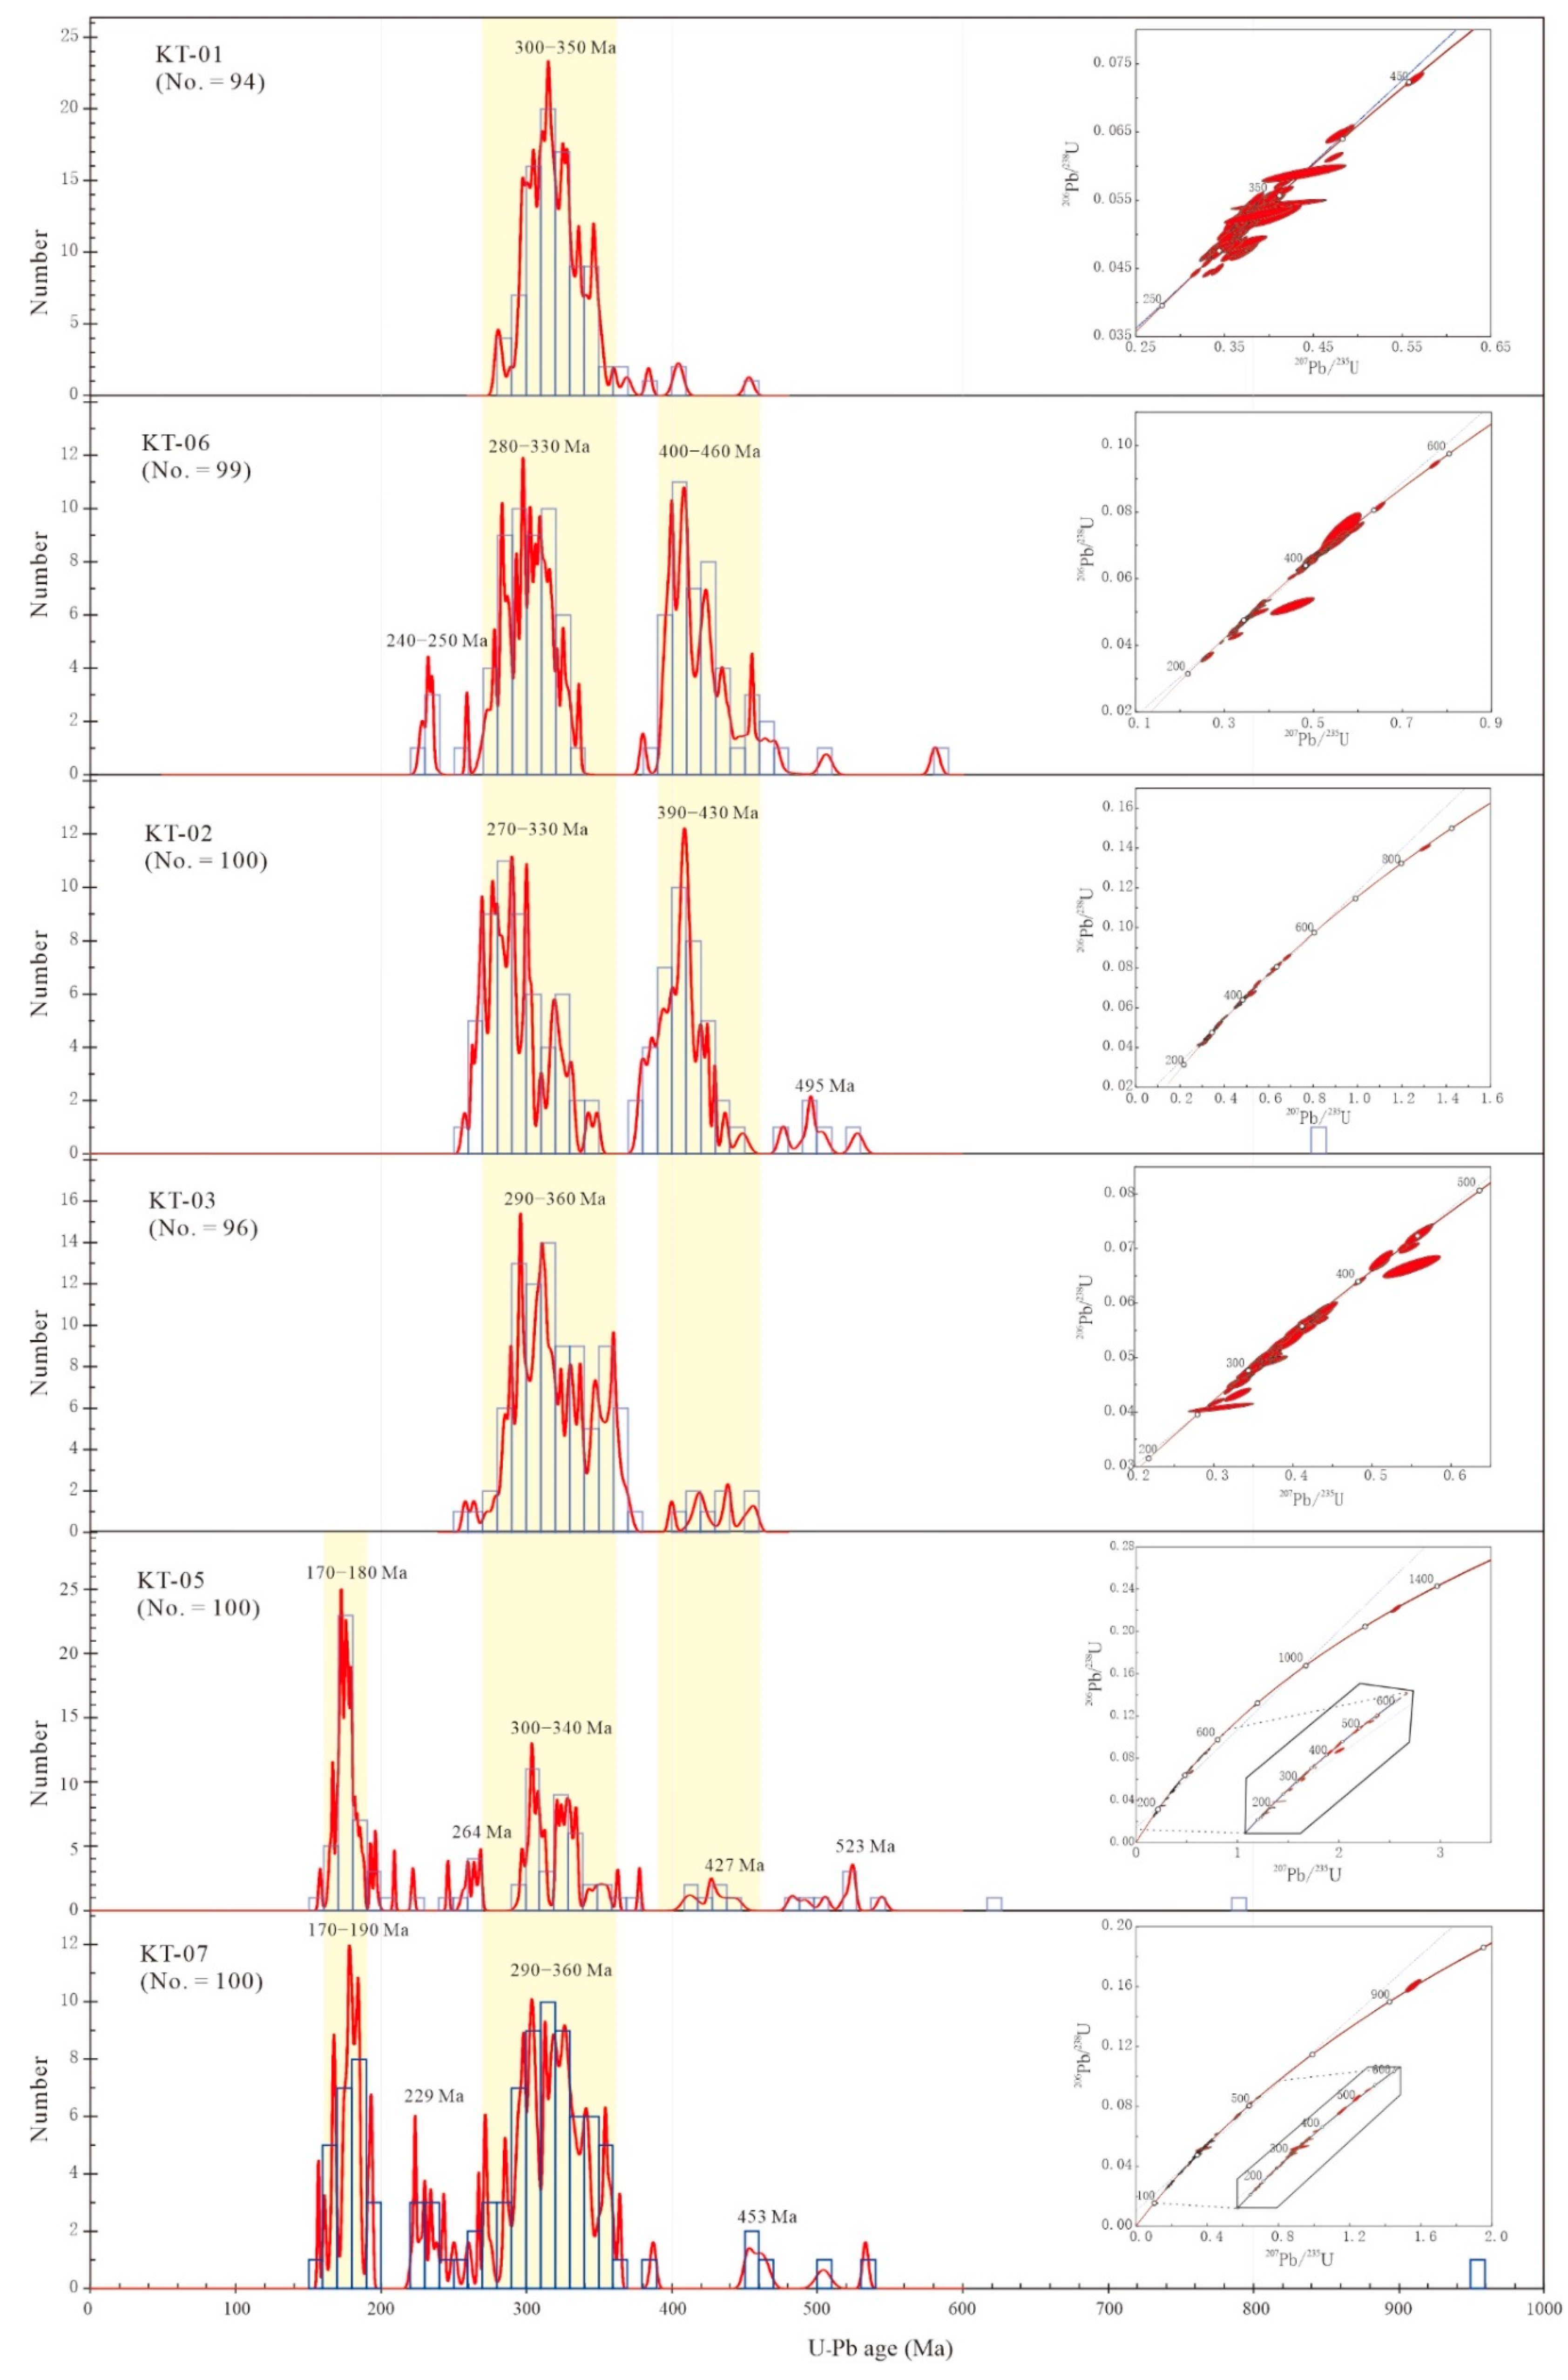
4.3.1. Detrital Zircon U-Pb Ages

Sample KT-01 from the Cangfg Formation: A total of 95 zircons were randomly tested, of which discordant ages of 6 zircons are not accepted because the concordance rate was less than 90%. The 206Pb/238U ages of 89 zircons range from 280 ± 2 Ma to 453 ± 3 Ma, (Table S1), and the main peak ages range from 300 Ma to 350 Ma (Figure 9).
Sample KT-06 from the Laoyg Formation: A total of 100 zircons were randomly tested, and 99 concordant U-Pb ages were obtained. The 206Pb/238U ages vary between 228 ± 2 Ma and 581 ± 3 Ma. Two age peaks were obtained, i.e., 280–330 Ma and 400–460 Ma, with a subpeak of 240–250 Ma.
Sample KT-02 from the Badaowan Formation: A total of 100 zircons were randomly tested. The U-Pb isotopic data of all zircons are plotted on the concordia curve. The 206Pb/238U ages vary between 258 ± 2 Ma and 528 ± 4 Ma, with one aged 845 Ma. Two age peaks were obtained, i.e., 270–330 Ma and 390–430 Ma, with a subpeak of 495 Ma.
Sample KT-03 from the Sangonghe Formation: A total of 96 zircons were randomly tested. The U-Pb isotopic data of all zircons are plotted on the concordia curve. The 206Pb/238U ages vary between 258 ± 2 Ma and 457 ± 3 Ma, and most zircon ages are distributed between 273 Ma and 370 Ma, with the main peak of 290–360 Ma and a subpeak of 400–460 Ma.
Sample KT-05 from the Xishanyao Formation: A total of 100 zircons were randomly tested. The U-Pb isotopic data of all zircons are plotted on the concordia curve. The 206Pb/238U ages vary between 158 ± 1 Ma and 1291 ± 8 Ma. The main peak ranges from 170 Ma to 180 Ma, with a subpeak of 300–340 Ma and three minor peaks of 264, 427, and 523 Ma. Moreover, two older zircons aged 793 and 1,291 Ma were detected.
Sample KT-07 from Toutunhe Formation: A total of 100 zircons were randomly tested, and the U-Pb isotopic data of all zircons were plotted on the concordia curve. The 206Pb/238U ages of 100 concordant zircons vary between 157 ± 1 Ma and 958 ± 10 Ma. Two main age peaks, i.e., 170–190 and 290–360 Ma, were detected. Moreover, two minor peaks of 229 and 453 Ma and an older zircon aged 958 Ma were detected.

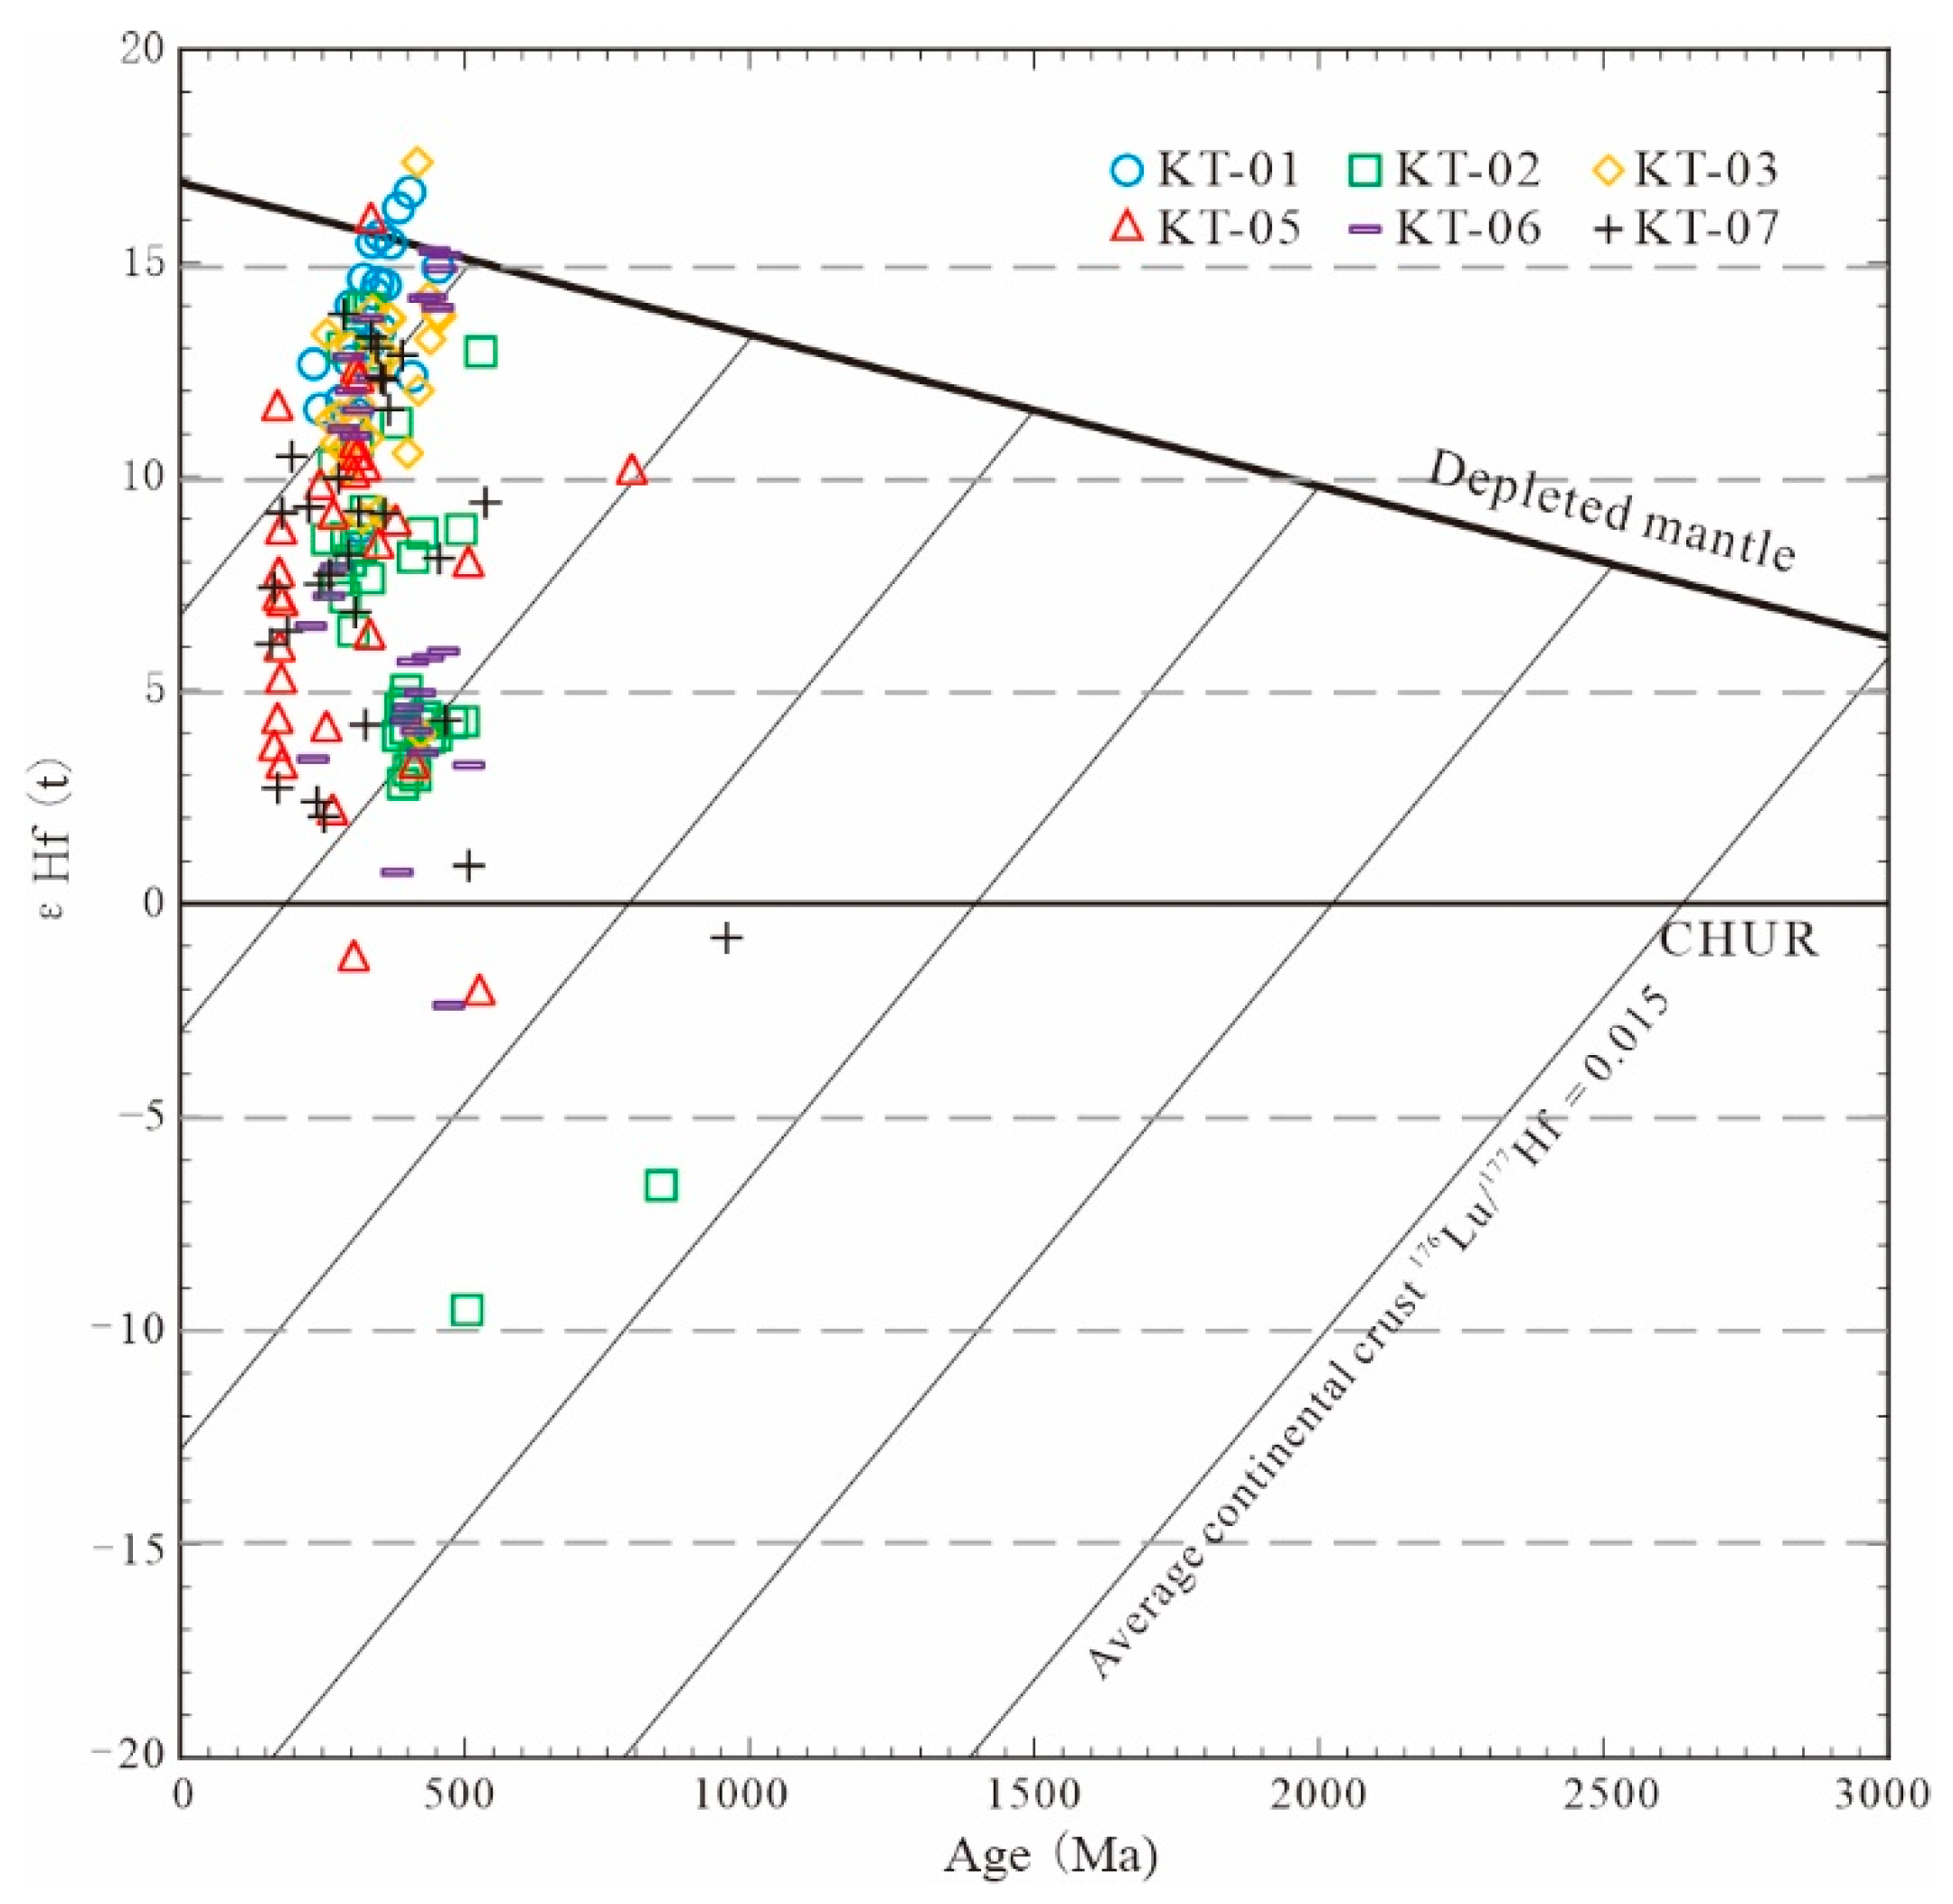
4.3.2. Hf Isotopic Data

Some detrital zircons with high concordance were selected for the in situ Hf isotope tests. The results showed that the 176Lu/177Hf ratios range from 0.000368 to 0.004487, (Table S2), compared with the present 176Hf/177Hf ratios ranging from 0.281581 to 0.283024. Except for a few zircons with 176Lu/177Hf ratios exceeding 0.002, the 176Lu/177Hf ratios of the other zircons are less than 0.002, indicating only a small amount of radioactive Hf accumulation after the formation of zircons. The 176Hf/177Hf ratios represent the Hf isotopic composition of the system.
The Hf two-stage model ages of six samples are widely distributed (i.e., 0.3–2.1 Ga), with peaks ranging from 0.3 Ga to 1.4 Ga. Of the ε Hf (t) values, 95% are from 2.06 Ga to 17.34 Ga (Figure 10), although a few zircons are negative, indicating that a large amount is derived from the new crust and a small amount is derived from the recycled material of ancient crust.

5. Discussion

5.1. Uplift and Denudation of the Eastern Junggar Basin Orogenic Belt

The apatite thermal path simulation results of the orogenic belt in the eastern Junggar Basin show four rapid uplifts, i.e., from approximately 300 Ma to approximately 250 Ma, from approximately 130 Ma to approximately 90 Ma, from approximately 65 Ma to approximately 30 Ma, and from approximately 20 Ma to the present. The analysis of the AFT ages of different tectonic blocks indicates that the uplift and denudation of the eastern orogenic belt exhibit heterogeneity in space.

5.1.1. Rapid Uplift Orogeny in the Permian

Samples K-9, Q-2, and Q-3 from Karameri and Qinglidi Mountains show a rapid uplift event in the Permian, i.e., approximately 300 Ma to approximately 250 Ma. The uplift rate of Qinglidi Mountain is faster than that of Karameri Mountain. The tectonic event in this period caused the Triassic strata to unconformably overlap with the Hercynian granite, indicating that Hercynian granite had been uplifted and denuded before the Triassic. The Permian is the transitional stage of accretionary orogeny and basin formation in the eastern Junggar Basin. The tectonic activity is considered to be caused by the incipient closure of the Junggar Ocean and local block collision, which is the Middle Tianshan movement [60]. Under its influence, the early orogenic belt in the eastern Junggar Basin uplifted intensively and underwent denudation, becoming the main provenance area. With the closure of the Junggar Ocean, seawater withdrew from the Junggar region, and the Junggar Basin was gradually formed. In the continental collision in the eastern Junggar Basin, the orogen overthrust toward the basin [61,62], formed a foreland basin in the piedmont zone, and shaped the paleomorphic pattern of the Jurassic aquifer in the area before its formation.

5.1.2. Rapid Uplift in the Cretaceous

The AFT ages and thermal path simulation results of the sample (i.e., K-9) from Karameri Mountain show that a rapid uplift occurred in the Early Cretaceous, i.e., approximately 130 Ma to approximately 90 Ma. The samples Q-8 and Q-12 from Qinglidi Mountain show tectonic uplift in the Middle Cretaceous, i.e., approximately 100 Ma to approximately 80 Ma. The samples A-2, A-3, A-4, and A-5 from Altay Mountain show tectonic uplift in the Middle and Late Cretaceous, i.e., approximately 110 Ma to approximately 60 Ma. The orogenic belt in the eastern Junggar Basin underwent tectonic uplift in the Cretaceous, with uplift age gradually becoming younger from south to north in space. Based on the analysis of AFT ages [34,56,57,63,64,65,66,67,68,69], most scholars propose that the uplift in this period occurred from Late Jurassic to the Early Cretaceous. The uplift occurred not only in the eastern Junggar Basin but also in different tectonic units in Xinjiang, China, with varied uplift ages and rates, indicating a significant regional tectonic event and wide influence. This tectonic activity re-uplifted the ancient CAOB, denuded and leveled in the Jurassic, providing sediment material for the Junggar Basin. The geodynamic origin in this period could be the collision and matching between the eastern part of the Karakoram–Lhasa block and the southern edge of the Asia plate in the Late Jurassic–Early Cretaceous and the closure of the Bangong–Nujiang Tethyan Ocean [70,71]. The continuous tectonic contraction and compression led to the formation of nearly east to west strike folds in this area and the gradual uplift from south to north in space.

5.1.3. Rapid Uplift in the Paleogene

The thermal path simulation results of samples Q-13 and A-5 indicate the rapid uplift and cooling event in the Paleogene, which occurred from approximately 65 Ma to approximately 30 Ma. Similarly, Li et al. [57] proposed that an important uplift and exhumation event occurred from approximately 60 Ma to 50 Ma in the northern Junggar Basin. The tectonic event in this period not only caused the thrust of Altay Mountain toward the basin but also widely deposited a set of thick-bed conglomerates at the bottom of the Paleogene in the northern and eastern Junggar Basin. Song et al. [72] proposed a rapid uplift and cooling event that occurred from approximately 70 Ma to approximately 30 Ma in Altay Mountain based on the thermal path simulation results of the AFT. Liu et al. [66] proposed a cooling event that occurred from approximately 70 Ma to approximately 50 Ma in Altay Mountain, and the denudation rate was 0.070 mm/a. Therefore, an uplift and cooling event occurred in the Paleogene in the Altay Mountains. This tectonic event was a far-field response to the initial collision and suturing processes between India and Asia, which first occurred in the central section of the Yarlung Tsangpo suture zone between approximately 65 Ma and 60 Ma and then spread diachronously outward toward both the eastern and western Himalayas [73].

5.1.4. Rapid Uplift since the Miocene

The samples Q-2, Q-3, Q-8, and Q-12 from Qinglidi Mountain simultaneously show a rapid uplift and denudation event that occurred at approximately 20 Ma. The samples A-2, A-3, and A-4 from Altay Mountain show that the event occurred at approximately 10 Ma, indicating the transmission of compressive stress and the younging of uplift from south to north in space. The tectonic event in this period has been extensively documented by previous studies. The unroofing of Tianshan Mountain occurred at approximately 24 Ma [64,74]. The AFT ages of Junggar and its adjacent areas also reveal the rapid uplift event that occurred from 25 Ma to 15 Ma [57,66]. Grave et al. [65,75] investigated the AFT ages of Altay Mountain in Siberia, indicating that Altay Mountain was formed in the Late Miocene and Pliocene. Guo et al. [64] proposed that the Cenozoic uplift and denudation intensity in the Junggar Basin were weaker than that in the Tianshan area, and the uplift amplitude was smaller. Therefore, the Cenozoic intracontinental orogeny in CAOB extends from the south (Tianshan) to the north (Altay). The geodynamic origin should be mainly the India–Eurasia plate collision and its induced compression [76,77].

5.2. Provenance of U-Ore-Bearing Strata

The U-Pb age peaks of detrital zircons from the Triassic and Jurassic in the Kamust uranium deposit show three intervals, i.e., 390–460 Ma (Group I), 270–360 Ma (Group II), and 170–190 Ma (Group III). Group I mainly occurred in the Laoyg and Badaowan Formations, indicating that the Ordovician–Early Devonian magmatic rocks were one of the dominant provenance areas in this period and gradually disappeared in the sedimentary period of the Middle and Upper Jurassic. Group II occurred in all sedimentary periods of the samples, indicating that the Carboniferous and Permian magmatic rocks have always been one of the dominant provenance areas. Group III only occurred in the Xishanyao and Toutunhe Formations and was strengthened in the Toutunhe Formation, indicating that contemporary magmatic rocks have become one of the dominant provenance areas.
The eastern Junggar Basin underwent several stages of ocean basin expansion, plate subduction, collision, post-collision, and post-orogenic processes in the Paleozoic. Moreover, magmatism is closely related to these processes. Early Paleozoic (Ordovician to Silurian) granites were mostly sporadically developed in Karameri Mountain, occurring as small-sized stocks. Their formation had similar controlling factors, which were the magmatic response to the evolution of the ancient Karameri ocean basin [78]. Magmatic rock ages on both sides of the Karameri fault zone are from 360 Ma to 436 Ma, similar to the Group I ages. Therefore, Karameri Mountain can be inferred to be one of the provenance areas for the Laoyg and Badaowan Formations in the Kamust uranium deposit [79,80,81,82].
The magmatic rocks in the eastern Junggar Basin are mainly Late Paleozoic granites, accounting for more than 85% of the total exposed area [78], and are mainly composed of large-sized elliptical batholiths, with characteristics of the north to west trending distribution and dominant development in Karameri and Qinglidi Mountains and a small amount in the Altay Mountains. Moreover, the granites are in the Carboniferous and Permian ages. From Carboniferous to Early Permian, the eastern Junggar Basin was characterized by the matching, accretion, and orogeny between residual Karameri ocean basin and island arc. Subduction of the ocean crust and lateral accretion of crust lasted until late Carboniferous in some areas [83,84,85]. The formation of Late Paleozoic granites and a small amount of intermediate–basic intrusive rocks were closely related to the growth of the continental crust, with characteristics of vertical crust growth in the post-collision stage [86]. The zircon U-Pb ages indicate that post-collision plutonic magmatism in the Junggar area started in the Early Carboniferous and ended in the Middle Permian [87,88]. The Late Paleozoic granites in Karameri and Qinglidi Mountains can be inferred as the dominant provenance areas for the Triassic–Jurassic sedimentation in the Kamust uranium deposit, which is substantial evidence for a large amount of granite fragments in the U-mineralized sandstone.
Group III ages indicate Jurassic magmatism in the eastern Junggar Basin. Similarly, the detrital zircon U-Pb ages of the Jurassic in the southern margin of the Junggar Basin have similar peak ranges [89,90,91]. Moreover, the sample Q-13 from Qinglidi Mountain shows that a tectonic thermal event occurred from approximately 200 Ma to 150 Ma. The AFT ages of the Altay Mountains also show the uplift event in the Late Jurassic–Early Cretaceous (i.e., 160–130 Ma) [67]. Bao et al. [92] proposed that the tectonic thermal event in this period was evidence of magmatic intrusion and fault activity in the Altay Mountains. The Junggar Basin has undergone intracontinental tectonic thermal evolution since the Mesozoic, and the magmatic activity has significantly weakened. However, many researchers have proposed that Jurassic magmatic activity occurred in Altay Mountain. The granite ages of Altay Mountain indicate that magmatism occurred from 131 Ma to 186 Ma [67,93,94]. The ages of zircon and AFT both indicate the occurrence of the Middle Jurassic magmatic event in the Altay Mountains, which was accordingly uplifted as one of the dominant provenance areas for the Xishanyao and Toutunhe Formations in the Kamust uranium deposit.
Based on the comprehensive analysis of the detrital zircon U-Pb and AFT ages of the orogenic belt, the provenance areas in the eastern Junggar Basin rapidly uplifted and formed orogenic zones in the Permian and served as the Triassic and Jurassic sediment sources. The Ordovician–Early Devonian magmatic rocks in Karameri Mountain were the only provenance for the Laoyg and Badaowan Formations, with limited distribution range, which was denuded and leveled in the subsequent sedimentary period, and gradually disappeared from the range of sediment sources in the Sangonghe Formation. The Carboniferous and Permian magmatic rocks in Karameri and Qinglidi Mountains provide continuous sediment materials for the basin. Because of the magmatic activity that occurred in the Middle Jurassic, the uplift of Altay Mountain was exacerbated, serving as one of the dominant provenance areas in the Middle and Late Jurassic.

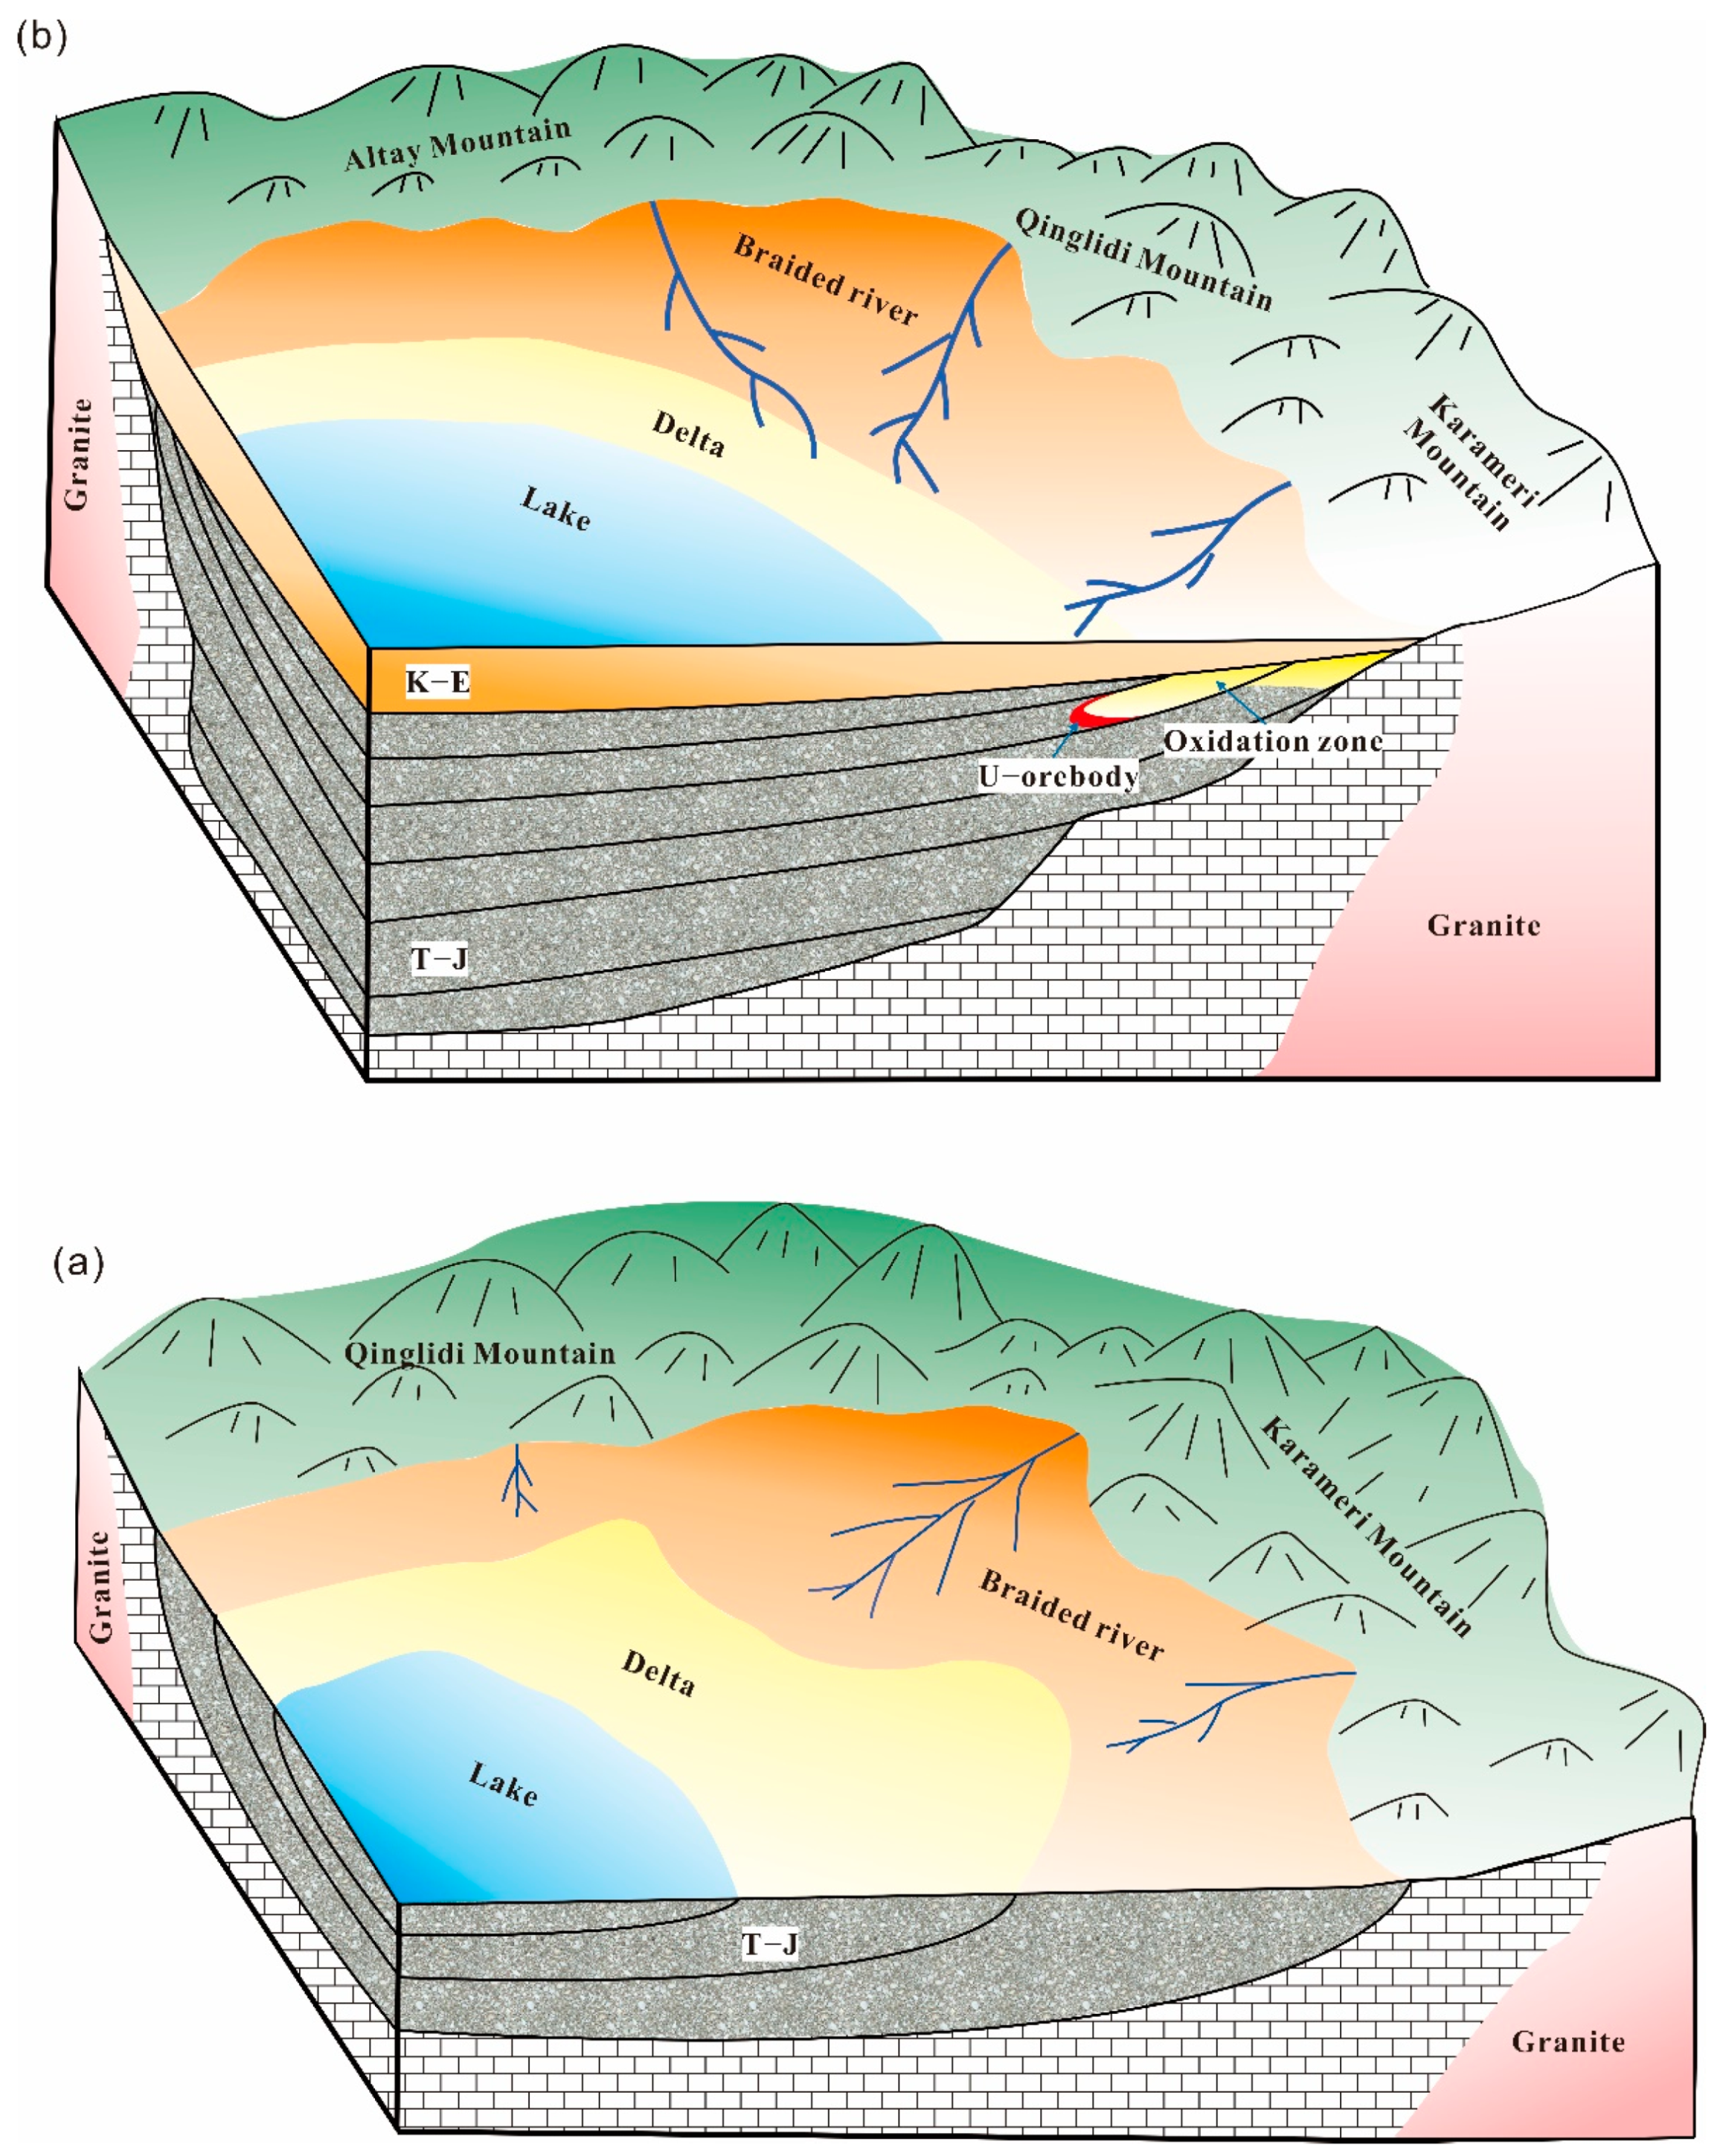
5.3. Influence of Tectonic Uplift and Provenance Transformation on Uranium Mineralization

The uranium minerals in the Kamust uranium deposit are selectively hosted in the dissolution pores of granite fragments, indicating that this lithology is a critical controlling factor in uranium mineralization in the provenances of the U-mineralized strata. Huang et al. [22] obtained the U-mineralization ages of 27 ± 3.2, 22.4 ± 3.9, and 21.3 ± 2.3 Ma using U-Pb isotopic dating combined with U–Ra balance correction, indicating that uranium mineralization mainly occurred in the tectonic relaxation period between the rapid uplifts of the Paleogene and Miocene. According to the metallogenic characteristics of sandstone-type uranium deposits, the uplift and denudation of the orogenic belt and the provenance transformation affect the formation of the U mineralization.

5.3.1. Influence on Uranium Source

The location of uranium deposits in Australia [95] and China [96] has a clear spatial relationship with uranium-enriched bedrock. The uranium released by the weathering of rocks in the provenance areas is mobilized in either surface or ground waters or physically transported and incorporated as detritus in the sedimentary deposits to be subsequently leached and remobilized within the sediment [97]. The identification and characterization of source rocks are vital to uranium exploration because the data may lead to discovering new uranium deposits by recognizing similar source rocks and geologic settings.
The granites in Karameri and Qinglidi Mountains uplifted and rapidly formed the orogenic zone in the Permian and served as the dominant sediment sources for the Triassic and Jurassic in the Kamust uranium deposit. In particular, after the Middle Jurassic, granites and granite pegmatite in Altay Mountain were shown to be one of the provenances in this area, increasing the supply of granitic magmatic rocks. A large number of Late Paleozoic granitic magmatic rocks with the geochemical characteristics of mature continental crust in the provenance areas provide uranium-rich material for the U-mineralization-bearing strata [98]. This uranium-rich material can release a large amount of uranium through interaction with mineralization-forming fluids. The average uranium content of the Toutunhe Formation in the Kamust uranium deposit ranges from 3 ppm to 7 ppm, with local contents of up to 10 ppm. The average uranium contents of the other formations do not exceed 5 ppm [99].
Because of the long-term denudation of the Late Paleozoic uranium-rich granites in the provenance areas, uranium was leached by surface water and migrated into the basin. The uranium content of granites in Karameri Mountain ranges from 2.47 ppm to 10.11 ppm, that of granites in Qinglidi Mountain is from 4.17 ppm to 9.57 ppm, and that of granites in Altay Mountain is from 2.64 ppm to 6.46 ppm. The Th/U ratios range from 3.07 to 14.13, indicating that a large amount of uranium in the granites has leached into the basin [22]. After the rapid uplifts of the Permian, Cretaceous, and Paleogene, the granites in the provenance areas were not leveled because of the maintenance of a certain basin–mountain height difference, thus continuously providing uranium for uranium mineralization in the basin.

5.3.2. Influence on Uranium Precipitation and Enrichment

After the rapid uplift and orogeny in the Permian, the tectonic activity in the eastern Junggar Basin was relatively mild during the Triassic and Jurassic with a slow uplift. The mountains were denuded and leveled, and the basin–mountain height difference became gradually smaller. Under the warm and humid paleoclimate in the Early and Middle Jurassic, a set of braided river and delta facies sediments were deposited in the Kamust uranium deposit (Figure 11a). In particular, the coal-bearing clastic rocks were deposited in the Toutunhe Formation. This single-layer sand body is 30–70 m thick, is rich in carbon debris and pyrite, and forms a high-reduction-capacity chemical trap for uranium mineralization [100].
The rapid uplift event in the Cretaceous caused the regional unconformity between the Cretaceous and Jurassic strata. Affected by this event, the basin–mountain height difference increased, and a tectonic slope zone was formed in the margin of the eastern basin. The sand bodies of the Toutunhe Formation were uplifted to the surface and infiltrated by the supergene oxidized and uranium-bearing fluids from the uranium-rich provenance areas, forming an interlayer oxidation zone. Uranium precipitation and enrichment occurred along the oxidation front to form uranium mineralization. In the Middle and Late Cretaceous, a large-scale lake flooding overlap event occurred, and a thick-bed red mudstone aquiclude was deposited, which thus suspended uranium mineralization due to the failure of the supergene metallogenic fluids to infiltrate past the mudstone. The rapid uplift event in the Paleogene tilted the Toutunhe Formation to the surface in the basin margin, and the overlying argillaceous aquiclude was denuded, thus restarting the interlayer oxidation and uranium mineralization (Figure 11b). Since the Miocene, the eastern Junggar Basin has reached the Cenozoic intracontinental orogeny stage. Under the action of approximate north–south trending compressive stress, the U-mineralization-bearing strata underwent intensive deformation, the original well-developed groundwater recharge–runoff–drainage system was destroyed, and the uranium mineralization process was forcibly terminated, which was confirmed by the obtained uranium mineralization ages, i.e., from 21 Ma to 27 Ma.

6. Conclusions

(1) The AFT ages and thermal path simulation results indicate that the orogenic belt in the eastern Junggar Basin underwent four rapid uplifts, i.e., from approximately 300 Ma to approximately 250 Ma, from approximately 130 Ma to approximately 90 Ma, from approximately 65 Ma to approximately 30 Ma, and from approximately 20 Ma to 0 Ma. The uplift ages show a younging trend from south to north in space, with heterogeneity, indicating that the tectonic compressive stress was transmitted from south to north.
(2) The detrital zircon U-Pb ages of the Triassic and Jurassic in the Kamust uranium deposit indicate that the provenance areas are mainly distributed in three age ranges, i.e., 390–460, 270–360, and 170–190 Ma. Combined with the analysis of the uplift thermal path simulation results, the Ordovician–Early Devonian magmatic areas in Karameri Mountain were one of the dominant sediment sources for the Laoyg to Badaowan Formations. They gradually disappeared from the range of provenance areas in the subsequent sedimentary period. Many Carboniferous and Permian magmatic rocks in the Karameri and Qinglidi Mountains have always been one of the dominant provenance areas. Based on the composition analysis of sediment lithic fragments, the granites in the provenance areas contribute the main sediment materials to the basin.
(3) Tectonic uplift and provenance switch have a significant impact on uranium mineralization. Uranium minerals in the Kamust uranium deposit are selectively hosted in the dissolution pores of granite fragments, indicating that granites in the provenance areas play a key role in uranium mineralization. The Late Paleozoic granites provide not only an external uranium source for the Kamust uranium deposit but also an internal uranium source (i.e., uranium-rich material). The rapid uplift in the Cretaceous formed the tectonic slope zone and created the groundwater recharge–runoff–drainage system. Uranium mineralization occurred in the tectonic relaxation periods after the rapid uplifts in the Cretaceous and Paleogene. The deformation of the U-mineralization-bearing strata, caused by the rapid uplift in the Miocene, terminated uranium mineralization in the region.

Supplementary Materials

The following supporting information can be downloaded at: https://www.mdpi.com/article/10.3390/min12070905/s1, Table S1: LA–ICP–MS detrital zircon U-Pb data for the samples.; Table S2: Detrital zircon Hf isotope data and two−stage model ages for the samples.

Author Contributions

Conceptualization, Z.L. and S.P.; methodology, Y.G.; validation, M.Q., Z.L. and Z.H.; investigation, S.H.; data curation, S.H.; writing—original draft preparation, Z.L.; writing—review and editing, S.P.; visualization, Y.G.; supervision, S.P. All authors have read and agreed to the published version of the manuscript.

Funding

This research was funded by the National Natural Science Foundation of China, grant number 41902084.

Data Availability Statement

The data presented in this study are available on request from the corresponding author. The data are not publicly available.

Acknowledgments

We would like to thank geology Party No. 216, CNNC, for their help with field work and sample collection. We also thank the anonymous reviewers for the detailed and constructive comments that greatly improved the manuscript.

Conflicts of Interest

The authors declare no conflict of interest.

References

  1. Wulser, P.A.; Brugger, J.; Foden, J.; Pfeifer, H.R. The Sandstone-Hosted Beverley Uranium Deposit, Lake Frome Basin, South Australia: Mineralogy, Geochemistry, and a Time-Constrained Model for Its Genesis. Econ. Geol. 2011, 106, 835–867. [Google Scholar] [CrossRef]
  2. Wu, B.L.; Zhang, W.Y.; Song, Z.S.; Cun, X.N.; Sun, L.; Luo, J.J.; Li, Y.Q.; Cheng, X.H.; Sun, B. Geological and Geochemical Characteristics of Uranium Minerals in the Sandstone-type Uranium Deposits in the North of Ordos Basin and Their Genetic Significance. Acta Geol. Sin. 2016, 90, 3393–3407. [Google Scholar]
  3. Chen, Z.L.; Lu, K.G.; Wang, G.; Chen, B.L.; Wang, G.R.; Zheng, E.J.; Cui, L.L.; Ding, W.J. Characteristics of Cenozoic Structural Movements in Southern Margin of Junggar Basin and Its’ Relationship to the Mineralization of Sandstone-Type Uranium Deposits. Acta Petrol. Sin. 2010, 26, 457–470. [Google Scholar]
  4. Cai, C.F.; Li, H.T.; Qin, M.K.; Luo, X.R.; Wang, F.Y.; Ou, G.X. Biogenic and petroleum-related ore-forming processes in Dongsheng uranium deposit, NW China. Ore Geol. Rev. 2007, 32, 262–274. [Google Scholar] [CrossRef]
  5. Zhang, J.D. Innovation and Development of Metallogenic Theory for Sandstone Type Uranium Deposit in China. Uranium Geol. 2016, 32, 321–332. [Google Scholar]
  6. Bonnetti, C.; Cuney, M.; Bourlange, S.; Deloule, E.; Poujol, M.; Liu, X.D.; Peng, Y.B.; Yang, J.X. Primary uranium sources for sedimentary-hosted uranium deposits in NE China: Insight from basement igneous rocks of the Erlian Basin. Miner. Depos. 2017, 52, 297–315. [Google Scholar] [CrossRef]
  7. Chi, G.X.; Xue, C.J. Hydrodynamic regime as a major control on localization of uranium mineralization in sedimentary basins. Sci. China Earth Sci. 2014, 57, 2928–2933. [Google Scholar] [CrossRef]
  8. Qin, M.K.; Huang, S.H.; He, Z.B.; Xu, Q.; Song, J.Y.; Liu, Z.Y.; Guo, Q. Evolution of Tectonic Uplift, Hydrocarbon Migration, and Uranium Mineralization in the NW Junggar Basin:An Apatite Fission-Track Thermochronology Study. Acta Geol. Sin. (Engl. Ed.). 2018, 92, 1901–1916. [Google Scholar] [CrossRef]
  9. Bonnetti, C.; Malartre, F.; Huault, V.; Cuney, M.; Bourlange, S.; Liu, X.D.; Peng, Y.B. Sedimentology, stratigraphy and palynological occurrences of the late Cretaceous Erlian Formation, Erlian Basin, Inner Mongolia, People’s Republic of China. Cretac. Res. 2014, 48, 177–192. [Google Scholar] [CrossRef]
  10. Han, X.Z.; Li, S.X.; Zheng, E.J.; Li, X.G.; Cai, Y.Q.; Chen, Z.L. Neotectonic Activity Characteristics of Yili Basin and its Relation to the Formation of Sandstone-Type Uranium Deposits. Xinjiang Geol. 2004, 22, 378–381. [Google Scholar]
  11. Guo, Q.Y.; Li, Z.Y.; Yu, J.S.; Li, X.C. Meso-Neozoic Structural Evolution in the Western Margin of Ordos Basin with Respect to Uranium Ore Formation. Uranium Geol. 2010, 26, 137–144. [Google Scholar]
  12. Liu, Z.Y.; Qin, M.K.; He, Z.B.; Guo, Q.; Xu, Q.; Geng, Y.Y.; Du Deng, G. Tectonic Uplift-Denudation Inhomogeneity and Impacts On the Sandstone-Hosted Uranium Mineralization in the Southern Margin of the Junggar Basin. Geotecton. Metallog. 2017, 41, 853–864. [Google Scholar]
  13. Liu, W.S.; Zhao, X.Q.; Kang, S.H.; Shi, Q.P.; Zhang, Z.N. Inversion Structure and its Relationship with Sandstone Type Uranium Metallization in Erlian Basin. Uranium Geol. 2018, 34, 81–89. [Google Scholar]
  14. Huang, S.H.; Qin, M.K.; Xu, Q.; He, Z.B.; Liu, Z.Y.; Selby, D. Superimposed Uranium Metallogenesis Between Deep Hydrocarbon Fluid and Supergene Oxidation Fluid in the Northwestern Margin of Junggar Basin. Acta Geol. Sin. 2018, 92, 1493–1506. [Google Scholar]
  15. Nie, F.J.; Zhang, J.; Yan, Z.B.; Wang, Y.N.; Li, M.G.; Xia, F.; Zhu, C.H.; Wang, S.L.; Hu, J. Apatite Fission Track Chronology of the Weijing Granite and Denudation Event in the Northern Margin of North China During the Late Cretaceous and their Implications to Uranium Mineralization. Acta Geol. Sin. 2018, 92, 313–329. [Google Scholar]
  16. Jaireth, S.; Roach, I.C.; Bastrakov, E.; Liu, S.F. Basin-related uranium mineral systems in Australia: A review of critical features. Ore Geol. Rev. 2016, 76, 360–394. [Google Scholar] [CrossRef]
  17. Chen, Z.Y. Regional Distribution Regularity of Sandstone Uraniumdeposits in Asian Continent and Prospecting Strategy for Sandstone Uranium Deposits in China. Uranium Geol. 2002, 18, 129–137. [Google Scholar]
  18. Chen, Z.L.; Liu, J.; Gong, H.L.; Han, F.B.; Marion, B.S.; Zheng, E.J.; Wang, G. Late Cenozoic tectonic activity and its significance in the northern Junggar Basin, northwestern China. Tectonophysics 2011, 497, 45–56. [Google Scholar] [CrossRef]
  19. Wang, G.; Wang, G.R.; Lu, K.G.; Tang, X.F. Review On the Uranium Geology Efforts and Outlook for Future Exploration in Junggar Basin. Uranium Geol. 2016, 32, 340–349. [Google Scholar]
  20. Du, J.; Tang, X.F. Controlling Factors and Prospecting Direction for Uranium Metallization in Middle Jurassic at Kamusite Area in Xinjiang. Uranium Geol. 2017, 33, 129–136. [Google Scholar]
  21. Tang, X.F.; Wang, G.; Zhang, Z.F.; Li, Y.L.; Wu, S.M.; Li, C.L. A Study On Uranium Metallogenic Model of Jurassic in Kamust Region, Junggar Basin. Geol. Rev. 2018, 64, 647–657. [Google Scholar]
  22. Huang, S.H.; Qin, M.K.; Liu, Z.Y.; He, Z.B.; Geng, Y.Y. Litho-mineralogy, geochemistry, and chronology for the genesis of the Kamust sandstone-hosted uranium deposit, Junggar Basin, NW China. Geol. J. (Chichester Engl.) 2021, 57, 1530–1551. [Google Scholar] [CrossRef]
  23. Jahn, B.M.; Natal’In, B.; Windley, B.; Dobretsov, N. Phanerozoic continental growth in Central. J. Asian Earth Sci. 2004, 23, 599–603. [Google Scholar] [CrossRef]
  24. Windley, B.F.; Alexeiev, D.; Xiao, W.; Kroener, A.; Badarch, G. Tectonic models for accretion of the Central Asian Orogenic Belt. J. Geol. Soc. 2007, 164, 31–47. [Google Scholar] [CrossRef] [Green Version]
  25. Xiao, W.J.; Han, C.M.; Yuan, C.; Sun, M.; Lin, S.; Chen, H.L.; Li, Z.L.; Li, J.L.; Sun, S.; Xiao, W.; et al. Middle Cambrian to Permian subduction-related accretionary orogenesis of northern Xinjiang, NW China; implications for the tectonic evolution of Central Asia. J. Asian Earth Sci. 2008, 32, 102–117. [Google Scholar] [CrossRef]
  26. He, D.F.; Zhang, L.; Wu, S.T.; Di, L.; Zhen, Y. Tectonic Evolution Stages and Features of the Junggar Basin. Oil Gas Geol. 2018, 39, 845–861. [Google Scholar]
  27. Xiao, W.; Windley, B.F.; Yan, Q.; Qin, K.; Chen, H.; Yuan, C.; Sun, M.; Li, J.; Sun, S. SHRIMP Zircon Age of the Aermantai Ophiolite in the North Xinjiang Area‚ China and Its Tectonic Implications. Acta Geol. Sin. 2007, 80, 6. [Google Scholar]
  28. Pirajno, F.; Mao, J.W.; Zhang, Z.C.; Zhang, Z.H.; Chai, F.M. The association of mafic–ultramafic intrusions and A-type magmatism in the Tian Shan and Altay orogens, NW China: Implications for geodynamic evolution and potential for the discovery of new ore deposits. J. Asian Earth Sci. 2008, 32, 165–183. [Google Scholar] [CrossRef]
  29. Han, B.F.; Guo, Z.J.; He, G.Q. Timing of Major Suture Zones in North Xinjiang, China:Constraints From Stitching Plutons. Acta Petrol. Sin. 2010, 26, 2233–2246. [Google Scholar]
  30. Zhang, Y.Y.; Gu, Z.J. New Constraints On Formation Ages of Ophiolites in Northern Junggar and Comparative Study On their Connection. Acta Petrol. Sin. 2010, 26, 421–430. [Google Scholar] [CrossRef] [Green Version]
  31. Xiao, W.; Huang, B.; Han, C.; Sun, S.; Li, J. A review of the western part of the Altaids: A key to understanding the architecture of accretionary orogens. Gondwana Res. 2011, 18, 253–273. [Google Scholar] [CrossRef]
  32. He, D.F.; Di, L.; Fan, C.; Yang, X.F. Geochronology, geochemistry and tectonostratigraphy of Carboniferous strata of the deepest Well Moshen-1 in the Junggar Basin, northwest China: Insights into the continental growth of Central Asia. Gondwana Res. 2013, 24, 560–577. [Google Scholar] [CrossRef]
  33. Ren, X.C. The Division of Mesozoic Structural Unit of Wulungu Depression in Jugar Basin. Pet. Geophys. 2008, 4, 38–41. [Google Scholar]
  34. Li, W.; Hu, J.M.; Qu, H.J. Fission Track Analysis of Junggar Basin Peripheral Orogen and its Geological Significance. Acta Geol. Sin. 2010, 84, 171–182. [Google Scholar]
  35. Allen; Mark, B.; Vincent; Stephen, J. Fault reactivation in the Junggar region, northwest China: The role of basement structures during Mesozoic-Cenozoic compression. J. Geol. Soc. 1997, 154, 151. [Google Scholar] [CrossRef]
  36. Su, Y.P.; Tang, H.F.; Cong, F. Zircon U-Pb Age and Petrogenesis of the Huangyangshan Lkalinegranite Body in East Junggar, Xinjiang. Acta Mineral. Sin. 2008, 28, 117–126. [Google Scholar]
  37. Gan, L.; Tang, H.F.; Han, Y.J. Geochronology and Geochemical Characteristics of the Yemaquan Granitic Pluton in East Junggar, Xinjiang. Acta Petrol. Sin. 2010, 26, 2374–2388. [Google Scholar]
  38. Li, D.; He, D.F.; Fan, C.; Xiang, K.; Jin, L.Y. Early Permian post-collisional magmatic events, East Junggar: Constraints from zircon SHRIMP U-Pb age, geochemistry and Hf isotope of rhyolite in the Yundukala area. Acta Petrol. Sin. 2013, 29, 317–337. [Google Scholar]
  39. Tian, J.; Liao, Q.A.; Fan, G.M.; Nie, X.M.; Wang, F.M. The discovery and tectonic implication of Early Carboniferous post-collisional Ⅰ-type granites from the south of Karamaili in eastern Junngar. Acta Petrol. Sin. 2015, 31, 1471–1484. [Google Scholar]
  40. Wu, W.W.; Liao, Q.A.; Chen, S.; Hu, C.B.; Tian, J.; Wang, F.M.; Fan, G.M. Petrogenesis and Geological Significance of Highly Frac-Tionated A-type Granites in Kalasayi, East Junggar. Geol. Bull. China 2015, 34, 385–399. [Google Scholar]
  41. Zhang, Y.F.; Lin, X.W.; Guo, Q.M.; Wang, X.; Zhao, D.C.; Dang, C.; Yao, S. LA-ICP-MS Zircon U-Pb Dating and Geochemistry of Aral Granitic Plutons in Koktokay Area in the Southern Altay Margin and their Source Significace. Acta Geol. Sin. 2015, 89, 339–354. [Google Scholar]
  42. Liu, S.B.; Dou, H.; Zhang, W.M.; Peng, Z.J.; Zhang, L.; Zhang, W.R. Discovery of Jurassic Trachyandesite and Its Geological Significance in the Northwestern of Junggar Basin. Geol. Rev. 2018, 64, 1519–1529. [Google Scholar]
  43. Zhang, B.W.; Zhan, X.Z.; Duanmu, C.Q. The Study on Petrogeochemistry of Kamusite Granites in Eastern Junggar and its Tectonic Significance. J. Xinjiang Univ. (Nat. Sci. Ed.) 2018, 35, 502–512. [Google Scholar]
  44. Dong, Z.C.; Zhao, G.C.; Pan, F.; Wang, K.; Huang, B.T. Petrogenesis of the Qinghe post-orogenic pluton and its implications for the Late Paleozoic tectonic evolution of the Altai orogenic belt. Acta Petrol. Sin. 2019, 35, 1033–1057. [Google Scholar]
  45. Xu, Z.H.; Yin, J.Y.; Chen, W.; Li, D.P.; Sun, J.B.; Yu, S.; Du, Q.Y.; Wu, C.Y. Chronology and Geochemistry of Late Devonian ⅰ-Type Granite in the Northeast of Eastern Junggar, Xinjiang and their Tectonic Implications. Acta Geol. Sin. 2019, 93, 2797–2812. [Google Scholar]
  46. Bian, W.H.; Jens, H.; Liu, Z.H.; Wang, P.J.; Matthias, H. Sedimentary and palaeoenvironmental evolution of the Junggar Basin, Xinjiang, northwest China. Palaeobiodiversity Palaeoenviron. 2010, 90, 175–186. [Google Scholar] [CrossRef]
  47. Reiners, P.W.; Ehlers, T.A.; Mitchell, S.G.; Montgomery, D.R. Coupled spatial variations in precipitation and long-term erosion rates across the Washington Cascades. Nature 2003, 426, 645–647. [Google Scholar] [CrossRef]
  48. Reiners, P.W.; Brandon, M.T. Using thermochronology to understand orogenic erosion. Annu. Rev. Earth Planet. Sci. 2006, 34, 419–466. [Google Scholar] [CrossRef] [Green Version]
  49. Flowers, R.M.; Ketcham, R.A.; Shuster, D.L.; Farley, K.A. Apatite (U–Th)/He thermochronometry using a radiation damage accumulation and annealing model. Geochim. Cosmochim. Acta 2009, 73, 2347–2365. [Google Scholar] [CrossRef]
  50. Ketcham, R.A.; Carter, A.; Donelick, R.A.; Barbarand, J.; Hurford, A.J. Improved measurement of fission-track annealing in apatite using c-axis projection. Am. Mineral. 2007, 92, 789–798. [Google Scholar] [CrossRef]
  51. Ketcham, R.A.; Donelick, R.A.; Carlson, W.D. Variability of apatite fission-track annealing kinetics; III, Extrapolation to geological time scales. Am. Mineral. 1999, 84, 1235–1255. [Google Scholar] [CrossRef]
  52. Wu, F.Y.; Yang, Y.H.; Xie, L.W.; Yang, J.H.; Xu, P. Hf isotopic compositions of the standard zircons and baddeleyites used in U-Pb geochronology. Chem. Geol. 2006, 234, 105–126. [Google Scholar] [CrossRef]
  53. Xie, L.W.; Zhang, Y.B.; Zhang, H.H.; Sun, J.F.; Wu, F.Y. In situ simultaneous determination of trace elements, U-Pb and Lu-Hf isotopes in zircon and baddeleyite. Chin. Sci. Bull. 2008, 53, 1565–1573. [Google Scholar] [CrossRef] [Green Version]
  54. Liu, Y.S.; Hu, Z.C.; Zong, K.Q.; Gao, C.G.; Gao, S.; Xu, J.; Chen, H.H. Reappraisement and refinement of zircon U-Pb isotope and trace element analyses by LA-ICP-MS. Chin. Sci. Bull. 2010, 55, 1535–1546. [Google Scholar] [CrossRef]
  55. Ludwig, K.R. User’s Manual for Isoplot 3.75: A Geochronological Toolkit for Microsoft Excel; Geochronology Center: Berkeley, CA, USA, 2012; pp. 1–75. [Google Scholar]
  56. Yuan, W.M.; Dong, J.Q.; Bao, Z.K. Fission track evidences for tectonic activity in Altay Mountains‚ Xinjiang‚ North-Western China. Earth Sci. Front. (China Univ. Geosci. Beijing) 2004, 11, 461–468. [Google Scholar]
  57. Li, L.; Chen, Z.L.; Qi, W.X.; Wang, S.X.; Chen, X.H.; Wu, Y.P.; Gong, H.L.; Wei, X.C.; Yang, Y.; Li, X.Z. Apatite Fission Track Evidence for Uplifting-Exhumation Processes of Mountains Surrounding the Junggar Basin. Acta Petrol. Sin. 2008, 24, 1011–1020. [Google Scholar]
  58. Corfu, F.; Hanchar, J.M.; Hoskin, P.W.O.; Kinny, P. Altas of zircon textures. Rev. Mineral. Geochem. 2003, 53, 469–500. [Google Scholar] [CrossRef]
  59. Black, L.P.; Kamo, S.L.; Williams, I.S.; Mundil, R.; Davis, D.W.; Korsch, R.J.; Foudoulis, C. The application of SHRIMP to Phanerozoic geochronology; a critical appraisal of four zircon standards. Chem. Geol. 2003, 200, 171–188. [Google Scholar] [CrossRef]
  60. Wu, K.Y.; Zha, M.; Wang, X.L.; Qu, J.X.; Chen, X. Further Researches On the Tectonic Evolution and Dynamic Setting of the Junggar Basin. Acta Geosci. Sin. 2005, 26, 217–222. [Google Scholar]
  61. Chen, X.; Lu, H.X.; Shu, L.S.; Wang, H.M.; Zhang, G.Q. Study On Tectonic Evolution of Junggar Basin. Geol. J. China Univ. 2002, 8, 257–267. [Google Scholar]
  62. Chen, F.J.; Wang, X.W.; Wang, X.W. Prototype and Tectonic Evolution of the Junggar Basin, Northwestern China. Earth Sci. Front. 2005, 12, 77–89. [Google Scholar]
  63. Yuan, W.M.; Carter, A.; Dong, J.Q. Mesozoic-Tertiary exhumation history of the Altai Mountains, northern Xinjiang, China: Constraints from apatite fission track data. Tectonophysics 2006, 412, 183–193. [Google Scholar] [CrossRef] [Green Version]
  64. Guo, Z.J.; Zhang, Z.C.; Wu, C.D.; Fang, S.H.; Zhang, R. The Mesozoic and Cenozoic Exhumation History of Tianshan and Comparative Studies to the Junggar and Altai Mountains. Acta Geol. Sin. 2006, 80, 1–15. [Google Scholar]
  65. Grave, J.D.; Buslov, M.M.; Haute, P. Distant effects of India–Eurasia convergence and Mesozoic intracontinental deformation in Central Asia: Constraints from apatite fission-track thermochronology. J. Asian Earth Sci. 2007, 29, 188–204. [Google Scholar] [CrossRef]
  66. Liu, H.T.; Yuan, W.M.; Tian, P.F.; Xue, B.; Song, G.; Zhao, W.J. Denudation and Exposure History and Paleotopographic Reconstruction of the Southern Margin of the Altay Mountains Since Cretaceous. Acta Petrol. Mineral. 2012, 31, 412–424. [Google Scholar]
  67. Li, Z.H.; Chen, G.; Cui, J.B.; Chen, Z.J.; He, J.Y.; Ding, C.; Yang, F. Fission Track Age of Yanshanian Tectonic-Thermal Events in the Northern Junggar Basin. Geol. Sci. Technol. Inf. 2014, 33, 9–14. [Google Scholar]
  68. Xu, Q.Q.; Ji, J.Q.; Sun, D.X.; Zhao, L. Late Cenozoic uplift-exhumation history of Qinghe-Fuyun region, Altay, Xinjiang—Evidence from apatite fission track. Geol. Bull. China 2015, 34, 834–844. [Google Scholar]
  69. Song, J.Y.; Qin, M.K.; Cai, Y.Q.; Guo, Q.; He, Z.B.; Liu, Z.Y.; Cao, X.; Chen, Z.G. Uplift-Denudation of Orogenic Belts Control On the Formation of Sandstone Type Uranium (U) Deposits in Eastern Junggar, Northwest China: Implications From Apatite Fission Track (Aft). Editor. Comm. Earth Sci. J. China Univ. Geosci. 2019, 44, 3910–3925. [Google Scholar]
  70. Xu, M.J.; Li, C.; Zhang, X.Z.; Wu, Y.W. Nature and evolution of the Neo-Tethys in central Tibet: Synthesis of ophiolitic petrology, geochemistry, and geochronology. Int. Geol. Rev. 2014, 56, 1072–1096. [Google Scholar] [CrossRef]
  71. Guo, R.H.; Li, S.Z.; Yu, S.Y.; Dai, L.M.; Liu, Y.J.; Peng, Y.B.; Zhou, Z.Z.; Wang, Y.H.; Liu, Y.M.; Wang, Q. Collisional processes between the Qiangtang Block and the Lhasa Block: Insights from structural analysis of the Bangong–Nujiang Suture Zone, central Tibet. Geol. J. 2019, 54, 946–960. [Google Scholar] [CrossRef]
  72. Song, G.; Yuan, W.M.; Zhao, W.J.; Liu, H.T. Apatite Fission Track Analyses of Exhumation History and Antiquated Topography Reconstruction in the Southern Margin of Altai, Xinjiang. Acta Geol. Sin. 2013, 87, 967–978. [Google Scholar]
  73. Ding, L.; Maksatbek, S.; Cai, F.L.; Wang, H.Q.; Song, P.P.; Ji, W.Q.; Xu, Q.; Zhang, L.Y.; Muhammad, Q.; Upendra, B. Processes of initial collision and suturing between India and Asia. Sci. China Earth Sci. 2017, 60, 635–651. [Google Scholar] [CrossRef]
  74. Allen, M.B.; Vincent, S.J.; Wheeler, P.J. Late Cenozoic tectonics of the Kepingtage thrust zone: Interactions of the Tien Shan and Tarim Basin, northwest China. Tectonics 1999, 18, 639–654. [Google Scholar] [CrossRef]
  75. Grave, J.D.; Haute, P.; Buslov, M.M.; Dehandschutter, B.; Glorie, S. Apatite fission-track thermochronology applied to the Chulyshman Plateau, Siberian Altai Region. Radiat. Meas. 2008, 43, 38–42. [Google Scholar] [CrossRef]
  76. Tapponnier, P.; Peltzer, G.; Armijo, R. On the mechanics of the collision between India and Asia. Geol. Soc. Lond. Spec. Publ. 1986, 19, 113–157. [Google Scholar] [CrossRef]
  77. Dobretsov, N.L.; Buslov, M.M.; Delvaux, D.; Berzin, N.A.; Ermikov, V.D. Meso- and Cenozoic Tectonics of the Central Asian Mountain Belt: Effects of Lithospheric Plate Interaction and Mantle Plumes. Int. Geol. Rev. 1996, 38, 430–466. [Google Scholar] [CrossRef]
  78. Yang, S.; Liu, G.; Jin, L.Y.; Zheng, H.F. Geochronology, Geochemistry and Tectonic Significance of Songkarsu Granites in Karamali, Eastern Junggar. Geoscience 2021, 35, 492–503. [Google Scholar]
  79. Li, Y.P.; Li, J.Y.; Sun, G.H.; Zhu, Z.X.; Yang, Z.Q. Basement of Junggar basin: Evidence from detrital zircons in sandstone of previous Devonian Kalamaili formation. Acta Petrol. Sin. 2007, 23, 1577–1590. [Google Scholar]
  80. Tang, H.F.; Zhao, Z.Q.; Huang, R.S.; Han, Y.J.; Su, Y.P. Primary Hf Isotopic Study On Zircons From the A-Type Granites in Eastern Junggar of Xinjiang, Northwest China. Acta Mineral. Sin. 2008, 28, 335–342. [Google Scholar]
  81. Li, J.D.; Yang, T.N.; Li, Y.P.; Zhu, Z.X. Geological Features of the Karamaili Faulting Belt, Eastern Junggar Region, Xinjiang, China and its Constraints On the Reconstruction of Late Paleozoic Ocean-Continental Framework of the Central Asian Region. Geol. Bull. China 2009, 28, 1817–1826. [Google Scholar]
  82. Zhou, G.; Zhang, Z.C.; Wu, G.G.; Dong, L.H.; He, Y.K.; Dong, Y.G.; He, L.X.; Qin, J.H.; Zhao, Z.H.; Liu, G.R. Postorogenic Extension and Continental Growth of the Northeastern Margin of the Juggar:Evidences from Petrography and Geochemistry of the Hadansun Intrusive Complex. Acta Geol. Sin. 2009, 83, 331–346. [Google Scholar]
  83. Xiao, W.J.; Zhang, L.C.; Qin, K.Z.; Sun, S.; Li, J.L. Paleozoic accretionary and collisional tectonics of the Eastern Tianshan (China): Implications for the continental growth of central Asia. Am. J. Sci. 2004, 304, 370–395. [Google Scholar] [CrossRef] [Green Version]
  84. Long, X.P.; Sun, M.; Yuan, C.; Xiao, W.J.; Chen, H.L.; Zhao, Y.J.; Cai, K.D.; Li, J.L. Genesis of Carboniferous Volcanic Rocks in the Eastern Junggar: Constraints on the Closure of the Junggar Ocean. Acta Petrol. Sin. 2006, 22, 31–40. [Google Scholar]
  85. Wu, X.Q.; Liu, D.; Li, Z.S. Post-Collisional Volcanism of Kalamaili Suture Zone. Earth Sci. Front. 2009, 16, 220–230. [Google Scholar] [CrossRef]
  86. Han, B.; He, G.; Wang, S. Postcollisional mantle-derived magmatism, underplating and implications for basement of the Junggar Basin. Sci. China Ser. D Earth Sci. 1999, 42, 113–119. [Google Scholar] [CrossRef]
  87. Zhao, Z.H.; Guo, Z.J.; Han, B.F.; Wang, Y. The geochemical characteristics and tectonic-magmatic implications of the latcst-Paleozoic volcanic rocks from Santanghu basin, eastern Xinjiang, northwest China. Acta Petrol. Sin. 2006, 22, 199–214. [Google Scholar]
  88. Yang, G.X.; Li, Y.J.; Si, G.H.; Wu, H.; Jin, Z.; Zhang, Y.Z. LA-ICPMS U-Pb Zircon Dating of the Beilekuduke Granite in Kalamaili Area, East Junggar, Xinjiang, China and its Geological Implication. Geotecton. Metallog. 2010, 34, 133–138. [Google Scholar]
  89. Fang, Y.N.; Wu, C.D.; Guo, Z.J.; Hou, K.J.; Dong, L.; Wang, L.; Li, L.L. Provenance of the southern Junggar Basin in the Jurassic: Evidence from detrital zircon geochronology and depositional environments. Sediment. Geol. 2015, 315, 47–63. [Google Scholar] [CrossRef]
  90. Geng, Y.Y.; Liu, Z.Y.; He, Z.B.; Huang, S.H.; Guo, Q.; Xu, Q.; Song, J.Y. Provenance and Ore-Forming Tectonic Setting of Sandstone-Type Uranium Deposits in the Southern Margin of Junggar Basin--Insights From U-Pb Ages and Hf Isotopes of Detrital Zircons. Geol. Rev. 2020, 66, 393–409. [Google Scholar]
  91. Zhu, W.B.; Wang, F.J.; Cao, Y.Y.; Wang, S.L. Tectono-magmatic events in Tianshan Mountains and adjacent areas during Yanshanian Movement period. Acta Geol. Sin. 2020, 94, 1331–1346. [Google Scholar]
  92. Bao, Z.K.; Yuan, W.M.; Dong, J.Q.; Gao, S.K. Apatite Fission Track Dating and Thermal History of Qing-He Region in Altay Mountains. Nucl. Tech. 2005, 28, 722–725. [Google Scholar]
  93. Zhang, Q.F.; Hu, A.Q.; Zhang, G.X.; Fan, S.K.; Pu, Z.P. Evidence from Isotopic Age for Presence of Mesozoic-Cenozoic Magmatic Activities in Altai Region, Xinjiang. Geochimica 1994, 3, 269–280. [Google Scholar]
  94. Cao, Y.Y.; Chen, F.; Zhao, F.; Wang, F.J.; Paerhati, Z. Tectono-Magmatic Events in Junggar Basin During Jurassic Period. Xinjiang Geol. 2020, 38, 341–347. [Google Scholar]
  95. Lambert, I.; Jaireth, S.; McKay, A.; Miezitis, Y. Australia’s Uranium Endowment: Metallogeny, Exploration and Potential; Springer: Heidelberg, Germany, 2005. [Google Scholar]
  96. Zhang, J.D.; Li, Z.Y. Uranium Potential and Regional Metallogeny in China. Acta Geol. Sin. Engl. Ed. 2008, 82, 741–744. [Google Scholar]
  97. Hou, B.H.; Keeling, J.; Li, Z.Y. Paleovalley-related uranium deposits in Australia and China: A review of geological and exploration models and methods. Ore Geol. Rev. 2017, 88, 201–234. [Google Scholar] [CrossRef]
  98. Geng, Y.Y.; Liu, Z.Y.; Huang, S.H.; He, Z.B. Geochronology and Geochemistry of the Kalamaili Granitic Rocks and Uranium Ore-Forming Potential at the Northeastern Margin of Junggar Basin, China. J. Earth Sci. Environ. 2022, 44, 20–41. [Google Scholar]
  99. Sun, X.; Wang, G.R.; Wang, G.; Lu, K.G. Middle Jurassic-Oligocene Paleoclimate Environment and its Influence On Mineralization of Sandstone-Type Uranium Deposit in Kamuster Area, Eastern of the Junggar Basin. Xinjiang Geol. 2019, 37, 242–246. [Google Scholar]
  100. Ji, H.L.; Guo, Q.; Qin, M.K.; Liu, Z.Y.; He, Z.B.; Yang, F. Relationship of Sedimentary Facies and Uranium Mineralization of the Middle Jurassic Toutunhe Formation in the Kamuster Area, Eastern Part of the Junggar Basin. Acta Geol. Sin. 2021, 95, 3455–3471. [Google Scholar]
Figure 1. (a) Tectonic Relationship of the Junggar Basin with the Central Asian Orogenic Belt (modified from [24,35]). (b) Map of China, the Junggar Basin is located in Northwest China. (c) Simplified geological map of the eastern Junggar Basin and the magmatic rock ages [36,37,38,39,40,41,42,43,44,45], showing that the orogenic belt was divided into the Karameri, Qinglidi, and Altay blocks by the Karameri and Ertix faults. (d) Comprehensive lithologic histogram of the Kamust uranium deposit. Uranium ore bodies occurred in coal-bearing clastic rocks of the Toutunhe Formation (J2t).
Minerals 12 00905 g001
Figure 2. The spatial relationship between interlayer oxidation zone and uranium mineralization in the Kamust uranium deposit.
Minerals 12 00905 g002
Figure 3. Lithic fragments of mineralized sandstones in the Kamust uranium deposit. (a) Granite–porphyry fragments with porphyritic structure. Phenocrysts are quartz and feldspar, and the matrix is a fully crystalline structure. (b) Granite fragments composed of quartz and feldspar. (c) Polycrystalline quartz. (d) Quartz schist fragments with a small amount of sericite and flake structure, and potassium feldspar fragments on the left. (e) Metamorphic siltstone fragments. (f) Siliceous gravel composed of microcrystalline quartz. (g) Andesite fragments with interlaced structure. (h) Rhyolite fragments with faintly visible flow structure, and the matrix is a fine structure interspersed with quartz veins. (i) Pyroclastic fragments, containing a large number of crystal pyroclasts.
Minerals 12 00905 g003
Figure 4. The SEM images of uranium minerals in the Kamust uranium deposit. (a) Granite fragment dissolved and filled by pitchblende. (b) Potassium feldspar dissolved and filled by pitchblende. (c) Pitchblende filling the dissolved pores along the edge of granite fragment, indicating the process of uranium minerals replacing granite. (d,e) Pitchblende almost completely replacing granite fragments. (f) Granite fragments replaced by pitchblende are wrapped by pyrite, indicating that the pyrite is formed after uranium minerals. (g) Pitchblende replacing rutile with a residually recognizable crystal structure. (h) Spherical coffinite attached to the surface of illite. (i) Uranium-bearing illite, showing adsorption of uranium on the illite.
Minerals 12 00905 g004
Figure 5. HeFTy thermal path evolution simulation results and histograms of AFT lengths of samples from Karameri and Qinglidi Mountains. The purple areas represent highly credible intervals of simulation. The green areas represent acceptable intervals. The black lines represent the best fit paths.
Minerals 12 00905 g005
Figure 6. HeFTy thermal path evolution simulation results and histograms of AFT lengths of samples from Altay Mountain. The purple areas represent highly credible intervals of simulation. The green areas represent acceptable intervals. The black lines represent the best fit paths.
Minerals 12 00905 g006
Figure 7. Representative detrital zircon micro-region CL image and age data (Ma). The white data is U-Pb age, and the yellow data is Hf two-stage model age. The red and yellow circles are laser ablation positions.
Minerals 12 00905 g007
Figure 8. Plots of U-Pb ages versus Th/U ratio of detrital zircons.
Minerals 12 00905 g008
Figure 9. Detrital zircon U-Pb age concordia and frequency distribution diagrams.
Minerals 12 00905 g009
Figure 10. Plot of detrital zircon U––Pb ages versus ε Hf (t).
Minerals 12 00905 g010
Figure 11. Model of influence of tectonic uplift and provenance switch on sandstone-type uranium mineralization. (a) Uranium-rich strata were formed under tectonic setting of slow uplift during Triassic and Jurassic, and Qinglidi and Karameri Mountains were dominant provenance areas. (b) Interlayer oxidation and uranium ore body occurred after the Cretaceous rapid uplift, and Altay Mountain was proved to be one of the dominant provenance areas. T−J: Triassic and Jurassic. K−E: Cretaceous and Paleogene.
Minerals 12 00905 g011
Table 1. AFT ages of samples from the eastern orogenic belts of the Junggar Basin.
LocationNo.LithologyNcρs (105/cm2)
Ns
ρi (105/cm2)
Ni
ρd (105/cm2)
Nd
P2)
%
Central Age (Ma)
(±1σ)
Pooled Age (Ma)
(±1σ)
L (μm)
(Number of Tracks)
Data Sources
Karameri MountainK-7Tuffaceous sandstone353.184 (776)3.784 (922)11.615 (5864)99.7197 ± 13197 ± 1313.9 ± 2.1 (100)This study
K-8Diorite203.666 (284)5.745 (445)9.487 (5864)35.7123 ± 12123 ± 1114.6 ± 1.8 (56)
K-9Diorite Porphyrite351.62 (491)2.316 (702)11.463 (5864)85162 ± 12162 ± 1213.4 ± 2.1 (69)
Qinglidi MountainQ-2Granite2725.050 (1981)47.480 (2497)16.919 (6887)48.88250.8 ± 7.5247.5 ± 7.312.45 ± 1.56 (101)This study
Q-3Granite316.842 (494)13.580 (1422)8.530 (6645)49.05237.4 ± 12.2228.9 ± 12.212.72 ± 1.26 (78)
Q-6Granodiorite3219.049 (4715)26.216 (6489)10.766 (5864)0158 ± 10158 ± 813.5 ± 2.4 (135)
Q-8Rhyolite283.420 (548)12.445 (1994)13.998 (7380)47.174 ± 5.274 ± 5.012.7 ± 2.0 (108)
Q-12Granite353.824 (474)13.715 (1700)12.912 (7124)35.274 ± 573 ± 512.4 ± 2.2 (69)
Q-13Granite3017.975 (1926)36.371 (3897)12.285 (7124)0.3124 ± 7123 ± 712.5 ± 2.4 (113)
03-45Granite241.987 (316)9.980 (1586)13.540 (3372)043.2 ± 4.7\12.37 ± 0.22 (61)Li et al. [57]
03-46Granite241.483 (201)7.710 (1045)13.530 (3369)0.941.6 ± 4.7\12.82 ± 0.26 (60)
03-47-2Granite2416.010 (1497)22.010 (2058)13.520 (3366)8.5\171.0 ± 15.512.99 ± 0.23 (62)
D407-1Granite251.731 (297)4.720 (810)9.340 (10,438)99.866 ± 566 ± 512.6 ± 2.2 (102)Li et al. [34]
D407-2Granite23122.956 (3880)19.553 (617)3.715 (4878)34.4151 ± 10153 ± 9\
D407-3Granite222.457 (293)8.586 (1024)9.442 (10,438)14.152 ± 452 ± 412.8 ± 2.7 (123)
D407-4Granite241.419 (288)4.257 (864)9.545 (10,438)46.861 ± 561 ± 511.7 ± 2.4 (117)
D407-5Granite253.215 (351)9.984 (1090)9.648 (10,438)99.160 ± 460 ± 411.9 ± 2.6 (77)
D407-6Granite241.998 (321)6.025 (973)9.751 (10,438)72.162 ± 462 ± 411.2 ± 2.6 (104)
D407-7Granite21125.559 (3876)24.036 (742)3.659 (4878)13.8124 ± 8126 ± 8\
Altay MountainA-2Amphibolite1211.971 (273)45.033 (1027)12.518 (7380)3.465 ± 6.764 ± 5.312.6 ± 1.9 (54)This study
A-3Granite312.133 (117)8.66 (475)12.813 (7380)8.461 ± 8.361 ± 6.912.5 ± 2.1 (76)
A-4Granite289.285 (1423)28.157 (4315)13.011 (7380)082 ± 5.483 ± 4.712.7 ± 1.8 (123)
A-5Sandstone248.765 (2409)24.294 (6677)13.208 (7380)092 ± 5.692 ± 4.913.4 ± 1.8 (114)
A-6Granite283.14 (308)13.914 (1365)13.405 (7380)99.858 ± 4.658 ± 4.613.1 ± 2.0 (106)
A-7Granite260.236 (34)1.65 (238)13.602 (7380)60.537 ± 7.238 ± 7.110.4 ± 2.8 (7)
A-8Tuff284.102 (1098)20.234 (5416)13.8 (7380)8.954 ± 3.454 ± 3.213.2 ± 1.9 (107)
P(χ2): Chi-squared probability; Nc: Number of apatite crystals analyzed per sample; ρs: Spontaneous track density in analyzed apatite crystals; Ns: Total number of fission tracks counted in ρs; ρd: Induced track density in an external detector adjacent to dosimetry glass; Nd: Total number of fission tracks counted in ρd; ρi: Induced track density in the external detector for analyzed crystals; Ni: Total number of fission tracks counted in ρi; L: Track length.
Publisher’s Note: MDPI stays neutral with regard to jurisdictional claims in published maps and institutional affiliations.

