1. Introduction
Deep unconventional resources, an important factor in the next step of energy supply, make considerable contributions to the development of clean energy and carbon neutrality worldwide [
1,
2,
3]. Deep marine shale gas-bearing strata buried at depths of greater than 3500 m have been discovered in the Wufeng Formation of the Upper Ordovician Longmaxi Formation of the Lower Silurian in the southern Sichuan Basin, China. At present, 200 × 10
8 m
3 commercial shale gas exploitation areas in Changning and Luzhou have been constructed [
4,
5,
6,
7].
Fracture generation under tectonic stress is an important channel for fluid activities in sedimentary basins [
8,
9]. The evolution process of fluid in shale can indicate the enrichment and loss mechanism of shale gas [
10,
11,
12]. The occurrence of fracture veins resulting from tectonic movement in shale reservoirs is caused by fracture opening and paleo-fluid precipitation [
13,
14,
15,
16,
17]. This is a trace of fluid migration and activity, which may be derived from the basin exogenous fluid, and may also be formed by strong material exchange with the surrounding rock. In calcite and quartz veins, the trace elements, the carbonate isotopes (
87Sr/
86Sr, δ
18O, δ
13C) and entrapment temperature, and the pressure and component information of fluid inclusions record different fluid activity events [
18,
19]. These fluid geochemical indicators can be used as the key elements for shale gas accumulation, transformation, and preservation evaluation [
20,
21].
Rare earth elements can be fractionated between fluids and minerals, which are widely used for identifying fluid sources, and determining redox environments [
22,
23]. For example, Ce is sensitive to oxidation and reduction conditions, and the positive Eu anomaly is often used as a sign of high-temperature hydrothermal fluid activity. Carbon and oxygen isotopes are direct geochemical indicators of the mineralized temperature, salinity, and dissolved carbon type of carbonate veins. Strontium isotopes were mainly derived from seawater in the same period. The strontium isotope tracer method can explain the sealing of the reservoir and the cross-layer activity of the fluid [
24].
Fluid inclusions can record temperature during hydrocarbon generation or mineral precipitation, pressurization, and composition [
25,
26]. These physical and chemical properties of fluid inclusions can be directly used to determine hydrocarbon accumulation time and reservoir pore-pressure evolution processes [
27]. Recently, quantitative analysis of fluid inclusions has been realized by high-resolution laser Raman spectroscopy, and the
PVT-x properties of fluid inclusions can be obtained [
28,
29,
30]. Combined with the history of basin tectonic evolution, the preservation conditions of oil and gas in the later stage have been evaluated [
12,
19].
Due to the complex tectonic activities in the margin of the basin, the fluid sequence, source, temperature, and pressure evolution become the key to the evaluation of shale gas preservation conditions. In this paper, PVT-x quantitative analysis of fluid inclusions, rare earth elements, and strontium carbonate isotope tracing methods were combined to study the stage, genesis, and source of fracture veins, the relationship with the surrounding rock, and the enrichment model in the Wufeng–Longmaxi shale. Considering the geochemical indicators, we discuss the influence mechanism of different fractures on the accumulation and loss of shale gas.
2. Geologica Setting
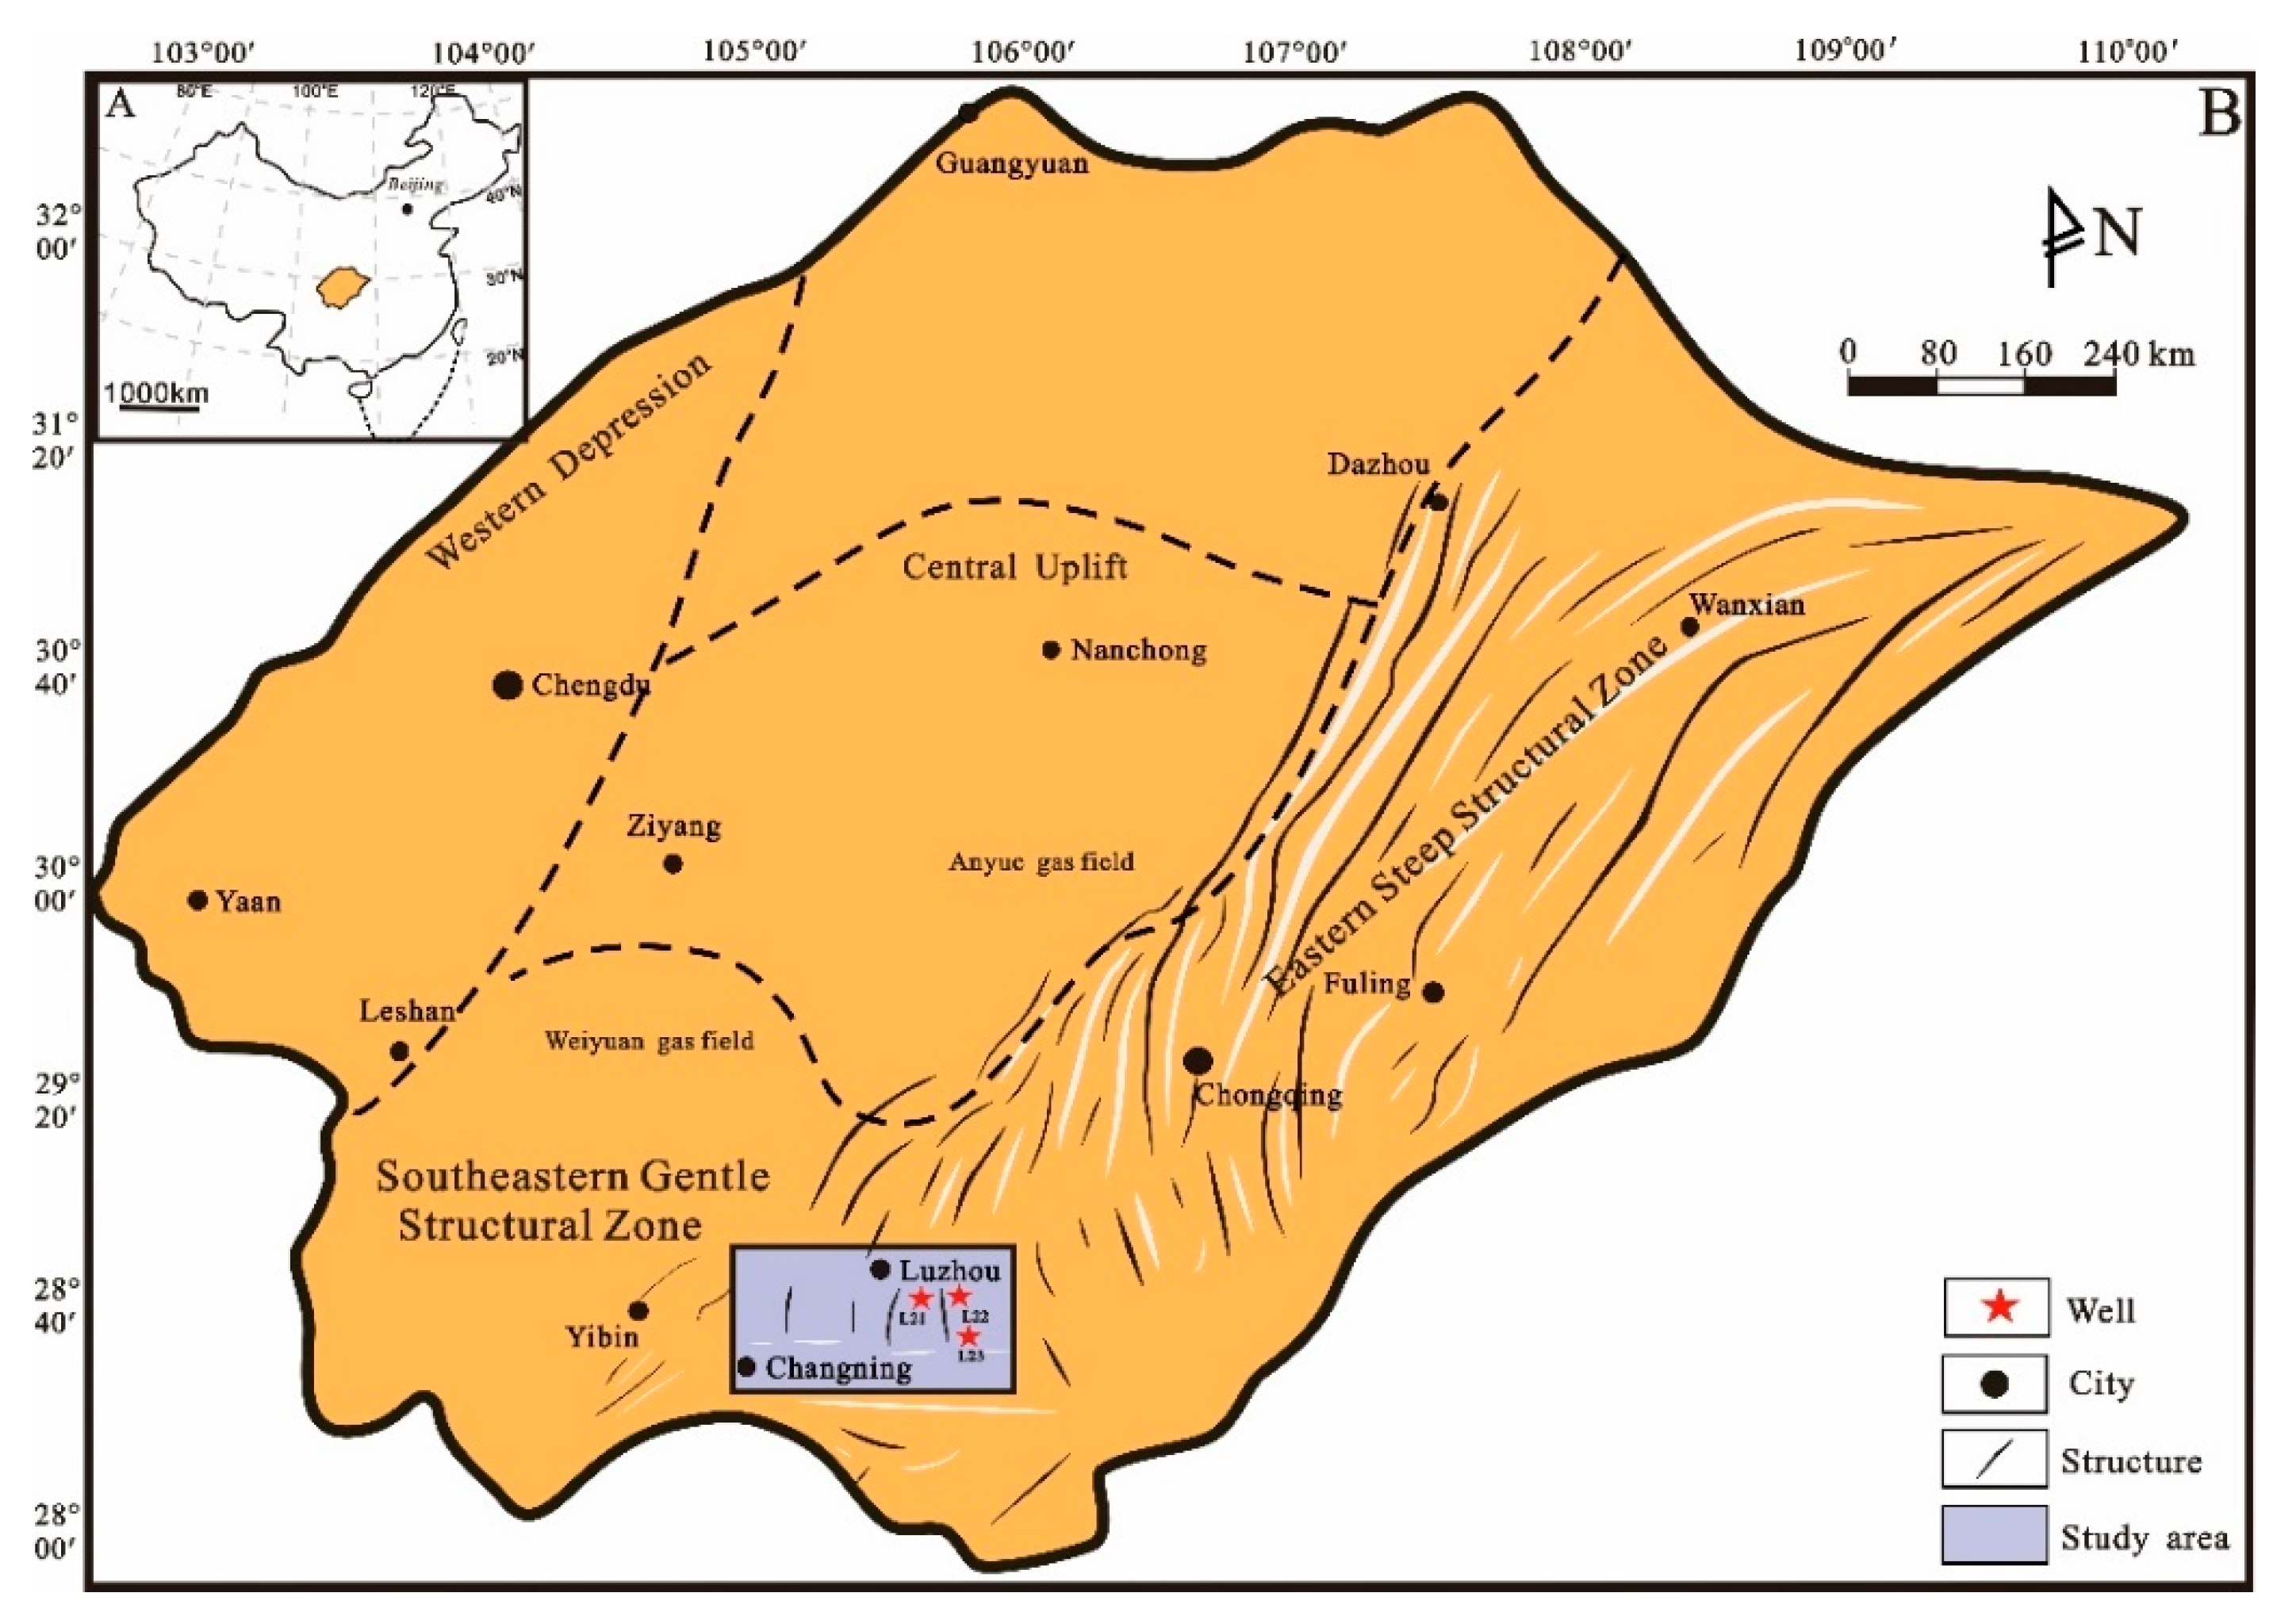
The Changning–Luzhou Shale Gas Field is located in the southern margin of the Sichuan Basin, and is affected by the Daloushan fault–fold belt and the Daliangshan strike-slip fault zone in the southern margin of the Sichuan Basin (
Figure 1). The Changning–Luzhou structure is an anticline extending from northwest to southeast; the axial direction is nearly NW, from Gaoxian to Suyong. It belongs to an asymmetric single box and long axis anticline [
31]. On the whole, it extends from northwest to southeast, and develops secondary folds and faults in the anticline [
32]. The Changning–Luzhou area experienced stages of subsidence before the Late Cretaceous, slow uplift and cooling from the Late Cretaceous to the Miocene, and rapid uplift and erosion from the Miocene to the present [
33]. The Yanshan and Himalayan periods led to strong composite compressive-torsional structural deformation, also resulting in differential uplift and erosion patterns in southern Sichuan [
34].
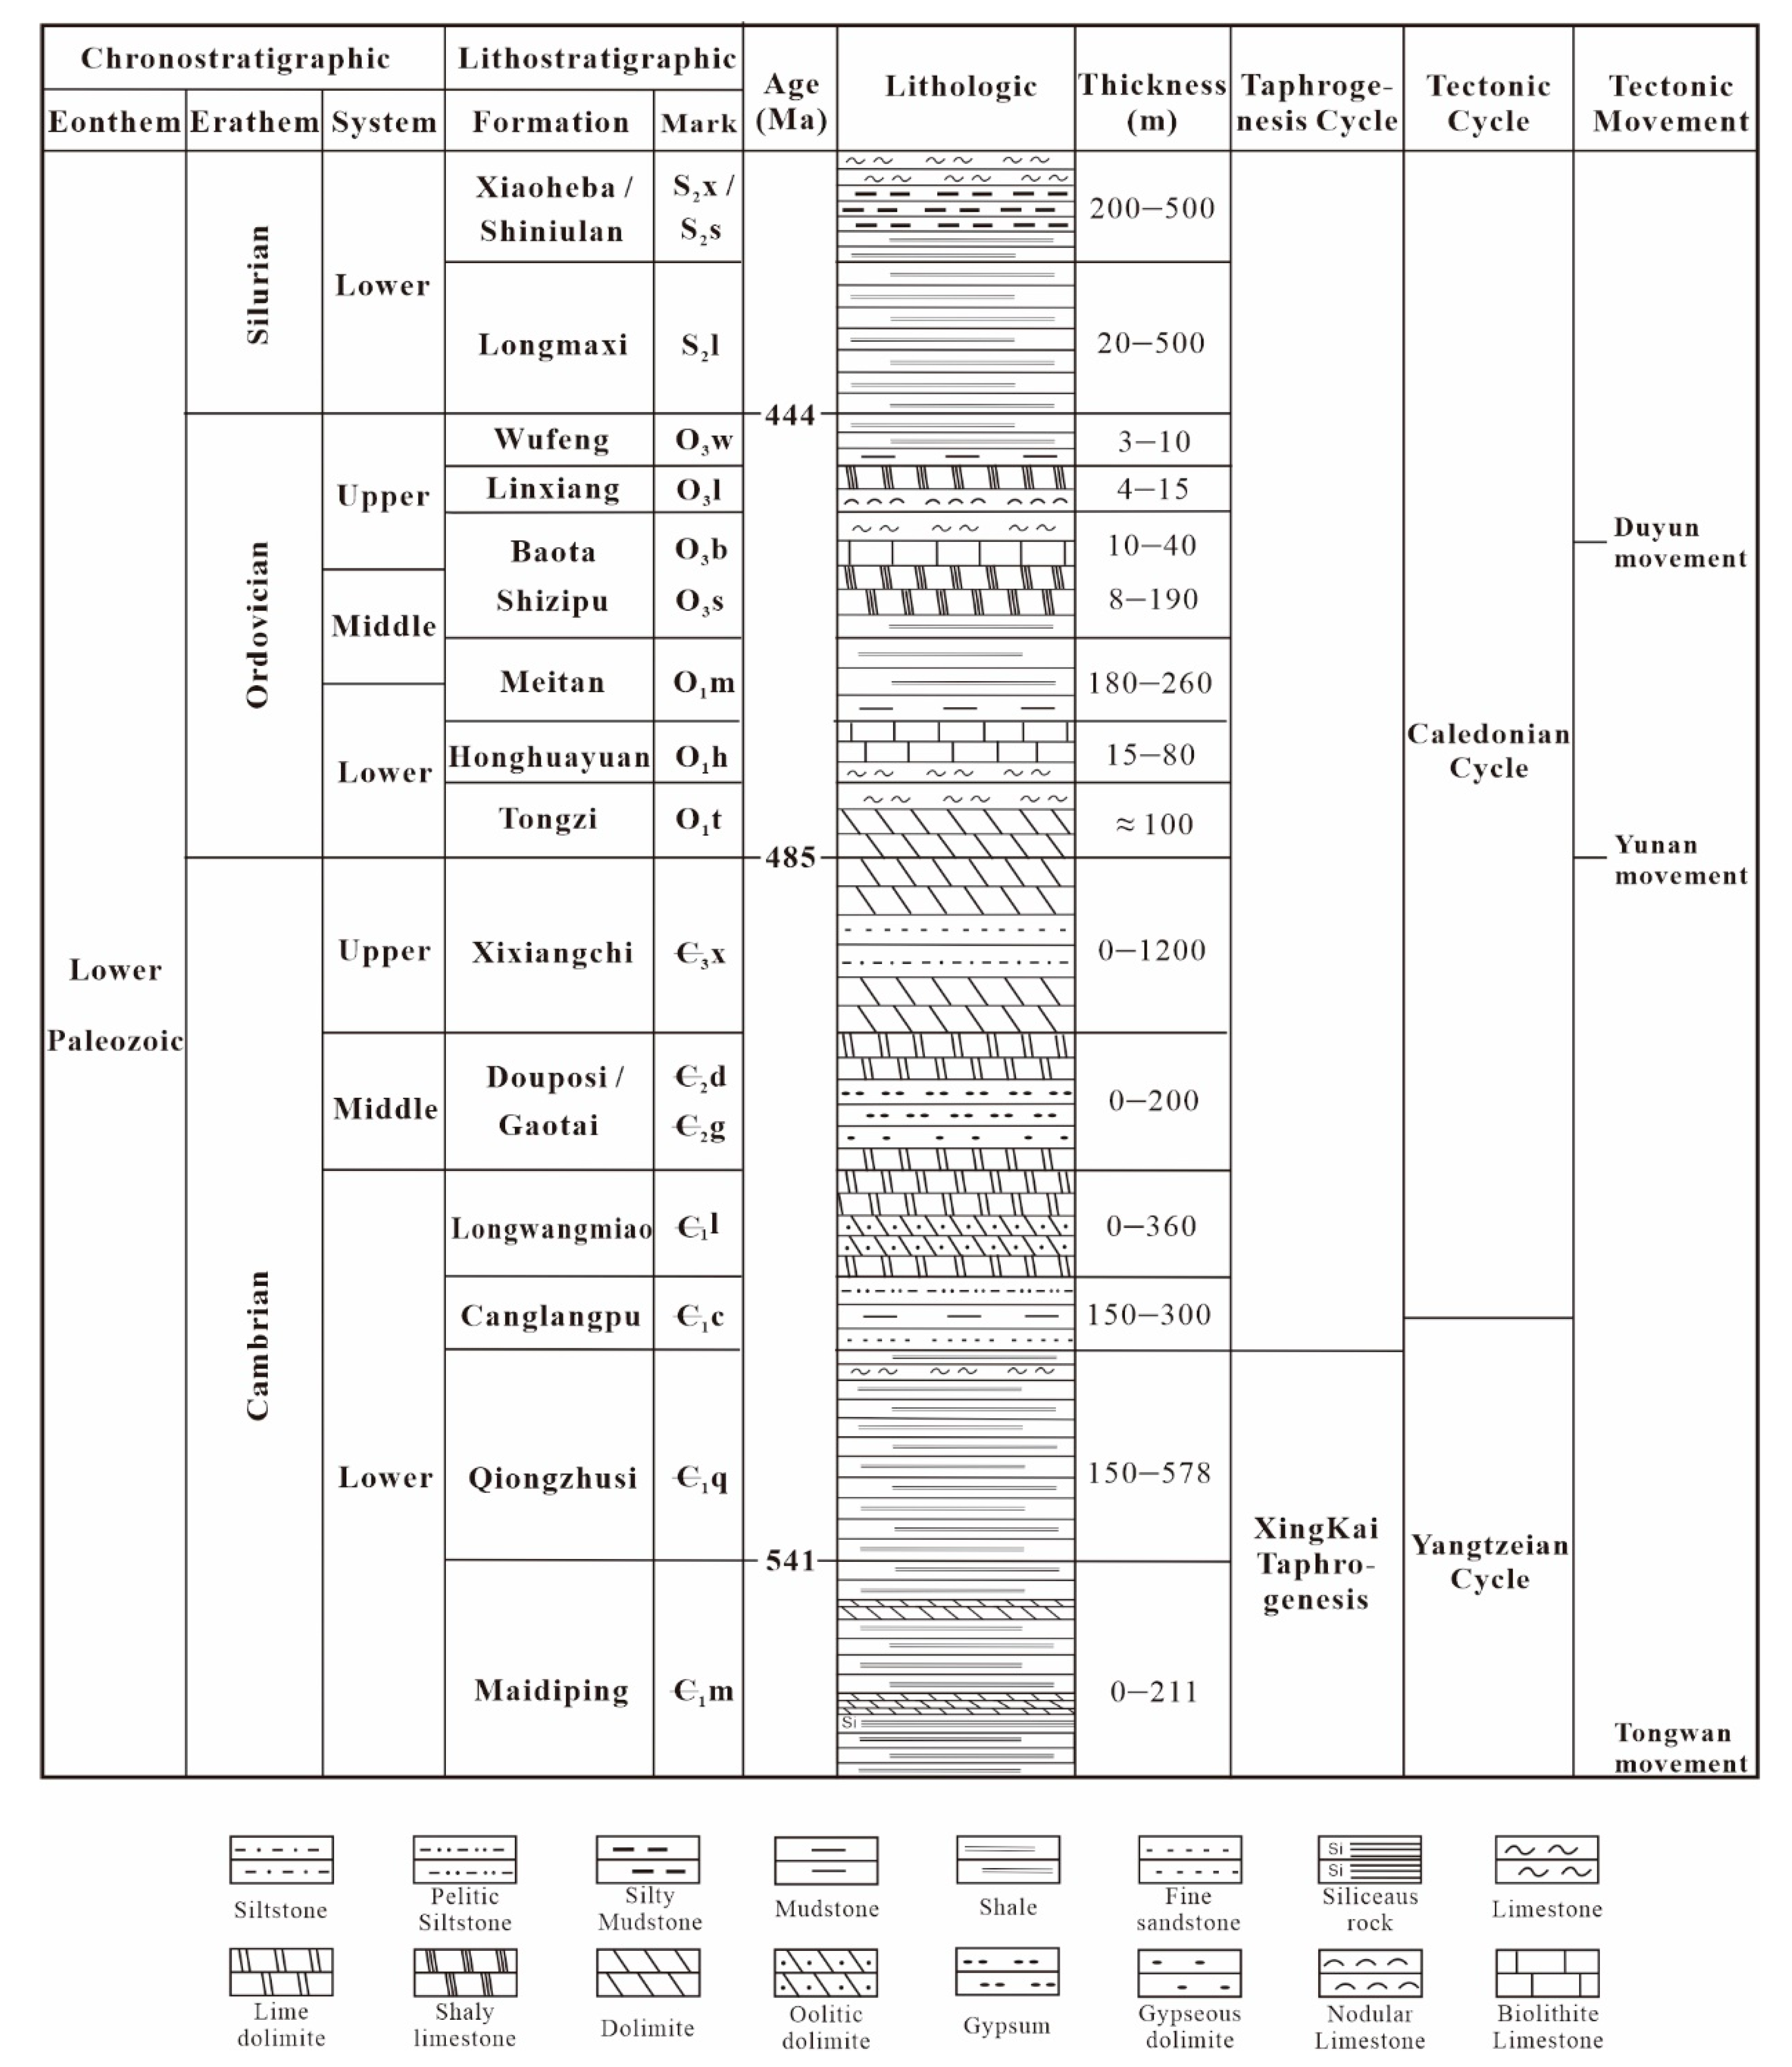
In the early Silurian, the sea level rose rapidly, resulting in a large area of anoxic deep-water shelf environment in the southern Sichuan depression. Marine shale, rich in organic matter, was deposited in the Wufeng Formation. The sea level decreased greatly in the middle and late Silurian, and the subsidence center migrated to the middle and north of Sichuan [
35]. During this period, the main sedimentary characteristics of the Longmaxi Formation in southern Sichuan were shallow shelf facies. The bottom of the Wufeng Formation in the study area is in contact with the Linxiang Formation and the Baota Formation, with clear boundaries [
36]. The lithology of the Wufeng Formation is dark gray–black thin-plate siliceous shale, siliceous mudstone, and the gray–white nodular argillaceous limestone of the Linxiang Formation [
37]. The thin or lenticular medium shell limestone of the Guanyinqiao section of the Ordovician, and the gray–black shale at the bottom of the Longmaxi Formation of the Silurian are the demarcation marks of the Ordovician and Silurian strata (
Figure 2).
The marine shale of the Wufeng–Longmaxi Formations has the characteristics of high organic carbon content (>3%), well-developed organic pores, and high gas content. Black shale with penstone is mainly developed [
38]. The burial depth of the bottom shale of the Wufeng Formation in southern Sichuan ranges from 2000 m to 4500 m, and the maximum burial depth is approximately 7000 m. The present degree of evolution of the organic matter in the shale series of the Wufeng–Longmaxi Formations is high maturity–overmaturity, and it has generally experienced complex processes, such as oil generation, oil cracking into gas, asphalt cracking into gas, and kerogen directly into gas [
39]. The gas composition of the gas reservoirs is mainly CH
4, and the CH
4 content is more than 90%. The formation pressure coefficient indicates the preservation conditions of shale gas [
40]. The formation pressure coefficient in the Changning area is generally characterized by overpressure, ranging from 1.40 to 1.90 [
41].
3. Samples and Methods
Twenty vein-bearing shale samples of the Ordovician Wufeng Formation were collected from Wells L21, L22, and L23 at depths of 3576.0–3664.5 m. Doubly polished thin sections and Canada balsam were used to make (~200 µm) thin sections. The core sheet was immersed in acetone for offloading from the vitreous sheet.
Microphetrographic observation of fluid inclusions and veins was conducted using an Olympus BX51 microscope combined with a Linkam (THMS–600) heating–cooling stage, to measure homogenization temperatures (Th) and ice-melting temperatures™. The control accuracy of the temperature values was ±1 °C. Cathodoluminescence (CL) analyses were carried out with a CL8200 MK5 (beam voltage: 17 kV, beam current: 500 μA).
Rare earth element measurements were measured at the State Key Laboratory of Geological Processes and Mineral Resources (GPMR) in the China University of Geoscience (Wuhan). The experimental instrument of the LA-ICP-MS was Agilent7500a (Wuhan SampleSolution Analytical Technology Co., Ltd., Wuhan, China). During the test, the diameter of the laser beam spot was 90 μm, the background acquisition time was 25 s, and the measurement time was 40 s for each point. The standard sample was synthetic silicate glass NIST610, which was measured after testing of each 8 points.
The Ca of samples was taken as the internal standard for the calculation of element content.
Stable isotopes of carbon and oxygen were measured at the Stable Isotopes Laboratory at the University of Queensland, Australia. The experimental instrument was a MAT251EM mass spectrometer (Wuhan SampleSolution Analytical Technology Co., Ltd., Wuhan, China); the experimental method was the standard 100% phosphoric acid. The analytical precision for the carbonates was established by repeated analysis of standards NBS-18 and NBS-19. The values of δ13C and δ18O were both in Pee Dee Belemnite (PDB) standard, with standard deviation of better than ±001.1‰ for δ13C and ±0.02‰ for δ18O. The radiogenic isotope of strontium was measured at the Radiogenic Isotope Facility (RIF) at the University of Queensland. The instrument was a Multireceiver Inductively Coupled Plasma Mass Spectrometer (MC-ICP-MS) (Wuhan SampleSolution Analytical Technology Co., Ltd., Wuhan, China). The international standard sample (SRM-987) was used to monitor the data quality, and the data were corrected with 86Sr/88Sr = 0.1194.
CH
4 gaseous and dissolved CH
4 aqueous fluid inclusions were all quantified at China University of Geosciences (Wuhan) by Raman spectroscopy, using a JY/Horiba LABRAM HR800 instrument (Hubei Key Laboratory of Marine Geological Resources, China University of Geosciences, Wuhan, China), which was equipped with 20×, 50×, and 100× long/short-focus objectives, and a 532 nm green laser with 200–500 mW output power. The spectra collection was set to a 150 µm focused foramen and 300 gr·mm
−1 optical grating with a 2650 cm
−1 grating center. The accumulation times were set from 200–500, for ensuring the highest signal-to-noise ratio to calculate the area ratio of water and CH
4. To acquire accurate Raman shifts for individual gaseous inclusions, a 1800 gr·mm
−1 grating/50-μm aperture was adopted. Neon lamp signals were simultaneously collected to acquire Raman wavenumbers [
42]. These high-resolution techniques were used to capture precise wavenumber shifts and peak area
ratios (PARs), so that the density of the pure CH
4 inclusions and the concentration of CH
4 could be calculated by measuring the C-H symmetric stretching band (
v1) of CH
4 in homogenized states (for more details, see [
24,
27]). Inclusion density and homogenization temperature were substituted into different systems of thermodynamic model to calculate inclusion trapped pressure [
43,
44].
The burial–thermal history was simulated utilizing BasinMod-1D software (3.0). Based on the logging lithology and stratigraphic data, the reciprocal pressure model proposed by Falvey was used to strip back the thickness of strata in different geological history periods, to simulate the burial history [
45]. The measured vitrinite reflectance values and corrected borehole temperatures were provided by the Petro China Southwest Oil and Gasfield Company, for calibrating the thermal history.
4. Results
4.1. Fracture Development Characteristics
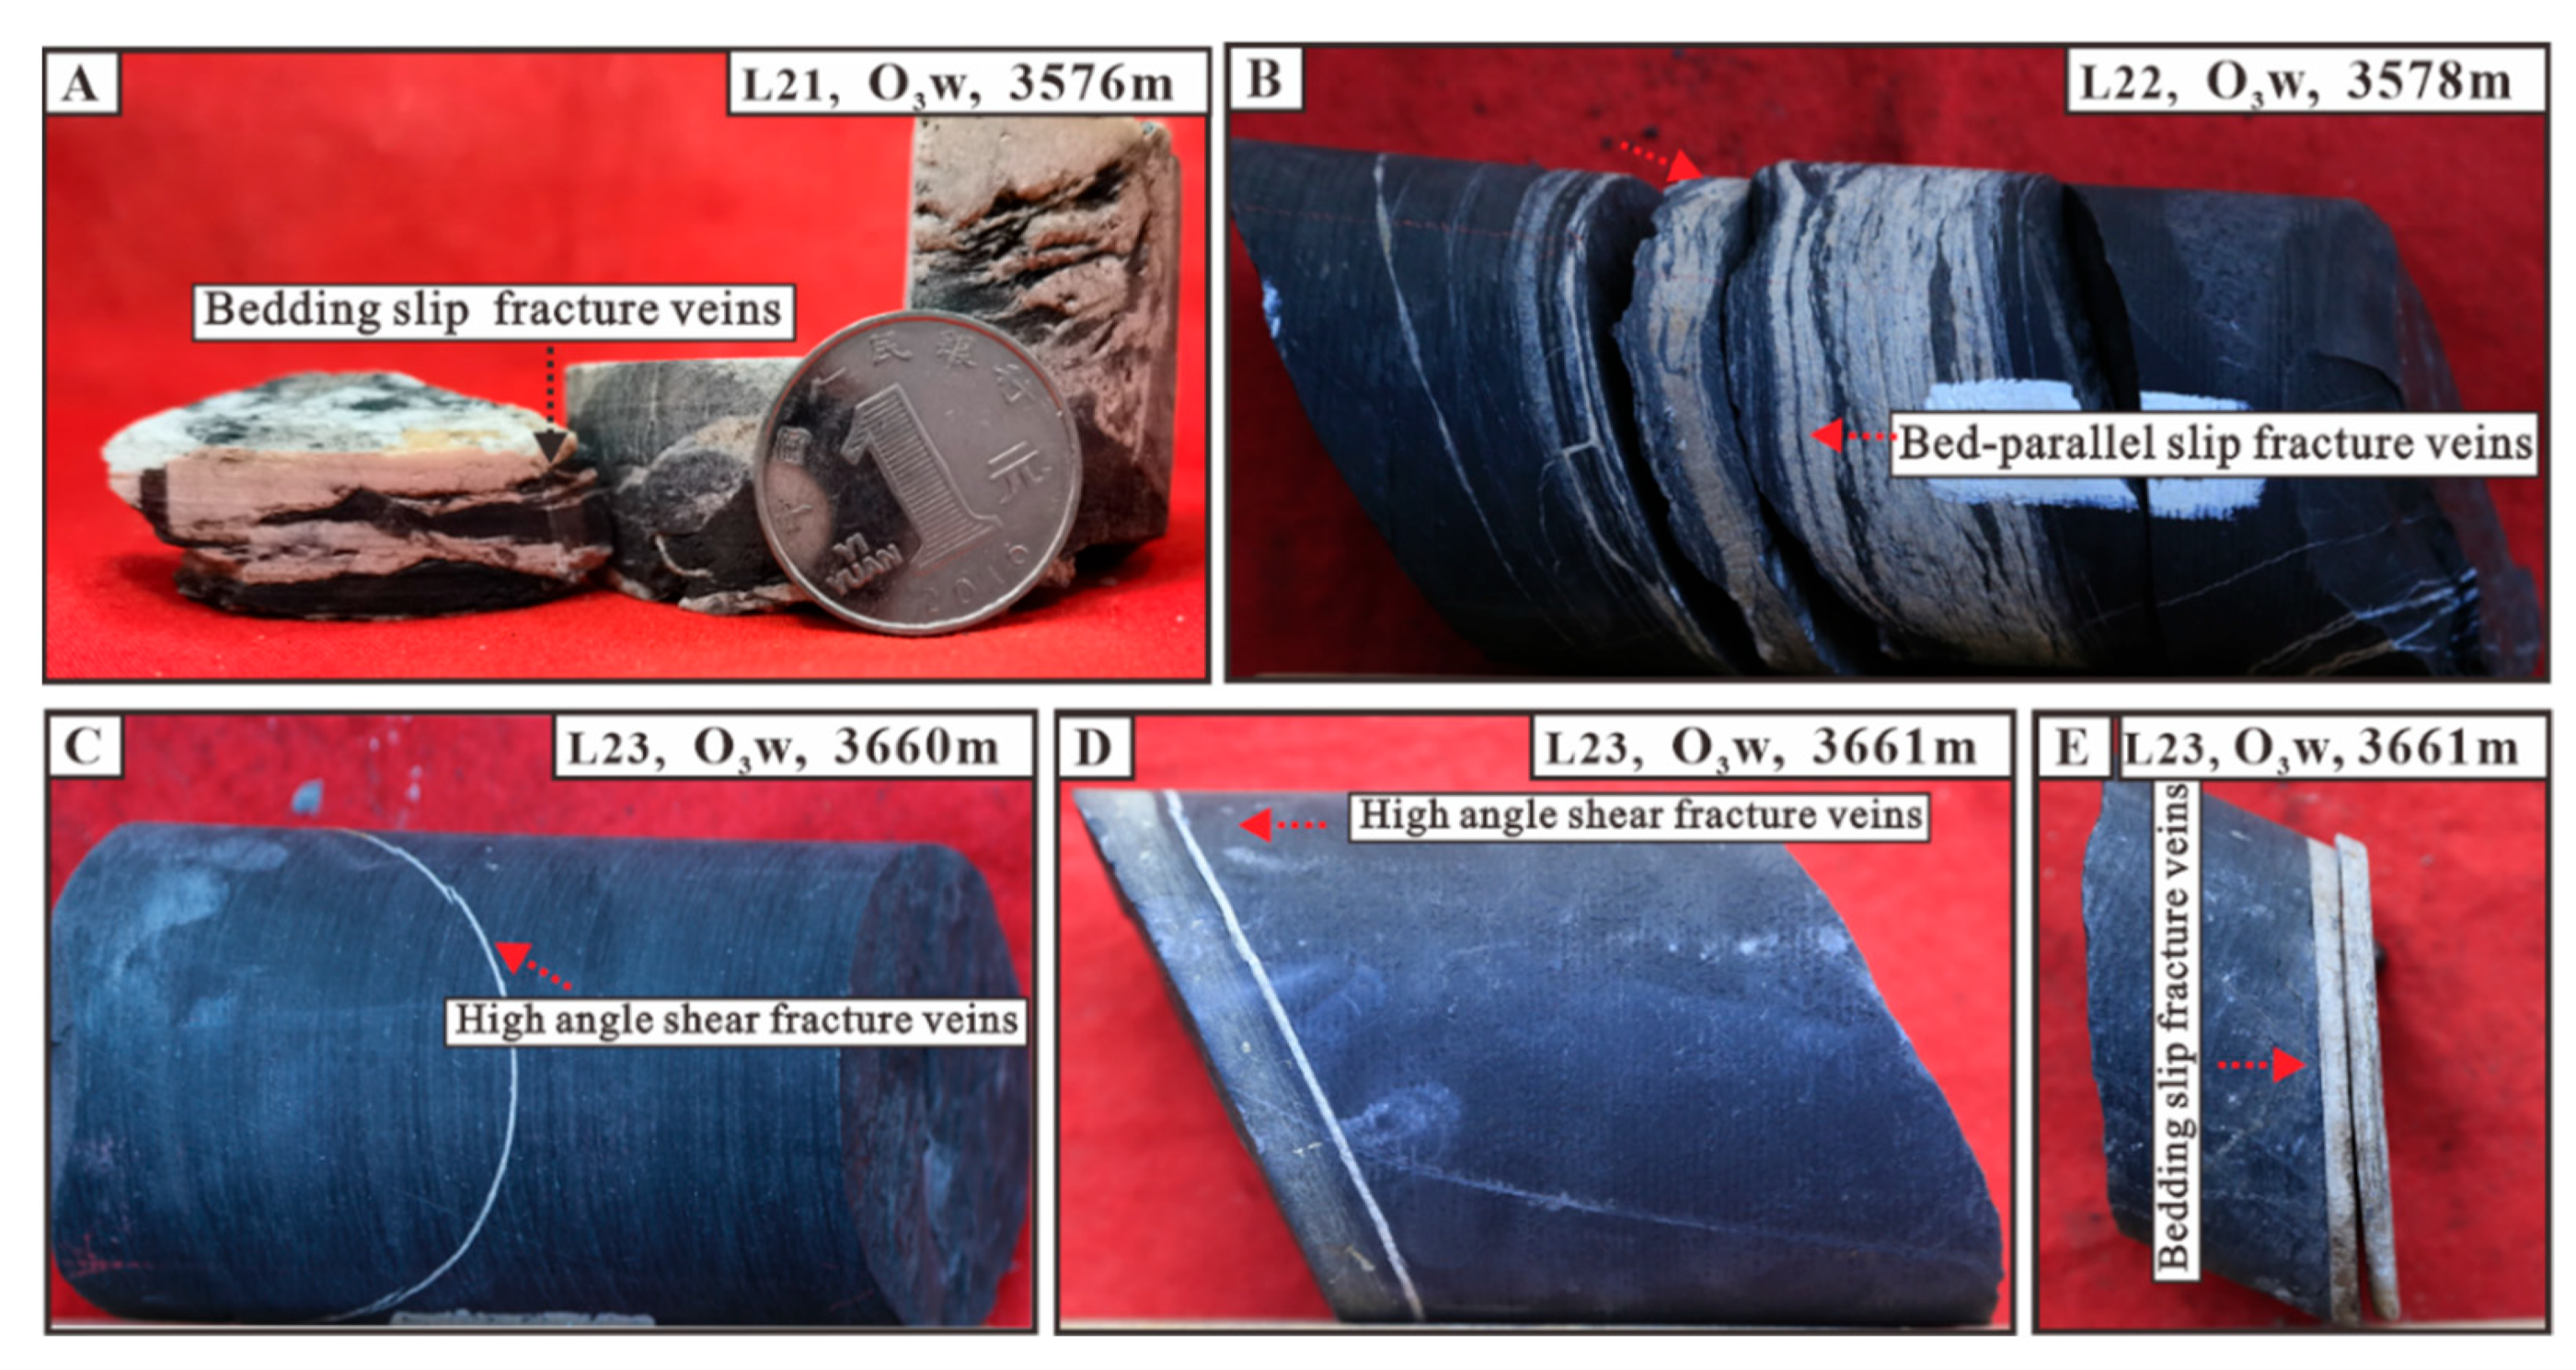
Two classical types of natural fractures wre clearly observed in the gas-bearing shale of the Wufeng–Longmaxi Formations in the Changning–Luzhou area. The first belonged to the slip seam, the development of the occurrence of parallel level development or, with the level of low-angle intersection, seam common scratches. The distance between the fracture walls ws 1–5 mm, belonging to high opening-degree fractures. The fracture dip angle ranged from 0° to 45°, and the veins were filled with large amounts of calcite and quartz. Due to unbalanced compaction, the contact position between the veins and the surrounding rock was uneven, and the fracture surface usually displayed roughness, with a small sliding distance (
Figure 3).
The fracture surface of the shear fracture was straight, and obliquely intersected with a high plane angle, and usually cut through the different strata to form a trans-layer phenomenon. Obvious long extension, scratches, and steps could be seen on the fracture surface. The distance between the fracture walls ws <0.5 mm, belonging to low-mid opening-degree fractures. This dip angle of the high-angle fracture ranged from 45° to 90°, and the shear fracture was filled with calcite. The contact position between the veins and the surrounding rock was straight.
4.2. Filling Mineral Petrography
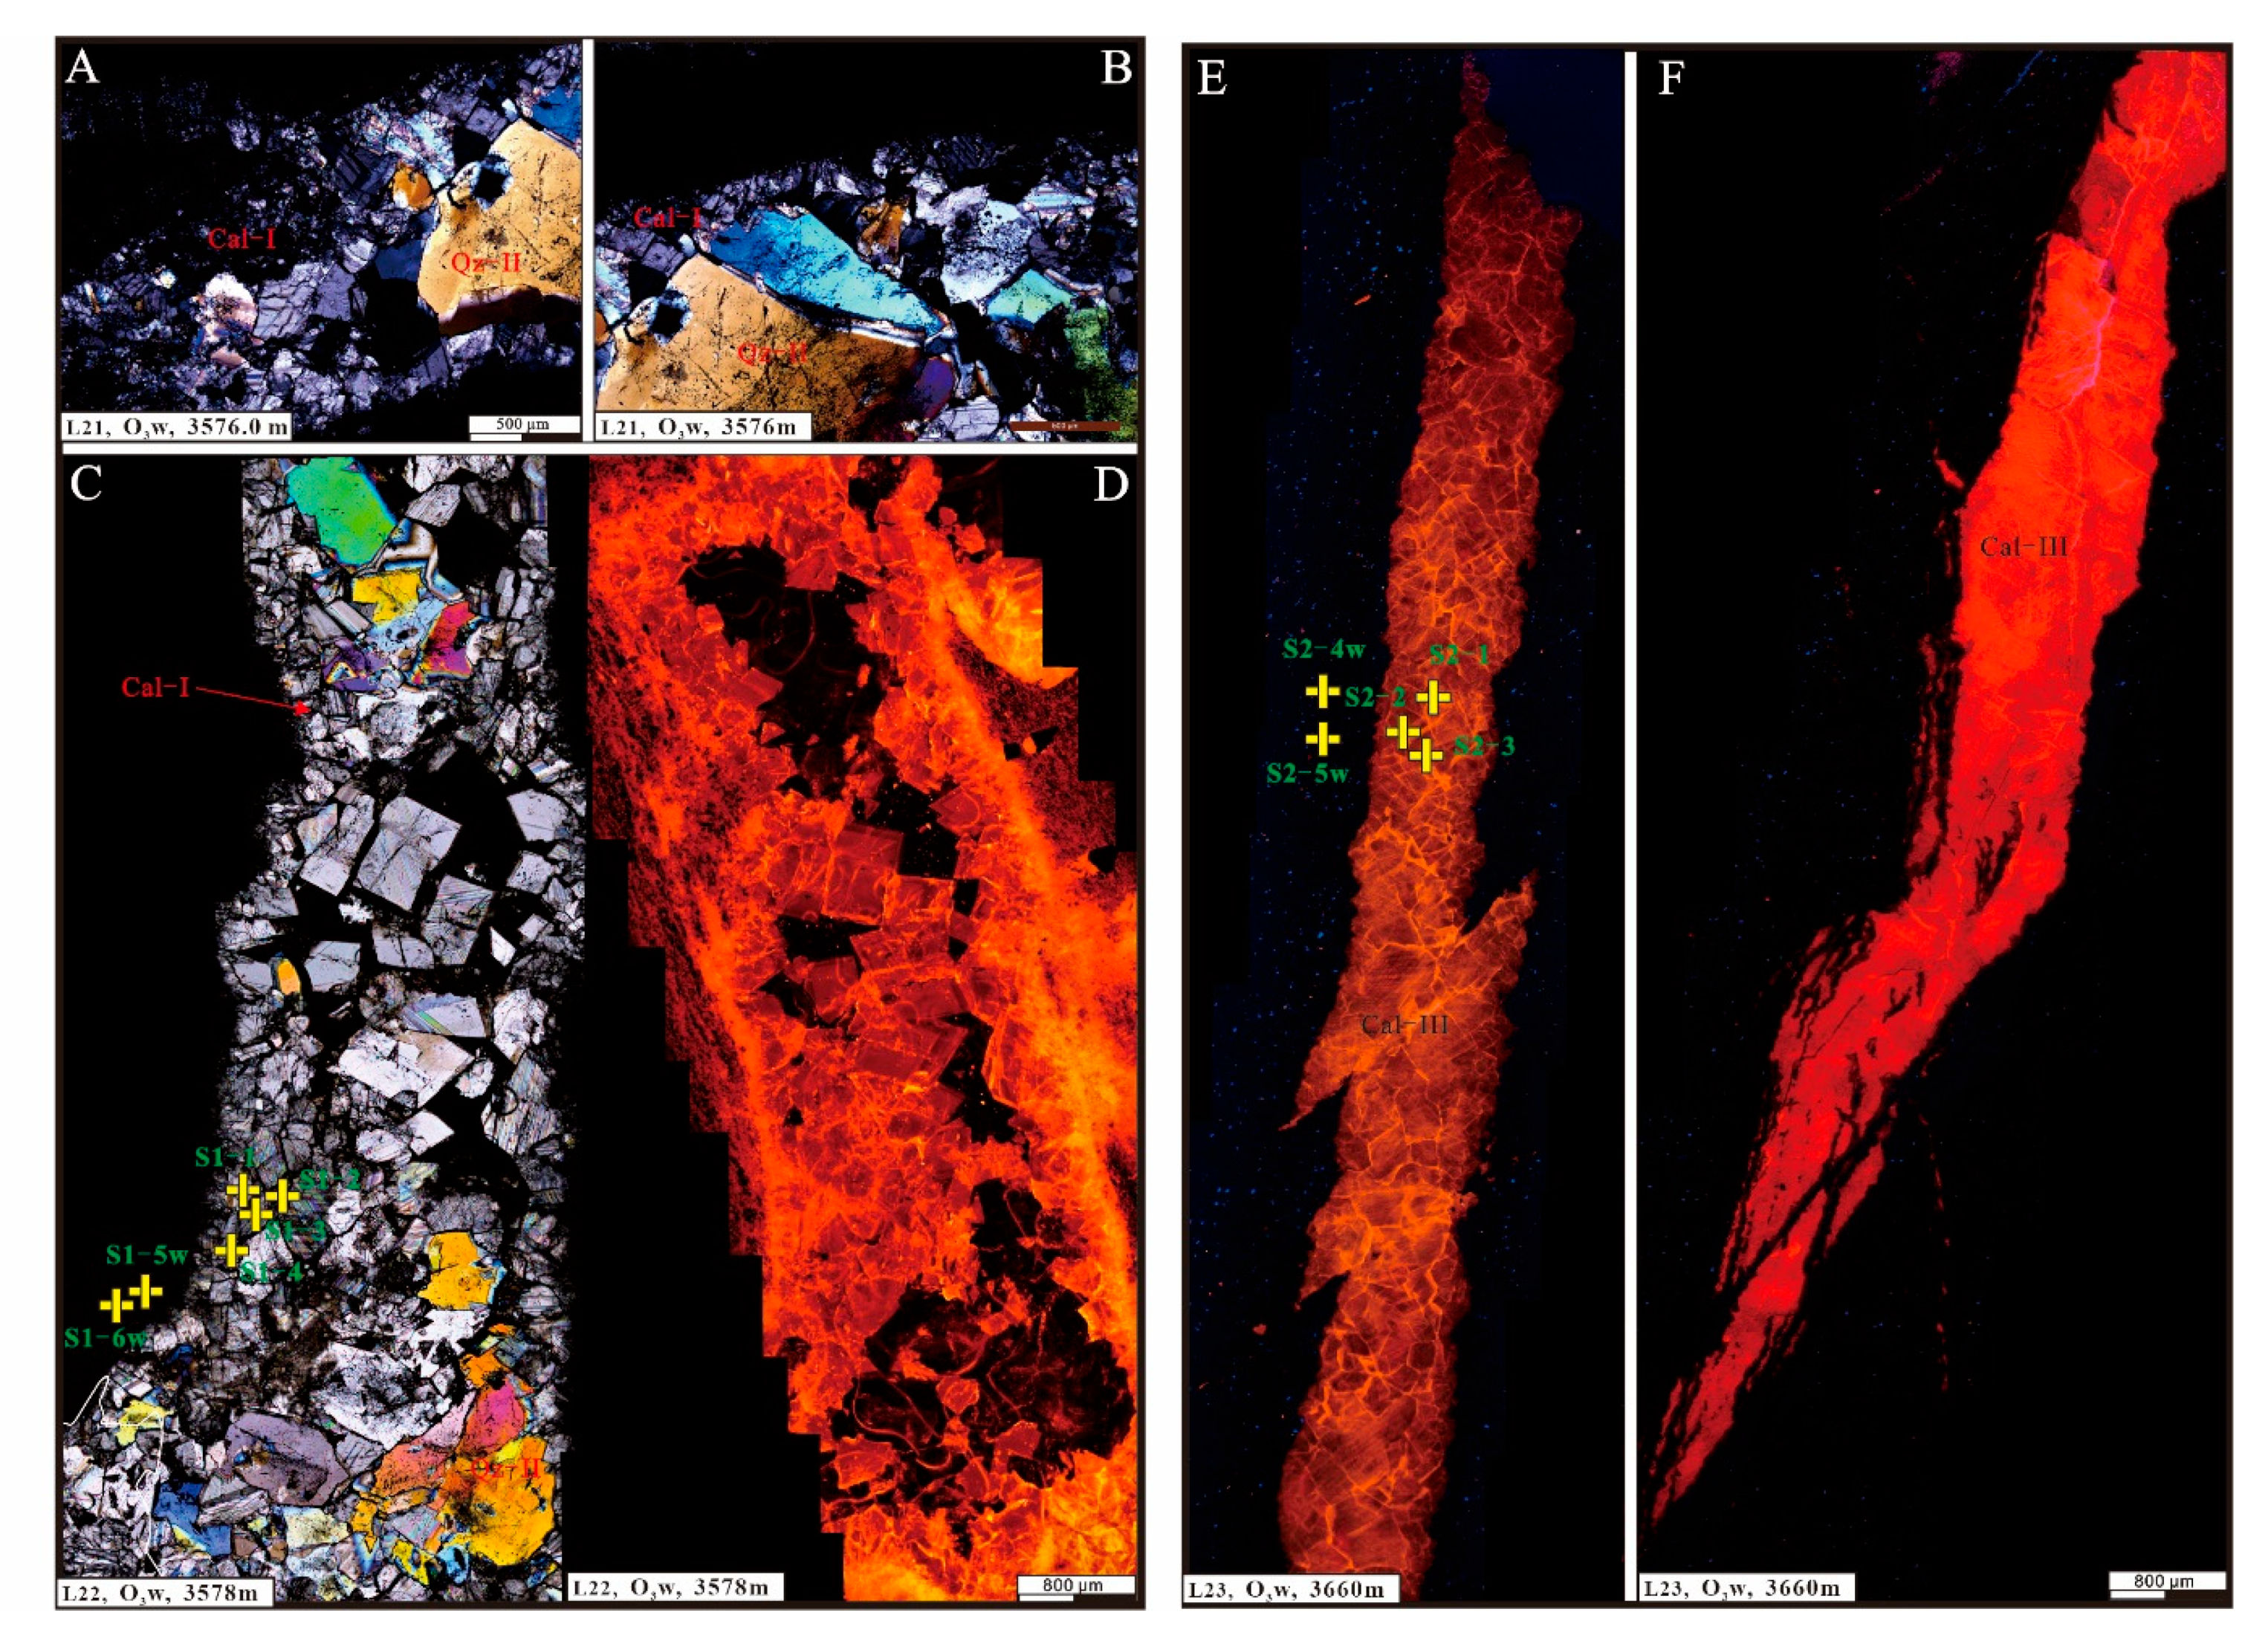
Fluid migration in shale fractures can precipitate calcite, dolomite or quartz, and other minerals. The intersection relationship of veins and cathodoluminescence can distinguish diagenetic fluids crystallized at different times or derived from different sources.
Figure 4A,B show petrographic photographs of bed-parallel slip fractures under orthogonal polarization. Meso-coarse calcite crystallized along the surrounding rock, and contacted directly with the surrounding rock. The calcite had an equiaxed grain shape, obvious cleavage, and internal inclusions, including a large number of quartz particles.
Figure 4C,D show the orthogonal polarization and cathodoluminescence panoramic photos of the bedding slip fracture veins. The calcite in the bedding veins excited orange light, while the quartz did not emit cathodoluminescence light. The calcite veins filling in the high-angle shear fracture excited orange and red light. Apparently, the stage of the bedding veins was early calcite cementation and late quartz crystallization. In the high-angle shear fracture vein, only one stage of calcite could be observed.
4.3. Rare Earth Elements (REE) and Element Compositions
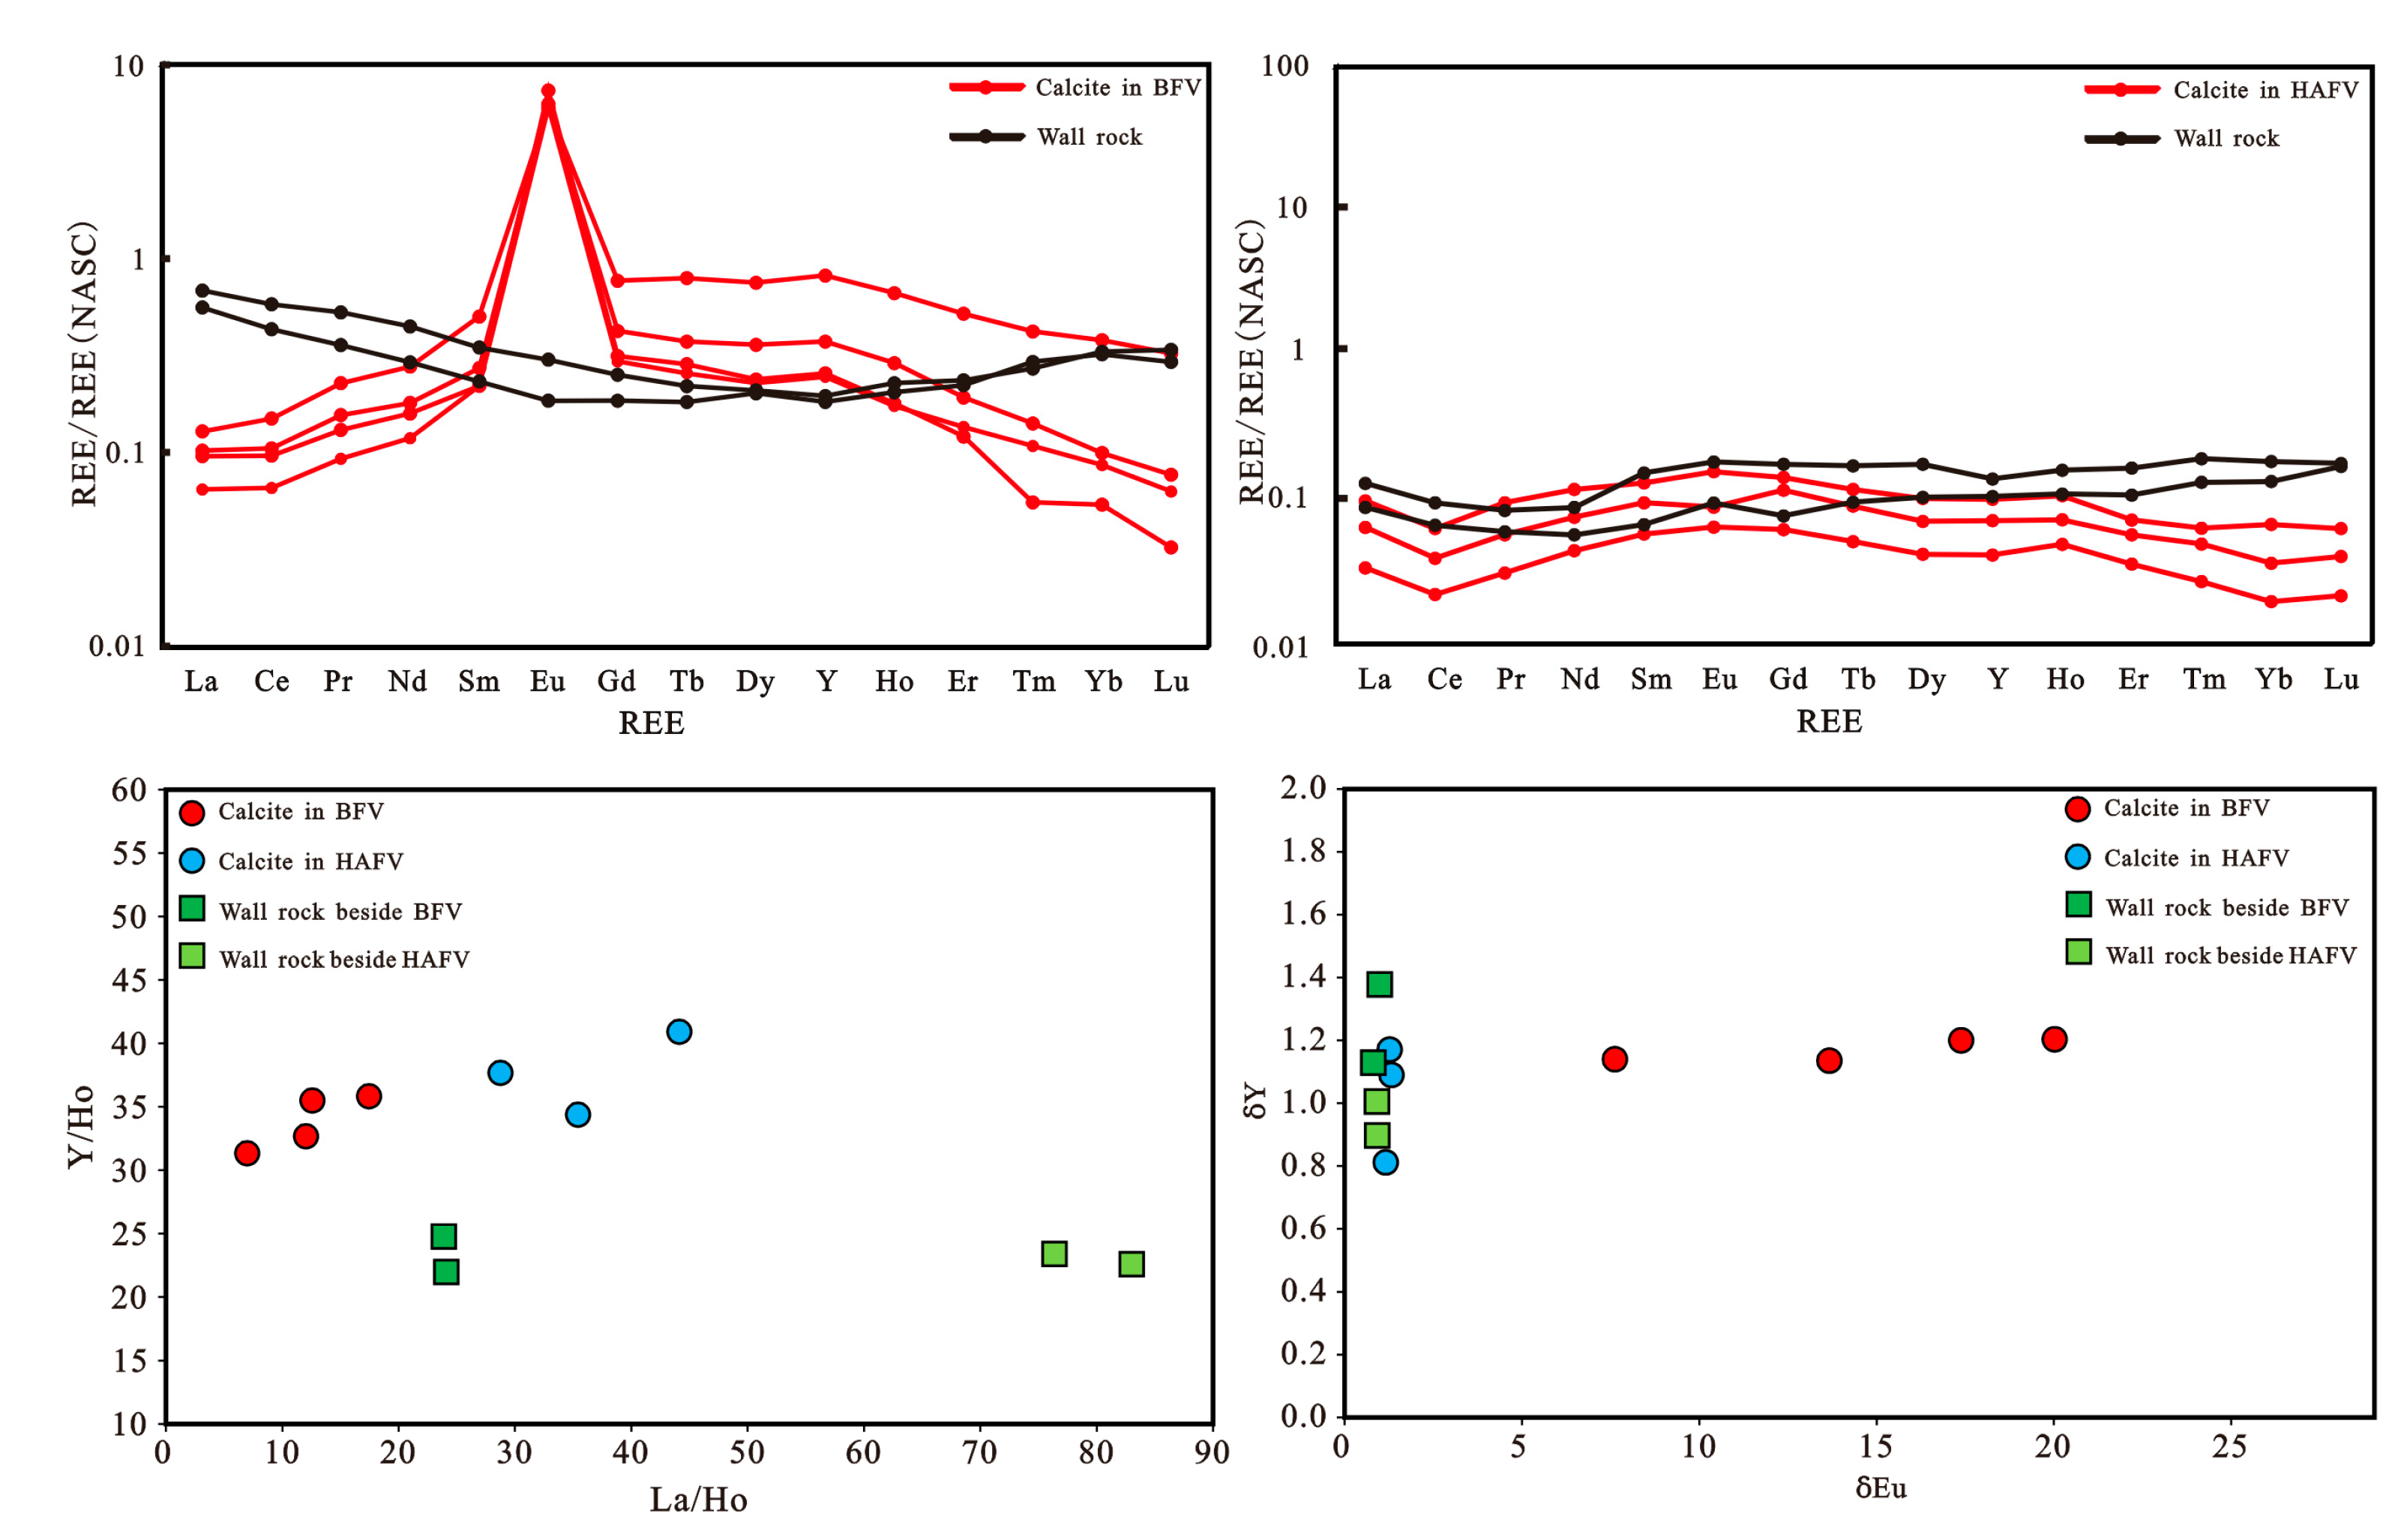
The REE compositions for calcite veins and the surrounding host rocks within the Wufeng–Longmaxi Formations in the Changning–Luzhou area are presented in
Table 1. Focusing on different generations of fracture cements, microscale analysis of the element concentrations was performed by LA-ICP–MS.
Rare earth concentrations were normalized by the standard of North American Shale. The total REE contents (ΣREE) of the bedding calcite vein in well L21 varied from 5.6283 to 8.6705 ppm (avg. 6.7911 ppm). The ΣREE of the contact surrounding rock varied from 0.4746 to 1.4184 ppm (avg. 3.7839 ppm) (
Table 1). The ΣREE of the high-angle calcite vein in well L21 varied from 0.4746 to 1.4184 ppm (avg. 0.9323 ppm), and the ΣREE of the contact surrounding rock varied from 1.3904 to 2.3537 ppm (avg. 1.8721 ppm). The calcite in the bedding veins showed an Eu-positive anomaly (δEu = 7.6180–20.0173) (
Table 2). The surrounding rock exhibited enrichment in HREE (
Figure 5). The ΣREE of the surrounding rock was less than that in the calcite of the bedding vein. Nevertheless, the calcite in the high-angle veins showed a Ce-negative anomaly, and its ΣREE was less than that of surrounding rock (
Figure 5). The Y/Ho values of the calcite in the bedding veins and the high-angle calcite in well L21 ranged from 31.3448 to 35.8317 (avg. 33.8430) and 34.4003 to 37.6917 (avg. 37.6742), respectively.
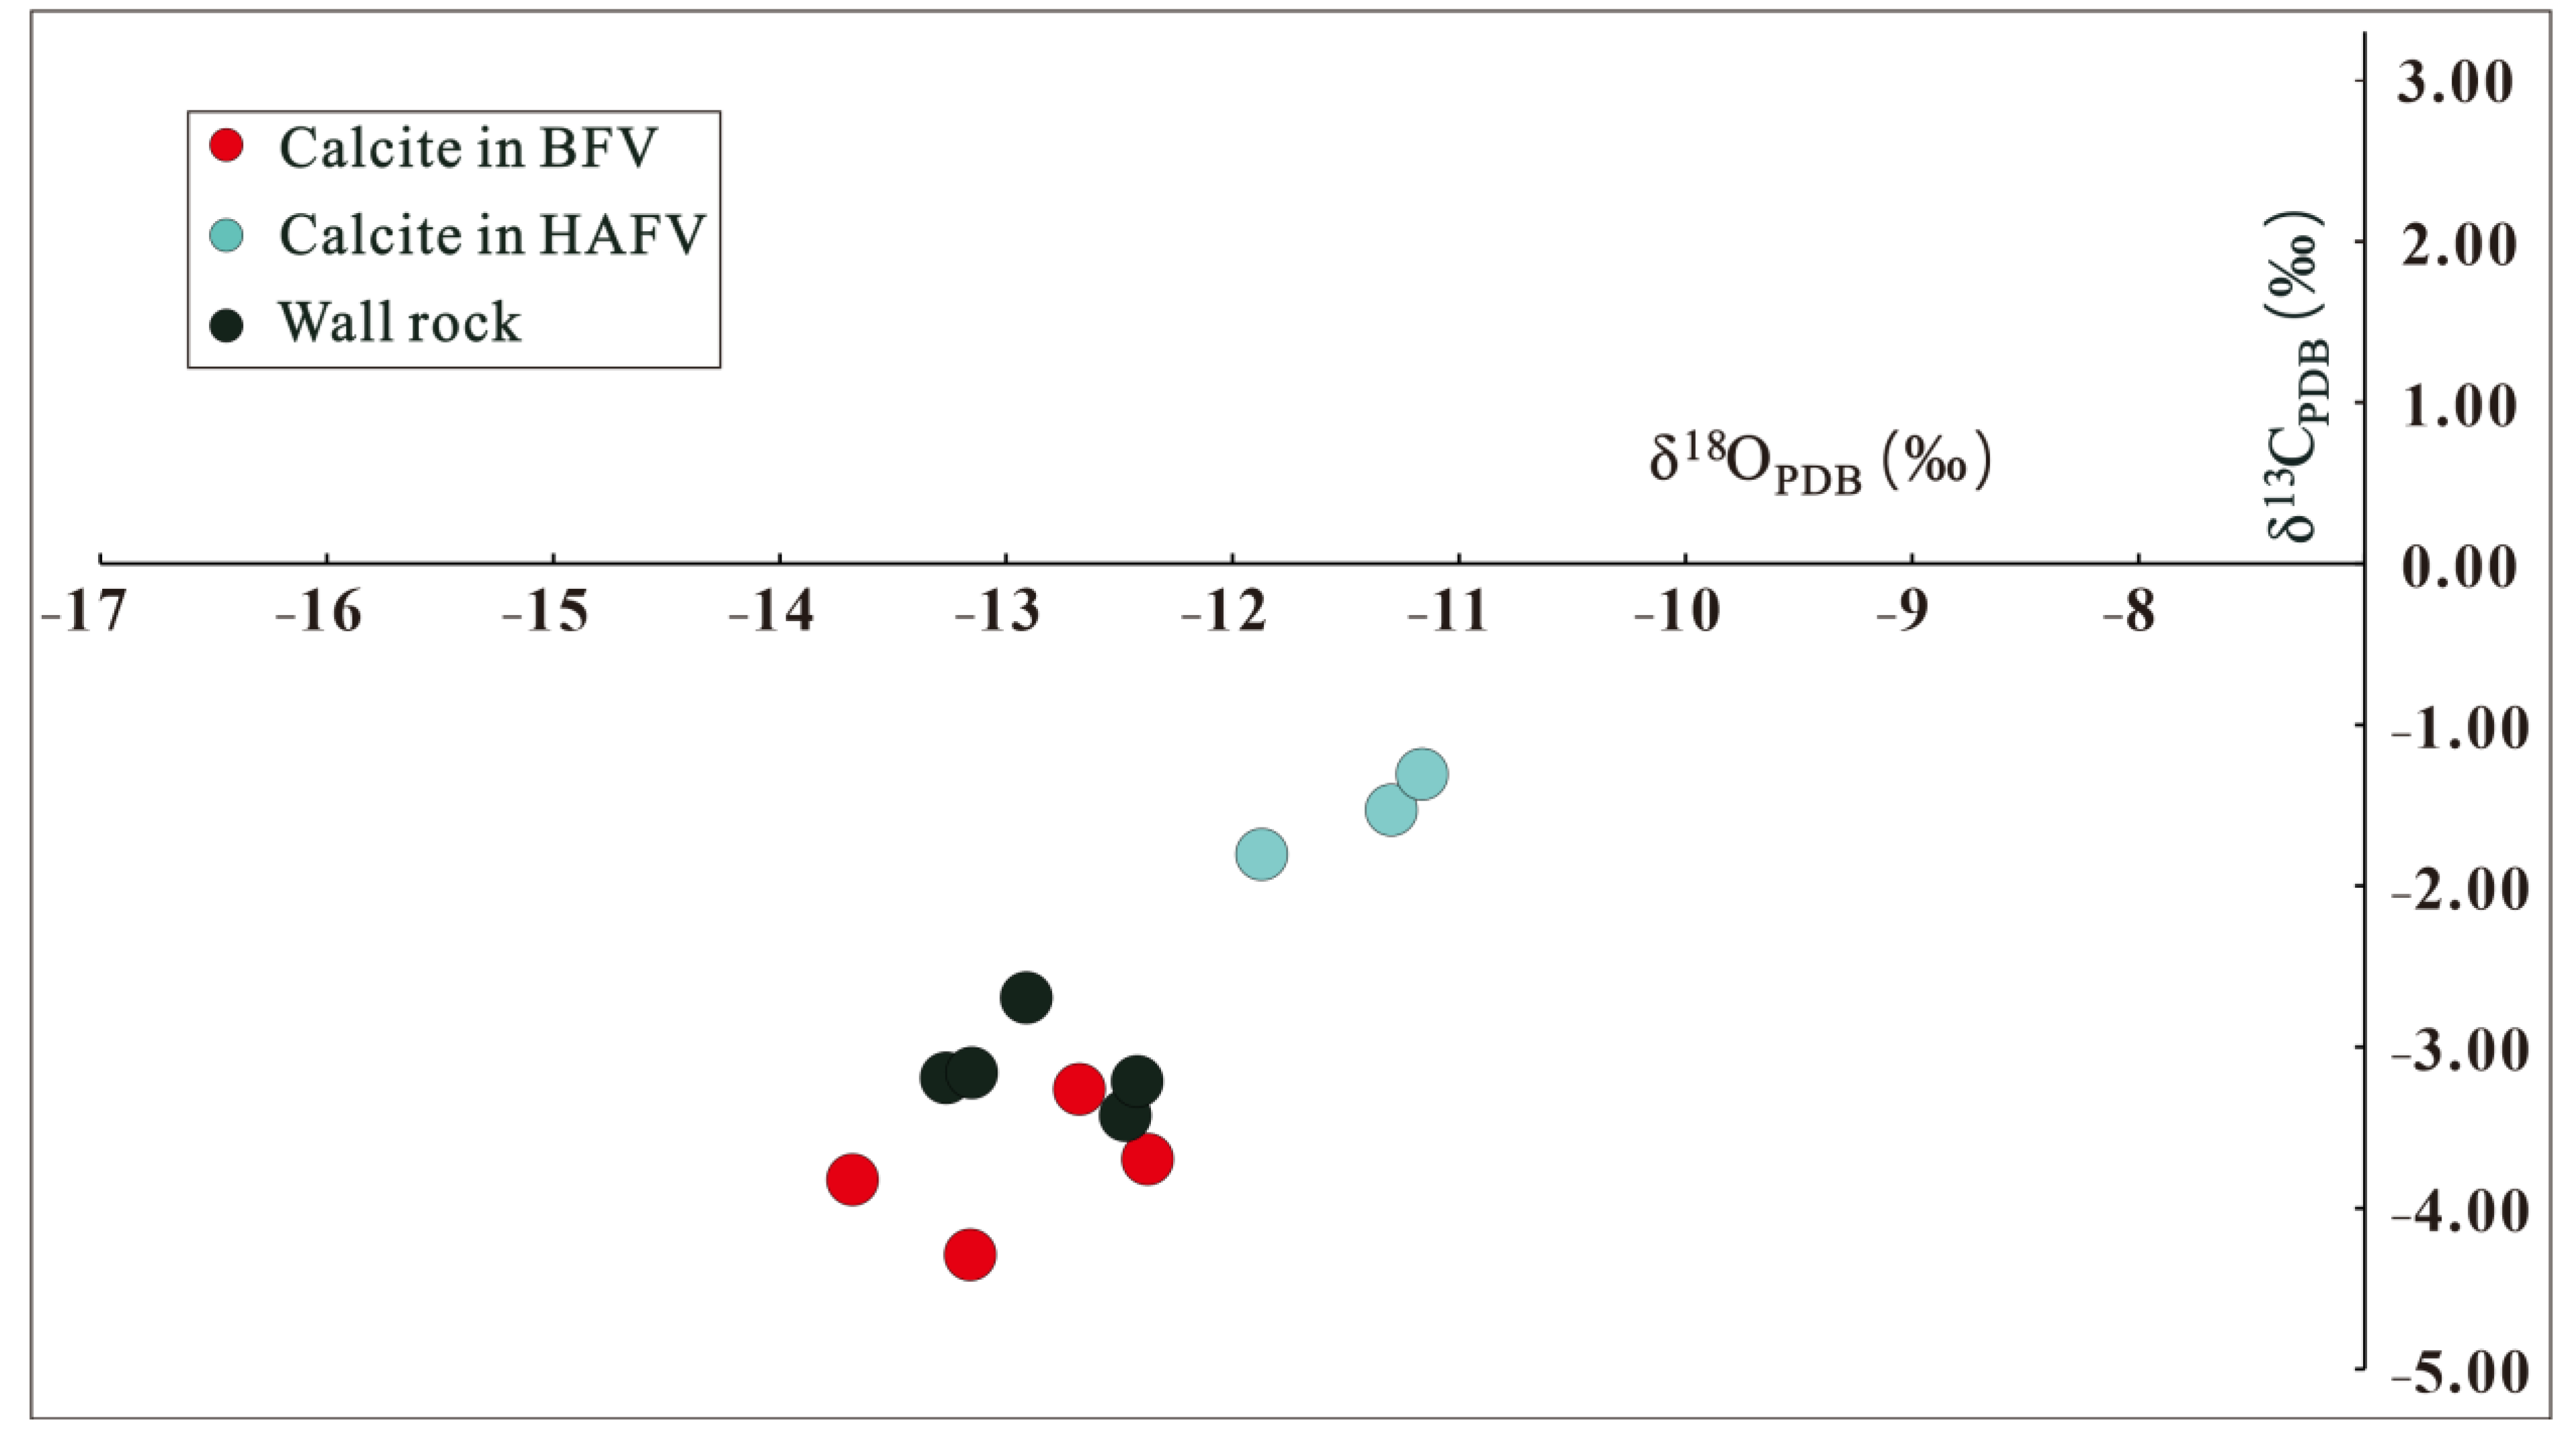
4.4. Carbon, Oxygen, and Strontium Isotopes
The δ
13C
PDB values of the calcite in the bedding veins in the O
3w formation varied from −4.21‰ to −3.18‰, slightly lower than those of the surrounding rock (−3.14‰ to −2.72‰). The δ
13C
PDB values of calcite in the high-angle veins varied from −1.92‰ to −1.42‰. The δ
18O
PDB values of the calcite in the bedding veins varied from −13.83‰ to −12.38‰, and the calcite in the high-angle veins varied from −11.93‰ to −11.15‰, higher than those of the surrounding rock (−13.17‰ to −12.48‰) (
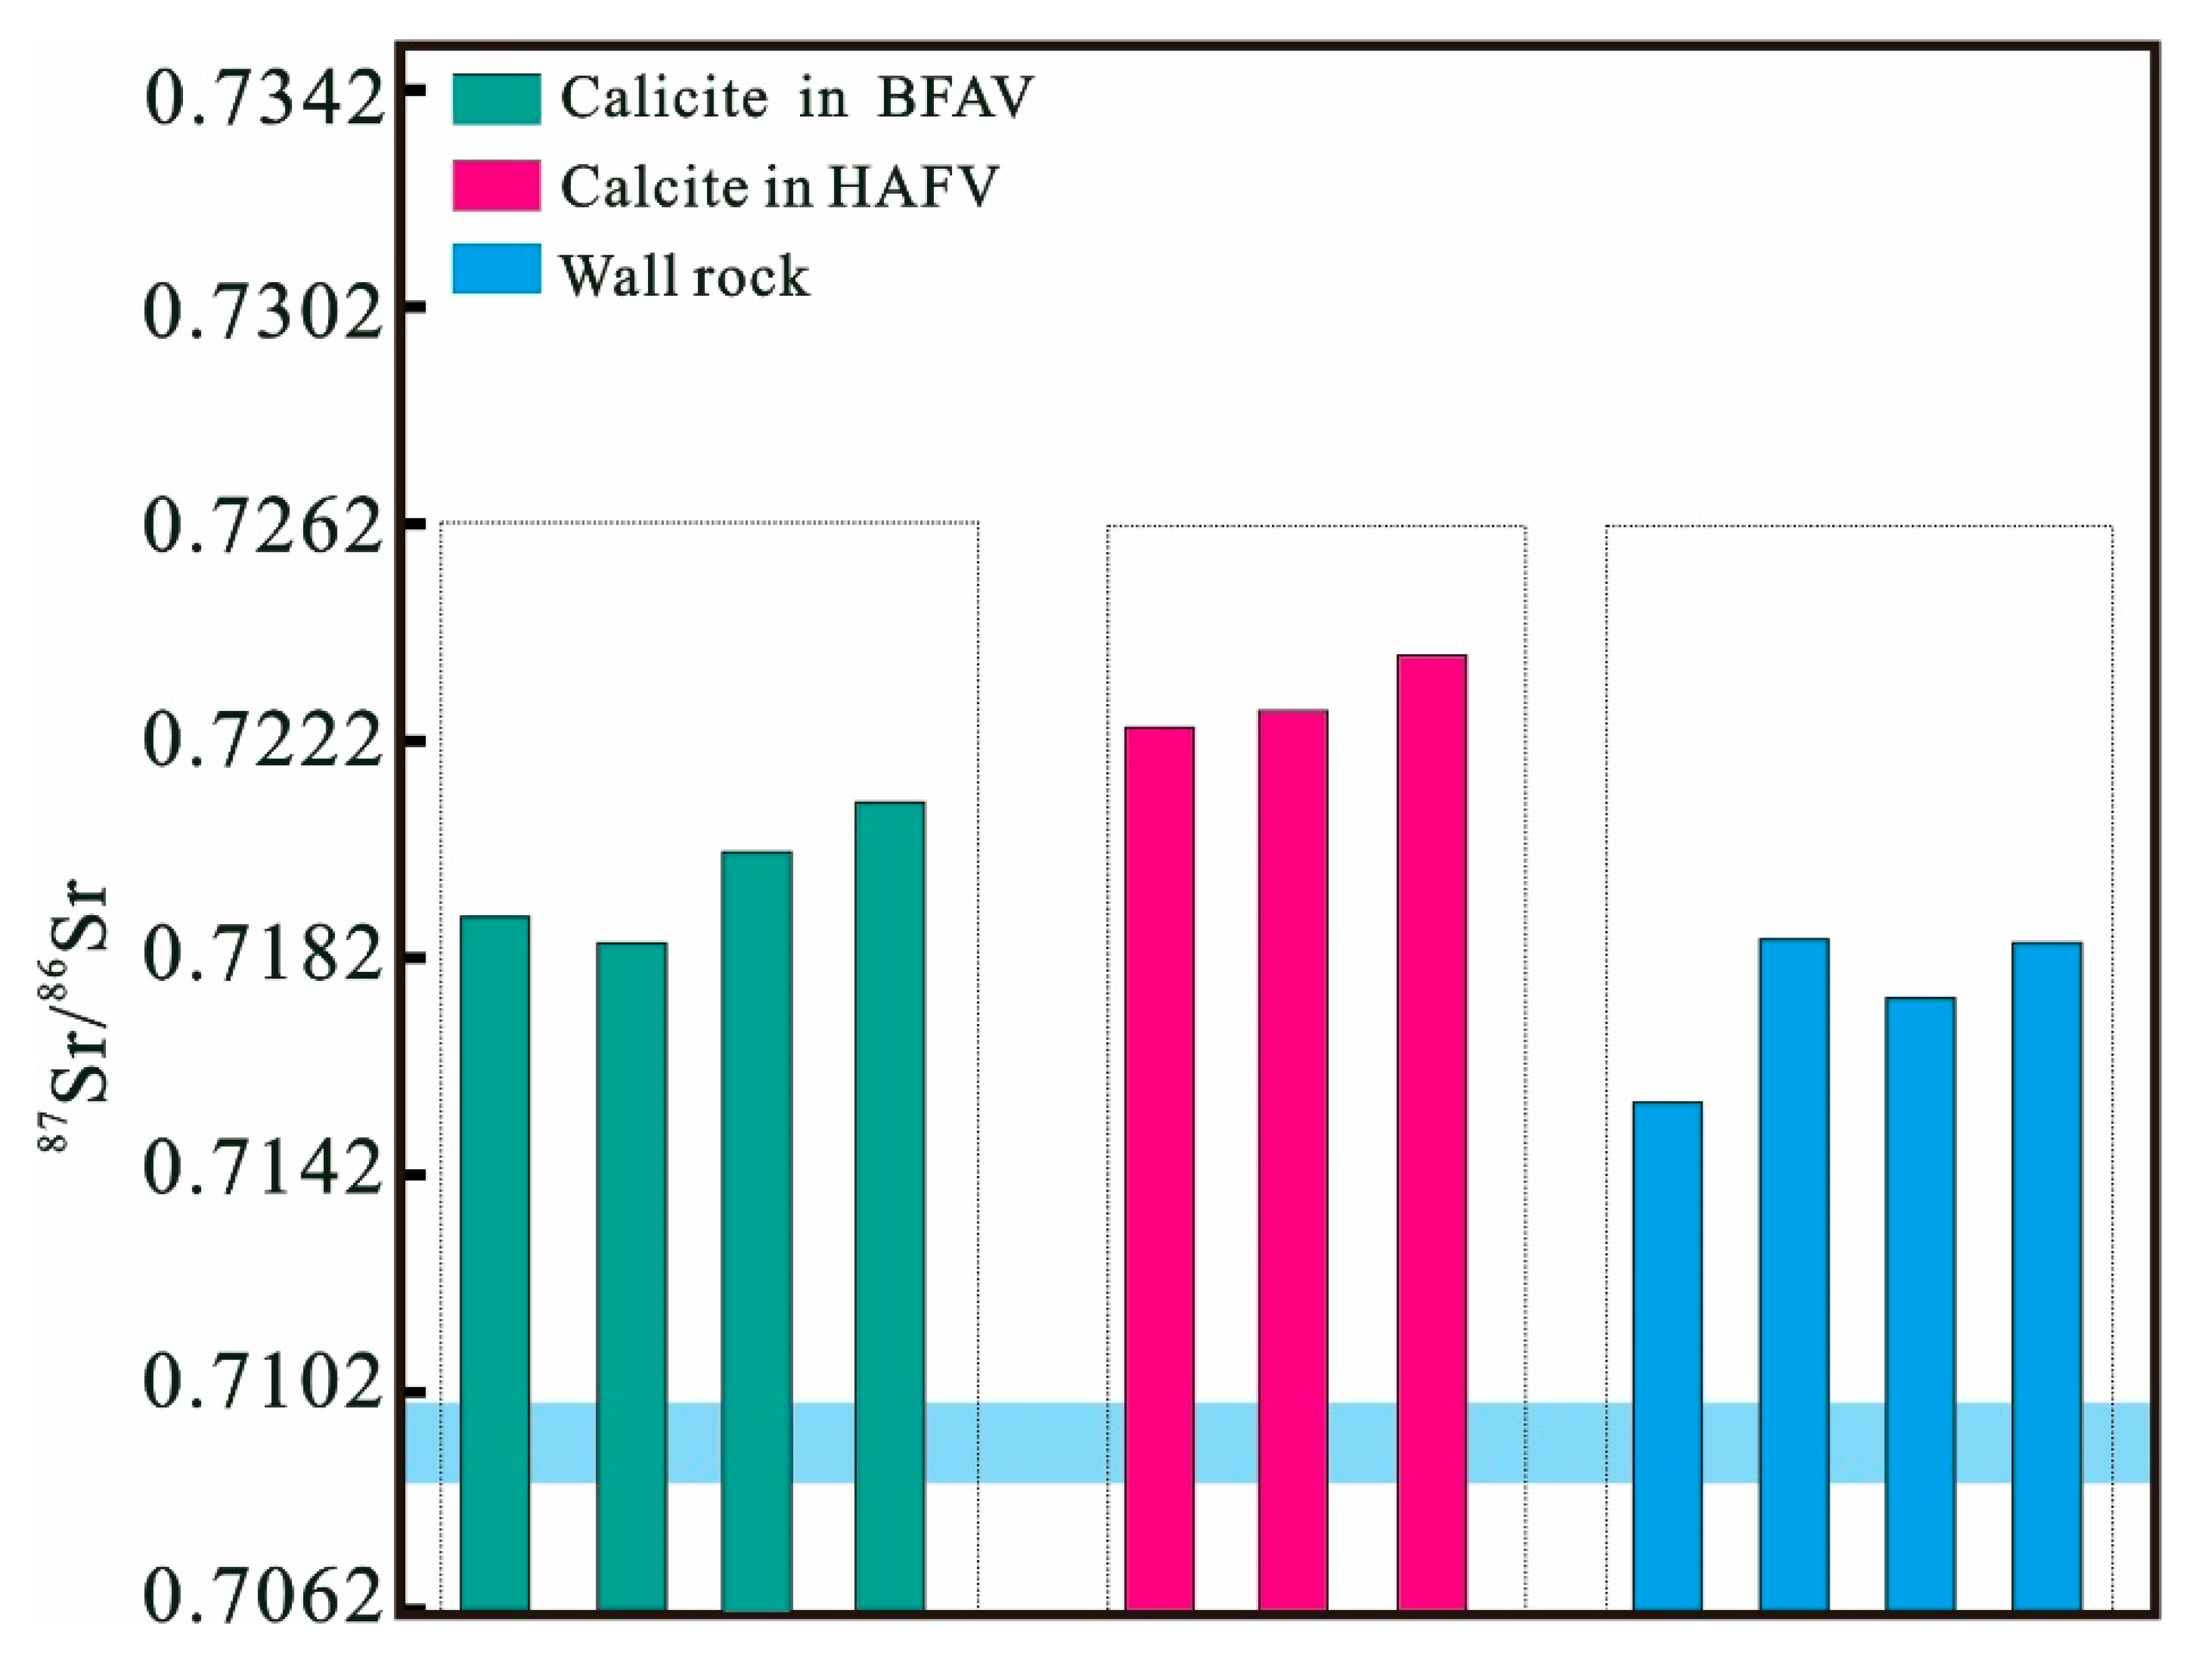
Figure 6). The
87Sr/
86Sr ratios of the calcite in the bedding veins varied from 0.71822 to 0.72119, complying with those of the surrounding rock (0.71562 to 0.71851), and all lower than those of the calcite in the high-angle veins (0.7225 and 0.72433) (
Figure 7;
Table 3). All
87Sr/
86Sr ratios of the calcite veins and the surrounding rock were higher than the values in the Ordovician seawater (0.7078–0.7088) [
46].
4.5. Fluid Inclusion Analysis
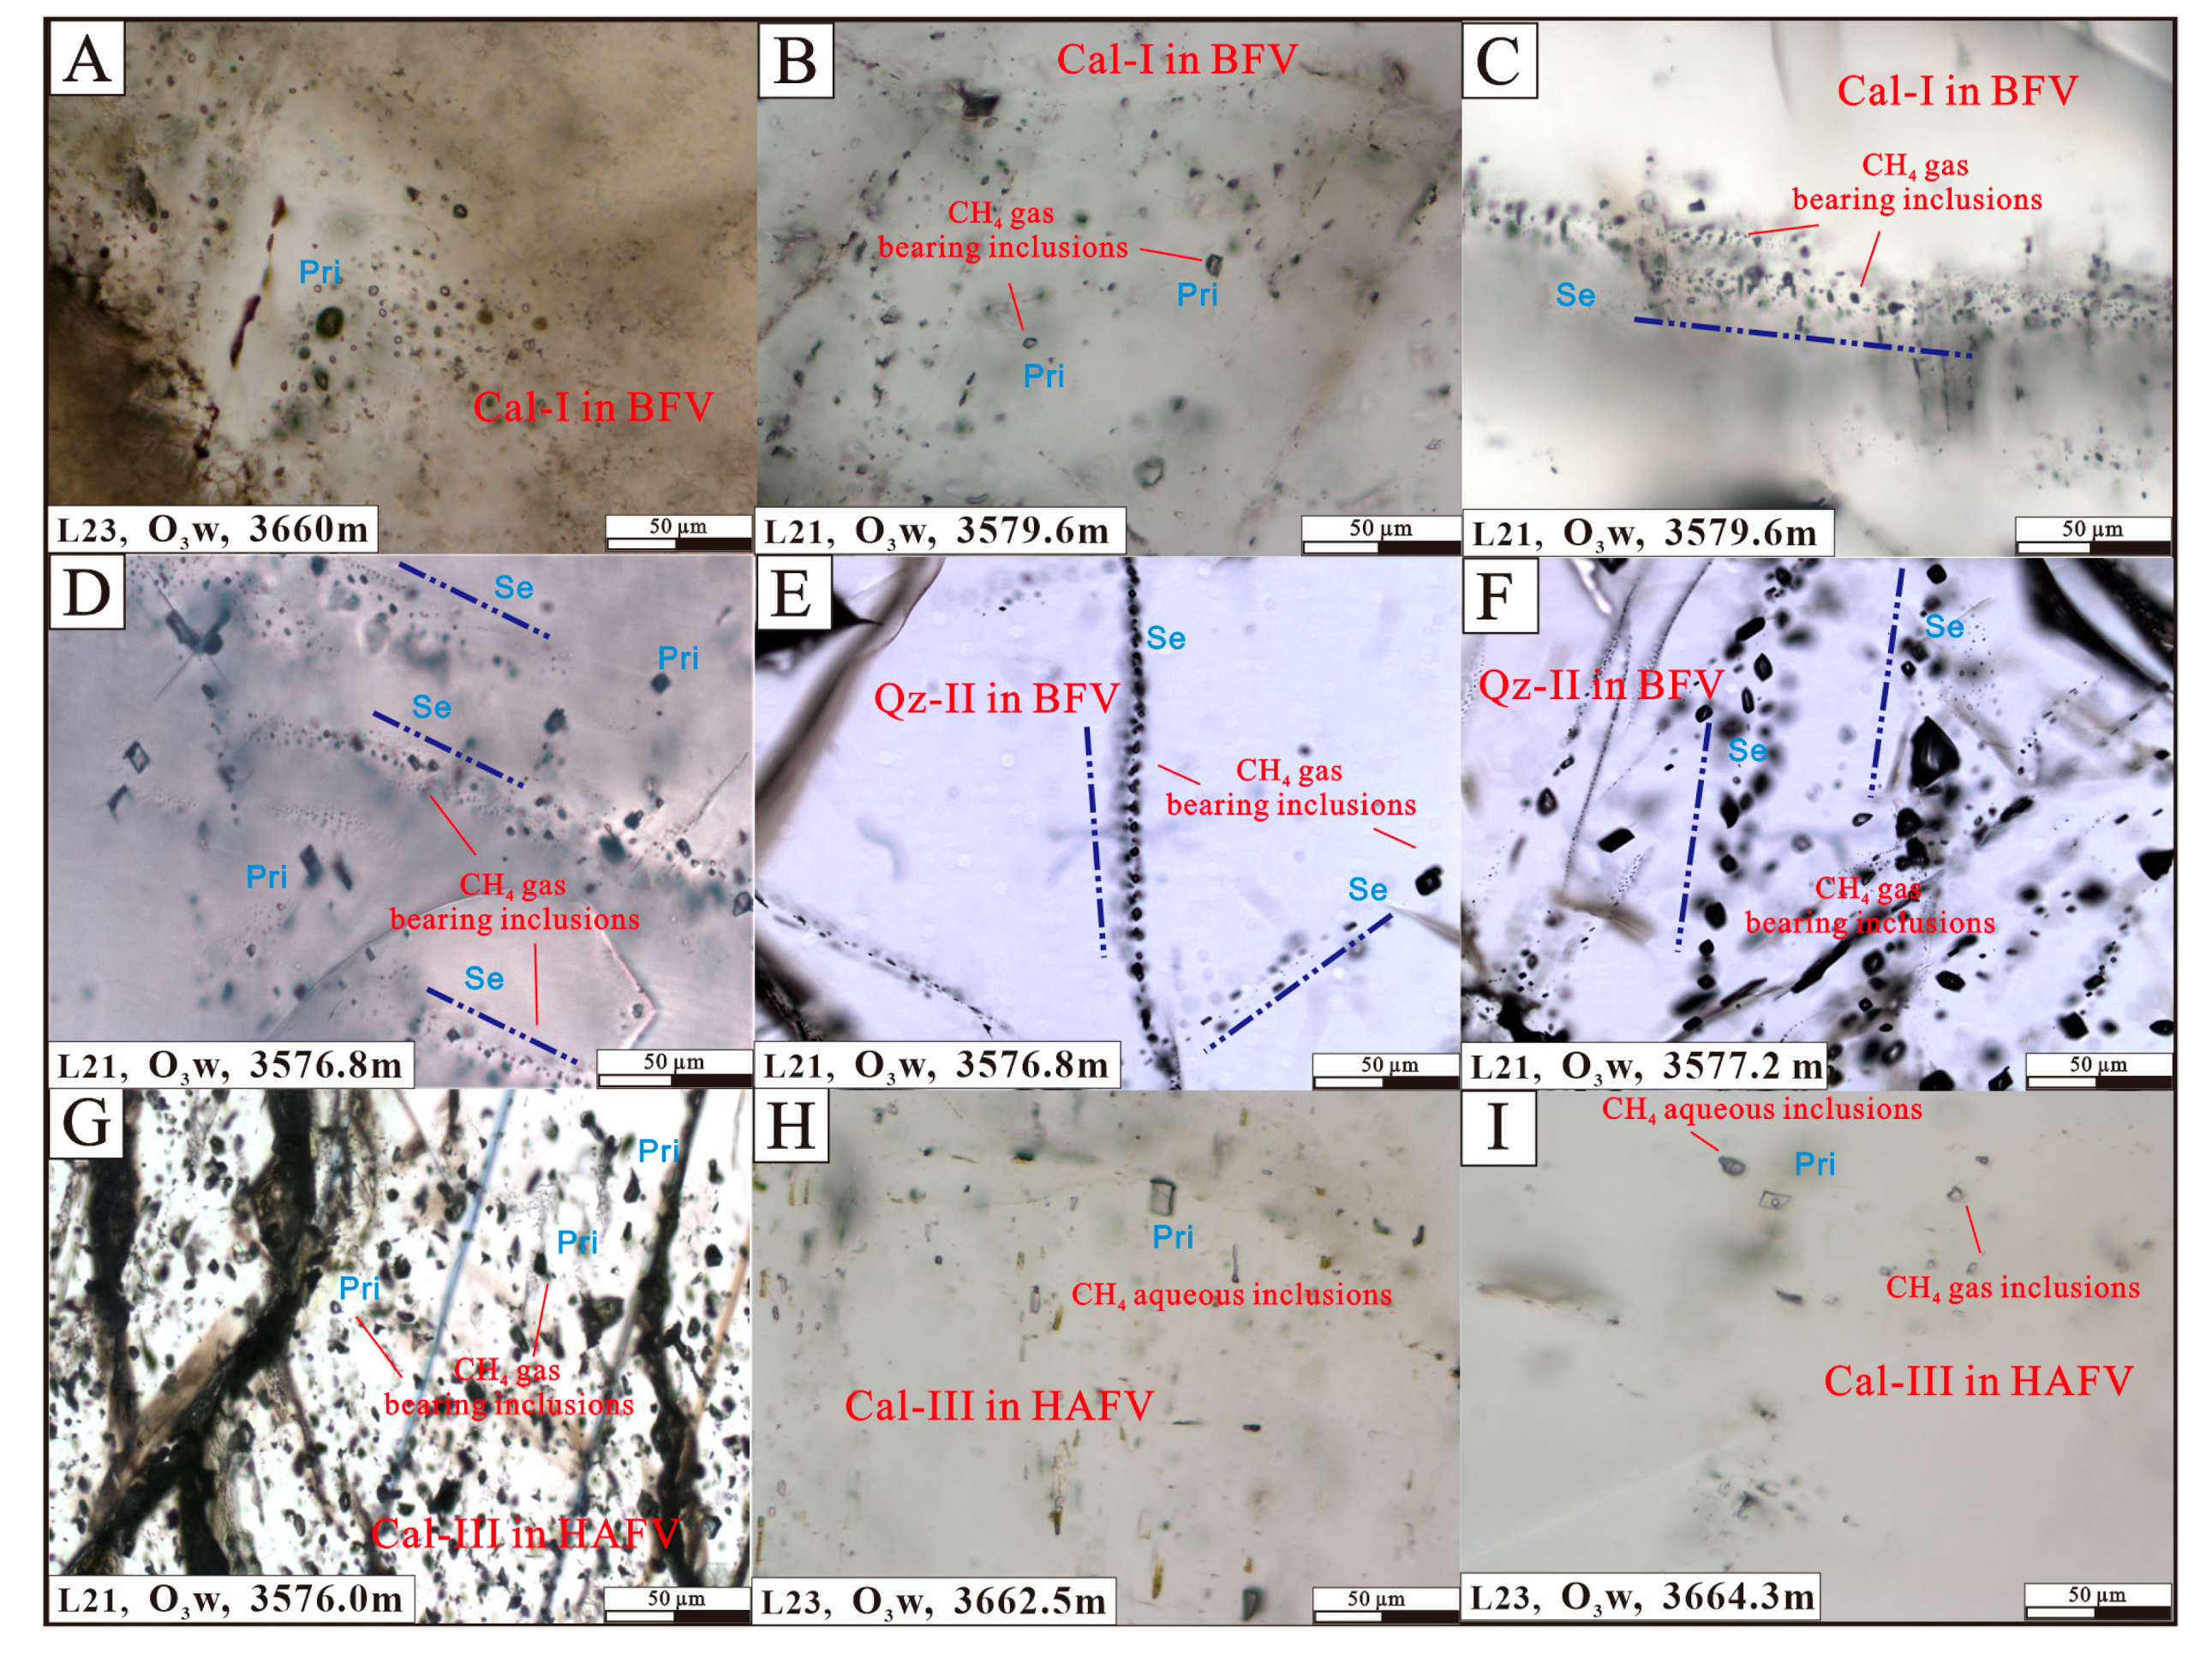
4.5.1. Petrographic Characteristics of Inclusions
The genesis of the inclusions constrained the evolution of the paleo-fluids to different degrees. In the early calcites (Cal-I) of the bedding fracture veins (BFV), the isolated elliptical and rhombic primary CH
4 gas inclusions, and the secondary CH
4 gas inclusions with elliptical or irregular secondary origins, were directionally distributed along the mineral fractures (
Figure 8). In the late quartz cement (Qz-II), the secondary CH
4 gas inclusions were mainly developed as rhombic or elliptical shapes, and the long axis was 12–25 μm. Aqueous salinity inclusions and single-phase methane gaseous inclusions could be observed in the calcite (Cal-III) within the high-angle shear fracture veins (HAFV) (
Figure 8). The inclusions were mostly quadrilateral, irregular polygon, and subcircular-shaped, with diameters of approximately 2–14 μm. The petrographical characteristics imply a primary origin.
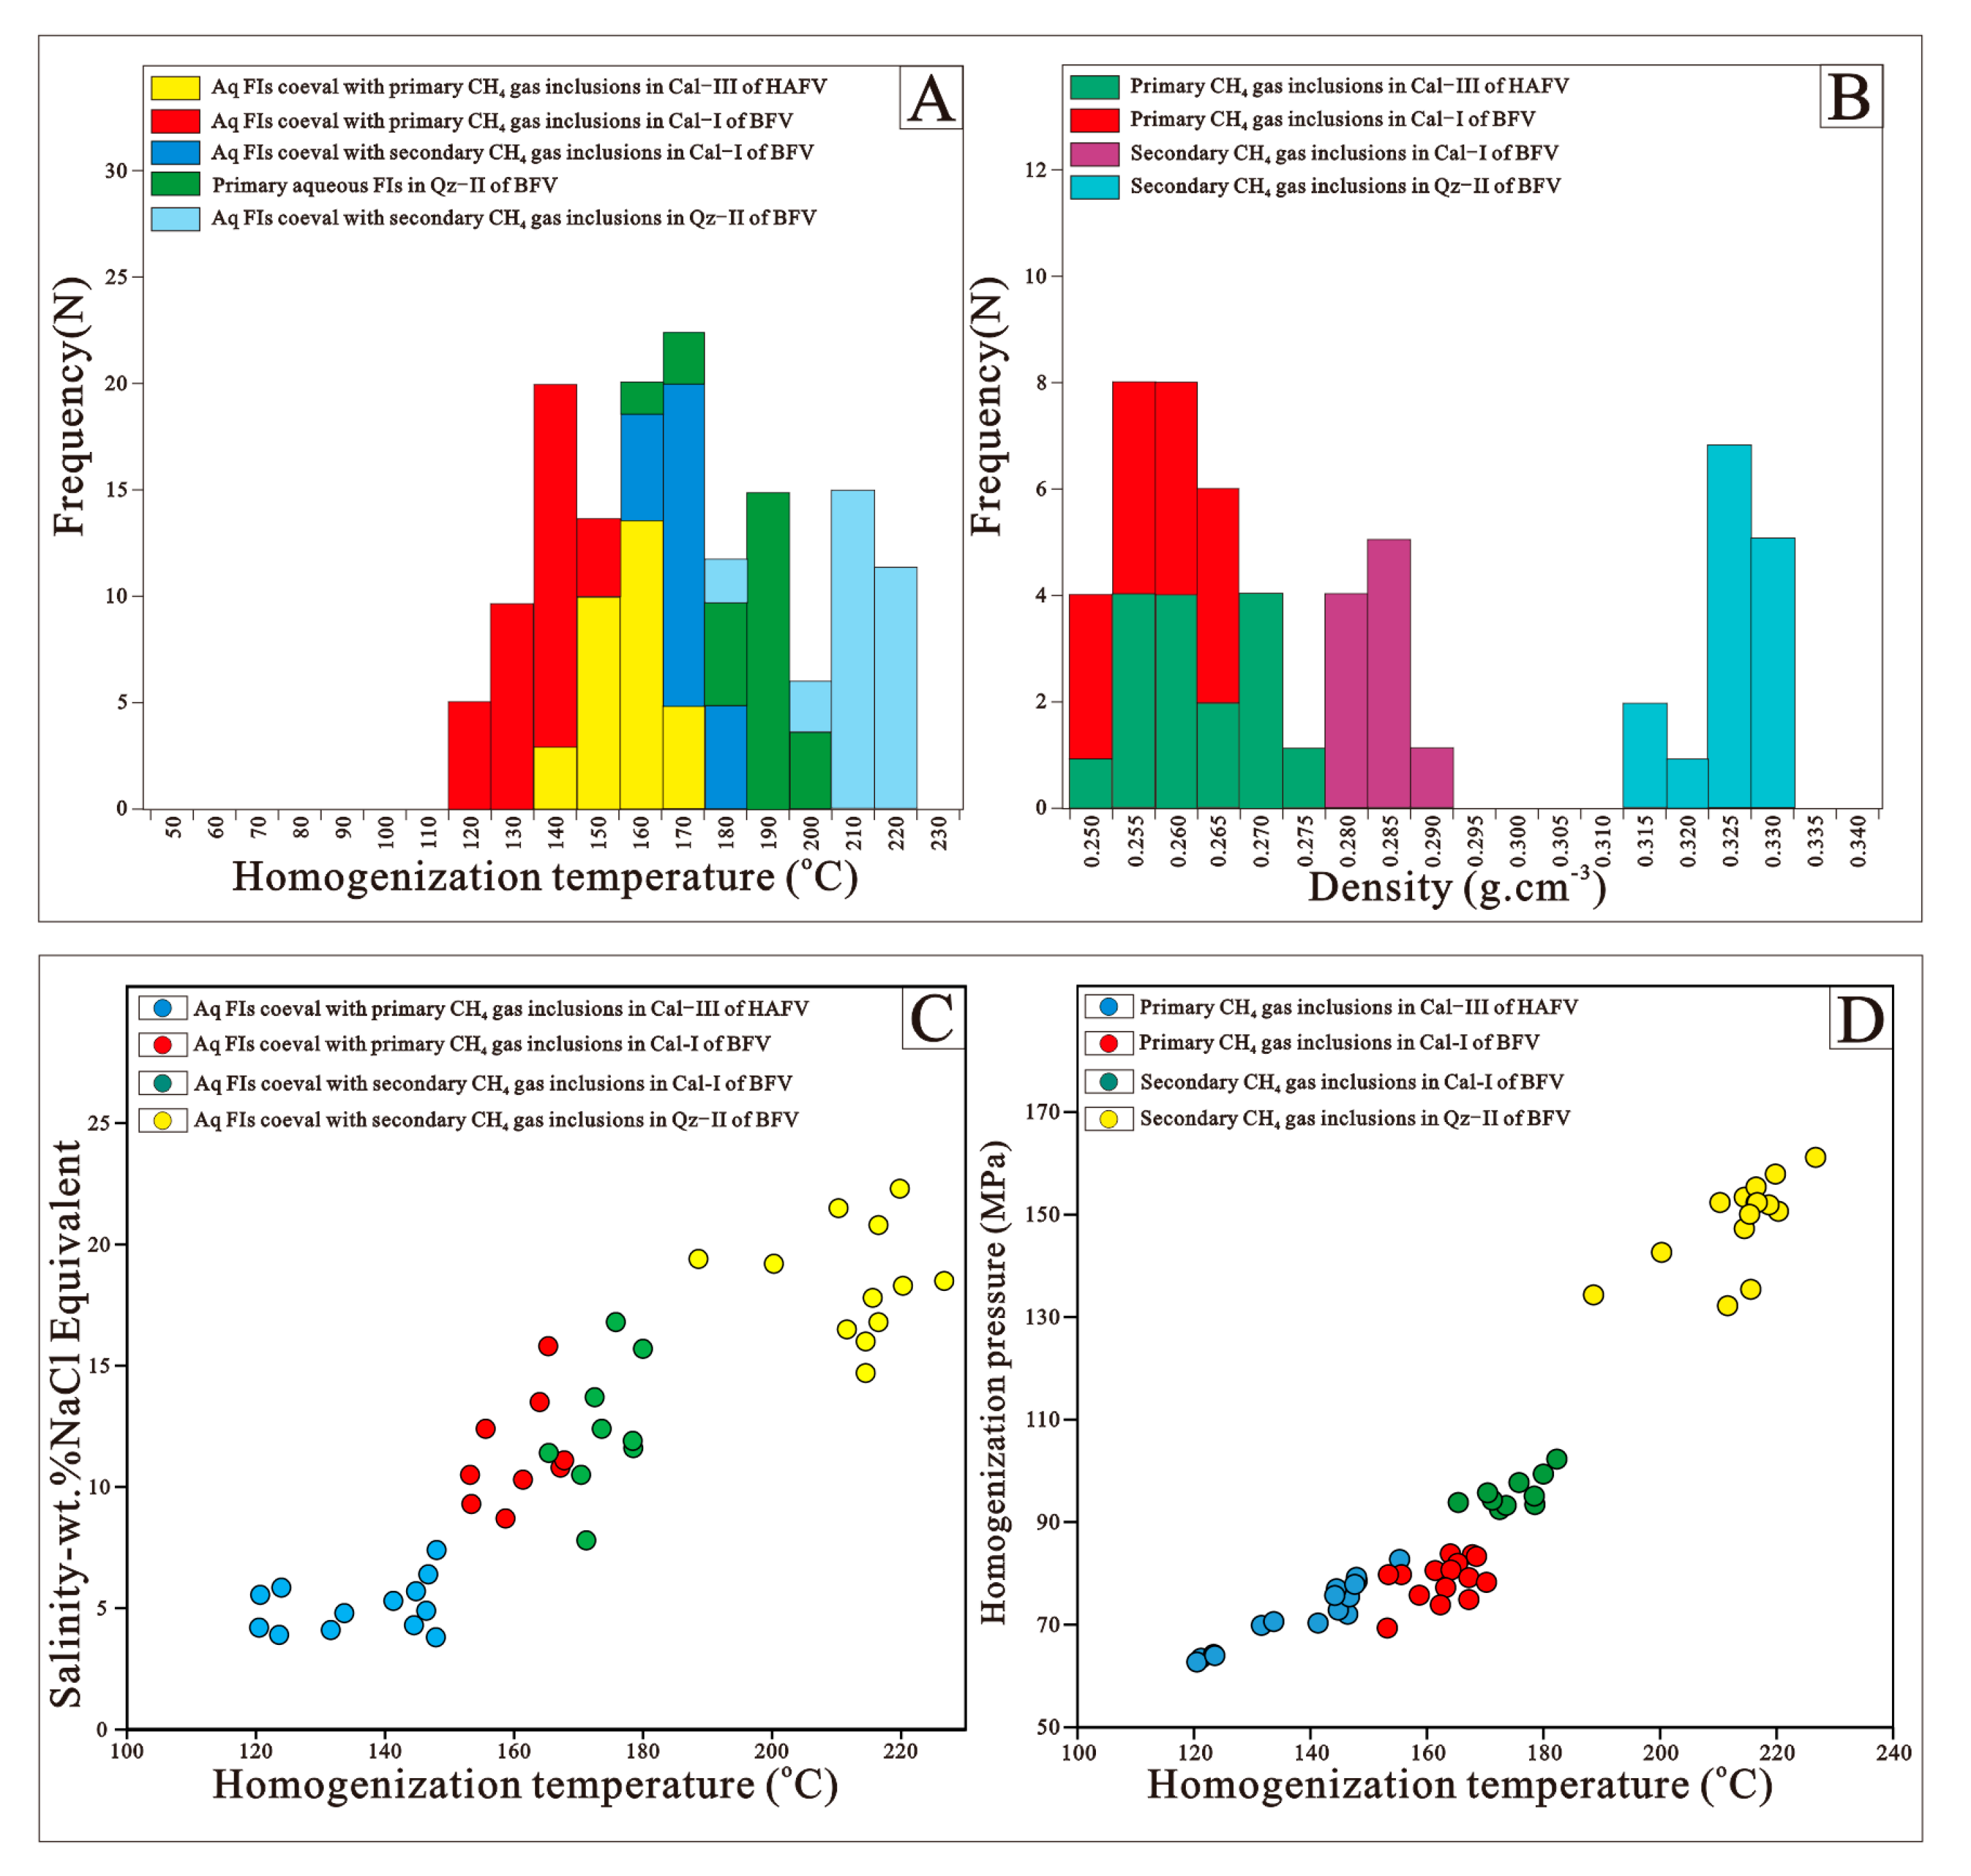
4.5.2. Microthermodynamics
Microthermometric data, including the homogenization temperature (
Th) and the ice–melting temperatures (
Tm) of primary aqueous inclusions or secondary aqueous inclusions coexisting with gaseous inclusions, were both measured in different stage cements. The
Th and
Tm values in the analyzed calcite and quartz crystals were plotted by dividing the unit into 10 °C bins (
Figure 9A,B). The
Th values of the aqueous inclusions cotrapped with the primary CH
4 gas inclusions in the calcite of the HAFV ranged from 140 °C to 170 °C, with unimodal
Th distributed from 155 to 165 °C. The
Th values of the aqueous inclusions cotrapped with the primary CH
4 gas inclusions in the Cal-I of the BFV ranged from 110 °C to 150 °C, with unimodal
Th distributed at 135–145 °C. The
Th values of the aqueous inclusions coeval with the secondary CH
4 gas inclusions in the Cal-I of the BFV ranged from 150 °C to 180 °C, with unimodal
Th distributions in 165–175 °C. The
Th values of the primary aqueous inclusions in the Qz-II of the BFV ranged from 150 °C to 200 °C, with unimodal
Th distributed from 195–200 °C. The
Th values of the aqueous inclusions coeval with the secondary CH
4 gas inclusions in the Qz-II of the BFV ranged from 190 °C to 220 °C, with unimodal
Th distributions in 205–215 °C.
The salinity of aqueous inclusions can be determined by
Tm measurement. The salinity intervals of the aqueous inclusions coeval with the primary CH
4 gas inclusions in the calcite of the HAFV ranged from 3.8 to 7.4 wt.%. The salinity intervals of the aqueous inclusions coeval with the primary CH
4 gas inclusions in the Cal-I of the BFV ranged from 8.7 to 15.8 wt.%. The salinity intervals of the aqueous inclusions coeval with the secondary CH
4 gas inclusions in the Cal-I of the BFV ranged from 7.8 to 16.8 wt.%. The salinity intervals of the aqueous inclusions coeval with the secondary CH
4 gas inclusions in the Qz-II of the BFV ranged from 14.7 to 22.3 wt.% (
Figure 9C).
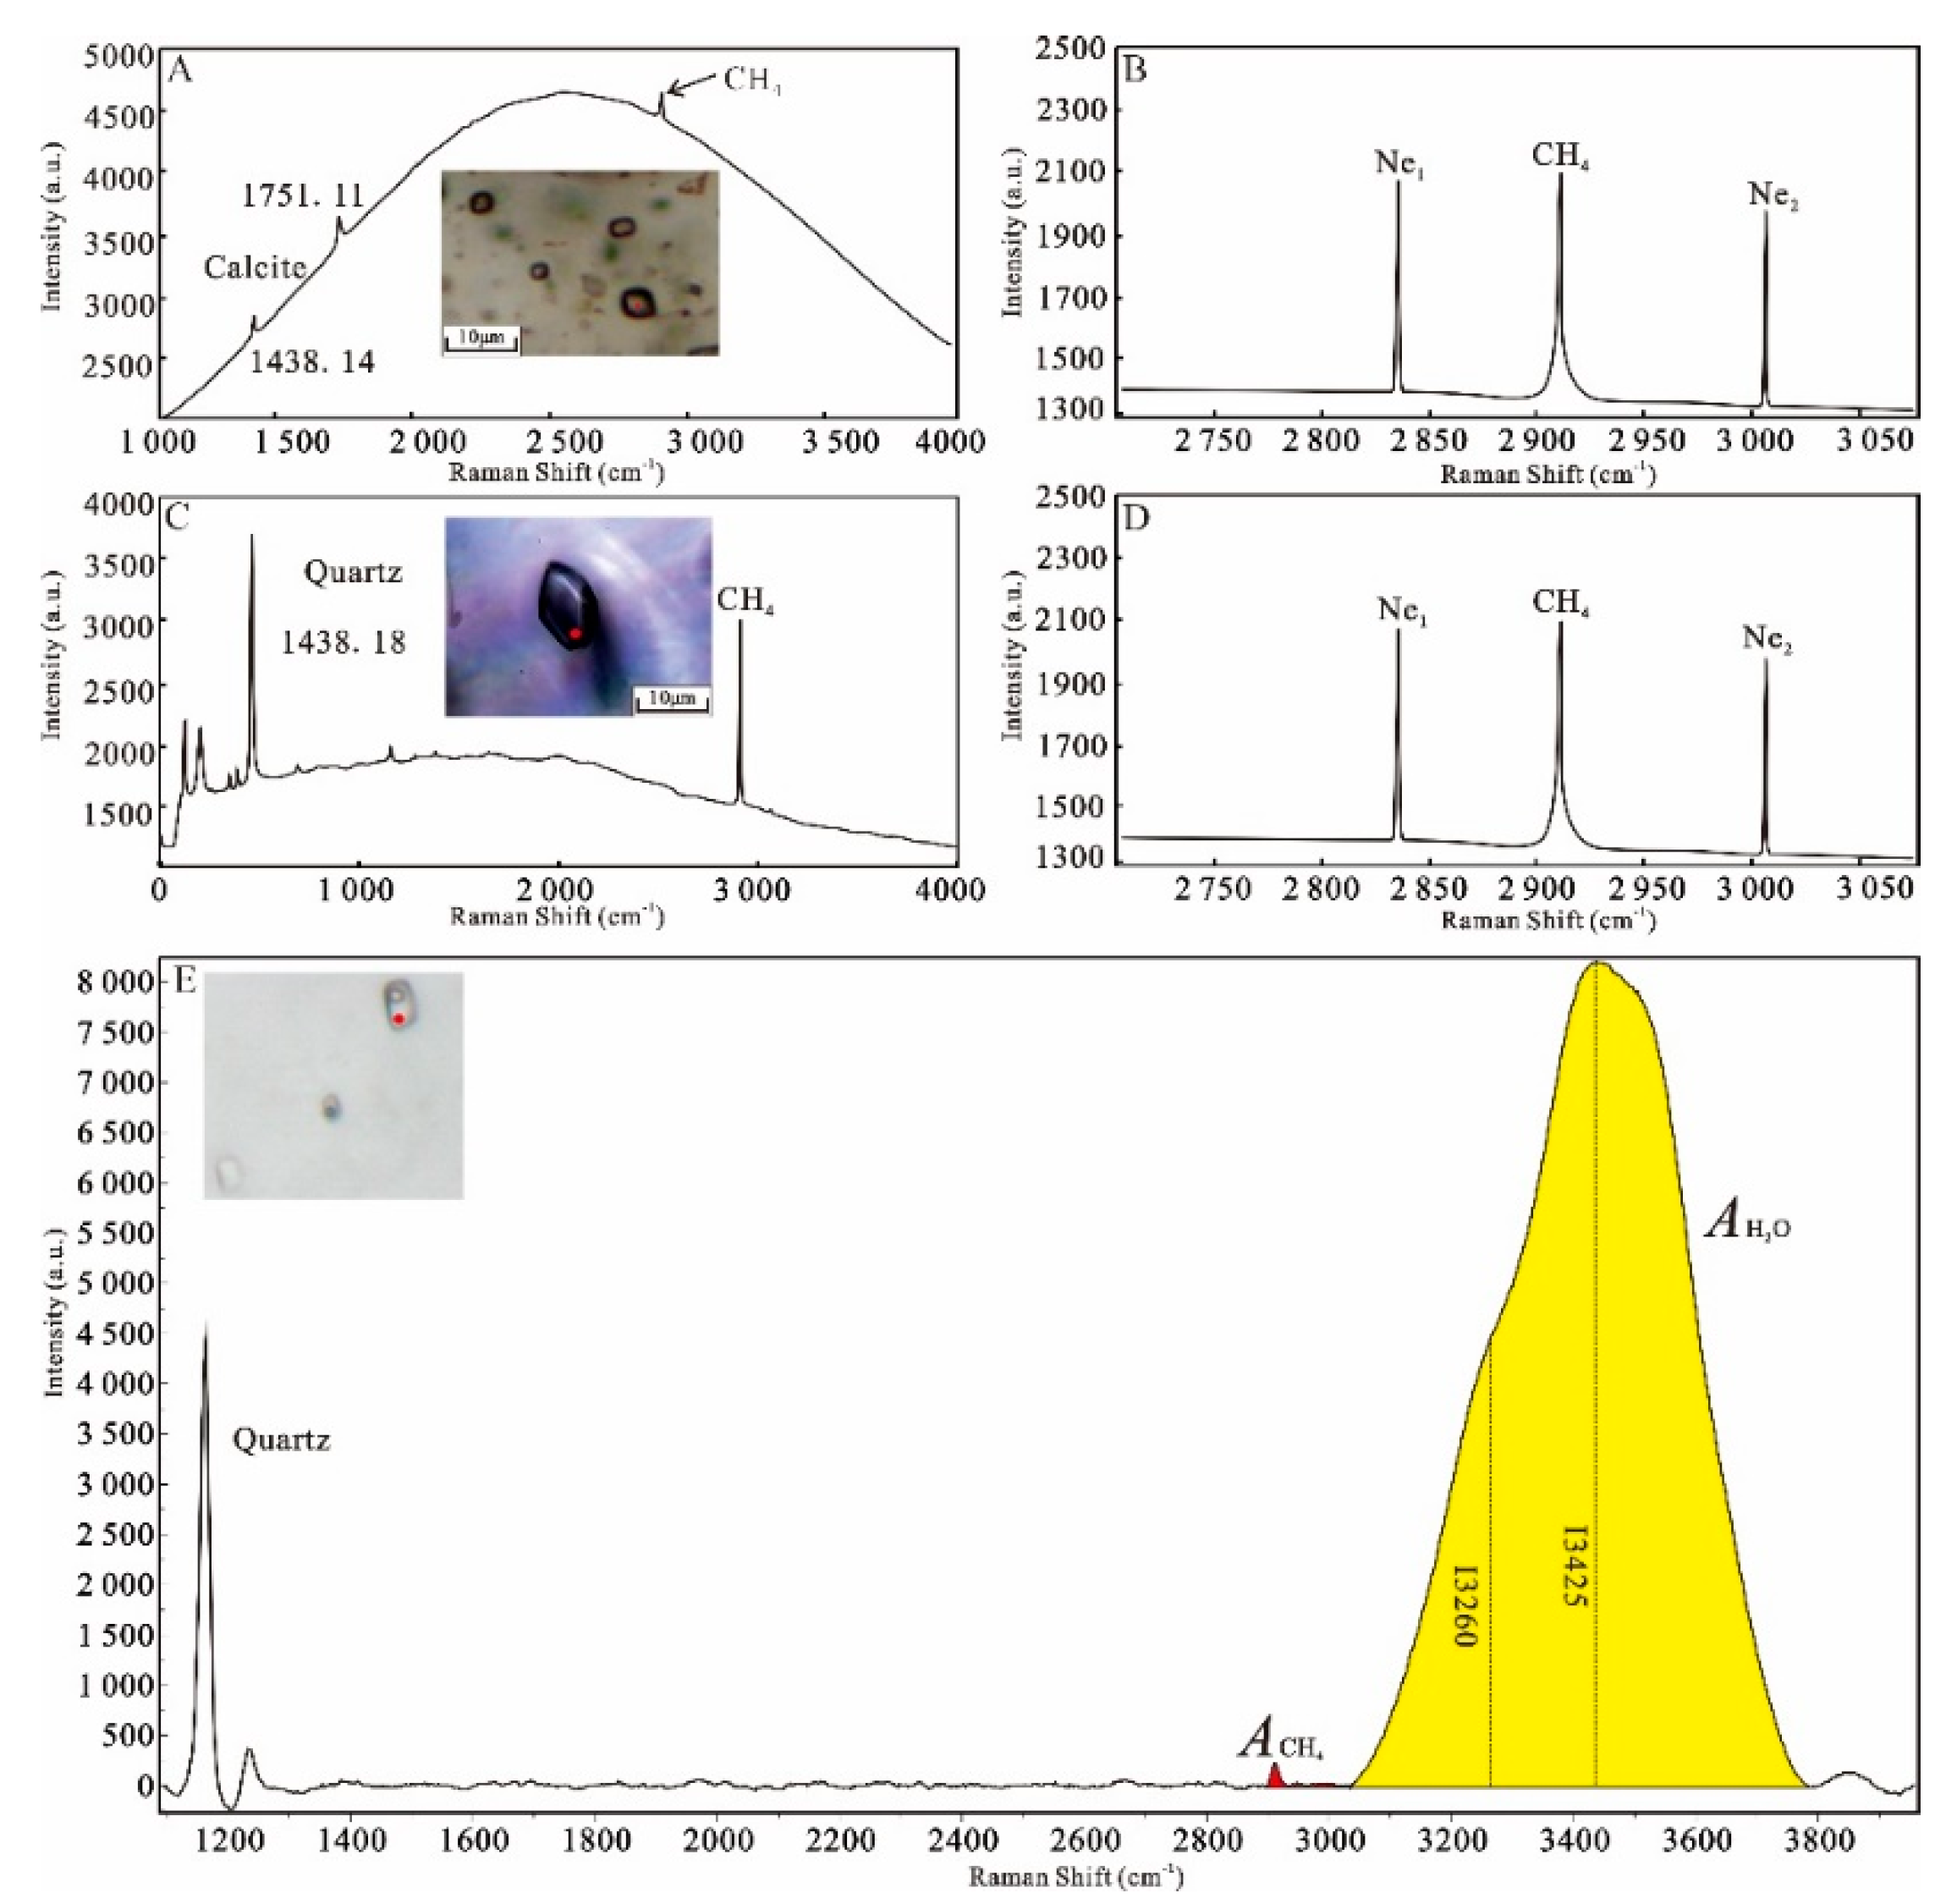
4.5.3. Quantitative Laser-Raman Analysis
Accurate quantification of past temperature and pressure fluctuations is essential for insights into shale gas accumulation patterns. A quantitative Raman spectroscopy of the fluid inclusions was combined with a thermodynamic model of the CH
4 System; the
PVT-x parameters of such natural inclusions were obtained completely (
Table 4).
Figure 10A–D shows examples of Raman spectra of CH
4 gaseous fluid inclusions trapped in calcite and quartz minerals. Variations in the homogenization pressure versus the homogenization temperature indicated that they were positively correlated, and had four stages. The Raman shifts of the primary CH
4 gaseous fluid inclusions in the calcite of the HAFV ranged from 2911.19 to 2911.52 cm
−1, and the densities were calculated to vary from 0.2505 to 0.2708 g/cm
3. The equivalent trapped pressures were calculated to be 62.7–82.8 MPa. The Raman shifts of the primary CH
4 gaseous fluid inclusions in the Cal-I of the BFV ranged from 2911.23 to 2911.59 cm
−1, and the densities were calculated to vary from 0.2463 to 0.2682 g/cm
3g/cm
3. The equivalent trapped pressures were calculated to be 69.3–95.1 MPa. The Raman shifts of the secondary CH
4 gaseous fluid inclusions in the Cal-I of the BFV ranged from 2910.94 to 2911.10 cm
−1, and the densities were calculated to vary from 0.2767 to 0.2880 g/cm
3. The equivalent trapped pressures were calculated to be 92.5–102.3 MPa. The densities of the secondary CH
4 gaseous fluid inclusions in the Qz-II of the BFV ranged from 0.3119 to 0.3338 g/cm
3, as calculated from the highest-resolution peak shift data of the Raman analyses (Raman shifts of 2910.51–2910.67 cm
−1). The equivalent trapped pressures were calculated to be 132.3–161.2 MPa.
The concentration of dissolved CH
4 in aqueous inclusions can be obtained by calculating the peak area ratio of Raman spectra in a homogeneous state of fluid inclusion. The
mCH
4 values in the primary aqueous inclusions of calcite in the HAFV ranged from 0.08 to 0.13 mol/kg.
mCH
4 in the primary aqueous inclusions of the Cal-I in the BFV was 0.21 mol/kg. The
mCH
4 values in the secondary aqueous inclusions of the Cal-I in the BFV ranged from 0.18 to 0.22 mol/kg. The
mCH
4 values in the secondary aqueous inclusions of the Qz-II in the BFV ranged from 0.34 to 0.39 mol/kg (
Table 5).
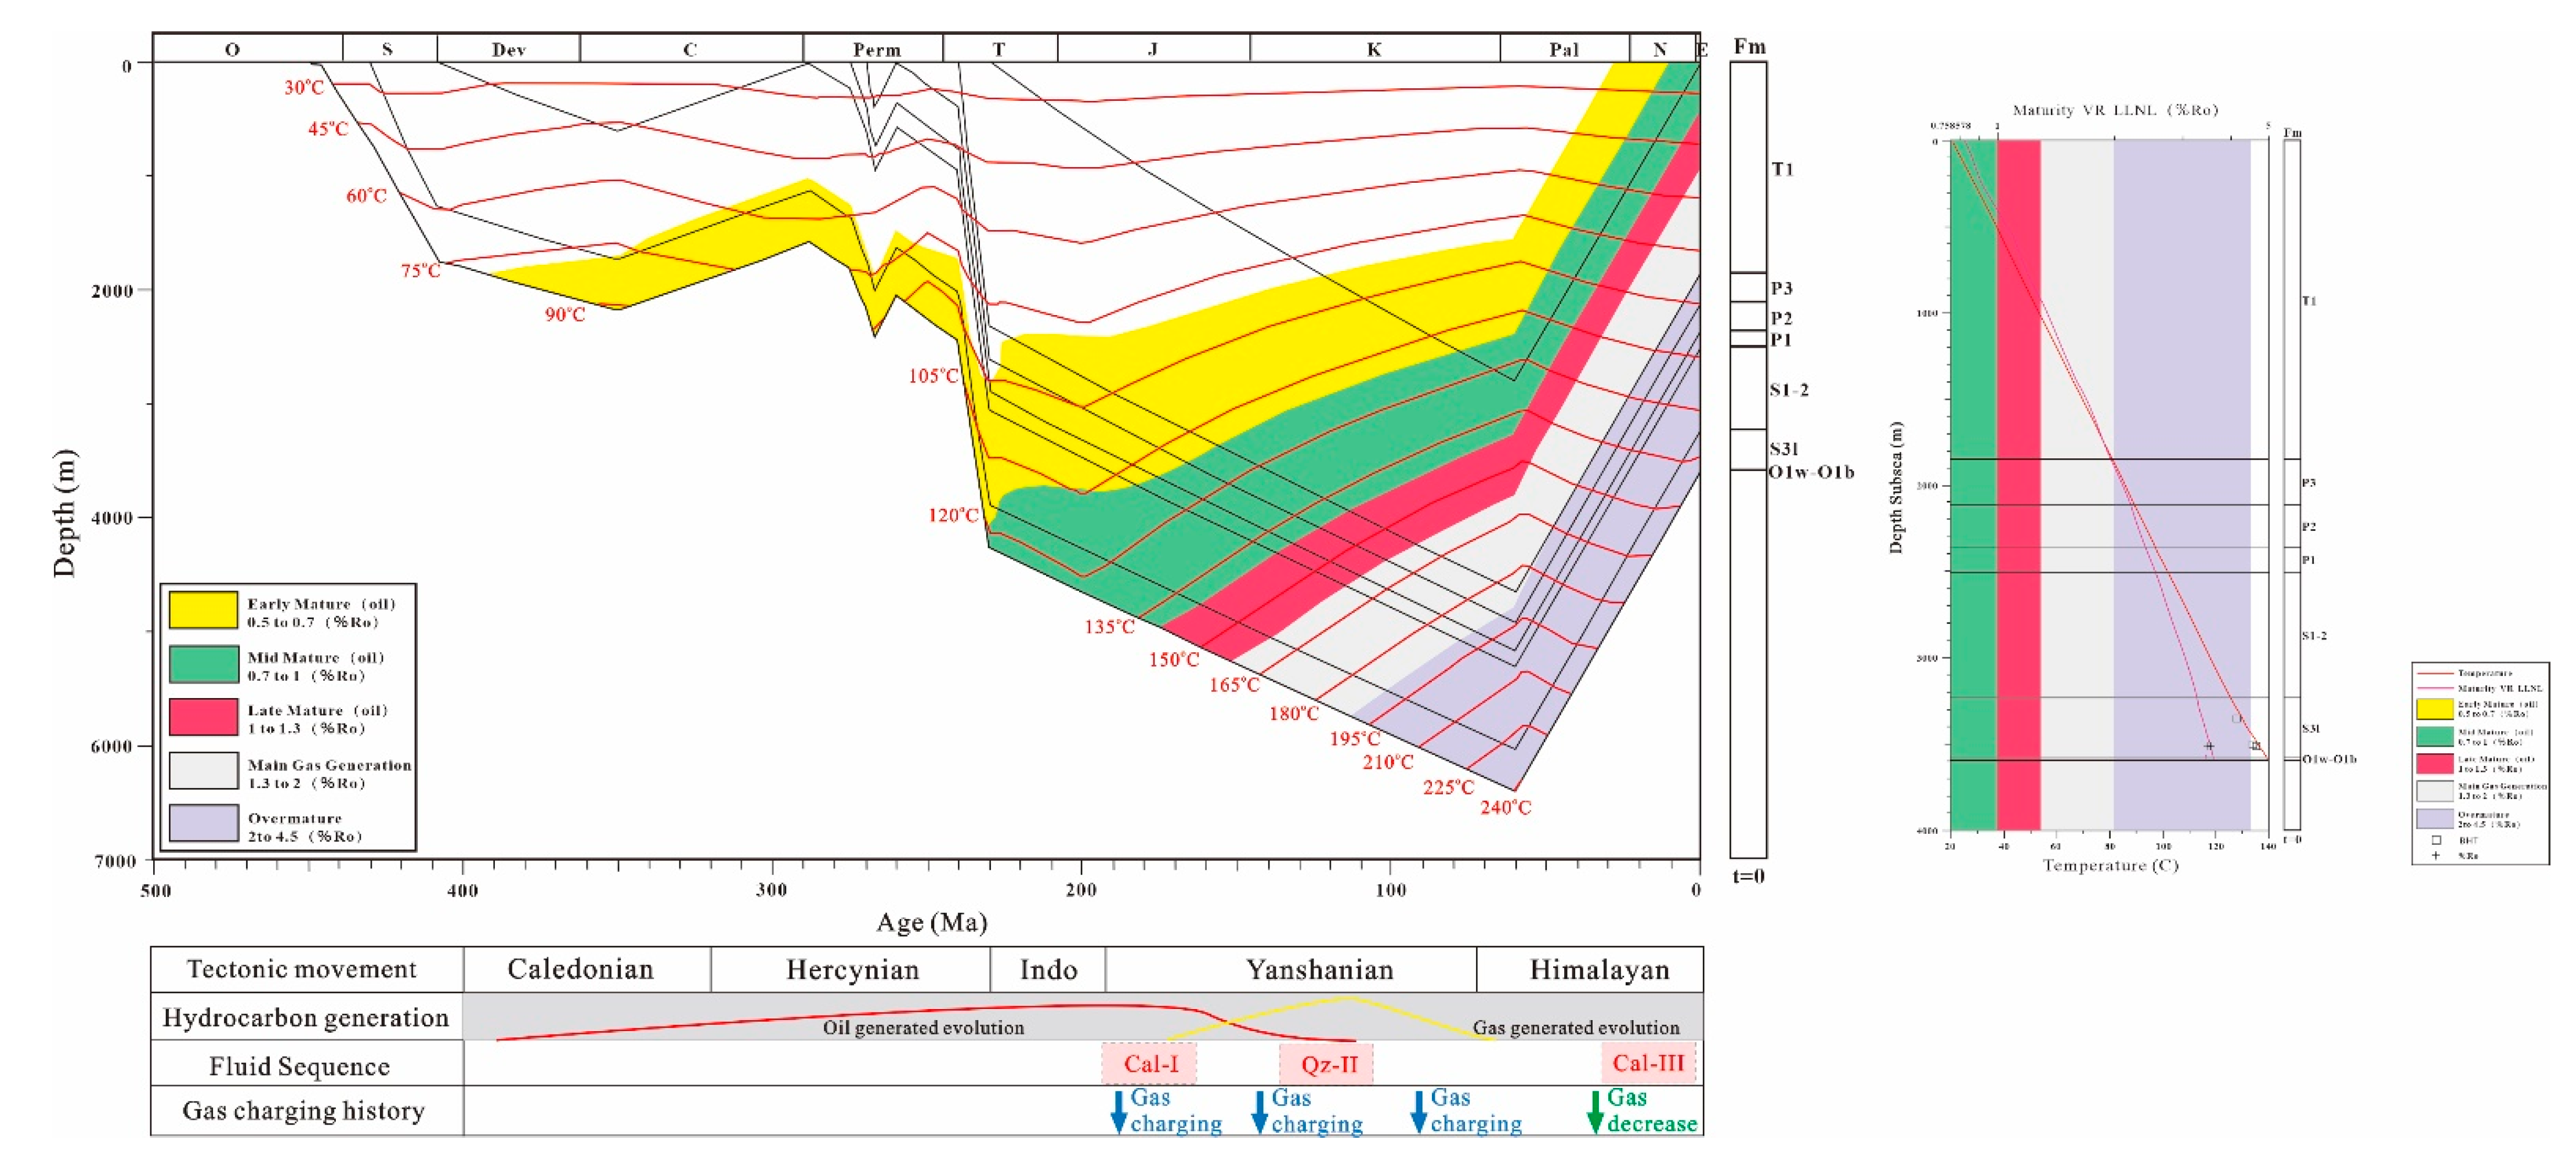
4.6. Hydrocarbon-Generated Evolution
The simulation results of the thermal maturity history in the Changning–Luzhou area show that the shale of the Silurian–Ordovician Wufeng–Longmaxi Formations started hydrocarbon generation at 390 Ma (Ro = 0.5%–0.7%), and the threshold temperature of the hydrocarbon generation was approximately 78 °C. Affected by Caledonian tectonic movement, the thermal evolution rate of the source rock was slow. At approximately 230 Ma, the maturity of shale in the Wufeng–Longmaxi Formations reached 0.7% Ro, entering the middle maturity stage, and the formation temperature was 120 °C. Due to the joint influence of the Emeishan igneous province in the early Late Permian and the rapid subsidence of the early Late Permian–Middle Triassic strata, shale rapidly entered the late mature stage from the middle mature stage in the early Early Triassic. At approximately 170 Ma, the maturity of the Wufeng–Longmaxi shale reached 1.0% Ro, entering the peak period of oil generation; the shale maturity of the Wufeng Formation–Longmaxi Formation reached 1.3% Ro at 150 Ma (Early Jurassic); by the middle Middle Cretaceous (120 Ma), the Ro value reached 2.0% and entered the main gas generation stage; the Wufeng–Longmaxi shale reached the maximum burial depth of approximately 6250 m in the Late Cretaceous (60 Ma), and the Ro evolved to a maximum of 2.9%. Since 60 Ma, Yanshan and Himalayan tectonic movements have caused strata uplift and erosion, and the thermal evolution process of shale in the Wufeng Formation–Longmaxi Formation in the study area tends to stop (
Figure 11).
5. Discussion
5.1. Multistage Fracture Veins
Fracture veins are important products in basin tectonism and diagenesis record information on paleo-fluid activity. Cement sequences of fracture-filling minerals in the O3w shales in wells L21, L22, and L23 were determined by detailed macrocore, microscopic petrographic, and cathodoluminescence observation. The formation stages of the veins can also be affected by the formation age and formation environment.
The diagenetic sequences in fracture veins can be summarized as follows: Cal-I in BFV (coarse-crystalline calcite)→Qz-II in BFV (dark cathodoluminescence)→Cal-III in HAFV (fine-grained, bright red cathodoluminescence). Mineral formation is accompanied by the entrapment of primary inclusions, which can be obtained by the burial history of the drawing point [
21]. The contact relationship indicated that the Cal-I in the BFV was close to the surrounding rock (
Figure 4A,B), and precipitated earlier than the Qz-II in the BFV. The
Th results show that the Cal-I in the BFV crystallized in the Late Jurassic (~180 Ma). The REE distribution pattern of the Cal-I in the BFV had obvious positive Eu anomalies and enrichment characteristics of light REE, revealing that the veins were hydrothermal in origin, and formed under partial reduction conditions. Y had different complexation with rare earth elements. With fluid-rock interactions, Y-Ho fractionation and abnormal Y concentrations increased the Y/Ho ratio [
49]. The Y/Ho value of the Cal-I in the BFV was concentrated between 31.344 and 35.832, which was close to the chondrites (Y/Ho = 28). The fluid-rock interaction was weak, and the formation time of the veins was early. Due to the influence of high-temperature fluid and increased organic matter content, the C and O of the first calcite vein were slightly depleted. The strontium isotope of the Cal-I in the BFV was mainly derived from diagenetic fluid [
50]. The dehydration of clay minerals and the later water-rock interaction led to the exchange of strontium isotopes, which resulted in calcite formed by diagenetic fluid with significant surrounding rock strontium isotope characteristics [
46].
The results of the Th throw method indicated that the Qz-II crystallized in the Middle Jurassic (~190 Ma). The quartz veins in the shale fractures failed to successfully analyze trace elements by LA-ICP–MS, but cathodoluminescence color can effectively distinguish terrestrial quartz from authigenic quartz. Terrestrial quartz shows strong luminescence under cathode light, and authigenic quartz does not emit light under cathode light. With increasing burial depth, the silicon content in the shale gradually increased in the Wufeng–Longmaxi Formations in the Luzhou–Changning study area. Diagenesis in the burial process makes clay minerals and biotransformation form a large number of silicon-containing fluids, which become the main source of authigenic quartz in shale. The fracture-filling quartz in the study area may have originated from the silicon-containing fluid in the surrounding rock. When the fracture was opened, the silicon-containing fluid filled the fracture, to form a quartz vein, and captured a large number of methane-rich fluids. The primary aqueous inclusion of quartz had the characteristics of high salinity. Quartz may have been generated from a relatively closed environment, and was not affected by exogenous fluids.
The
Th of the primary aqueous inclusions trapped in the Cal-III veins of the HAFV ranged from 155 to 160 °C, proving their precipitation during the early Eocene (~12 Ma). The Cal-III in the HAFV had an obvious negative Ce anomaly, and the total REE content was slightly lower than that of the surrounding rock. Ce element anomalies are highly sensitive to the oxidation–reduction environment [
51]. Ce deficiency demonstrates a gradually weakened water-rock interaction, and the mixing of atmospheric freshwater. This process leads to a change in fluid chemical components, a decrease in temperature, and an increase in oxygen fugacity. The Y/Ho value of the Cal-III in the HAFV was concentrated between 37.691 and 40.930, and the Y/Ho values of the Cal-I and the Cal-III were constant, while the La/Ho ratios varied greatly, indicating that the two fluids originated from different sources. The cross-layer of strontium-rich fluid in the Cal-III in the HAFV suggests that fractures destroyed the closed reservoir (
Figure 7).
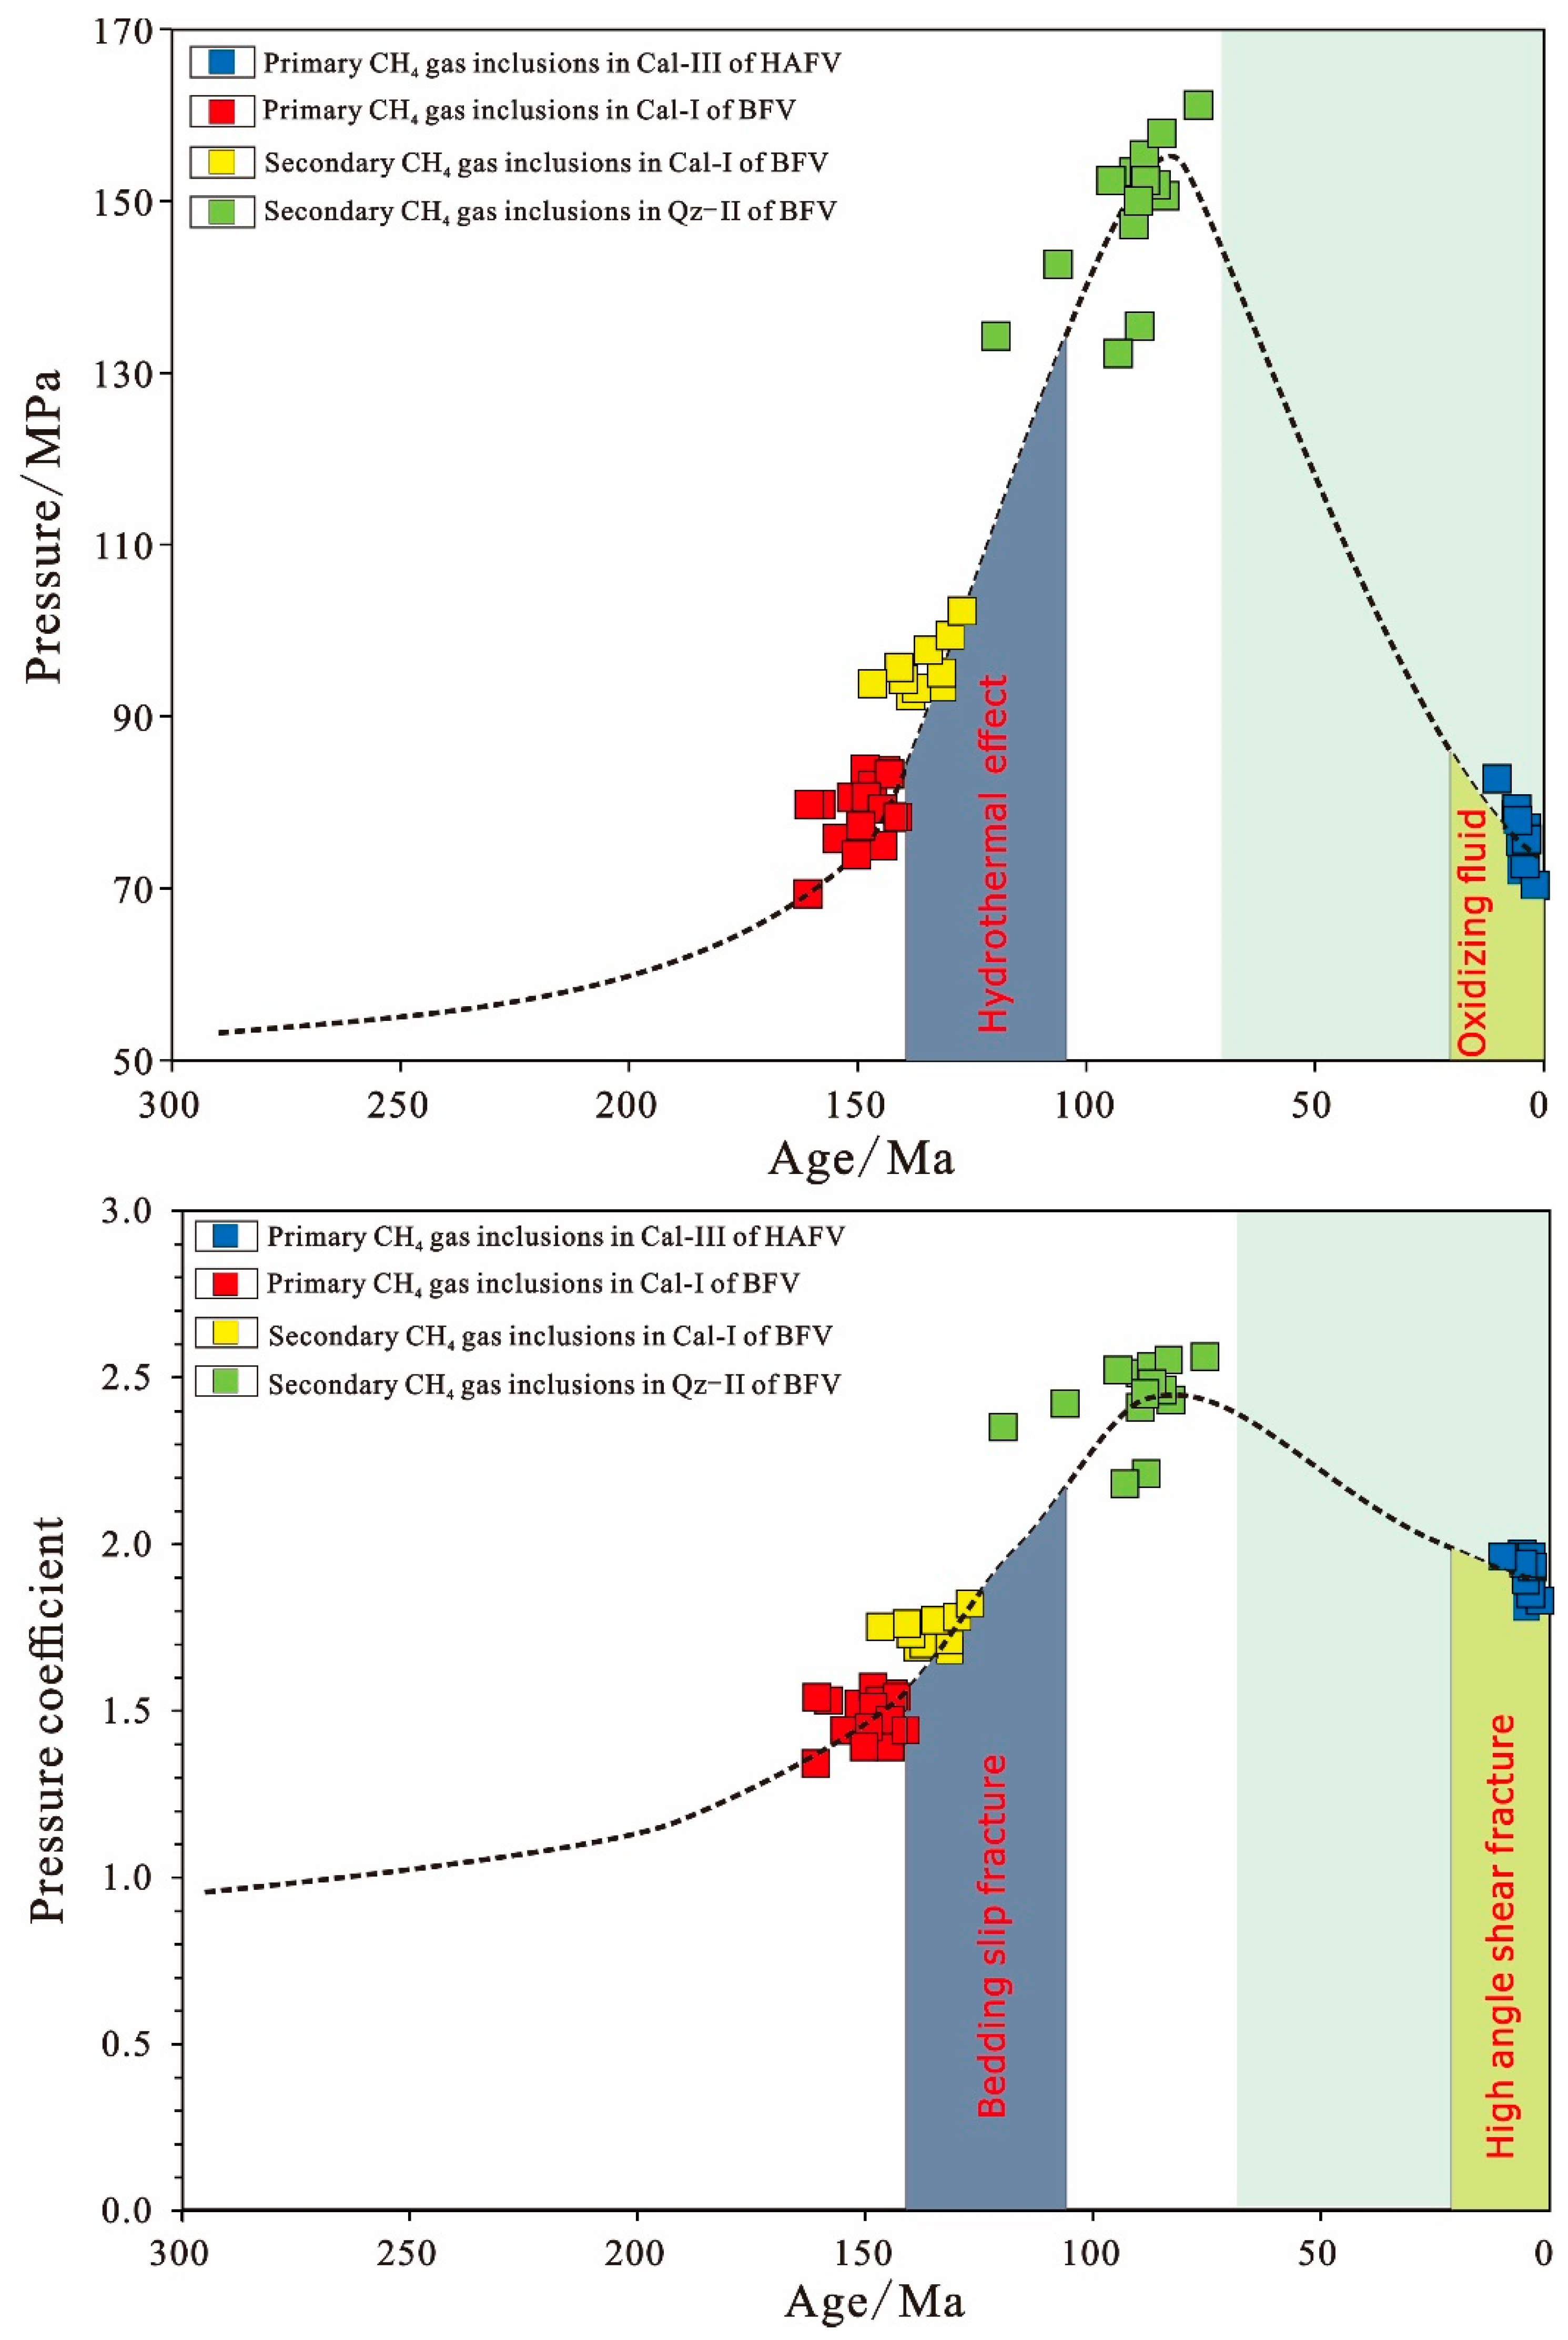
5.2. Fluid Pressure Evolution
The Lower Paleozoic shale in the southern Sichuan Basin has experienced multistage tectonic movement and uplift-erosion, changing the temperature field, pressure field, and in situ stress field in the shale, and affecting the evolution of pore pressure in the shale reservoirs. Previous studies have shown that the gas content of shale gas reservoirs is significantly different under different depths and pressures, due to the influence of later reconstruction. Currently, the pressure coefficient of shale gas reservoirs is one of the comprehensive indices of shale gas preservation conditions. The enrichment degree and production of shale gas have an obvious correlation with the pressure coefficient.
In this study, the pore pressure evolution process of the shale reservoirs was recovered by restoring the trapped pressure of CH4 inclusions in different stages of fracture veins. The entrapment depth and time of inclusions were obtained by combining the trapped temperature of the inclusions in the fracture veins with burial and thermal history.
The pore fluid pressure and the pressure coefficient evolution of the Wufeng–Longmaxi Formations shale in the Changning–Luzhou area of the southern Sichuan Basin is shown in
Figure 12. The evolution of the pore fluid pressure and the pressure coefficient of well shale in the area has gone through two stages. The first stage was between 160 Ma and 86 Ma, when the pressure and pressure coefficient gradually increased. The pressure of the shale gas reservoir gradually increased from weak overpressure to strong overpressure, and the overpressure state continued to maintain with increasing burial depth. All overpressures of shale gas reservoirs in the Wufeng–Longmaxi Formations can be provided by shale hydrocarbon generation [
52]. The second stage was from 75 Ma to the present, and was affected by tectonic activities and strata uplift-erosion, when the pore fluid pressure and pressure coefficient in the shale reservoirs were significantly reduced. In the uplift stage of the shale gas reservoirs, the pore fluid pressure decreased with decreasing temperature, and the formation depth decreased again, so the hydrostatic pressure in the shale formations decreased. However, the existence of overpressure in the reservoir reflected that the shale reservoirs still had good preservation conditions after uplift.
5.3. Indication of Shale Gas Preservation by Fracture Veins
As the main flow channel of shale gas, natural fractures play an important role in the enrichment of shale gas. Different types of natural fractures have different development characteristics, and thus have different effects on shale gas enrichment. The two main types of fracture in shale are oblique high-angle shear fractures and bedding slippage fractures. Through the study of lithofacies, elements, isotopes, and related fluid inclusions of the two types of fracture-filling veins, fracture slippage was clearly shown in bedding slippage fractures, and the veins were divided into two stages. The early calcite veins and the late quartz veins were both generated in the burial stage of the strata, and mainly originated from hydrothermal and diagenetic fluids. Before the tectonic uplift in the late Yanshan period, the shale reservoir belonged to the deep burial–hydrocarbon generation stage, in which the primary and secondary inclusions recorded the enrichment process of free gas in the shale. The process of the reservoir fluid pressure gradually increasing to a strong overpressure state was tracked. This kind of closed fracture is beneficial to the migration and diversion of free gas. From the perspective of geochemistry, it plays a constructive role in the enrichment of shale gas. Under deep shale gas conditions, fracture slip can significantly improve fracture permeability.
High-angle shear fractures usually cut through different strata in areas with strong tectonic activity, and only one-stage calcite was developed in the veins, which formed in the uplift stage after the Himalayan period. Faults and fractures destroyed the sealing of the shale. The veins were affected by atmospheric freshwater leaching, and cross-layer fluid activities occurred. The primary methane gas inclusions recorded the process of excess reservoir pressure reduction and the partial loss of shale free gas. Such open fractures destroyed the enrichment of the shale gas. The pores, faults and fractures, fluid evolution and temperature-pressure characteristics of shale reservoirs are key factors controlling shale gas enrichment and preservation.
6. Conclusions
Petrographic observations, elemental geochemistry, including REE, and quantitative analysis of fluid inclusions were combined with burial history reconstructions and hydrocarbon generation modelling to elucidate the fluid diagenetic histories of fracture veins in the O3w-S2l formation of the southern Sichuan Basin.
(1) The diagenetic sequences in the fracture veins can be summarized as follows: Cal-I in BFV→Qz-II in BFV→Cal-III in HAFV. The Th results show that the Cal-I in the BFV crystallized in the late Jurassic (~180 Ma), that the Qz-II crystallized in the middle Jurassic (~190 Ma), and that the Cal-III veins of the HAFV precipitated during the early Eocene (~12 Ma). The REE distribution pattern of the Cal-I vein originated from hydrothermal origin and diagenetic fluid. Quartz may generate from a relatively closed environment and was not affected by exogenous fluids. The Cal-III in the HAFV within Ce deficiency demonstrates the gradually weakened water-rock interaction and the mixing of atmospheric freshwater.
(2) The pore fluid pressure evolution of the shale reservoir was recovered by restoring the trapped pressure of the CH4 inclusions in different stages of fracture veins. The evolution of the pore fluid pressure and the pressure coefficient of the well shale in the area has gone through two stages. From 160 Ma to 86 Ma, the pressure gradually increased, and the pressure coefficient of the shale gas reservoir gradually increased from weak overpressure to strong overpressure. From 75 Ma to the present, affected by tectonic activities and strata uplift-erosion, the pore fluid pressure and pressure coefficient in the shale reservoirs has been significantly reduced. However, the existence of overpressure in the reservoir reflects that the shale reservoirs still have good preservation conditions after uplifting.
(3) Different types of natural fractures have different effects on shale gas enrichment. Bedding slippage fractures play a constructive role in the enrichment of shale gas. Fracture slip can significantly improve fracture permeability. High-angle shear fractures usually cut through different strata in areas with strong tectonic activity, and destroy the sealing of the shale. The occurrence of primary methane gas inclusions records the process of excess reservoir pressure reduction and the partial loss of shale free gas. Such open fractures destroy the enrichment of shale gas.
Author Contributions
R.T.: Conceptualization, Methodology, Software, Investigation, Writing—Original Draft. R.W.: Validation, Formal analysis, Visualization. Y.H.: Validation, Formal analysis, Review & Editing. R.Y.: Validation, Formal analysis, Visualization, Review & Editing. H.L.: Validation, Formal analysis, Review & Editing. K.L.: Review & Editing. All authors have read and agreed to the published version of the manuscript.
Funding
This research was funded by the Open Fund (PLC20210206) of the State Key Laboratory of Oil and Gas Reservoir Geology and Exploitation (Chengdu University of Technology), and the Joint Fund for Enterprise Innovation and Development (No. U20B6001), and supported by the National Natural Science Foundation of China (No. 42172157) and the Open Fund of the Key Laboratory of Exploration Technologies for Oil and Gas Resources (Yangtze University), Ministry of Education, NO. PI2021-05.
Data Availability Statement
The data used to support the findings of this study are included within the article.
Acknowledgments
This paper was granted by the Open Fund (PLC20210206) of the State Key Laboratory of Oil and Gas Reservoir Geology and Exploitation (Chengdu University of Technology), and the Joint Fund for Enterprise Innovation and Development (No. U20B6001), and supported by the National Natural Science Foundation of China (No. 42172157) and the Open Fund of the Key Laboratory of Exploration Technologies for Oil and Gas Resources (Yangtze University), Ministry of Education, NO. PI2021-05. We thank the editor and anonymous reviewer for their constructive comments.
Conflicts of Interest
The authors declare no conflict of interest.
References
- Hao, F.; Zou, H.; Lu, Y. Mechanisms of shale gas storage: Implications for shale gas exploration in China. AAPG Bull. 2013, 97, 1325–1346. [Google Scholar] [CrossRef]
- Dai, J.; Zou, C.; Liao, S.; Dong, D.; Ni, Y.; Huang, J.; Wu, W.; Gong, D.; Huang, S.; Hu, G. Geochemistry of the extremely high thermal maturity Longmaxi shale gas, southern Sichuan Basin. Org. Geochem. 2014, 74, 3–12. [Google Scholar] [CrossRef]
- Guo, T. Key geological issues and main controls on accumulation and enrichment of Chinese shale gas. Pet. Explor. Dev. 2016, 3, 317–326. [Google Scholar] [CrossRef]
- Yang, W.; He, S.; Zhai, G.; Tao, Z.; Yuan, X.; Wei, S. Maturity Assessment of the Lower Cambrian and Sinian Shales Using Multiple Technical Approaches. J. Earth Sci. 2021, 32, 1262–1277. [Google Scholar] [CrossRef]
- Guo, T. Progress and direction of deep shale gas exploration and development. Reserv. Eval. Dev. 2021, 1, 6. [Google Scholar]
- Wang, Y.; Zhai, G.; Liu, G.; Shi, W.; Lu, Y.; Li, J.; Zhang, Y. Geological Characteristics of Shale Gas in Different Strata of Marine Facies in South China. J. Earth Sci. 2021, 32, 725–741. [Google Scholar] [CrossRef]
- Zhang, Y.; Liu, L. Insights into the Formation Mechanism of Low Water Saturation in Longmaxi Shale in the Jiaoshiba Area, Eastern Sichuan Basin. J. Earth Sci. 2021, 32, 863–871. [Google Scholar] [CrossRef]
- Walderhaug, O. Temperatures of quartz cementation in Jurassic sandstones from the Norwegian continental shelf; evidence from fluid inclusions. J. Sediment. Res. 1994, 64, 311–323. [Google Scholar] [CrossRef]
- Fischer, M.P.; Higuera-Díaz, I.C.; Evans, M.A.; Perry, E.C.; Lefticariu, L. Fracture-controlled paleohydrology in a map-scale detachment fold: Insights from the analysis of fluid inclusions in calcite and quartz veins. J. Struct. Geol. 2009, 31, 1490–1510. [Google Scholar] [CrossRef]
- Chen, X.; Chen, L.; Shu, J.; Liu, A.; Luo, S.; Li, H.; Li, P.; Chen, P. Evaluation of Shale Reservoir Quality by Geophysical Logging for Shuijingtuo Formation of Lower Cambrian in Yichang Area, Central Yangtze. J. Earth Sci. 2021, 32, 766–777. [Google Scholar] [CrossRef]
- Qiu, Z.; Tao, H.; Lu, B.; Chen, Z.; Wu, S.; Liu, H.; Qiu, J. Controlling Factors on Organic Matter Accumulation of Marine Shale across the Ordovician-Silurian Transition in South China: Constraints from Trace-Element Geochemistry. J. Earth Sci. 2021, 32, 887–900. [Google Scholar] [CrossRef]
- Huang, Y.; He, S.; Guo, X.; Wu, Z.; Zhai, G.; Huang, Z.; Zhang, M.; Xiao, Q. Pressure–temperature–time–composition (P–T–t–x) of paleo–fluid in Permian organic–rich shale of Lower Yangtze Platform, China: Insights from fluid inclusions in fracture cements. Mar. Pet. Geol. 2021, 126, 104936. [Google Scholar] [CrossRef]
- Parry, W.T.; Bruhn, R.L. Fluid pressure transients on seismogenic normal faults. Tectonophysics 1990, 179, 335–344. [Google Scholar] [CrossRef]
- Roberts, S.M.; Spencer, R.J. Paleotemperatures preserved in fluid inclusions in halite. Geochim. Cosmochim. Acta 1995, 59, 3929–3942. [Google Scholar] [CrossRef]
- Goldstein, R.H. Petrographic analysis of fluid inclusions. Fluid Incl. Anal. Interpret. 2003, 32, 9–53. [Google Scholar]
- Zhao, Y.J.; Zhang, H.; Liu, C.; Liu, B.; Ma, L.; Wang, L. Late Eocene to early Oligocene quantitative paleotemperature record: Evidence from continental halite fluid inclusions. Sci. Rep. 2014, 4, 5776. [Google Scholar] [CrossRef] [Green Version]
- Gao, J.; He, S.; Zhao, J.; Yi, J. Geothermometry and geobarometry of overpressured lower Paleozoic gas shales in the Jiaoshiba field, Central China: Insight from fluid inclusions in fracture cements. Mar. Pet. Geol. 2017, 83, 124–139. [Google Scholar] [CrossRef] [Green Version]
- Osborne, M.; Haszeldine, S. Evidence for resetting of fluid inclusion temperatures from quartz cements in oilfields. Mar. Pet. Geol. 1993, 10, 271–278. [Google Scholar] [CrossRef]
- Huang, Y.-H.; Tang, Y.-J.; Li, M.-J.; Hong, H.-T.; Wu, C.-J.; Zhang, J.-Z.; Lu, X.-L.; Yang, X.-X. Quantitative evaluation of geological fluid evolution and accumulated mechanism: In case of tight sandstone gas field in central Sichuan Basin. Pet. Sci. 2021, 18, 416–429. [Google Scholar] [CrossRef]
- Evans, M.A. Fluid inclusions in veins from the Middle Devonian shales: A record of deformation conditions and fluid evolution in the Appalachian Plateau. Geol. Soc. Am. Bull. 1995, 107, 327–339. [Google Scholar] [CrossRef]
- Goldstein, R.H. Fluid inclusions in sedimentary and diagenetic systems. Lithos 2001, 55, 159–193. [Google Scholar] [CrossRef]
- Nothdurft, L.D.; Webb, G.E.; Kamber, B.S. Rare earth element geochemistry of Late Devonian reefal carbonates, Canning Basin, Western Australia: Confirmation of a seawater REE proxy in ancient limestones. Geochim. Cosmochim. Acta 2004, 68, 263–283. [Google Scholar] [CrossRef]
- Hu, Z.; Zhang, W.; Liu, Y.; Gao, S.; Li, M.; Zong, K.; Chen, H.; Hu, S. “Wave” Signal-Smoothing and Mercury-Removing Device for Laser Ablation Quadrupole and Multiple Collector ICPMS Analysis: Application to Lead Isotope Analysis. Anal. Chem. 2015, 87, 1152–1157. [Google Scholar] [CrossRef]
- Huang, Y.; Tarantola, A.; Lu, W.; Caumon, M.-C.; He, S.; Zhuang, X.; Yan, D.; Pironon, J.; Wang, W. CH4 accumulation characteristics and relationship with deep CO2 fluid in Lishui sag, East China Sea Basin. Appl. Geochem. 2020, 115, 104563. [Google Scholar] [CrossRef]
- Seitz, J.C.; Pasteris, J.D.; Chou, I.M. Raman spectroscopic characterization of gas mixtures. II. Quantitative composition and pressure determination of the CO2-CH4 system. Am. J. Sci. 1996, 296, 577–600. [Google Scholar] [CrossRef]
- Pironon, J.; Grimmer, J.O.W.; Teinturier, S.; Guillaume, D.; Dubessy, J. Dissolved methane in water: Temperature effect on Ramanquantification in fluid inclusions. J. Geochem. Explor. 2003, 78–79, 111–115. [Google Scholar] [CrossRef]
- Huang, Y.; Tarantola, A.; Wang, W.; Caumon, M.-C.; Pironon, J.; Lu, W.; Yan, D.; Zhuang, X. Charge history of CO2 in Lishui sag, East China Sea basin: Evidence from quantitative Raman analysis of CO2-bearing fluid inclusions. Mar. Pet. Geol. 2018, 98, 50–65. [Google Scholar] [CrossRef]
- Azbej, T.; Severs, M.J.; Rusk, B.G.; Bodnar, R.J. In situ quantitative analysis of individual H2O–CO2 fluid inclusions by laser Raman spectroscopy. Chem. Geol. 2007, 237, 255–263. [Google Scholar] [CrossRef]
- Baumgartner, M.; Bakker, R.J. Raman spectroscopy of pure H2O and NaCl-H2O containing synthetic fluid inclusions in quartz—A study of polarization effects. Mineral. Petrol. 2009, 95, 1–15. [Google Scholar] [CrossRef]
- Ou, W.; Guo, H.; Lu, W.; Wu, X.; Chou, I.-M. A re-evaluation of the effects of temperature and NaCl concentration on quantitative Raman spectroscopic measurements of dissolved CH4 in NaCl aqueous solutions: Application to fluid inclusion analysis. Chem. Geol. 2015, 417, 1–10. [Google Scholar] [CrossRef]
- Zhang, H.J. Recovery of thermal evolution history of organic matter of Longmaxi and Wufeng Formations in Changning area, Sichuan Province, China. J. Chengdu Univ. Technol. 2021, 3, 348–353. [Google Scholar]
- Huang, H.; He, D.; Li, Y.; Fan, H. Determination and formation mechanism of the Luzhou paleo-uplift in the southeastern Sichuan Basin. Earth Sci. Front. 2019, 26, 102–120. [Google Scholar]
- Liu, S.G. Unique geological features of burial and superimposition of the Lower Paleozoic shale gas across the Sichuan Basin and its periphery. Earth Sci. Front. 2016, 23, 11–28. [Google Scholar]
- Hu, D.F. Main controlling factors for gas preservation conditions of marine shales in southeastern margins of the Sichuan Basin. Nat. Gas Ind. 2014, 6, 17–23. [Google Scholar]
- Jin, Z.J. Controlling factors on the enrichment and high productivity of shale gas in the Wufeng-Longmax Formation, south-eastern Sichuan Basin. Earth Sci. Front. 2016, 23, 1–10. [Google Scholar]
- He, Z.L. The main factors of shale gas enrichment of Ordovician Wufeng Formation-Silurian Longmaxi Formationin in the Sichuan Basin and its adjacent areas. Earth Sci. Front. 2016, 23, 8–17. [Google Scholar]
- Tong Wang, T. Sequence stratigraphy of Wufeng–Longmaxi Formation and its control on reservoir in southern Sichuan. Acta Pet. Sin. 2015, 36, 915–925. [Google Scholar]
- Guo, T. Formation and enrichment mode of Jiaoshiba shale gas field, Sichuan Basin. Pet. Explor. Dev. 2014, 41, 31–40. [Google Scholar] [CrossRef]
- Zhang, C. Analysis and enlightenment of the difference of enrichment conditions for deep shale gas in southern Sichuan Basin. Nat. Gas Geosci. 2021, 2, 248–261. [Google Scholar]
- Tingxue Jiang, X.B. Volume fracturing of deep shale gas horizontal wells. Nat. Gas Ind. 2017, 1, 90–96. [Google Scholar]
- Liu, W.P. Controlling factors and evolution laws of shale porosity in Longmaxi Formation, Sichuan Basin. Acta Pet. Sin. 2017, 2, 175–184. [Google Scholar]
- Lu, W.; Chou, I.-M.; Burruss, R.C.; Song, Y. A unified equation for calculating methane vapor pressures in the CH4–H2O system with measured Raman shifts. Geochim. Cosmochim. Acta 2007, 71, 3969–3978. [Google Scholar] [CrossRef]
- Peng, D.Y.; Robinson, D.B. A New Two-Constant Equation of State. Minerva Ginecol. 1960, 12, 3069–3078. [Google Scholar] [CrossRef]
- Duan, Z.; Mao, S. A thermodynamic model for calculating methane solubility, density and gas phase composition of methane-bearing aqueous fluids from 273 to 523 K and from 1 to 2000 bar. Geochim. Cosmochim. Acta 2006, 70, 3369–3386. [Google Scholar] [CrossRef]
- He, S.; Mike, M. Heat flow and thermal maturity modelling in the northern carnarvon basin, north west shelf, Australia. Mar. Pet. Geol. 2002, 19, 1073–1088. [Google Scholar] [CrossRef]
- Veizer, J.; Ala, D.; Azmy, K. 87Sr/86Sr, δ13C and δ18O evolution of Phanerozoic seawater. Chem. Geol. 1999, 161, 59–88. [Google Scholar] [CrossRef] [Green Version]
- Zhang, J.; Qiao, S.; Lu, W.; Hu, Q.; Chen, S.; Liu, Y. An equation for determining methane densities in fluid inclusions with Raman shifts. J. Geochem. Explor. 2016, 171, 20–28. [Google Scholar] [CrossRef] [Green Version]
- Peng, D.Y.; Robinson, D.B. Two and three phase equilibrium calculations for systems containing water. Can. J. Chem. Eng. 1976, 54, 595–599. [Google Scholar] [CrossRef]
- Bau, M.; Dulski, P. Comparing yttrium and rare earths in hydrothermal fluids from the Mid-Atlantic Ridge: Implications for Y and REE behaviour during near-vent mixing and for the Y/Ho ratio of Proterozoic seawater. Chem. Geol. 1999, 155, 77–90. [Google Scholar] [CrossRef]
- Mcarthur, J.M.; Kennedy, W.J.; Chen, M. Strontium isotope stratigraphy for Late Cretaceous time: Direct numerical calibration of the Sr isotope curve based on the US Western Interior. Palaeogeogr. Palaeoclimatol. Palaeoecol. 1994, 108, 95–119. [Google Scholar] [CrossRef]
- Cox, S.F. Structural and isotopic constraints on fluid flow regimes and fluid pathways during upper crustal deformation: An example from the Taemas area of the Lachlan Orogen, SE Australia. J. Geophys. Res. Solid Earth 2007, 112, B8. [Google Scholar] [CrossRef] [Green Version]
- Gao, J.; Zhang, J.-K.; He, S.; Zhao, J.-X.; He, Z.-L.; Wo, Y.-J.; Feng, Y.-X.; Li, W. Overpressure generation and evolution in Lower Paleozoic gas shales of the Jiaoshiba region, China: Implications for shale gas accumulation. Mar. Pet. Geol. 2019, 102, 844–859. [Google Scholar] [CrossRef]
Figure 1.
(A): Location of the Sichuan Basin in China. (B): Location of the Changning–Luzhou Shale Gas Field in the Sichuan Basin.
Figure 1.
(A): Location of the Sichuan Basin in China. (B): Location of the Changning–Luzhou Shale Gas Field in the Sichuan Basin.
Figure 2.
Stratigraphic and lithologic diagram of the Lower Paleozoic in the southeastern Sichuan Basin.
Figure 2.
Stratigraphic and lithologic diagram of the Lower Paleozoic in the southeastern Sichuan Basin.
Figure 3.
(A,B,E): Bedding-parallel slip fracture veins are intermingled with the surrounding rock. (C,D): High-angle shear fracture veins.
Figure 3.
(A,B,E): Bedding-parallel slip fracture veins are intermingled with the surrounding rock. (C,D): High-angle shear fracture veins.
Figure 4.
Lithography and cathodoluminescence characteristics of filled calcite and quartz veins in the O3w-S2l formation of the southern Sichuan Basin. (A,B): Early calcite and late quartz cementation in bedding slip fracture veins (cross-polarized light); (C): panoramic image of bedding fracture veins (cross-polarized light); (D): panoramic image of bedding fracture veins (cathodoluminescence); (E,F): panoramic image of high-angle shear fracture veins (cathodoluminescence).
Figure 5.
Distributions of rare earth elements in calcite veins and surrounding rock from bedding fracture veins (BFVs) and high-angle fracture veins (HAFVs), respectively. The concentrations are normalized to the North American Shale Standard.
Figure 5.
Distributions of rare earth elements in calcite veins and surrounding rock from bedding fracture veins (BFVs) and high-angle fracture veins (HAFVs), respectively. The concentrations are normalized to the North American Shale Standard.
Figure 6.
Plot diagram of δ13CPDB and δ18OPDB of calcite veins from the O3w-S2l formation in the southeastern Sichuan Basin.
Figure 6.
Plot diagram of δ13CPDB and δ18OPDB of calcite veins from the O3w-S2l formation in the southeastern Sichuan Basin.
Figure 7.
Histogram of 87Sr/86Sr ratios of calcite veins from the O3w-S2l formation in the southeastern Sichuan Basin.
Figure 7.
Histogram of 87Sr/86Sr ratios of calcite veins from the O3w-S2l formation in the southeastern Sichuan Basin.
Figure 8.
(A,B): primary CH4 gas-bearing inclusions in the Cal-I of the BFV; (C,D): secondary pure CH4 gas inclusions coeval with aqueous inclusions along with microfractures in the Cal-I of the BFV; (E,F): secondary pure CH4 gas inclusions coeval with aqueous inclusions along with microfractures in the Qz-II of the BFV; (G–I): One-phase (vapor) inclusions gather in the Cal-III of the HAFV, and are distributed as clusters, and isolated. All components were identified by micro–Raman spectroscopy.
Figure 9.
(A): Histogram of homogenization temperatures (Th) of aqueous inclusions coeval with CH4 gas fluid inclusions in different host minerals; (B): Histogram of density of CH4 gas fluid inclusions in different host minerals; (C): Th versus salinities of aqueous inclusions coeval with CH4 gas fluid inclusions in different host minerals; (D): Homogenization temperatures versus homogenization pressure of CH4 gas fluid inclusions in different host minerals.
Figure 10.
(A): Raman spectrum of pure CH4 inclusion, collected using the 300 gr·mm−1 grating in calcite; (B): CH4 symmetric stretching band (v1) peak was collected using the 1800 gr·mm−1 grating with Ne lamp; (C): Raman spectrum of pure CH4 inclusion, collected using the 300 gr·mm−1 grating in quartz; (D): CH4 symmetric stretching band (v1) peak was collected using the 1800 gr·mm−1 grating with Ne lamp; (E): Schematic diagram of spectral parameters of dissolved CH4 aqueous inclusions, collected using the 300 gr·mm−1 grating.
Figure 11.
Burial and thermal history model of well L21, including petroleum generation and destruction, pressure evolution, and fluid charging periods.
Figure 11.
Burial and thermal history model of well L21, including petroleum generation and destruction, pressure evolution, and fluid charging periods.
Figure 12.
Diagram of the fluid pressure evolution process and measured inclusion pressure variation with time.
Figure 12.
Diagram of the fluid pressure evolution process and measured inclusion pressure variation with time.
Table 1.
Rare earth elements (REE) concentrations of different calcite veins and surrounding rock in the Wufeng Formation shales.
Table 1.
Rare earth elements (REE) concentrations of different calcite veins and surrounding rock in the Wufeng Formation shales.
Sample
Location | Host
Mineral | Rare Earth Elements (ug/g) | ΣREE | LREE/
HREE | La/Ho | Y/Ho |
|---|
| La | Ce | Pr | Nd | Sm | Eu | Gd | Tb | Dy | Y | Ho | Er | Tm | Yb | Lu |
|---|
| S1-1 | Cal-I | 0.0916 | 0.0921 | 0.1213 | 0.1448 | 0.1948 | 4.6380 | 0.2686 | 0.2459 | 0.2090 | 0.2229 | 0.1615 | 0.1131 | 0.0558 | 0.0545 | 0.0344 | 6.4254 | 6.3500 | 17.4518 | 35.8317 |
| S1-2 | Cal-I | 0.0973 | 0.0996 | 0.1423 | 0.1621 | 0.2358 | 4.0139 | 0.3517 | 0.3136 | 0.3030 | 0.3134 | 0.2490 | 0.1721 | 0.1302 | 0.0948 | 0.0751 | 6.4405 | 3.8142 | 12.0235 | 32.6761 |
| S1-3 | Cal-I | 0.1195 | 0.1371 | 0.2006 | 0.2396 | 0.4101 | 3.8566 | 0.6024 | 0.6196 | 0.5903 | 0.6370 | 0.5276 | 0.4228 | 0.3499 | 0.3184 | 0.2760 | 8.6705 | 1.7928 | 6.9691 | 31.3448 |
| S1-4 | Cal-I | 0.0641 | 0.0652 | 0.0891 | 0.1110 | 0.1945 | 3.8958 | 0.2538 | 0.2230 | 0.2010 | 0.2148 | 0.1570 | 0.1253 | 0.1023 | 0.0834 | 0.0628 | 5.6283 | 4.8947 | 12.5625 | 35.5194 |
| S1-5w | Surrounding rock | 0.4517 | 0.3578 | 0.3020 | 0.2510 | 0.2043 | 0.1661 | 0.1663 | 0.1638 | 0.1800 | 0.1642 | 0.1820 | 0.1962 | 0.2522 | 0.2735 | 0.2520 | 3.3989 | 1.2664 | 76.3652 | 23.4224 |
| S1-6w | Surrounding rock | 0.5418 | 0.4679 | 0.4288 | 0.3687 | 0.2938 | 0.2579 | 0.2193 | 0.1944 | 0.1856 | 0.1749 | 0.2009 | 0.2070 | 0.2347 | 0.2812 | 0.2869 | 4.1689 | 1.6208 | 82.9804 | 22.6017 |
| S2-1 | Cal-III | 0.0281 | 0.0170 | 0.0255 | 0.0388 | 0.0531 | 0.0605 | 0.0579 | 0.0460 | 0.0363 | 0.0358 | 0.0437 | 0.0301 | 0.0217 | 0.0149 | 0.0166 | 0.4746 | 1.4502 | 28.7248 | 37.6917 |
| S2-2 | Cal-III | 0.0992 | 0.0588 | 0.0956 | 0.1228 | 0.1392 | 0.1718 | 0.1544 | 0.1229 | 0.1036 | 0.1022 | 0.1091 | 0.0692 | 0.0593 | 0.0636 | 0.0588 | 1.4184 | 1.4599 | 44.1085 | 40.9307 |
| S2-3 | Cal-III | 0.0602 | 0.0337 | 0.0524 | 0.0729 | 0.0958 | 0.0882 | 0.1214 | 0.0897 | 0.0675 | 0.0683 | 0.0693 | 0.0523 | 0.0440 | 0.0307 | 0.0348 | 0.9038 | 1.3834 | 35.4170 | 34.4003 |
| S2-4w | Surrounding rock | 0.0877 | 0.0626 | 0.0554 | 0.0522 | 0.0634 | 0.0952 | 0.0748 | 0.0968 | 0.1062 | 0.1079 | 0.1130 | 0.1106 | 0.1404 | 0.1426 | 0.1895 | 1.3904 | 0.5464 | 23.8802 | 24.7898 |
| S2-5w | Surrounding rock | 0.1382 | 0.0955 | 0.0828 | 0.0874 | 0.1678 | 0.2061 | 0.1974 | 0.1920 | 0.1972 | 0.1497 | 0.1766 | 0.1838 | 0.2196 | 0.2081 | 0.2012 | 2.3537 | 0.7074 | 24.0788 | 22.0070 |
| NASC | | 32 | 73 | 7.9 | 33 | 5.7 | 1.24 | 5.2 | 0.85 | 5.8 | 27 | 1.04 | 3.4 | 0.5 | 3.1 | 0.48 | | | | |
Table 2.
Characteristic parameters of trace elements in the calcite veins of the Wufeng Formation shales.
Table 2.
Characteristic parameters of trace elements in the calcite veins of the Wufeng Formation shales.
Sample
Location | Host Mineral | U/Th | V/Cr | Ni/Co | V/(V + Ni) | δY | δEu | δCe |
|---|
| S1-1 | Cal-I | 24.8761 | 0.4069 | 3.4636 | 0.8085 | 1.2032 | 20.0173 | 0.8652 |
| S1-2 | Cal-I | 0.9543 | 0.7651 | 0.3312 | 0.9770 | 1.1355 | 13.6643 | 0.8314 |
| S1-3 | Cal-I | 0.8414 | 0.0911 | 2.0634 | 0.8685 | 1.1396 | 7.6180 | 0.8566 |
| S1-4 | Cal-I | 1.3487 | 0.2616 | 0.0837 | 0.9902 | 1.2000 | 17.3803 | 0.8512 |
| S1-5w | Surrounding rock | 0.5887 | 1.5313 | 12.9802 | 0.7539 | 0.9072 | 0.8964 | 0.9494 |
| S1-6w | Surrounding rock | 0.4222 | 1.8069 | 14.6974 | 0.7587 | 0.9050 | 1.0053 | 0.9641 |
| S2-1 | Cal-III | 6.0810 | 28.9325 | 1.8611 | 0.9881 | 1.3163 | 1.0901 | 0.6343 |
| S2-2 | Cal-III | 6.5839 | 3.1866 | 5.6776 | 0.9891 | 1.2627 | 1.1703 | 0.6037 |
| S2-3 | Cal-III | 12.6746 | 4.2917 | 8.9477 | 0.9759 | 1.1569 | 0.8122 | 0.5986 |
| S2-4w | Surrounding rock | 4.3795 | 7.1073 | 13.2924 | 0.7299 | 0.9845 | 1.3777 | 0.8749 |
| S2-5w | Surrounding rock | 5.5657 | 7.2786 | 12.4918 | 0.7224 | 0.8010 | 1.1287 | 0.8643 |
Table 3.
Carbon, oxygen, and strontium isotope compositions of the calcite veins and the surrounding rock of the Wufeng Formation.
Table 3.
Carbon, oxygen, and strontium isotope compositions of the calcite veins and the surrounding rock of the Wufeng Formation.
| No. | Occurrence Types | δ13CPDB (‰) | δ18OPDB (‰) | 87Sr/86Sr |
|---|
| 1 | Bedding fracture calcite veins | −4.21 | −13.10 | 0.71829 |
| 2 | Bedding fracture calcite veins | −3.88 | −13.83 | 0.71822 |
| 3 | Bedding fracture calcite veins | −3.79 | −12.38 | 0.72003 |
| 4 | Bedding fracture calcite veins | −3.18 | −12.91 | 0.72119 |
| 5 | High-angle fracture calcite veins | −1.92 | −11.93 | 0.72225 |
| 6 | High-angle fracture calcite veins | −1.50 | −11.19 | 0.72361 |
| 7 | High-angle fracture calcite veins | −1.42 | −11.15 | 0.72433 |
| Surrounding rock | | | | |
| 1 | Surrounding rock | −2.72 | −12.94 | 0.71562 |
| 2 | Surrounding rock | −3.05 | −13.17 | 0.71851 |
| 3 | Surrounding rock | −3.04 | −13.16 | 0.71774 |
| 4 | Surrounding rock | −3.13 | −12.48 | 0.71849 |
| 5 | Surrounding rock | −3.14 | −12.50 | no data |
Table 4.
CH4 gaseous inclusion Raman quantitative analysis summary in fracture veins of the Wufeng Formation.
Table 4.
CH4 gaseous inclusion Raman quantitative analysis summary in fracture veins of the Wufeng Formation.
| No. | Well | Depth
(m) | Host Mineral | Inclusion
Classification | vtrue (cm−1) | Density
(g/cm3) | Num | Th (oC) | Reconstructed Trapped Pressure
(MPa) | Pressure Coefficient |
|---|
| 1 | L21 | 3576.0 | Cal-III | Primary | 2911.40–2911.49 | 0.2522–0.2571 | 2 | 121.2–123.4 | 63.4–64.2 | 1.91–1.92 |
| 2 | L21 | 3576.0 | Cal-III | Primary | 2911.36–2911.52 | 0.2505–0.2595 | 3 | 120.5–131.6 | 62.7–69.9 | 1.90–1.95 |
| 3 | L21 | 3576.5 | Cal-III | Primary | 2911.36–2911.43 | 0.2555–0.2598 | 2 | 133.7–146.4 | 70.6–72.1 | 1.81–1.94 |
| 4 | L21 | 3576.5 | Cal-I | Primary | 2911.27–2911.59 | 0.2463–0.2653 | 2 | 153.2–158.7 | 69.3–79.8 | 1.34–1.53 |
| 5 | L21 | 3577.2 | Cal-I | Primary | 2911.25–2911.52 | 0.2501–0.2665 | 3 | 153.4–167.2 | 74.9–79.8 | 1.39–1.54 |
| 6 | L21 | 3577.8 | Cal-I | Secondary | 2911.06–2911.10 | 0.2767–0.2792 | 4 | 172.5–178.5 | 92.5–95.1 | 1.68–1.71 |
| 7 | L22 | 3578.0 | Cal-III | Primary | 2911.24–2911.44 | 0.2549–0.2670 | 3 | 141.3–148.0 | 70.4–78.5 | 1.83–1.95 |
| 8 | L22 | 3578.3 | Cal-I | Primary | 2911.23–2911.30 | 0.2637–0.2682 | 4 | 172.5–178.5 | 92.5–95.1 | 1.68–1.71 |
| 9 | L22 | 3578.3 | Cal-I | Secondary | 2911.00–2911.03 | 0.2841–0.2816 | 2 | 170.4–171.2 | 94.3–95.7 | 1.73–1.76 |
| 10 | L22 | 3578.3 | Qz-II | Secondary | 2910.51–2910.67 | 0.3119–0.3338 | 4 | 188.6–226.7 | 132.3–161.2 | 2.18–2.56 |
| 11 | L22 | 3578.3 | Qz-II | Secondary | 2910.51–2910.55 | 0.3274–0.3327 | 3 | 200.3–216.5 | 142.7–155.4 | 2.42–2.53 |
| 12 | L23 | 3660.0 | Cal-III | Primary | 2911.22–2911.32 | 0.2620–0.2685 | 3 | 144.5–147.9 | 75.4–79.3 | 1.89–1.97 |
| 13 | L23 | 3660.5 | Cal-III | Primary | 2911.19–2911.29 | 0.2639–0.2708 | 3 | 144.2–155.3 | 75.7–82.8 | 1.93–1.96 |
| 14 | L23 | 3660.0 | Cal-I | Primary | 2911.38–2911.51 | 0.2506–0.2583 | 4 | 162.3–170.2 | 73.9–79.2 | 1.39–1.47 |
| 15 | L23 | 3662.5 | Cal-I | Primary | 2911.28–2911.32 | 0.2625–0.2649 | 2 | 164.1–168.5 | 80.7–83.3 | 1.51–1.54 |
| 16 | L23 | 3662.5 | Qz-II | Secondary | 2910.52–2910.56 | 0.3260–0.3317 | 4 | 214.5–220.3 | 147.3–153.4 | 2.41–2.51 |
| 17 | L23 | 3664.3 | Cal-I | Secondary | 2910.94–2911.00 | 0.2838–0.2880 | 4 | 165.4–182.3 | 93.9–102.3 | 1.75–182 |
| 18 | L23 | 3664.3 | Qz-II | Secondary | 2910.51–2910.54 | 0.3282–0.3336 | 4 | 215.4–219.8 | 150.1–157.9 | 2.45–4.55 |
Table 5.
Dissolved CH4 in NaCl aqueous inclusions obtained by Raman quantitative analysis data complication.
Table 5.
Dissolved CH4 in NaCl aqueous inclusions obtained by Raman quantitative analysis data complication.
| No. | Well | Depth
(m) | Host Mineral | Inclusion
Classification | PAR
(CH4/H2O) | IR
(I3425 cm−1/I3260 cm−1) *a | Salinity (wt.%) *b | mCH4
(mol.kg−1) *c | Homogenization Temperature (°C) |
|---|
| 1 | L21 | 3576.0 | Cal-I | Primary | 0.0022 | 1.58992 | 10.5 | 0.21 | 156.7 |
| 2 | L21 | 3576.0 | Cal-III | Primary | 0.0026 | 1.42003 | 5.8 | 0.11 | 125.5 |
| 3 | L22 | 3578.0 | Cal-I | Secondary | 0.0031 | 1.83225 | 16.2 | 0.18 | 181.3 |
| 4 | L22 | 3578.3 | Qz-II | Secondary | 0.0082 | 1.99972 | 20.4 | 0.39 | 215.7 |
| 5 | L22 | 3578.3 | Qz-II | Secondary | 0.0081 | 2.08776 | 21.1 | 0.36 | 212.0 |
| 6 | L22 | 3578.3 | Qz-II | Secondary | 0.0078 | 1.91115 | 17.6 | 0.34 | 210.6 |
| 7 | L23 | 3662.5 | Cal-I | Secondary | 0.0048 | 1.70156 | 13.2 | 0.22 | 173.8 |
| 8 | L23 | 3662.5 | Cal-III | Primary | 0.0025 | 1.55131 | 9.5 | 0.13 | 157.4 |
| 9 | L23 | 3662.5 | Cal-III | Primary | 0.0016 | 1.38105 | 4.8 | 0.08 | 136.9 |
| Publisher’s Note: MDPI stays neutral with regard to jurisdictional claims in published maps and institutional affiliations. |
© 2022 by the authors. Licensee MDPI, Basel, Switzerland. This article is an open access article distributed under the terms and conditions of the Creative Commons Attribution (CC BY) license (https://creativecommons.org/licenses/by/4.0/).


