1. Introduction
Titanium or vanadium metals, or their alloys, owing to their unique properties have found applications in alloys, steel, pipe, aerospace, superconducting magnets, medical implants, and battery manufacturing. As only a few countries, such as China, Russia, and South Africa, produce roughly 85% of the world’s vanadium, the increasing gap between demand and supply needs to be bridged.
In the present study, a reconnaissance survey was carried out for magnetite-ilmenite mineralization in the Sudamakund and Paharpur areas, Gaya and Jehanabad districts, Bihar in parts of Survey of India (SOI) Toposheet Nos. 72 G/4. The geological work components of the investigation included large-scale mapping of 100 sq. km (at 1:12,500 scale), pitting-trenching (pit/trench samples—PTS), systematic bedrock sampling (BRS), and multi-spectral remote sensing approaches, along with ground geophysical survey (gravity and magnetic) studies. Apart from these petrochemical samples (PCS), petrographic samples (PS), ore microscopy study, and X-ray powder diffraction (XRD) samples were collected to evaluate the mineralization potential of the study area. The primary objective of the current study was to assess the potentiality of magnetite-ilmenite mineralization associated with mafic-ultramafic rocks, and granitoids of the Makhpa, Sudamakund-Nagarjuni Magmatic Complex, Paharpur area, Gaya and Jehanabad Districts, Bihar, India. To accomplish the objectives, various exploration techniques such as geological, geochemical, remote sensing and ground geophysical work was done.
Several geologists from the Geological Survey of India (GSI) have worked in this area carrying out systematic mapping in and around Sudamakund and Nagarjuni hills. Medlicott and Wilson were the earliest workers (1847) who carried out the systematic geological mapping and prepared the first geological map of this area. Earlier worker had reported a gravity low and gravity high zones near Bodh gaya and Gaya [
1]. The low anomalous gravity zone possibly indicates the continuation of Son–Narmada graben, and the high anomalous zone probably depicts the presence of basic, ultra-basic, or anorthositic rocks beneath. The area was covered under project CRUMANSONATA, where two ENE-WSW trending lineaments to the north and south of the rocky upland were reported [
1] along with systematic geological mapping. Geological and petro-mineragraphic study of the area led to the identification of magnetite-ilmenite lenses. The bands are associated with gabbro-anorthosite within porphyritic and homophanous massive granite and granophyres [
2]. Within the granitic country, enclaves of quartzite, phyllite, quartz biotite schist, and hornblende schist are present. Bands and lenses of magnetite vary in length from 160 m to 400 m and width ranges from 50 to 150 m. Magnetite samples have shown total Fe content ranging from 49.36 to 55.08%, TiO
2 from 14.21 to 23.8%, while V varied from 0.411 to 1.021%. The relatively higher content of vanadium were observed in six magnetite samples with values ranging from 3868 ppm to 8776 ppm (average 6146.67 ppm) in the area [
3,
4]. Samples have also yielded Ni between 118 to 368 ppm and Cr between 180 to 223 ppm. Mukherjee (2010) [
2] proposed the tentative broad litho-stratigraphic succession based on mutual file relationship of the various litho-units encountered in the area, which is as follows:
| Recent | Alluvium |
|---|
| Proterozoic | Pegmatite and aplite
Porphyritic biotite granite, pegmatic granite and homophanous biotite granite.
Gabbro-Anorthosite suite interlayered with titaniferous vanadiferous magnetite. |
2. Study Area
The study area is in parts of the Gaya and Jehanabad districts, Bihar, India. It is surrounded by Misir Bigha, Ghasi Bigha, Makpa, Adampur, Daulatpur, Sakir Bigha, Nawagarh, Lodhipur, Shripur, Ibrahimpur, Azad Basti, and Paharpur villages. The study area is mainly occupied by local village people for agricultural purposes; however, some parts are covered by open-type forest areas managed by the Divisional Forest Officer (DFO). The area is considered as freehold but falls in the open-type forest area where some parts are of archaeological importance due to the presence of many caves and temples of historical significance maintained by the Archaeological Survey of India (ASI).
The study area falls in the SOI toposheet no. 72G/4 bounded by latitudes 24°59′45″ N to 25°03′00″ N and longitudes 85°00′00″ E to 85°10′00″ E in Gaya and Jehanabad districts, Bihar, India (
Figure 1). The area is accessible by a metal road from Jehanabad, Makhdumpur, and Bela at distances of 29 km, 5 km, and 13 km, respectively. Bela is the nearest railhead, located 20 km north of Gaya, on the Gaya-Patna railway line. Jehanabad and Bela are also situated on the Patna-Gaya state highway, running parallel to the Patna-Gaya railway line; Patna is due north and Gaya due south. The nearest airports are Patna and Gaya airport.
The area is characterized by a tropical to sub-tropical climate with moderate rainfall and experiences a continental monsoon climate. It can be divided into three well marked seasons, namely 1, a cold weather season from November to mid-March; 2, a hot weather season from mid-March to mid-June; and 3, a rainy season from mid-June to October. The hill ranges and plateaus of the area support fairly dense jungles, consisting of essentially Sal (Shorea robusta), Shisham (Dalbergia sisoo) and Neem (Azadirachta indica), Banyan tree (Ficus benghalensis), Peepal tree (Ficus religiosa), Palm tree (Roystonea regia), and Date palm (Phoenix sylvestris). The Mahadeo temple, Nagarjuni caves, and Sudamakund caves in Patal Ganga are considered of historical/archaeological importance and are maintained by the ASI.
2.1. Regional Geology
A vast tract of the Peninsular Eastern Indian Shield is occupied by gneisses and granulitic rocks commonly referred to as the “Chotanagpur Gneiss Granulite Complex” (henceforth referred to as CGGC [
5] and covers an area of 100,000 square kilometres. The Chotanagpur Granite-Gneiss Complex (CGC) is bordered on the north by Gangetic alluvium and on the south by Singhbhum mobile belt. The CGC is also bounded by the Munger-Saharsa Ridge (MSR) fault on the northern side, which is believed to be the southern boundary of the Central Indian Tectonic Zone (CITZ). The ENE-WSW trending CITZ is a zone where the collision between northern and southern Indian continental blocks took place during the Proterozoic time [
6]. The area under study is situated in the north fringe of CGGC (
Figure 2).
The bulk of the CGC constitutes of late Precambrian gneisses and granites of at least three generations [
7] and migmatites, in quartzite grading to ferruginous quartzite, occasionally grunerite bearing, phyllites and mica schists, grading into mica-gneiss due to granitization, calc-silicate rocks, limestones, ortho- and para-amphibolites, and skarn rocks occur as enclaves of varying dimensions. The rocks within the Complex have witnessed metamorphism from middle to upper amphibolite facies, the general P-T conditions being 4–6 Kb and about 680 °C, respectively [
8,
9]. Within this, granulite-facies of rocks, consisting of khondalites, leptynites, charnockites, quartz-magnetite granulite etc., occurring in patches, were noted in Godda, Dumka, Bhagalpur, Palamau, and Ranchi districts of Bihar (
Table 1). The CGGC is also characterized by the occurrence of various types of anorthosite-gabbro suite of rocks [
10]. Anorthosite magmatism in CGGC, representing an end- product of differentiated basic igneous rocks, was found at Bela, Hizla, and Chatra (
Figure S1).
2.2. Previous Exploration Carried out in the Study Area
Dayal, N., (1983) [
12] carried out systematic geological mapping and concluded that the area is formed by granitoid with patches of meta-sediments like quartzite, granulites, amphibolites, etc., and veins of pegmatites and quartz. The granite gneiss consists of quartz, potash feldspar, plagioclase, and micaceous minerals [
13]. Prior to granitic intrusion, the area has been subjected to large-scale ultramafic to mafic intrusions, resulting in the generation of the anorthositic suite of rocks.
Mukherjee (2010) [
2] carried out a geological and petro-mineragraphic study in the area and identified that the magnetite-ilmenite mineralization is associated with the gabbro-anorthosite suite and granite suite of rocks forming the Sudamakund Nagarjuni Magmatic Complex. There are two distinct modes of occurrence, firstly as an interlayer within the anorthosite suite and secondly as large xenolithic bodies within granitic suite. The magnetite lodes occur as bands and lenses within the anorthosite bodies. Bands and lenses of magnetite vary in length from 160 m to 400 m, and width ranges from 50 m to 150 m. The anorthosite suite of rocks is of particular interest as it contains a considerable load of the ilmenite-magnetite deposit that could be of economic importance. One of the bodies is located 1 km east of Ramnath Bigha and another one northwest of Nagarjuni caves. Similarly, isolated magnetite ore bodies are found at the north-western slope of Mahadeo hill and north of Satghara hill. Apart from these significant occurrences, a few occurrences that are more isolated were recorded in the area. Ore petrography reveals that the primary body mainly comprises of titaniferous-magnetite with lamellar as well as patchy ilmenite intergrowth within magnetite. Development of typical Widmanstatten intergrowth structures defined by three sets of ilmenite intergrowth laths along three sets of cleavage is a very conspicuous feature. The chemical analysis of the bodies of Sudamakund Nagarjuni Magmatic Complex (Mukherjee, 2010), shows that it contains 49.36% to 55.08% total Fe, with TiO
2 ranging from 14.21% to 23.8%, and V
2O
3 ranges from 0.411% to 1.021%. The Ni and Co range from 118 ppm to 368 ppm, and 180 ppm to 223 ppm, respectively. This dominant oxide mineralization is associated with minor sulphides in the form of chalcopyrite and pyrite.
3. Geoscientific Investigation
3.1. Geological Exploration
3.1.1. Geology of the Study Area
The study area is in the northern part of the Chotanagpur plateau flanked in the north by Indogangetic alluvial plains and southeast by the Rajgir Group of Proterozoic metasediments. The variety of magmatic rocks forming the Sudamakund-Nagarjuni ranges is surrounded by Indogangetic alluvium only to the south of Ganga River and east of Son River (
Figure 3 and
Figure 4). The rock type manifested in the area exposes gabbro-anorthosite-granite suite of rocks forming a part of Chotanagpur Gneissic Complex (CGC). The granite suite of rocks occurs in three special variants represented by coarse-grained homophanous biotite granite, medium-grained hornblende granite, and porphyritic biotite granite. Apart from these, highly silicified, sheared and very fined grained granite is also recorded in the northern part of the study area, which corresponds with a prominent regional shear zone trending in NE-SW direction. Locally the influence of migmatitic character has also been recorded. Veins of quartz and pegmatite occur as intrusives into the granitic country rock. The rocks occurring as relict patches or xenoliths within anorthosite are meta-gabbro, and talc-tremolite-actinolite schist, and within the granite are amphibolites and anorthosite. In the east of Phalgu River, a huge gabbro anorthosite suite of rocks are exposed and occurs as long linear bodies which were previously unreported. Talc tremolite actinolite schist also occurs as thin lenses within gabbro-anorthosite suite of rocks trending in NW-SE direction. Metagabbro is exposed in the form of extensive boulders, which is fine to medium-grained, hard, compact, dark greyish, and having a trend of NE-SW. It is sheared in places and altered, leading to the development of chloritisation, biotitisation, and ferruginisation. This body is 700 m long and 100 m wide. It also contains crystals of magnetite at places. Two different types of anorthosite were observed: a clotted type, with clots of amphiboles, and a layered type, defined by distinct segregation of amphibole cumulates as a layer. The dominant type is clotted anorthosite, which is massive in nature and exposed in the form of boulders.
The only regional structure recorded in the area is a prominent shear zone with a NE-SW trend running through silicified granite along the Sudamakund ranges. This regional trend shows similarity with the orientation of Son Narmada lineament, which is considered a favourable place for the emplacement of gabbro-anorthosite suite of rocks and magnetite body (
Figure S2). Two prominent joint sets were recorded generally trending in NE-SW and NW-SE direction). Igneous layering was observed as the primary structure, defined by the segregation of amphibole cumulates/needles forming distinct layering in anorthosite and having a trend of NE-SW. The secondary structures are joints, faults, folds, and shear zone. Two prominent sets of joint planes have developed. Evidence of mesoscopic faulting were observed as indicated by slickenlines, and displacement of quartzo-feldspathic pegmatitic/aplitic veins.
Very rich lodes of magnetite that require special attention from an economic point of view are found as pockets and lenses associated with a gabbro-anorthosite suite of rocks and granite suite of rocks. Five major magnetite bodies were delineated: NE of Sudamakund, 750 m SW of Patalganga, NW of Nagarjuni hills, NW of Patal Ganga, and east of Phalgu river. Bands and lenses of magnetite vary in length from 200 m to 800 m, and width ranges from 40 m to 200 m.
The study area mainly consists of gabbro-anorthosite-granite suite of rocks forming a part of Chotanagpur Gneissic Complex (CGC). The litho-units (
Figure 3 and
Figure 4) that were identified and delineated during mapping are as follows:
The amphibolite occurs as rafts or xenoliths within the homophanous biotite granite and porphyritic biotite granite, traversed by innumerable anastomosing quartzo-feldsphatic pegmatite veins (
Figure 5a,b). It is a fine to medium-grained, hard, massive, dark greenish rock, highly brecciated with angular/irregular fragments at places. Amphiboles have been converted to biotite, and locally the amphibolite appears to be a product of the metamorphism of some gabbroic rocks. One stray boulder of amphibolite gneiss showing well-developed banding was observed (
Figure 5c). It is well exposed north of Patal Ganga and east of Nawagarh village.
- ii.
Talc-tremolite-actinolite schist
This ultramafic rock is highly sheared, fractured, and crenulated with development of F2 puckers and is closely associated with metagabbro, layered anorthosite, and clotted anorthosite (
Figure 5d). It is dark green, fine-grained rock, giving a soapy feeling when touched. This weathered, crenulated ultramafic rock shows malachite staining (
Figure 5e) and often shows haloes of chloritisation, biotisation, and epidotisation. Xenoliths of this rock type were observed in clotted anorthosite (
Figure 5f). This thin band is observed only in the east of Phalgu River.
- iii.
Metagabbro/gabbro
This rock unit is exposed in the form of linear, quite extensive, bouldery nature, having a trend of NE-SW with the development of a shear fracture. It is fine to medium-grained, hard, compact, dark greyish rock. It is sheared at places, highly altered, leading to chloritisation, biotitisation, and ferruginisation. This body is 700 m long and 100 m wide with a trend of N50E and contains magnetite crystals in places (
Figure S3a). Some unmappable units were also observed. It is well exposed in the east of Phalgu river. Apart from this, gabbro is also exposed in and around Nagarjuni hills. A xenolith of this rock type was observed in homophanous biotite granite (
Figure S3b).
- iv.
Anorthosite
The anorthosite is a monomineralic rock mainly composed of plagioclase feldspar. It is medium to fine grained, hard, compact, bluish grey to dark grey in colour rock. It is mineralogically composed of plagioclase feldspar, with a minor amount of hornblende occurring as patches or clots. It is exposed mainly in the form of boulders. Two different types of anorthosite were observed: clotted type with clots of amphiboles and layered type defined by distinct segregation of amphibole grains as layer (
Figure S3c,d). The dominant type is clotted anorthosite, which is bouldery in nature, weathered, and joint planes are filled by quartzo-feldspathic material as veins, which are close spaced, and often shows anastomosing character. At places, it is completely devoid of mafic minerals, rich in feldspar, and highly sheared into powdery clay-like material. Clotted type anorthosite was also observed NW of Nagarjuni hill surrounded by porphyritic biotite granite (
Figure S3e). Mesoscopic xenolith of clotted anorthosite has been observed within homophanous biotite granite (
Figure S3f). Typical clotted anorthosite encountered in the area is located 750 m SW of Patalganga in which the outcrop is a circular pod associated with irregular lenses of magnetite. It forms a linear hillock in the east of Phalgu River. An unmappable unit of gabbroic-anorthosite is intimately associated with anorthosite and at places shows distinct primary igneous layering defined by segregation of mafic minerals. It is coarse to medium-grained, massive, dark grey coloured rock. It is composed of plagioclase feldspar and pyroxene, with plagioclase as the dominant constituent. In places, it contains crystals of magnetite ore. Quartz veins are seen intruding along joint planes, which are found to be sheared, and boudinaged. It is massive and exposed in the East of the Phalgu river.
- v.
Granite
The different varieties of granite are as follows:
- a.
Homophanous biotite granite
These rock type forms the major lithology of the study area. It is very coarse to coarse-grained, leucocratic, and massive in character rock. It is essentially composed of quartz, feldspar, biotite, and with little or no hornblende. Mafic magmatic enclaves (MME) of varying sizes are common features observed in this rock type (
Figure S4a). To the NW of Patal Ganga, this MME is cut across by a quartzo-feldsphatic vein (
Figure S4b). Xenoliths of amphibolite, anorthosite, and gabbro have also been observed within this rock type. It is exposed in the form of boulders and found intimately associated with hornblende granite in the south of Sudamakund hill, Misir Bigha, and SE of Sakir Bigha.
- b.
Porphyritic biotite granite:
This granite contains euhedral phenocrysts of plagioclase laths ranging in size from 2 cm to about 4 cm (
Figure S4c). It is leucocratic, massive in character, and composed of quartz, feldspar, and little biotite. Xenoliths of highly brecciated amphibolite are common features observed in this rock type. It consists of numerous MME. Spheroidal weathering is quite prominent, and it is non-foliated and free from any deformation except some joint planes, well exposed in Nagarjuni caves and east of Nawagarh village. In places, badland weathering features of the granitic terrain were noticed.
- c.
Hornblende granite:
Around the Misir Bigha village and south of Sudamakund hill, medium to fine-grained, melanocratic rock, massive in nature hornblende granite is well exposed, which forms a quite extensive body and is intimately associated with fine grains, extremely sheared silicified granite. It is composed of plagioclase, alkali feldspar, quartz, hornblende, and very few biotite. This granite body is devoid of MMEs and xenoliths, which are prominent characteristics of porphyritic and homophanous biotite granite, which is, exposed in a major part of the area. It contains innumerable epidote-chlorite veins (
Figure S4d).
- vi.
Silicified granite
These fine-grained granitic rocks occurring at the northern part of the area are hard and massive and exhibit conchoidal fractures when broken (
Figure S4e). Mineralogically, it is composed of very fine-grained quartz and feldspar with some mafics. It is highly silicified, mylonitised, and sheared at places trending in the NE-SW direction. Epidote veins are very conspicuous features in this rock type (
Figure S4f). Its northern contact lies against the alluvium, while the southern contact is sharp with the medium-grained hornblende granite.
- vii.
Quartz veins and pegmatites
Quartz veins are usually of small dimensions and not very prominent in the area. They vary in size from a few centimetres to a few metres. They generally occur along the joint planes of granite, which are boudinaged and sheared at places. Pegmatites of dimensions worth mentioning were not encountered in the area; however, pegmatite veins or lenses are occasionally seen intruding into the granitoid country rock.
3.1.2. Petrography
The study area mainly exposes two distinct suites of rocks, namely a granite suite of rocks and a gabbro-anorthosite suite of rocks. Apart from these suites of rocks, amphibolite, and talc tremolite actinolite schist have also been observed. Representative rock samples of these rocks were collected during large-scale mapping and petrographically examined using a Leica microscope at SU: Bihar petrological laboratory.
- i.
Anorthosite
The anorthosite is a monomineralic rock mainly composed of plagioclase feldspar. Mineralogically, it is composed of laths of plagioclase feldspar with a minor amount of hornblende occurring as patches of clots along the intergranular space between prismatic plagioclase crystal (
Figure 6a). The plagioclase composition ranges from An75 to An85, so are bytownite species. Plagioclase feldspar mostly occurs as randomly oriented prismatic subhedral to euhedral laths forming the main mass. These randomly oriented prismatic subhedral to euhedral plagioclase laths define coarse-grained hypidiomorphic granular and cumulus textures (
Figure 6b). Partial termination of twin lamellae, kinking of lamellae, and strained shadows in prismatic plagioclase grain suggest deformation (
Figure 6c). Albite, Carlsbad, and pericline twinning are widely developed; in places, hornblende has altered to epidote (
Figure 6d).
- ii.
Gabbro
The main mineral components of gabbro are pyroxene (augite) and plagioclase with a minor amount of olivine. An ophitic to sub-ophitic texture is well developed in which laths of plagioclase crystals are enclosed by pyroxene as shown in (
Figure 6e). It is a coarse-grained rock, subhedral to euhedral exhibiting cumulus and hypidiomorphic textures. In places, plagioclase crystals show development of sericitization/epidotization (
Figure 6f). Pyroxene is also altered in places; however, the relict pyroxene has been preserved.
- iii.
Amphibolite
Mineralogically, it is characterized by amphibole and plagioclase. It is foliated, as shown by the linear alignment of amphibole mineral (
Figure S5a). It is a medium-grained rock, and in places, the margins of plagioclase laths are sutured. It consists of magnetite as an opaque mineral (
Figure S5b). The amphibole mineral chiefly consists of actinolite showing typical acicular, fibrous nature. The grade of metamorphism this rock has undergone is the lower amphibolite facies.
- iv.
Talc tremolite actinolite schist
Mineralogically, it is composed of tremolite/actinolite, talc and is a fine-grained rock. Talc forms the fine-grained matrix between the prismatic crystals of tremolite/actinolite in this rock. It is well foliated and cleaved into layers. It is crenulated and folded, leading to the development of S1 and S2 planes (
Figure S5c). The grade of metamorphism in which this rock has undergone to lower amphibolite facies.
- v.
Hornblende granite
This rock type is composed of plagioclase, amphibole, alkali feldspar, and a few opaques. Alkali feldspar is represented by anhedral microcline showing cross hatch twinning and orthoclase with occasional Carlsbad twinning. It is a medium-grained rock and exhibits interlocking hypidiomorphic texture. The granophyric texture is very conspicuous and is defined by the intergrowth of quartz and alkali feldspar, which often shows a radiating-like structure (
Figure S5d). The development of perthitic structure is also observed as defined by the intergrowth of sodic and potassic feldspar resulting from subsolidus exsolution (
Figure S5e). In places, hornblende has altered to chlorite. Anhedral quartz with a sutured grained boundary shows undulose extinction, suggesting the development of strained shadows that is attributed to post crystallization deformation.
- vi.
Silicified granite
It is very fine-grained and mineralogically composed of quartz and feldspar with very few hornblendes (
Figure S5f). Hornblende minerals have been altered to chlorite in places. Mylonitic character is very conspicuous, which is defined pervasively as pulverized quartz and feldspar. This rock does not preserve the original grain shapes, indicating that they have experienced high strain deformation.
3.1.3. Petrochemical Studies
- i.
Whole rock analysis
Representative samples were collected for the whole rock analysis of major and trace elements and rare earth elements (REE) of the respective litho-units exposed in the study area. The samples were selected based on the representativeness of major litho-units with respect to magnetite ilmenite mineralization. The major oxides (%) and trace elements (ppm) were analysed by X-ray fluorescence (XRF). The rare earth elements (in ppm) and some of the trace elements (Be, Ge, As, Mo, Cs, Hf, Ta, W, Bi and U) were analysed by Inductively Coupled Plasma Mass Spectrometry (ICP-MS). The samples were collected from a fresh outcrop to avoid apparent alteration and weathering effects. Samples of 500 g of bedrocks were collected, broken into small chips by hammer, and powdered by iron mortar. The powdered samples were then sieved through 120 mesh size simultaneously. Finally, 250 g of powdered samples were coned, quartered, and sent for chemical analysis to Chemical Division, ER, Kolkata. Some magnetite samples were also analysed for major oxides to determine the variation of major oxide content in different magnetite ore bodies of the area. This will help in further exploration work and beneficiation of the magnetite ore.
- ii.
Geochemistry of Granitoid and ultramafic rocks
The granitoid rock is classified as granite both in the silica versus total alkali diagram [
14]
Figure 7a) and R1-R2 plots (
Figure 8a) [
15]. The Na
2O, K
2O, and Al
2O
3 show a positive correlation (SiO
2 increases, other increases). In the REE diagram, silicified granite shows a negative Eu anomaly with some enrichment of LREE, while the biotite granite represents a positive Eu anomaly with HREE enrichment (
Figure S6a).
The mafic-ultramafic suite of rock is the main one seen in the study area, and is represented by gabbro, gabbro-anorthosite, anorthosite, pyroxenite, and amphibolite. It occurs as intrusive as well as enclave forms within granite and homophanous granite. The Harker’s binary variation diagram of SiO
2 versus major oxides for mafic-ultramafic suite of rock is shown in (
Figure S7). The MgO, CaO, TiO
2, and Al
2O
3 show a negative correlation with respect to silica. The mafic-ultramafic rocks are classified as gabbro–diorite in TAS diagram [
14] (
Figure 7b), and gabbro–diorite to gabbro-norite in the R1-R2 plots [
15] (
Figure 8b). In the REE diagram, the gabbro-anorthosite suite of rocks indicate a positive Eu anomaly while amphibolite is showing almost flat REE pattern, while the former is showing HREE enrichment nature (
Figure S6b). This suggests probable mafic igneous parentage of the gabbro-anorthosite suite of rocks with some mantle connection.
3.1.4. Geological Structure
The different types of structural features based on the field observation during mapping of the area are grouped under the following headings: (i) primary structure (ii) secondary structure.
- i.
Primary structure
- a.
Igneous layering
This layering is defined by the segregation of amphibole rich cumulates forming distinct layering in anorthosite and may be considered as primary igneous layering (
Figure 9a). This rarely developed layering trends 60°/19° towards N. Such distinct layering was observed only in the east of Phalgu River and one small hillock 750 m SW of Patal Ganga. It was also recorded in intermixed gabbro magnetite exposure in the northeast of Sudamakund.
- ii.
Secondary structures
- a.
Joints
Prominent sets of three joint planes have developed in silicified granite, hornblende granite, and homophanous biotite granite generally trending 300°/56° towards SW (J1), 50°/67° towards SE, (J2), and E-W (J3) in which J2 follows the same trend of the shear zone (
Figure 9b). Apart from this, one N-S trending vertical joint was also observed along which a quartz vein was emplaced. A rose diagram has been plotted, and it shows that most of the joints trend in the EW alignment (
Figure S8).
- b.
Faults
The evidence of mesoscopic faulting was observed as indicated by slickenlines, and displacement of aplite/quartz veins. To the NE of Naugarh village, pegmatite veins intruding the homophanous biotite granite trends N300W and were displaced by a micro-fault with a sinistral sense of movement (
Figure 9c). One prominent E-W trending movement plane was also observed over which slickensides were developed with development of mineral lineation marked by the needles of amphiboles and chlorite. The small-scale faults observed during fieldwork were not mappable. That is why it is not possible to show these on the map.
- c.
Folds
To the east of Phalgu River, a mesoscopic F1 fold was observed in layered gabbroic anorthositic rock defined by folding of primary igneous layering (
Figure 9d). Further, towards the northeast, highly weathered talc tremolite actinolite schist closely associated with gabbroic anorthositic rock has been deformed and highly crenulated leading to the development of small F2 puckers. The axial trace of this small F2 fold is 235°/73° towards the S, and the associated S1 foliation plane is 305°/55° towards the SW. The plunge of the F2 puckers is 44° towards 340°.
- d.
Shear zone
A discrete shear zone trending in the NE-SW direction passes through the northern Barabar ranges of the study area, which is about 150 m wide and 6 km long. To the west of Barabar hill, and south of Sakir Bigah and Ghasi Bigah, it is highly sheared and deformed, leading to the development of general shear foliation trending 47°/80° SE. Along the joint planes of hornblende granite, the intruding quartz veins are sheared and boudinaged in places leading to the development of a lens-like shape (
Figure 9e). To the NE of Naugarh village, the granitoid rock is extremely mylonitised, leading to the development of the S’-C’ fabric (
Figure 9f). The attitude of S’ plane is 3000 with vertical dip and C’ plane 60° with vertical dip. This mylonitic fabric is again cut across by shear fracture having attitude 300°/55° towards NE. Another prominent shear plane was also observed in clotted anorthosite near Parvatinagar village having general attitude E-W/60° towards S. These shear planes are filled with quartzo-feldsphatic material exhibiting anastomosing character and shows an apparent dextral sense of shear movement.
3.1.5. Metamorphism
A major part of the study area is covered by granitic rocks, which are in the biotite zone of metamorphism. Granitic activity in the area initiated at the culminating period of deformation. The pre-existing rocks were gradually transformed into rocks of granitic composition by the process of metamorphic replacement due to the introduction of granitic melt of deep-seated origin migmatised in places. Retrograde metamorphism has taken place as indicated by epidotization and sericitization in gabbro. The presence of actinolite in amphibolite and tremolite/actinolite in talc tremolite actinolite schist indicates that the rocks were subjected to amphibolite facies.
3.1.6. Minerology of the Ore Zone and Ore Textures
The ore petrographic study (
Figure 10 and
Figure 11) reveals that the body mainly comprises of titaniferous-magnetite with lamellar as well as patchy ilmenite intergrowth within magnetite. The titaniferous magnetite bodies are mainly associated with the gabbroic-anorthosite suit of rocks. The microscopic study reveals that they are dominantly composed of magnetite, ilmenite, and silicate gangue (
Figure 10f and
Figure 11a,b). Overall, the magnetite bands exhibit a polycrystalline granular texture. Coarse to medium polygonal magnetite grains are euhedral/subhedral in shape. Their grain boundaries tend to meet in triple junction points with an interfacial angle of 120° (
Figure 10b).
The magnetite grains are preferentially martitized along grain boundary (
Figure 10b) except in a few places where it is martitized throughout the grain. This martitization is caused by low-temperature oxidation [
16]. Widmanstaten intergrowth structures are visible in magnetite (
Figure 10d). Ilmenite occurs in four modes: (i) as lamellae or blebs within magnetite host; (ii) as individual grains; (iii) within fracture filling veins; and (iv) as intergrowth with magnetite. Most of the magnetite grains contain lamellae or blebs of ilmenite (
Figure 10e), which resulted from the oxidation. Besides finer lamellae, coarse lamellae of ilmenite are also observed within the magnetite host. Thick ilmenite lamellae are observed to be torn apart due to the shearing effect (
Figure 10e).
Development of typical Widmanstatten intergrowth structures defined by three sets of ilmenite intergrowth laths along three sets of cleavage is a very conspicuous feature (
Figure 10c). Often thick ilmenite lamellae are seen to contain exsolved magnetite lamellae (
Figure 11c). Magnetite grains exhibit triple point contact and cumulate texture suggesting that the magnetite grains are primary cumulus grains which crystalize from the ore bearing fluid. Ilmenite occurs as lamellae, blebs, irregular grains within magnetite, and as individual grains where there is no difference in chemical compositional variation. Thus mineralogically, the massive magnetite of this area is, in fact, titaniferous.
Scattered magnetite grains within silicate gangue are frequent (
Figure 10f). Disseminated magnetite grains often show reaction relation with silicates. Martitization of magnetite is relatively low or moderate and mainly restricted at or near the ilmenite and silicate contacts (
Figure 10a). Martitization has also taken place along the crystallographic planes of magnetite. Martite often forms a rim around magnetite (
Figure 10b). Mainly, two generations of magnetite are encountered. The first-generation involves elongated patches of haematite (
Figure 10a), synkinematically formed during the shearing event, and second is the altered one. The homogeneous mass seen under the microscope was found to be composed of submicroscopic intergrowth of ilmenite and magnetite.
Figure 10.
(
a–f) Photomicrographs of thin cum polished section under the microscope showing different minerals and micro-structures [
17].
Figure 10.
(
a–f) Photomicrographs of thin cum polished section under the microscope showing different minerals and micro-structures [
17].
Figure 11.
(a–f) Photomicrographs of thin cum polished section under the microscope showing different minerals and micro-structures.
Figure 11.
(a–f) Photomicrographs of thin cum polished section under the microscope showing different minerals and micro-structures.
3.1.7. Pitting/Trenching
Pitting and trenching (
Figure 12,
Figure 13 and
Figures S11–S14) were carried out across the strike of the exposure zones of mineralization, which were delineated based on surface manifestation. A total of 57 cubic metres was excavated, and 40 samples were collected. The details of pitting/trenching are as follows:
PTR-02: This trench was excavated to find out the strike extension 750 m SW of the Patal Ganga magnetite body, aligned N50° E–S50° W, with a dimension of 3 m × 1.5 m × 1.5 m. It exposes anorthosite which is partly weathered at places along with reddish soil. This body appears to be float type since there is no continuity in-depth (
Figures S11a and S12a).
TRM-04: This trench was excavated to find the strike extension NW of the Patal Ganga magnetite body, aligned N25° W–S25° E, having a dimension of 3.5 m × 1.5 m × 2.5 m. It exposes magnetite rubbles with brownish soil (
Figure S9a,b).
TRA-01: This trench was excavated to find the strike extension to the east of the Phalgu magnetite body, aligned N70° E–S70° W, having a dimension of 2 m × 1 m × 1 m, respectively. This body exposes rubbles of magnetite and anorthosite along with soil (
Figures S11c and S13a).
TRA-02: This trench was excavated to find the strike extension to the east of the Phalgu magnetite body, aligned N40° E–S40° W, having a dimension of 3 m × 1 m × 1 m, respectively. This body exposes rubbles of magnetite along with reddish soil (
Figures S10d and S11b).
TRSK-01: This trench was excavated to find the strike extension NE of the Sudamakund magnetite body, aligned N50° W–S50° E, having a dimension of 3.5 m × 1.5 m × 1 m, respectively. This body exposes rubbles of magnetite and gabbro along with reddish soil (
Figures S10e,f and S12a).
TRNM-02: This trench was excavated to find the strike extension NW of the Ngarjuni hills magnetite body, aligned N60° E–S60° W, having a dimension of 3 m × 1.5 m × 1.5 m, respectively. This body exposes rubbles of magnetite along with soil (
Figure 12a and
Figure S14b).
PTNM-01: This trench has been excavated to find the strike extension NE of the Sudamakund magnetite body, aligned N15° E–S15° W, having a dimension of 4 m × 1 m × 1 m, respectively. This body exposes rubbles of magnetite and anorthosite along with reddish soil (
Figure 12b and
Figure 13).
3.2. Remote Sensing Studies over the Mineralized Zones
An innovative and effective remote sensing methodology was developed to identify potential regional mineral deposits (mineral abundance mapping) using the cloud-free multispectral remote sensing Landsat-8 Operational Land Imager (OLI) data package downloaded from USGS, the Earth Explorer. The satellite image processing methods included: RGB (red, green, blue) combinations, band ratios, spectral band indices, and principal component analysis in ArcMap and ENVI for mineral prospect identification. The results obtained could be further improved by integrating hyperspectral aerial/satellite data in the future.
3.2.1. Landsat Data and Methodology
In the present study, we applied the Landsat-8 OLI data to map the regional alteration pattern to target the prospective areas of finding a deposit, i.e., iron and associated mineral deposit identification. The geoscience communities use Landsat data for various thematic applications, which include lithological, structural, and other issues related to mineral exploration [
18,
19,
20,
21,
22,
23,
24,
25]. Multi-spectral images were used to study signatures of various iron-bearing, sulphide-bearing, clay-bearing minerals, rocks, and soils by several researchers in the past [
23]. The workflow below demonstrates the stepwise process with remote sensing data incorporated in ArcGIS and ENVI environment to generate spectral band indices to identify the mineral-bearing zones.
Band-ratio techniques are widely used, e.g., VNIR is deployed to derive the iron oxide ratio as characteristics absorption feature may be attributed to the electronic processes. The SWIR is suitable to determine the presence or absence of water and hydroxyl (improved moisture content), carbonate, and sulphate. The characteristic absorption features also depend upon the grain size as the scattering and absorption phenomena are dependent upon the grain size. In general, the absorption band is correlated with the abundance of materials. Lithium-bearing minerals like spodumene and lepidolites can be observed by applying band ratio techniques to satellite imagery.
The current remote sensing approach aims to derive the distribution of clay minerals, oxidized iron-bearing sulphides, other ferrous/iron-bearing minerals, and some lithium bearing minerals using multispectral Landsat-8 OLI imagery dated 25 February 2021. The Landsat-8 data was obtained from USGS Landsat repository (Earth Explorer
https://earthexplorer.usgs.gov/ accessed on dated 25 January 2021). The Landsat imagery was corrected for atmospheric effects. The conversion of the DN values to Top-of-the-atmosphere (TOA) Reflectance (not shown here), correction for sun elevation, and Near-surface reflectance (
Figure S13a) were derived to explore the distribution of a group of minerals using well known spectral band-ratio techniques. The derivation of the normalized difference vegetation index (NDVI) over the study region shows high values (NDVI > 0.8) that indicate the presence of dense shrubs and trees in the study region (
Figure S13b). The presence of dense shrubs and trees tends to mask the mineralogical characteristics of the surface. However, open/barren areas show strong signatures for the existence of a specific group of minerals.
3.2.2. Spectral Signatures and Potential Zones
The following band-ratio techniques in (
Table 2) has been tested for the same Landsat-8 OLI imagery:
Clay minerals (clay minerals ratio): the relative distribution of clay minerals was obtained using the band ratio of shortwave-infrared (SWIR 1 and SWIR2 bands) (
Figure 14a). This ratio highlights the presence of clay and alunite in the hydrothermally altered rocks [
29].
Oxidized iron-bearing sulphides (iron oxide ratio): the relative distribution of iron-oxide-bearing minerals was obtained using band ratio of red and blue bands (
Figure 14b). The hydrothermally altered rocks, particularly oxidized iron-bearing sulphides, are highlighted by the band-ratio of red and blue bands [
29,
30].
Other ferrous/iron-bearing minerals (ferrous minerals ratio) were highlighted by the band-ratio of SWIR and Near Infrared (NIR) bands (
Figure 14c,d). This is a commonly used index using multispectral satellites [
29,
30].
Spodumene mineral ratio: the relative distribution of pyroxene mineral consisting of lithium aluminium inosilicate (spodumene) was obtained using the band-ratio of green and NIR bands.
Lepidolite mineral ratio: the relative distribution of lepidolite (mica group of minerals, which is the secondary source of lithium), cookeite, amblygonite, montebrasite were obtained using the band-ratio of red and SWIR2 bands (
Figure S14).
As with any image band, we can arrange them in such a way to extract unique and novel information. This requires the extraction and identification of spectral signatures of objects in an image. In the case of Landsat-8, some of the popular band combinations include natural colour, colour infrared, and various vegetation indexes. The RGB combination in (
Table 3) has also been tested for iron and clay-bearing minerals derived from Landsat-8 imagery dated 25 February 2021, such as composite bands 2-5-7 and 6-5-7.
Principal Component Analysis (PCA) is a multivariate statistical technique used to enhance and separate certain types of spectral signatures from the background [
31,
32]. This technique reduces the redundancy of correlated data by applying a linear transformation [
26,
27]. The subsets chosen for the selective PCA and the target information to extract are presented in
Table 4 and (
Figure S15).
3.3. Geophysical Exploration (Gravity and Magnetic Surveys)
The ground geophysical survey, viz. gravity and magnetic surveys, was carried out by the Geophysics Division, ER. The study area is part of CGC comprising of gabbro, anorthosite, and granitic suits of rocks. Recent geological and petro-mineragraphic studies have shown that the magnetite-ilmenite lenses and bands are associated with gabbro anorthosite within porphyritic massive granite. These bands and lenses of magnetite vary in length from 160 m to 800 m and width ranges from 50 m to 150 m.
Detailed gravity and magnetic (TF) surveys were carried out to identify the geological units and bring out the sub-surface structures that may have a bearing on possible mineralization. The gravity method aimed to study the density contrast resulting from lithological and structural variations in the terrain. While the magnetic method was intended for ascertaining the variation in magnetic response over different geological units.
The geophysical investigations were carried out in different blocks, Block-1 (near Sudamakund/Hathiabore bounded by coordinates 85°3′1.918″ E to 85°3′36.656″ E and 25°0′31.063″ N to 25°1′5.413″ N), Block-2 (near Patalganga/and NW of Nagarjuni hill bounded by coordinates 85°3′23.713″ E to 85°4′36.388″ E and 25°0′19.885″ N to 25°0′58.804″ N) and Block-3 (near Sapneri village bounded by coordinates 85°8′44.676” E to 85°9′40.777″ E and 25°0′27.288″ N to 25°1′18.351″ N). The magnetic surveys were carried out in Block-1 and Block-3 with station intervals 20 m to 50 m and profile intervals 50 to 100 m. Block-2 was covered by gravity and magnetic surveys with a station interval of 10 to 20 m, and a profile interval of 50 to 100 m. The total traverse length covered by the magnetic method was 20 line-km and by gravity method was 4.5 line km. Because of the unavailability of a known gravity base station, an arbitrary base was established, and its value was taken as 9,758,500 mGal. A CG-5 Autograv Gravimeter and Total Field Magnetometer (GSM-19T) were used for gravity and magnetic (TF) surveys. Elevations were measured with DGPS. Gravity and magnetic (GM) maps were prepared on a 1:12,500 scale. The observed geophysical responses over different blocks are discussed here:
The magnetic map of the Block-1 i.e., near Hathiabore shows magnetic values variation between 43,678 nT to 51,356 nT. The map shows high magnetic response (nearly 51,000 nT) aligned in NE- SW direction and low magnetic response (less than 45,000 nT) in central and northern parts. In the central region, intermediate value of nearly 48,000 nT is also present. The high magnetic values trending in the NE-SW direction is well matching with local magnetite-ilmenite mineralization. The central and northern low values may be due to the presence of non-magnetic rocks. The central intermediate value may be due to the weathered magnetic mineral-bearing rocks (
Figure 15a).
The upward continuation technique was applied to enhance deeper features. The technique was applied at various depths. It was observed that magnetic highs start disappearing after a depth of 50 m. This response indicates that the causative source may be extending up to that depth (
Figure 15b).
The magnetic map of Block-2, i.e., the Patalganga area, shows the variation of magnetic values from 42,123.6 nT and 55,625.86 nT. The map shows high magnetic values (more than 50,000 nT) in the south-western part and disseminated high magnetic values in the north-eastern portion. The general trend of high magnetic values was interrupted by the central low magnetic values (less than 43,000 nT). A similar magnetic low was observed in the northern part. This type of response in the central region was observed due to the presence of granite separating the bands of magnetic minerals trending in NE-SW direction. The northern low may be due to the presence of non-magnetic rocks (
Figure 16a).
Upward continuation technique on the data of this area was performed varying depth values by 10 m. Here it was observed that the causative bodies, which appear on the surface in the disseminated form, are shallower features. In contrast, a high magnetic field producing south-western body may be extending deeper than 80 m. (
Figure 16b).
The Bouguer gravity anomaly map of Block-2, i.e., Patalganga area, shows that the anomaly values vary from −430.05 mGal to −423.89 mGal. The gravity highs (nearly −425 mGal) occur in the north-east and south-western part of the block. Intermediate values dominate the central portion. Low gravity values (less than −429 mGal) were observed in the eastern portion. The high gravity values were observed over magnetite. The central intermediate values may be due to non-magnetic material (
Figure 17a).
The upward continued map of the Bouguer gravity data shows density variation with depth. Continuation technique was applied varying depth at 10 m intervals. It was observed that the bodies are causing prominent responses implying their extension beyond a depth of 80 m. (
Figure 17b).
In the magnetic map of the Block-3, i.e., the Sapneri area, magnetic values ranged from 45,387 nT to 50,225 nT. The high magnetic values (more than 47,000 nT) were observed in the north-eastern part and bipolar anomalies in the south-western region. The central portion showed low magnetic values (nearly 46,000 nT). The observed responses can be attributed to the presence of intrusive lenses and bands of magnetic bodies (
Figure 18a).
The upward continued magnetic map of the Sapneri area shows that the disseminated bodies are located at a shallower depth. The prominent high response producing bodies are present in north-eastern and south-western areas and may extend beyond 100 m. (
Figure 18b).
3.4. Geochemical Exploration
3.4.1. Bedrock Sampling (BRS)
The purpose of collecting BRS was to determine the content of elements of economic interest. Here, the main emphasis was to assess the potentiality of magnetite and find out the Fe and Ti content as reported by previous workers of GSI. During sampling, special emphasis was given mainly to the magnetite body. The bed BRS were collected employing grab sampling method as per the requirement. Channel samples were also collected occasionally at a few places from the exposed bedrock across the strike. Representatives BRS were collected from all the major five magnetite bands. A total of 70 bedrock samples (BRS-1 to BRS-70) was collected from the field.
3.4.2. Methodology of Geochemical Exploration
Small chips of bedrock sample (2 kg approx.) were collected, broken into smaller chips with the help of a hammer, powdered with the help of iron mortar and pestle, and sieved through 120 mesh sieves. After sieving, coning, and quartering was done. These prepared samples were packed in polythene bags; 250 g each was sent to the Chemical Division, ER, Kolkata for the chemical analysis. Another was preserved as duplicate samples at Samples Repository, GSI, Patna for future use.
3.4.3. Statistical Analysis of Geochemical Data
For 70 magnetite samples, analytical results were received except for some parts. The major element data for the different ore bodies shows content of high Fe(T) from 25.85 to 60.78%, considerable amount of TiO
2 from 1.47 to 26.77%, and low amount of SiO
2 from 0.50 to 40.05% (40.05% only in sample number BRS-33), Al
2O
3 from 2.41 to 16.74%, and very low P
2O
5 from <0.01% to 0.13%, MnO from 0.16 to 0.54%, MgO from 1.59 to 10.66%, CaO from 0.06 to 8.81%, Na
2O from 0.13 to 0.98% and very low K
2O from 0.02 to 0.33% (
Table 5).
3.4.4. Strike, Length, and Width of the Magnetite Body
- i.
NE of Sudamakund
This magnetite body has a dimension of about 800 m × 200 m, occurring as a block with an apparent trend of NE-SW.
- ii.
NW of Patal Ganga
This magnetite body occurs as a lens exposed in the form of boulders trending in NE-SW direction having a dimension of about 500 m × 100 m.
- iii.
NW of Nagarjuni hill
The apparent trend of this body is NE-SW having a dimension of 500 m × 100 m. It is well exposed in the Lalpahari hillock (local name).
- iv.
750 m SW of Patal Ganga
This magnetite body occurs as a pod, likely to be float type having a dimension of about 150 m diameter.
- v.
East of Phalgu River
The dimension of this magnetite body is about 200 m × 40 m having an apparent trend of NW-SE direction.
Band wise statistical analysis can be given as follows (
Table 5).
The analytical value for V (vanadium) is received only for a few PTS samples. The value ranges from 30.00 ppm to 256.00 ppm, whereas the average value is 144.79 ppm.
4. Integration of Geological, Geochemical, and Geophysical Data, and Interpretation
The mapped area exposes major magmatic suites of rocks: granitoids and gabbro-anorthosite suites with associated magnetite mineralization. However, the area also suffered metamorphism from greenschist to amphibolite facies along with shear zone development followed by retrogressive metamorphism. The granitoids are of three variants represented by homophanous biotite granite, porphyritic biotite granite, and hornblende granite. Apart from these variants, highly silicified, sheared, and fine-grained granite was also mapped as a long linear body in the northern part of the study area, forming a prominent shear zone trending in the NE-SW direction. The gneissic amphibolite and massive amphibolite enclaves are associated with a small unmappable exposure of migmatitic gneiss near Patalganga, indicating high-grade metamorphism. An unmappable thin linear lens of talc-tremolite-actinolite schist of greenschist facies having a trend of NW-SE is exposed in the area east of Phalgu river associated with a gabbro-anorthosite suite of rocks. In the area east of Phalgu River, in contrast to the western part, only gabbro anorthosite suite of rocks are exposed as long linear bodies along with the magnetite lenses, hitherto unreported, having a NW-SE trend and some ultramafic rocks. Interestingly, there is no granitoid exposure in this part of the mapped area.
Magnetite mineralization was found to be closely associated with a granitoid suite of rocks in the western part along with some gabbro-anorthosite suite, and in the area east of Phalgu river, magnetite ore lenses occur exclusively within a gabbro-anorthosite suite of rocks with some ultramafics. The magnetite lodes are exposed in the form of boulders and blocks and define the bands and lenses on the surface. Five magnetite ore bodies were mapped, amongst which four ore bodies have a NE-SW trend with the one east of Phalgu having a NW-SE trend. The length of these magnetite ore bodies varies from 200 m to 800 m, and width ranges from 40 m to 200 m. The magnetite ore is hard, compact, crystalline, and at some places granular in nature.
Interestingly, these magnetite ore bodies have trends that match the major lineament, i.e., NE-SW and NW-SE, and the major shear zone of the mapped area is also trending NE-SW. The close association of the magmatic gabbro-anorthosite suite of rocks and granitoid suites, associated magnetite ore bodies, and petrographic features of gabbro-anorthosite and magnetite with prominent euhedral crystals defining interlocking, cumulus texture, all indicate the magmatic nature of the magnetite ore. However, the mineralization is also controlled by the major shear zone and regional tectonic features. Thus, this study demonstrates both lithological and structural controls of magnetite mineralization.
The analytical value of these magnetite ore bodies indicates total Fe% from 25.85 to 60.78% with an average of 49.53%. TiO2 is present in a considerable amount ranging from 1.47 to 26.77% with an average value of 15.85%. The chemical analysis for vanadium is only received for a few PTS samples. The value of V in these PTS ranges from 30.00 ppm to 256.00 ppm, with an average value of 144.79 ppm. Interestingly, all these magnetite ore bodies have low SiO2 (0.50 to 17.72% with an exception of 40.05%); low Al2O3 (2.51 to 16.74%); low P2O5 (<0.01 to 0.18%); low Na2O (0.13 to 0.98%); low K2O (0.02 to 0.33%); low MnO (0.16 to 0.54%); low CaO (0.06 to 8.81%); and low to moderate MgO content (1.59 to 10.66%). The moderately high MgO suggests the association of magnetite ore bodies with ultramafics. The National Geochemical Mapping (NGCM) work by GSI has been carried out over the study area, and the report is yet to be circulated.
The officers of the Geophysics Division, Eastern Region (ER) have carried out ground geophysical gravity and magnetic surveys on 1:12,500 scale in selected blocks viz. Block-1, Block-2, and Block-3.
According to the Geophysics Division, Eastern Region (ER), during the surveys and data analyses, an upward continuation technique was applied to enhance deeper features. The technique was applied at various depths. It was observed that magnetic highs start disappearing after a depth of 50 m near Hathiyabore/Sudamakund (Block-1,
Figure 15b). Near Patal Ganga (Block-2,
Figure 16b), it was observed that the causative bodies which appear on the surface in disseminated form are shallower features. In contrast, high magnetic field producing south-western body may extend deeper than 80 m. The upward continued map of the Bouguer gravity data shows density variation with depth. A continuation technique was applied, varying depth at 10 m intervals. It was observed that the bodies causing prominent responses may extend beyond a depth of 80 m. The upward continued magnetic map of Sapneri area (Block-3,
Figure 18b) shows that the disseminated bodies are located at a shallower depth. The prominent high response producing bodies present in north-eastern and south-western part of the area may extend beyond 100 m.
The Geophysics Division, ER has provided the block wise shape files (with shp extension) of the gravity and magnetic contour maps. For integrated analysis, the geophysical survey blocks were superimposed over the 1:12,500 scale geological map for better understanding of the magnetic and gravity anomaly vis-à-vis lithological and structural controls, and depiction of the probable extension of magnetite ore bodies in the alluvium cover areas (
Figures S2, S16 and S17). In all the blocks, it was observed that the magnetic contours showing high values (i.e., magnetic highs) are very well matched with the disposition of magnetite ore bodies (
Figures S15, S16 and S18) and the trend of the magnetite ore bodies almost follows the magnetic anomaly axis. There are some high magnetic contours over the alluvium cover areas which indicates the presence/probable extension of the magnetite ore bodies below the alluvium cover. The high-value gravity contours (highs) in Block-2 probably indicates the presence of gabbro-pyroxenite/high density rock in the deeper parts (
Figure S18).
The integrated geological map with magnetite ore bodies along with ground geophysical magnetic and gravity anomaly in different blocks are shown below:
5. Mineral Prospects
5.1. Surface Manifestation, and Nature of Mineralization
On the surface, during mapping, it was observed that the magnetite ore bodies are exposed as boulders, blocks, pods, lumps and defining some linear disposition in the form of band or lens having some definite geographical trend. The magnetite ore is hard, compact, and crystalline, and the ore bodies vary in length from 200 m to 800 m with width ranging from 40 m to 200 m. It was found to be closely associated with gabbro-anorthosite and granitoid suite of rocks. In the present investigation, five magnetite bodies were mapped and delineated. In the eastern part of the Phalgu river area, the nature of the magmatic complex was very clear where anorthosite was exposed, hitherto unreported, along with a long linear gabbro body. This suite of rocks was closely associated with lenses of the magnetite body.
5.2. Mode of Occurrence and Control of Mineralization
The magnetite lodes occur within the gabbro-anorthosite suite and granitoid suite of rocks exposed in the form of boulders and blocks and defining the bands and lenses on the surface. Based on the field observation, it was clear that the magnetite body occurs as two distinct modes, firstly as large xenolithic/bouldery bodies within the granitoid suite (
Figure S19b), and gabbro-anorthosite suite of rocks and secondly as layers formed by magnetite grains within anorthosite and gabbro suite of rocks (
Figure S19a). The magnetite lodes also occur as bands and lenses at places. The interlayer type was recorded near Sudamakund whereas large xenolithic body within porphyritic granite was observed at NW of Nagarjuni hills.
The association of this suite of rocks and petrographic features (with specific textures) indicate the magmatic nature of the magnetite ore. Further, these magnetite ore bodies have trends that match the major lineament, i.e., NE-SW and NW-SE, and the major shear zone of the mapped area was also trending NE-SW. However, the mineralization was also controlled by the major shear zone and regional tectonic features. Thus, magnetite mineralization’s lithological and structural control is very well depicted in the present study.
5.3. Details of Mineralization
During mapping, five major magnetite bodies were delineated as follows:
This magnetite body has a dimension of about 800 m × 200 m, occurring as a block with an apparent trend of NE-SW. It was found associated with gabbro and homophanous biotite granite. It is crystalline in nature, hard, compact, and exhibits lead grey metallic lustre (
Figure S19c). In this magnetite body, total Fe varies from 25.85% to 52.04%, TiO
2 from 2.93% to 26.77%, SiO
2 varies from 0.99% to 40.05%, Al
2O
3 from 2.63% to 16.52% and P
2O
5 from 0.01 to 0.18% (
Table 5).
- ii.
NW of Patal Ganga
This magnetite body was found to be associated with anorthosite, gabbro, and homophanous biotite granite occurring as lens exposed in the form of boulders (
Figure S19d,e). It is hard, compact, and crystalline in nature (
Figure S19f), with a NE-SW trend having a dimension of about 500 m × 100 m. In this magnetite body, total Fe varies from 47.70% to 52.67%; TiO
2 varies from 16.41% to 26.10%, SiO
2 varies from 1.68% to 3.51%; Al
2O
3 varies from 2.99% to 5.10%, and P
2O
5 less than 0.01 to 0.03% (
Table 5).
- iii.
NW of Nagarjuni hill
The apparent trend of this body is NE-SW having a dimension of 500 m × 100 m. It is well exposed in the Lalpahari hillock (local name), and the magnetite is crystalline, hard, compact and was found to be associated with anorthosite, gabbro and homophanous biotite granite (
Figure 19a,b). Total Fe varies from 44.40% to 53.57%, TiO
2 varies from 19.76% to 21.94%, SiO
2 varies from 0.50% to 4.942%, Al
2O
3 varies from 2.52% to 4.70%, and P
2O
5 varies from 0.01 to 0.03% (
Table 5).
- iv.
750 m SW of Patal Ganga
This magnetite body occurs as a pod, likely to be float type found associated with sheared clotted anorthosite. It is hard, crystalline, and bouldery in nature, having a dimension of about 150 m in diameter. Total Fe varies from 47.09% to 54.21%, TiO
2 varies from 13.52% to 20.14%, SiO
2 varies from 1.35% to 3.98%, Al
2O
3 from 2.41% to 6.08%, and P
2O
5 is less than 0.01 (
Table 5).
- v.
East of Phalgu River
The dimension of this magnetite body is about 200 m × 40 m having an apparent trend of NW-SE direction. It was found associated with clotted anorthosite, gabbroic anorthosite, and metagabbro. It is granular in nature, less crystalline, and associated with some gangue minerals (
Figure 19d–f). In this magnetite body, the variation of total Fe varies from 35.27% to 60.78%, and TiO
2 varies from 1.47% to 10.50%, whereas SiO
2 varies from 0.87% to 17.72%, Al
2O
3 varies from 4.67% to 16.74% and P
2O
5 varies from 0.01 to 0.02% (
Table 5).
The analytical value of these magnetite ore bodies indicates total Fe% from 25.85 to 60.78% with an average of 49.53%, considerable amount of TiO2 ranges from 1.47 to 26.77% with an average value of 15.85%. The chemical analysis for vanadium was only received for a few PTS samples. The value of V in these PTS samples ranged from 30.00 ppm to 256.00 ppm with an average value of 144.79 ppm. Interestingly, all these magnetite ore bodies have low SiO2 (0.50 to 17.72% with the exception of 40.05%); low Al2O3 (2.51 to 16.74%); low P2O5 (<0.01 to 0.18%); low Na2O (0.13 to 0.98%); low K2O (0.02 to 0.33%); low MnO (0.16 to 0.54%); low CaO (0.06 to 8.81%); and low to moderate MgO content (1.59 to 10.66%).
6. Summary and Conclusions
Using large scale geological and structural mapping (1:12,500 scale) as well as analysis of bedrock samples (BRS), pit/trench samples (PTS), petrographic samples (PS), and petrochemical samples (PCS), a reconnaissance survey for magnetite-ilmenite mineralization was conducted in parts of toposheet 72G/04, Gaya and Jehanabad districts, Bihar. Further, at the same scale, ground geophysical gravity and magnetic surveys were conducted in selected blocks by the Geophysics Division, ER. Finally, data from geological, geochemical, remote sensing, and geophysical sources were integrated to form conclusions and recommendations.
The mapped area exposes granitoids and gabbro-anorthosite suites with magnetite mineralization. The three variants of granitoids are: homophanous biotite granite, porphyritic biotite granite, and hornblende granite. The study area’s northernmost shear zone was mapped as a long linear body of highly silicified, sheared, very fine-grained granite. There is a small unmappable exposure of migmatitic gneiss near Patalganga that is associated with the gneissic amphibolite and massive amphibolite enclaves. Exposed thin linear lens of talc-tremolite-actinolite schist with NW-SE trending associated with gabbro-anorthosite suite of rocks east of Phalgu river. Unlike the western part, only gabbro anorthosite suite of rocks are exposed as long linear bodies along with magnetite lenses, previously unreported, trending NW-SE and some ultramafic rocks.
The salient conclusive features of the present investigation are as follows:
- i.
Five major and potential magnetite ore bodies (length of 200 m to 500 m and width of 40 m to 200 m) were mapped and delineated. Amongst these five magnetite bodies, four bodies are promising. However, due to the presence of ancient caves and temples, two of the magnetite ore bodies (NE of Sudamakund and NW of Patal Ganga) are classified as archaeological heritage sites.
- ii.
Magnetite bodies are hard, compact, and crystalline. They are granular in some places. The analytical value from magnetite ore bodies indicates that the average total Fe and TiO2 content was 49.53%, and 15.85%, respectively. The average V from PTS was 144.79 ppm (range: 30.00 ppm to 256.00 ppm).
- iii.
The magnetite ore bodies trend NE-SW and NW-SE. The major magnetite ore bodies are disposed NE-SW, matching the major regional lineaments, and the Son-Narmada lineament. A ductile-brittle shear zone (6 km long, 150 m wide) has the same NE-SW trend.
- iv.
The petrographic features of gabbro-anorthosite and magnetite ore with prominent euhedral crystals defining interlocking, cumulus texture indicate the magmatic nature of the magnetite ore. However, the major shear zone and regional tectonic features also control the mineralization. It illustrates both lithological and structural control of magnetite mineralization.
- v.
From satellite data, it was possible to see evidence of altered rocks (clay bearing minerals) surrounding oxidized iron-bearing sulphides and other iron-bearing minerals. The remote sensing maps revealed a potential association between alunite (clay mineral), spodumenes, lepidolites, and cookeites that can be further explored using hyperspectral imageries.
- vi.
Ground geophysical gravity and magnetic surveys on selected blocks (Block 1, 2, and 3) were conducted by the Geophysics Division, ER. The upward continuation technique that enhances the deeper features show that near Hathiyabore/Sudamakund (Block 1), magnetic highs start to fade after 50 m. Near Patal Ganga (Block-2), the causative bodies that appear on the surface are shallower. A south-western body with a strong magnetic field may extend deeper than 80 m. The Bouguer gravity upward continued map shows density variation with depth. The bodies causing significant responses were seen to extend beyond 80 m. In Block-3, the disseminated bodies are located at a shallower depth. The high response producing bodies in the area’s northeast and southwest may extend beyond 100 m.
- vii.
The magnetic and gravity anomaly maps superimposed on the geological layers reveals the probable extension of magnetite ore bodies in alluvium cover areas. Magnetite ore bodies were well matched to magnetic highs in all blocks, with the magnetite ore bodies almost following the magnetic anomaly axis.
The two magnetite ore bodies (northwest of Nagarjuni hill and east of Phalgu River) are recommended for further studies (including drilling) and the G-3 stage of magnetite exploration. Interestingly besides the potential for TiO2 and V, the maximum total Fe content for the two proposed potentially economically important magnetite ore bodies is over 45 percent, which is the cut-off value (by Indian Bureau of Mines, IBM) for low-grade iron ore. These magnetite ore bodies’ sub-surface (horizontal and vertical) extension should be investigated.
Supplementary Materials
The following supporting information can be downloaded at
https://www.mdpi.com/article/10.3390/min12070860/s1, Figure S1. Geological set-up of the northern part of Chhotanagpur Gneiss Complex (CGC) area (Geol. Sur. Ind. Misc. Pub, 30, 2010). The present study area is shown as a red color-filled rectan-gular box; Figure S2. Geological map integrated with ground geophysical magnetic anomaly map of Block -3 near Sapneri area (1:12,500 scale); Figure S3. Field photographs showing: (a) long linear bouldery exposure of metagabbro (700m × 100 m) at east of Sapneri village, (b) gabbro xenolith occurring within homophanous biotite granite at the southeast of Mahadeo temple, (c) clotted type anorthosite with clots of amphiboles, 750m SW of Patal Ganga, (d) layered anorthosite defined by distinct segregation of amphibole grains as layer near Sapneri village, (e) bouldery nature of anorthosite surrounded by homophanous biotite granite at NW of Nagarjuni hill, (f) xenolith of clotted anorthosite occurring within homophanous biotite granite at the east of Patal Ganga; Figure S4. Field photographs showing: (a) number of MME’s occurring within homophanous biotite granite at the north of Patal Ganga (b) MME within homophanous biotite granite which is cut across by thin quartzofeldspathic vein at NW of Patal Ganga, (c) porphyritic biotite granite with plagioclase laths ranging in size fron 2cm to 4cm at east of Nagarjuni hill, (d) epidote veins traversing hornblende granite at the south of Misir Bigha (e & f) highly silicified granite exhibiting conchoidal fracture and traversed by epidote vein at south of Daulatpur village; Figure S5. Photomicrographs showing: (a) alignment of actinolite in amphibolite defining prominent foliation, (b) occurrence of magnetite in amphibolite, (c) crenulated talc tremolite actinolite schist showing prominent S1 and S2 foliation plane, (d) granophyric texture in hornblende granite, (e) microcline showing perthitic texture in hornblende granite, and (f) very fine-grained highly sheared silicified granite. Figure S6. (a) REE plot of granitoid rock of Barabar and Sapneri area, Jhanabad district, Bihar. (b) REE plot of Mafic-ultramafic rocks of Barabar and Sapneri area, Jhanabad district, Bihar. Figure S7. Harker Variation Diagram shows SiO2 Vs. TiO2, Al2O3, MgO, CaO, Na2O, K2O, P2O5, and FeO plot of mafic-ultramafic suite. Figure S8. Rose diagram of major joints in different lithounits (J1data shows NW-SE, J2 data shows NE-SW, were as J3 data shows EW direction). Figure S9. (a) Litholog of trench number PTR-02 showing variation of Fe(T)% and TiO2%, (b) Litholog of trench number TRM-04 showing variation of Fe(T)% and TiO2%. Figure S9. (a) Litholog of trench number PTR-02 showing variation of Fe(T)% and TiO2%, (b) Litholog of trench number TRM-04 showing variation of Fe(T)% and TiO2%. Figure S10. Field photographs showing: (a) Trench number PTR-02 North of Ramnath Bigha, (b) Trench number TRM-04, SE of Mahadeva Temple, (c) Trench number TRA-01 Phalgu, (d) Trench number TRA-01 Phalgu, (e) and (f) Trench number TRSK-01 NE of Sudamakund. Figure S11. (a) Litholog of trench number TRA-01 showing variation of Fe(T)% and TiO2%, (b) Litholog of trench number TRA-02 showing variation of Fe(T)% and TiO2%. Figure S12. (a) Litholog of trench number TRSK-01 showing variation of Fe(T)% and TiO2%, (b) Litholog of trench number TRNM-02 showing variation of Fe(T)% and TiO2%. Figure S13. As derived from Landsat 8 imagery dated 2021.02.25: (a) True color composite (bands 4,3,2) around study area using Near-surface Reflectance (with atmospheric correction), and (b) High vegetation density and shrub areas (highlighted in greenish color, NDVI > 0.8) over the study region masks the signature of minerals from the rocks, and sediments. Figure S14. The potential rich zones around the study areas (marked as two rectangular boxes), based on band-ratios, of (a) Spodumene (reddish color), (b) Lepidolite minerals (bluish color: cookeite, amblygonite, montebrasite), and (c) Goethite and halloysite (brownish color) as derived from Landsat 8 imagery dated 25 February 2021. Figure S15. (a) RGB Combination for highlighting Iron and Clay bearing minerals, (b) selective PCA highlighting ferric iron minerals rich zones, and (d) selective PCA highlighting hydroxyl minerals rich zones over the study region (marked as two rectangular boxes) as derived from Landsat-8 imagery dated 25 February 2021. Figure S16. Geological map integrated with ground geophysical magnetic anomaly map of Block -1 near Sudamakund area (1:12,500 scale). Figure S17. Geological map integrated with ground geophysical magnetic anomaly map of Block -2 around Mahadeo Temple near Patal Ganga and Nagarjuni hill areas (1:12,500 scale). Figure S18. Geological map integrated with ground geophysical magnetic anomaly map of Block-2 around Mahadeo Temple near Patal Ganga, and Nagarjuni hill areas (1:12,500 scale). Figure S19. Field photographs showing: (a) intermixed gabbro and magnetite showing primary layering at SE of Sudama Kund, (b) view of magnetite body surrounded by homophanous biotite granite, NW of Patal Ganga, (c) fracture magnetite body at SE of Sudamakund, (d) huge xenolith of magnetite body within homophanous biotite granite, (e) magnetite ore closely associated with gabbro at NW of Patal Ganga, and (f) closure view of hard, compact crystalline magnetite at NW of Patal Ganga.
Author Contributions
Conceptualization, A.M.; methodology, A.M., A.K.P. and K.-u.W.; software, A.M.; formal analysis, A.M., A.K.P., K.-u.W., M.A., V.A. and H.E.-A.; investigation, A.M. and K.-u.W.; resources, A.M., K.-u.W., H.E.-A.; data curation, A.M.; writing—original draft preparation, A.M.; writing—review and editing, A.M., A.K.P., K.-u.W., M.A., V.A. and H.E.-A.; visualization, A.M.; supervision, A.M., A.K.P. and H.E.-A.; project administration, A.M.; funding acquisition, A.M. and H.E.-A. All authors have read and agreed to the published version of the manuscript.
Funding
A.M. is grateful to GSI (ME/ER/BR/2016/004, Field Season: 2016-17) for the support related to the fieldwork and laboratory analyses.
Institutional Review Board Statement
Not applicable.
Informed Consent Statement
Not applicable.
Data Availability Statement
The name of the source(s) and download link(s) of the space-based Landsat dataset used in this study is mentioned in
Section 3.2.
Acknowledgments
The authors express their gratitude to the Director General, Geological Survey of India (GSI), and H.O.D. Eastern Region, Kolkata. The authors express heartfelt gratitude to Shri Sanjay Kumar Dutta, Dy. Director General; Rajesh Asthana, Dy. Director General (Retired), and Shri Somnath Chandel, Ad. Director General (Retired), G.S.I., for their kind support and valuable guidance under whose direction the field assignment was initiated and completed. With utmost reverence and a deep sense of admiration, the authors express gratitude and indebtedness to Shri Sukhendu Ray, Director (Geology), for his guidance in executing the field assignment and also for rendering valuable suggestions and technical advice during headquarter based work. The support received from him in scrutiny of the report and rendering its present state is deeply acknowledged. The authors acknowledge support from the Chemical Division, Eastern Region (ER), for related geochemical data/analysis (personal communication). The authors also acknowledge support from the Geophysics Division, ER, for geophysical data, maps, and interpretation (personal communication). The authors are thankful to Anubhav Shukla, research scholar, IIT(ISM) Dhanbad, for extending help in organizing and formatting the manuscript. The authors are thankful to all their colleagues and individuals who helped them directly or indirectly during the work.
Conflicts of Interest
The authors declare no conflict of interest.
References
- Ghosal, A.K.; Kumar, Y. A Report of the Geological Studies along Son Lineament and Adjoining Areas Falling in Parts of Palamau, Arungabad, Gaya, Nalanda.Hazaribagh and Giridih Districts of Bihar; Geological Survey of India: Kolkata, India, 1984; 54p, Unpublished Report.
- Mukherjee, D. Report on Tectono-Magmatic Evolution of Gaya-Sudamakund Area in Gaya and Jehanabad Districts, Bihar and Associated Magnetite-Ilmenite Mineralization; Geological Survey of India: Kolkata, India, 2010; Unpublished Report.
- Mohammad, A.; Wetsah, K. Final Report on Reconnoitory Survey for Magnetite-Ilmenite Mineralisation in Gaya-Bela Area, Gaya and Jehanabad Districts, Bihar; Geological Survey of India: Kolkata, India, 2017; Unpublished Report.
- Ringphami, A.; Wetsah, K. Report on Preliminary Exploration for Vanadium Bearing Magnetite-Ilmenite Mineralisation around the Areas Northeast of Patal Ganga and Sapneri Villages, Jehanabad and Gaya Districts, Bihar; Geological Survey of India: Kolkata, India, 2020; Unpublished Report.
- Ghose, N. Chhotanagpur Gneiss-Granulite Complex, Eastern India: Present Status and Future Prospect. Indian Jour. Geol. 1992, 64, 100–121. [Google Scholar]
- Chatterjee, N.; Ghose, N.C. Extensive Early Neoproterozoic High-Grade Metamorphism in North Chotanagpur Gneissic Complex of the Central Indian Tectonic Zone. Gondwana Res. 2011, 20, 362–379. [Google Scholar] [CrossRef]
- Mukhopadhyay, P.; Ray, S.; Saran, R.; Huin, A. A Status Report on the Geology, Structure, Metamorphism, Petrology, Mineral Chemistry, Petrochemistry, Geochemistry and Geochronology and Economic Potentiality of the Major Units of Chhotanagpur Gneissic Complex in West Bengal, Jharkhand and Bihar, Eastern India (SER/ER/HQ/2008/013); Geological Survey of India: Kolkata, India, 2011; Unpublished Report.
- Mallik, A.K. Mineralogy and Temperature of Formation of Titaniferous Magnetite Ores Associated with Gabbro in the Moulabhanja Parbat Area, Dhenkanal District, Orissa; Geological Survey of India: Kolkata, India, 1968; Unpublished Report.
- Bhattacharyya, B.P. Report on the Petro-Minerological Study of the Mica Pegmatites and Associated Rocks of the Bihar Mica Belt; Geological Survey of India: Kolkata, India, 1982.
- Das, S.; Mukherji, S. Mineralogy and Geochemistry of V-Ti Magnetite Deposits of Mayurbhanj Basic Igneous Complex, Orissa. Indian Mineral. 2001, 35, 134–150. [Google Scholar]
- Singh, S. Early Precambrian Stratigraphy of the Chotanagpur Province. Precambrian Crustal Evol. Metallog. India 2001, 127–137. [Google Scholar]
- Dayal, N. Report on the Systematic Geological Mapping in Parts of Gaya District, Bihar; Geological Survey of India: Kolkata, India, 1983; Unpublished Report.
- Mukherjee, D.; Ghose, N.C. Precambrian Anorthosites within the Chhotanagpur Gneissic Complex; Geological Survey of India: Kolkata, India, 1992; Unpublished Report.
- Cox, K.; Bell, J.; Pankhurst, R. The Interpretation of Igneous Rocks; George Allen and Unwin: London, UK, 1979; p. 450. [Google Scholar]
- De la Roche, H.; de Leterrier, J.T.; Grandclaude, P.; Marchal, M. A Classification of Volcanic and Plutonic Rocks Using R1R2-Diagram and Major-Element Analyses its Relationships with Current Nomenclature. Chem. Geol. 1980, 29, 183–210. [Google Scholar] [CrossRef]
- Roy, S. Origin of the Vanadium Bearing Titaniferous Magnetite Ores of Mayurbhanj, India. Proc. Nat. Inst. Sci. India 1956, 23, 285–292. [Google Scholar]
- Mohammad, A.; Wetsah, K. Titaniferous Magnetite-Ilmenite Mineralisation in Makhpa-Barabar and Sapneri Area, Gaya and Jehanabad Districts, Bihar. In Vaigyanik Sangoshthee Saransh Pushtika At. Miner. Dir. AMD ER Jamshedpur Jharkhand, Vaigyanik Sangoshthee Saransh Pushtika 2018; AMD Publication: Santa Clara, CA, USA, 2018; p. 63. [Google Scholar]
- Abdelsalam, M.G.; Stern, R.J.; Berhane, W.G. Mapping Gossans in Arid Regions with Landsat TM and SIR-C Images: The Beddaho Alteration Zone in Northern Eritrea. J. Afr. Earth Sci. 2000, 30, 903–916. [Google Scholar] [CrossRef]
- Boccaletti, M.; Bonini, M.; Mazzuoli, R.; Abebe, B.; Piccardi, L.; Tortorici, L. Quaternary Oblique Extensional Tectonics in the Ethiopian Rift (Horn of Africa). Tectonophys 1998, 287, 97–116. [Google Scholar] [CrossRef]
- Ferrier, G.; White, K.; Griffiths, G.; Bryant, R.; Stefouli, M. The Mapping of Hydrothermal Alteration Zones on the Island of Lesvos, Greece Using an Integrated Remote Sensing Dataset. Int. J. Remote Sens. 2002, 23, 341–356. [Google Scholar] [CrossRef]
- Fraser, A.; Huggins, P.; Rees, J.; Cleverly, P. A Satellite Remote Sensing Technique for Geological Structure Horizon Mapping. Int. J. Remote Sens. 1997, 18, 1607–1615. [Google Scholar] [CrossRef]
- Gad, S.; Kusky, T. Lithological Mapping in the Eastern Desert of Egypt, the Barramiya Area, Using Landsat Thematic Mapper (TM). J. Afr. Earth Sci. 2006, 44, 196–202. [Google Scholar] [CrossRef]
- Sabins, F.F. Remote Sensing for Mineral Exploration. Ore Geol. Rev. 1999, 14, 157–183. [Google Scholar] [CrossRef]
- Schetselaar, E.M.; Chung, C.-J.F.; Kim, K.E. Integration of Landsat TM, Gamma-Ray, Magnetic, and Field Data to Discriminate Lithological Units in Vegetated. Remote Sens. Environ. 2000, 71, 89–105. [Google Scholar] [CrossRef]
- Yesou, H.; Besnus, Y.; Rolet, J. Extraction of Spectral Information from Landsat TM Data and Merger with SPOT Panchromatic Imagery a Contribution to the Study of Geological Structures. ISPRS J. Photogramm. Remote Sens. 1993, 48, 23–36. [Google Scholar] [CrossRef]
- Ali, A.S.; Pour, A.B. Lithological Mapping and Hydrothermal Alteration Using Landsat 8 Data: A Case Study in Ariab Mining District, Red Sea Hills, Sudan. Int. J. Basic Appl. Sci. 2014, 3, 199. [Google Scholar] [CrossRef]
- Mia, B.; Fujimitsu, Y. Mapping Hydrothermal Altered Mineral Deposits Using Landsat 7 ETM+ Image in and around Kuju Volcano, Kyushu, Japan. J. Earth Syst. Sci. 2012, 121, 1049–1057. [Google Scholar] [CrossRef] [Green Version]
- Pour, A.B.; Hashim, M. Hydrothermal Alteration Mapping from Landsat-8 Data, Sar Cheshmeh Copper Mining District, South-Eastern Islamic Republic of Iran. J. Taibah Univ. Sci. 2015, 9, 155–166. [Google Scholar] [CrossRef]
- Drury, S. Image Interpretation in Geology; Allen &Unwin: London, UK, 1987. [Google Scholar]
- Segal, D.B. Use of Landsat Multispectral Scanner Data for the Definition of Limonitic Exposures in Heavily Vegetated Areas. Econ. Geol. 1983, 78, 711–722. [Google Scholar] [CrossRef]
- Gabr, S.; Ghulam, A.; Kusky, T. Detecting Areas of High-Potential Gold Mineralization Using ASTER Data. Ore Geol. Rev. 2010, 38, 59–69. [Google Scholar] [CrossRef]
- Moradi, M.; Basiri, S.; Kananian, A.; Kabiri, K. Fuzzy Logic Modeling for Hydrothermal Gold Mineralization Mapping Using Geochemical, Geological, ASTER Imageries and Other Geo-Data, a Case Study in Central Alborz, Iran. Earth Sci. Inform. 2015, 8, 197–205. [Google Scholar] [CrossRef]
- Kwarteng, P.; Chavez, A. Extracting Spectral Contrast in Landsat Thematic Mapper Image Data Using Selective Principal Component Analysis. Photogramm Eng. Remote Sens. 1989, 55, 339–348. [Google Scholar]
- Loughlin, W. Principal Component Analysis for Alteration Mapping. Photogramm. Eng. Remote Sens. 1991, 57, 1163–1169. [Google Scholar]
Figure 1.
The regional geological map of Bihar, India, and the location of the study area (marked out as a red colour-filled rectangle) (Mukhopadhyay et al., 2011).
Figure 1.
The regional geological map of Bihar, India, and the location of the study area (marked out as a red colour-filled rectangle) (Mukhopadhyay et al., 2011).
Figure 2.
Geological map of the region depicting the study area (After [
6] (Chatterjee & Ghose, 2011).
Figure 2.
Geological map of the region depicting the study area (After [
6] (Chatterjee & Ghose, 2011).
Figure 3.
Geological map of Sudamakund area, in parts of Gaya and Jehanabad districts, Bihar.
Figure 3.
Geological map of Sudamakund area, in parts of Gaya and Jehanabad districts, Bihar.
Figure 4.
Geological map of Paharpur area, in parts of Gaya and Jehanabad districts, Bihar.
Figure 4.
Geological map of Paharpur area, in parts of Gaya and Jehanabad districts, Bihar.
Figure 5.
Field photographs showing: (a) xenoliths of amphibolite occurring within porphyritic biotite granite at the east of Nawagarh village; (b) massive amphibolite xenolith traversed by innumerable anastomosing quartzo-feldspathic pegmatite veins occurring within homophanous biotite granite at the north of Patalganga; (c) xenolith of migmatised amphibolite within fine-grained amphibolite rock at the north of Patal Ganga; (d) highly sheared, fractured, and crenulated talc tremolite actinolite schist at the east of Parvati Nagar village; (e) malachite staining in highly sheared talc tremolite actinolite schist at the east of Parvati Nagar village; and (f) xenolith of talc tremolite actinolite schist occurring within clotted anorthosite at the east of Parvati Nagar village.
Figure 6.
Photomicrographs showing: (a) occurrence of hornblende along with the intergranular space between plagioclase in anorthosite; (b) cumulus plagioclase crystals exhibited by anorthosite; (c) discontinuous twin lamellae and strain shadow suggesting deformation in anorthosite; (d) development of epidote along with the intergranular space between plagioclase in anorthosite; (e) typical ophitic texture in gabbro; and (f) cumulus textural pattern in gabbro.
Figure 7.
(
a) Discrimination plots between SiO
2 (wt %) and Na
2O + K
2O (wt %) of granitoid rock. (
b) Discrimination plots between SiO
2 (wt %) and Na
2O + K
2O (wt %) of mafic-ultramafic suite [
14].
Figure 7.
(
a) Discrimination plots between SiO
2 (wt %) and Na
2O + K
2O (wt %) of granitoid rock. (
b) Discrimination plots between SiO
2 (wt %) and Na
2O + K
2O (wt %) of mafic-ultramafic suite [
14].
Figure 8.
(
a) Data plotted on R1-R2 plot [
15] of granitoid rock. (
b) Data plotted on R1-R2 plot [
15] of the mafic-ultramafic suite.
Figure 8.
(
a) Data plotted on R1-R2 plot [
15] of granitoid rock. (
b) Data plotted on R1-R2 plot [
15] of the mafic-ultramafic suite.
Figure 9.
Field photographs showing: (a) primary layering (S0) in layered anorthosite near Sapneri village; (b) prominent two sets of joint pattern in hornblende granite at the south of Misir Bigah; (c) displacement of pegmatite vein within homophanous biotite granite also showing the sinistral sense of movement at NE of Naugarh village; (d) early tight isoclinal fold (F1) in layered gabbroic anorthosite at the east of Adampur village; (e) highly sheared quartz vein in hornblende granite at SE of Daulatpur village; and (f) development of S’-C’ fabric in homophanous biotite granite at South of Dhakra village.
Figure 12.
Field photographs showing: (a) Trench TRNM-02, NE of Mahadeva Temple; (b) Trench TRM-03, SE of Mahadeva Temple; (c)Trench PTNM-01, NE of Mahadeva Temple; (d) Trench PTR-01 North of Ramnath Bigha; (e,f) Trench PTR-02, 750 m SW of Patal Ganga.
Figure 12.
Field photographs showing: (a) Trench TRNM-02, NE of Mahadeva Temple; (b) Trench TRM-03, SE of Mahadeva Temple; (c)Trench PTNM-01, NE of Mahadeva Temple; (d) Trench PTR-01 North of Ramnath Bigha; (e,f) Trench PTR-02, 750 m SW of Patal Ganga.
Figure 13.
Litholog of trench PTNM-01 showing variation of Fe(T)% and TiO2%.
Figure 13.
Litholog of trench PTNM-01 showing variation of Fe(T)% and TiO2%.
Figure 14.
Mineralogical mapping and relative abundance of a group of minerals: (a) Clay group of minerals highlighted in greyish colour; (b) Oxidized iron-bearing sulphides highlighted in reddish colour (Iron-oxides ratio); (c) Ferric Iron minerals highlighted in reddish colour; and (d) Other ferrous/iron-bearing minerals highlighted in reddish colour, as derived from Landsat 8 imagery dated 25 February 2021.
Figure 15.
(
a) Magnetic map (TF) of Block-1, and (
b) Upward continued magnetic map of Block-1 [
3].
Figure 15.
(
a) Magnetic map (TF) of Block-1, and (
b) Upward continued magnetic map of Block-1 [
3].
Figure 16.
(
a) Magnetic map (TF) of Block-2, and (
b) Upward continued magnetic map of Block-2 [
3].
Figure 16.
(
a) Magnetic map (TF) of Block-2, and (
b) Upward continued magnetic map of Block-2 [
3].
Figure 17.
(
a) Bouguer gravity anomaly map of Block-2, and (
b) Upward continued Bouguer gravity map of Block-2 [
3].
Figure 17.
(
a) Bouguer gravity anomaly map of Block-2, and (
b) Upward continued Bouguer gravity map of Block-2 [
3].
Figure 18.
(
a) Magnetic map (TF) of Block-3, and (
b) Upward continued magnetic map of Block-3 [
3].
Figure 18.
(
a) Magnetic map (TF) of Block-3, and (
b) Upward continued magnetic map of Block-3 [
3].
Figure 19.
Field photographs showing (a,b) exposure of hard crystalline magnetite body at NW of Nagarjuni hill, (c) boulders of magnetite at 750 m SW of Patal Ganga, (d) specks of sulphides in magnetite at the east of Phalgu River, (e) sheared and fractured magnetite body at the east of Phalgu river, and (f) view of magnetite body occurring as the lens within clotted anorthosite at the east of Phalgu river.
Table 1.
The comparative stratigraphy of CGGC from Bihar as given in the geological map of GSI [
7].
Table 1.
The comparative stratigraphy of CGGC from Bihar as given in the geological map of GSI [
7].
| | Stratigraphy by (Singh, 1993, 1998, 2001) [11] | Compiled Geological Map of GSI (1:2 Million Scale) |
|---|
| Intrusives | Massive, granite-granophyre, gabbro-anorthosite, Ortho-amphibolites |
| Rajgir Group | Upper phyllite Formation |
| Quartzite Formation |
| Lower Phyllite Formation |
| ------------------------------ Unconformity ---------------------- |
| Intrusive Suite | Rare-metal bearing pegmatite, pegmatoid granite and quartz veins, mica pegmatites, trondhjemite; gabbro, porphyritic granites and augen gneiss, migmatite and gneisses. | Hazaribagh granite and pegmatite/quartz. |
| Kodarma Group | Kakolat Fm | Massive quartzite, quartz-schist and quartz mica schist | Metamorphics of Chotanagpur Mica belt. |
| Dhab Fm | Mica schist, mica gneiss, carbonaceous schist with thin bands of calc-silicate, calcareous quartzite, and acid tuff |
| Phulwaria Fm | Quartzite, quartz-schist, quartz-mica schist BHJ, BHQ, amphibolite, hornblende schist, calc-silicate gneiss, crystalline limestone, conglomerate, conglomeratic and pebbly quartz-schist. |
| ------------------------------ Unconformity ---------------------- |
| Intrusive Suite | Aplo-granite, pegmatite, quartz veins, Jaled Ultramafics: Pyroxenite, peridotite. |
| Chatra Gneiss Suite | Granite gneisses, tonalite gneisses,
migmatites, augen gneiss | Granite gneisses |
| CGGC | Meta-ultramafites-mafites with layers of magnetite and garnet BIF
Calc-silicate and skarn rocks; Magnetite-chert, banded magnetite-chert-jasper, banded magnetite-grunerite quartzite. | Unclassified metamorphics |
| Enclave Suite | Chakrabandha Schists;
Chlorite schist, mica schist, garnet-biotite schist, and gneiss
Sillimanite + muscovite + garnet schist and gneiss, quartz-biotite gneisses, meta-quartzite;
Dumka Granulite:
Charnockite, khondalite, pyroxene granulite, leptinite, etc. |
| ----------------- Basement not known ------------------------------ |
| | Pre-tectonic mafic-ultramafic intrusive Palaeo- Proterozoic- Late Archaean (≥2000 Ma) | Amphibolite (schistose), meta-ultramafics (viz. talc-tremolite schist, tremolite-actinolite schist, chlorite schist, actinolite-cummingtonite schist, hornblende schist, serpentinite etc.), and layered anorthosite |
| | Basement
Archaean–Palaeo-Proterozoic | Tonalite gneiss, volcano-clastic metasediments, khondalite, and leptynite (Granulite Facies, Phase I) |
Table 2.
Band-ratios applied for LANDSAT-8 imagery dated 25 February 2021.
Table 2.
Band-ratios applied for LANDSAT-8 imagery dated 25 February 2021.
| Band Ratio: Landsat-8 | Features | References |
|---|
| 3/5 | Spodumene | Current study |
| 4/2 | Iron oxides | [23,26] |
| 4/3 | Ferric iron | Current study |
| 4/7 | Lepidolite; (cookeite; amblygonite; montebrasite) | Current study |
| 6/5 | Ferrous minerals | [26,27] |
| 6/7 | Alunite and clay minerals | [23,28] |
| 10/7 | Goethite and halloysite | Current study |
| (5 − 4)/(5 + 4) | NDVI | -- |
Table 3.
RGB combination created using LANDSAT-8 imagery dated 25 February 2021.
Table 3.
RGB combination created using LANDSAT-8 imagery dated 25 February 2021.
| Target Mineral Information | RGB Combination: Landsat-8 | References |
|---|
| Iron oxides and Clay Minerals | 257
657 | [26]
[26] |
Table 4.
Chosen subsets for the selective PCA for Landsat-8 imagery dated 25 February 2021.
Table 4.
Chosen subsets for the selective PCA for Landsat-8 imagery dated 25 February 2021.
| Target Mineral Information | Subset PCA: Landsat-8 | References |
|---|
| Ferric Iron Minerals | 2,4
2,4,5,6 | [33,34] |
| Hydroxyl Minerals | 6,7
2,5,6,7 | [33,34] |
Table 5.
Statistical analysis of major oxides composition of magnetite bodies [
3].
Table 5.
Statistical analysis of major oxides composition of magnetite bodies [
3].
| Scheme 2. | Body/Band Name | Dimension & Statistics | Fe (T) (%) | TiO2 (%) | SiO2 (%) | Al2O3 (%) | P2O5 (%) | MnO (%) | MgO (%) | CaO (%) | Na2O (%) | K2O (%) |
|---|
| 1 | NE of Sudamakund: | 800 m × 200 m | Min | 25.85 | 2.93 | 0.99 | 2.63 | 0.01 | 0.23 | 1.74 | 0.06 | 0.13 | 0.02 |
| Max | 52.04 | 26.77 | 40.05 | 16.52 | 0.18 | 0.54 | 10.66 | 8.81 | 0.98 | 0.33 |
| Avg. | 45.96 | 20.50 | 7.00 | 4.21 | 0.03 | 0.28 | 3.48 | 0.93 | 0.22 | 0.07 |
| 2 | NW of Patal Ganga | 500 m × 100 m | Min | 47.70 | 16.41 | 1.68 | 2.99 | 0.01 | 0.22 | 2.11 | 0.06 | 0.15 | 0.02 |
| Max | 52.67 | 26.10 | 3.51 | 5.10 | 0.03 | 0.23 | 4.61 | 0.21 | 0.16 | 0.04 |
| Avg. | 50.31 | 20.07 | 2.51 | 3.87 | 0.01 | 0.23 | 3.54 | 0.11 | 0.15 | 0.03 |
| 3 | NW of Nagarjuni hill | 500 m × 100 m | Min | 44.40 | 19.75 | 0.50 | 2.52 | 0.01 | 0.21 | 1.59 | 0.06 | 0.14 | 0.02 |
| Max | 53.57 | 24.88 | 4.94 | 4.70 | 0.03 | 0.28 | 4.67 | 0.19 | 0.16 | 0.06 |
| Avg. | 50.09 | 21.94 | 2.32 | 3.31 | 0.01 | 0.25 | 2.72 | 0.10 | 0.15 | 0.04 |
| 4 | 750 m SW of Patal Ganga | 150 m diameter | Min | 47.09 | 13.51 | 1.35 | 2.41 | 0.01 | 0.16 | 8.19 | 0.06 | 0.14 | 0.02 |
| Max | 54.21 | 20.14 | 3.98 | 6.08 | 0.01 | 0.23 | 8.67 | 0.08 | 0.16 | 0.03 |
| Avg. | 51.09 | 16.66 | 2.74 | 4.72 | 0.01 | 0.20 | 8.43 | 0.07 | 0.15 | 0.03 |
| 5 | East of Phalgu River | 200 m × 40 m | Min | 35.27 | 1.47 | 0.87 | 4.67 | 0.01 | 0.17 | 6.72 | 0.06 | 0.14 | 0.02 |
| Max | 60.78 | 10.50 | 17.72 | 16.74 | 0.02 | 0.27 | 10.50 | 0.84 | 0.18 | 0.04 |
| Avg. | 50.41 | 4.68 | 6.68 | 10.46 | 0.01 | 0.21 | 8.68 | 0.42 | 0.16 | 0.03 |
| Overall variation of the values in all bands | Min | 25.85 | 1.47 | 0.50 | 2.41 | 0.01 | 0.16 | 1.59 | 0.06 | 0.13 | 0.02 |
| Max | 60.78 | 26.77 | 40.05 | 16.74 | 0.18 | 0.54 | 10.66 | 8.81 | 0.98 | 0.33 |
| Avg. | 49.53 | 15.85 | 4.55 | 5.77 | 0.02 | 0.25 | 4.29 | 0.45 | 0.18 | 0.04 |
| Publisher’s Note: MDPI stays neutral with regard to jurisdictional claims in published maps and institutional affiliations. |
© 2022 by the authors. Licensee MDPI, Basel, Switzerland. This article is an open access article distributed under the terms and conditions of the Creative Commons Attribution (CC BY) license (https://creativecommons.org/licenses/by/4.0/).


 ,
, 


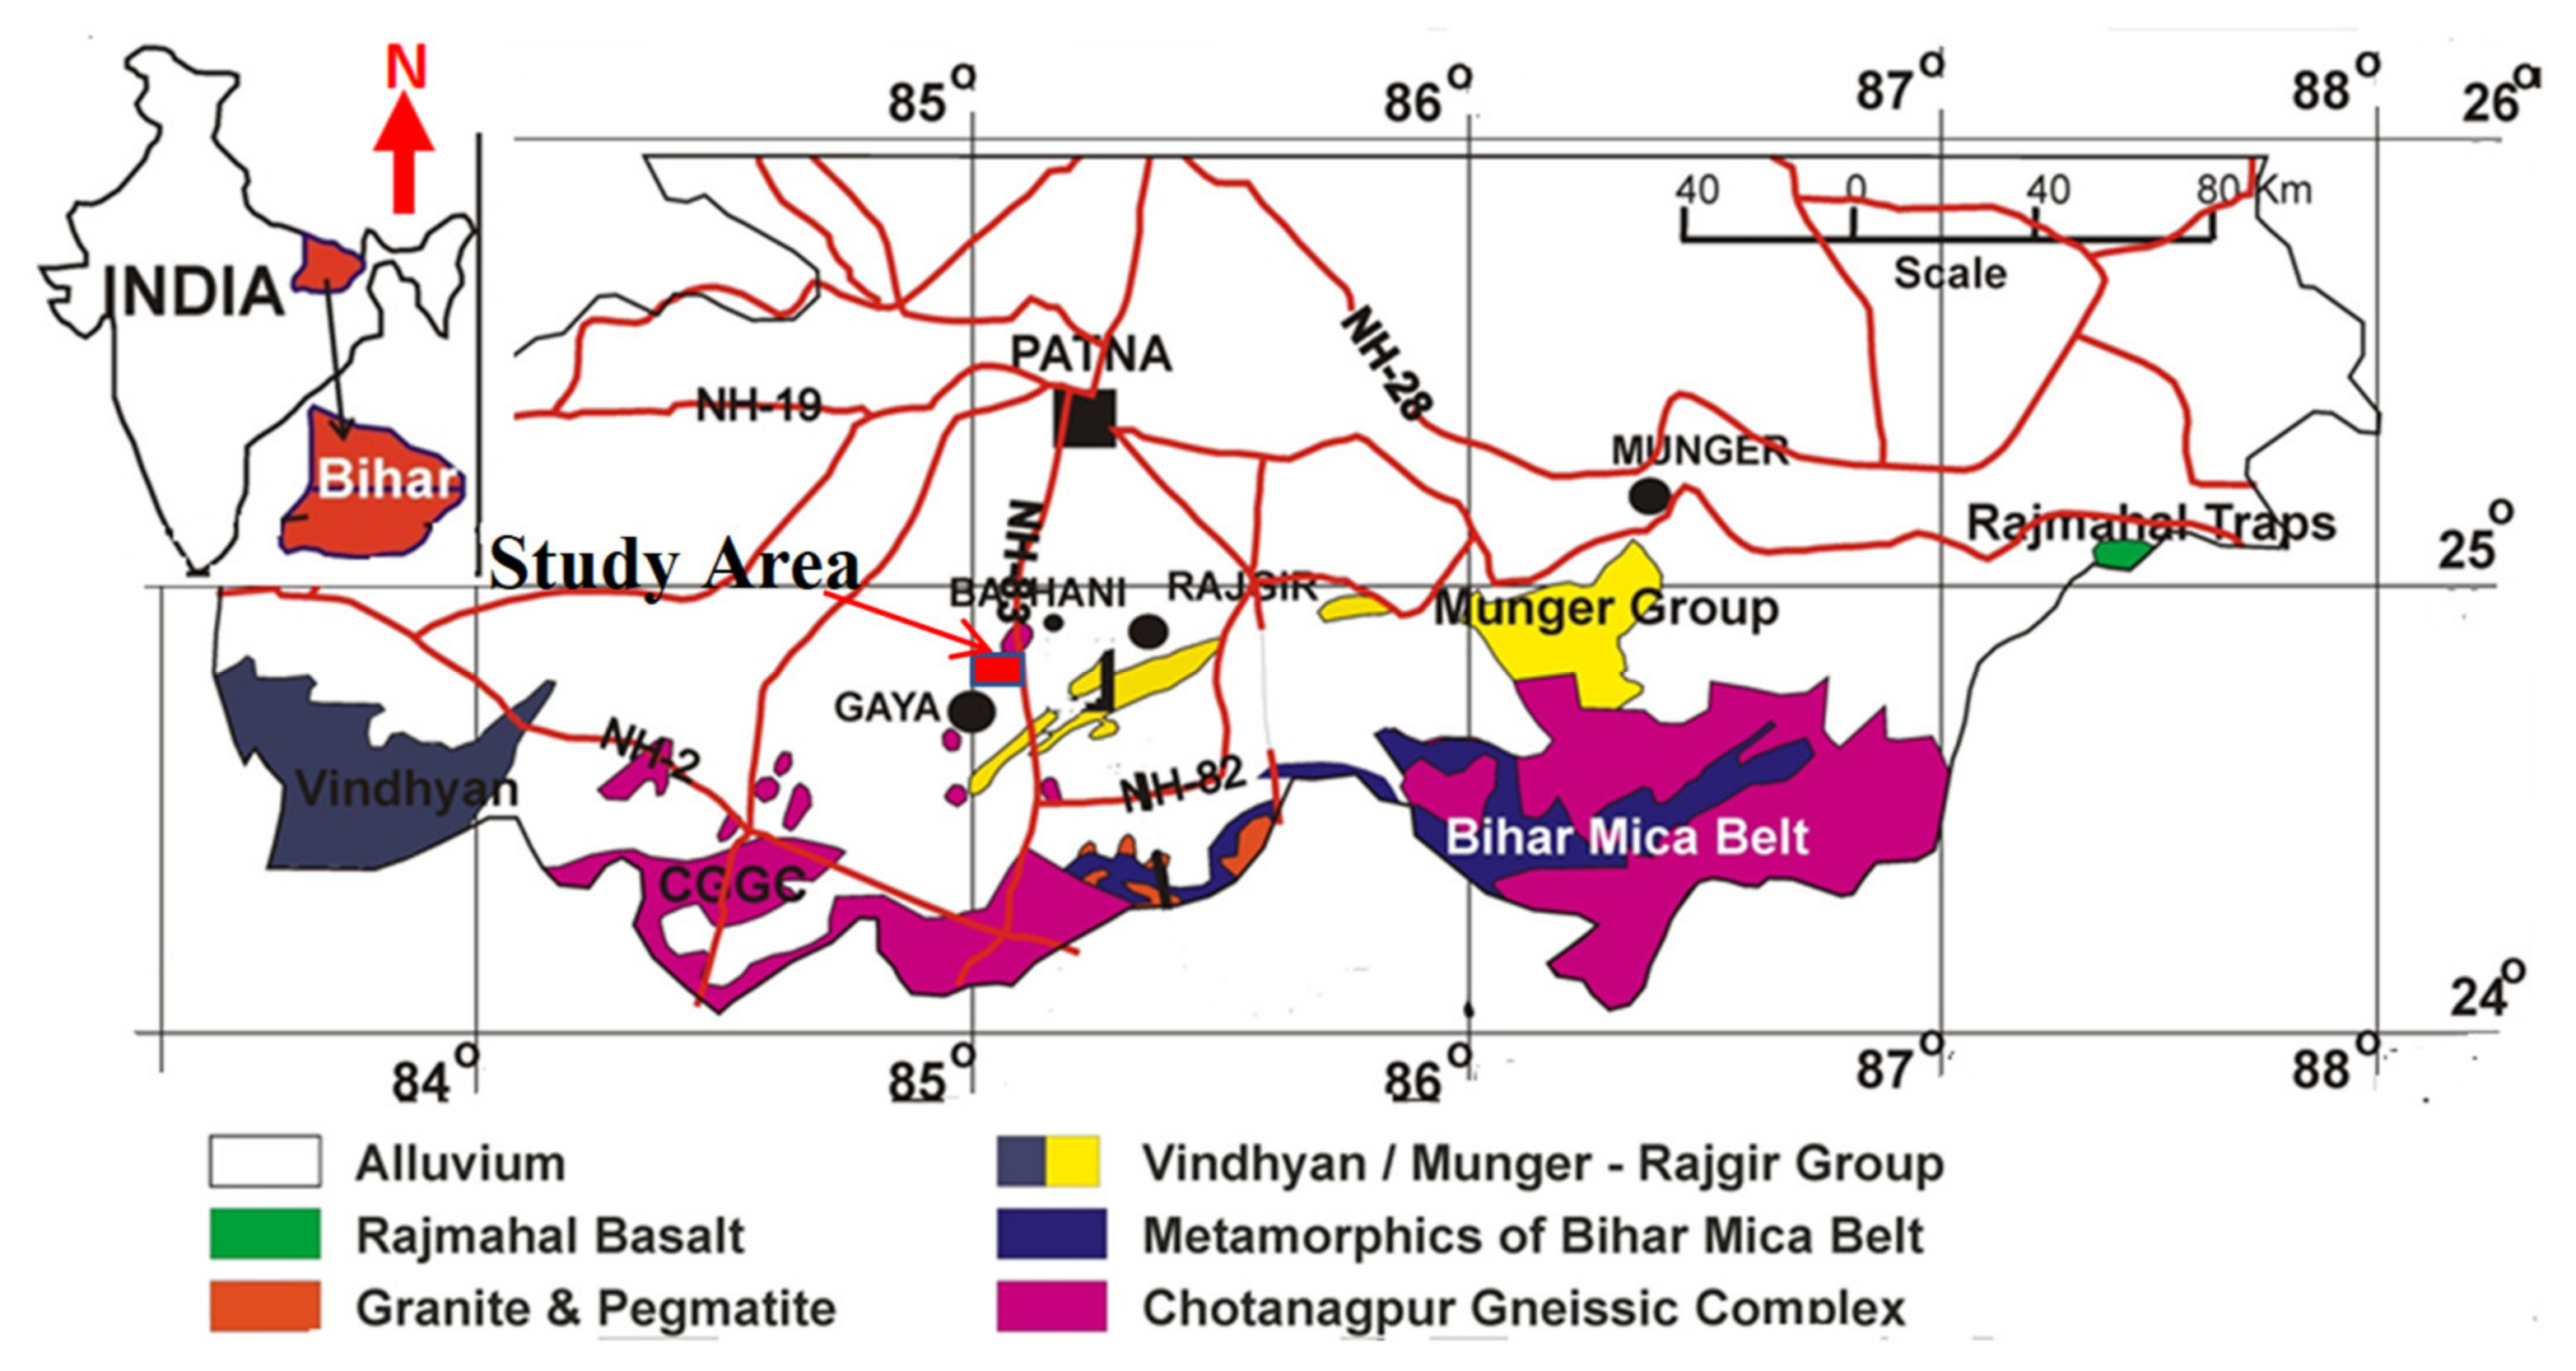
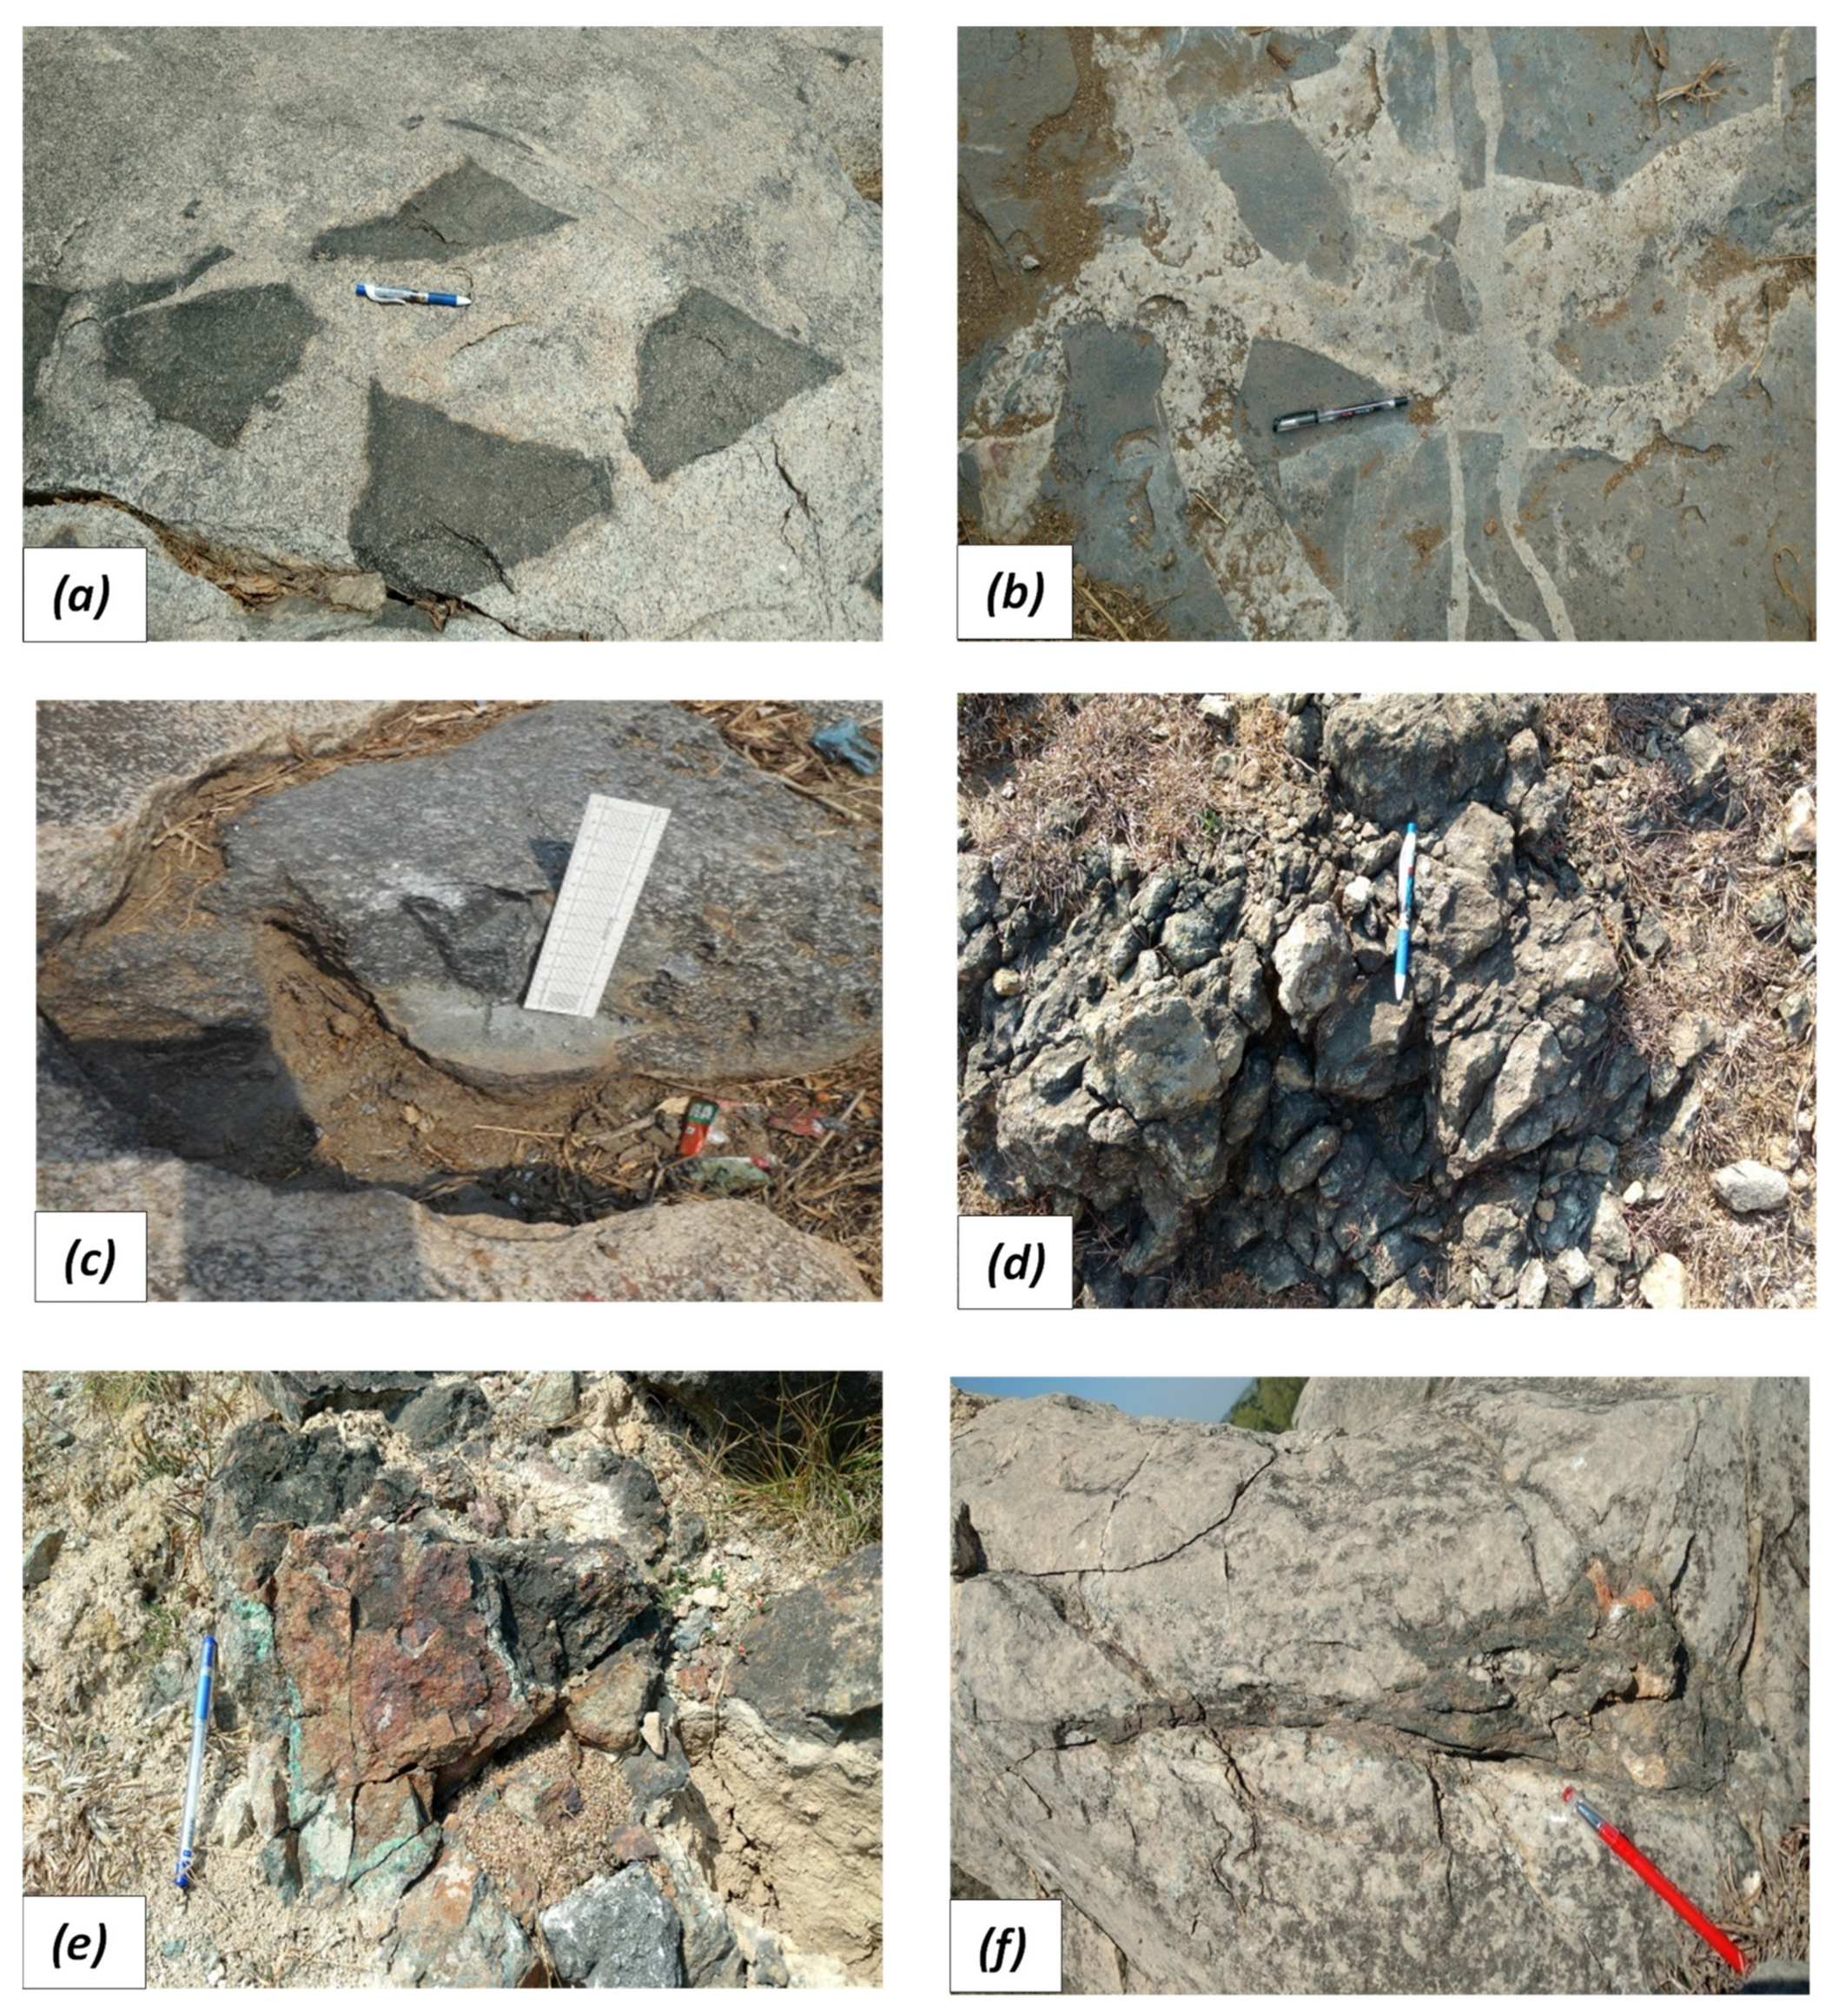
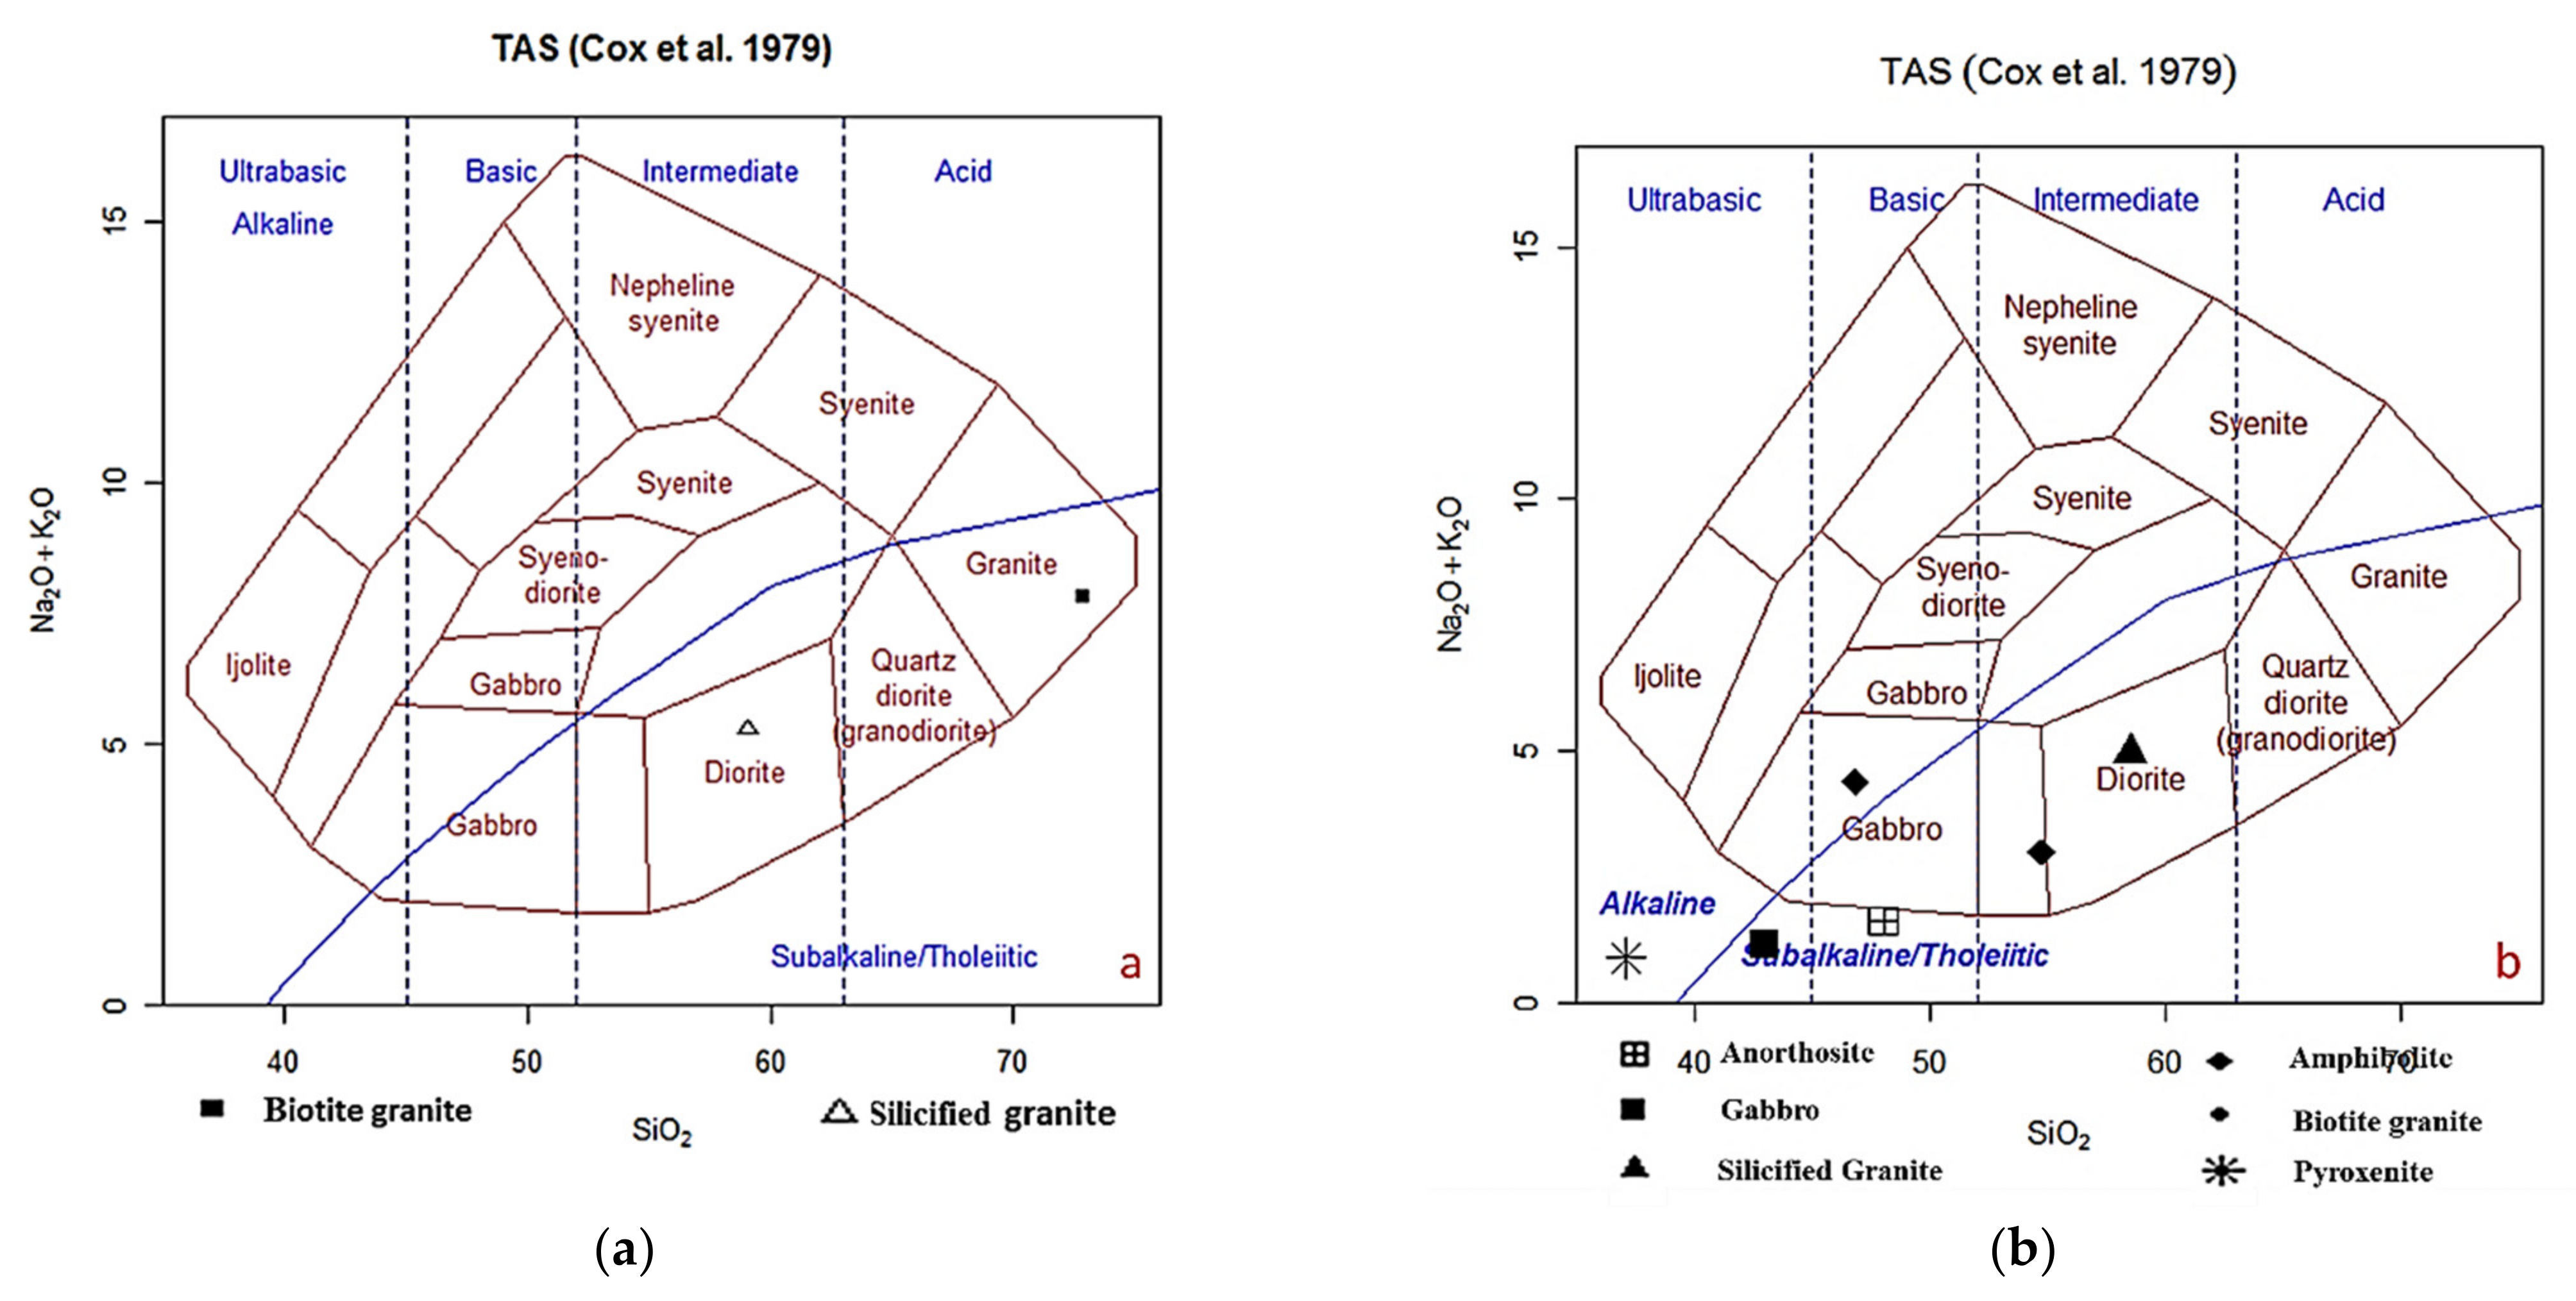
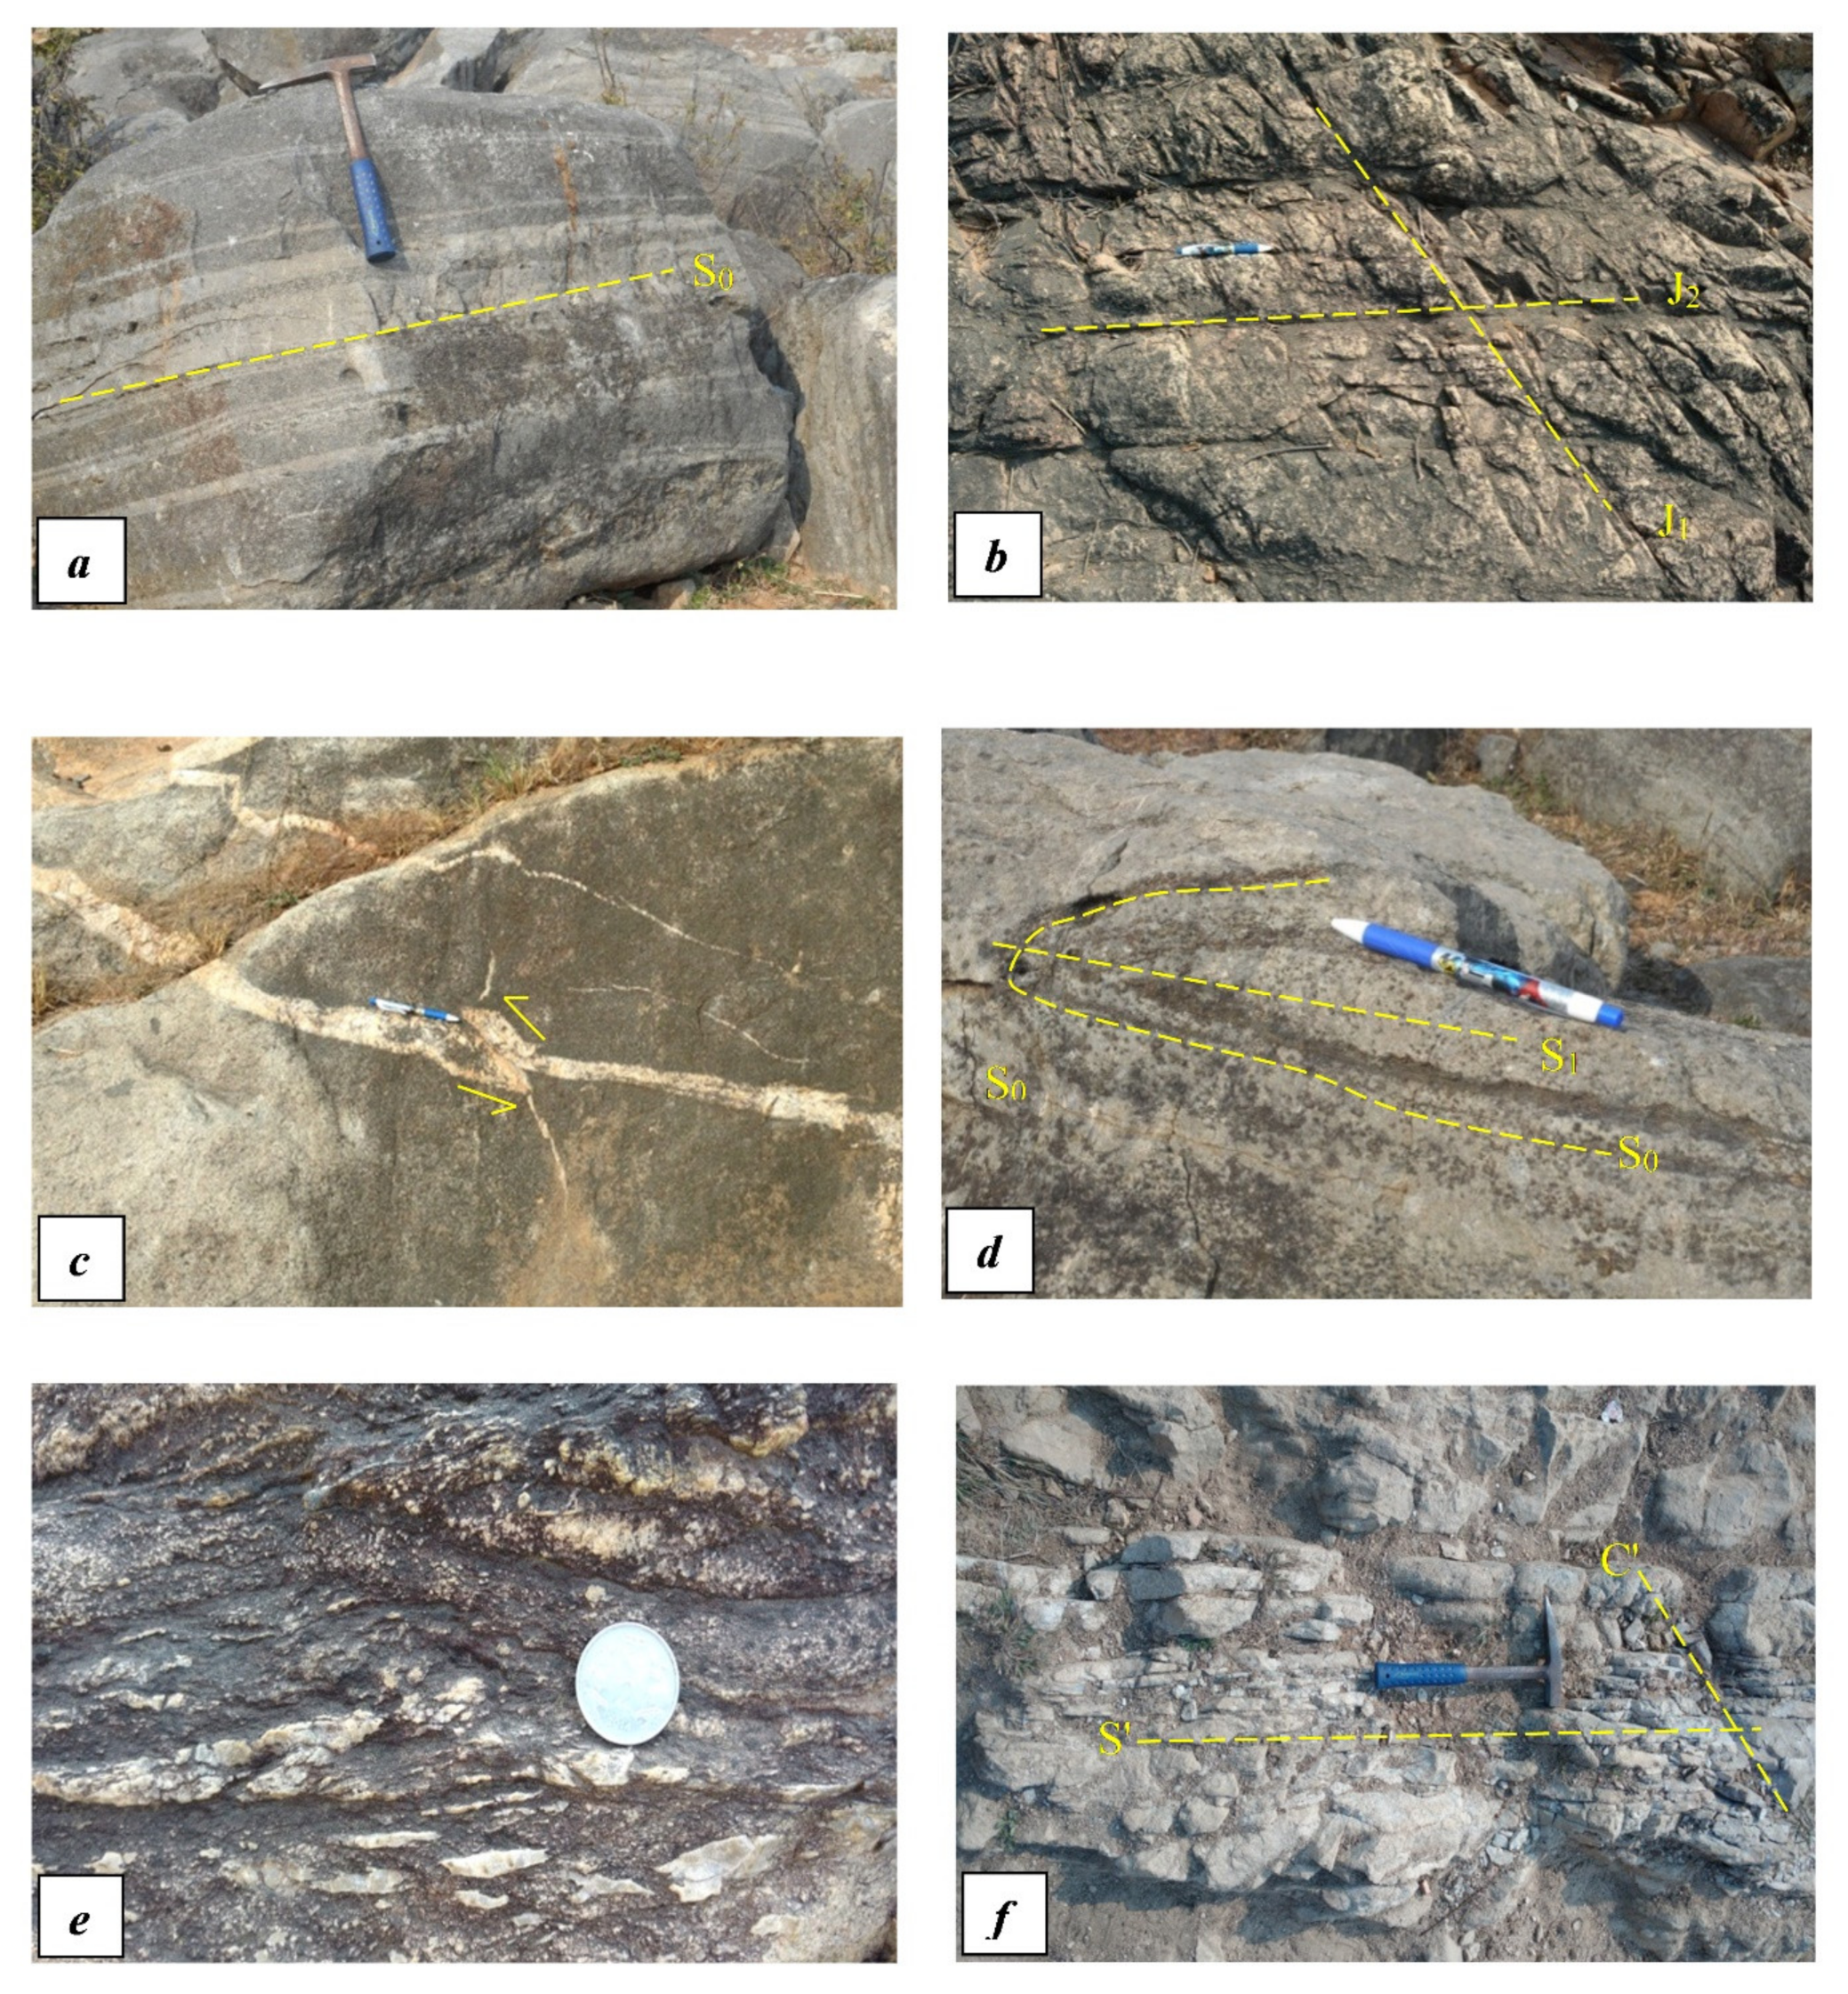
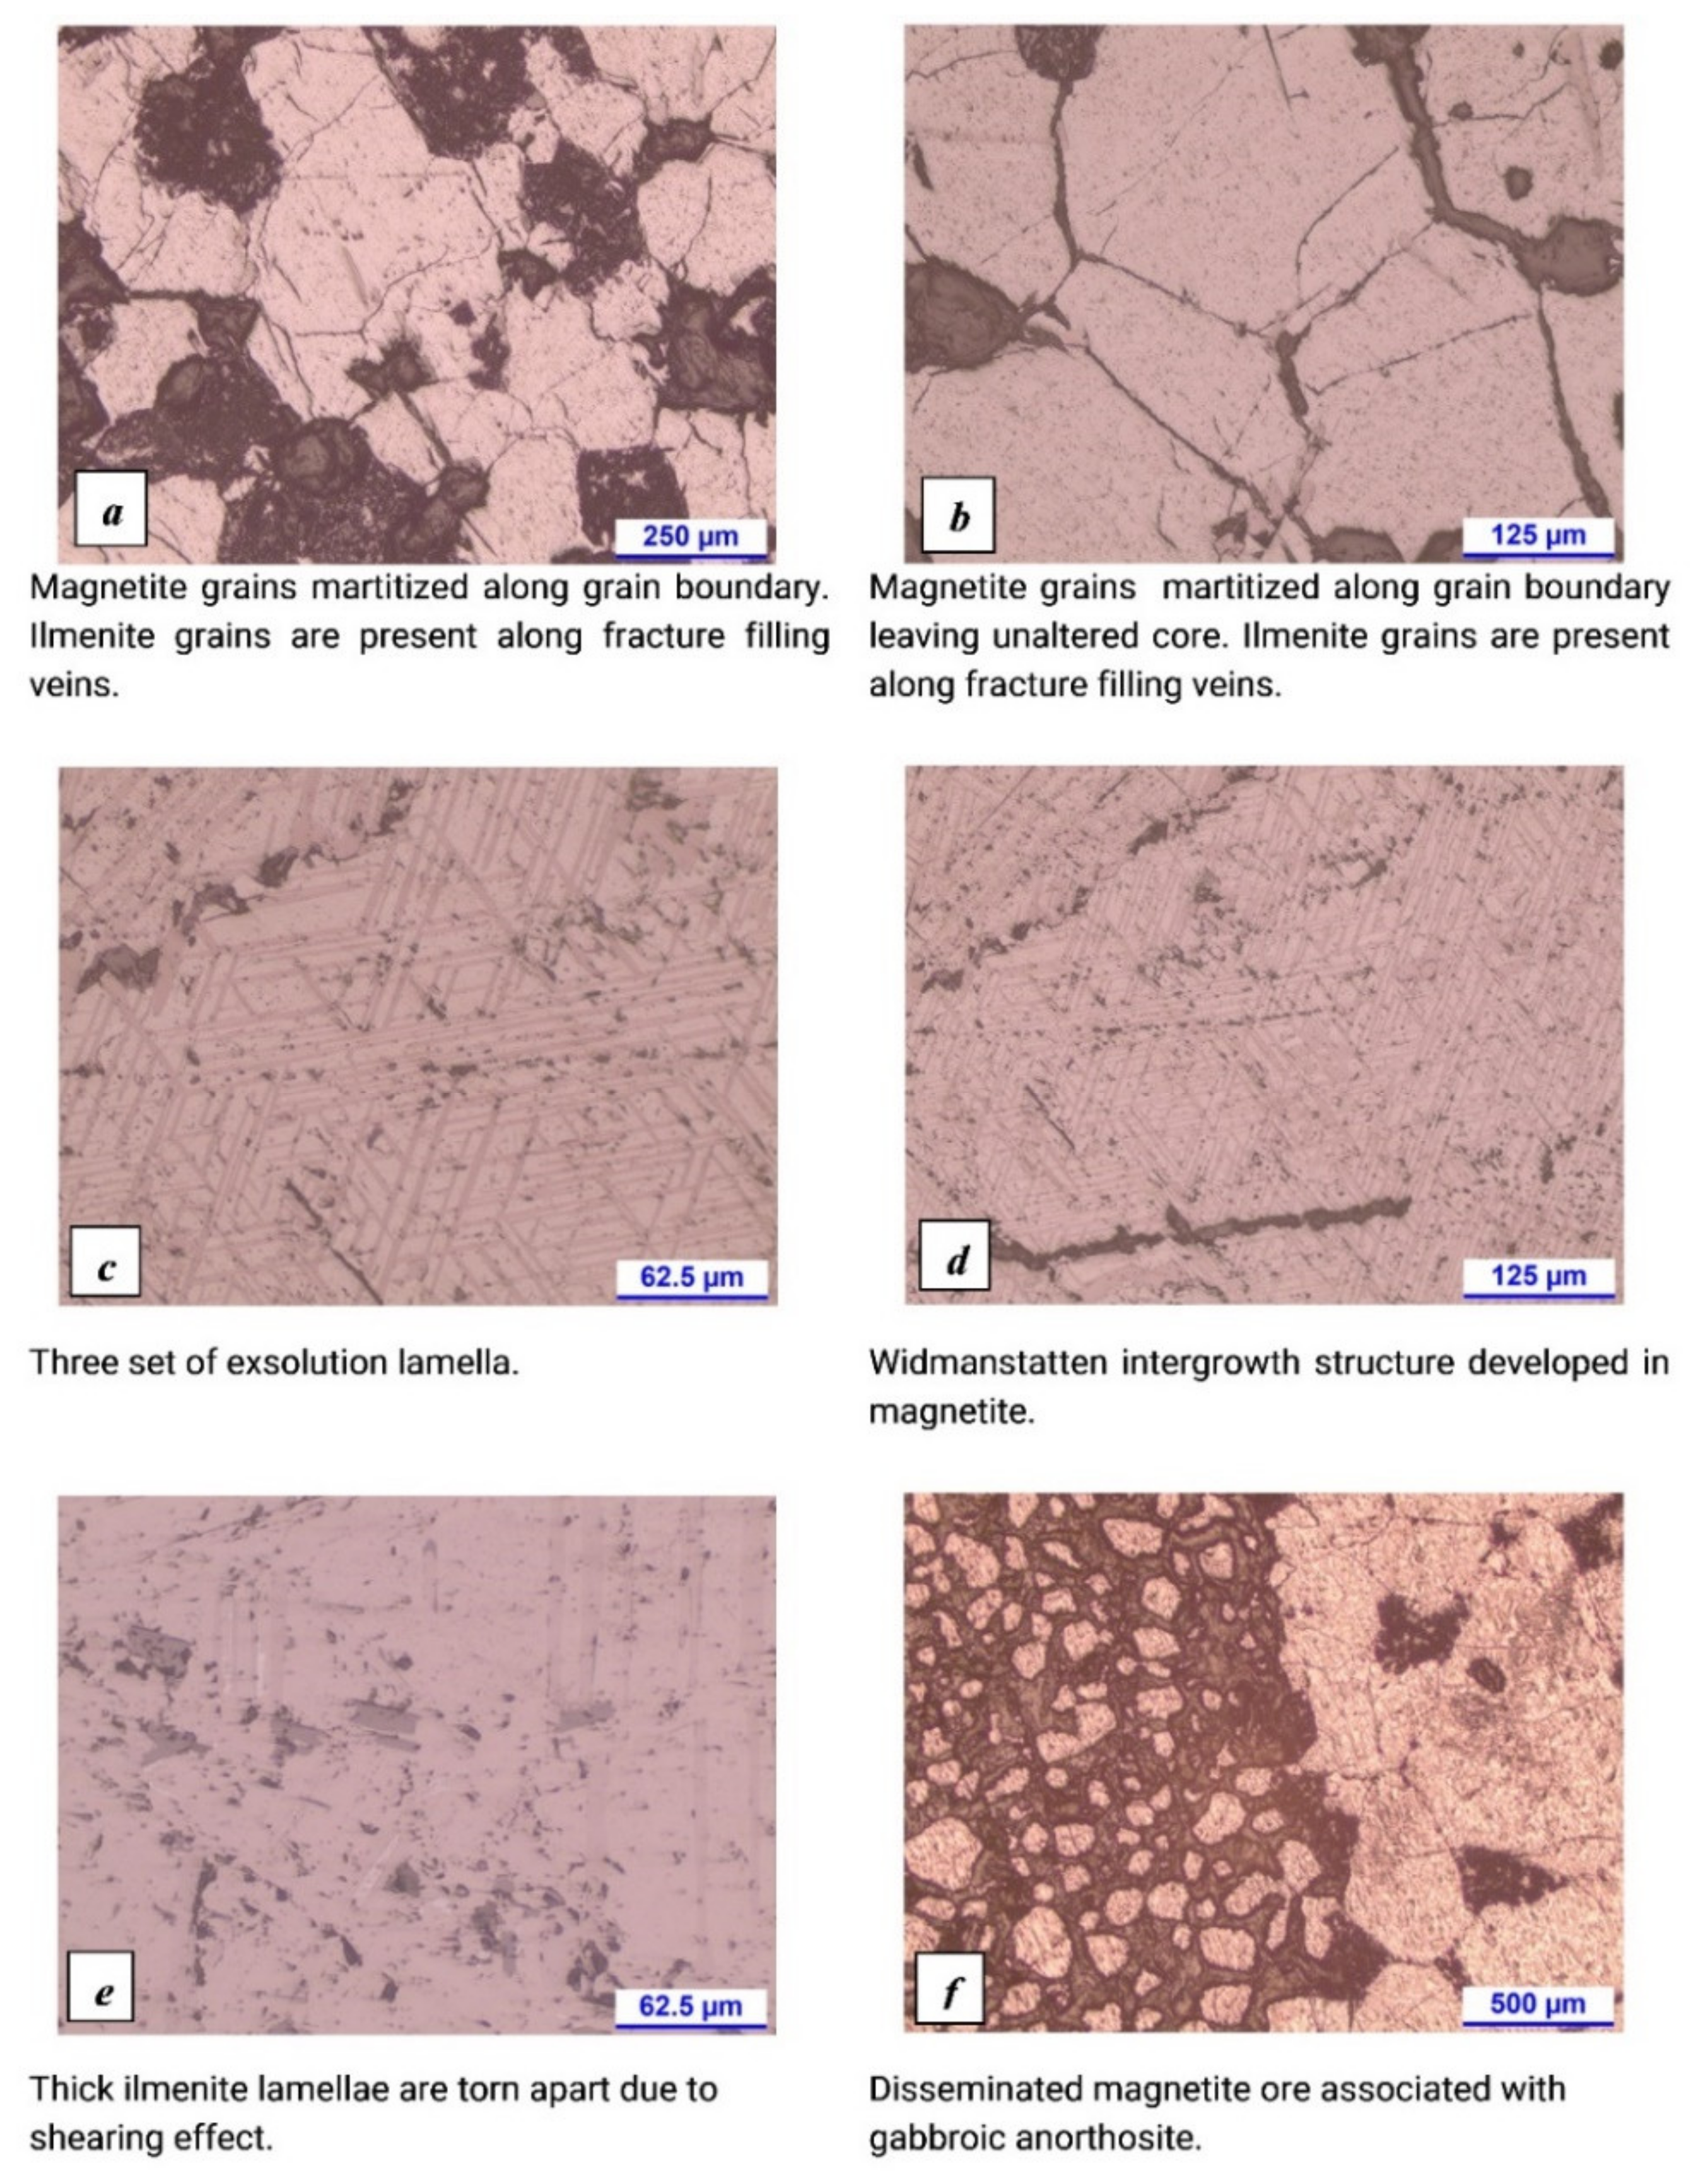
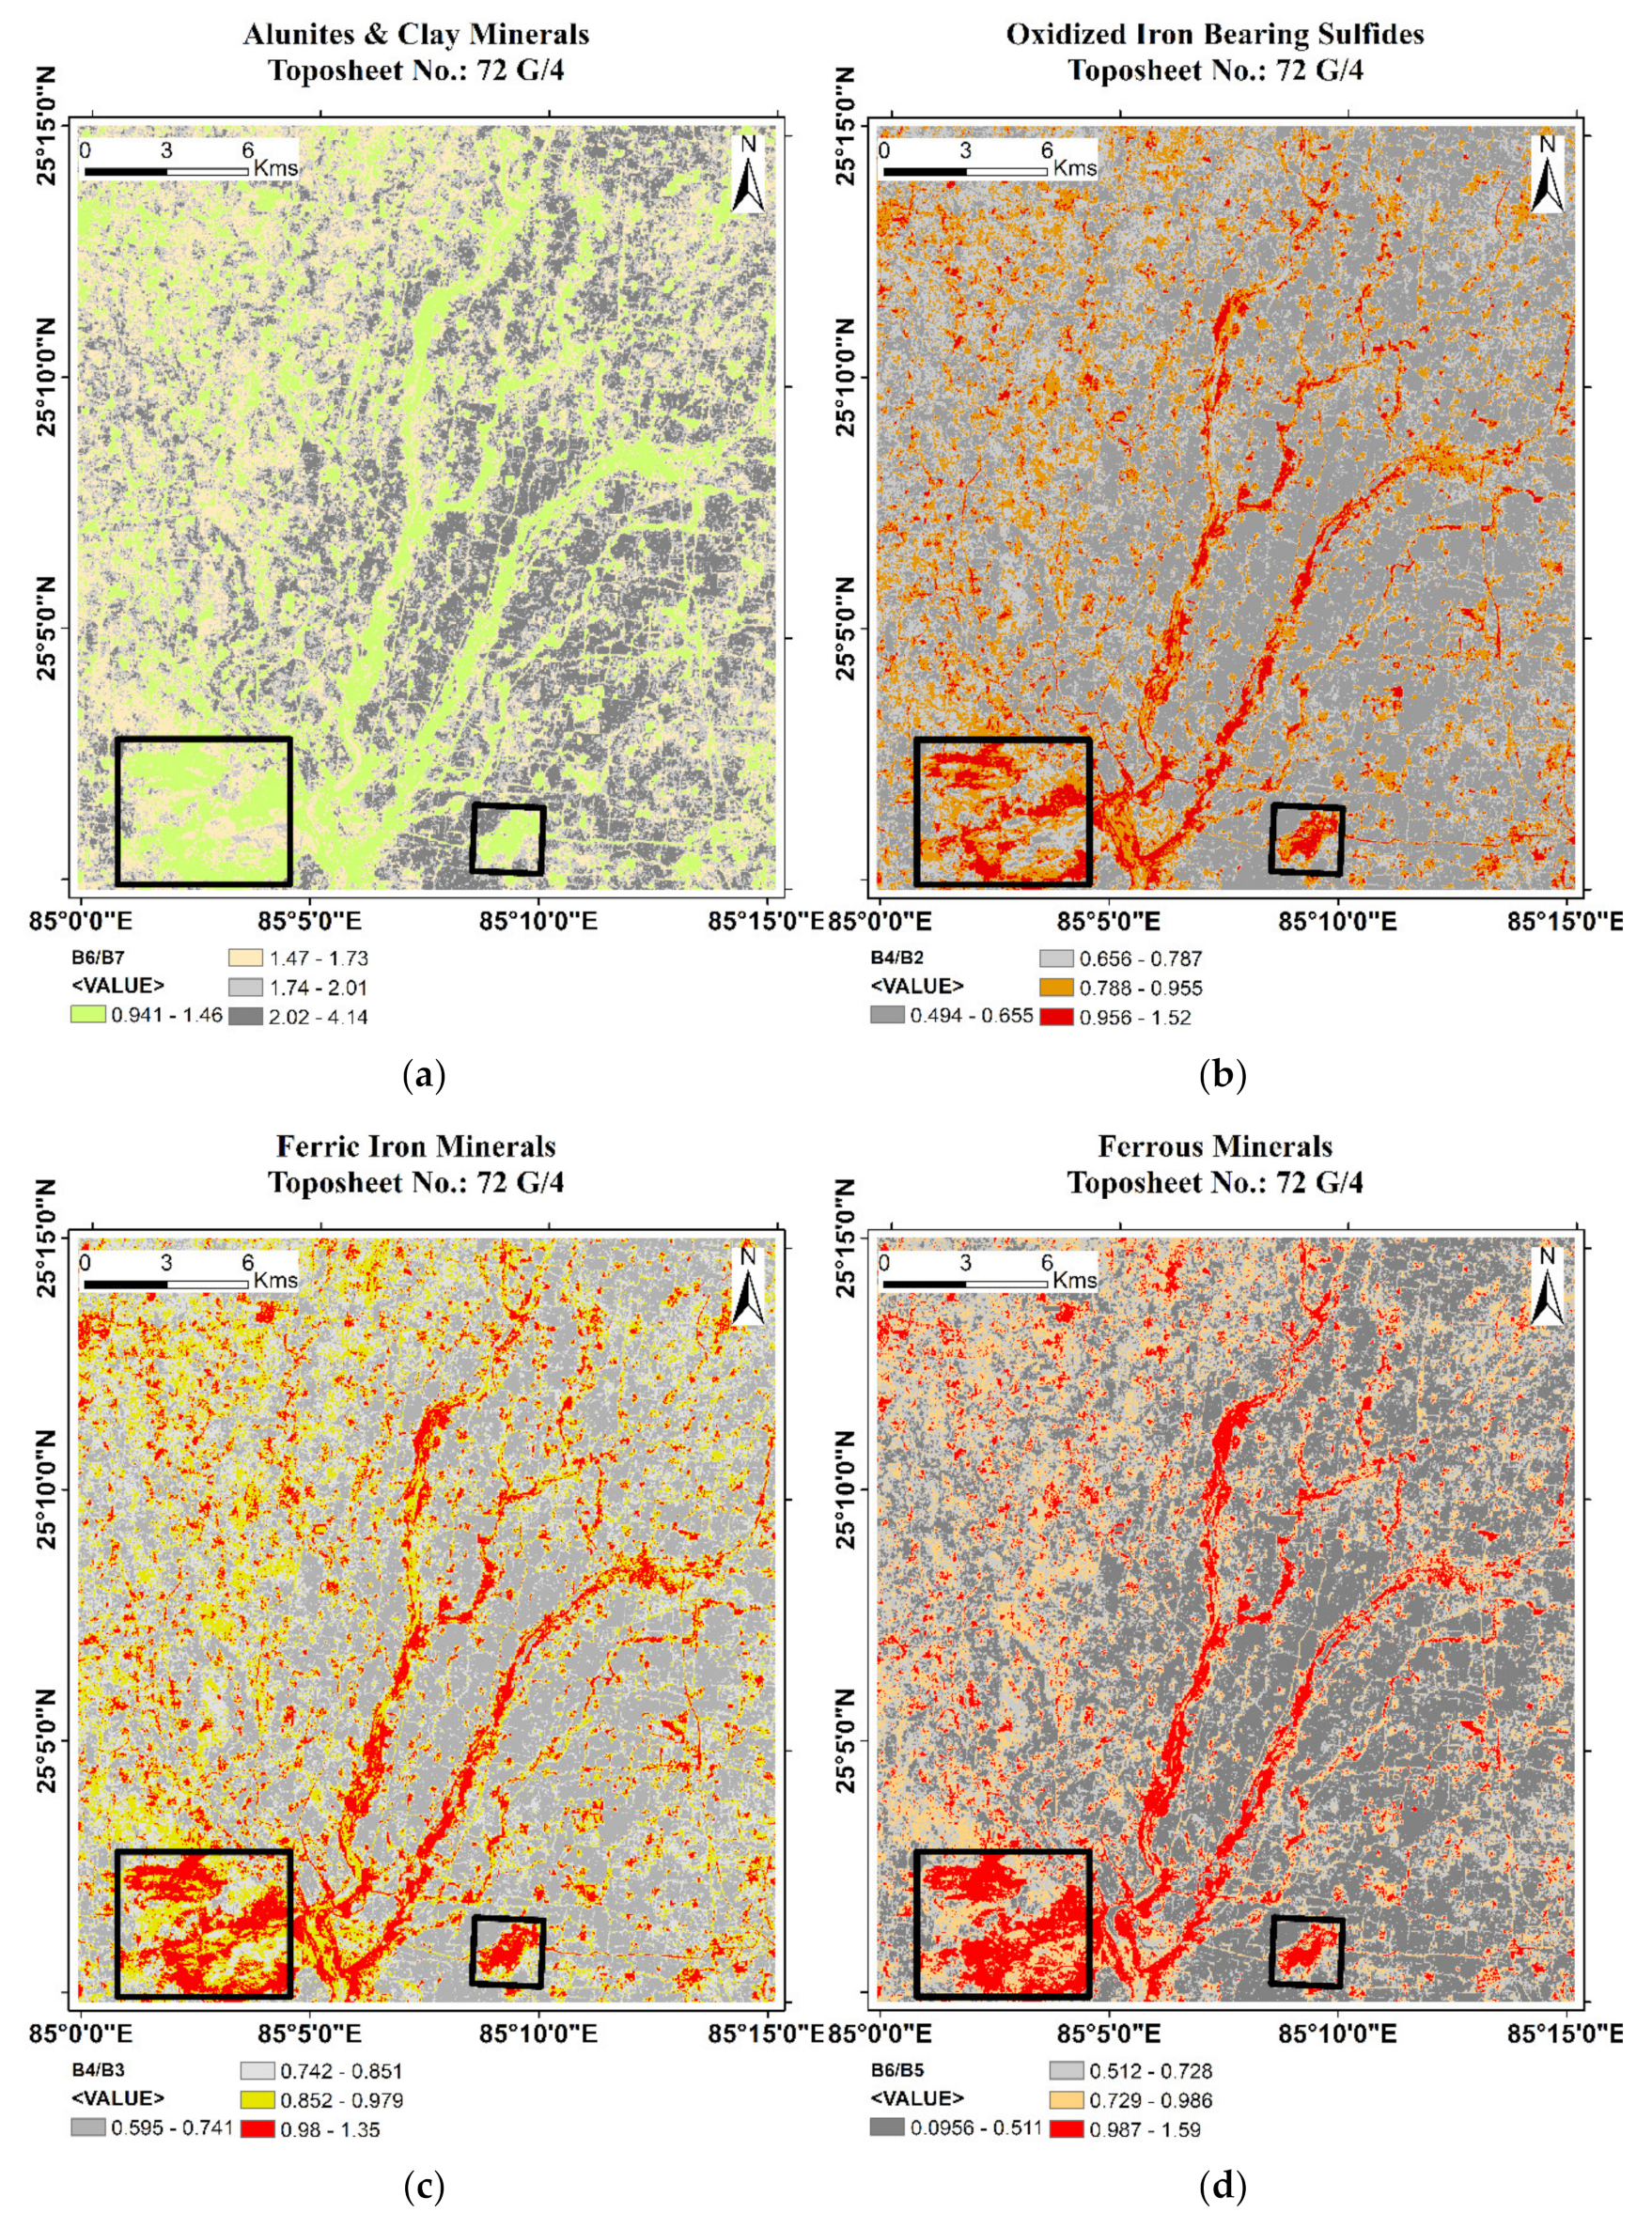
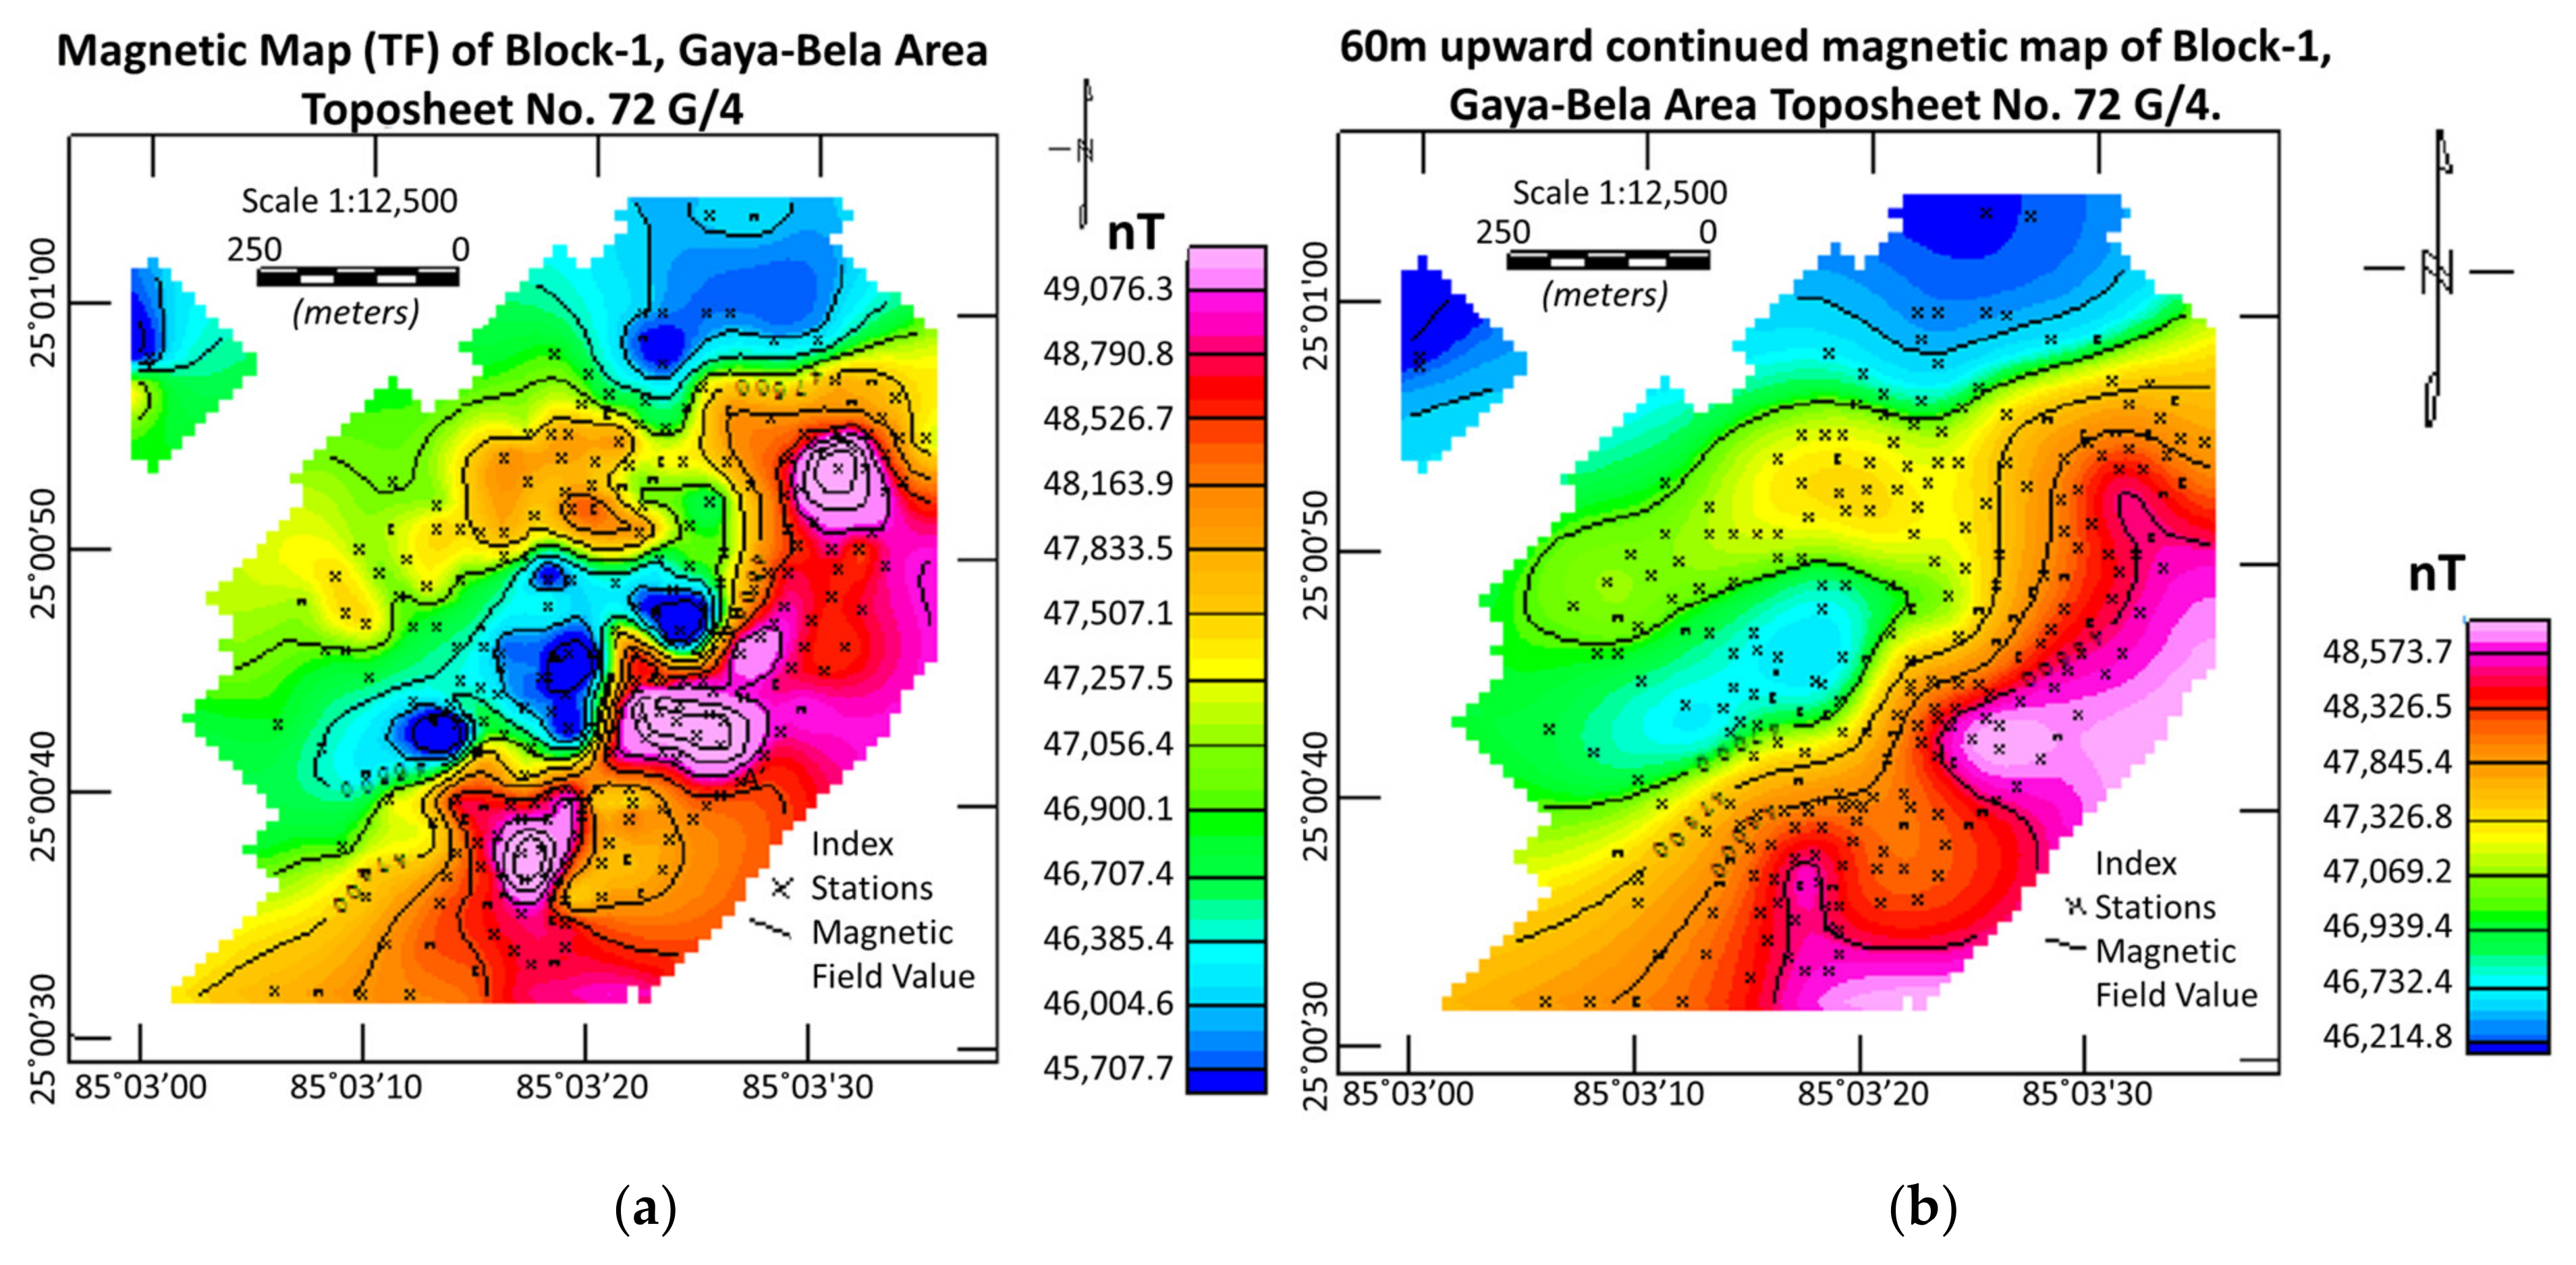
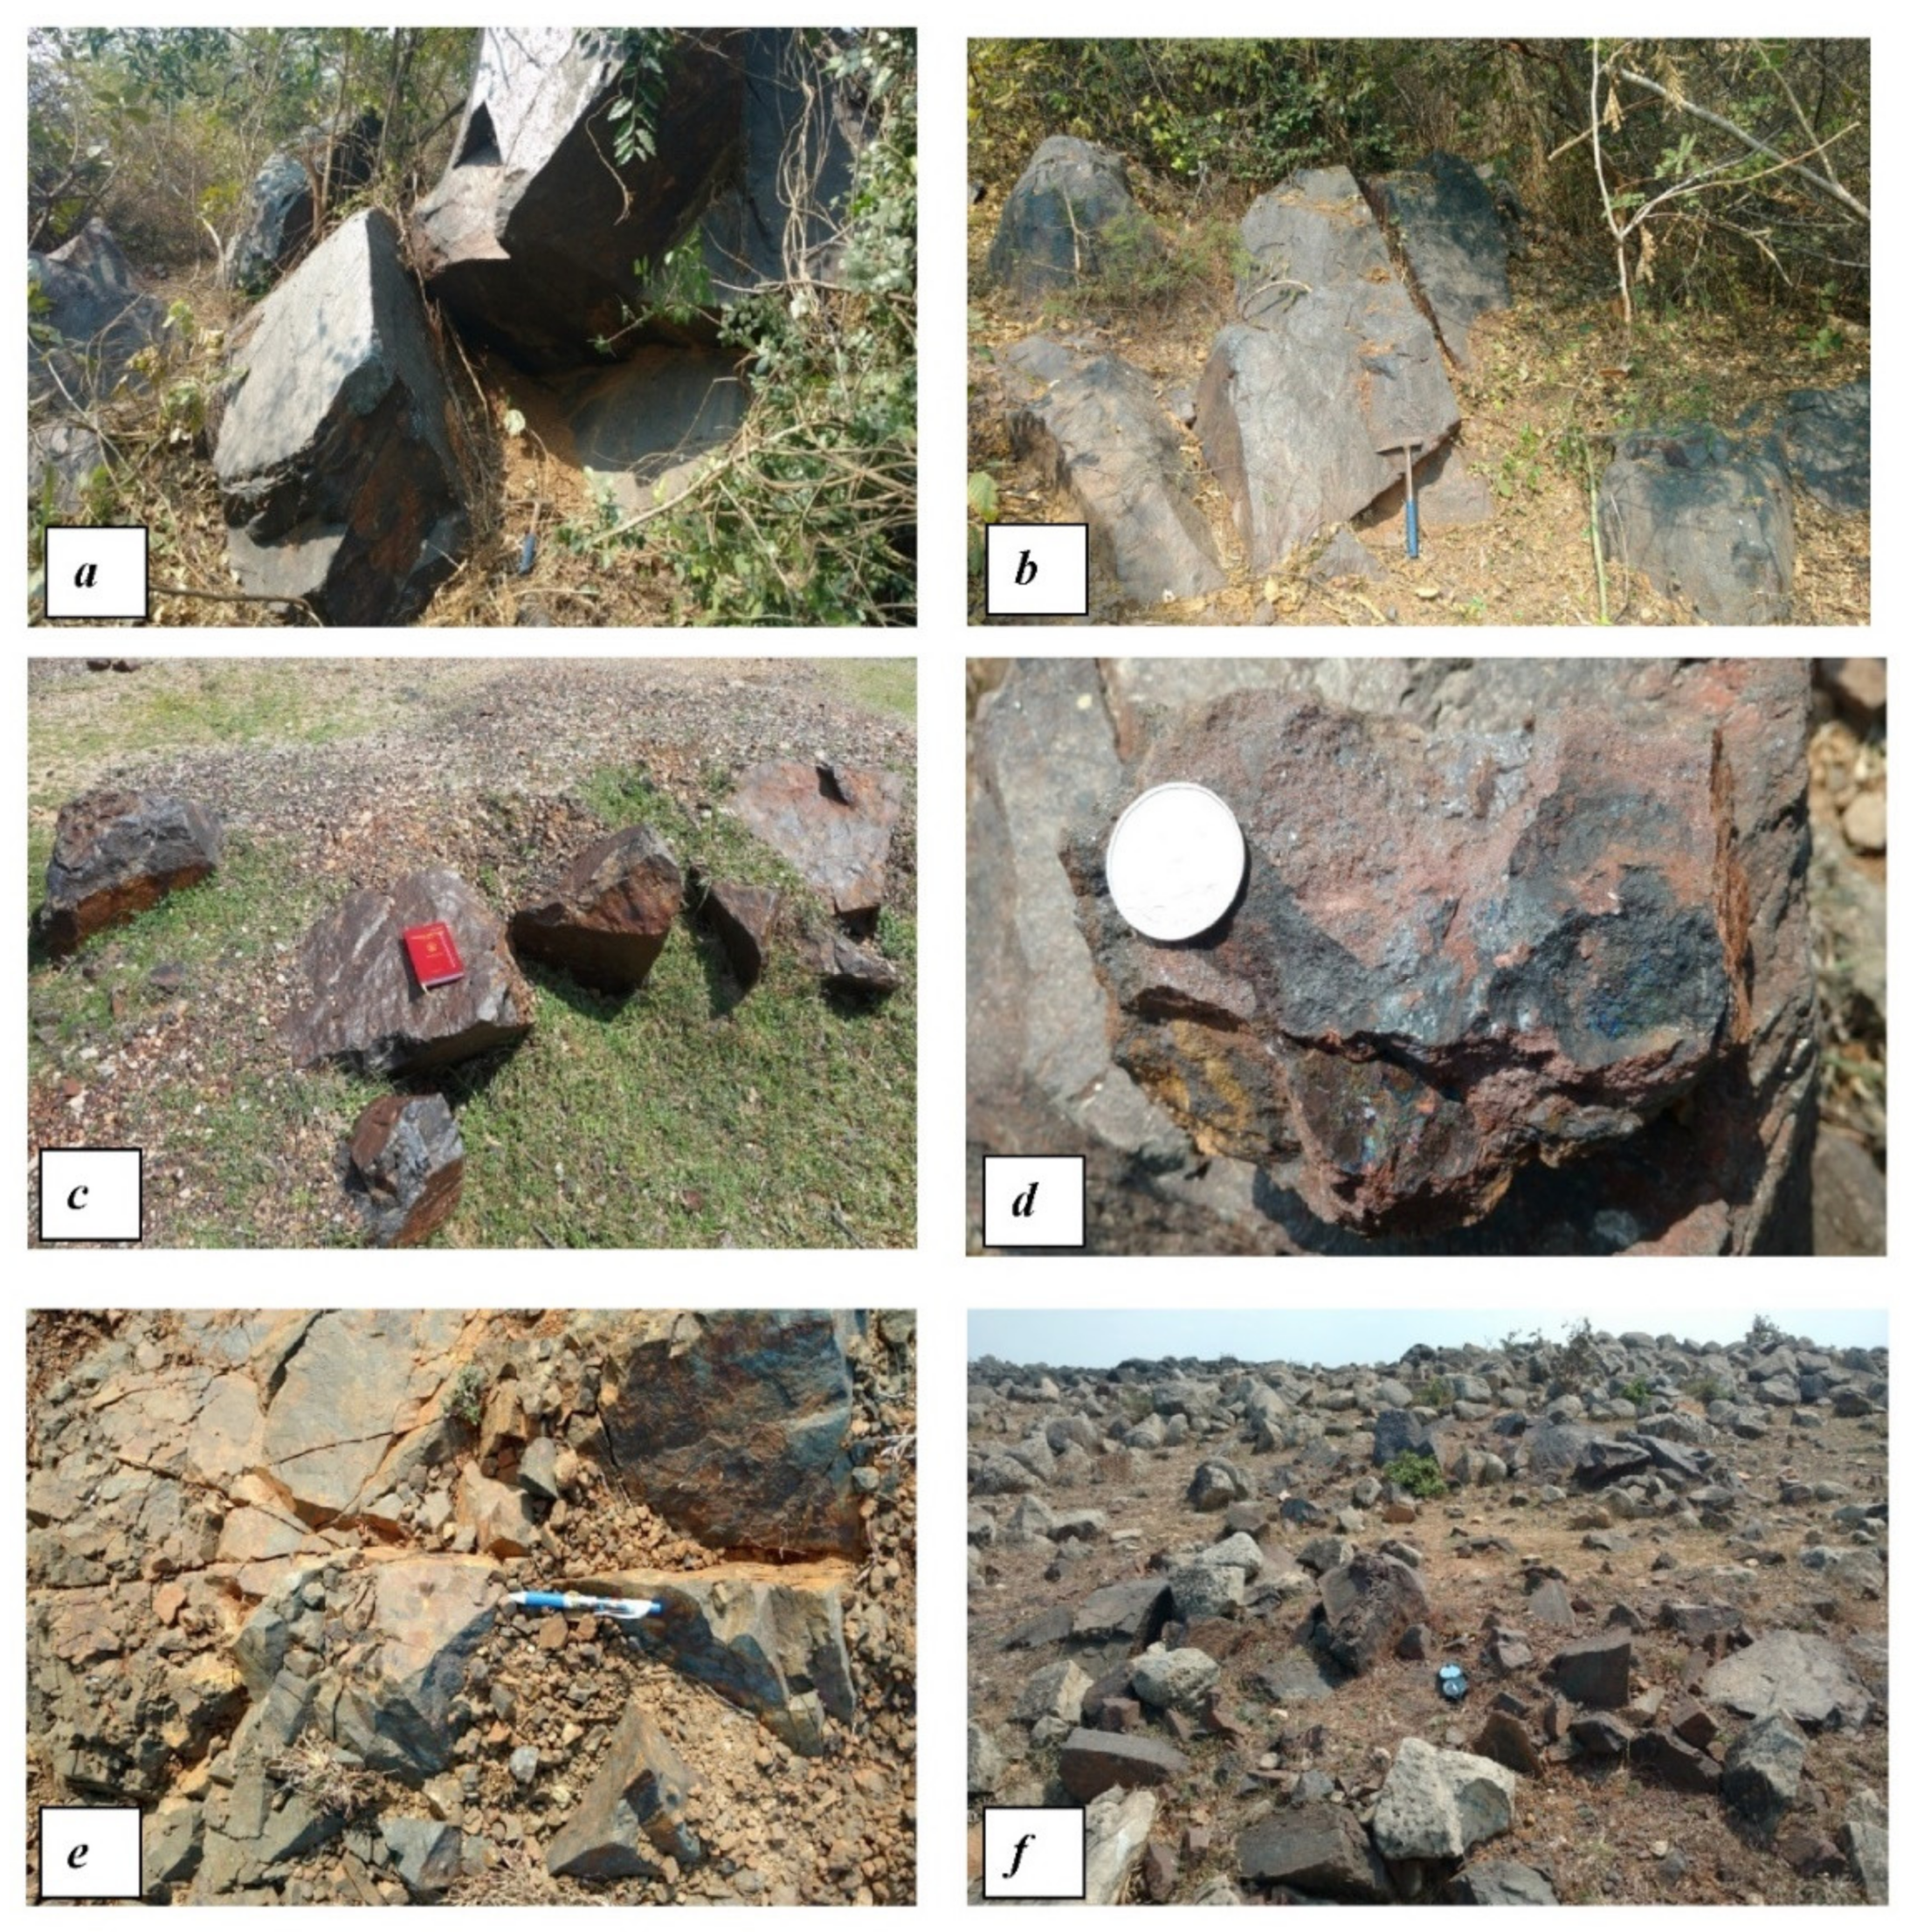