
Microstructure and Mechanical Properties of Fly Ash-Based Geopolymer Cementitious Composites

Abstract
:1. Introduction
2. Materials and Methods
2.1. Materials
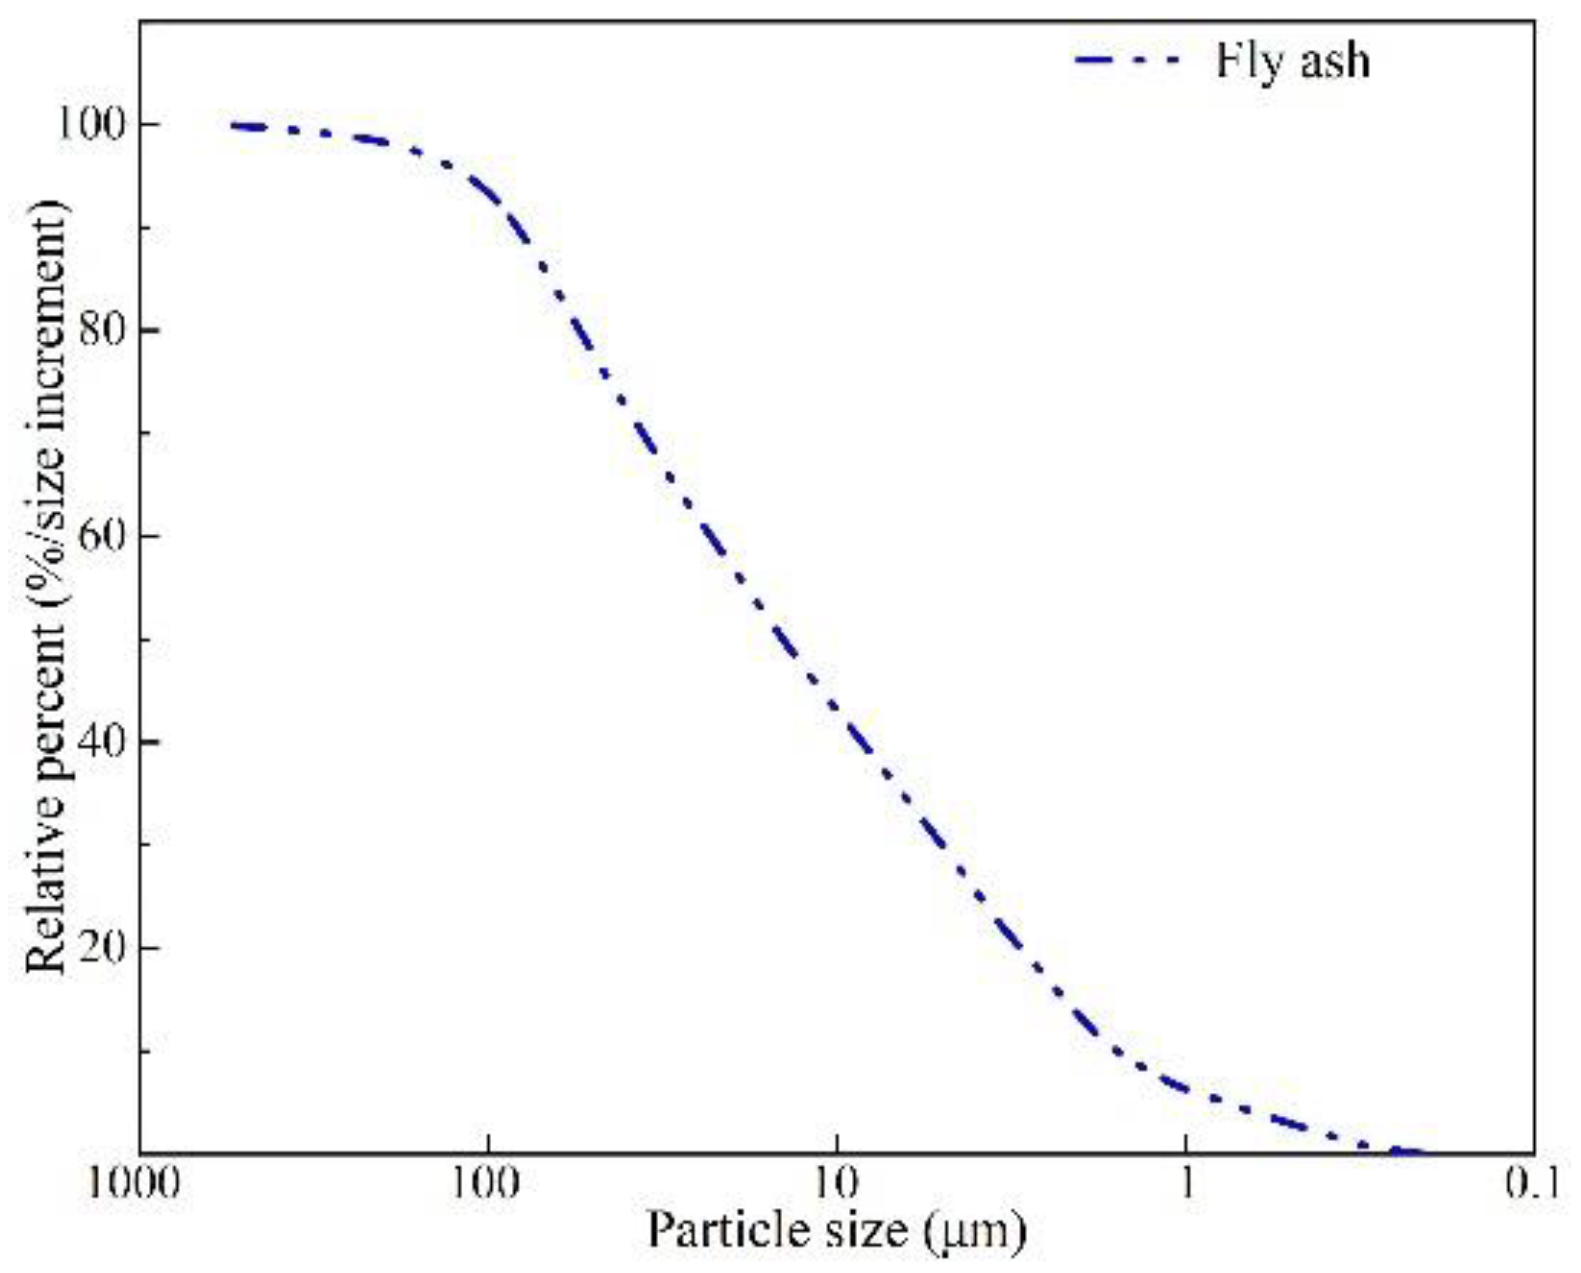
2.1.1. Fly Ash
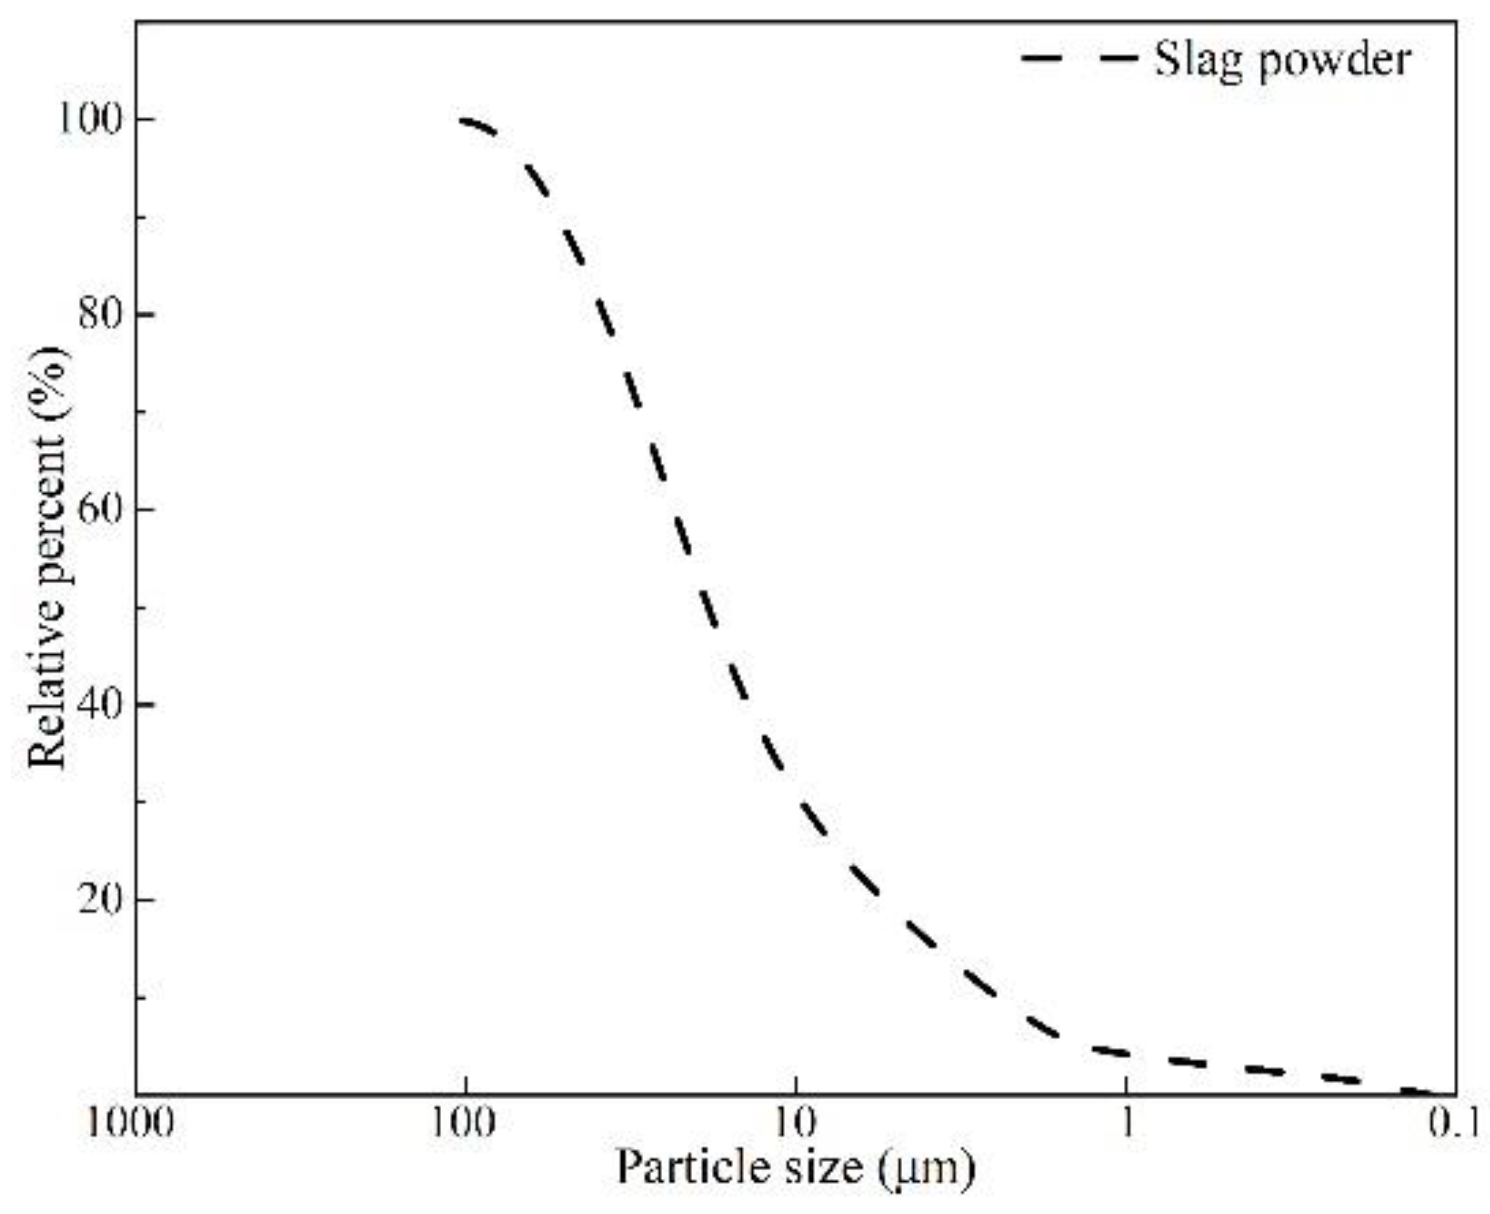
2.1.2. Slag
2.1.3. Alkali Activators
2.2. Orthogonal Experimental Design
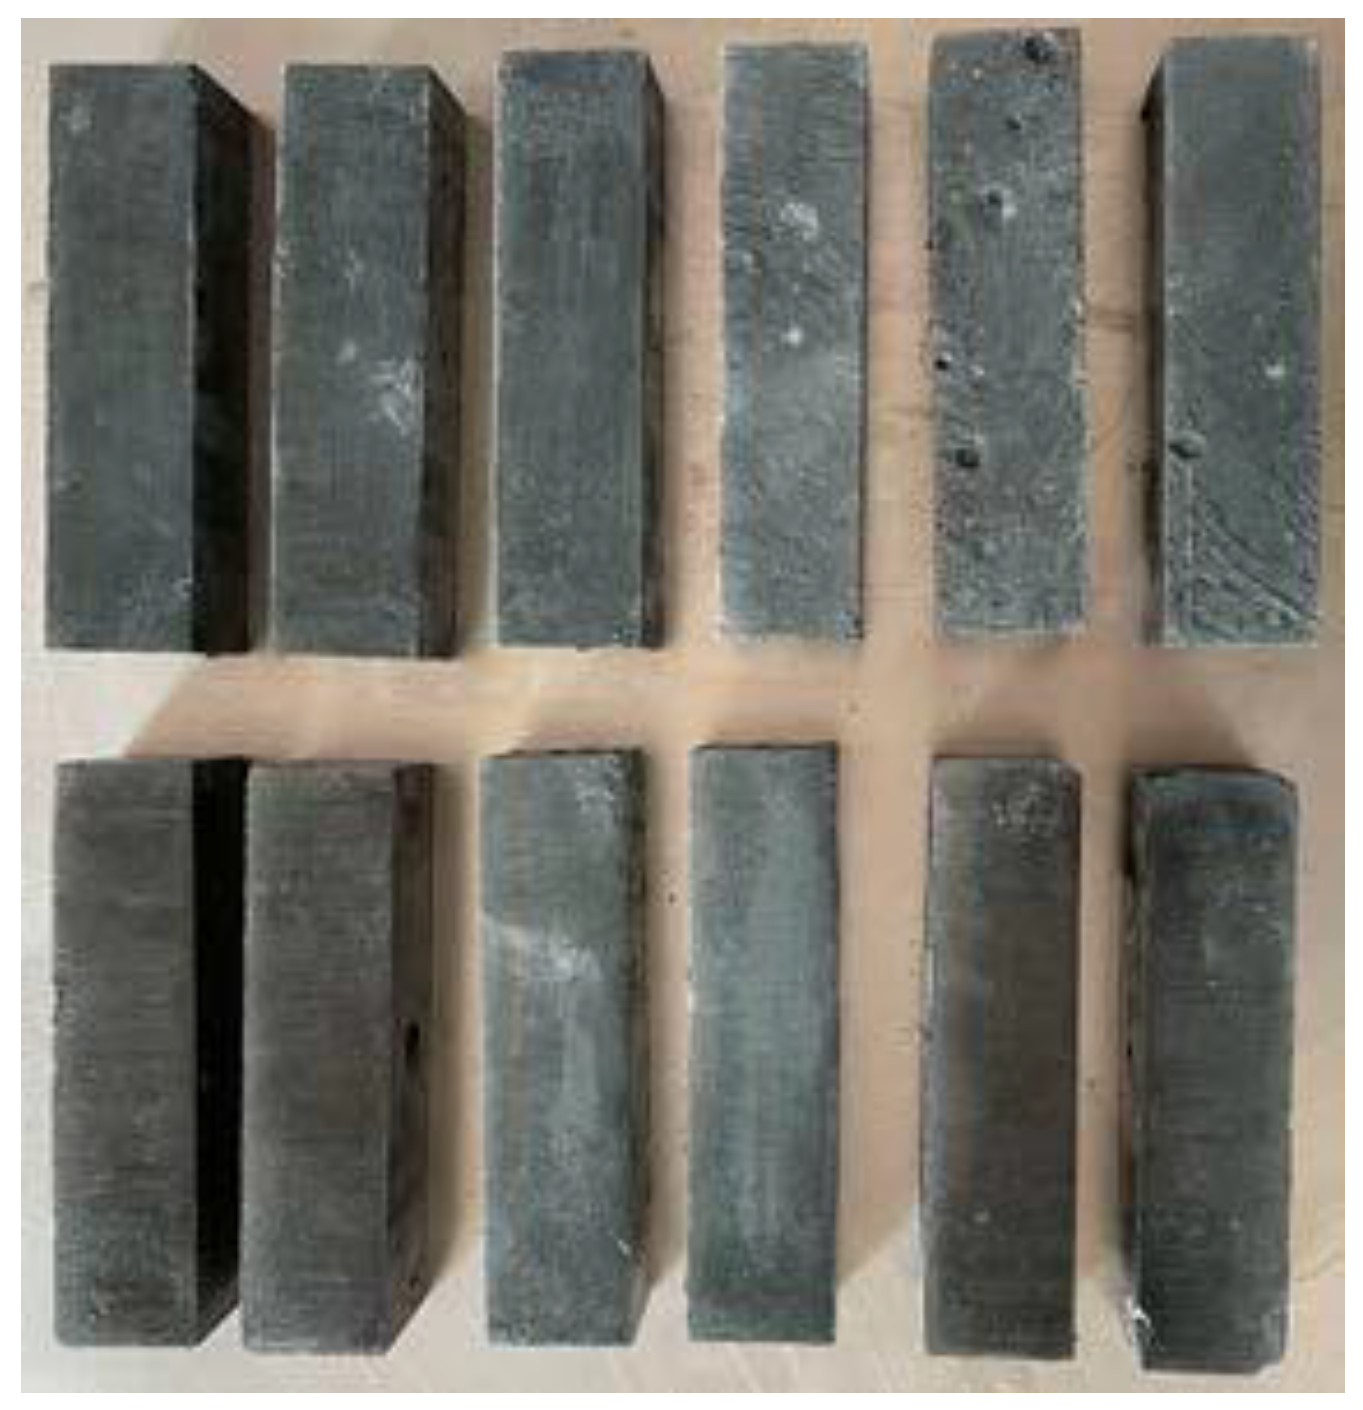
2.3. Sample Preparation
2.4. Test Method
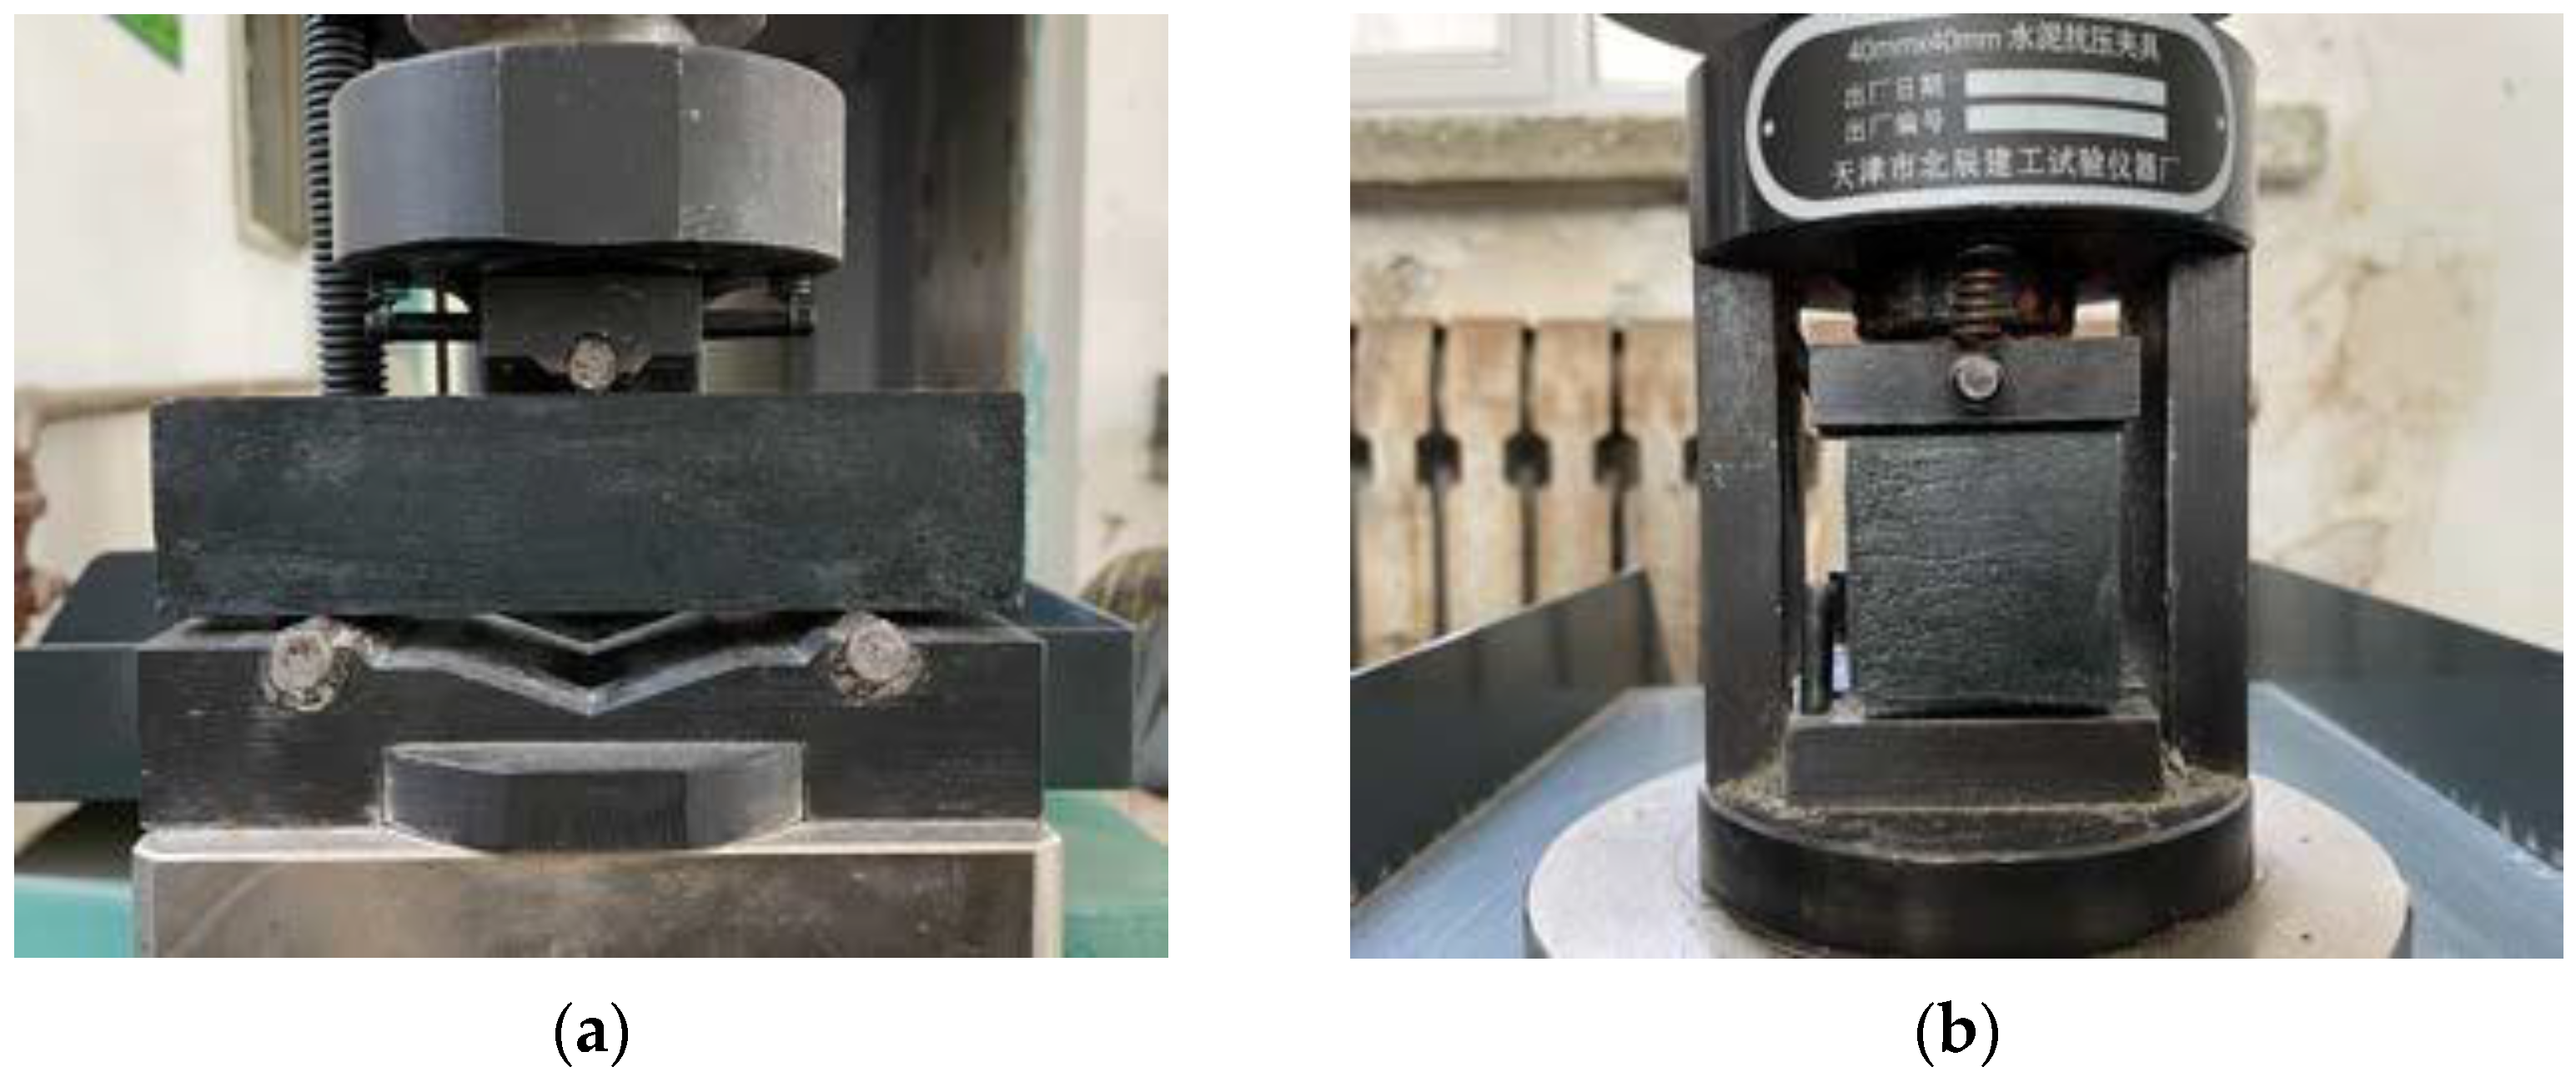
2.4.1. Mechanical Properties Testing
2.4.2. Orthogonal Test
2.4.3. Microstructure Testing
3. Results and Discussion
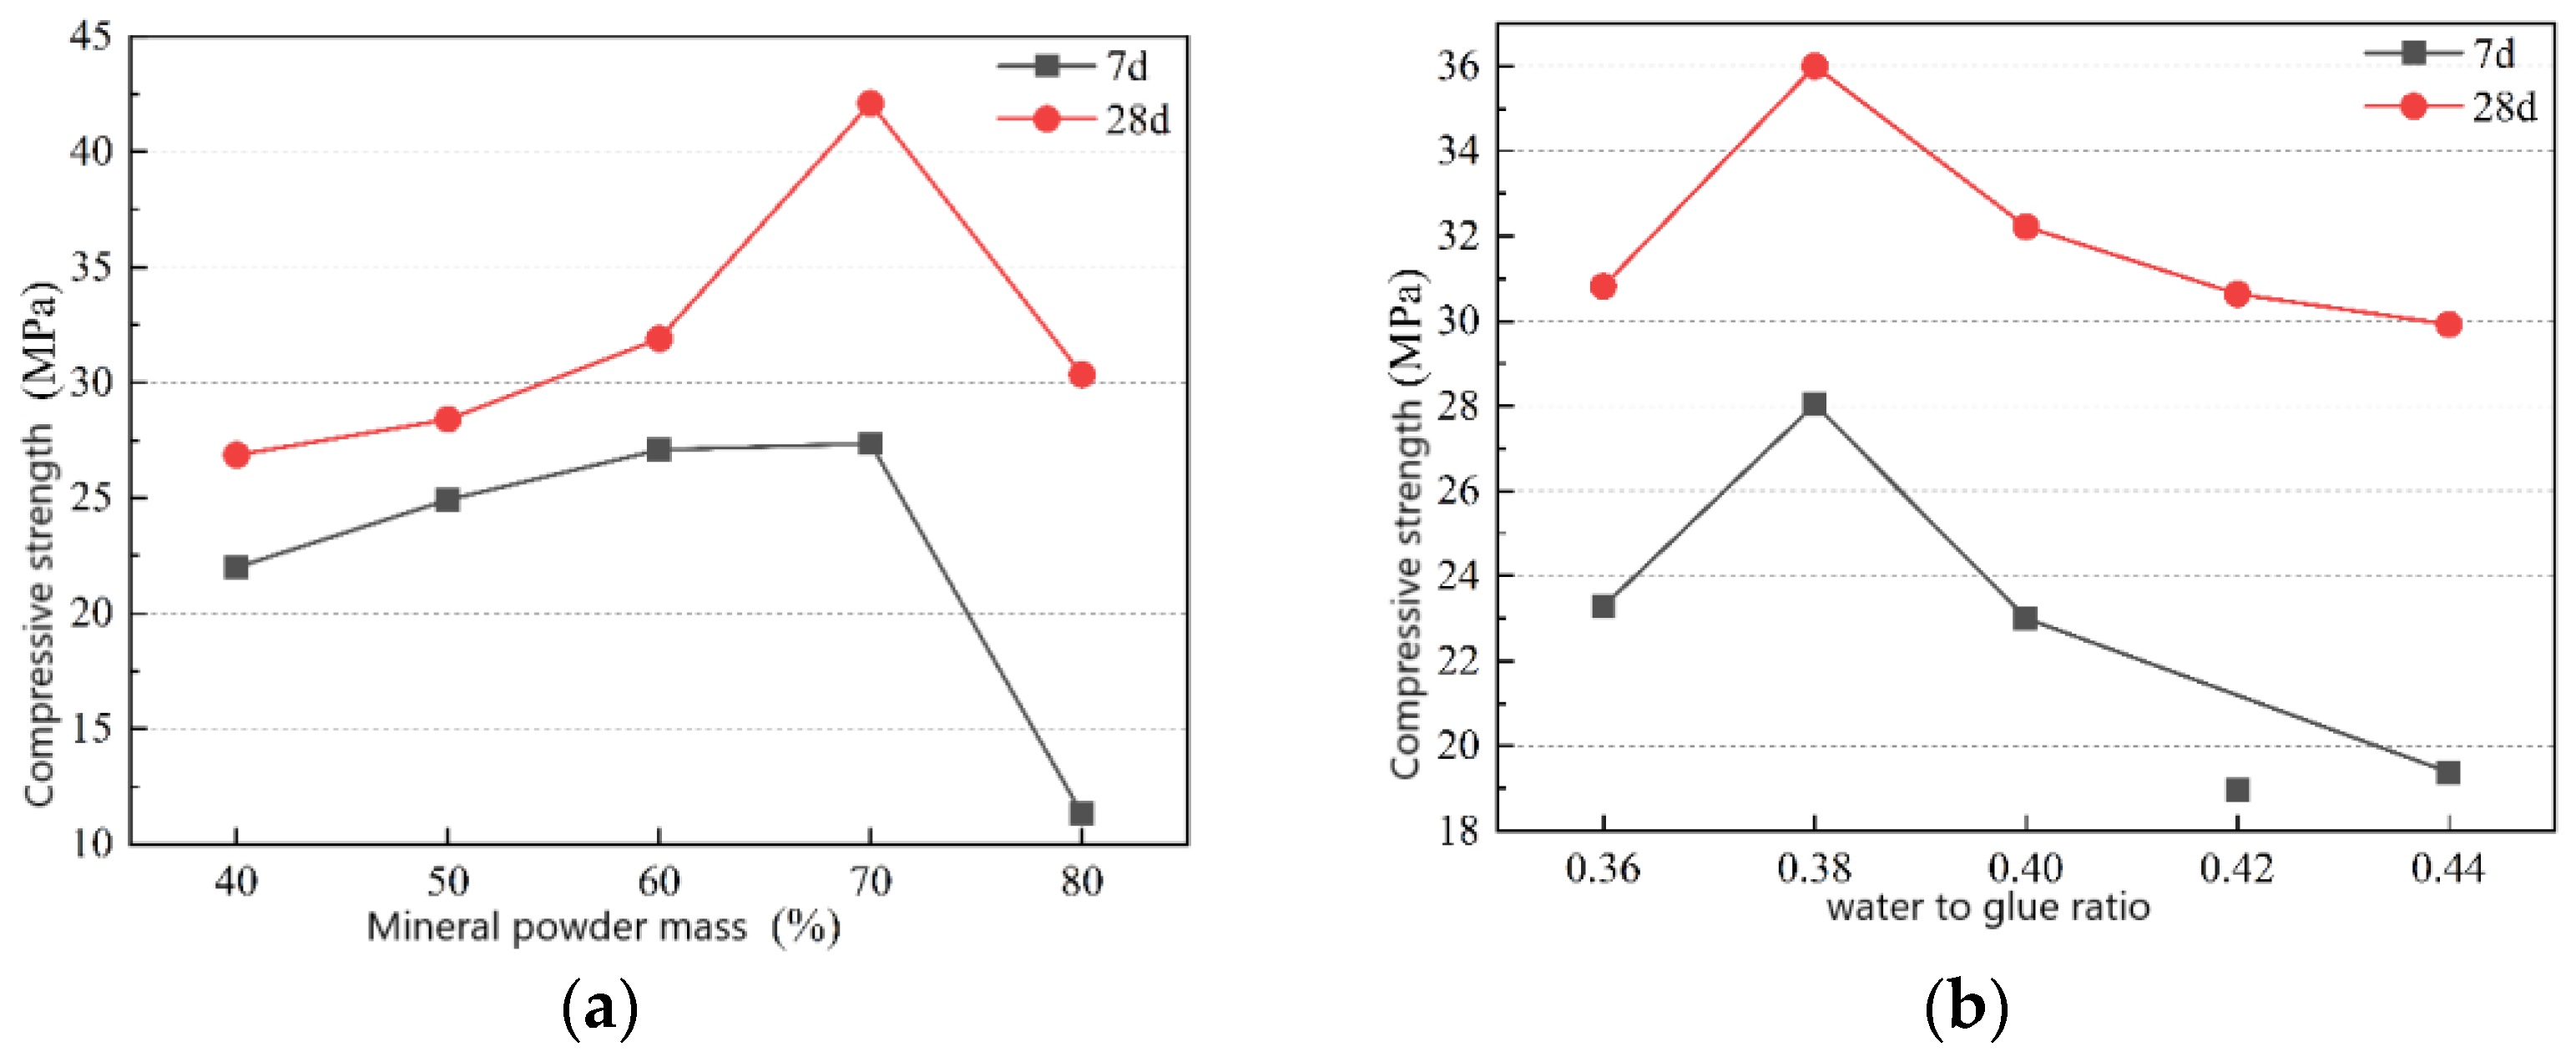
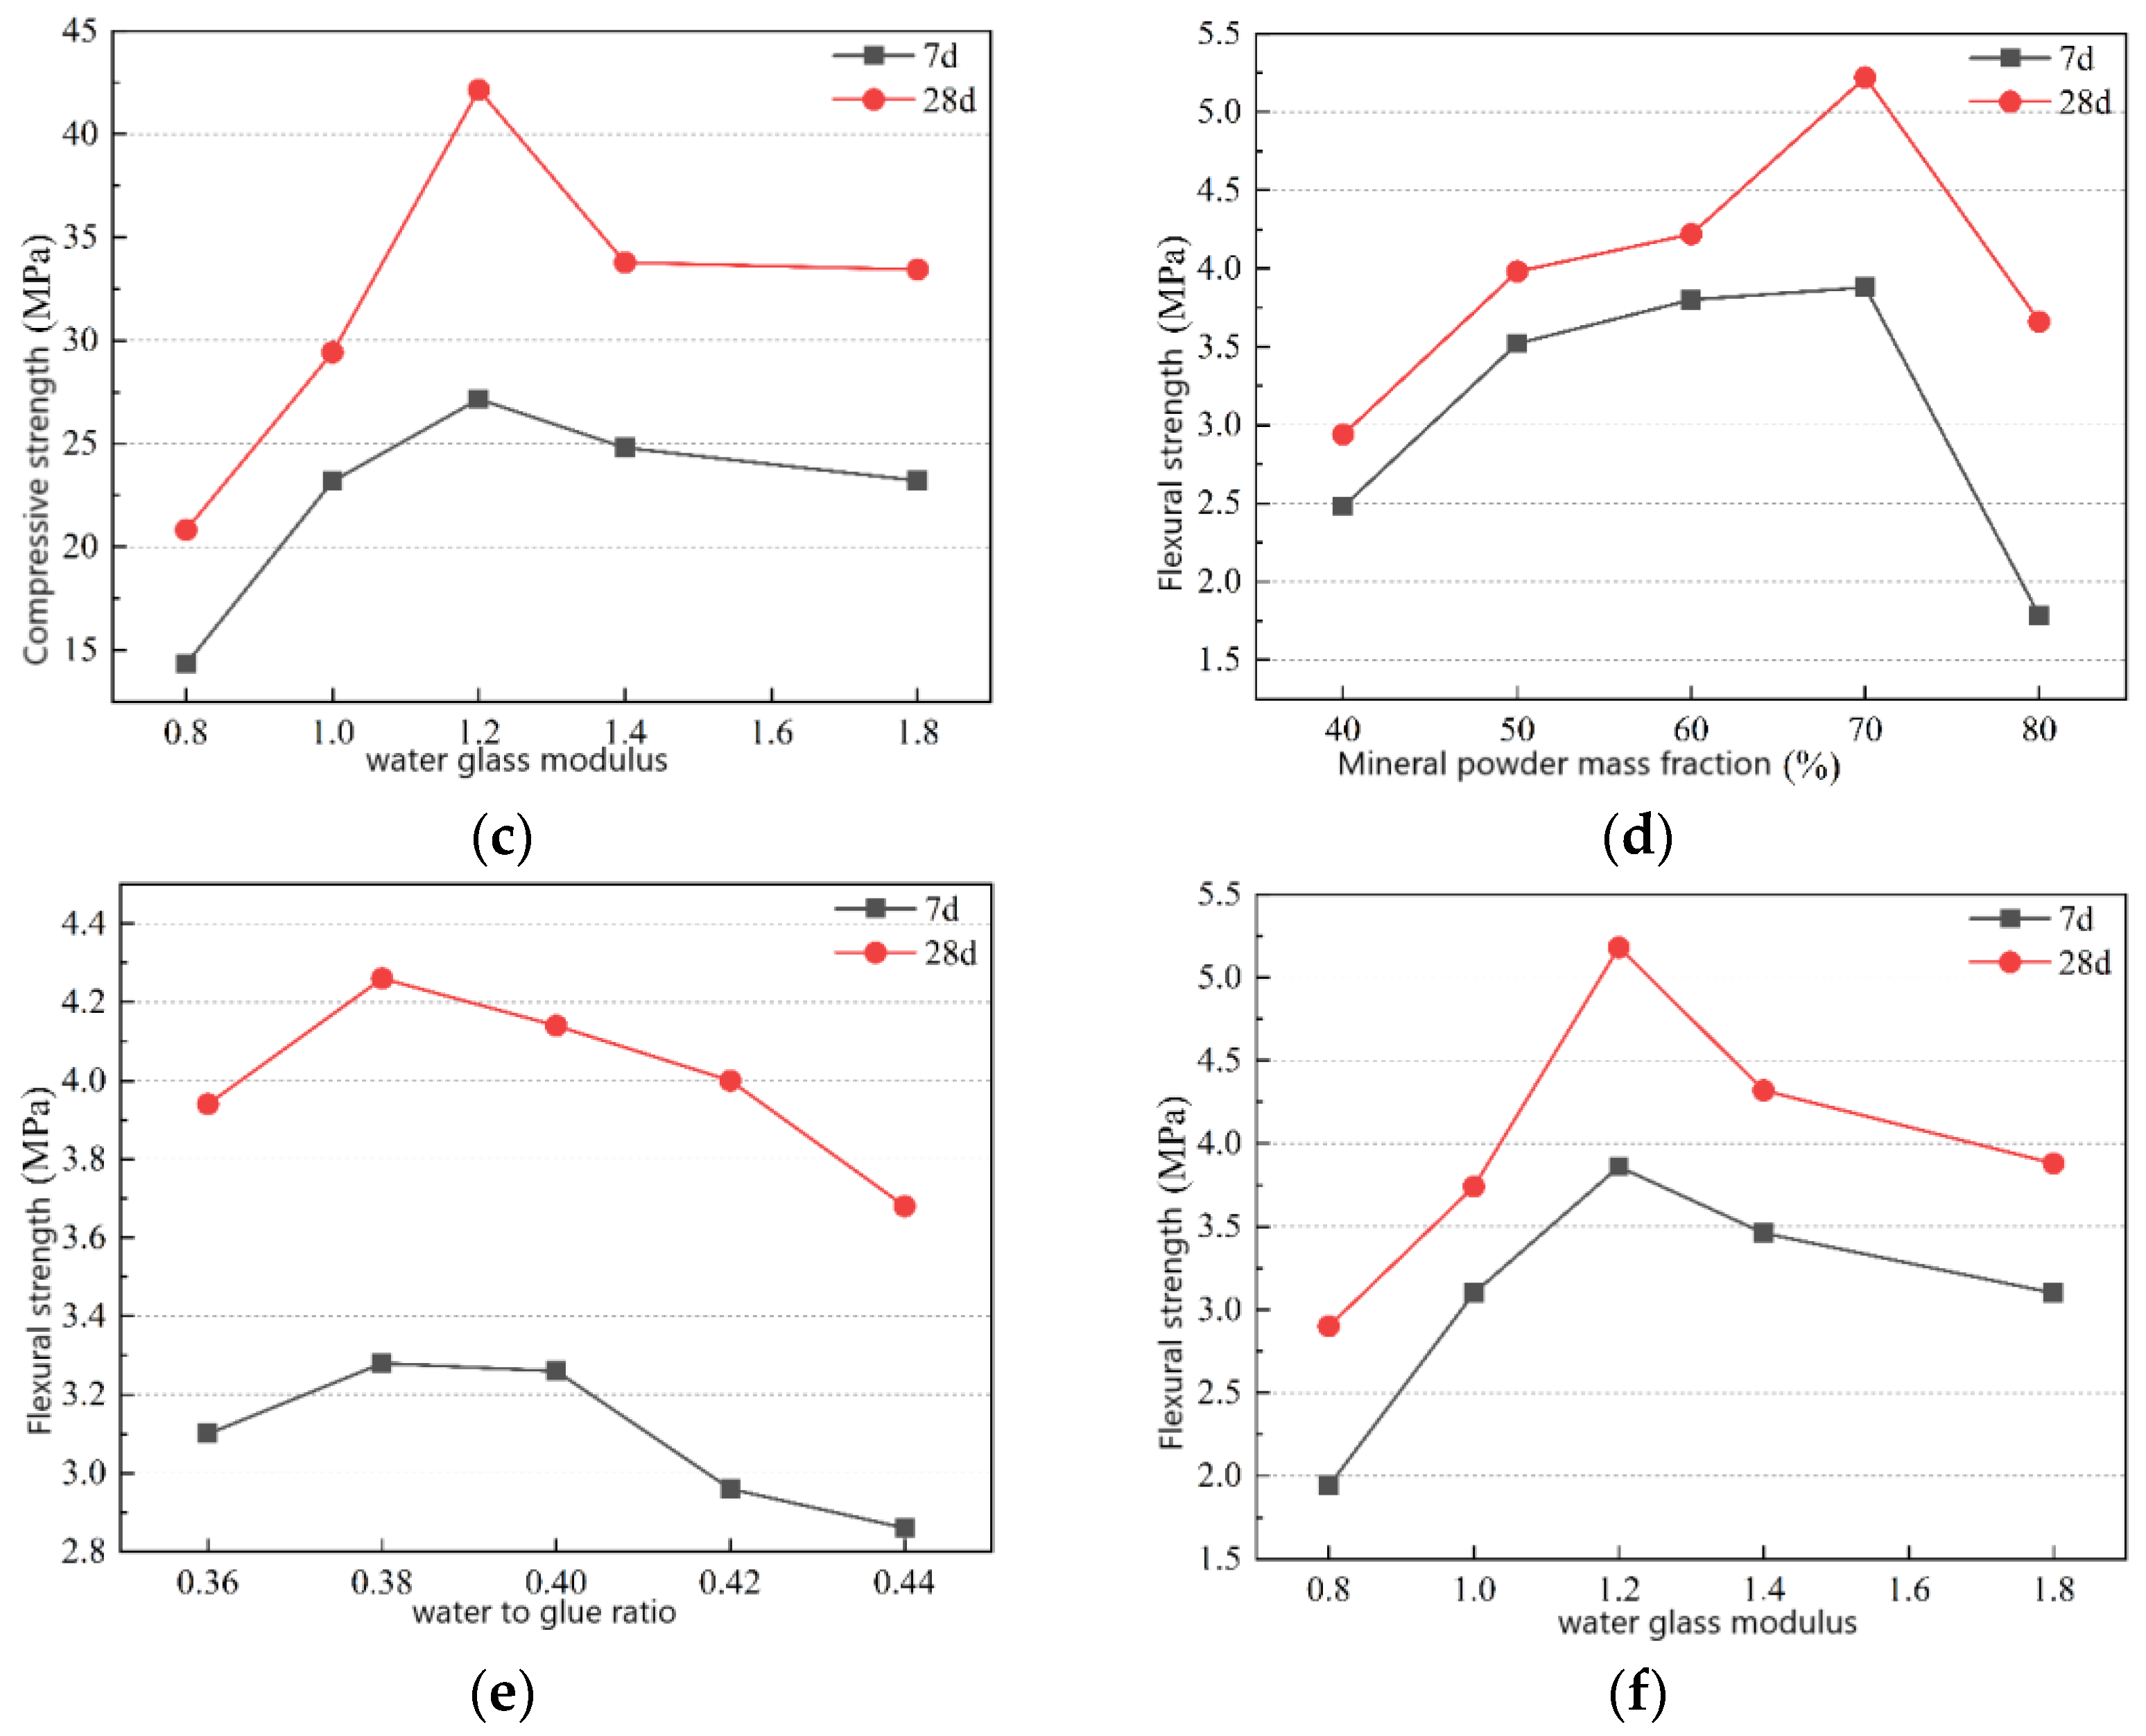
3.1. Mechanical Properties Analysis
3.2. Microscopic Mechanism Analysis
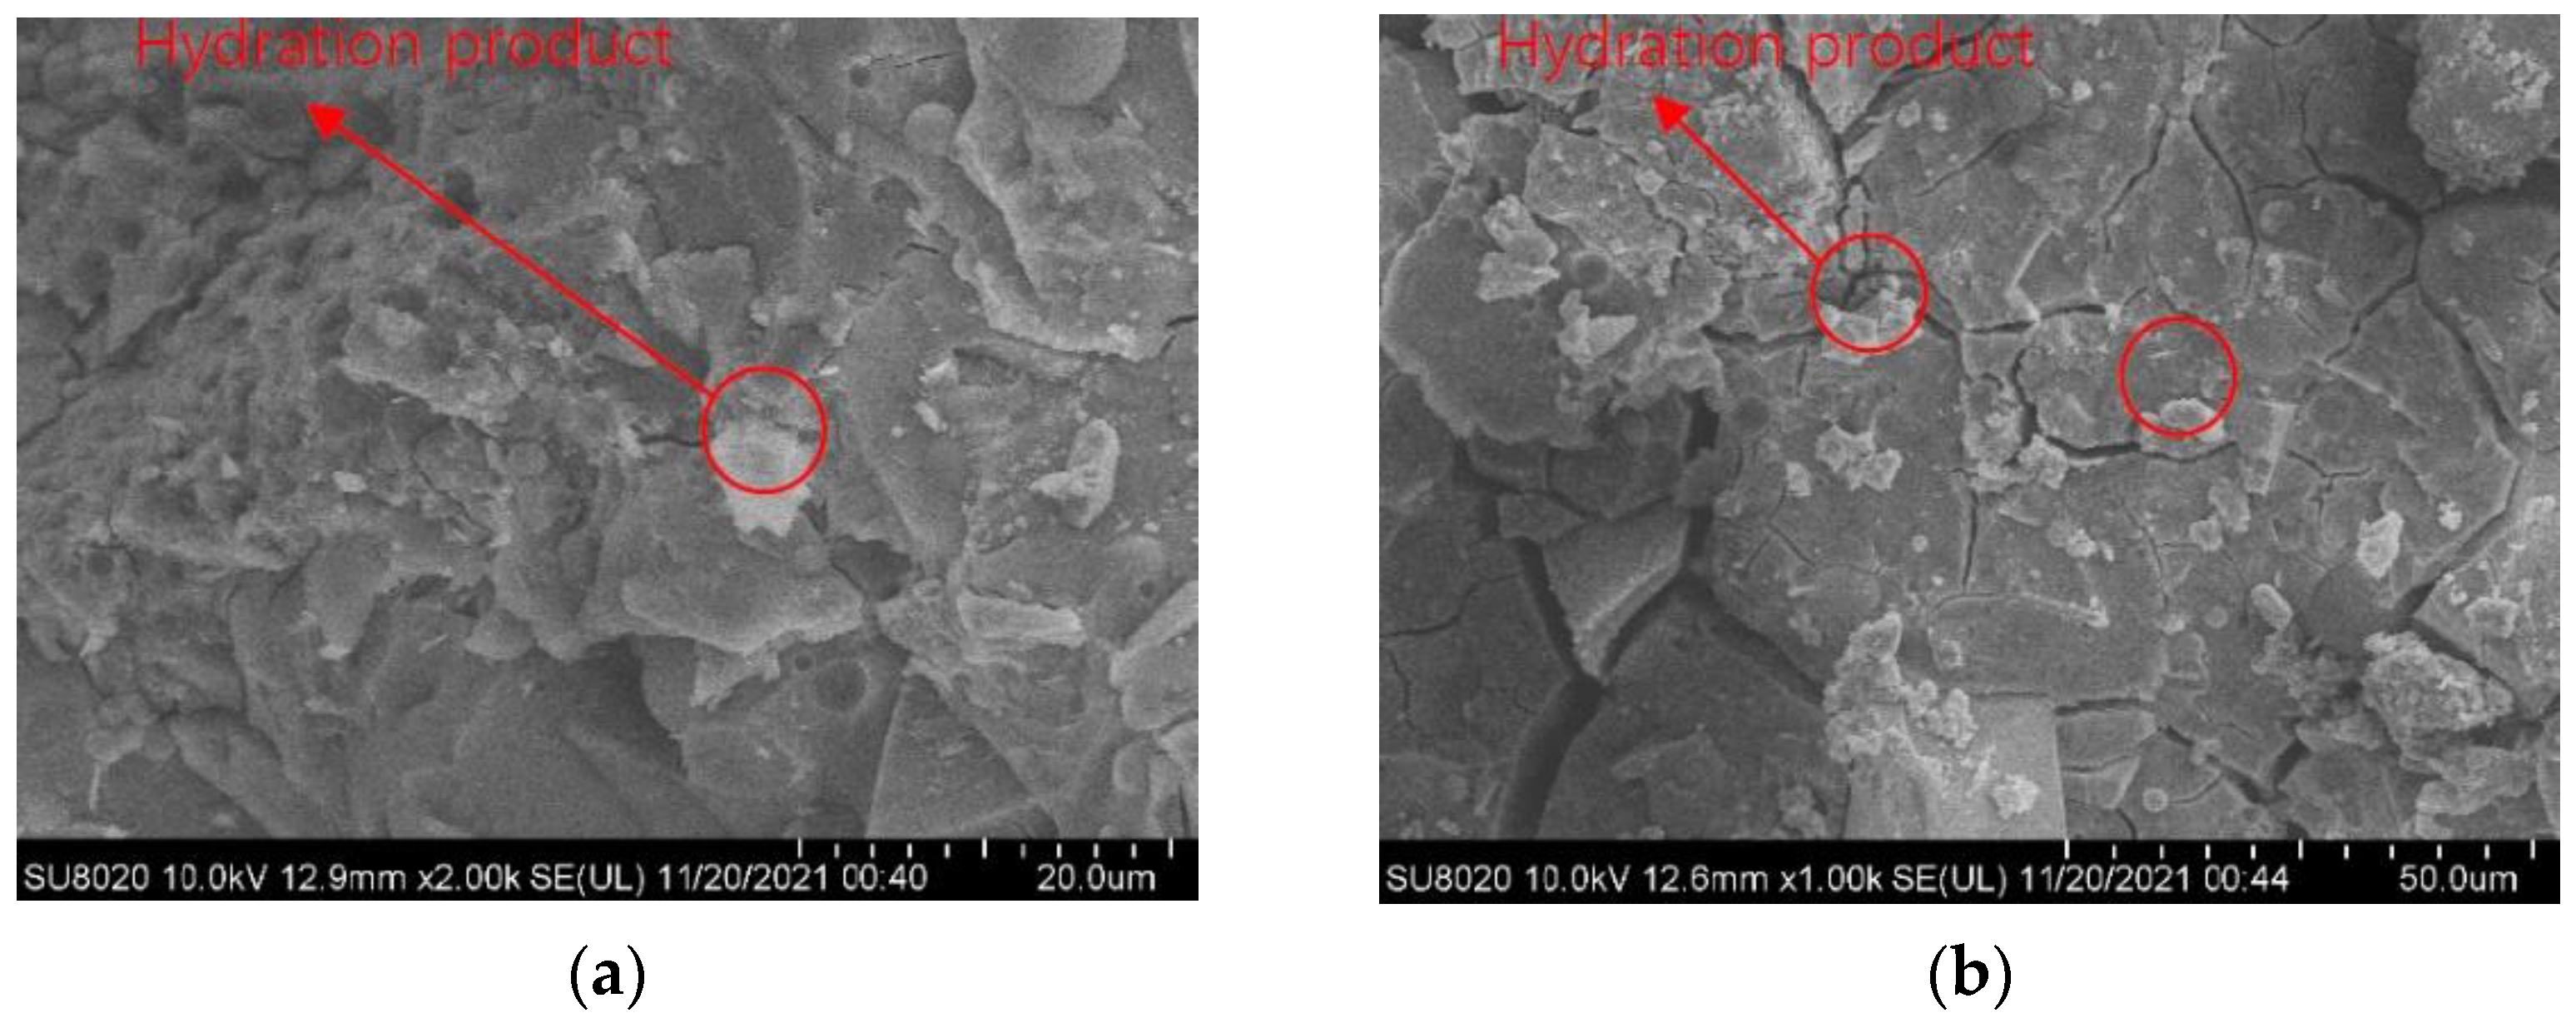
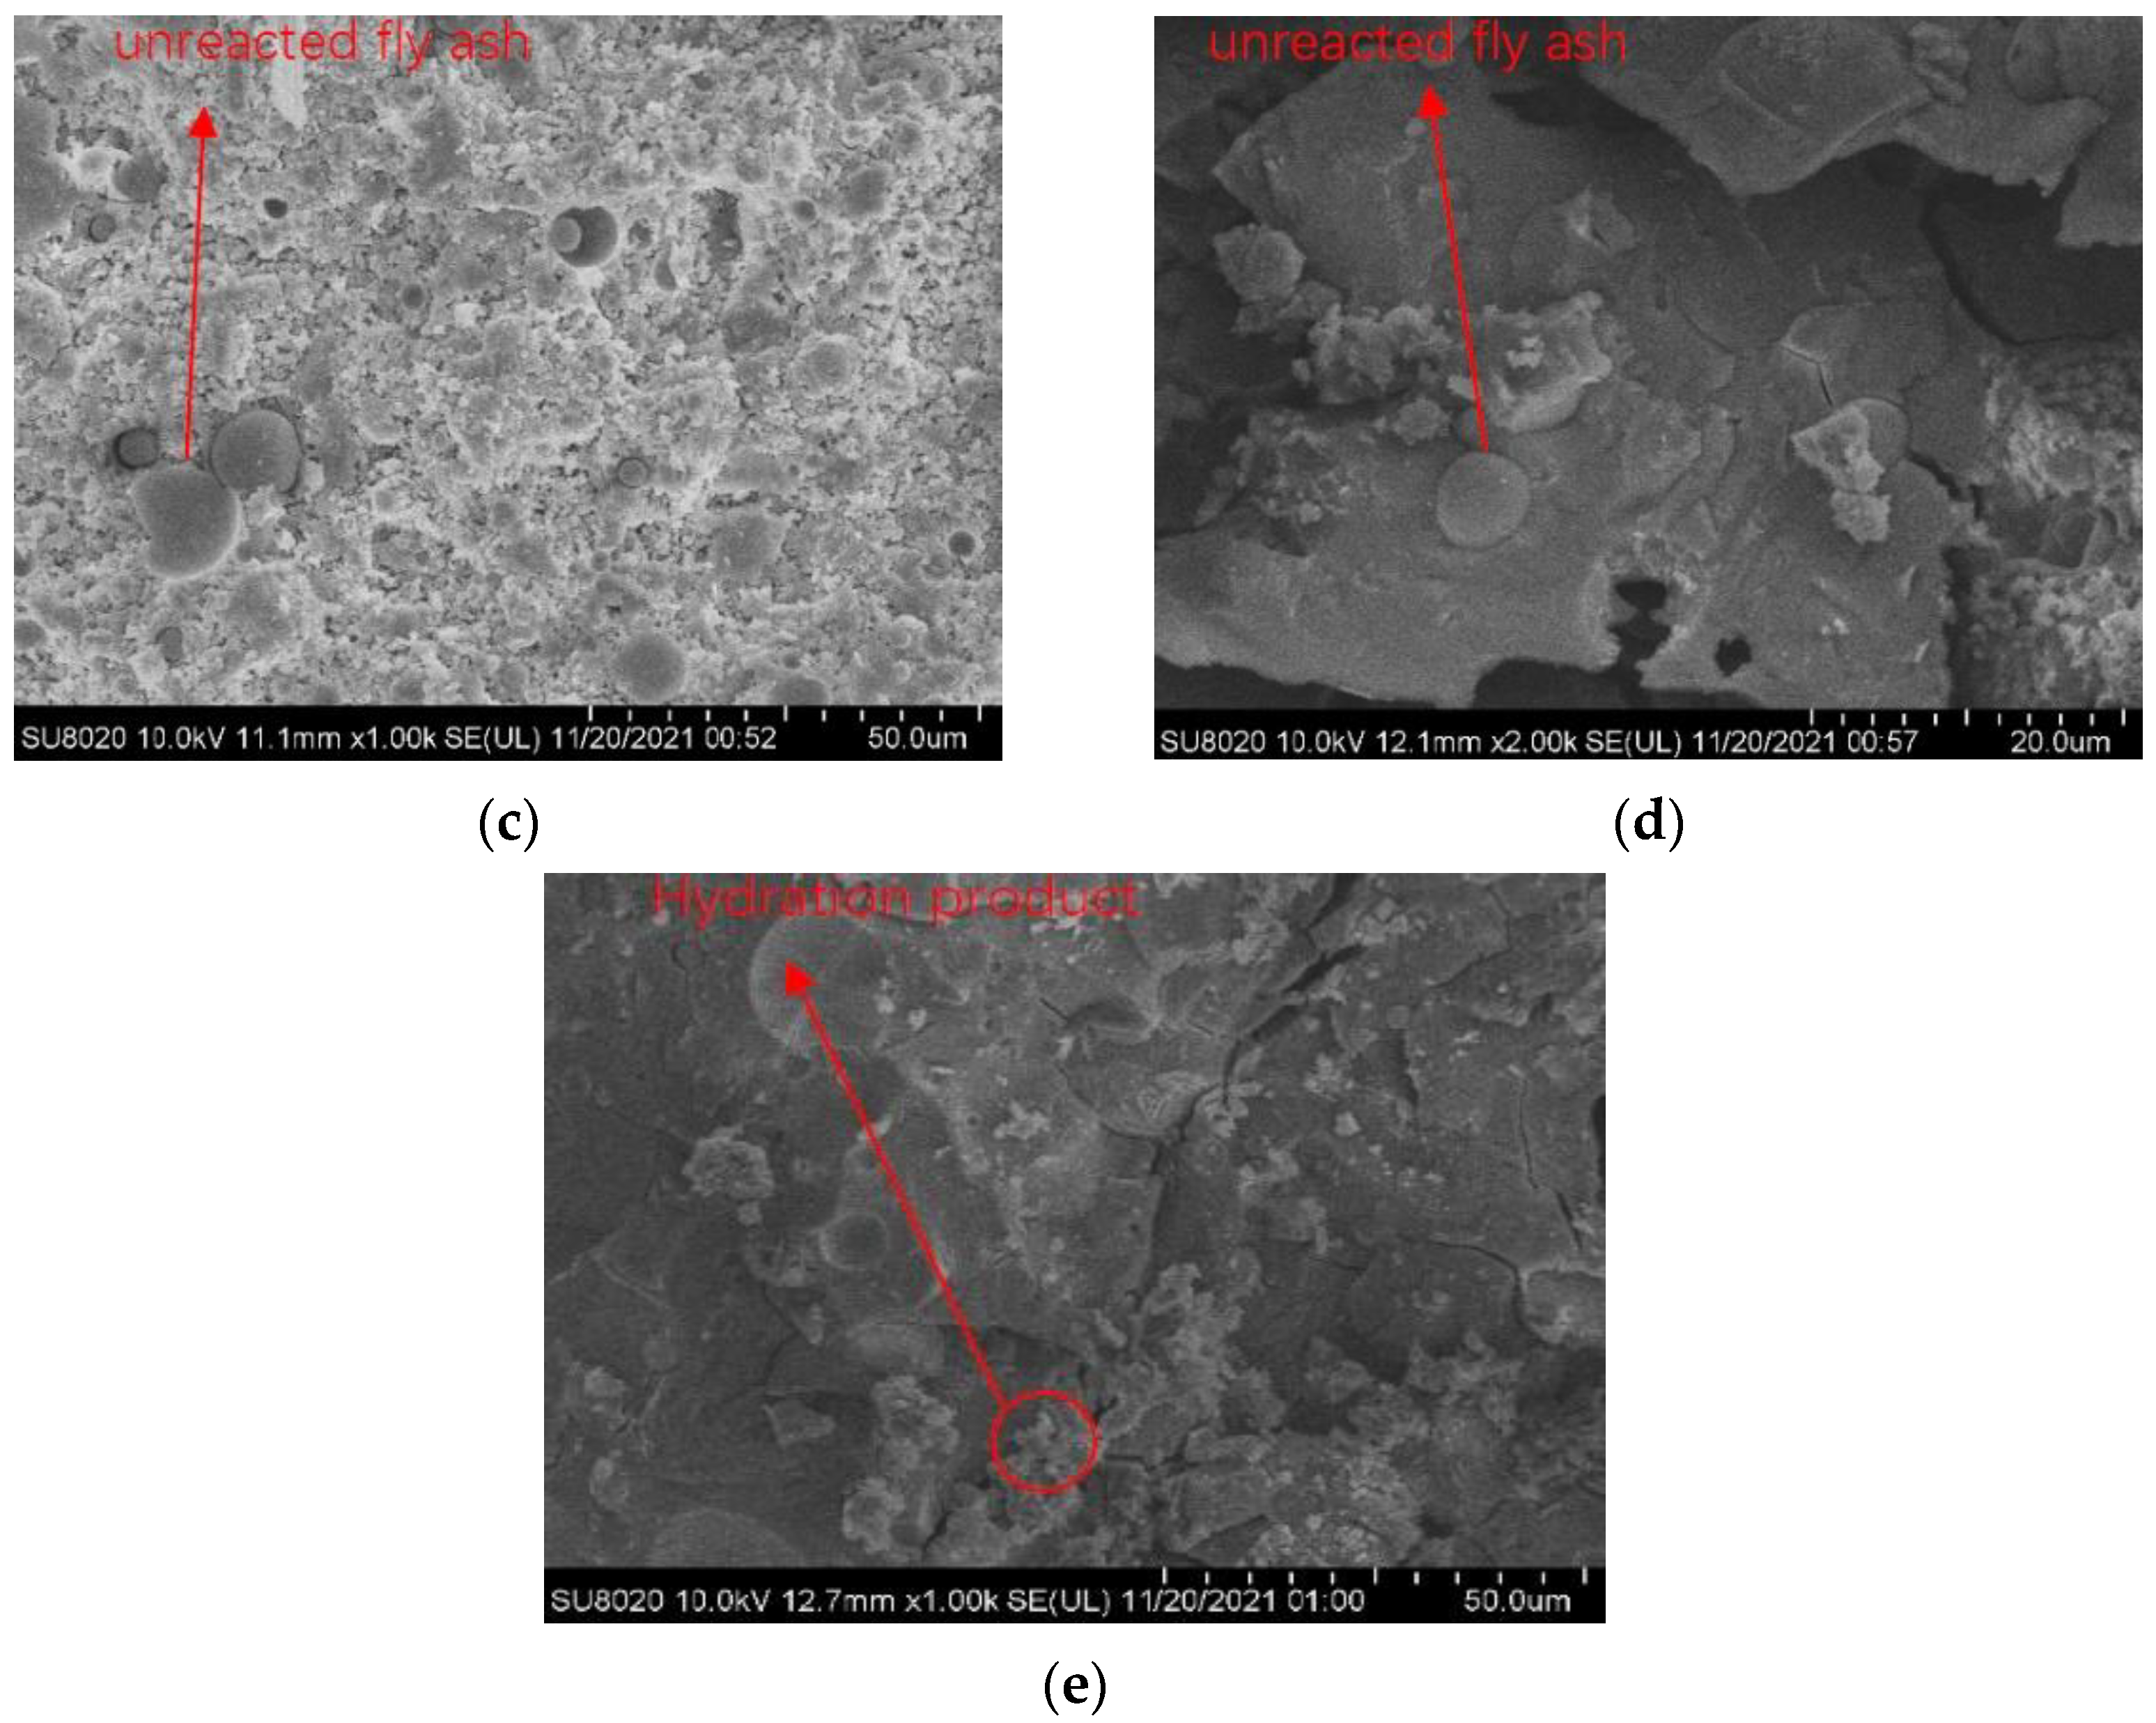
3.2.1. SEM Analysis
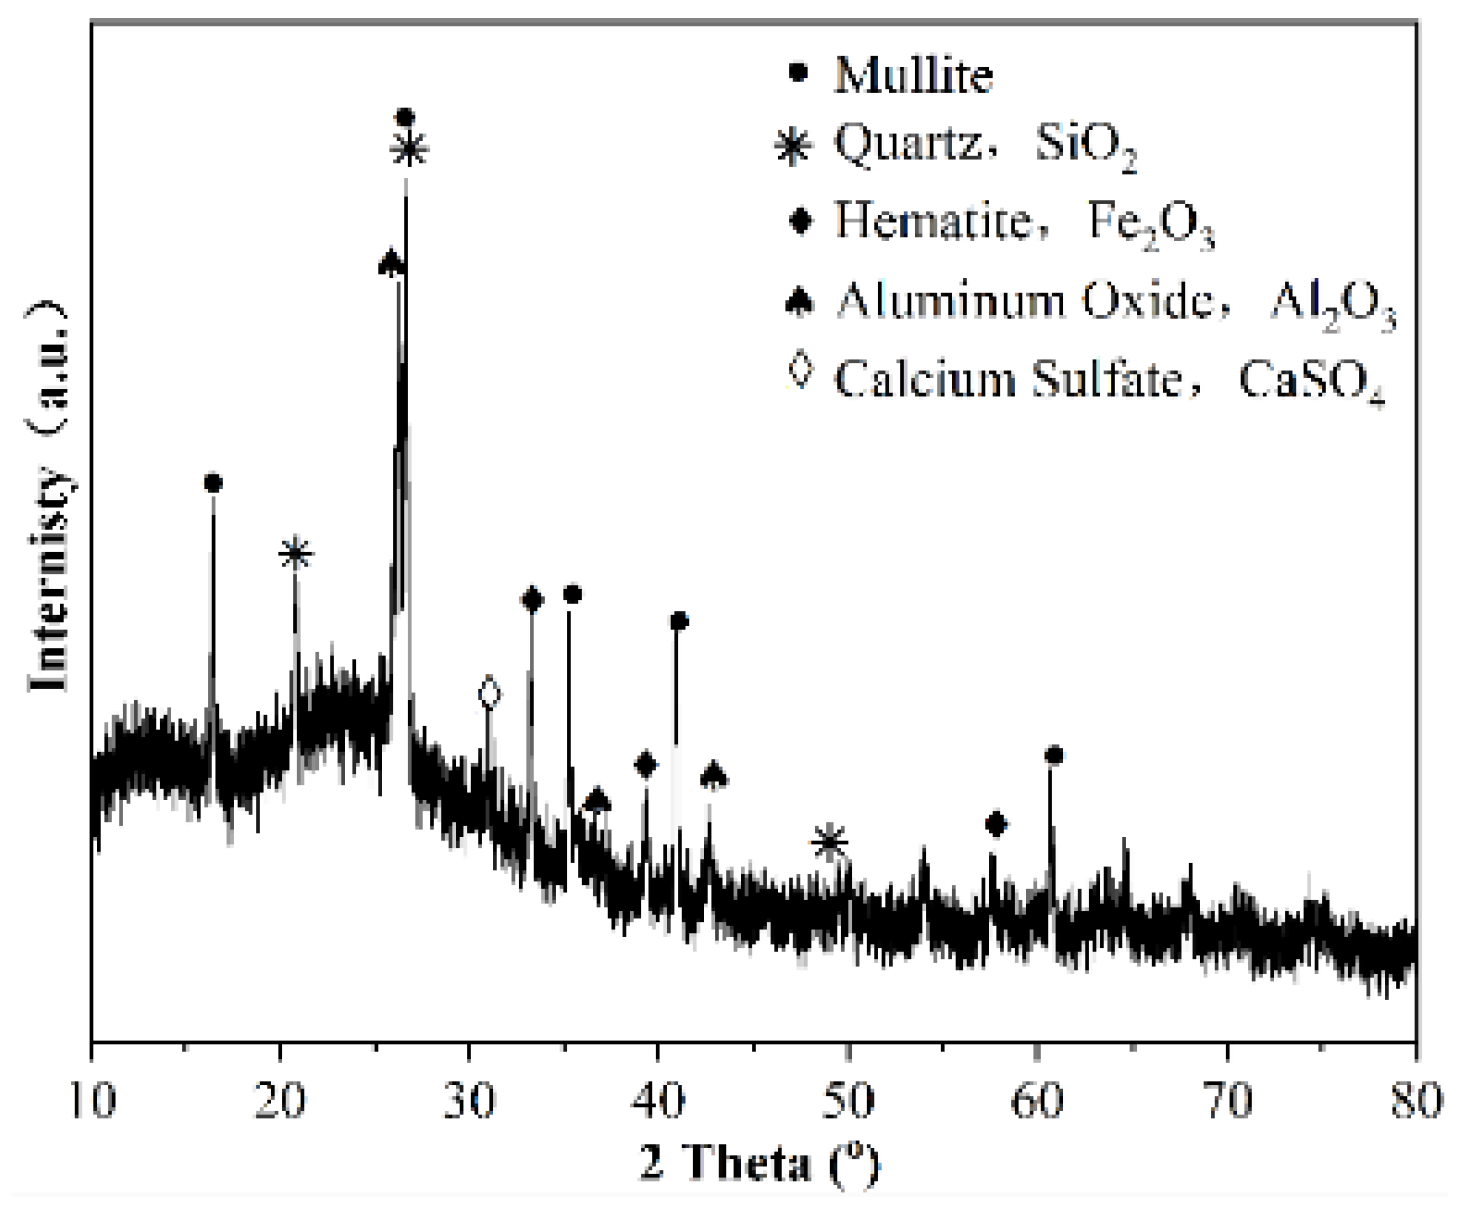
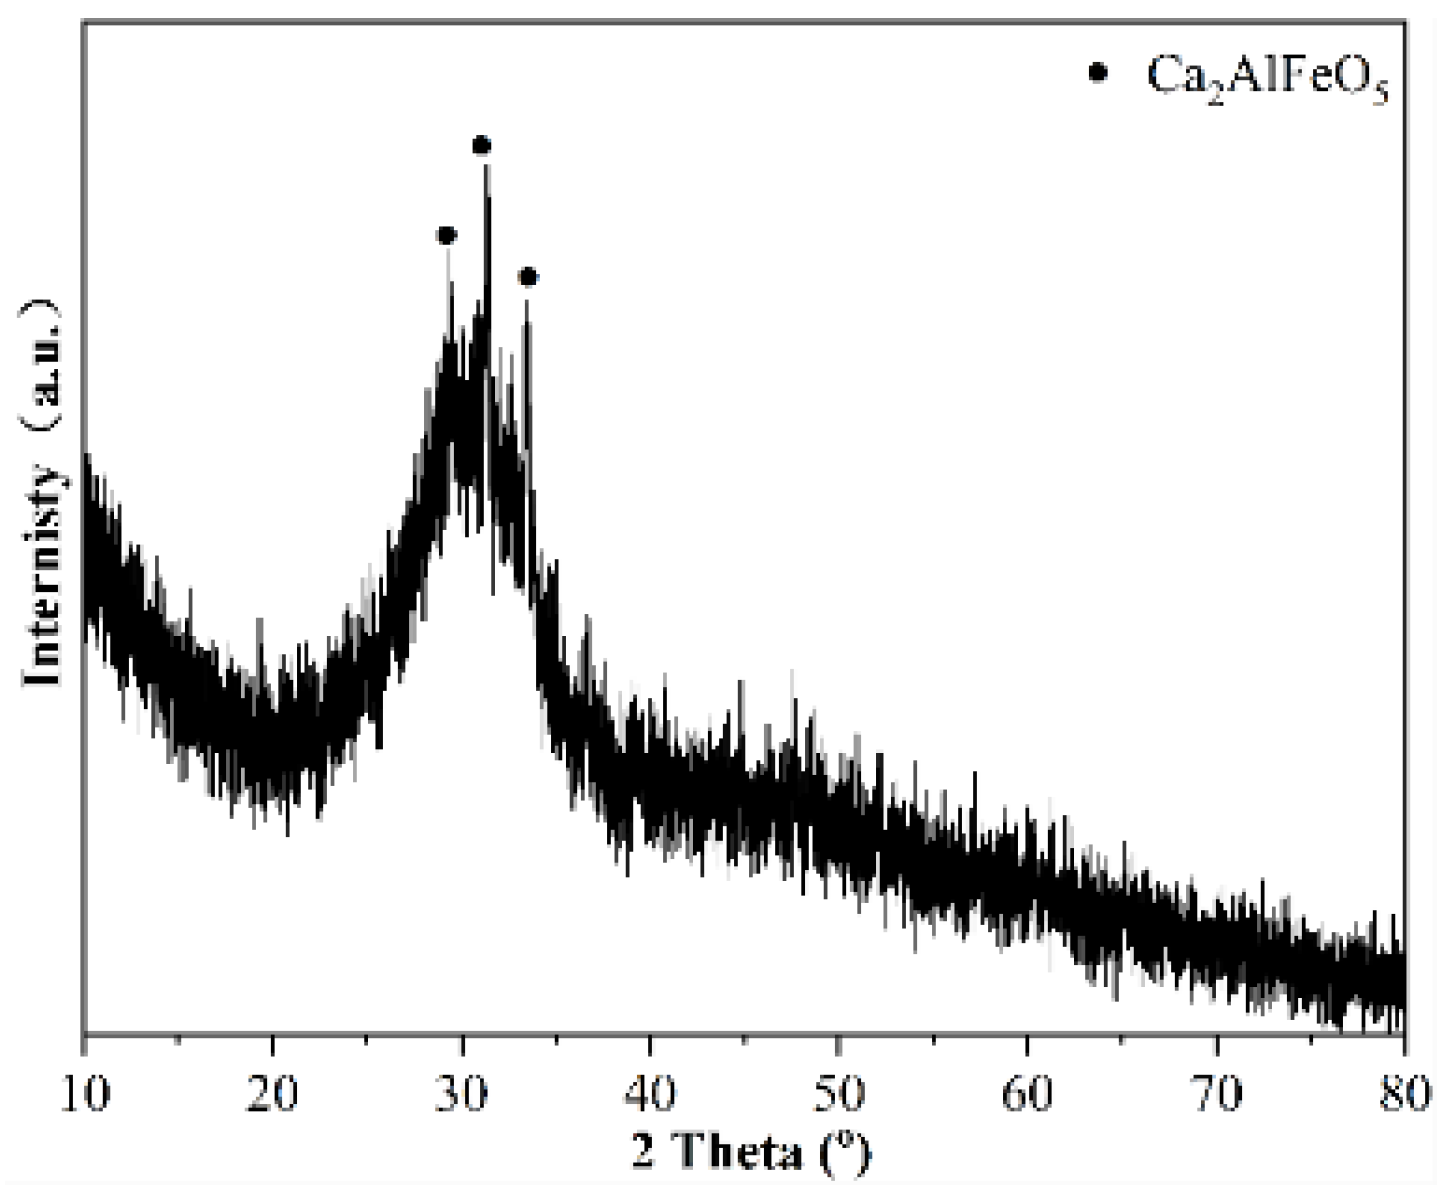
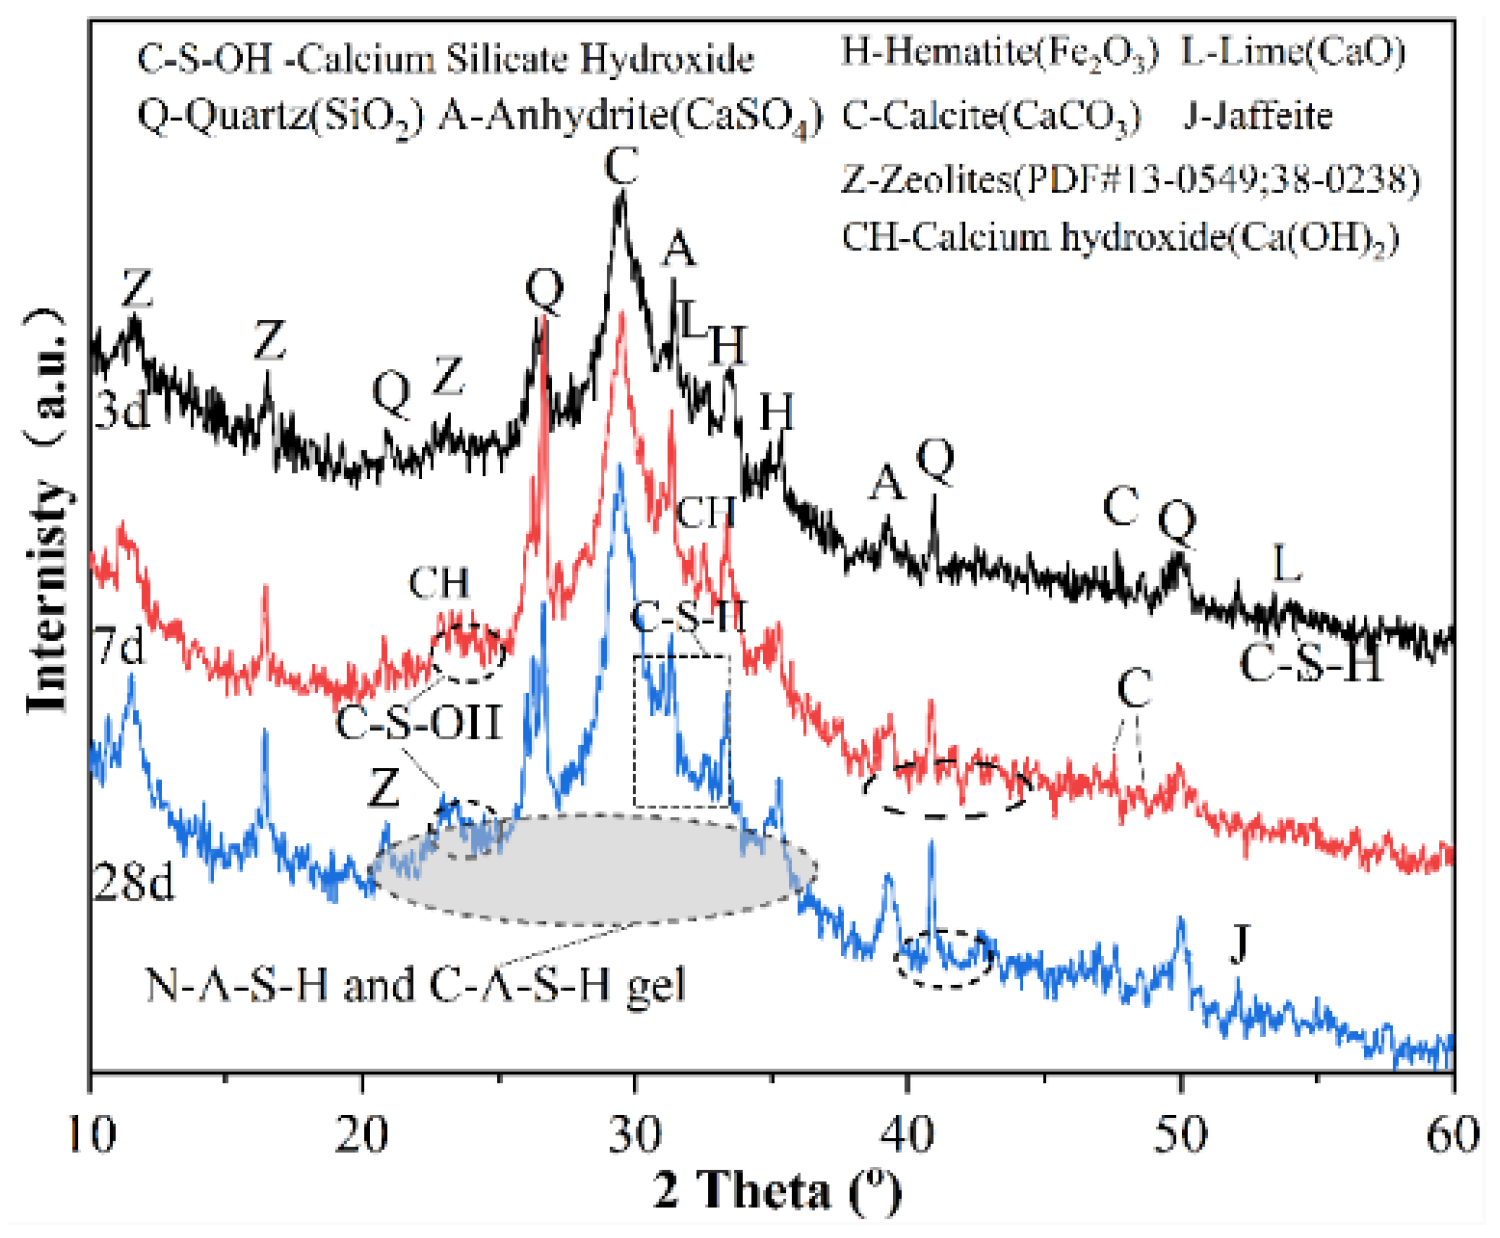
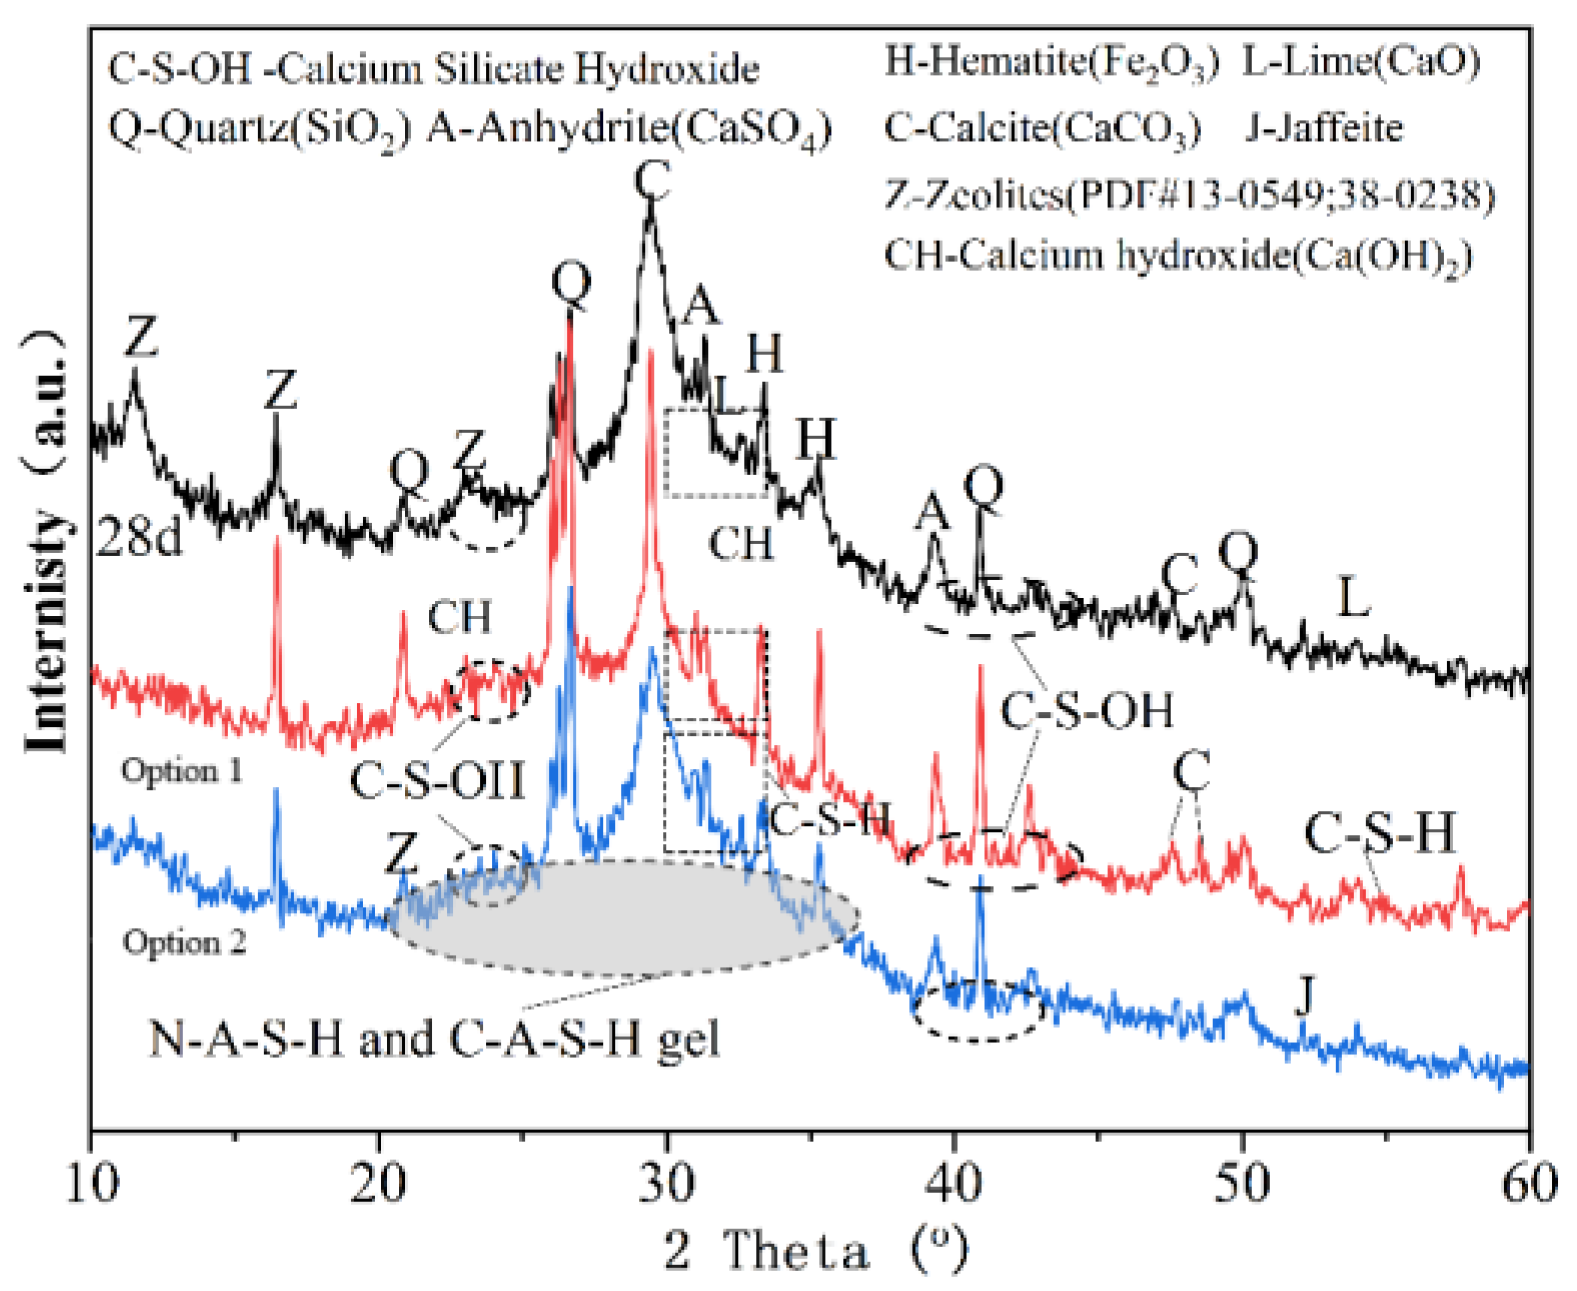
3.2.2. XRD Analysis
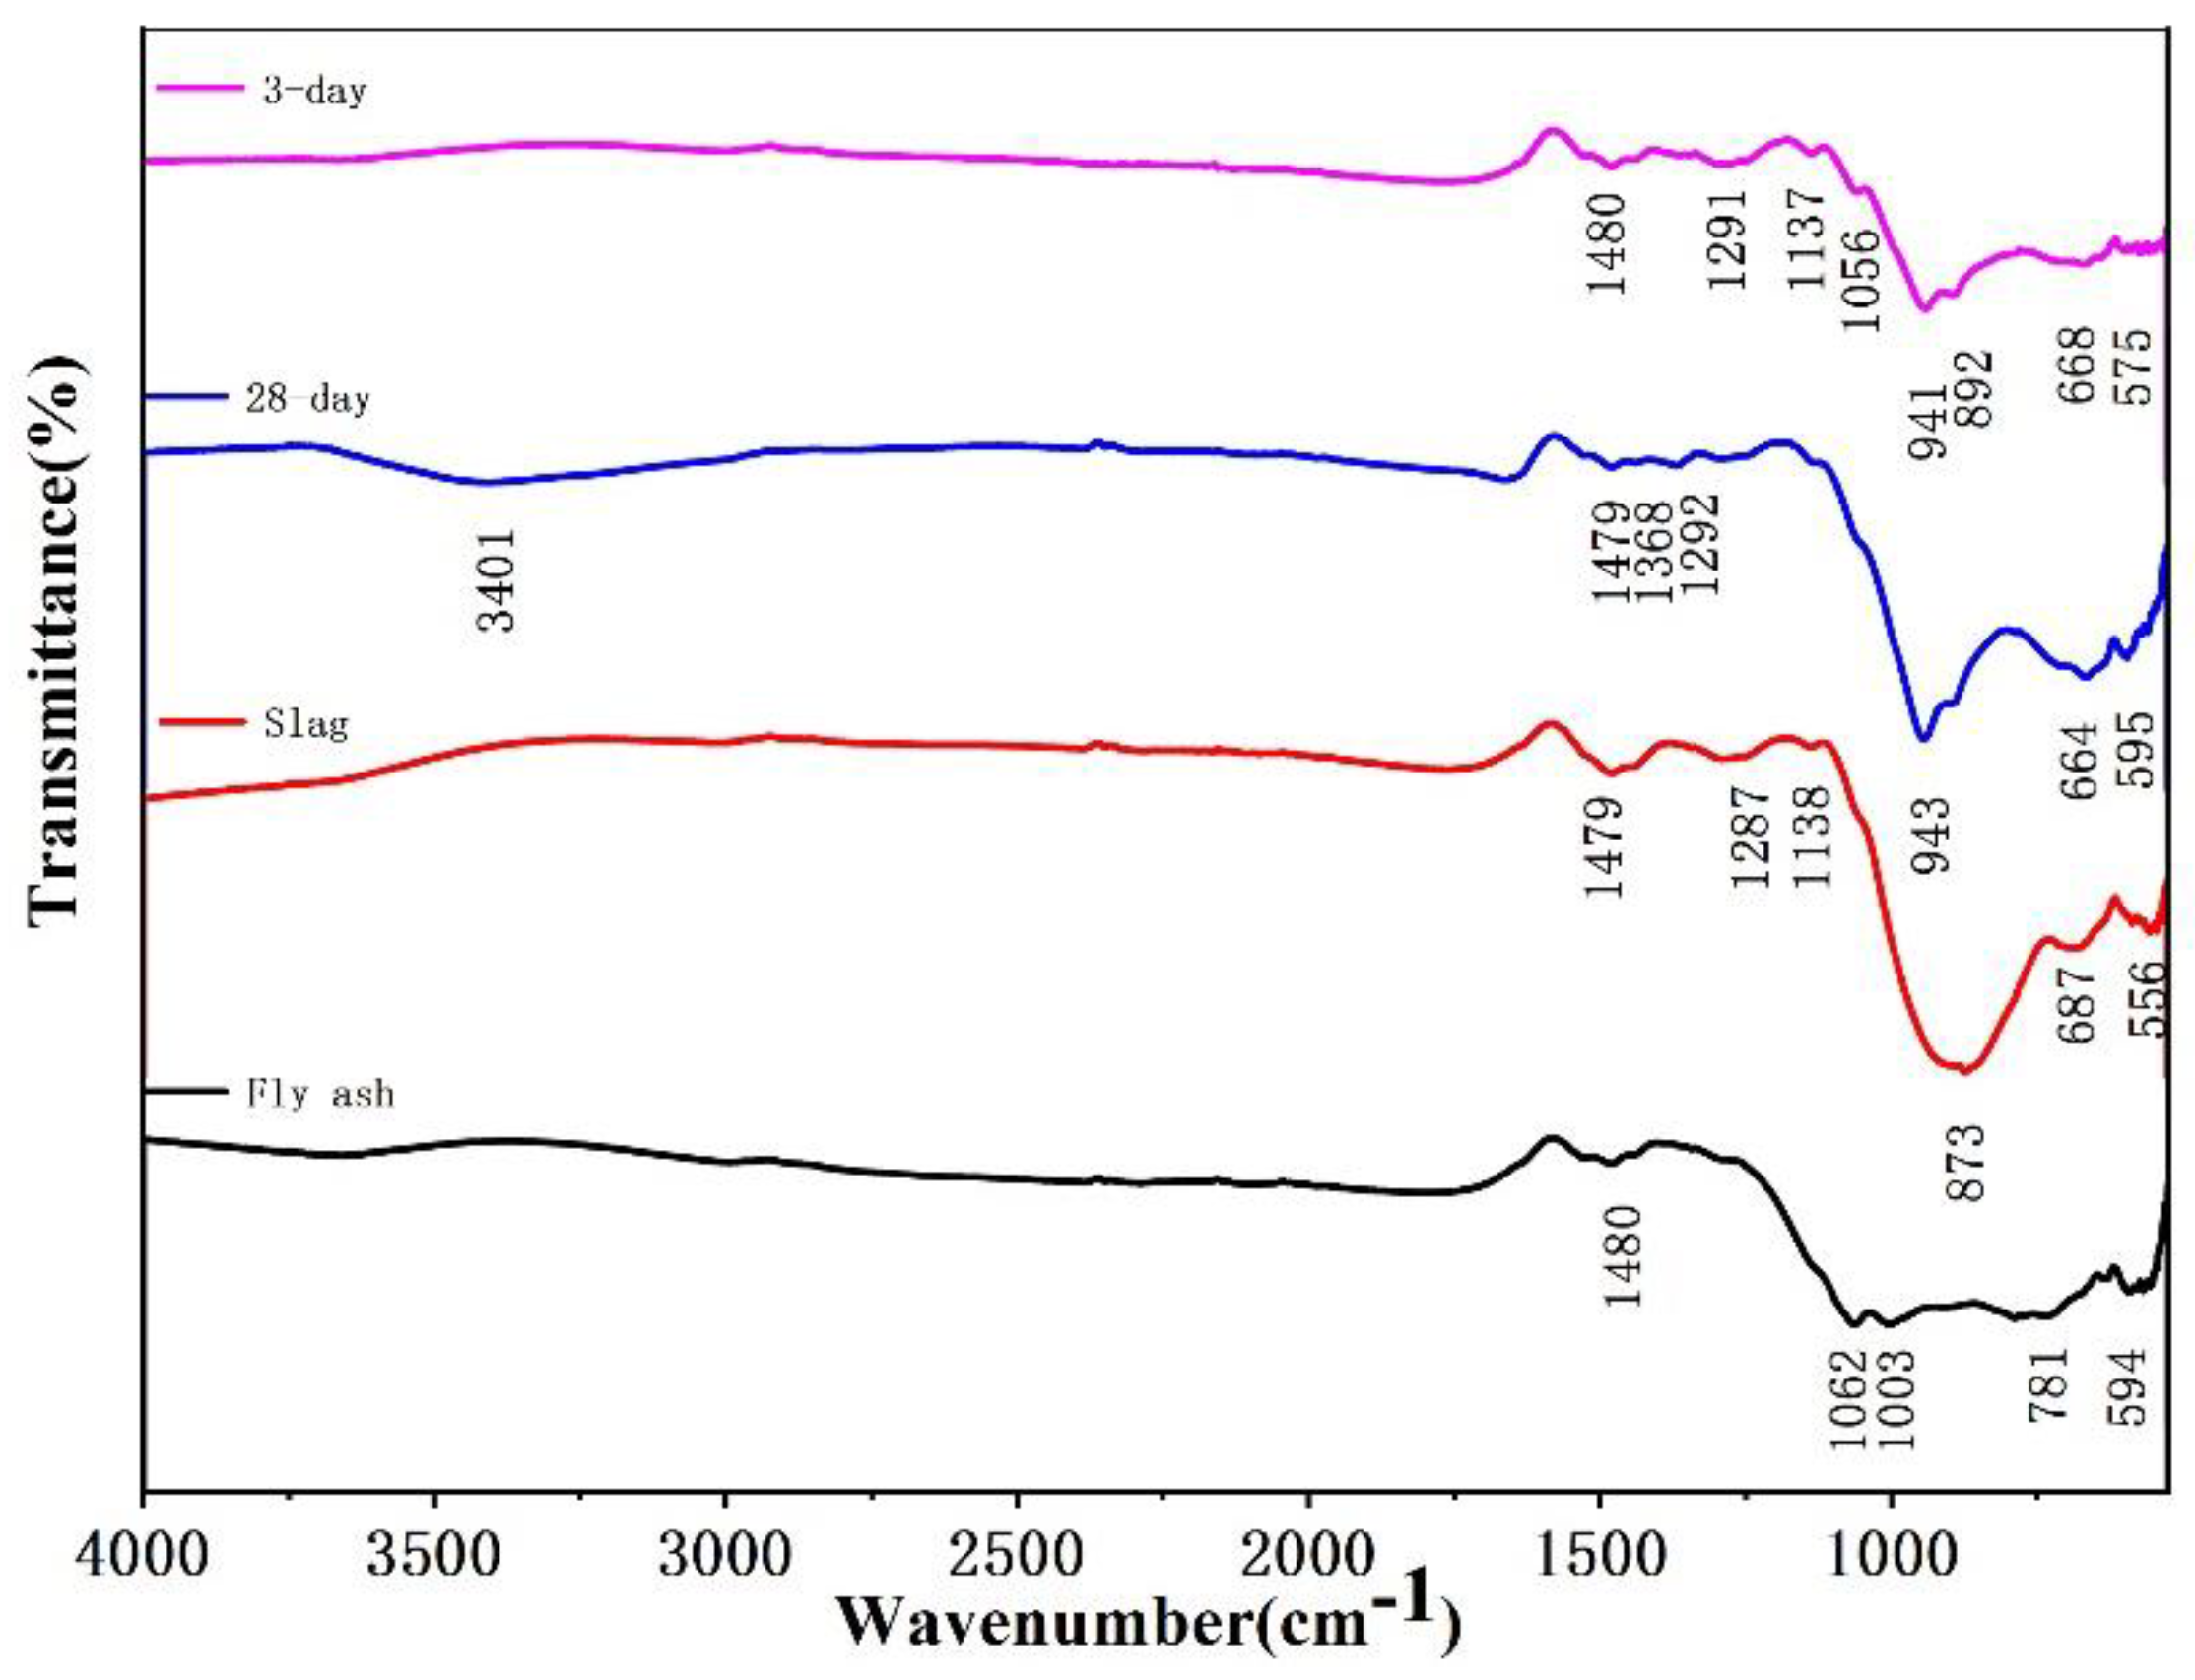
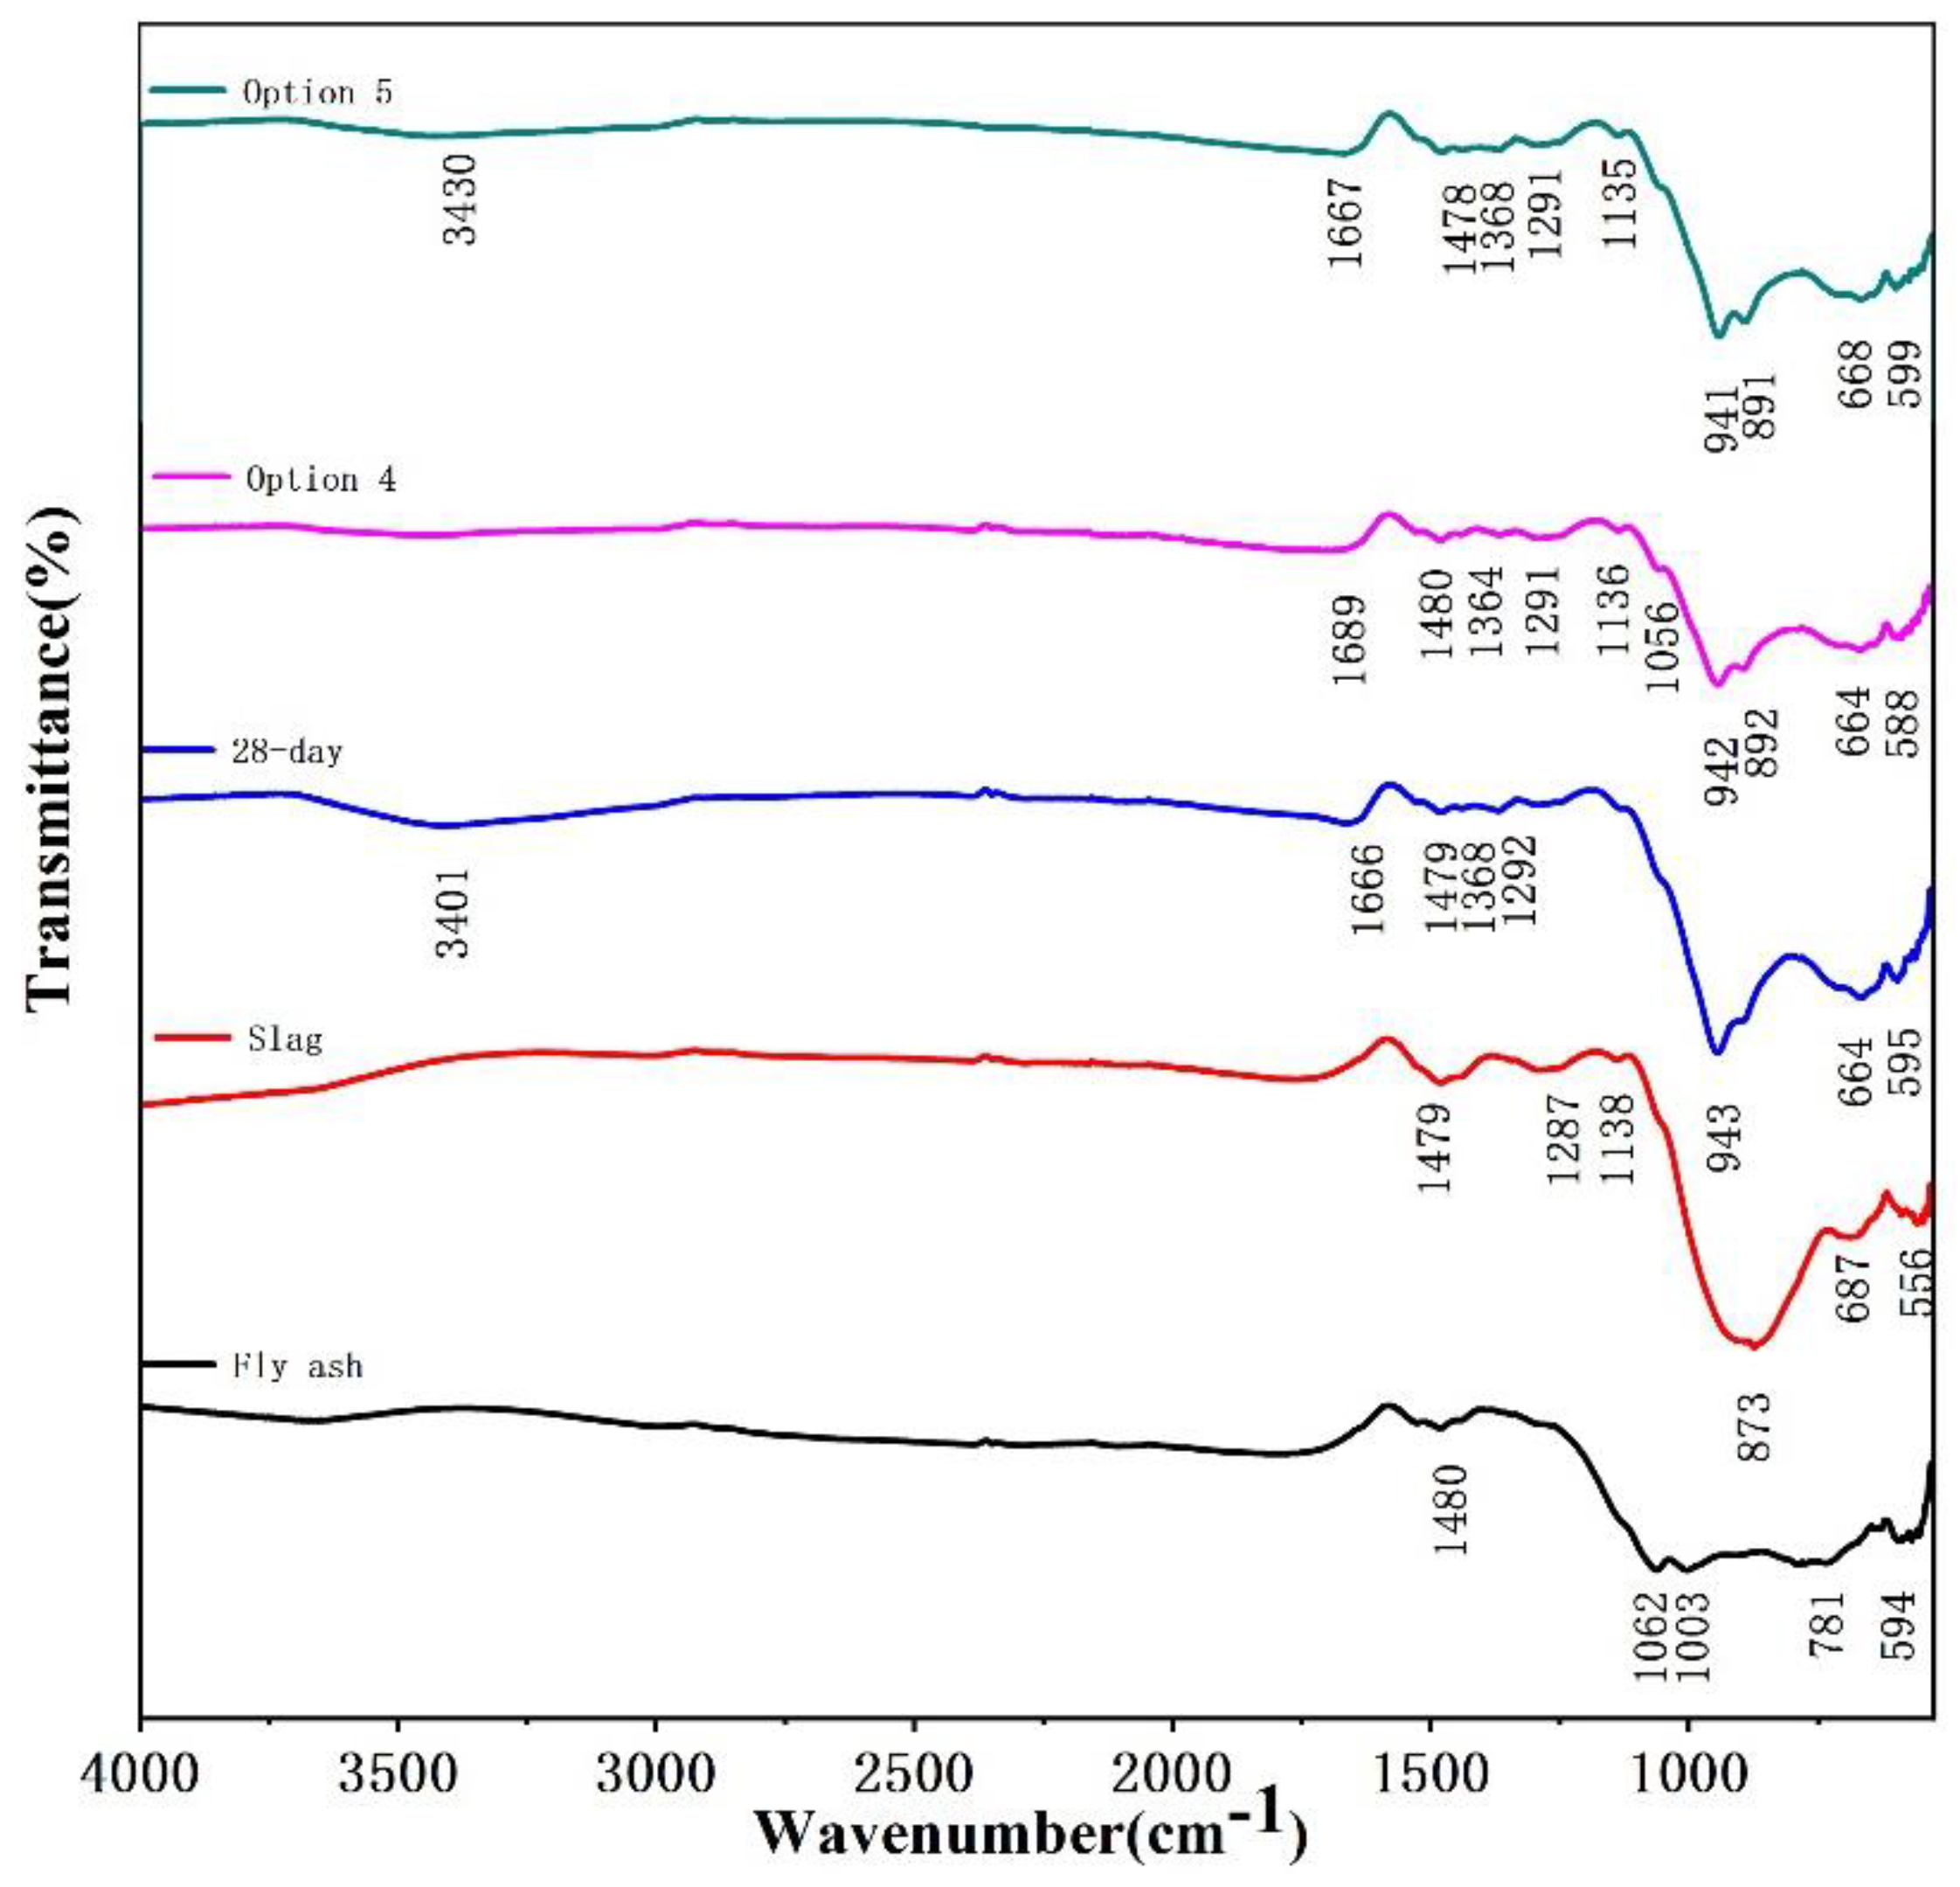
3.2.3. FTIR Analysis
4. Conclusions
- The influence factors of compressive and flexural strength of geopolymers were analyzed using the orthogonal test, and it was found that the content of slag and the modulus of water glass had significant effects on the mechanical properties of 7-day and 28-day geopolymers, respectively. The geopolymers prepared at room temperature were obtained. The compressive and flexural strengths of the polymer can reach 65.3 and 6.1 MPa, respectively.
- The calculation results based on the range analysis of the orthogonal test show that geopolymer has high early strength and can rapidly improve the reinforcement performance as an impregnating glue. The water–binder ratio and the amount of slag have a significant influence on the constructability of the geopolymer. Selecting the appropriate mixing ratio can yield a geopolymer with good working performance and suitable fluidity. Therefore, the optimal mixing ratio was selected in the follow-up study: the content of slag was 70%, the water–binder ratio was 0.38, and the modulus of water glass was 1.2.
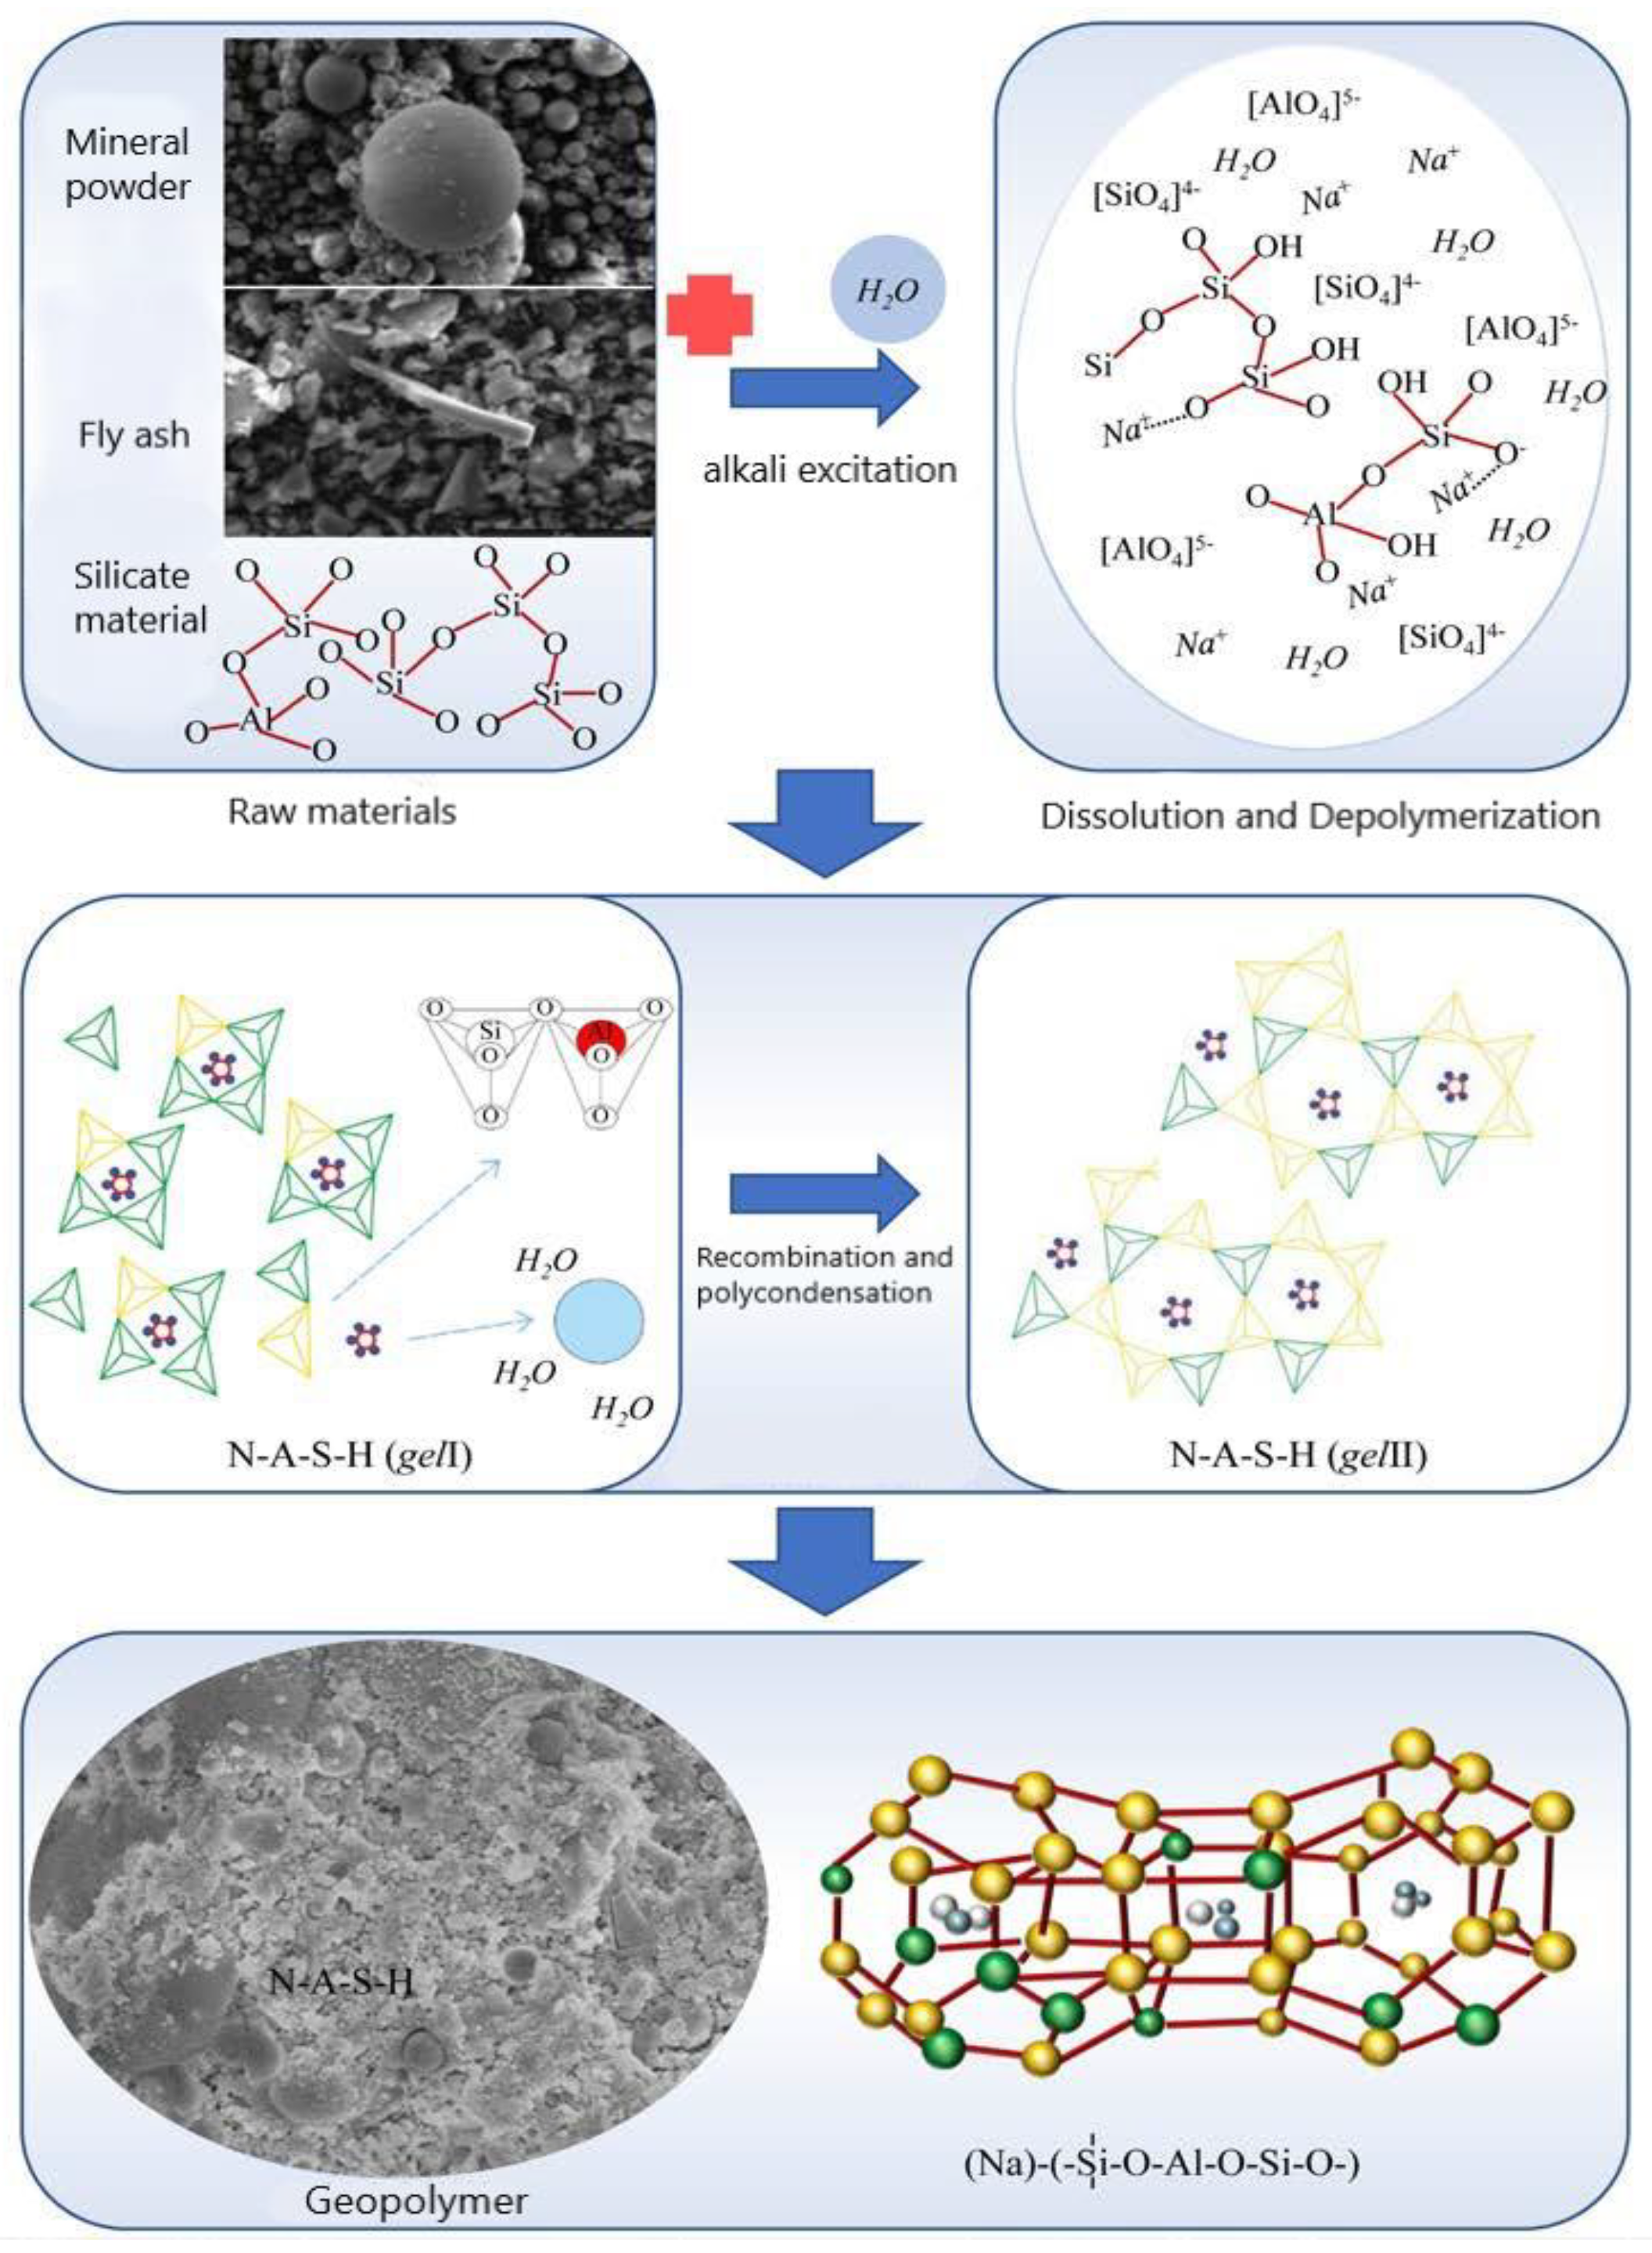
- The microscopic morphology and phase composition of the geopolymer were analyzed by SEM, XRD, and FTIR. It was determined that the main final product of the geopolymer was hydrated silicic acid, which contributed the most to the development of the early strength of the geopolymer, including calcium gel and hydrated calcium aluminosilicate gel, tetra calcium ferro aluminate mineral, and RO phase.
Author Contributions
Funding
Institutional Review Board Statement
Informed Consent Statement
Data Availability Statement
Conflicts of Interest
References
- Fan, F.; Liu, Z.; Xu, G.; Peng, H.; Cai, C. Mechanical and thermal properties of fly ash based geopolymers. Constr. Build. Mater. 2018, 160, 66–81. [Google Scholar] [CrossRef]
- Padmakar, K.C.; Kumar, B.S.C. An experimental study on metakaolin and GGBS based geopolymer concrete. Int. J. Civ. Eng. Technol. 2017, 8, 544–557. [Google Scholar]
- Xu, H.; Van Deventer, J. The geopolymerisation of alumino-silicate minerals. Int. J. Miner. Process. 2000, 59, 247–266. [Google Scholar] [CrossRef] [Green Version]
- Davidovits, J.; Comrie, D. Long term durability of hazardous toxic and nuclear waste disposals. Proc. Geopolym. 1988, 1, 125–134. [Google Scholar]
- Temuujin, J.; van Riessen, A.; MacKenzie, K. Preparation and characterisation of fly ash based geopolymer mortars. Constr. Build. Mater. 2010, 24, 1906–1910. [Google Scholar] [CrossRef]
- Burciaga-Díaz, O.; Magallanes-Rivera, R.; Escalante-García, J. Alkali-activated slag-metakaolin pastes: Strength, structural, and microstructural characterization. J. Sustain. Cem. Mater. 2013, 2, 111–127. [Google Scholar] [CrossRef]
- Glukhovskij, V.; Zaitsev, Y.; Pakhomov, V. Slag-alkaline cements and concretes-structure, properties, technological and economical aspects of the use. Silic. Ind. 1983, 48, 197–200. [Google Scholar]
- Geng, J.; Zhou, M.; Li, Y.; Chen, Y.; Han, Y.; Wan, S.; Zhou, X.; Hou, H. Comparison of red mud and coal gangue blended geopolymers synthesized through thermal activation and mechanical grinding preactivation. Constr. Build. Mater. 2017, 153, 185–192. [Google Scholar] [CrossRef]
- Niklioć, I.; Marković, S.; Janković–Častvan, I.; Radmilović, V.V.; Karanović, L.; Babić, B.; Radmilović, V.R. Modification of mechanical and thermal properties of fly ash-based geopolymer by the incorporation of steel slag. Mater. Lett. 2016, 176, 301–305. [Google Scholar] [CrossRef] [Green Version]
- Soutsos, M.; Boyle, A.P.; Vinai, R.; Hadjierakleous, A.; Barnett, S. Factors influencing the compressive strength of fly ash based geopolymers. Constr. Build. Mater. 2016, 110, 355–368. [Google Scholar] [CrossRef] [Green Version]
- Anuradha, R.; Thirumala, R.; John, P.N. Optimization of molarity on workable self-compacting geopolymer concrete and strength study on SCGC by replacing fly ash with silica fume and GGBFS. Int. J. Adv. Struct. Geotech. Eng. 2014, 3, 11–18. [Google Scholar]
- Castel, A.; Foster, S.J. Bond strength between blended slag and Class F fly ash geopolymer concrete with steel reinforcement. Cem. Concr. Res. 2015, 72, 48–53. [Google Scholar] [CrossRef]
- Mantese, G.C.; Amaral, D.C. Comparison of industrial symbiosis indicators through agent-based modeling. J. Clean. Prod. 2017, 140, 1652–1671. [Google Scholar] [CrossRef]
- Wongsa, A.; Siriwattanakarn, A.; Nuaklong, P.; Sata, V.; Sukontasukkul, P.; Chindaprasirt, P. Use of recycled aggregates in pressed fly ash geopolymer concrete. Environ. Prog. Sustain. Energy 2019, 39, e13327. [Google Scholar] [CrossRef]
- Poudenx, P. The effect of transportation policies on energy consumption and greenhouse gas emission from urban passenger transportation. Transp. Res. Part A Policy Pract. 2008, 42, 901–909. [Google Scholar] [CrossRef]
- Puertas, F.; Martinez-Ramirez, S.; Alonso, S.; Vázquez, T. Alkali-activated fly ash/slag cements: Strength behaviour and hydration products. Cem. Concr. Res. 2000, 30, 1625–1632. [Google Scholar] [CrossRef]
- Kelham, S.; Damtoft, J.; Talling, B. The influence of high early-strength (HES) mineralized clinker on the strength development of blended cements containing fly ash, slag, or ground limestone. Spec. Publ. 1995, 153, 229–248. [Google Scholar]
- Babu, K.G.; Kumar, V.S.R. Efficiency of GGBS in concrete. Cem. Concr. Res. 2000, 30, 1031–1036. [Google Scholar] [CrossRef]
- Aiken, T.A.; Kwasny, J.; Sha, W.; Soutsos, M.N. Effect of slag content and activator dosage on the resistance of fly ash geopolymer binders to sulfuric acid attack. Cem. Concr. Res. 2018, 111, 23–40. [Google Scholar] [CrossRef] [Green Version]
- Aliques-Granero, J.; Tognonvi, M.T.; Tagnit-Hamou, A. Durability study of AAMs: Sulfate attack resistance. Constr. Build. Mater. 2019, 229, 117100. [Google Scholar] [CrossRef]
- Lahoti, M.; Tan, K.H.; Yang, E.-H. A critical review of geopolymer properties for structural fire-resistance applications. Constr. Build. Mater. 2019, 221, 514–526. [Google Scholar] [CrossRef]
- Shill, S.K.; Al-Deen, S.; Ashraf, M.; Hutchison, W. Resistance of fly ash based geopolymer mortar to both chemicals and high thermal cycles simultaneously. Constr. Build. Mater. 2019, 239, 117886. [Google Scholar] [CrossRef]
- Abdel-Ghani, N.T.; Elsayed, H.A.; AbdelMoied, S. Geopolymer synthesis by the alkali-activation of blastfurnace steel slag and its fire-resistance. HBRC J. 2018, 14, 159–164. [Google Scholar] [CrossRef] [Green Version]
- Ferone, C.; Roviello, G.; Colangelo, F.; Cioffi, R.; Tarallo, O. Novel hybrid organic-geopolymer materials. Appl. Clay Sci. 2013, 73, 42–50. [Google Scholar] [CrossRef]
- Wang, K.-T.; Tang, Q.; Cui, X.-M.; He, Y.; Liu, L.-P. Development of near-zero water consumption cement materials via the geopolymerization of tektites and its implication for lunar construction. Sci. Rep. 2016, 6, 29659. [Google Scholar] [CrossRef] [Green Version]
- Mohammadi, M.; Moghtadaei, R.M.; Samani, N.A. Influence of silica fume and metakaolin with two different types of interfacial adhesives on the bond strength of repaired concrete. Constr. Build. Mater. 2014, 1, 141–150. [Google Scholar] [CrossRef]
- Cilla, M.S.; Colombo, P.; Morelli, M.R. Geopolymer foams by gelcasting. Ceram. Int. 2014, 40, 5723–5730. [Google Scholar] [CrossRef]
- Cilla, M.S.; Morelli, M.R.; Colombo, P. Effect of process parameters on the physical properties of porous geopolymers obtained by gelcasting. Ceram. Int. 2014, 40, 13585–13590. [Google Scholar] [CrossRef]
- Nikolić, V.; Komljenović, M.; Marjanović, N.; Baščarević, Z.; Petrović, R. Lead immobilization by geopolymers based on mechanically activated fly ash. Ceram. Int. 2014, 40, 8479–8488. [Google Scholar] [CrossRef]
- Alanazi, H.; Yang, M.; Zhang, D.; Gao, Z. Bond strength of PCC pavement repairs using metakaolin-based geopolymer mortar. Cem. Concr. Compos. 2016, 65, 75–82. [Google Scholar] [CrossRef]
- Albidah, A.; Abadel, A.; Alrshoudi, F.; Altheeb, A.; Abbas, H.; Al-Salloum, Y. Bond strength between concrete substrate and metakaolin geopolymer repair mortars at ambient and elevated temperatures. J. Mater. Res. Technol. 2020, 9, 10732–10745. [Google Scholar] [CrossRef]
- Fernández-Jiménez, A.; Palomo, A. Characterisation of fly ashes. Potential reactivity as alkaline cements. Fuel 2003, 82, 2259–2265. [Google Scholar] [CrossRef]
- Khale, D.; Chaudhary, R. Mechanism of geopolymerization and factors influencing its development: A review. J. Mater. Sci. 2007, 42, 729–746. [Google Scholar] [CrossRef]
- Hu, Z.; Wyrzykowski, M.; Lura, P. Estimation of reaction kinetics of geopolymers at early ages. Cem. Concr. Res. 2020, 129, 105971. [Google Scholar] [CrossRef]
- Palomo, Á.; Kavalerova, E.; Fernández-Jiménez, A.; Krivenko, P.; García-Lodeiro, I.; Maltseva, O. A review on alkaline activation: New analytical perspectives. Mater. Constr. 2014, 64, e022. [Google Scholar] [CrossRef] [Green Version]
- Zhao, J.; Tong, L.; Li, B.; Chen, T.; Wang, C.; Yang, G.; Zheng, Y. Eco-friendly geopolymer materials: A review of performance improvement, potential application and sustainability assessment. J. Clean. Prod. 2021, 307, 127085. [Google Scholar] [CrossRef]
- Shi, C.; Roy, D.; Krivenko, P. Alkali-Activated Cements and Concretes; CRC press: Boca Raton, FL, USA, 2003. [Google Scholar]
- Davidovits, J. Geopolymers: Inorganic polymeric new materials. J. Therm. Anal. Calorim. 1991, 37, 1633–1656. [Google Scholar] [CrossRef]
- García-Lodeiro, I.; Palomo, A.; Fernández-Jiménez, A.; Macphee, D. Compatibility studies between NASH and CASH gels. Study in the ternary diagram Na2O–CaO–Al2O3–SiO2–H2O. Cem. Concr. Res. 2011, 41, 923–931. [Google Scholar] [CrossRef]
- Kuenzel, C.; Ranjbar, N. Dissolution mechanism of fly ash to quantify the reactive aluminosilicates in geopolymerisation. Resour. Conserv. Recycl. 2019, 150, 104421. [Google Scholar] [CrossRef]
- Ranjbar, N.; Kuenzel, C.; Spangenberg, J.; Mehrali, M. Hardening evolution of geopolymers from setting to equilibrium: A review. Cem. Concr. Compos. 2020, 114, 103729. [Google Scholar] [CrossRef]
- Provis, J.; Myers, R.; White, C.; Rose, V.; van Deventer, J.S. X-ray microtomography shows pore structure and tortuosity in alkali-activated binders. Cem. Concr. Res. 2012, 42, 855–864. [Google Scholar] [CrossRef]


| Loss on Ignition | Al2O3 (%) | SiO2 (%) | Water (%) | CaO (%) | Alkali (%) | Fe3+ (%) | Free CaO (%) | Density (g/cm3) | Bulk Density (g/cm3) |
|---|---|---|---|---|---|---|---|---|---|
| 2.8 | 24.2 | 45.1 | 0.85 | 5.6 | 1.2 | 0.85 | 0.85 | 2.55 | 1.12 |
| SO3 | Loss on Ignition | Alkali Content | Vitreous Content | Water Content | Density (g/cm3) |
|---|---|---|---|---|---|
| 0.1 | 0.8 | 0.56 | 99 | 0.1 | 2.9 |
| Modulus (M) | SiO2 (%) | NaO (%) | Fe (%) | Density | Water Insoluble Content (%) |
|---|---|---|---|---|---|
| 3.24 | 27.45 | 8.73 | 0.019 | 1.38 | 0.2 |
| Level | Factor A Slag Mass Fraction (%) | Factor B Water-to-Binder Ratio | Factor C Water Glass Modulus |
|---|---|---|---|
| 1 | 40 | 0.36 | 0.8 |
| 2 | 50 | 0.38 | 1.0 |
| 3 | 60 | 0.40 | 1.2 |
| 4 | 70 | 0.42 | 1.4 |
| 5 | 80 | 0.44 | 1.8 |
| Sample | Compressive Strength (MPa) | Flexural Strength (MPa) | ||
|---|---|---|---|---|
| 7-Day | 28-Day | 7-Day | 28-Day | |
| 1 | 12.3 | 15.5 | 0.9 | 1.7 |
| 2 | 29.3 | 31.5 | 2.6 | 3.5 |
| 3 | 32.5 | 36.1 | 4.1 | 4.2 |
| 4 | 28.1 | 30.2 | 3.7 | 3.5 |
| 5 | 7.8 | 21.3 | 1.1 | 1.8 |
| 6 | 24.1 | 20.5 | 3.2 | 3.3 |
| 7 | 28.6 | 40.7 | 3.8 | 4.9 |
| 8 | 28.8 | 36.1 | 4.1 | 5 |
| 9 | 23.4 | 20.8 | 3.7 | 3.5 |
| 10 | 19.7 | 24.4 | 2.8 | 3.2 |
| 11 | 37.2 | 43.1 | 5.2 | 5.3 |
| 12 | 30.4 | 34 | 4.1 | 4.8 |
| 13 | 26.3 | 29.4 | 3.8 | 4 |
| 14 | 11.5 | 21.5 | 1.8 | 2.8 |
| 15 | 30 | 31.6 | 4.1 | 4.2 |
| 16 | 25.9 | 40.9 | 3.7 | 5.1 |
| 17 | 41.6 | 61.8 | 4.4 | 5.8 |
| 18 | 17.8 | 29.6 | 2.7 | 4.5 |
| 19 | 22.9 | 33.9 | 4 | 4.7 |
| 20 | 28.6 | 44.5 | 4.6 | 6 |
| 21 | 16.9 | 34.1 | 2.5 | 4.3 |
| 22 | 10.3 | 13.8 | 1.5 | 2.3 |
| 23 | 9.6 | 29.9 | 1.6 | 3 |
| 24 | 8.9 | 46.8 | 1.6 | 5.5 |
| 25 | 10.8 | 27.8 | 1.7 | 3.2 |
| Sample | 7-Day Compressive Strength | 28-Day Compressive Strength | ||||
|---|---|---|---|---|---|---|
| A | B | C | A | B | C | |
| K1 | 22 | 23.28 | 14.32 | 26.86 | 30.82 | 20.82 |
| K2 | 24.92 | 28.04 | 23.18 | 28.4 | 36 | 29.42 |
| K3 | 27.08 | 23 | 27.16 | 31.9 | 32.22 | 42.14 |
| K4 | 27.36 | 18.96 | 24.8 | 42.1 | 30.64 | 33.78 |
| K5 | 11.3 | 19.38 | 23.2 | 30.34 | 29.92 | 33.44 |
| R | 16.06 | 9.08 | 12.84 | 15.24 | 6.08 | 21.32 |
| Level | 7-Day Flexural Strength | 28-Day Flexural Strength | ||||
|---|---|---|---|---|---|---|
| A | B | C | A | B | C | |
| K1 | 2.48 | 3.1 | 1.94 | 2.94 | 3.94 | 2.9 |
| K2 | 3.52 | 3.28 | 3.1 | 3.98 | 4.26 | 3.74 |
| K3 | 3.8 | 3.26 | 3.86 | 4.22 | 4.14 | 5.18 |
| K4 | 3.88 | 2.96 | 3.46 | 5.22 | 4 | 4.32 |
| K5 | 1.78 | 2.86 | 3.1 | 3.66 | 3.68 | 3.88 |
| R | 2.1 | 0.42 | 1.92 | 2.28 | 0.58 | 2.28 |
| Factor | Deviation Sum of Squares | Degrees of Freedom | F Value | Fa | Significant Level |
|---|---|---|---|---|---|
| Slag mass fraction | 880.686 | 4 | 17.876 | F0.05 (4,4) = 6.39 | ** |
| Water-cement ratio | 269.054 | 4 | 5.461 | F0.01 (4,4) = 16 | |
| Water glass modulus | 474.326 | 4 | 9.628 | * | |
| Error | 49.27 | 4 |
| Factor | Deviation Sum of Squares | Degrees of Freedom | F Value | Fa | Significant Level |
|---|---|---|---|---|---|
| Slag mass fraction | 715.962 | 4 | 5.593 | F0.05 (4,4) = 6.39 | |
| Water-cement ratio | 133.13 | 4 | 1.04 | F0.01 (4,4) = 16 | |
| Water glass modulus | 1192.598 | 4 | 9.316 | * | |
| Error | 128.01 | 4 |
| Factor | Deviation Sum of Squares | Degrees of Freedom | F Value | Fa | Significant Level |
|---|---|---|---|---|---|
| Slag mass fraction | 17.006 | 4 | 25.845 | F0.05 (4,4) = 6.39 | ** |
| Water-cement ratio | 0.674 | 4 | 1.024 | F0.01 (4,4) = 16 | |
| Water glass modulus | 10.262 | 4 | 15.596 | * | |
| Error | 0.66 | 4 |
| Factor | Deviation Sum of Squares | Degrees of Freedom | F Value | Fa | Significant Level |
|---|---|---|---|---|---|
| Slag mass fraction | 13.882 | 4 | 15.407 | F0.05 (4,4) = 6.39 | * |
| Water-cement ratio | 0.966 | 4 | 1.072 | F0.01 (4,4) = 16 | |
| Water glass modulus | 13.934 | 4 | 15.465 | * | |
| Error | 0.9 | 4 |
Publisher’s Note: MDPI stays neutral with regard to jurisdictional claims in published maps and institutional affiliations. |
© 2022 by the authors. Licensee MDPI, Basel, Switzerland. This article is an open access article distributed under the terms and conditions of the Creative Commons Attribution (CC BY) license (https://creativecommons.org/licenses/by/4.0/).
Share and Cite
Yu, G.; Jia, Y. Microstructure and Mechanical Properties of Fly Ash-Based Geopolymer Cementitious Composites. Minerals 2022, 12, 853. https://doi.org/10.3390/min12070853
Yu G, Jia Y. Microstructure and Mechanical Properties of Fly Ash-Based Geopolymer Cementitious Composites. Minerals. 2022; 12(7):853. https://doi.org/10.3390/min12070853
Chicago/Turabian StyleYu, Guanglong, and Yanmin Jia. 2022. "Microstructure and Mechanical Properties of Fly Ash-Based Geopolymer Cementitious Composites" Minerals 12, no. 7: 853. https://doi.org/10.3390/min12070853