Article

Nature and Isomorphism of Extra-Framework Components in Cancrinite- and Sodalite-Related Minerals: New Data

by
Nikita V. Chukanov
1,2,*,
Marina F. Vigasina
2,
Roman Yu. Shendrik
2,3,
Dmitry A. Varlamov
1,4,
Igor V. Pekov
2 and
Natalia V. Zubkova
2
1
Institute of Problems of Chemical Physics, Russian Academy of Sciences, 142432 Chernogolovka, Moscow Region, Russia
2
Faculty of Geology, Moscow State University, Vorobievy Gory, 119991 Moscow, Russia
3
Vinogradov Institute of Geochemistry, Siberian Branch of Russian Academy of Sciences, 1a Favorskii St., 664033 Irkutsk, Russia
4
Institute of Experimental Mineralogy RAS, 142432 Chernogolovka, Moscow Region, Russia
*
Author to whom correspondence should be addressed.
Minerals 2022, 12(6), 729; https://doi.org/10.3390/min12060729
Submission received: 16 May 2022 / Revised: 30 May 2022 / Accepted: 3 June 2022 / Published: 7 June 2022
(This article belongs to the Special Issue Isomorphism and Solid Solutions of Minerals and Related Compounds)

Abstract

:
New data on the isomorphism of extra-framework components (including chromophores) in two- and multilayer minerals belonging to the cancrinite and sodalite groups, are obtained using chemical and single-crystal X-ray diffraction data as well as infrared, Raman, ESR, UV–Vis–near IR absorption and photoluminescence spectroscopy methods. It is shown that the blue color of these minerals may be due to CO3•− or S3•− radical anions, whereas yellow and pink shadings are typically due to the presence of S2•− radical anions and S4•− or S4, respectively. Two kyanoxalite varieties are distinguished: (1) with predominantly acid oxalate groups and (2) predominantly neutral oxalate groups. Zundel cation H5O2+ and CO2 molecules are shown to be typical impurities in nosean. The Zundel cation is also detected in kyanoxalite and in the 12-layer, cancrinite-related mineral marinellite. Wide isomorphic series involving substitutions of SO4 for SO32− and CO32−, as well as OH for H2O and F, are common for eight-layer, cancrinite-group minerals with an afghanite-type framework.

1. Introduction

Natural, cancrinite-related aluminosilicates (CRAs) are microporous tectosilicates hosting extra-framework cations (mainly Na+, K+ and Ca2+), anions (Cl, SO42−, CO32−, SO32−, PO43−, C2O42−, OH, F, Snm, etc.), radical anions (S2•−, S3•−, S4•−, SO4•−) and neutral molecules (H2O, CO2, COS, S4, S6, etc.) [1,2,3,4]. Their frameworks, composed of SiO4 and AlO4 tetrahedra, are built by three kinds of stacking of adjacent layers, which are denoted as A, B and C. The stacking sequence in a repeat unit determines the topological type of the framework. The number of layers in a repeat unit n varies from 2 (for minerals with a cancrinite-type framework displaying the AB stacking sequence) to 36 (for kircherite with the ABACBACBACBABCBACBACBACBCACBACBACBAC stacking sequence). All CRAs, except those with the ABC stacking sequence, are trigonal or hexagonal, while three-layer minerals (sodalite group members) are cubic or pseudo-cubic.
Compounds with cancrinite-type structures (i.e., CRAs with the simplest AB stacking sequence) contain wide channels limited by 12-membered rings. In multilayer CRAs, the wide channel is absent. Instead, frameworks of these compounds contain different kinds of cage which are combined in columns running along the c-axis. The cancrinite (can), sodalite (sod), losod (los), liottite (lio) and giuseppettite (giu) cages known in natural CRAs are crossed by two, three, four, six and eight aluminosilicate layers, respectively [4].
Various cancrinite and sodalite analogues with different compositions of framework and extra-framework components have been synthesized. These materials were studied for their technologically important properties, including ionic conductivity and the ability to immobilize various ions and molecules [4]. Extra-framework components occurring in natural CRAs are considered as indicators of the geochemical environment [4,5,6,7,8,9]. This paper provides new data on the isomorphism of C- and S-bearing extra-framework components in some two-layer and multilayer, cancrinite-related minerals.

2. Materials

The studied samples are listed below. Their empirical formulae were calculated on the basis of 6n Si + Al + Fe atoms (i.e., Z = 1).
Sample 1 is cancrinite from the Mica mine, Kovdor alkaline complex, Kola Peninsula, Russia. Its empirical formula is [10]: Na6.7Ca0.7(Si6.5Al5.5O24)(CO3)1.3·nH2O). The unit cell parameters are: a = 12.606(2) Å, c = 5.118(1) Å. The mineral forms gray, short, prismatic crystals up to 3 cm long in association with pectolite, potassic feldspar and aegirine–diopside. Sample 2 is yellow cancrinite from miaskite hosting peralkaline pegmatite at the Dara-e Pioz valley, Alai Range, Tajikistan. Its empirical formula is Na6.65Ca0.87(Si6.33Al5.61Fe0.06O24)(CO3)1.36·nH2O (see Table 1).
Sample 3 is pinkish-gray cancrinite from the Zhidoi alkaline massif, Tunka Range, Irkutsk region, Russia, hosted by a Precambrian complex of metamorphic rocks. The mineral forms aggregates of prismatic crystals up to 5 mm long in association with aegirine and nepheline. Its empirical formula is Na6.47Ca1.23K0.01[Al5.97Si6.03O24](CO3)1.45(SO4)0.03Cl0.01·2H2O [11].
Sample 4 is a CO3-bearing variety of vishnevite from Loch Borrolan, Scotland, GB [10]. Its empirical formula is Na6.46Ca0.88K0.08(Si6.18Al5.82O24)(SO4)0.74(CO3)0.50·nH2O. The contents of carbonate anions (confirmed by spectroscopic data) in Samples 1 to 4 were calculated based on the charge balance requirement.
Sample 5 is the cotype sample of kyanoxalite from Alluaiv Mountain, Lovozero alkaline massif, Kola Peninsula, Russia. It forms pale-blue grains up to 5 mm across in a peralkaline pegmatite mainly composed of microcline, nepheline, aegirine, arfvedsonite, murmanite, eudialyte, HS-bearing sodalite and natrolite. The empirical formula is [12]: Na6.45K0.08Ca0.025(Si6.89Al5.11O24)(C2O4)0.50(SO4)0.06(PO4)0.06(OH)0.11·4.7H2O. The unit cell parameters are: a = 12.749(4) Å, c = 5.218(3) Å. Sample 6 is pale-blue kyanoxalite from Flora Mountain, Lovozero alkaline massif, Kola Peninsula, Russia. Its empirical formula is [10]: Na5.42K0.12Ca0.11(Si6.63Al5.37O24)(C2O4)0.20(SO4)0.07·nH2O. The content of oxalate groups was calculated based on the charge balance requirement. The contents of Na, and, correspondingly, C2O42−, may be somewhat lowered due to migration of Na under the electron beam during electron microprobe analysis.
Sample 7 is gray nosean forming crystals up to 0.5 cm across and twins on (111) up to 1 cm long in cavities of nosean sanidinite in the In den Dellen (Zieglowski) pumice quarry, 1.5 km north-east of Mendig, Laach Lake (Laacher See) paleovolcano, Eifel region, Rhineland-Palatinate, Germany. Associated minerals are sanidine, augite, annite and zircon. The empirical formula is [8]: (H3O)xNa5.72K0.64Ca0.33(Si6.43Al5.51Fe0.06O24)(SO4)1.21Cl0.11F0.09(CO2)0.11·nH2O.
Sample 8 is pale, violet-blue-to-almost-colorless nosean which forms grains up to 3 mm across in carbonatite at the contact zone of the miaskite intrusion in the Vishnevogorskii alkaline complex, South Urals, Russia. Nosean is associated with calcite, phlogopite, fluorapatite and titanite. The empirical formula is (H3O)0.69Na6.72Ca0.54K0.06(Si6.19Al5.70Fe0.11O24)(SO4)1.35Cl0.02(CO2)0.35·nH2O (see Table 1). The content of H3O+ cations detected using IR spectroscopic data (see below) was calculated based on the charge balance requirement. The contents of CO2 corresponding to the CO2 molecules in samples 7 and 8 were determined from the IR spectra using the procedure described in [8].
Sample 9 is afghanite from the Koksha valley, Sar-e Sang district, Badakhshan province, Afghanistan. The mineral forms pale-green, spindle-like crystals up to 5 cm long in coarse-grained calcite. The empirical formula is Na21.46Ca9.19K1.30(Si24.08Al23.65Fe0.27O96)(SO4)6.25Cl5.38·nH2O (see Table 1).
Sample 10 is a pale-blue, single-crystal grain of afghanite 6 cm across in association with lazurite and calcite. Sample 10 originates from the Ladgvardara gem lazurite deposit, SW Pamirs, Tajikistan. The empirical formula is Na19.33Ca10.88K1.27(Si23.98Al23.85Fe0.17O96)(SO4)6.85Cl6.24(CO2)0.05·nH2O (see Table 1).
Sample 11 is K-rich afghanite occurring as colorless isometric crystals up to 2 mm across in association with sanidine, nepheline, leucite and humite. The sample originates from the Tre Croci occurrence, near Vetralla, Viterbo province, Latium, Italy. The empirical formula is Na17.13Ca10.47K3.32(Si24.27Al23.52Fe0.21O96)(SO4)5.58Cl6.50·nH2O (see Table 1).
Sample 12 is the holotype of steudelite. It occurs as colorless, thick, tabular, isometric and short prismatic blocky crystals up to 7 mm across. Sample 12 originates from Biachella Valley, Sacrofano Caldera, Sacrofano municipality, Rome province, Latium region, Italy. The associated minerals are sanidine, diopside, andradite, biotite, leucite, haüyne, sacrofanite, biachellaite and liottite. The empirical formula is [9]: Na11.06K8.28Ca11.18(Si23.86Al24.04Fe3+0.10O96)(SO3)3.43(SO4)3.00F4.04Cl1.10(H8.22O3.89). The unit cell parameters are: a = 12.8953(2) Å, c = 21.2778(3) Å. Sample 13 is the holotype of alloriite from a volcanic syenitic ejectum collected at Monte Cavalluccio, Campagnano municipality, Rome province, Latium region, Italy. The associated minerals are sanidine, biotite, andradite and apatite. Alloriite forms colorless, short, prismatic and tabular crystals up to 2 mm across. Its empirical formula is [9]: Na19.16K6.21Ca4.87(Si25.26Al22.74O96)(SO4)4.88(CO3)0.70Cl0.46(OH)0.76·4.73H2O. The unit cell parameters are: a = 12.892(3) Å, c = 21.340(5) Å. Sample 14 is franzinite from the Tosco pumice deposit near Pitigliano, Grosseto, Toscana, Italy. The mineral forms colorless crystals up to 0.5 mm in a metasomatic rock. The associated minerals are sanidine, diopside, calcite and leucite. The empirical formula of Sample 14 is Na23.19Ca9.91K6.76(Si29.81Al30.19O120)(SO4)9.72Cl0.78·nH2O. The unit cell parameters are: a = 12.814(4) Å, c = 26.559(7) Å.
Sample 15 is marinellite forming violet grains up to 1 mm across in a subvolcanic rock composed of sanidine, nepheline, leucite and biotite. The specimen originates from Magliano, Rome, Latium, Italy. The empirical formula of Sample 15 is Na29.78K11.80Ca6.48(Si35.95Al36.05O144)(SO4)7.99Cl2.03·nH2O. The unit cell parameters are: a = 12.8727(2) Å, c = 31.7393(5) Å.

3. Methods

In order to obtain IR absorption spectra, powdered Samples 1–15 were mixed with anhydrous KBr (in the KBr: mineral ratio of about 150: 1), pelletized and analyzed using an ALPHA FTIR spectrometer (Bruker Optics, Ettlingen, Germany) at a resolution of 4 cm1. A total of 16 scans were collected for each spectrum. The IR spectrum of an analogous pellet of pure KBr was used as a reference.
Raman spectra of Samples 1, 4–11, 14 and 15 were obtained for randomly oriented grains using an EnSpectr R532 spectrometer based on an OLYMPUS CX 41 microscope (Enhanced Spectrometry, San Jose, USA) coupled with a diode laser (λ = 532 nm) at room temperature (Moscow State University, Faculty of Geology). The spectra were recorded in the range of 100 to 4000 cm−1 with a diffraction grating (1800 gr mm−1) and spectral resolution of about 6 cm−1. The output power of the laser beam was in the range of 5 to 13 mW. The diameter of the focal spot on the sample was 5–10 μm. The backscattered Raman signal was collected with a 40× objective; signal acquisition time for a single scan of the spectral range was 1 s, and the signal was averaged over 50 scans. Crystalline silicon was used as a standard.
Chemical analyses were carried out using a Tescan VEGA-II XMU INCA Energy 450 (EDS mode, 20 kV, 120–150 pA, beam size 120 nm, excitation zone < 5 μm; TESCAN, Brno, Czech Republic). The following standards were used: CaF2 for F, albite for Na, synthetic Al2O3 for Al, wollastonite for Ca, potassium feldspar for K, SiO2 for Si, Fe metal for Fe, FeS2 for S and LaPO4 for P.
The empirical formulae given above are partly taken from literature sources. Chemical data for newly analyzed samples are given in Table 1.
Single-crystal XRD studies were carried out for Samples 14 and 15 using an Xcalibur S diffractometer (OXFORD DIFFRACTION, Oxford, GB) equipped with a CCD detector (MoKα radiation) (Lomonosov Moscow State University, Faculty of Geology).
The UV–Vis–near IR absorption spectra of Samples 6, 7, 9 and 10 were measured at room temperature using a Lambda 950 spectrophotometer (Perkin-Elmer, Shelton, CT, USA). In particular, the absorption spectra of 0.5–0.9 mm afghanite grains were measured in the transmission mode through a circular diaphragm 0.8 mm in diameter. The spectra of other minerals were measured in an integrating sphere. To do this, small crystals of the studied mineral were placed in a quartz test tube, transparent in the region of 250–2000 nm, and the test tube was placed in an integrating sphere.
The photoluminescence spectra of Samples 6, 7, 9 and 10 were measured using a spectrometer based on an SDL-1 monochromator with a 600 lines per mm threaded diffraction grating (LOMO, St. Petersburg, Russia). The spectral slit width was 0.4 nm. Registration was carried out using a Hamamatsu H10721-04 photomodule (Hamamatsu, Sendai, Japan). Excitation was performed using a semiconductor laser with a wavelength of 405 nm and a power of 40 mW. The sample was fixed on the cryopinger of a filling nitrogen cryostat, which was placed in a vacuum chamber and evacuated to 10−4 Pa. Photoluminescence spectra were measured at 77 K. Excitation spectra were measured at room temperature on an LS-55 spectrofluorimeter (Perkin-Elmer, Shelton, CT, USA).
The electron spin resonance (ESR) spectra of Samples 6, 7, 9 and 10 were measured with a RE-1306 X-band spectrometer (KBST, Smolensk, Russia) with a frequency of 9.3841 GHz at room temperature and 9.1841 GHz at 77 K. For low-temperature measurements, the sample was placed in a flooded quartz cryostat.
The samples were irradiated using a low-pressure mercury lamp with a power of 30 W.

4. Results

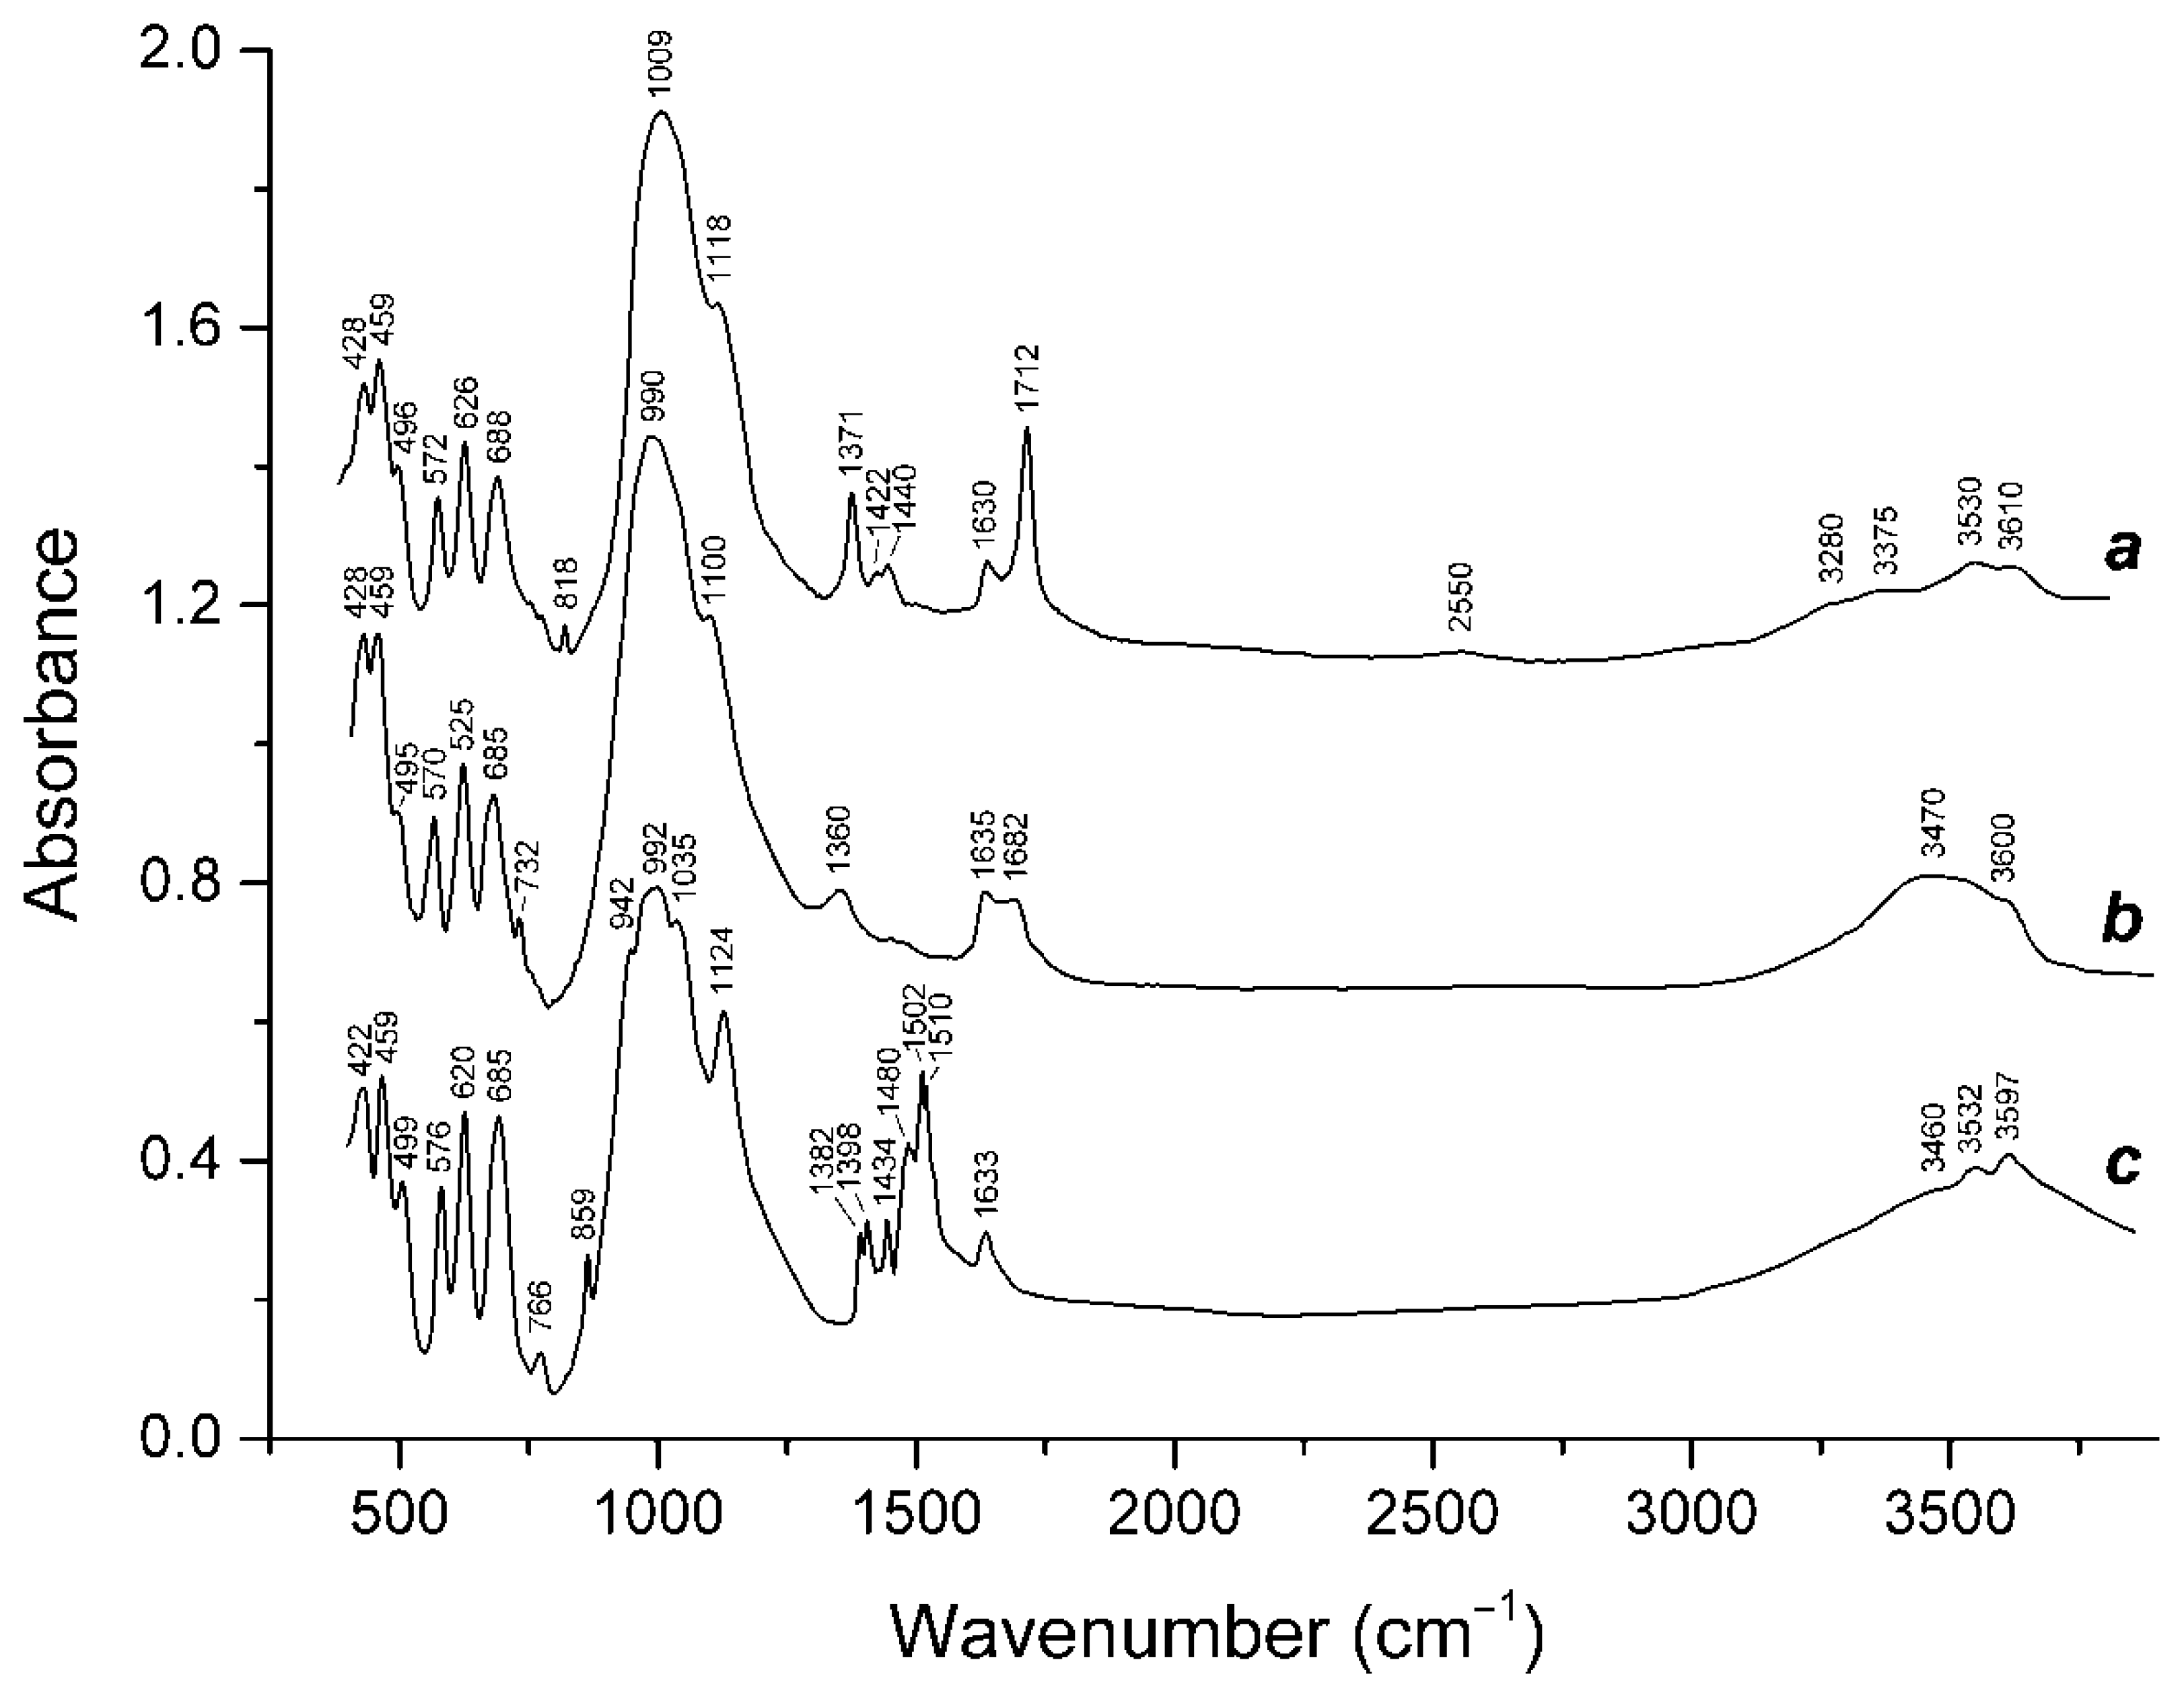
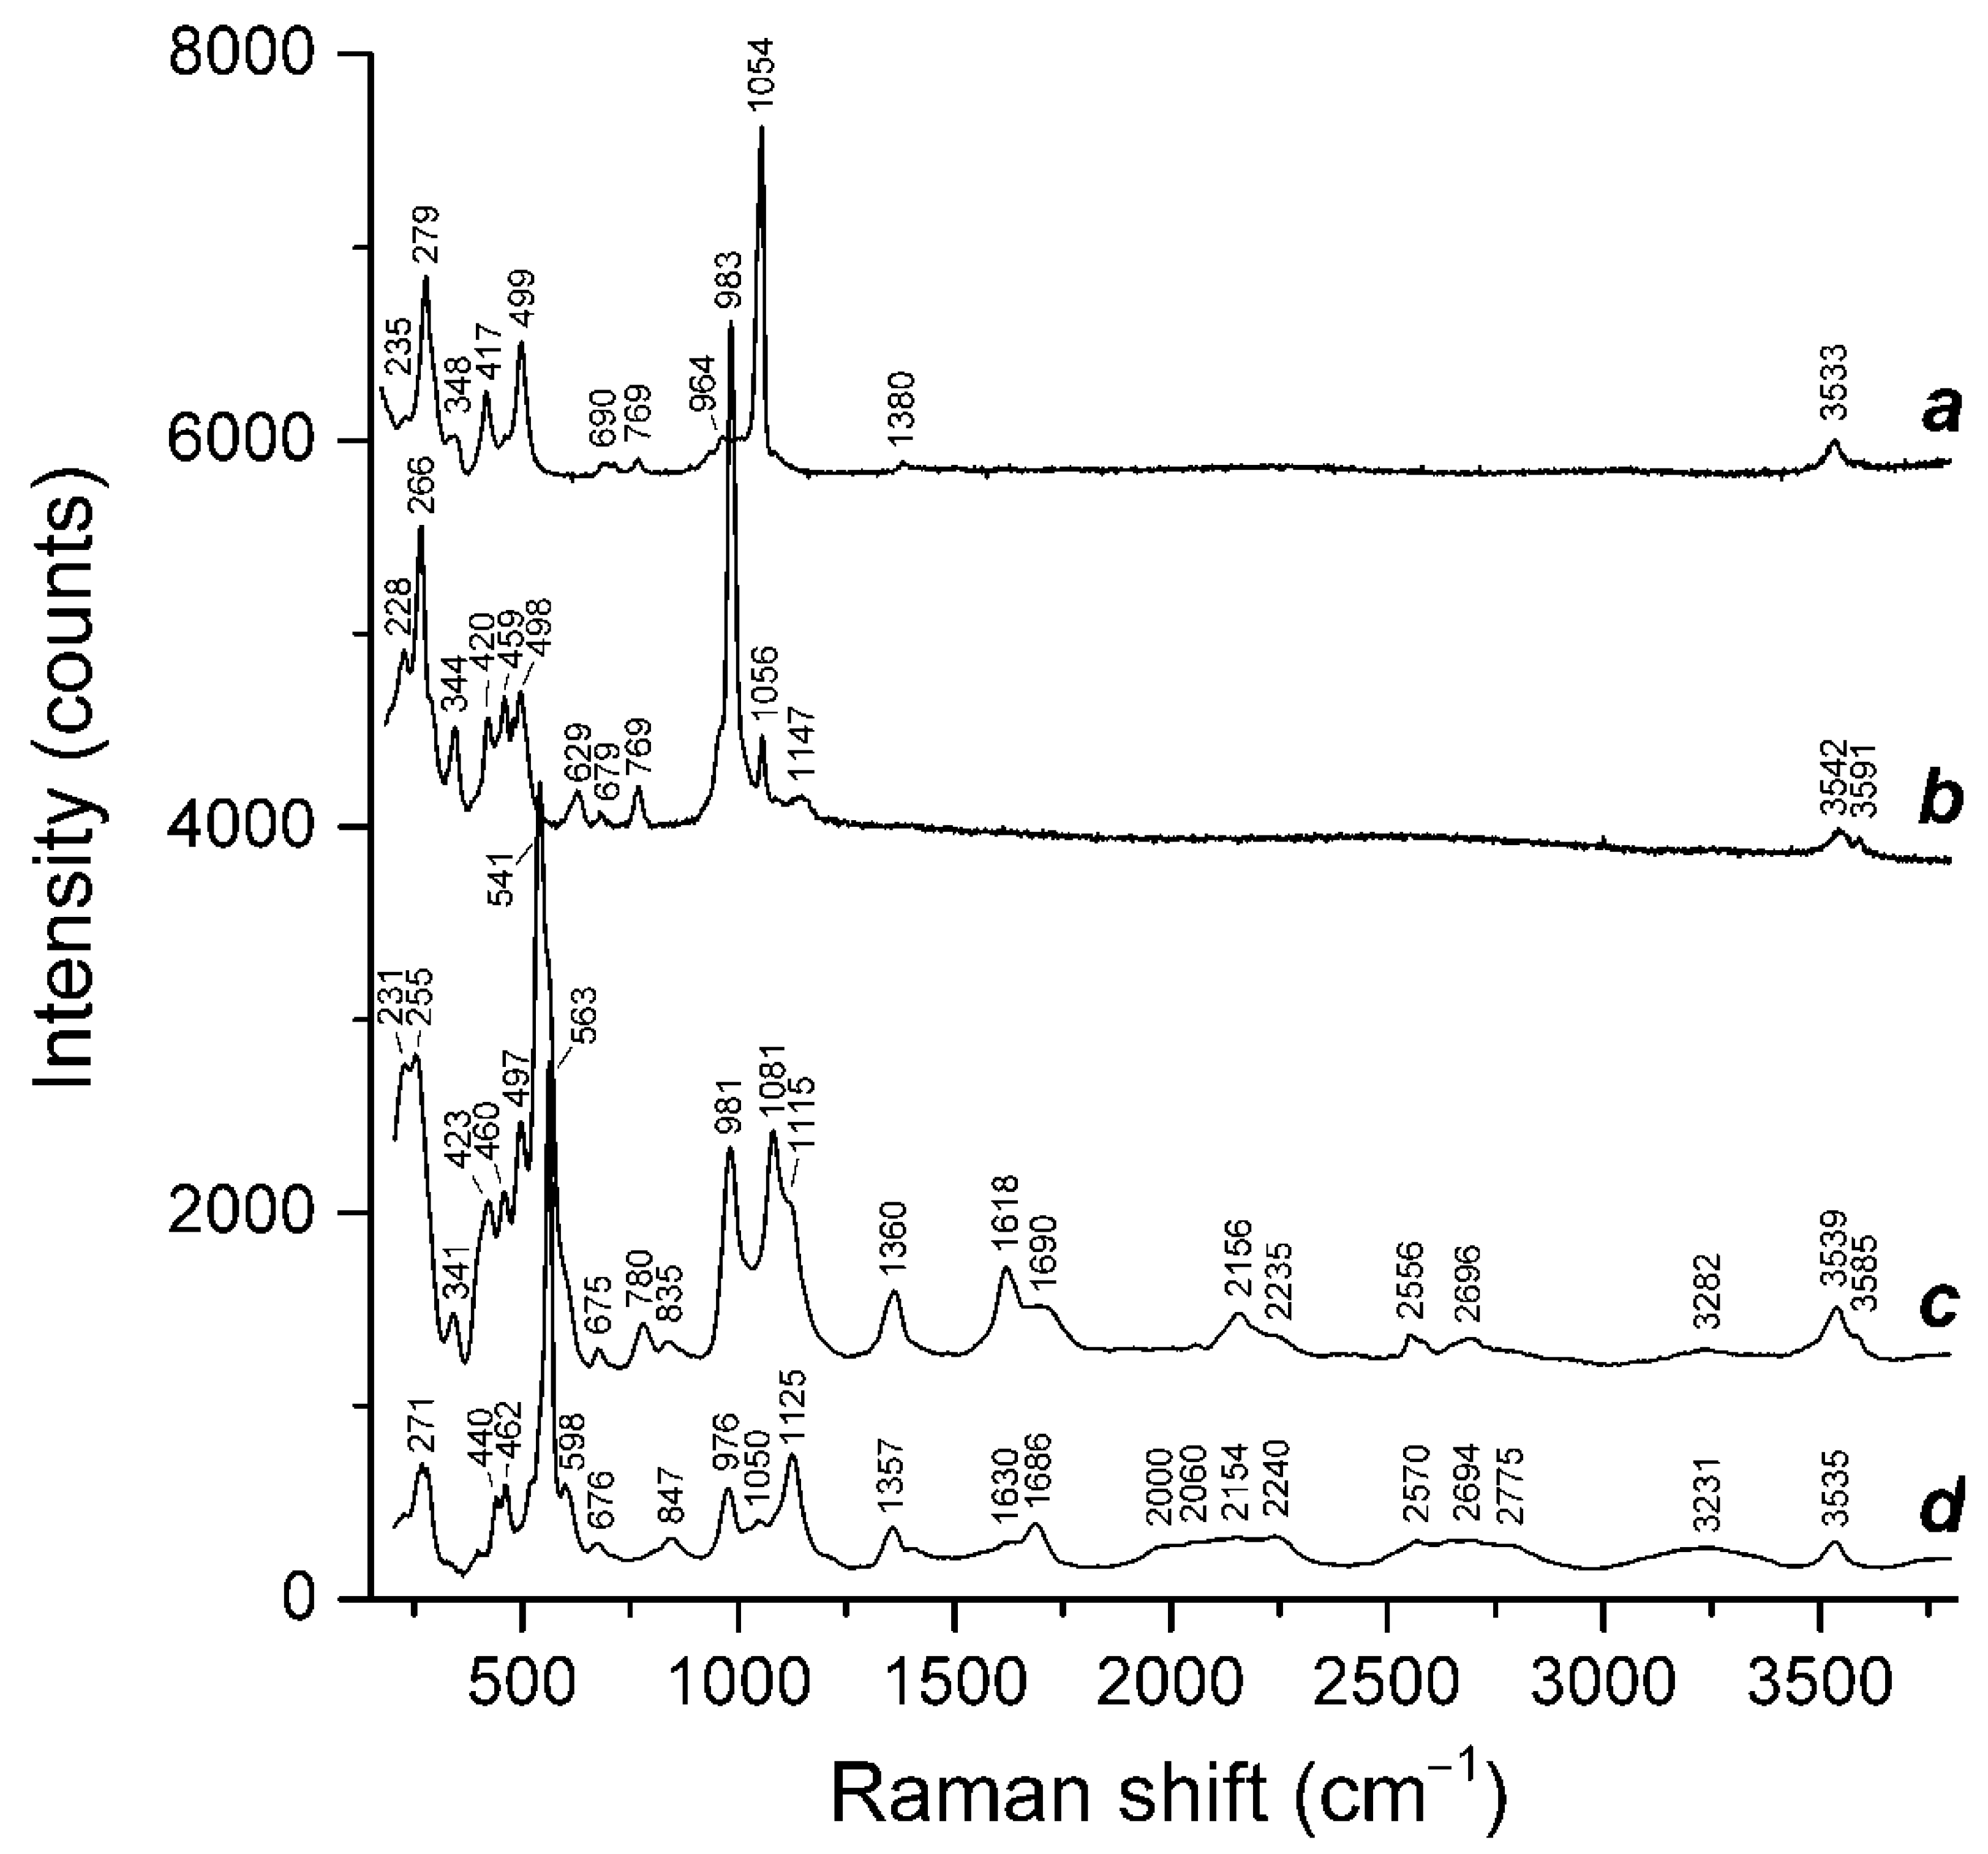
4.1. Two-Layer CRAs (Cancrinite–Vishnevite–Kyanoxalite Solid Solution System, n = 2)

A typical IR spectrum of cancrinite (Sample 1) is given in Figure 1 (curve c). A detailed analysis of the IR spectra of two-layer, cancrinite-group minerals was reported by us earlier [13]. The assignment of IR bands is as follows: 3400 to 3600 cm−1 — O–H stretching vibrations of H2O molecules; 1633 cm−1 — bending vibrations of H2O molecules; 1382 to 1510 cm−1—C–O stretching vibrations of carbonate anions which occupy different sites in the wide channel; 859 and 766 cm−1 — out-of-plane and in-plane bending vibrations of carbonate anions; other bands in the ranges of 800–1130 and 400–830 cm−1 — stretching and bending vibrations of the aluminosilicate framework. As one can see from Figure 1, bands of carbonate groups are not observed in the IR spectra of different kyanoxalite samples. Kyanoxalite from the Alluaiv Mountain (Sample 5; curve a in Figure 1) displayed IR bands related to acid oxalate anion HC2O4. In particular, the bands at 3375, 3280 and 2550 cm−1 correspond to the O–H stretching vibrations of acid groups. The band at 1712 cm−1 corresponds to the stretching vibrations involving the double C=O bond belonging to the carboxyl –COOH group. The band at 1371 cm−1 is due to the symmetric stretching vibrations of the carboxylate –COO group. The band at 818 cm−1 and the shoulder in the range of 720–740 cm−1 correspond to O–C–OH and O–C–O bending modes, respectively. According to available correlations [14], the band at 2550 cm−1 is related to a hydrogen bond with an O⋯O distance of 2.57–2.58 Å, which may correspond to the Zundel cation H5O2+ formed as a result of dissociation of the HC2O4 anion and subsequent protonation of a pair of H-bonded water molecules.
In the crystal structure of kyanoxalite of this type, the C–C bond length is equal to 1.50 Å [12]. The C–C bond length in neutral oxalates is close to 1.55 Å [15]. However, it is known that protonation of one of the carboxyl groups in an oxalate anion is accompanied by a shortening the C–C bond length [16]. This fact confirmed the presence of acid oxalate groups in Sample 5.
Sample 6 (curve b) represents another variety of kyanoxalite. In its IR spectrum, the band of stretching vibrations involving a double C=O bond is shifted towards 1682 cm−1. The bands at 1360 and 1635 cm−1 correspond to symmetric and antisymmetric C–O stretching modes of the neutral oxalate anion, respectively (the latter band is overlapped with the band of bending vibrations of the H2O molecules). The peak at 732 cm−1 was related to the O–C–O bending vibrations of the neutral oxalate anion, whereas the band O–C–OH bending vibrations are observed as an indistinct shoulder near 800 cm−1.
The Raman spectra of both aforementioned kyanoxalite samples (Samples 5 and 6, curves c and d, respectively, Figure 2) contain bands of oxalate anions (in the ranges of 780–850, 1350–1360 and 1600–1700 cm−1, which correspond to the bending, symmetric stretching and antisymmetric stretching vibrations of carboxyl or carboxylate groups). The strongest band of carbonate groups (symmetric C–O stretching mode, the range 1050–1060 cm−1: see curves a and b in Figure 2) is not observed (for Sample 5) or it is very weak (for Sample 6). The strongest band of admixed sulfate groups (symmetric S–O stretching mode, the typical range 970–1000 cm−1: see curve b in Figure 2) is located at 981 and 976 cm−1 in the Raman spectra of Sample 5 and Sample 6, respectively. The Raman bands of the two-layer, cancrinite-group minerals observed in the range of 3500–3600 cm−1 correspond to the stretching vibrations of water molecules.
The bands at 541, 835, 1081, 1360, 1618, 2156, 2696 and 3282 cm−1 in the Raman spectrum of Sample 5 correspond to the fundamentals, overtones and combination modes of the S3•− radical anion (see Table 2). Similar but weaker bands are observed in the Raman spectrum of Sample 6. The wavenumber of 563 cm−1 at the maximum of a peak observed in the Raman spectrum of Sample 6 is equal in energy to the distance between phonon repetitions in the luminescence spectrum of kyanoxalite (see below). Consequently, this peak may be a superposition of the bands of the S2•− and S3•− radical anions. Thus, the S3•− radical anion, which is a strong, blue chromophore [5,6,8], is the most probable cause of the blue color of kyanoxalite. Other bands of the Raman spectra of kyanoxalite observed in the range of 1900–2800 cm−1 are related to the stretching vibrations of the acid groups forming strong hydrogen bonds.
The UV–Vis–near IR absorption spectrum of kyanoxalite from Flora (Sample 6) is given in Figure 3. This spectrum shows a broad band with a maximum of about 16,900 cm−1, as well as a broad band at 25,400 cm−1. Luminescence was recorded under excitation in this band. In this case, a wide band with a pronounced vibrational structure is observed with maxima at 12,595, 13,294, 13,873, 14,428, 14,914, 15,477, 16,040, 16,603, 17,199, 17,729 and 18,294 cm−1 (Figure 4).
After irradiation of kyanoxalite (Sample 6) with ultraviolet radiation with an energy of more than 40,000 cm−1, the absorption spectrum changed slightly, and a shoulder near 15,000 cm−1 appeared.
Several centers are observed in the ESR spectrum of kyanoxalite (Figure 5). The signal from the first type of center has the following g tensor values: g1 = 2.002, g2 = 2.050 and g3 = 2.038. There is also an intense signal from the second type of center with the g tensor values g1 = 2.009, g2 = 2.004 and g3 = 1.996. In addition, a weak signal with a g factor of 2.018 was recorded from the third type of center.
Under ultraviolet irradiation with a photon energy of more than 40,000 cm−1, the ESR signal from the first type of center, disappeared, while the intensity of the signal from the third type of center increased.

4.2. Three-Layer CRA (Nosean, n = 3)

Infrared spectra of two nosean samples originating from different geological environments are shown in Figure 6 (Samples 7 and 8; curves a and b, respectively). They contained bands of O–H stretching vibrations of H2O molecules (in the range of 3480–3620 cm−1), antisymmetric stretching vibrations of CO2 molecules (at 2342 and 2343 cm−1) and asymmetric stretching (1133–1140 cm−1) and bending (618–619 cm−1) vibrations of SO42− anions, as well as different modes of the aluminosilicate framework (other bands in the range of 360–1200 cm−1). Additional bands at 1352, 1687–1690 and 3355 cm−1 are related to acid groups.
The assignment of Raman bands in sodalite-group minerals made based on the data from [5,7,8,17,18,19] is given in Table 2. It is notable that CO2 molecules and extra-framework components with acid groups are common for hydrous sodalite-group minerals [8].
The presence of SO42− anions, CO2 molecules and acid groups in the nosean Samples 7 and 8 was confirmed by the Raman spectra (Figure 7 and Table 2). In particular, the Raman bands at 1273–1279 and 1376–1382 cm−1 correspond to Fermi resonance modes of CO2; the strong band at 980–981 cm−1 correspond to SO42− symmetric stretching mode, and the bands in the range of 2100–3200 cm−1 are due to the O–H stretching vibrations of acid OH groups forming strong hydrogen bonds. Raman spectroscopy is more sensitive to vibration of protons than IR spectroscopy and can be used for the estimation of the O⋯O distances for corresponding hydrogen bonds based on available correlations [14]. In particular, the bands at 2141, 2428–2430, 2762 and 3126 cm−1 correspond to the O⋯O distances of ~2.5, 2.56, 2.60 and 2.67 Å, which are typical for hydrated proton (the so-called Zundel cation H5O2+). In reference to this, it should be noted that, in the nosean structure, there is a cluster Na4·H2O with the Na⋯O distance of 2.6 Å [20]. Thus, the substitution of one Na+ cation for an H3O+ cation may result in the formation of the Zundel cation. As one can see from the empirical formulae of the nosean Samples 7 and 8, they are Na deficient. This fact indirectly confirms the occurrence of the Zundel cation in these samples.
The outer zones of nosean individuals (such as Sample 7) have a blue tint. The samples show intense luminescence with a maximum at 16,000 cm−1 and a vibrational structure with phonon repetitions at a distance of 540 cm−1. This luminescence is caused by the S2•− radical anions (Figure 8).
In the ESR spectrum of Sample 7, a weak signal with g = 2.018, related to a sulfide radical anion, is observed on the background of a broad signal from Fe3+ clusters which presumably occurred in admixed iron oxide (Figure 9). A similar signal was assigned to the S6•− radical anion [21]. In the UV–Vis–near IR absorption spectrum (Figure 10), Sample 7 showed a broad peak at 37,600 cm−1, which is close to the band at 37,700 cm−1 assigned to the S6•− radical anion [19].

4.3. Eight-Layer CRAs with Afghanite-Type Framework Topology (n = 8)

Figure 11 shows the IR spectra of afghanite. The spectra of Samples 9, 10 and 11 are similar. The main differences are in the range of 1300–3500 cm−1, which corresponds to volatile extra-framework components. No bands are observed in this range for Sample 11, which originated from an effusive rock.
Two other samples (9 and 10) have metasomatic origin and crystallized at lower temperatures. Both samples contain small numbers of H2O molecules which absorbed at 1650–1669 and 3300–3410 cm−1 and CO32− anions which absorbed in the range of 1360–1480 cm−1. Additionally, Sample 9 contains neutral CO2 molecules which absorbed at 2353 cm−1, whereas the IR spectrum of Sample 10 contains bands of acid groups (at 1748 and 2920 cm−1).
The strongest band in the Raman spectra of the studied afghanite samples (Figure 12) observed in the range of 990–995 cm−1 correspond to SO42− symmetric stretching vibrations (A11) mode). The maxima of the other bands of SO42− anions are located at 1130–1140 cm−1 (SO42− asymmetric stretching vibrations (F23) mode)), 617–621 cm−1 (SO42− bending vibrations (F24) mode)) and 450–456 cm−1 (SO42− bending vibrations (the E2) mode), possibly overlapping with the band of O–Si(Al)–O bending vibrations). Additionally, the Raman spectrum of the afghanite from Ladgvardara (Sample 10) contains bands of the S3•− radical anion at 547, 585, 1085, 1350, 1633 and 2194 cm−1 (see Table 2). Thus, the presence of S3•−, which is a strong, blue chromophore occurring in lazurite and related blue sodalite-group minerals [5,6,8], is the cause of the color of Sample 10.
A weak band of S3•− or S2•− at 545 cm−1 is also observed in the Raman spectrum of the pale-green afghanite from Sar-e Sang (Sample 9). No distinct bands of sulfide groups are observed in the Raman spectrum of the colorless afghanite from Tre Croci (Sample 11).
Other distinctive features of the colored afghanites from gem lazurite deposits are Raman bands which correspond to the stretching vibrations of the HS anion (at 2566–2568 cm−1) and O–H stretching vibrations of acid groups (other bands in the range of 1800–3000 cm−1), as well as a weak band at 339–340 cm−1, which may correspond to the cis-S4 mixed ν4 mode (combined symmetric bending and stretching vibrations [17,18]). The shoulder at 647 cm−1 in the Raman spectrum of Sample 10 may correspond to the cis-S4 stretching ν2 mode [17,18]. The weak bands at 775 and 1061–1113 cm−1 correspond to the stretching vibrations of the Al–O–Al and Al–O–Si fragments, respectively.
The UV–Vis–near IR absorption spectra of the studied afghanites (Samples 9 and 10) are shown in Figure 13. In the spectrum of afghanite from the Sar-e Sang deposit (Sample 9), weak and narrow bands are observed at 5240, 5710 and 7240 cm−1. These bands were absent in the UV–Vis–near IR absorption spectrum of afghanite from Ladgvardara (Sample 10). Both spectra show a broad band with a maximum at 11,300 cm−1. In the visible region of the spectrum, afghanite from Sar-e Sang contains an intense band with a maximum at 16,870 cm−1. In the spectrum of the afghanite from Ladgvardara, this band is less intense; its maximum is shifted to a blue spectral region and is located at 17,070 cm−1. In the region above 21,000 cm−1, an increase in the absorption intensity and a shoulder at about 26,800 cm−1 are observed.
The ESR spectra of the afghanite Samples 9 and 10 at room temperature show a weak signal and a poor-resolved band with a g factor of about 2.032. The signal intensity is three orders of magnitude lower than in the ESR spectrum of lazurite [6]. When the samples were cooled to a temperature of 77 K, the signal intensity increased (Figure 14), and its structure became better resolved, with the components gx = 2.002, gy = 2.060 and gz = 2.038 for Sample 9 and gx = 2.002, gy = 2.057 and gz = 2.035 for Sample 10.
When the afghanite samples were excited in the 22,500 cm−1 band, a broad luminescence band was observed with a maximum at 16,573 cm−1 (Figure 15). For the sample from Ladgvardara (Sample 10), this band has a vibrational structure with maxima at 14,389, 14,934, 1579, 16,024, 16,569, 17,114, 17,659, 18,204 and 18,749 cm−1 (±5 cm−1 for each component). In the absorption spectrum of the sample from Sar-e Sang, the maximum of the luminescence band is slightly red-shifted (towards 16,623 cm−1). The luminescence band of this sample also exhibited a vibrational structures. Each vibrational component is split and represents a doublet with the distance between the maxima of about 200 cm−1.
The luminescence excitation spectrum of Sample 9 is shown in Figure 16. In this spectrum, intense bands with maxima at 22,500, 26,500 and 32,300 cm−1, as well as a rise starting at about 37,000 cm−1, are observed.
Steudelite, ideally Na4(K8Na8Ca7)Ca4(Al24Si24O96)(SO3)6F6·4H2O [9], and alloriite, (Na,K)26Ca6(Al24Si24O96)(SO4)4(SO3,CO3)2(OH)2·4H2O [22], are also eight-layer CRAs with an afghanite-type framework topology. Their IR spectra (for Samples 12 and 13, respectively) are shown in Figure 17. Both minerals are H2O-rich and contain SO42− groups absorbing in the range of 1116–1150 cm−1. Water molecules occurring in the columns of cancrinite cages and alternating there with Na+ cations absorb in the ranges of 1630–1640 and 3430–3510 cm−1, respectively. The doublet 1463 + 1492 cm−1 and the shoulder at 3655 cm−1 in the IR spectrum of alloriite corresponds to the carbonate groups occurring in liottite cages and OH anions in isolated cancrinite cages, respectively. In the structure of steudelite, corresponding sites contain SO32− and F anions. The shoulder at 960 cm−1 in the IR spectrum of steudelite is related to the asymmetric stretching vibrations of the sulfite anions SO32−.

4.4. Franzinite (n = 10) and Marinellite (n = 12)

Franzinite and marinellite are trigonal, multilayer cancrinite-group minerals containing different sets of cages ([can]2[sod]6[los]2 and [can]6[sod]4[lio]2 per unit cell, respectively). Their IR spectra (for Samples 14 and 15, respectively) are shown in Figure 18.
The range from 500 to 750 cm−1 in the IR spectra of cancrinite-related minerals is considered as a finger-print region which is sensitive to the framework topology [4]. In particular, in the IR spectra of all minerals containing liottite (lio) cage (i.e., afghanite, steudelite, alloriite, tounkite, marinellite, farneseite and biachellaite), a band at 547 ± 4 cm−1 is observed, whereas IR absorption in the range of 523–533 cm−1 is a characteristic feature of cancrinite-group minerals containing losod (los) cage (bystrite, sulfhydrylbystrite, liottite, tounkite, biachellaite and fantappièite) [23,24,25]. Thus, the absorptions at 530 and 549 cm−1 in the IR spectra of franzinite and marinellite are related to the losod and liottite cages, respectively, whereas most other bands in the finger-print region are related to cancrinite and sodalite cages. The only exception is the band at 619–620 cm−1, which is due to SO42− bending vibrations (F24) mode). The bands in the range of 1110–1140 cm−1 correspond to the asymmetric stretching vibrations (F23) mode) of extra-framework SO42− groups. The ranges of 1630–1700 and 3400–3700 cm−1 are related to the H–O–H bending and O–H stretching modes. In particular, the band at 1695 cm−1 in the IR spectrum of marinellite may correspond to the hydronium cation H3O+.
The Raman spectrum of marinellite (Figure 19) confirms the presence of hydronium in the studied sample; broad, weak bands in the range of 2200–3100 cm−1 correspond to strong hydrogen bonds with O⋯O distances of 2.5 to 2.7 Å, which are typical for hydronium hydrate (Zundel cation H5O2+ [14]). In the range of 400 to 1200 cm−1, the Raman spectra of franzinite and marinellite are quite similar and are dominated by bands of sulphate groups.
The shoulder at 345 cm−1 in the Raman spectrum of marinellite may correspond to S4 or S4•−, which are pink chromophores [17,18,19]. No other bands which could be related to chromophores and explain the violet color of Sample 15 were observed.

5. Discussion

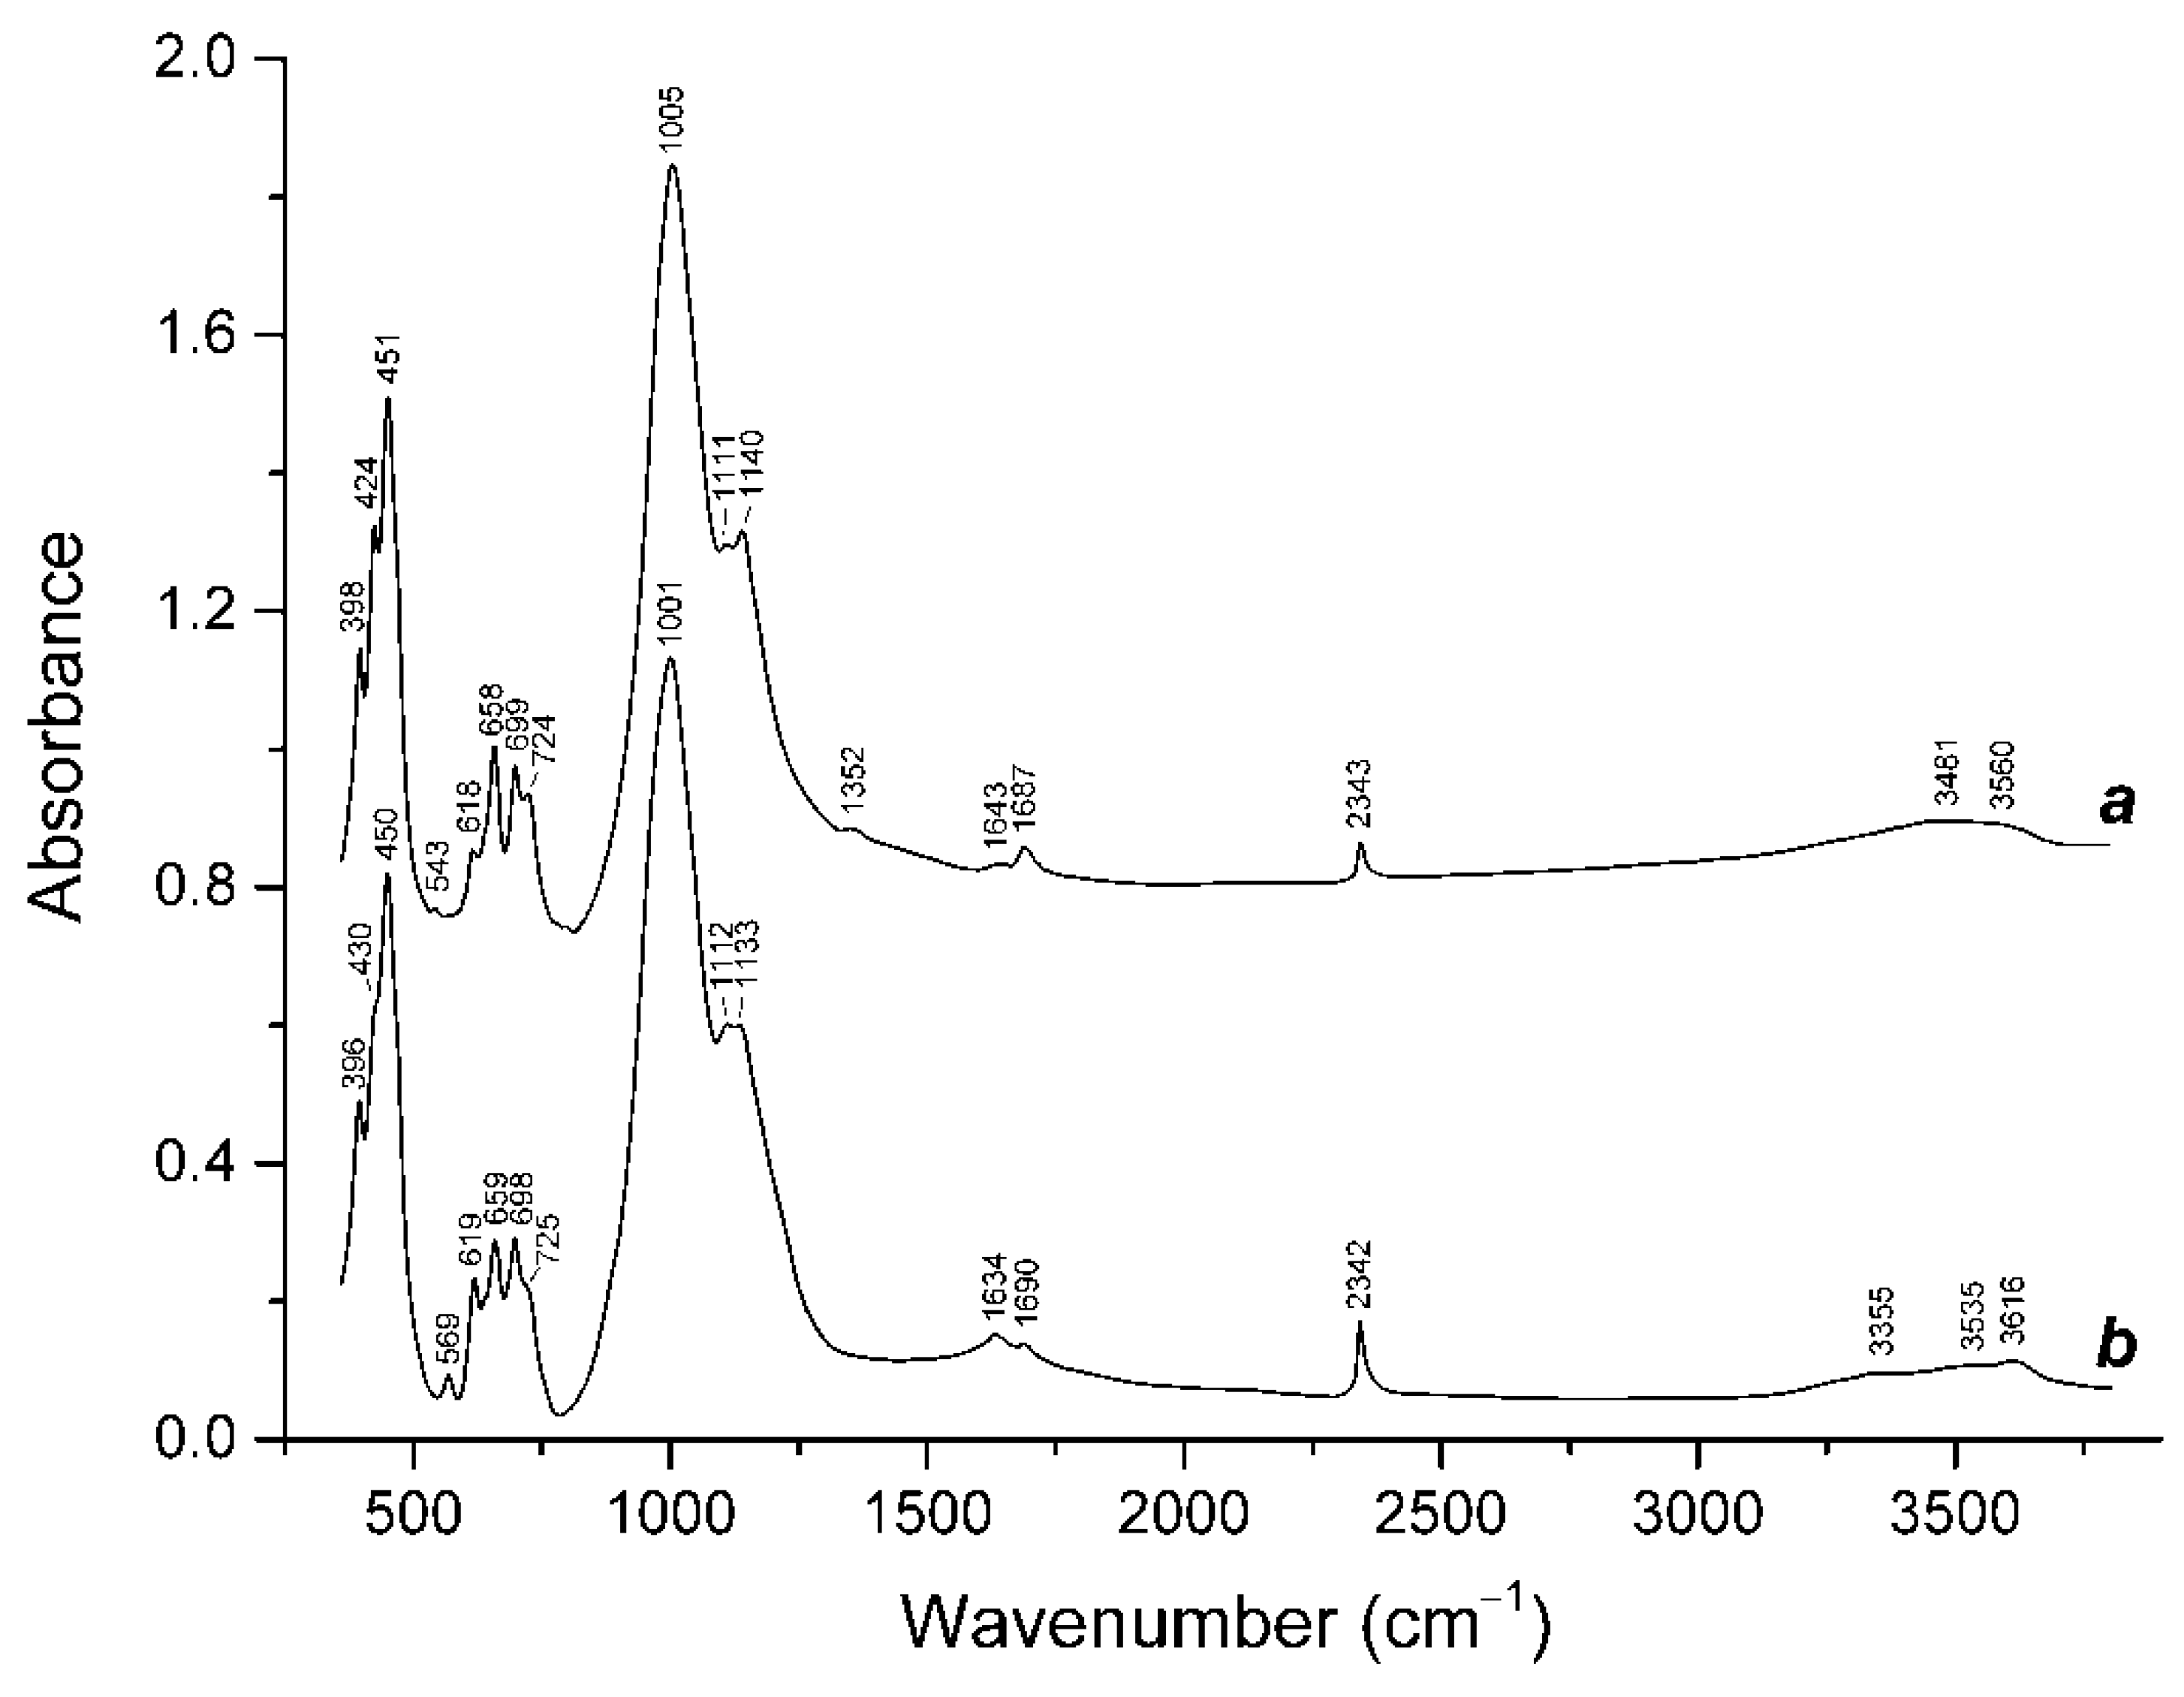
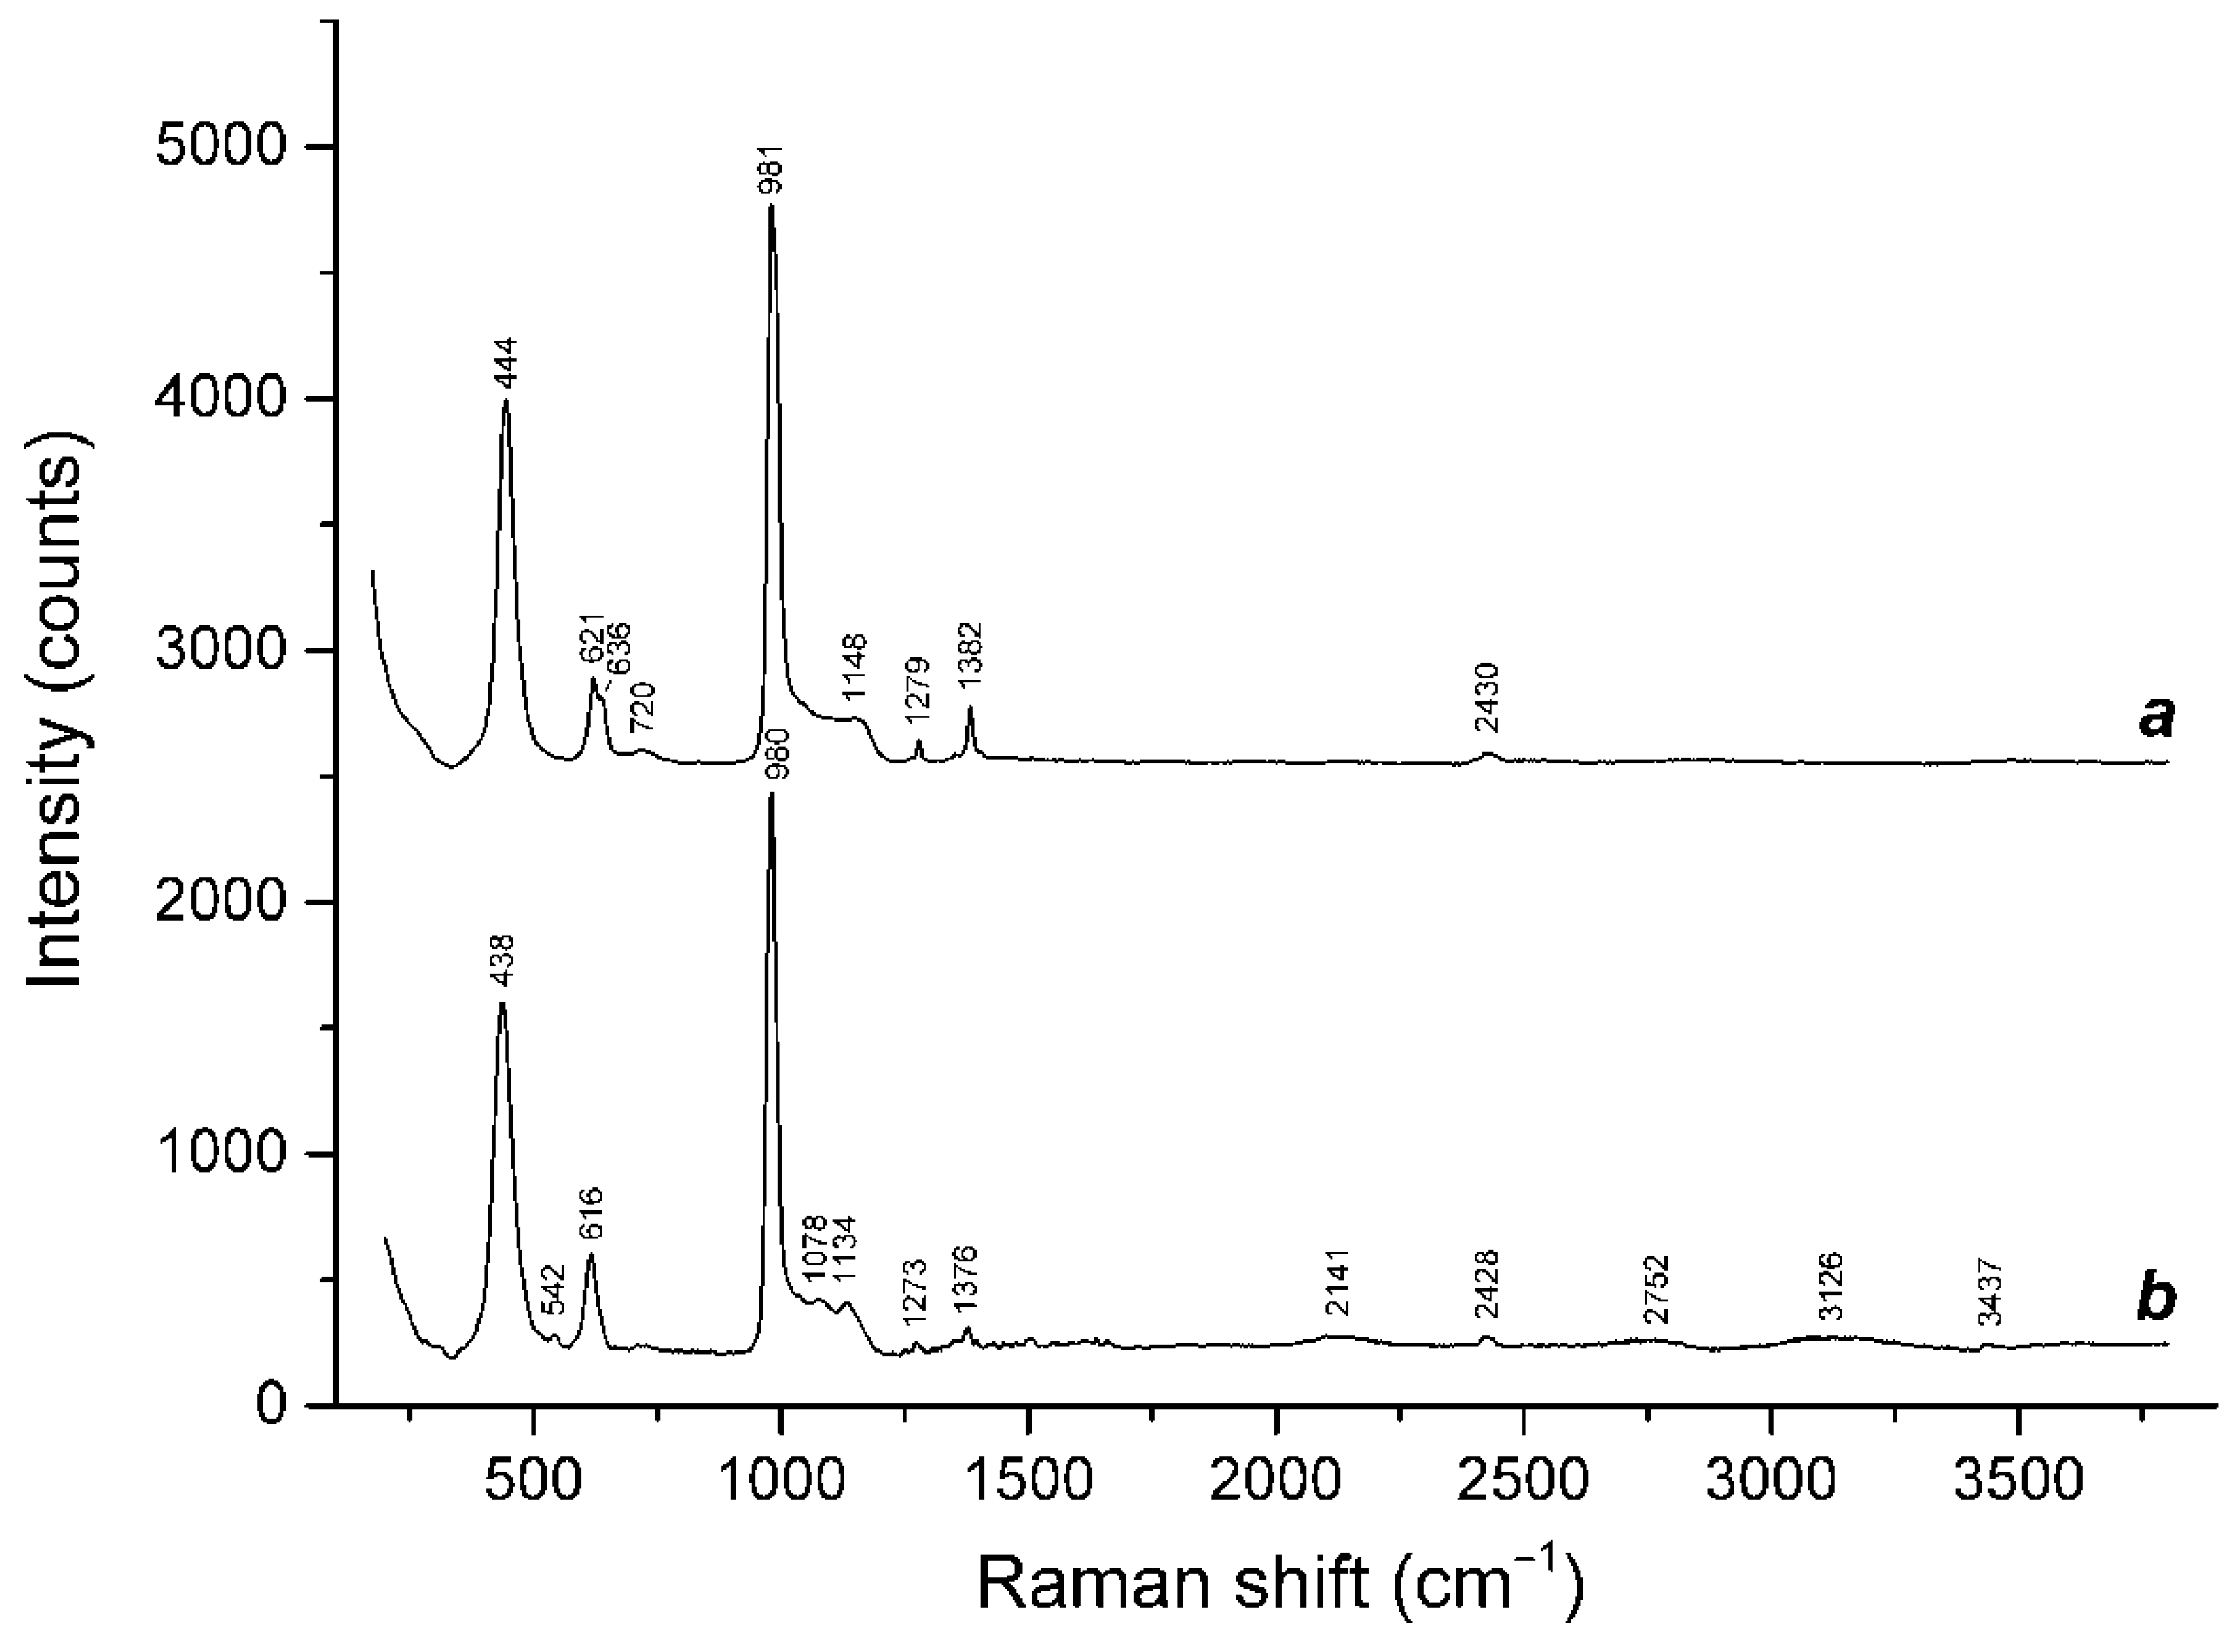
5.1. Spectroscopy of Extra-Framework Components in Two-Layer CRAs

Cancrinite is usually colorless or has a yellowish color, but blue specimens are occasionally found. Unlike most minerals of the sodalite [5,6,8] and cancrinite groups (see below), it is not associated with the presence of the radical anion S3•− and has a radiation nature. When cancrinite is irradiated with ultraviolet or X-ray radiation, it turns blue [11,26]. After irradiation of cancrinite, intense absorption bands appeared in its UV–Vis–near IR absorption spectrum near 16,100 cm−1 and in the range of 25,000–37,000 cm−1, and a signal with gy = 2.014 and gx = 2.018 was observed in the ESR spectrum. It was shown in [27] that, in this case, the blue color and the ESR signal are due to the appearance of whole CO3•− radical anions. These radicals are created by irradiation with ultraviolet light with an energy above 40,300 cm−1 and are caused by the decay of electronic excitations near the CO32− anions. As a result, anionic chlorine vacancies are formed that capture electrons and CO3•− radical anions. The radiation defects are formed when cancrinite crystals are irradiated at temperatures above 120 K. The color remains unchanged up to 500 K. When irradiated at temperatures below 120 K, cancrinite almost does not change color, but it exhibits intrinsic luminescence with maxima at 22,600 and 30,600 cm−1. As the temperature increases, the luminescence intensity decreases, and the samples begin to change color, which may indicate an exciton mechanism for the formation of radiation defects.
A broad band with a maximum at 16,900 cm−1 in the absorption spectrum and the ESR signal from the first type of center can be attributed to the S3•− radical anion. Geometrically, these centers are slightly distorted relative to S3•− in afghanites and are close to S3•− centers in synthetic cancrinite [28]. The absorption band at 25,400 cm−1 is related to the S2•− centers. Luminescence attributed to S2•− centers is observed under excitation in this band. The distance between phonon repetitions is about 563 cm−1. The maximum of the luminescence band is shifted to lower energies compared to the luminescence of S2•− radical anions in afghanite, which indicates a difference in the environment of this radical in kyanoxalite compared to afghanites. The distance between phonon satellites in the spectrum is related to the S–S bond length [29]. This value differs for kyanoxalite and afghanite, which indicates different bond lengths in the S2•− radical anions occurring in these minerals.
The ESR signal of the second type of center can be associated with the presence of radical anions CO2•− or HC2O4•− in kyanoxalite. For CO2•− centers in strontium carbonate, the components of the g tensor are g1 = 2.007, g2 = 2.005 and g3 = 1.998 [30]. Corresponding values for HC2O4•− in ammonium oxalate monohydrate are g1 = 1.999, g2 = 2.002 and g3 = 2.005 [31]. The averaged g factor for oxalate radical anions in aluminosilicates is about 2.004 [32].
After irradiation, the ESR signal from the third type of center increases, and a shoulder appears at 15,000 cm−1. As in the case of cancrinites, the ESR signal with a g factor of 2.018 and the induced absorption band at 15,000 cm−1 are associated with the radical anions CO3•−. After irradiation, the ESR signal from S3•− radical anions disappears. Obviously, the observed discoloration of kyanoxalite after prolonged exposure to sunlight is associated with this phenomenon.
In the region of about 40,000 cm−1 is the ionization energy of CO32− anions, which are electron donors. A simultaneous increase in the number of CO3•− centers and a decrease in S3•− upon irradiation may indicate that there is a photoinduced electron transfer from CO32− to S3•− with the formation of S32− anions, the absorption of which is in the vacuum ultraviolet region, and they did not appear in the ESR spectra obtained in this work.

5.2. Specific Features of Isomorphism in Sodalite-Group Minerals

Sodalite-group minerals are characterized by a wide diversity of extra-framework components including Na+, K+, Ca2+, Cl, SO42−, CO32−, OH, F, Snm, S2, S3, S4, SO4, H2O, CO2, COS, S4, S6, etc. (see Table 2). Some of them are known as yellow (S2 and S6), blue (S3 and SO4) or red (S4 and S4) chromophores, which determine color diversity of these minerals. New data presented above confirm the affinity of the sodalite framework structure to CO2 molecules and different polysulfide species including the S6 radical anion, which was first detected in this work.
Recently, Raman spectroscopy has been shown to be a sensitive tool for detecting the Zundel cation H5O2+ in minerals [14]. New data obtained in this work show that replacing Na+ with H3O+ in the Na4·H2O cluster with an Na⋯O distance of 2.6 Å occurring in the nosean structure results in the formation of the Zundel cation (Samples 7 and 8, Figure 7).

5.3. Isomorphism of Extra-Framework Components of Afghanite

Absorption bands in the range of 5000–7300 cm−1 in the UV–Vis–near IR absorption spectrum of afghanite from Sar-e Sang are associated with overtones of the vibrations of water molecules (Figure 13). In the range of 9000–13,000 cm−1, there is a wide band. In this region of the spectrum, radical anions S4•−, having cis-C2v, trans-C2h and Cs conformations absorb; the positions of the most intense absorption bands associated with transitions in S4•− conformers were obtained from ab initio quantum chemical calculations and were in the range of 9000 to 11,100 cm−1. Using the calculated oscillator strength, which is equal to 0.006 for Cs and 0.04 to 0.05 for the cis- and trans- conformers of S4•−, one could use the Smakula formula [33] to estimate the concentration of these molecules in afghanite Samples 9 and 10, which did not exceed 5 × 1018 cm−3.
In the visible region of the absorption spectra of colored afghanites, a broad band with a maximum in the region of 16,800 to 17,100 cm−1 was detected. This band is related to the blue chromophore S3•− present in Samples 9 and 10. In natural lazurite and related blue sodalite-group minerals, the absorption maximum of the band associated with S3•− is observed at about 16,700 cm−1 [5,6]; in the spectrum of synthetic Li-cancrinite, the band assigned to the S3•− centers is observed at 16,600 cm−1 [34]; in the spectra of synthetic Na- and K-cancrinites, this band is shifted to 15,900 and 15,700 cm−1, respectively [28]. The oscillator strength calculated for the “blue” transition in S3•− is about 0.07 [35]. Consequently, the concentration of S3•− estimated by the Smakula formula [33] for the sample from Sar-e Sang was about 1019 cm−3, and, for the afghanite from Ladjvardara, it was one and a half times less.
The shoulder at ~26,800 cm−1 is related to the S2•− radical anion which is a yellow chromophore. This assignment is confirmed by the luminescence spectra (Figure 15). The observed luminescence and excitation spectra were characteristic of the S2•− radical anion (a yellow chromophore). The distance between satellites is about 545 cm−1, which coincides with the wavenumber of a strong band recorded in the Raman spectra. Previously, such luminescence was recorded for minerals of the sodalite group: sapozhnikovite (with a maximum at 16,000 cm−1 and the distance between the satellites of 536 cm−1 [7]), haüyine (with a maximum at 15,400 cm−1 and the distance between the satellites of 590 cm−1 [5]) and hackmanite (with a maximum at 16,400 cm−1 and phonon repetitions at a distance of 535 cm−1 [36,37]).
In the energy region above 37,000 cm−1, an increase in the absorption and excitation spectrum was observed. In this region, there are transitions within sulfate anions and the edge of the fundamental absorption of afghanite.
An ESR signal with components of g tensor gx = 2.002, gy = 2.060 and gz = 2.038 for Sample 9 and gx = 2.002, gy = 2.057 and gz = 2.035 for Sample 10 refers to the S3•− radical anion (Figure 14). For synthetic cancrinite, the g tensor of a similar signal had the following components: gx = 2.002, gy = 2.050 and gz = 2.036. According to calculations in [28], a free S3•− radical anion has the following components of the g tensor: gx = 2.002; gy = 2.061; and gz = 2.039. For the S3•− radical anion in haüyine, the g tensor has the components gx = 2.003; gy = 2.05; and gz = 2.033 [5]. Thus, the configurations of S3•− in the afghanite samples from Sar-e Sang and Ladgvardara are slightly different. In the Ladgvardara afghanite, this species has a configuration close to a free particle, while the S3•− radical anion in the Sar-e Sang afghanite is similar in its spatial structure to that in synthetic cancrinites. The difference in the geometry could also explain the blue shift of the maximum of the absorption band of S3•− for the afghanite from Ladgvardara.
The intensity of the ESR signal of the S3•− centers in the afghanites obtained at room temperature is three orders of magnitude lower than analogous signal of lazurite [6]. Thus, the concentration of such centers does not exceed 1019 cm−3, which agrees with the estimates obtained above using the Smakula formula.
In addition to the signal from S3•−, in the ESR spectra of the studied afghanites, one more signal is observed, with g factors of 2.030, 2.018, 2.011 and 2.007. The corresponding peaks are marked in Figure 14 with asterisks. This signal could have been caused by radiation-induced radical anions (SO3)•− or (SO4)•− [38,39]. A signal with g = 2.008 was previously observed for minerals of the sodalite group [5] and sapozhnikovite [7]. In [40], this signal was attributed to the S2•− radical anions. However, in the ESR spectra of alkali halide crystals and synthetic ultramarine, the g tensor has a significant anisotropy (g1 = 2.69, g2 = 2.03 and g3 = 1.86) [41].
In the studied afghanite samples, a weak broad band with g = 2.62 is observed. Therefore, the ESR signal with g1 = 2.620, g2 = 2.030 and g3 = 2.007 can be associated with the S2•− radical anion. However, it is difficult to draw an unambiguous conclusion about the nature of this signal because the hyperfine structure of the 33S isotope is not resolved for afghanites at a temperature of 77 K. On the other hand, the observed signal is close to the calculated values for S4•− radical anions, the giso factor of which, in the cis configuration, is close to 2.03, while, in the Cs configuration, it is equal to 2.011 [18]. The simultaneous presence of absorption bands near 11,000 cm−1 and a characteristic ESR signal may indicate the presence of different S4•− conformers.
The parameters of the S2•−, S3•− and possibly S4•− radical anions are slightly different for the afghanites from Ladgvardara and Sar-e Sang. These differences could be caused by interactions of the radical anions with other extra-framework components including H2O and CO2 molecules occurring in Sample 9, as well as hydronium cations (in the case of Sample 10).

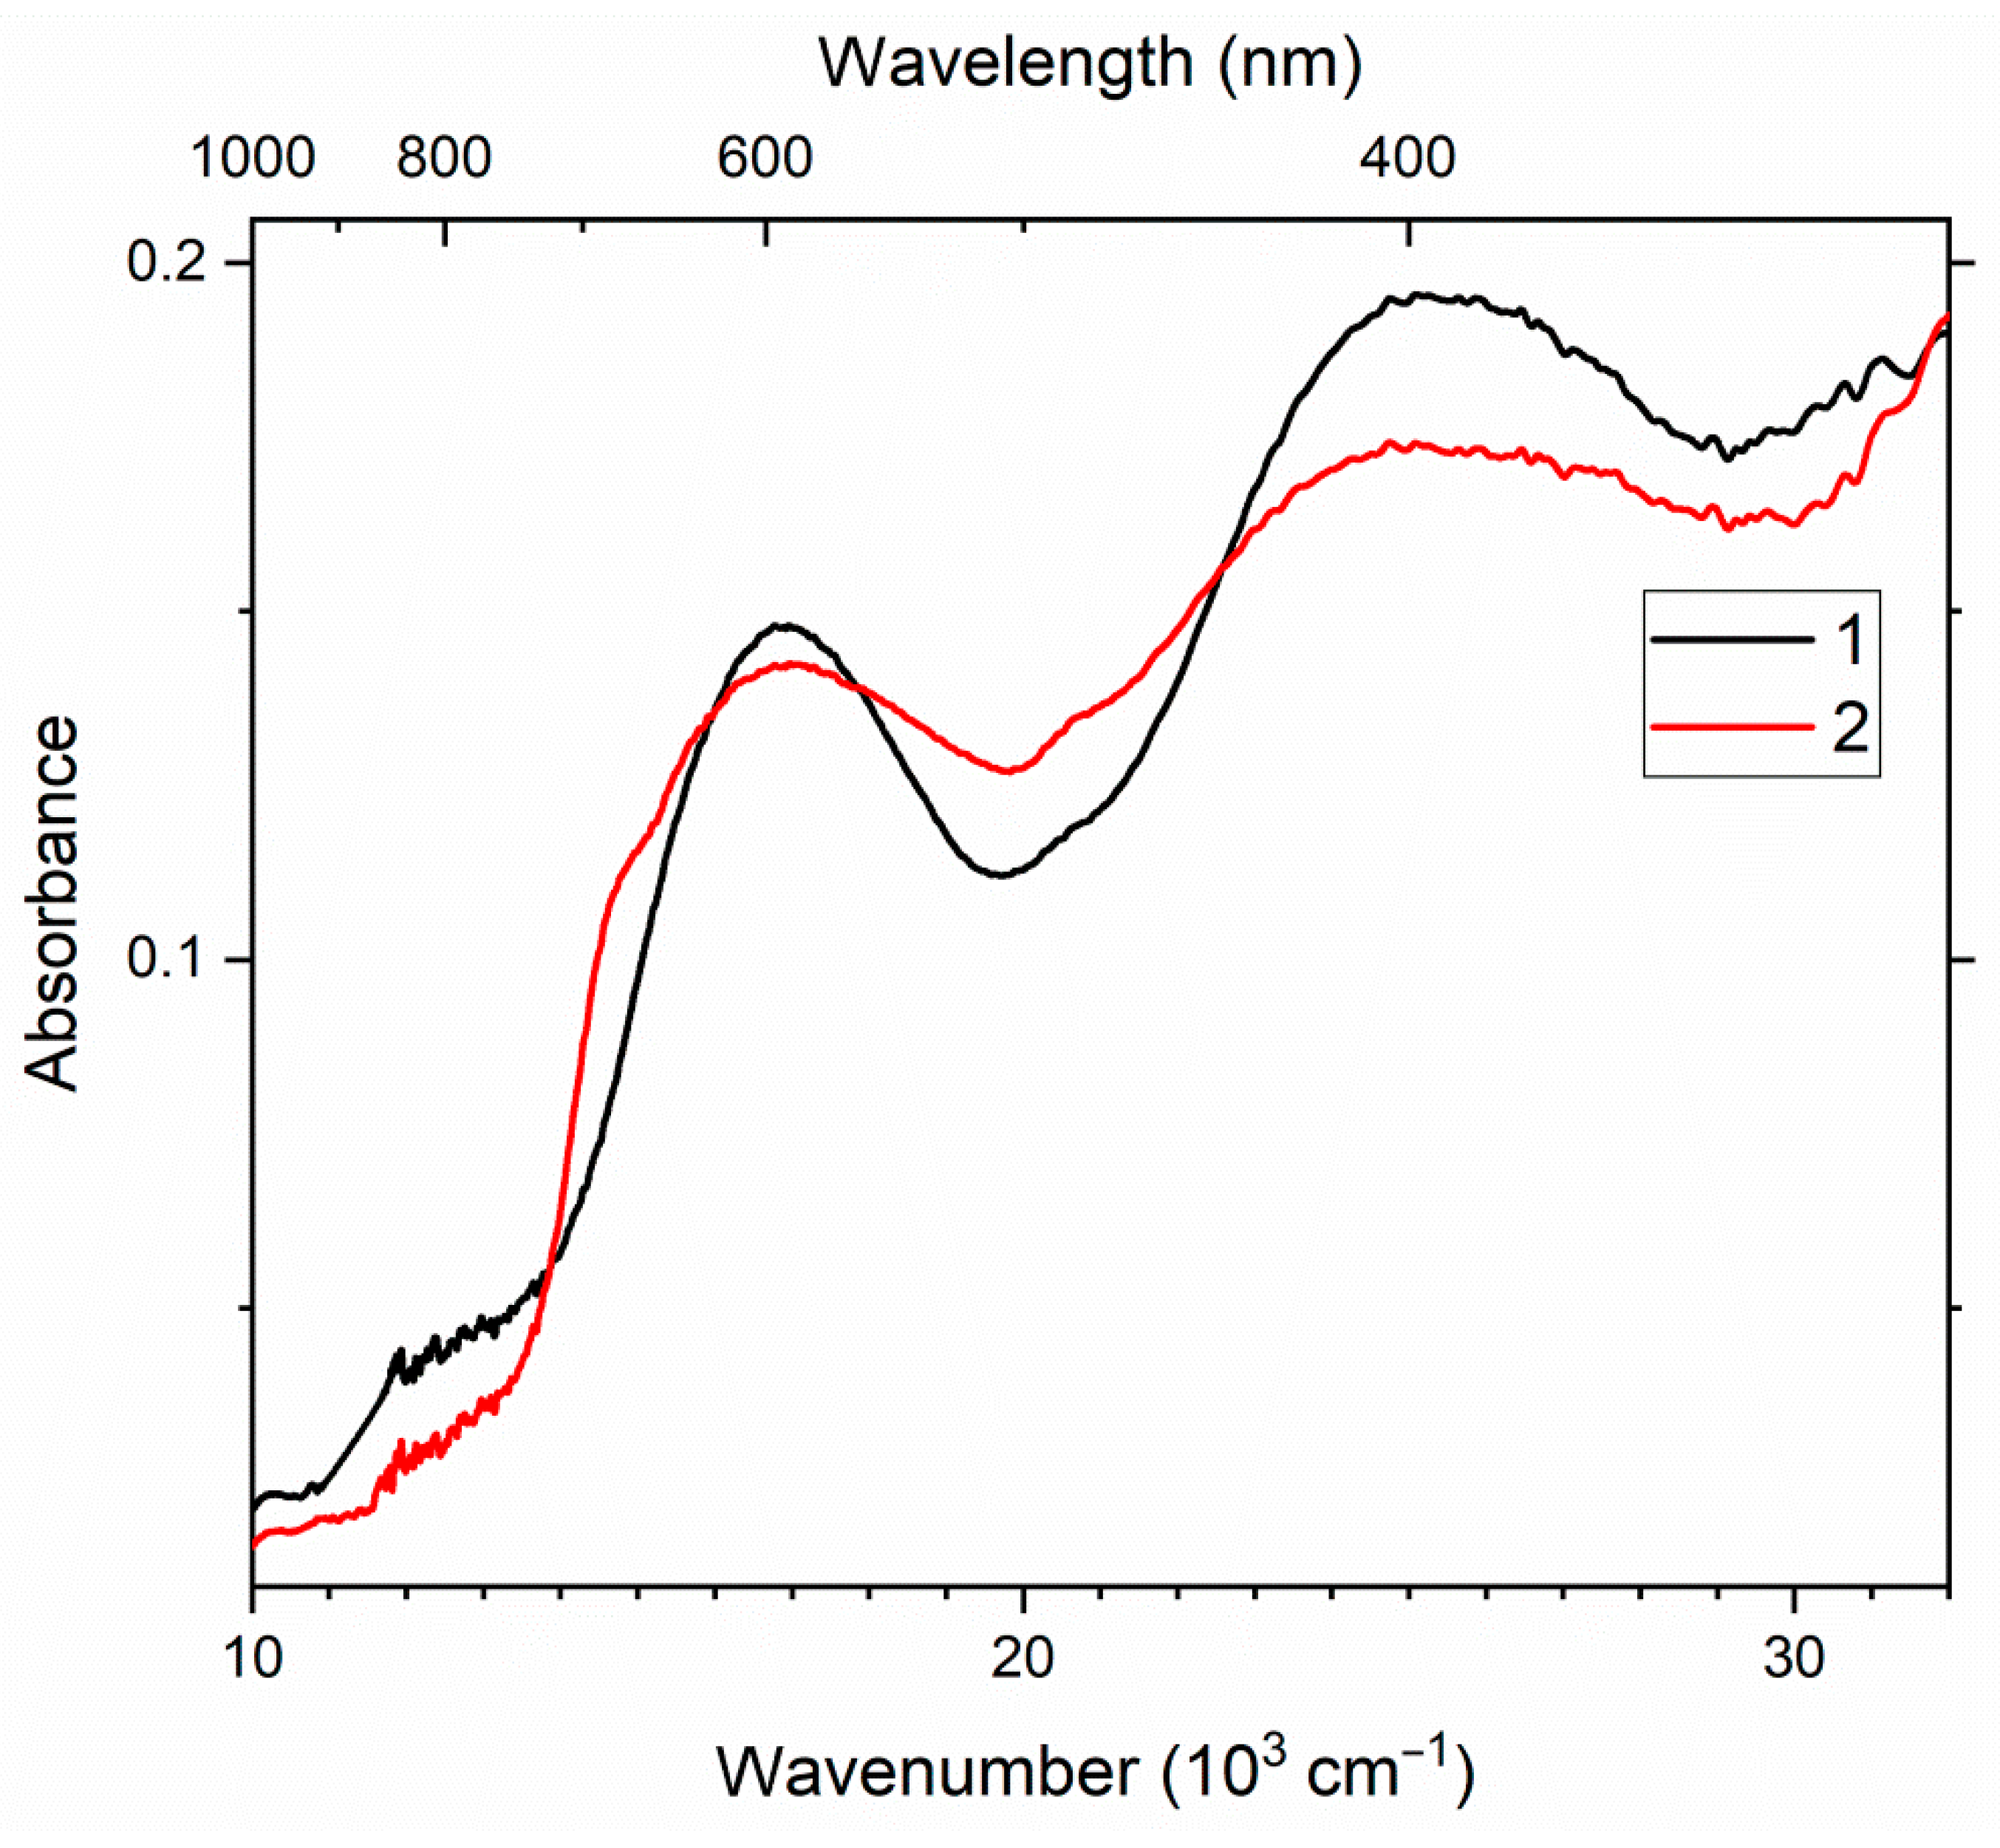
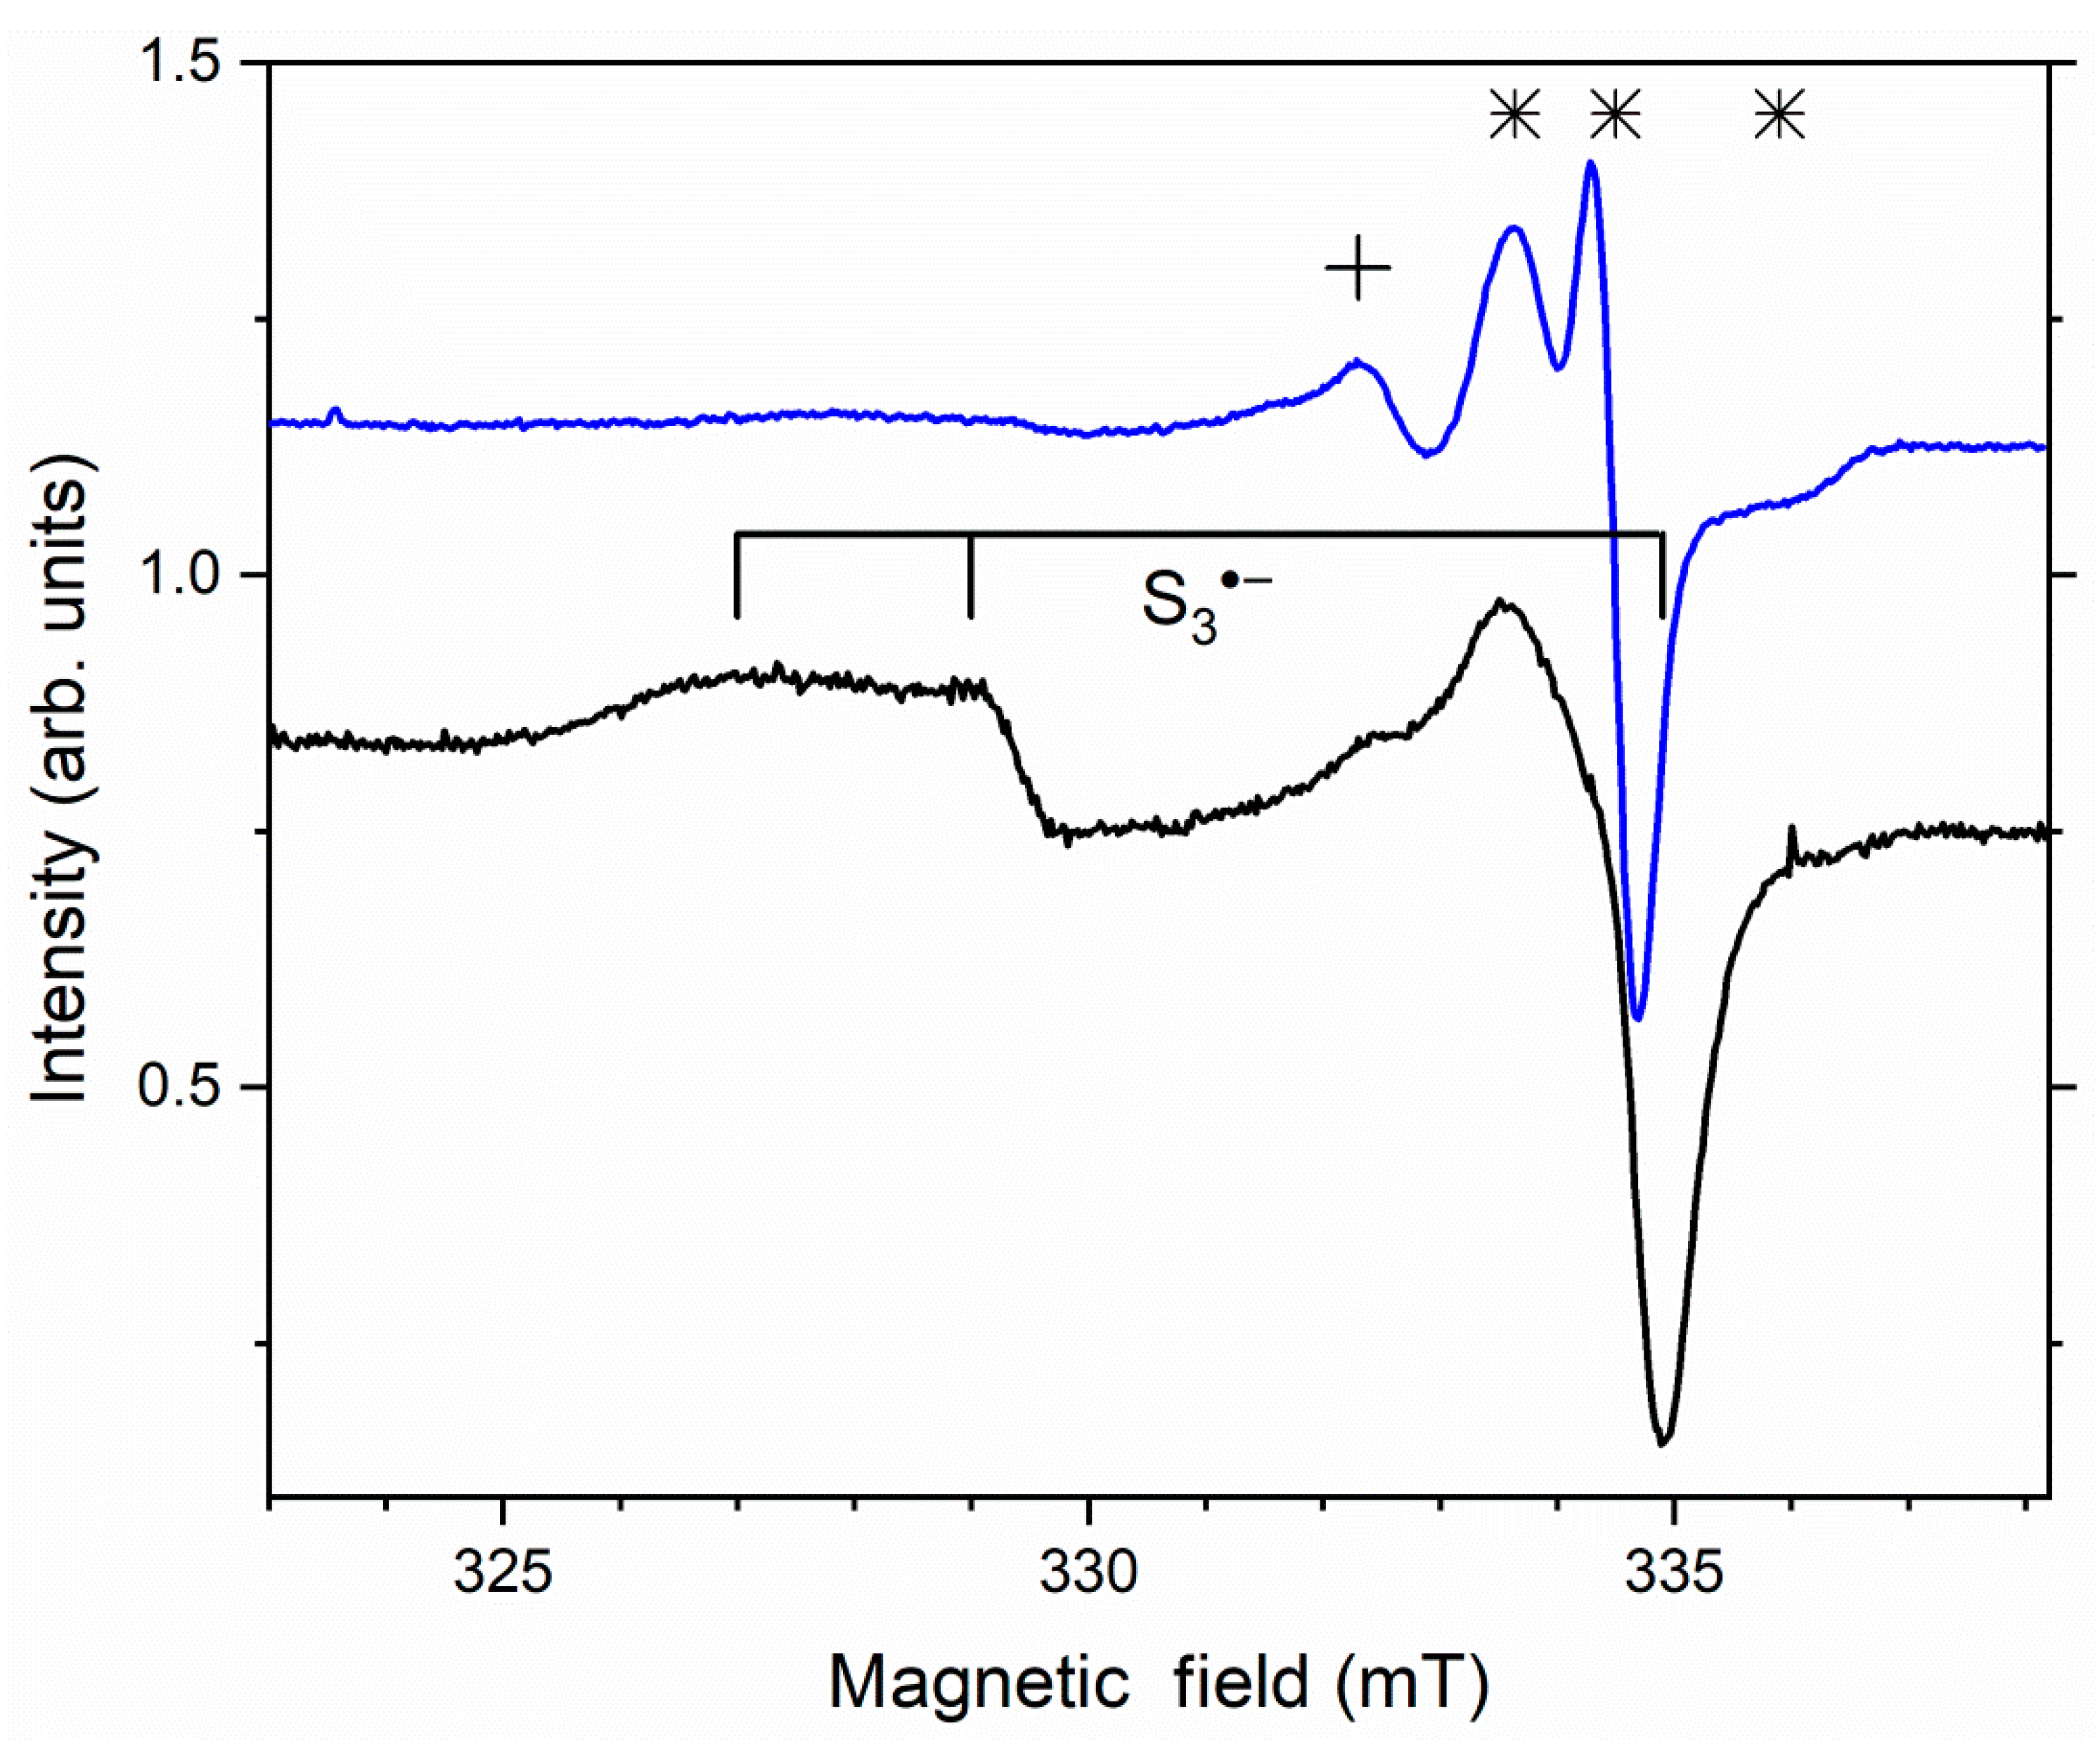
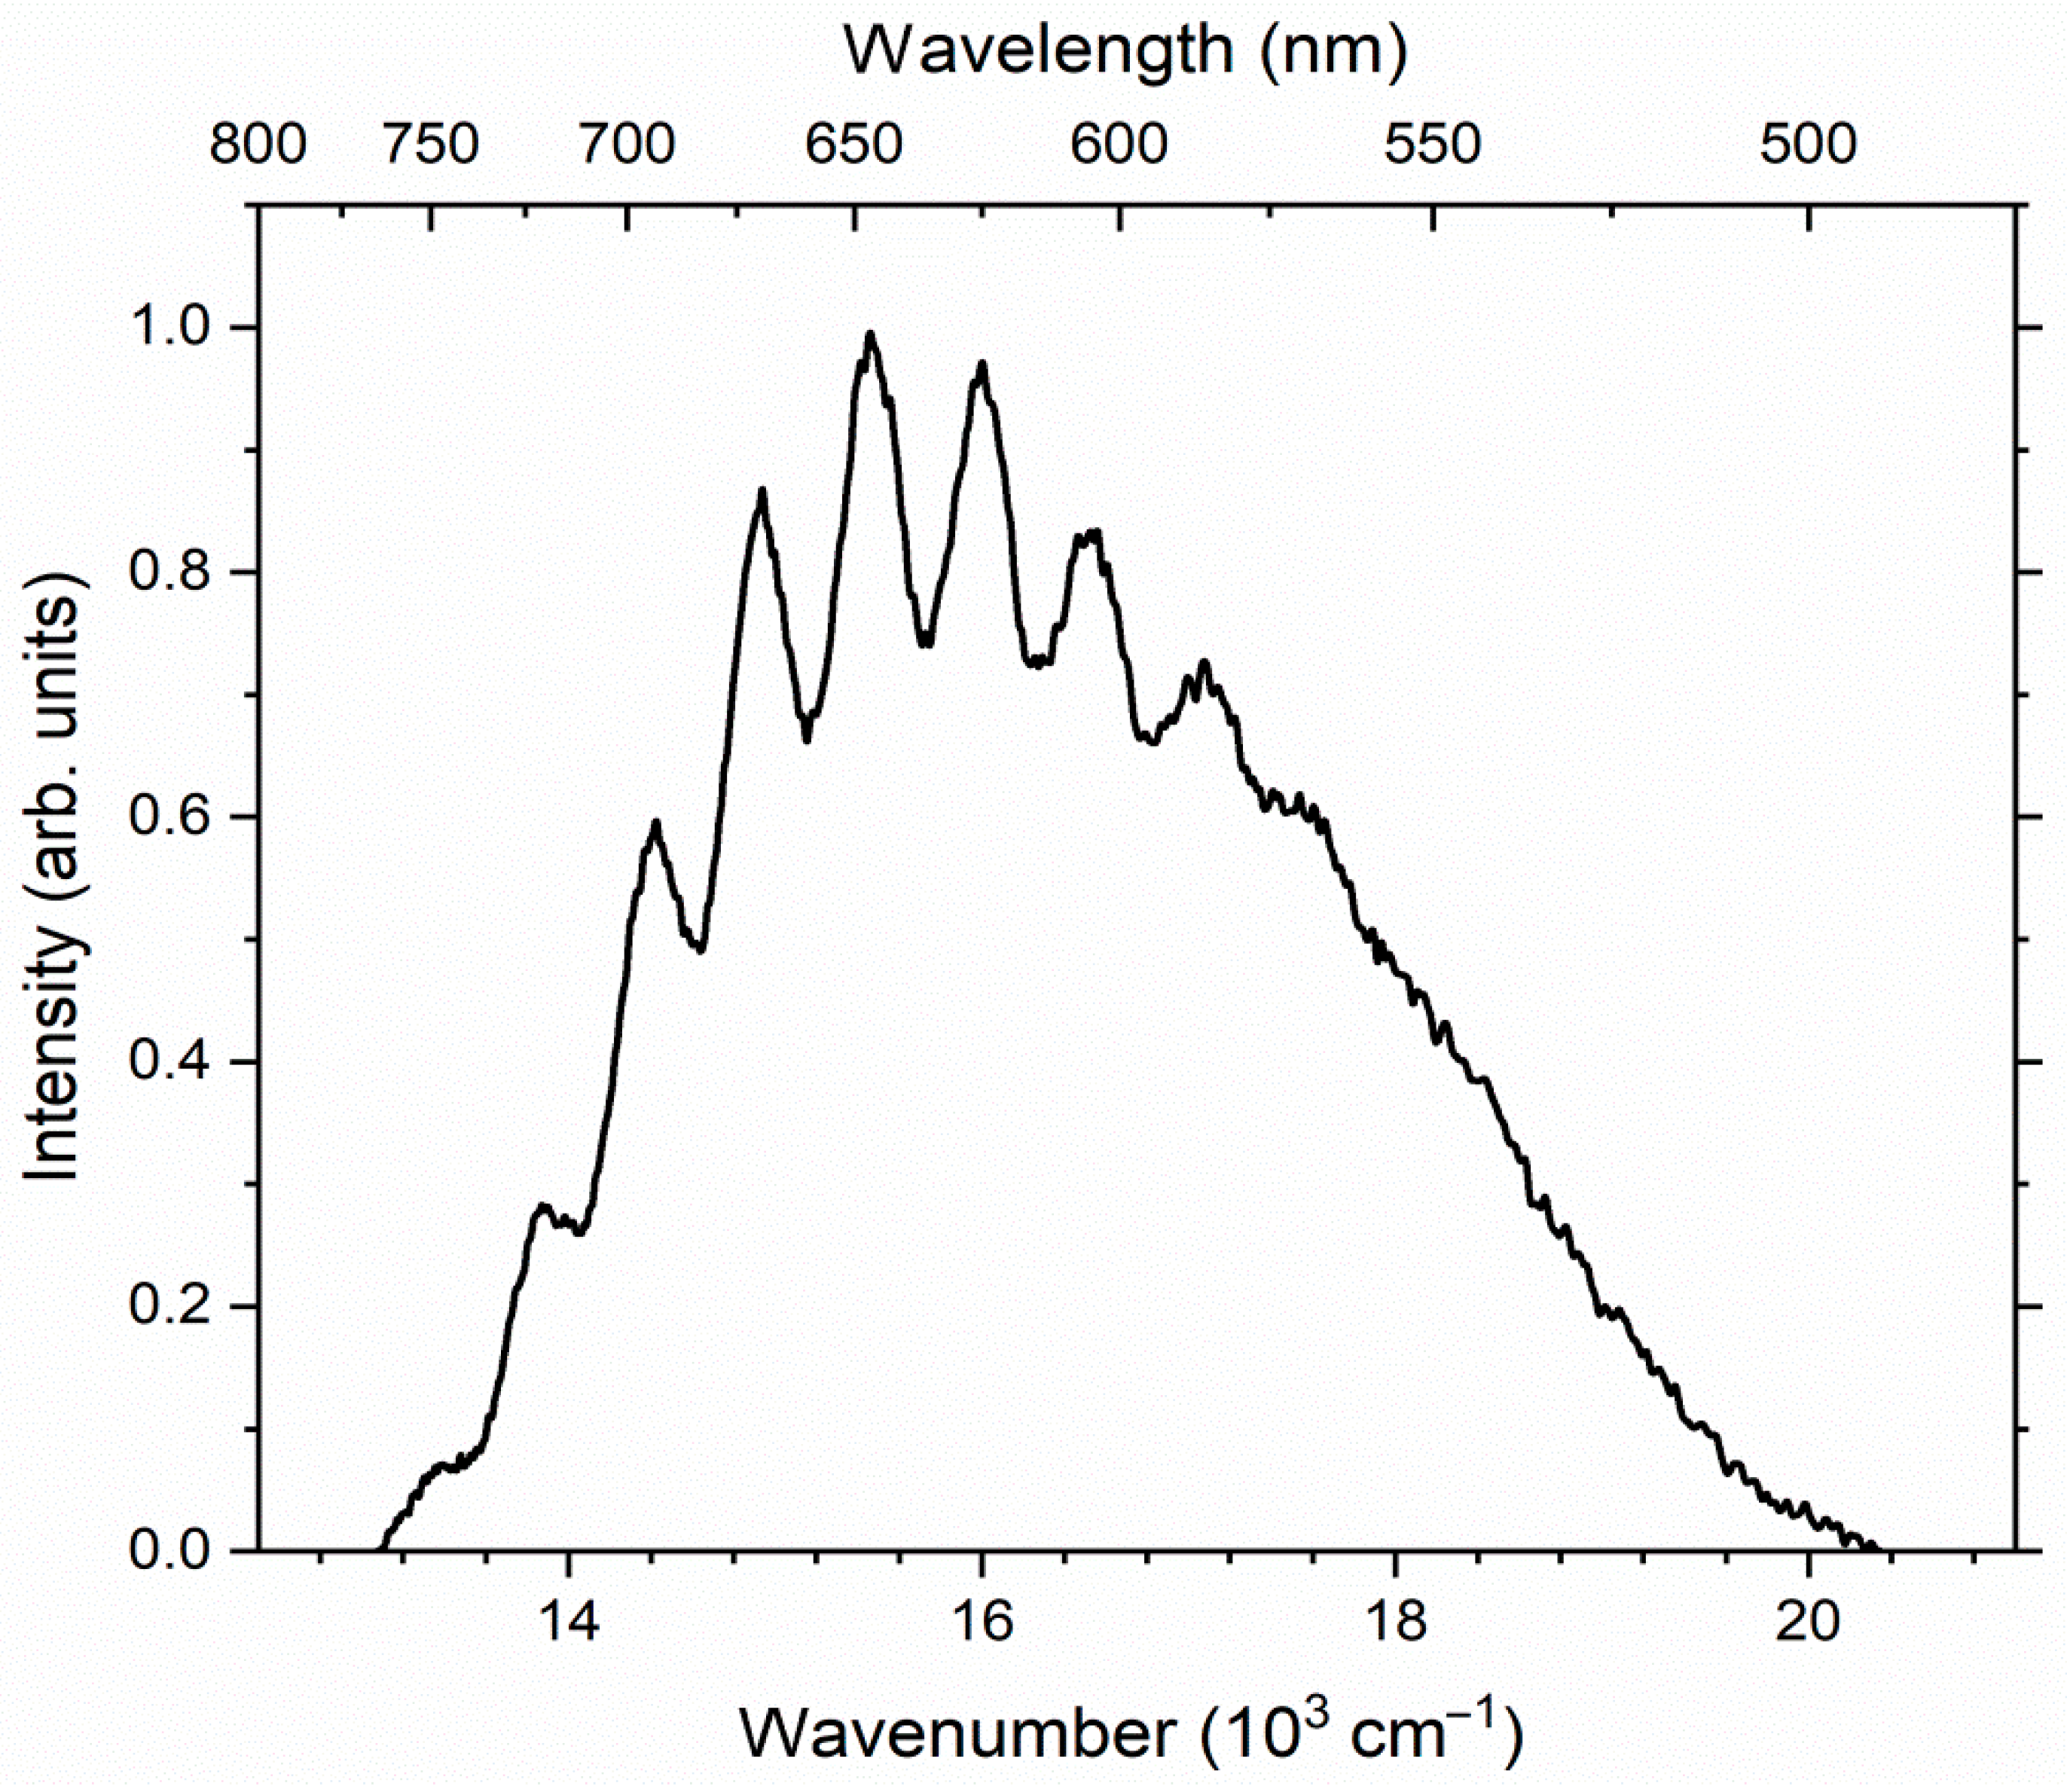
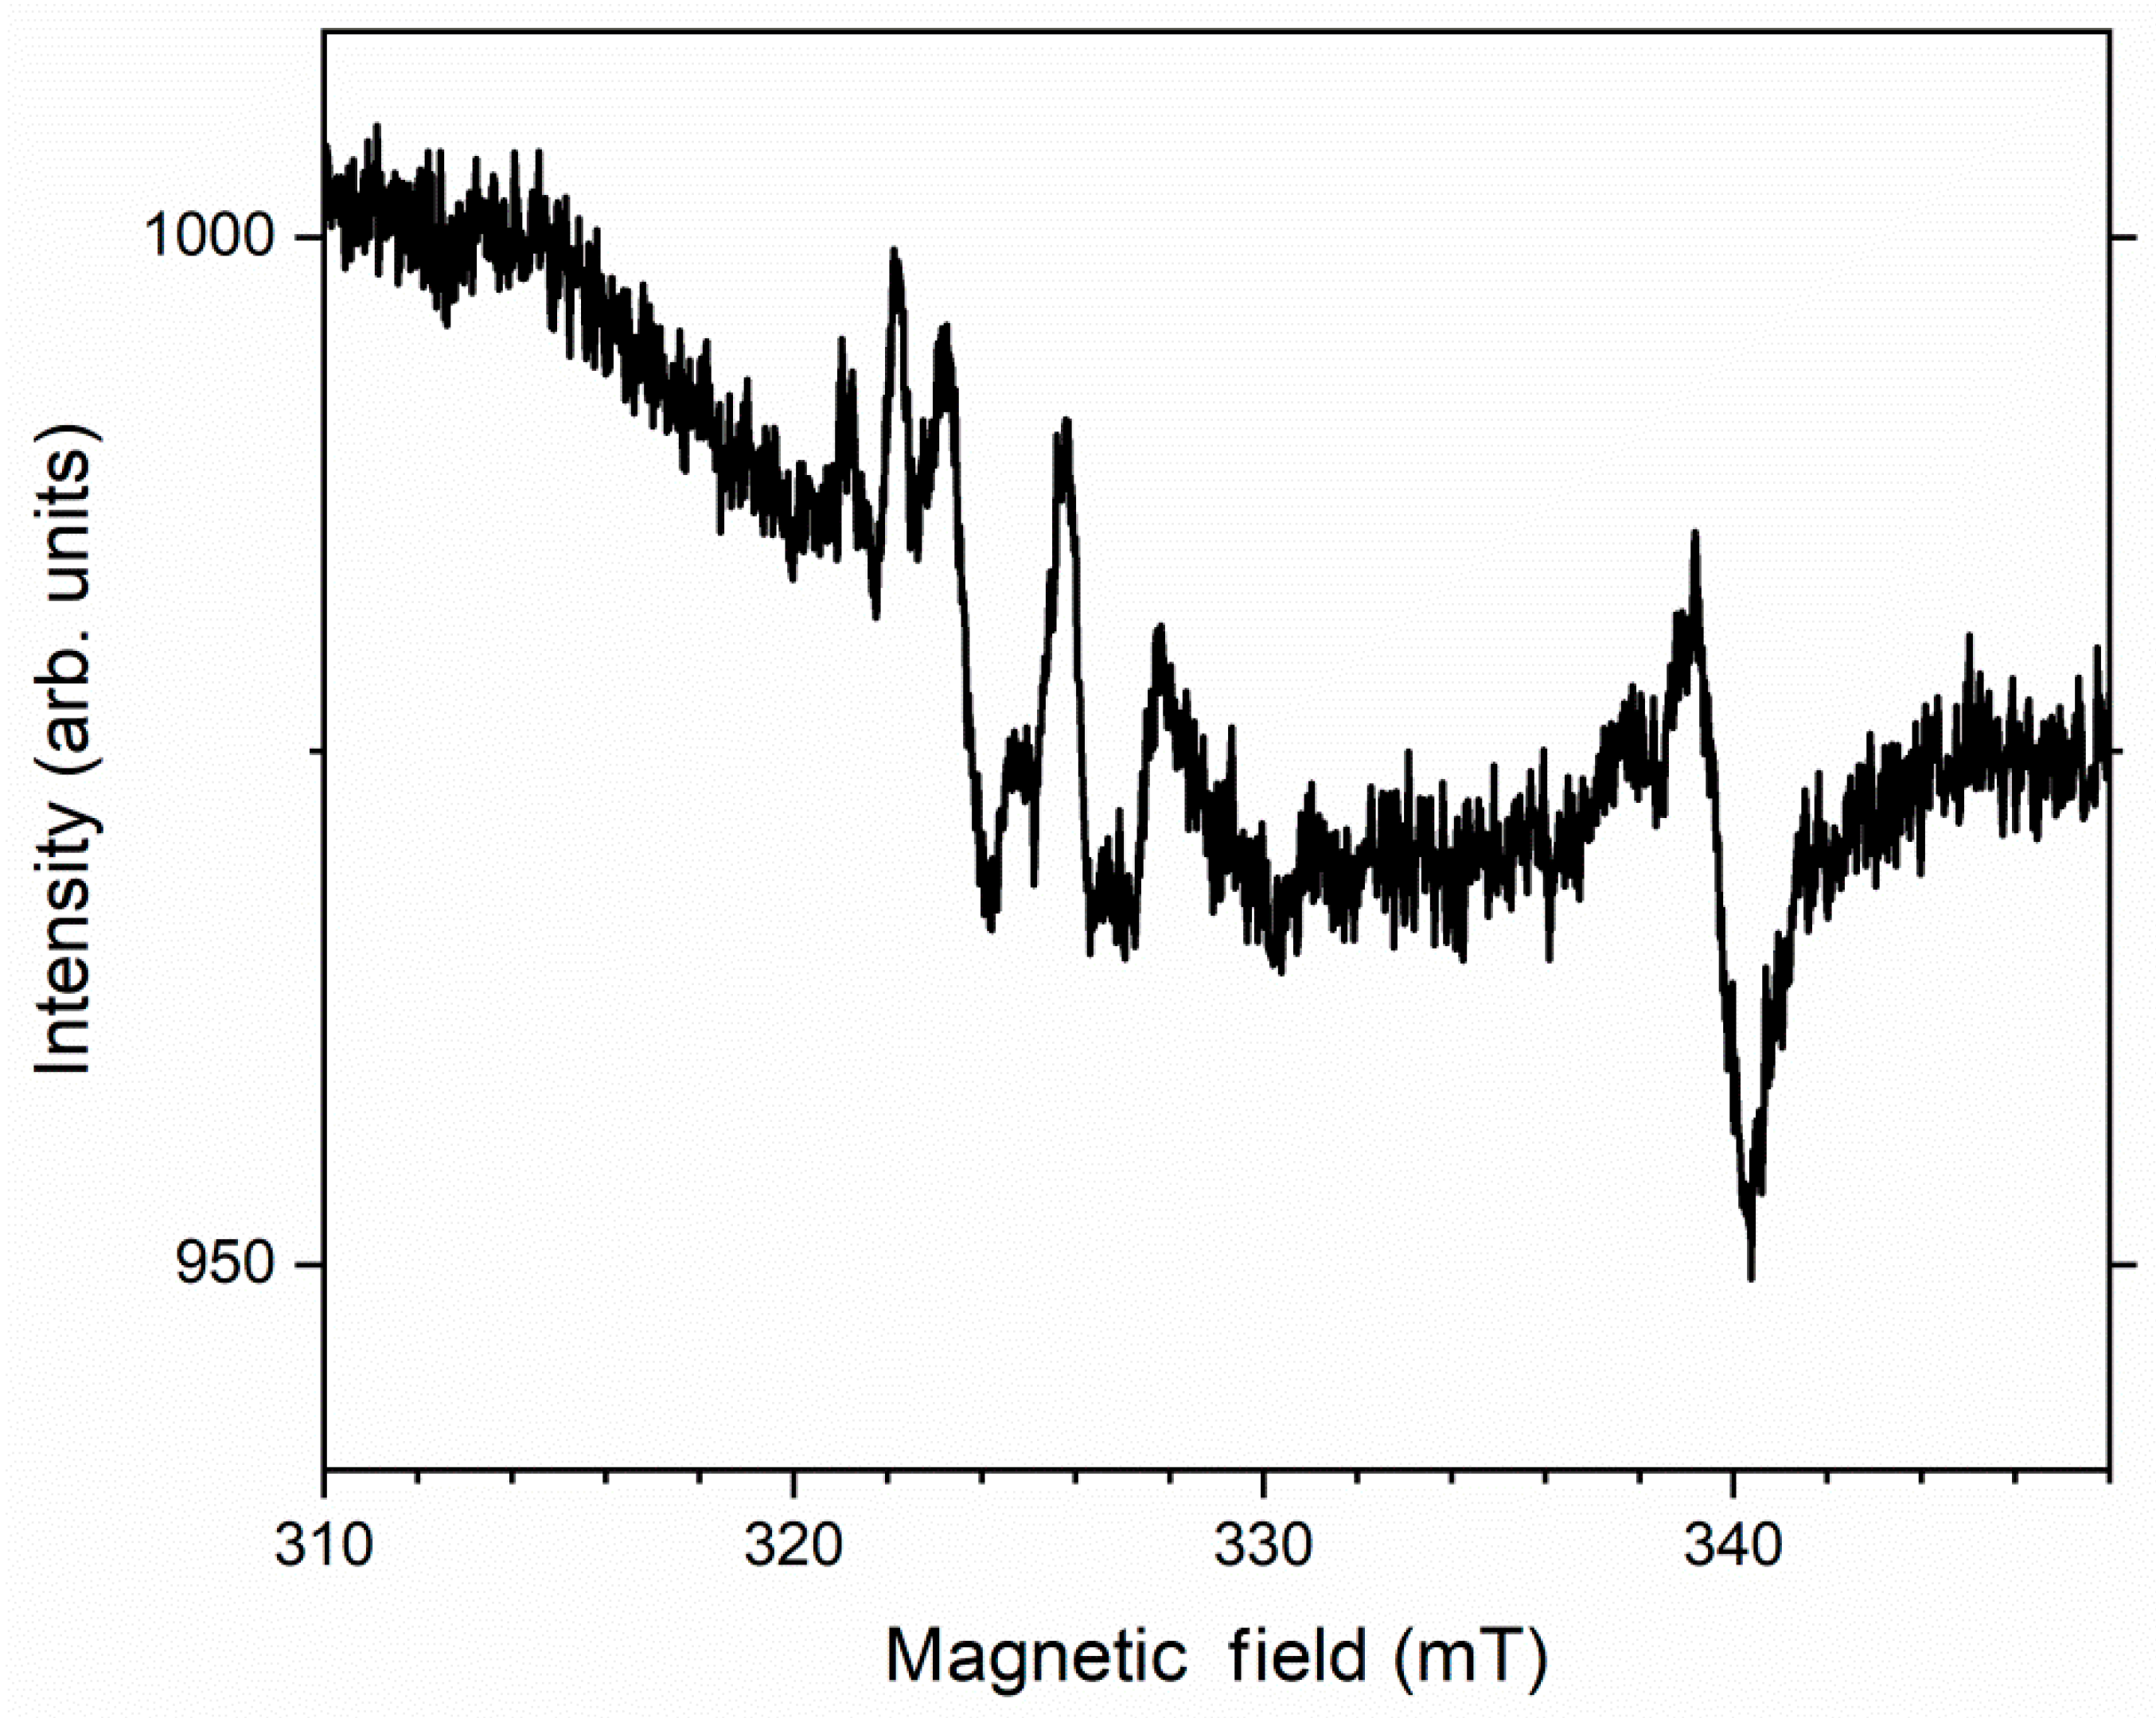
5.4. Color Centers in CRAs

Absorption and luminescence spectra in the visible range can be used for the determination of their color coordinates in the CIE1931 color space chromaticity diagram. Coordinates of a mineral coloration were calculated for daylight illuminant D with 4500 K temperature. These data are shown in Figure 20.

6. Conclusions

The approach based on the use of a combination of spectroscopic methods (IR spectroscopy, Raman spectroscopy, ESR, UV–Vis–near IR absorption spectroscopy, photoluminescence) applied in this work to CRAs is an effective tool for the identification of different extra-framework components in these minerals. Cancrinite-related minerals with frameworks of different topological types show different regularities of the isomorphism of extra-framework components.
Minerals with a two-layer, cancrinite-type framework show affinity for carbonate groups, which transform to CO3•− radical anions on irradiation with ultraviolet light. In cancrinite-type minerals, which crystallize under reductive conditions, neutral or acid oxalate groups may be the major extra-framework anions.
In this work, it is shown, for the first time, that replacing Na with H3O+ in the Na4·H2O cluster with an Na⋯O distance of 2.6 Å occurring in a sodalite cage results in the formation of the Zundel cation. This cation was also detected in kyanoxalite, where its formation was a result of the dissociation of acid oxalate groups and subsequent hydration of protons.
CRAs with the afghanite-type framework are characterized by a complex isomorphism involving different S-bearing groups (S2•−, S3•−, S4•−, SO42−, SO32− and HS). The blue and green colors of afghanite are related to S2•− (yellow chromophore) and S3•− (blue chromophore) occurring in this mineral in different proportions. Bands at 2566–2568 cm−1 in the Raman spectra of the afghanite samples from gem lazurite deposits correspond to the stretching vibrations of the HS anion.

Author Contributions

Conceptualization, N.V.C. and R.Y.S.; Methodology, N.V.C., R.Y.S., M.F.V., D.A.V. and N.V.Z.; Investigation, R.Y.S., M.F.V., D.A.V. and N.V.Z. and I.V.P.; Original Manuscript Draft Preparation, N.V.C. and R.Y.S.; Manuscript Review and Editing, R.Y.S., N.V.C., I.V.P. and D.A.V.; Figures, N.V.C. and R.Y.S. All authors have read and agreed to the published version of the manuscript.

Funding

All spectroscopic studies were supported by the Russian Science Foundation, grant no. 22-17-00006. Collecting of minerals, their identification and chemical analyses were carried out in accordance with the state task, state registration no. AAA-A19-119092390076-7.

Data Availability Statement

Not applicable to this work.

Conflicts of Interest

The authors declare no conflict of interest.

References

  1. Ballirano, P.; Maras, A.; Buseck, P.R. Crystal chemistry and IR spectroscopy of Cl− and SO4 bearing cancrinite-like minerals. Am. Miner. 1996, 81, 1003–1012. [Google Scholar] [CrossRef]
  2. Bonaccorsi, E.; Merlino, S. Modular microporous minerals: Cancrinite-davyne group and C-S-H phases. Rev. Miner. Geochem. 2005, 57, 241–290. [Google Scholar] [CrossRef]
  3. Merlino, S. Feldspathoids: Their average and real structures. In Feldspars Feldspathoids; NATO ASI Serie; Brown, W.L., Ed.; Springer: Dordrecht, The Netherlands, 1984; Volume 137, pp. 435–470. [Google Scholar] [CrossRef]
  4. Chukanov, N.V.; Aksenov, S.M.; Rastsvetaeva, R.K. Structural chemistry, IR spectroscopy, properties, and genesis of natural and synthetic microporous cancrinite- and sodalite-related materials: A review. Micropor. Mesopor. Mater. 2021, 323, 111098. [Google Scholar] [CrossRef]
  5. Chukanov, N.V.; Sapozhnikov, A.N.; Shendrik, R.Y.; Vigasina, M.F.; Steudel, R. Spectroscopic and crystal-chemical features of sodalite-group minerals from gem lazurite deposits. Minerals 2020, 10, 1042. [Google Scholar] [CrossRef]
  6. Sapozhnikov, A.N.; Tauson, V.L.; Lipko, S.V.; Shendrik, R.Y.; Levitskii, V.I.; Suvorova, L.F.; Chukanov, N.V.; Vigasina, M.F. On the crystal chemistry of sulfur-rich lazurite, ideally Na7Ca(Al6Si6O24)(SO4)(S3)·nH2O. Am. Miner. 2021, 106, 226–234. [Google Scholar] [CrossRef]
  7. Chukanov, N.V.; Zubkova, N.V.; Pekov, I.V.; Shendrik, R.Y.; Varlamov, D.A.; Vigasina, M.F.; Belakovskiy, D.I.; Britvin, S.N.; Yapaskurt, V.O.; Pushcharovsky, D.Y. Sapozhnikovite, Na8(Al6Si6O24)(HS)2, a new sodalite-group mineral from the Lovozero alkaline massif, Kola Peninsula. Miner. Mag. 2022, 86, 49–59. [Google Scholar] [CrossRef]
  8. Chukanov, N.V.; Vigasina, M.F.; Zubkova, N.V.; Pekov, I.V.; Schäfer, C.; Kasatkin, A.V.; Yapaskurt, V.O.; Pushcharovsky, D.Y. Extra-framework content in sodalite-group minerals: Complexity and new aspects of its study using infrared and Raman spectroscopy. Minerals 2020, 10, 363. [Google Scholar] [CrossRef] [Green Version]
  9. Chukanov, N.V.; Zubkova, N.V.; Varlamov, D.A.; Pekov, I.V.; Belakovskiy, D.I.; Britvin, S.N.; Van, V.K.; Ermolaeva, V.N.; Vozchikova, S.A.; Pushcharovsky, D.Y. Steudelite, (Na3□)[(K,Na)17Ca7]Ca4(Al24Si24O96)(SO3)6F6·4H2O, a new cancrinite-group mineral with afghanite-type framework topology. Phys. Chem. Miner. 2022, 49, 1. [Google Scholar] [CrossRef]
  10. Olysych, L.V. Structural and Genetic Mineralogy of the Cancrinite Group in Intrusive Alkaline Complexes. Ph.D. Thesis, Lomonosov Moscow State University, Moscow, Russia, 2010; 307p. (In Russian). [Google Scholar]
  11. Shendrik, R.; Kaneva, E.; Radomskaya, T.; Sharygin, I.; Marfin, A. Relationships between the structural, vibrational, and optical properties of microporous cancrinite. Crystals 2021, 11, 280. [Google Scholar] [CrossRef]
  12. Chukanov, N.V.; Pekov, I.V.; Olysych, L.V.; Massa, W.; Zadov, A.E.; Rastsvetaeva, R.K.; Vigasina, M.F. Kyanoxalite, a new cancrinite-group mineral species with extraframework oxalate anion from the Lovozero alkaline pluton, Kola peninsula. Geol. Ore Depos. 2010, 52, 778–790. [Google Scholar] [CrossRef]
  13. Chukanov, N.V.; Pekov, I.V.; Olysych, L.V.; Zubkova, N.V.; Vigasina, M.F. Crystal chemistry of cancrinite-group minerals with AB-type frameworks. II. IR spectroscopy and its crystal chemical implications: Review and new data. Can. Miner. 2011, 49, 1151–1164. [Google Scholar] [CrossRef]
  14. Chukanov, N.V.; Vigasina, M.F.; Rastsvetaeva, R.K.; Aksenov, S.M.; Mikhailova, J.A.; Pekov, I.V. The evidence of hydrated proton in eudialyte-group minerals based on Raman spectroscopy data. J. Raman Spectrosc. 2022, 1. published online. [Google Scholar] [CrossRef]
  15. Deganello, S.; Kampf, A.R.; Moore, P.B. The crystal structure of calcium oxalate trihydrate: Ca(H2O)3(C2O4). Am. Miner. 1981, 66, 859–865. [Google Scholar]
  16. Wójcik, M.J.; Szczeponek, K.; Boczar, M. Theoretical study of multidimensional proton tunnelling in benzoic acid dimer. Int. J. Molec. Sci. 2003, 4, 422–433. [Google Scholar] [CrossRef] [Green Version]
  17. Eckert, B.; Steudel, F. Molecular spectra of sulfur molecules and solid sulfur allotropes. Top. Curr. Chem. 2003, 231, 31–97. [Google Scholar] [CrossRef]
  18. Rejmak, P. Computational refinement of the puzzling red tetrasulfur chromophore in ultramarine pigments. Phys. Chem. Chem. Phys. 2020, 22, 22684–22698. [Google Scholar] [CrossRef]
  19. Steudel, R.; Jensen, D.; Göbel, P.; Hugo, P. Optical absorption spectra of the homocyclic sulfur molecules Sn (n = 6, 7, 8, 9, 10, 12, 15, 20) in solution. Ber. Bunsenges. Phys. Chem. 1988, 92, 118–122. [Google Scholar] [CrossRef]
  20. Hassan, I.; Grundy, H.D. The structure of nosean. Can. Miner. 1989, 27, 165–172. [Google Scholar]
  21. Steudel, R. Inorganic polysulfides Sn2− and radical anions Sn•−. In Elemental Sulfur und Sulfur-Rich Compounds II. Topics in Current Chemistry; Steudel, R., Ed.; Springer: Berlin/Heidelberg, Germany, 2003; Volume 231. [Google Scholar]
  22. Chukanov, N.V.; Rastsvetaeva, R.K.; Pekov, I.V.; Zadov, A.E. Alloriite, Na5K1.5Ca(Si6Al6O24)(SO4)(OH)0.5·H2O, a new mineral species of the cancrinite group. Geol. Ore Depos. 2007, 49, 752–757. [Google Scholar] [CrossRef]
  23. Chukanov, N.V. Infrared Spectra of Mineral Species: Extended Library; Springer: Berlin/Heidelberg, Germany, 2014; 1716p, ISBN 9400771274. [Google Scholar]
  24. Chukanov, N.V.; Chervonnyi, A.D. Infrared Spectroscopy of Minerals and Related Compounds; Springer: Berlin/Heidelberg, Germany, 2016; 1109p. [Google Scholar] [CrossRef]
  25. Chukanov, N.V.; Vigasina, M.F. Vibrational (Infrared and Raman) Spectra of Minerals and Related Compounds; Springer: Dordrecht, The Netherlands, 2020; 1376p. [Google Scholar] [CrossRef]
  26. Kaneva, E.; Shendrik, R. Radiation defects and intrinsic luminescence of cancrinite. J. Lumin. 2022, 243, 118628. [Google Scholar] [CrossRef]
  27. Kaneva, E.; Shendrik, R. Tinaksite and tokkoite: X-ray powder diffraction, optical, and vibrational properties. Crystals 2022, 12, 377. [Google Scholar] [CrossRef]
  28. Hoffmann, S.K.; Goslar, J.; Lijewski, S.; Olejniczak, I.; Jankowska, A.; Zeidler, S.; Koperska, N.; Kowalak, S. S3− radicals in ε-cages of cancrinite and zeolite L: Spectroscopic and magnetic resonance studies. Micropor. Mesopor. Mater. 2012, 151, 70–78. [Google Scholar] [CrossRef]
  29. Steudel, R. Ermittlung Von SS-Kernabständen Aus Schwingungsspektren (Determination of SS bonddistances from Vibrational spectra). Z. Naturforsch. 1975, 30, 281–282. (In German). Available online: https://www.degruyter.com/document/doi/10.1515/znb-1975-3-431/html (accessed on 28 April 2022). [CrossRef] [Green Version]
  30. Angelov, S.; Stoyanova, R.; Dafinova, R.; Kabasanov, K. Luminescence and EPR studies on strontium carbonate obtained by thermal decomposition of strontium oxalate. J. Phys. Chem. Solids 1986, 47, 409–412. [Google Scholar] [CrossRef]
  31. Premovic, P.I.; Adamic, K.J.; Herak, J.N. Electron spin resonance study of gamma.-irradiated single crystal of ammonium oxalate monohydrate. J. Phys. Chem. 1972, 76, 3274–3278. [Google Scholar] [CrossRef]
  32. Horváth, L.; Nöthig-Laslo, V.; Bilinski, H. The role of the aluminosilicate matrix in the gamma-irradiation energy transfer to the oxalate molecule. Int. J. Radiat. Appl. Instrum. Part C Radiat. Phys. Chem. 1991, 37.2, 325–329. [Google Scholar] [CrossRef]
  33. Smakula, A. Über Erregung und Entfärbung lichtelektrisch leitender Alkalihalogenide. Z. Phys. 1930, 59, 603–614. (In German) [Google Scholar] [CrossRef]
  34. Kowalak, S.; Jankowska, A.; Zeidler, S. Ultramarine analogs synthesized from cancrinite. Micropor. Mesopor. Mater. 2006, 93, 111–118. [Google Scholar] [CrossRef]
  35. Fabian, J.; Komiha, N.; Linguerri, R.; Rosmus, P. The absorption wavelengths of sulfur chromophors of ultramarines calculated by time-dependent density functional theory. J. Mol. Struct. Theochem. 2006, 801, 63–69. [Google Scholar] [CrossRef]
  36. Sidike, A.; Sawuti, A.; Wang, X.-M.; Zhu, H.-J.; Kobayashi, S.; Kusachi, I.; Yamasita, N. Fine structure in photoluminescence spectrum of center in sodalite. Phys. Chem. Miner. 2007, 34, 477–484. [Google Scholar] [CrossRef]
  37. Radomskaya, T.A.; Kaneva, E.V.; Shendrik, R.Y.; Suvorova, L.F.; Vladykin, N.V. Sulfur-bearing sodalite, hackmanite, in alkaline pegmatites of the Inagli massif (Aldan Shield): Crystal chemistry, photochromism, and luminescence. Geol. Ore Depos. 2021, 63, 696–704. [Google Scholar] [CrossRef]
  38. Ostroumov, M.; Fritsch, E.; Faulques, E.; Chauver, O. Etude spectrometrique de la lazurite du Pamir, Tajikistan. Can. Miner. 2002, 40, 885–893. (In French) [Google Scholar] [CrossRef] [Green Version]
  39. Schneider, J.; Dischler, B.; Räuber, A. Electron spin resonance of sulfur and selenium radicals in alkali halides. Phys. Status Solidi 1966, 13, 141–157. [Google Scholar] [CrossRef]
  40. Kowalak, S.; Jankowska, A.; Zeidler, S.; Wiećkowski, A.B. Sulfur radicals embedded in various cages of ultramarine analogs prepared from zeolites. J. Solid State Chem. 2007, 180, 1119–1124. [Google Scholar] [CrossRef]
  41. Raulin, K.; Gobeltz, N.; Vezin, H.; Touat, N.; Ledé, B.; Moissette, A. Identification of the EPR signal of S2− in green ultramarine pigments. Phys. Chem. Chem. Phys. 2011, 13, 9253–9259. [Google Scholar] [CrossRef]
  42. Sapozhnikov, A.N.; Bolotina, N.B.; Chukanov, N.V.; Kaneva, E.V.; Shendrik, R.Y.; Vigasina, M.F.; Ivanova, L.A. Slyudyankaite, IMA2021-062a. CNMNC Newsletter 65. Eur. J. Miner. 2022, 34, 143–148. [Google Scholar] [CrossRef]
Figure 1. Infrared spectra of (a) kyanoxalite from Alluaiv Mountain (Sample 5), (b) kyanoxalite from Flora Mountain (Sample 6), both Lovozero massif and (c) cancrinite from the Kovdor massif (Sample 1).
Minerals 12 00729 g001
Figure 2. Raman spectra of (a) cancrinite from Kovdor (ample 1), (b) CO32−-bearing vishnevite from Loch Borrolan (Sample 4), (c) kyanoxalite from Alluaiv (Sample 5) and (d) kyanoxalite from Flora (Sample 6).
Minerals 12 00729 g002
Figure 3. Diffuse transmission spectra of kyanoxalite (Sample 6) before irradiation (curve 1) and after irradiation (curve 2) with light at a wavelength of 240 nm.
Minerals 12 00729 g003
Figure 4. Photoluminescence spectrum of kyanoxalite (Sample 6) upon excitation at a wavelength of 405 nm, measured at a temperature of 77 K.
Minerals 12 00729 g004
Figure 5. ESR spectra of kyanoxalite (Sample 6) before irradiation (upper curve) and after irradiation with light at a wavelength of 240 nm (lower curve). The signals from the centers of the first, the second and the third type are shown with vertical lines, asterisks and crosses, respectively.
Minerals 12 00729 g005
Figure 6. Infrared spectra of (a) nosean from the Eifel region (Sample 7) and (b) nosean from South Urals (Sample 8).
Minerals 12 00729 g006
Figure 7. Raman spectra of the nosean Samples 7 (a) and 8 (b).
Minerals 12 00729 g007
Figure 8. Photoluminescence spectrum of nosean (Sample 7), measured upon excitation with a 405 nm laser at a temperature of 77 K.
Minerals 12 00729 g008
Figure 9. ESR spectrum of nosean (Sample 7) measured at 77 K.
Minerals 12 00729 g009
Figure 10. Diffuse absorption spectrum of nosean (Sample 7) measured at room temperature.
Minerals 12 00729 g010
Figure 11. Infrared spectra of the afghanite Samples 10 (a), 9 (b) and 11 (c).
Minerals 12 00729 g011
Figure 12. Raman spectra of the afghanite Samples 10 (a), 9 (b) and 11 (c).
Minerals 12 00729 g012
Figure 13. UV–Vis–near IR absorption spectra of afghanite Samples 9 (curve 1) and 10 (curve 2).
Minerals 12 00729 g013
Figure 14. ESR spectra of afghanites from Sar-e Sang, Sample 9 (a), and Ladgvardara, Sample 10 (b), measured at 77 K.
Minerals 12 00729 g014
Figure 15. Photoluminescence spectra of afghanite samples from Sar-e Sang (Sample 9, curve 1) and Ladgvardara (Sample 10, curve 2), measured upon excitation with a 405 nm laser at a temperature of 77 K.
Minerals 12 00729 g015
Figure 16. Excitation spectrum of afghanite (Sample 9) luminescence monitored at 16,600 cm−1 at 77 K.
Minerals 12 00729 g016
Figure 17. Infrared spectra of (a) steudelite, Sample 12, and (b) alloriite, Sample 13.
Minerals 12 00729 g017
Figure 18. Infrared spectra of (a) franzinite, Sample 14, and (b) marinellite, Sample 15.
Minerals 12 00729 g018
Figure 19. Raman spectra of (a) franzinite, Sample 14, and (b) marinellite, Sample 15.
Minerals 12 00729 g019
Figure 20. Color space chromaticity diagram of the studied samples coloration: (1) irradiated cancrinite, (2) kyanoxalite, (3) irradiated kyanoxalite, (4) afghanite from Sar-e Sang, (5) afghanite from Ladgvardara. Color coordinates of lazurite (7) [6] and slyudyankaite (8) [42] are shown for comparison. Chromaticity diagram of S2•− radical anion luminescence are given for: 2l—kyanoxalite; 4l—afghanite from Sar-e Sang; 5l—afghanite from Ladgvardara; 6l—nosean; 8l—slyudyankaite.
Minerals 12 00729 g020
Table 1. Chemical composition of CRAs (wt.%) obtained in this work.
Sample No.238910111415
MineralCancriniteCancriniteNoseanAfghaniteAfghaniteAfghaniteFranziniteMarinellite
ColorYellowPinkish-grayPale violet-bluePale greenPale blueColorlessColorlessViolet
Na2O20.3519.7019.7114.4912.8811.5512.4313.85
K2O00.060.251.341.283.435.518.30
CaO4.806.792.8611.2312.9012.789.615.47
Al2O328.2529.9027.5326.2525.7626.0626.6327.73
Fe2O30.3600.730.440.260.4000
SiO237.5635.6035.1931.5130.4631.6930.9932.45
CO2 a001.3200.21000
SO3 b00.3010.2710.9411.659.7413.469.62
Cl00.030.104.164.665.010.481.06
–O=Cl00−0.04−0.94−1.05−1.13−0.11−0.24
Total91.3292.3897.9299.4299.0199.5398.9998.25
a CO2 contents corresponding to CO2 molecules were determined from the IR spectra using a procedure described in [8]. b All sulfur is given as SO3.
Table 2. Assignment of Raman bands of sodalite-group minerals.
Raman Shift (cm−1)Assignment
210–290 wCombination of low-frequency lattice modes
219trans-S4 bending mode
254–265S3•− bending mode (ν2)
260Bending vibrations of the [ClNa4] cluster
283–294 wCombination of low–frequency lattice modes involving Na+ cations and S6 bending mode
298S4•− bending vibrations
327–332 wcis-S4 mixed ν4 mode (combined symmetric bending + stretching vibrations)
380cis-S4 mixed ν3 mode
417Bending vibrations of the aluminosilicate framework
436–447SO42− [the E2) mode] and/or δ[O–Si(Al)–O] bending vibrations
459–464Stretching vibrations of the [ClNa4] and [(HS)Na4] clusters
477S6 stretching mode and/or mixed ν4 mode of trans–S4
485AlF6 stretching vibrations
503Bending vibrations of four-membered aluminosilicate rings belonging to the framework
543–550 sS3•− symmetric stretching (ν1) and/or AlF6 stretching mode
578–585 shS3•− antisymmetric stretching (ν3), possibly, overlapping with the stretching band of S2•−
604–607S2•− stretching mode
594–605Stretching vibrations of the [(S2−)Na4] cluster
615–673Possibly, HF translational modes
611Possibly, overtone of vibrations involving Na+ cations
613–625SO42− bending vibrations [F24) mode]
645cis-S4 symmetric stretching mode
649–652gauche-S4 symmetric stretching vibrations [A11) mode]
667–684 wtrans-S4 symmetric stretching ν3 mode
732Mixed vibrations of the aluminosilicate framework
802–814S3•− combination mode (ν1 + ν2)
975–990SO42− symmetric stretching vibrations [A11) mode]
970–1071 wStretching vibrations of the aluminosilicate framework
1058CO32− symmetric stretching vibrations
1074HF libration?
1084–1098S3•− overtone (2′ν1)
1135–1152 wSO42− asymmetric stretching vibrations [F23) mode], possibly, overlapping with S2•− overtone (2 × ν1)
1160–1166 wPossibly, S2•− overtone (2 × ν1)
1271–1279 wCO2 Fermi resonance
1335Overtone of the cis-S4 antisymmetric stretching mode (2 × ν3)
1340Symmetric C–O stretching vibrations of CO2 molecules involved in strong dipole–dipole interactions with H2O molecules
1349–1350H+ (translation of isolated proton)
1351–1363S3•− combination mode (2ν1 + ν2)
1381CO2 Fermi resonance
1442 wCO3 asymmetric stretching mode
1632–1642S3•− overtone (3 × ν1)
1894–1908 wS3•− combination mode (3 × ν2 + ν1)
2168–2188S3•− overtone (4 × ν1)
2420–2450 wS3•− combination mode (4 × ν2 + ν1)
2553–2581HS stretching mode
2691cis-S4 antisymmetric stretching (4 × ν3)
2712–2730 wS3•− overtone (5 × ν1)
2904CH4 stretching vibrations
2975 wS3•− combination mode (5 × ν1 + ν2)
3242–3257 wS3•− overtone (6 × ν1)
3243H3O+ stretching mode
3495–3670H2O stretching vibrations
3796S3•− overtone (7 × ν1)
Note: w—weak band, sh—shoulder.
Publisher’s Note: MDPI stays neutral with regard to jurisdictional claims in published maps and institutional affiliations.

