Article

Sampling Broken Ore Residues in Underground Gold Workings: Implications for Reconciliation and Lost Revenue

by
Simon C. Dominy
1,2,*,
Hylke J. Glass
1 and
Richard C.A. Minnitt
3
1
Camborne School of Mines, University of Exeter, Penryn, Cornwall TR10 9FE, UK
2
Western Australian School of Mines, Curtin University, Bentley, WA 6102, Australia
3
School of Mining Engineering, University of the Witwatersrand, Johannesburg 2050, South Africa
*
Author to whom correspondence should be addressed.
Minerals 2022, 12(6), 667; https://doi.org/10.3390/min12060667
Submission received: 25 April 2022 / Revised: 23 May 2022 / Accepted: 23 May 2022 / Published: 25 May 2022
(This article belongs to the Special Issue Sampling Across the Mine Value Chain)

Abstract

:
The underground mining process typically results in some of the metal inventory remaining as a broken residue within mine workings. Up to 0.5 m of broken ore may be left on the floors of development drives and in stopes. It is possible that this broken ore contains 5% or more of the original metal in the ore reserve, which will have a material effect on reconciliation and project economics. Broken ore remaining in the mine may have been subject to enhanced milling during the mucking process, yielding enhanced liberation of the economic minerals of interest. Given that the material in question is already broken, the sampling strategy will be based on digging trenches or pits into the mine floor to extract a pre-determined mass of material for assay. The sampling of stope floors will most likely be based on grab sampling. Application of the theory of sampling is a key aspect of ensuring that evaluation is effective. Gy’s equation for the fundamental sampling error can be used to determine an optimum sample mass, and to inform subsequent steps in preparation for assaying at given confidence limits and precision. This paper presents a discussion and case study.

1. Introduction

1.1. Sampling

The importance of sampling throughout the mine value chain, from exploration through to evaluation and production, has been stated by many authors [1,2,3,4,5]. The sampling value chain includes collection, preparation, and assaying or testing, and forms the basis for mineral resource and ore/mineral reserve estimates [2,3].
Sampling protocols for in-situ and broken rock containing gold should be designed to suit the style of mineralisation and geometry of accumulation, with a priori requirement for characterisation [6,7]. Sample collection, preparation, and assaying should aim to achieve an acceptable estimation variance, as expressed in a low nugget effect. When the mineralisation is heterogeneous on a local scale, a large sample size is typically required, and the effectiveness of the sampling protocol merits attention. Sampling protocols can be optimised using the fundamental sampling error (FSE) equation, where the determination of the gold liberation diameter, which is linked to the size of gold particles present, is critical [1,3,4,5,7,8].

1.2. Reconciliation

Reconciliation can be defined as “the act of making compatible or consistent”. In a mining context, this equates to the comparison of a prediction (e.g., resource model, reserve model, grade control model, or mine plan information) with reported production from the processing plant [9].
Reconciliation encompasses data integration across geology, mining engineering, operations, and metallurgy to deliver benefits throughout the mining value chain. The basic aim of reconciliation is to measure performance of the operation against targets, confirm grade and tonnage estimation accuracy, ensure evaluation of mineral assets is accurate, and to provide results of key performance indicators.
Numerous factors can contribute to poor reconciliation, where the actual does not match predicted, often in a negative fashion. Key factors may include data entry errors, high mining dilution, incorrect truck loading and movement tracking, poor equipment calibration (e.g., weightometers), sampling and assay problems, stope/bench or stockpile survey errors, poor stockpile management, ore loss/gain, resource/reserve estimation errors, and poor plant metal accounting.
One of the critical reconciliation factors is ore loss/gain. Loss may relate to ore being left in-situ due to an unplanned need (e.g., pillars placed during mining in response to poor ground conditions or irrecoverable wedges of ore left in-situ due to faulted ground not recognised during mine planning) or incorrect positioning of workings or hold ups in stopes and/or ore passes. Additionally, ore can be lost as broken residues within stopes and/or on drive floors [10,11,12,13]. Ore can also be lost during blasting, where liberated or fine material can be thrown away from the extraction area. This is also relevant to open pit operations. This type of ore loss is rarely considered at either the feasibility or operational stage of a project, despite its potentially material impact.
Additionally, some apparent ore loss is likely to relate to sampling error, particularly where face samples (e.g., chip or channel samples) are used to inform a resource/grade control model. Face samples often produce positively biased grades due to delineation and/or extraction issues [14,15]. Grab sampling used for grade control also generally leads to positively biased grades [16].
Any type of ore loss that is not factored into the reserve during a pre-feasibility or feasibility study, should be counted as a revenue loss. The quantity and quality (grade) of broken ore residues receives little to no attention by evaluators during feasibility studies or production. Consideration of gold loss within workings is important for mine to mill reconciliation [13].

1.3. What Are Broken Ore Residues?

The liberation of ore-bearing minerals (e.g., native gold and metal-bearing sulphides) during mining is common (Figure 1). This is likely to be particularly prevalent in coarse-gold operations, but can also have an effect in sulphide-rich systems (e.g., gold in sulphides or other metal sulphides). This liberated metal-rich material can be lost on stope walls and floors, development floors, trucks and along truck routes, and on surface and underground stockpile floors (Figure 2).
Metal-rich material is liberated across the mining process during blasthole drilling, the blasting process, and mucking. During blasthole drilling for either development or stoping, fine, mineralised material is produced that accumulates on the floor (Figure 3). During blasting, the rock is fractured, liberating material from a fine size (<<1 mm) to large blocks (20–40 cm). In many cases, relatively fine material, e.g., the −1 cm fraction, represents 30% or more of the total. The mucking process itself can enhance the “milling” of ore through movement, which yields enhanced liberation of gold and gold-bearing minerals. Such fine material can be lost at any stage from the face to the mill, with the greater proportion being left on drive and/or stope floors.
The dominant source of residues relates to ore drives, which can reach a width of up to 6 m, with a floor residue depth up to 0.5 m (Figure 4). Drainage gullies along the margins of drives also provide a key area for gold-bearing residue (mud) accumulation. The accumulation of broken residues of drives can be around 200 kg/m2 to 1200 t/m2, depending on residue depth. For stopes, this is likely to be in the range of <5 kg/m2 to 50 kg/m2. Residue in-situ density can vary from 1.7 t/m3 to 2.1 t/m3 for less compact residue, and 2.2 t/m3 to 2.4 t/m3 for compacted residue.
High-angle (>50°) stopes empty effectively via gravity, with any loss principally focused on the ore drive below. However, when stopes have an angle of less than 50°, the likelihood of material collecting on the stope footwall is high (Figure 5). Even the use of scraper winches will not necessarily remove all material from the stope, and may sometimes serve to move it around and promote segregation. Coverage is usually variable, with fine (<5 cm) material typically collecting in cracks and depressions. Scraper cleaning can be inefficient on irregular stope floors. In stopes >50°, residues may remain on the tops of pillars.
In drill and blast underground mining, especially in high-grade narrow vein operations, potentially economic quantities of broken ore residues can be left behind following mucking of ore drives and stopes. The JORC Code 2012 and PERC Standard 2021 refer to these residues as “mineralised fill” [17,18]. The CIM Standard 2014 makes no specific mention of residues or fill [19]. Residues may carry significant economic value and, if not collected before mine abandonment or backfilling, will be lost permanently [10,20].
As with any mining programme, the potential value of broken residues needs to be evaluated and costed prior to a recovery programme. At the project feasibility stage, it may be possible to make an estimate of the likely residues that could occur during mining via granulometric and assay studies. It is most likely, however, that evaluation will need to be undertaken during mining. Safety matters are paramount during any evaluation underground.
In some cases, the loss of gold to residues can be >5% and up to 20% or more of the total gold inventory (Table 1). Metal loss in stopes and development is well-recognised, and has led to the practice of sweeping and vamping, using both manual and vacuum recovery [11,12,13,21]. Sweeping refers to the cleaning of stopes and vamping the cleaning of drives and gullies.

1.4. Broken Ore Residues—A South African Perspective

The recovery of fine gold-bearing material (“lost gold”) from the floors of drives or stopes is a routine process conducted in tandem with stoping operations in many Witwatersrand mines. Sweeping used to be carried out by means of wire brushes and shovelling, but today there are a range of high-powered vacuum cleaners with appropriate filters to recover the material [21]. The use of high-pressure water jets to loosen and move the gold particles is advocated by some, while others believe it simply washes gold into footwall cracks and irregularities.
Research completed by De Jager [11] identified gold loss relating to cracks in stopes footwall quartzites and shales, blasting and impregnation of timbers and mat-packs, stope water that washed it away, accumulation in the muds generated during mining, in the plant, in residues and tailings from the plant, unusual mineralogy, incorrect sampling, incorrect evaluation, and theft.
De Jager undertook several experiments, one of which included measuring the grade of muds in cross-cuts underlying faces on which the grade had been measured by standard face sampling methods [14,15]. These samples indicated grades of 13.6 g/t Au, approximately 50% of the grade in the prevailing stope faces. In an experiment specifically designed to quantify the amount of gold in areas approved of as being swept to the required standards, De Jager conducted an experiment on stopes of the Basal Reef in the Western Holdings gold mine, where the average grade was 20 g/t Au. Vacuum technology was able to recover 32 t of fines over eight c. eight day periods. The average fines grade was 63 g/t Au, containing c. 65 oz Au.
The expense of vacuuming 32 t of fines that contained 65 oz Au was found to be unsustainable at c. 0.11 tonnes per hour. A minimum of 1 t per hour with an average grade of 30 g/t Au was needed to be vacuumed to make the operation profitable (in 1996).
Sampling of mud in the drains in cross-cuts and haulages at 30 m intervals in muds with an average depth of 42 cm gave an average grade of 5.7 g/t Au. The calculated amount of mud in such drains was 21,570 t, with a density of 1.7 g/m3 containing a total amount of 3955 oz Au. This is a relatively small proportion of the total gold recovered from the mining operation. On a monthly basis, about 695 oz Au is sent to the mill in the form of mud, and true accounting provided a 5% increase in the Mine Call Factor from 67% to 72%. The overall conclusion from analysing the gold content of muds is that it carries gold at slightly more than half the grade available in surrounding stope areas.
Overall, De Jager [11] concluded that gold loss does not take place in obscure ways; the only genuine gold loss is because some ore broken in the stopes never arrives at the plant. He also concluded that some gold predicted by the evaluation processes was never there in the first place, blaming the shortfall on poor sampling at the face (e.g., biased channel or chip samples) [14,15].
With reference to the Witwatersrand mines, Xingwana [13] notes that 40% of ore reserves are left behind as support pillars and, of the remaining 60%, 20–30% of gold-bearing particles are lost between the drive or stope and processing plant. “Loss” of ounces during the post-mining reconciliation process is often poorly considered and assumed to relate to estimation error (including sampling error) and/or loss in the processing plant. This may be true in some cases, but it may also relate to a loss in broken residues. Such loss is generally accounted for through the application of the Mine Call Factor [9,13].

1.5. Aim/Focus of This Paper

The evaluation of broken ore residues is compelling, even if to merely understand how much gold is being lost (or not), and its effect on project economics. Maximised recovery of value from a mining operation is key to “Responsible Consumption and Production”, the United Nations (UN) Sustainable Development Goal #12. In addition, effective recovery is also key to the International Council on Mining and Metals (ICMM) Principal #8, “Responsible Production”.
This paper presents a discussion and case study, where the reader will gain an understanding of the problem, and how to collect samples for evaluation. The authors are unaware of any such discussion or case study presented elsewhere.

2. Sampling of Broken Rocks

2.1. Overview

Drive evaluation should include the digging of pits and trenches into floors to determine residue depth, and to take samples for grade determination. Stopes are more challenging to sample, with grab sampling being the most appropriate, though a sub-optimal, technique [4,5,16]. Application of the TOS should be at the fore of any sampling undertaken to ensure representative and fit-for-purpose samples [1,3,4,5]. Knowledge of the ore type should be used to determine representative sample mass. Such sampling programmes are likely be important during reconciliation studies, where unaccounted lost gold needs to be identified [9,20].

2.2. Theory of Sampling Applied to Mine Residues

Based on experience, a channel or trench sample is likely to be the most effective on a drive floor. This entails digging a trench across the drive width to the depth of the residue. The trench can be between 10–50 cm wide, or as appropriate. The application of vacuum technology can help with the extraction of the sample if it is available. The trench can be collected as a series of consecutive lengths as required, e.g., a 3 m long trench taken as three 1 m samples or as one 3 m long trench, for example. This may be controlled by the sample preparation and assay method, where shorter lengths will form the basis of samples that need to be reduced in size/mass prior to assay. Longer samples are likely to be effective for those that will be processed through a laboratory or pilot plant, hence a greater feed mass is appropriate.
Pits can also be dug, although they will not represent the full width of the drive floor. They are suited to checking residue depth and/or taking a bulk density sample. Grab sampling should be avoided, though may be the only possible method applicable to stope floors.
Table 2 presents a discussion of TOS errors likely to be encountered during trenching.
The evaluation of residues left on the floors of stopes is more problematic from a safety perspective, with risks from unstable/unsupported hanging-walls, and uneven and steep floors. Assuming safe access can be gained, grab sampling is the most likely sampling method, though is prone to many TOS errors [1,4,5,16]. An alternative is to recover a down-dip swath of residues using water jetting from the upper level. The pile, which needs to be caught on rubber matting below, can be recovered in its entirety and sub-sampled after crushing and potentially pre-screening. This is not a perfect option, as DE and EE are all likely, together with the potential partitioning of fines into cracks and undulations on the stope floor enhancing the EE.

2.3. FSE Application

The Gy FSE equation can be used to calculate what sub-sample size should be used to obtain a specified variance at a given reliability. When FSE is not optimised for each sub-sampling stage, it becomes a major component of the sampling nugget effect [4,20,22]. The FSE can be modelled before material is sampled, provided certain characteristics are determined, specifically grade, liberation diameter, and nominal material size [4,8,16]. The François-Bongarçon modified FSE equation is given as follows [8]:
FSE(rel var) = f g c (d95Au)b dnα (1/MS − 1/ML)
Equation (1) can be rearranged to calculate the mass of a sample required to achieve a specified FSE value, as follows:
MS = f g c (d95Au)b dnα/FSE(rel var)
where f = shape factor; g = granulometric factor; dn = nominal material size (95% passing/5% retained value); c = mineralogical factor; d95Au = liberation diameter; b = (3 − α), where α is determined experimentally from duplicate series analysis tests [23] or a default value of α = 1.5 is applied [8]; MS = sample mass; and ML = lot mass.
Table 3 provides examples of potential sample masses required for fine- and coarse-gold bearing residues based on the application of Equation (2). As the gold particle size coarsens, then the required sample mass rises to the scale of tonnes. If a reduced dn value of 5 cm is applied, for example, the required mass reduces by c. 65%.
The evaluator must consider the sampling strategy in the big picture of the project aims. Whilst the FSE equation provides a given mass (e.g., 5 t), it needs to be placed in the context of the programme and its outputs. For example, if an entire mine is being evaluated, then a series of 5 t samples may be required over a given area or levels. It will be impractical to collect multiple 5 t samples, whereas it should be practical to collect 20 × 250 kg samples from a given area (e.g., drive).
The data quality objectives (DQO) need to be set based on expected outputs. If, for example, a mineral resource is expected, then a precision of ±15–20% at the 90% confidence limit may be appropriate for an indicated mineral resource classification using either the JORC, PERC, or CIM codes/standards [17,18,19]. It is up to the competent/qualified person to set the required DQOs.

2.4. Optimised Sampling Protocol

A first pass determination of the presence of gold can be undertaken by the collection of multiple small samples (e.g., <50 kg) for manual panning and identification of gold or sulphide colour (Figure 1). This process is relatively fast and cheap, and provides an effective way to undertake a first-pass review. Note that where gold is dominantly locked in sulphides, this approach may not be optimal, beyond identifying potentially gold-bearing sulphide minerals which can be assayed to check for gold content.
The evaluation of a drive can initially be performed by taking 100–250 kg of material made up from 5 to 10 individual samples. These should be assayed via an appropriate protocol, and preferably as large samples processed through a metallurgical laboratory. Table 4 provides a potential preparation–assay route based on a 250 kg sample. The FSE is calculated based on a 10 g/t Au grade and liberation diameter of 1 mm. Higher grades and/or lower liberation diameters will reduce the FSE. Practitioners should apply Equation (2) with appropriate inputs to optimise their specific residue type.
Table 5 presents the total FSE based on a primary lot mass of 260 t from a 150 m long and 3 m wide drive containing 25 cm of broken residue. For both confidence limits, the total FSE is equal to or below ±20% as an acceptable target [2,3,4].
The protocol and analysis given in Table 4 and Table 5 are general, though provide a starting point for any programme. Proper characterisation and optimisation are critical for all cases. In coarse gold-dominated residues, laboratory-scale or pilot plant facilities, or a sampling tower, may be required for grade determination. A Quality Assurance/Quality Control (QAQC) programme will be required for all testwork.
Beyond sample collection, preparation and assay optimisation, evaluation must be accompanied by an appropriate QAQC programme, including procedures, preparation/process equipment hygiene, standards, blanks, umpire assay, and duplicates [24].

3. Case Study

3.1. Introduction

A case study is presented from an underground operation located in South America. An ore drive (200 Level Drive: “200LD”) with a length of 150 m and stopes above was accessed and sampled in the South Vein section of the mine. Mineralisation is characterised by a 1.0–1.75 m wide 45–55° dipping composite quartz-sulphide vein, hosted in granodiorite. The host rock contains no gold and is generally very stable. The vein contains coarse-free quartz-hosted (c. 70%) gold and free sulphide-hosted (c. 30%) gold, with 60–70% gravity recoverable. The ore reserve grade, based on diamond core samples at a 10–15 m spacing, was in the range of 13–16 g/t Au. Mining took place between 2012–2015, with the evaluation reported here undertaken during 2016.
Mining was performed by in air-leg room-and-pillar benching, with scraper winches used for mucking. A review of reconciliation over the previous mined areas promoted analysis of the likely destination of estimated gold beyond just the processing plant. A review of blasted ore granulometry indicated that 61% of the gold was hosted in the sub-25 mm fraction, representing 27% of the total development round mass of 42 t (Table 6). This indicated that there was a strong likelihood that drive and stope broken residues would be high grade.

3.2. Preliminary Sampling on the 200 Level Drive

3.2.1. Initial bulk Sample and Granulometry

In total, 7 trenches were dug across the 200LD to give a combined 7.5 t bulk sample for assay. The data for each individual sample was re-combined to give a granulometric profile for the residue (Table 7). Each size fraction was processed through a 0.5 t/h gravity-based pilot plant to recover as much coarse gold as possible. The pilot plant was based on 3-stage crushing and grinding to produce a P80 –150 µm product for feed to two 7.5-inch Knelson concentrators in series to recover 60–80% of the gold. Concentrates were further cleaned using a Superpanner. A Vezin splitter was located on the tails line. Tails were sent to a leach plant for final gold recovery. All tails were assayed to provide a head grade for each size fraction. Panning of the gravity concentrates identified liberated coarse gold, >60% of it between 500 µm and 1200 µm in size.
This data indicates that 91% of the gold is hosted in the sub-25 mm fraction, representing 74% of the total bulk sample mass (Table 7). The bulk grade of the residue material was 35.6 g/t Au, with the sub-25 mm fraction grading at 32.7 g/t Au. Compared to the original blasted ore, there was a 2.7× enrichment of the floor residue with respect of gold. This relates to the continuous accumulation of liberated gold in the sub-25 mm fraction during drive development, stope blasting, and the mucking process.

3.2.2. Segregation in the Residue Pile

A granulometric analysis was undertaken across 3 consecutive layers at each of 2 locations on the 200LD (Table 8 and Table 9), which aimed to investigate potential grade segregation through the residue pile.
Each sample was based on a pit area of 1 m by 0.5 m to the depth of the residual fill. Each sample was carefully removed by hand, layer-by-layer, to preserve any segregation between layers. The total sample from each layer was screened at 6 mm, and each fraction subsequently assayed via the pilot plant. Panning of the gravity concentrates identified liberated coarse gold, >60% of it between 500 µm and 1350 µm in size (Figure 1).
The two samples show grade segregation across the residue pile at each location. Sample SEG001 displays the highest head grade at 45.2 g/t Au, with 54% of the contained gold in the base layer (66.9 g/t Au), decreasing to 20% (27.8 g/t Au) in the upper layer. Similarly, sample SEG002 displays a lower head grade at 22.4 g/t Au, with 48% of the contained gold in the base layer (32.1 g/t Au), decreasing to 22% (15.5 g/t Au) in the upper layer.

3.3. FSE Analysis

Based on an analysis of 200LD bulk samples, an FSE analysis was undertaken to investigate the optimum sample size required. The data quality objectives were set at ±15% precision at the 90% confidence limit, given the expectation to estimate an indicated mineral resource and report it in accordance with the JORC code [17]. Initially, a nominal material size of 10 cm was selected, as this generally represented the dominant residue upper fragment size.
Gold liberation diameters of 500 µm and 1000 µm were applied using a series of grades from 5 g/t Au to 60 g/t Au. At the time of evaluation (2016), 10 g/t Au was the breakeven grade for any residue recovery programme. Table 10 shows the sample masses required across the different grade-liberation diameter scenarios at a nominal top size of 10 cm.
Given that 90% of the sub-5 cm mass fraction contains 98% of the gold (Table 7), the sample masses were re-estimated using a nominal top size of 5 cm rather than 10 cm. This reduces the required sample mass substantially. Sufficient residue must be collected to achieve the prescribed sample mass after screening at 5 cm. Table 11 shows the sample masses required across the different grade-liberation diameter scenarios at a nominal top size of 5 cm.

3.4. 200 Level Drive Sampling Programme

Based on results given in Table 11, an optimum sample mass of 6 t was selected after screening at 5 cm. Subsequently, twenty-four 200–350 kg trenches were cut along the 150 m test drive, each with a separation of 5–6 m. Each trench was 3 m long, 20 cm to 40 cm wide, and up to 30 cm in depth.
Samples were collected by hand to minimise the DE and EE. Given that the residue was relatively hard, the trench sidewalls were generally stable. Material was broken with a compressed air pick where required, and brooms and a small hand blower or vacuum unit were used to assist with fines recovery.
Each sample was then processed in its entirety through the pilot plant, with concentrates and tails assayed to provide a head grade for each sample. Processing yielded a head grade of 33.4 g/t Au from 6.25 t of material. This was applied to the entire 200LD which was estimated to contain 260 t at 33.4 g/t Au for 279 oz Au.
Direct sampling of the stopes was not possible due to safety issues. One stope panel of 30 m strike length was sampled by water-jetting the residues from the level above. The collected material was processed through the pilot plant providing 13.8 t at 13.7 g/t Au.

3.5. 200 Level Drive Field Duplicate Programme

At one of the drive sample locations, a further nine samples were taken consecutively across the drive one after another. This provided ten samples and, effectively, nine pairs (field duplicates) for precision analysis. The pairs gave a global precision of ±25%, which is reasonable given the coarse gold nature of the ore. The usual expectation of such could be within ±30–50% [24].
It should be noted that the section of the 200LD sampled was of a consistently high grade (>35 g/t Au and up to 50 g/t Au) and that 9 pairs is a very small population for meaningful analysis. Given the size of the samples and their pilot plant processing, large numbers of field duplicates were both costly and impractical.

3.6. 200 Drive Residue Reconciliation

Based on the original mine plan, the 200LD and associated stopes were estimated to contain 2902 oz Au in probable ore reserves, based on 15 m by 10 m diamond core grade control drilling. The mill-reconciled head was 2420 oz Au, a shortfall of 482 oz. The residues were subsequently removed, yielding 235 t, which contained a reconciled 274 oz Au.
Table 12 shows the reconciliation of actuals (mining plus recovered residue) and the original estimate. Recovery of the residue increases the grade to 14.9 g/t Au compared to the estimate of 15.8 g/t Au.
Based on the actual predicted (2902 oz Au) and that produced (2420 oz Au + 274 oz Au = 2694 oz Au), this leaves a shortfall of 208 oz Au from the original model. The shortfall may represent gold loss elsewhere, particularly on stope floors and in trucks, stockpiles, the processing plant, and sampling and estimation error.
The stopes were not included in the residue estimate, and were not part of the reclaim programme. Based on a limited sampling programme (refer to Section 3.4), it was estimated that c. 100–150 oz Au could be in the stopes. Coverage of stope residue material is highly variable and could only be visually estimated.

3.7. Sampling of the Rest of the South Vein Workings

The 3 remaining 450 m drives were trenched every 15–20 m, with a 200–250 kg sample collected at each location, targeting 6 t per level (screened at 50 mm). The same sampling approach was applied as in Section 3.4. An additional 12–15 1 m by 1 m pits were dug between the trenches to check the depth of the residue and to provide bulk density data.

3.8. Evaluation of the South Vein Workings

All trenches and pits were surveyed, and a 3D model of the residue was provided for each of the four drives. The estimate was based on an essentially sectional model, where given volumes were assigned grade and density based on the values inside the given volume. Areas where the residue was <2 cm and/or <10 g/t Au were excluded from the estimate, though these only accounted for c. 2% of the total residues.
An indicated mineral resource was reported for 1650 m of combined drives containing 2650 t at 28.1 g/t Au for 2394 oz Au. This equates to 1.61 t of residue and 1.45 oz Au per metre of drive.
Based on the mineral resource estimate, a feasibility study was undertaken to evaluate the potential of reclaiming all the drive floor residues. The learnings of the sampling programme were used to scope the practicality of removal. The feasibility study resulted in a probable ore reserve being reported for 1650 m of ore drive containing 2600 t at a head grade 27.9 g/t Au for an estimated 2332 oz Au contained. The study indicated the project had a pre-tax Net Present Value (NPV) of US$1.7 M, and an Internal Rate of Return (IRR) of 550%. Given that the mine was operating, the residues were readily accessible and reclaimable, and the gold was recoverable, and all over a relatively short period, the risk was low and a discount factor of 2.5% was applied to the NPV.
During 2017, reclaim of the residues was undertaken by contract miners who completed the job by hand. Processing was via the existing pilot plant, with tails sent to another site for cyanide leaching.

3.9. Rest of Mine Reconciliation

At completion, 2412 t were reclaimed at a head grade of 32.4 g/t Au for 2373 oz Au recovered (Table 13).
Given the reconciliation provided in Table 13, the results are wholly consistent with an indicated estimate (within ±10–20%) and validate the sampling programme implemented.
On completion of the residue reclamation process, a reconciliation of the actual reclaim was made with the original ore reserve and actual mined (Table 14). With the addition of the actual reclaim, the shortfall in ounces from the ore reserve was 472 oz Au (Table 14). The reclaim ounces represent 18.7% of the original ore reserve estimate. With the reclaim ounces included, 96.4% of the estimated ounces are accounted for. The “missing” 3.6% likely relates to gold loss, particularly on stope floors and in trucks, stockpiles, and the processing plant. It may simply not be missing, as it represents sampling and/or estimation error and, therefore, never existed in the first place.
Whilst the stopes were not exhaustively sampled (refer to Section 3.4) or reclaimed, it is estimated that they could contain between 150–250 t of residue at 10–20 g/t Au, equating to c. 50–160 oz Au contained.

3.10. Economic Value of the Programme

The cost of evaluation in 2016 was US$0.32 M (including all initial access, sampling, processing, and QAQC costs) and combined mining, processing, and administration costs at US$0.65 M. Based on gold sales of US$3 M, a post-tax profit of US$1.65 M was achieved from the programme. Cost and profit per tonne and ounce are given in Table 15.
Based on these figures, a breakeven cut-off grade of 7 g/t Au was calculated for the project. If the evaluation costs are considered, the cut-off rises to 10.5 g/t Au. The evaluation programme indicated minimal material below 10 g/t Au (c. 2%).
The project was served to advantage given that the mine was operating, allowing a supply of skilled labour and equipment. Beyond geotechnical rehabilitation and installation of ventilation within the South Vein area, minimal preparatory work was needed. Access and egress to the surface was simple, with residue transported out of the mine via a dedicated truck. The existing pilot plant was well-suited to batch processing the high gravity gold ore type, without which batching through the production plant would have been the only option, interrupting production and making its own reconciliation more difficult and, thus, increasing operating costs.

4. Sampling, Evaluation, Reporting and Reclamation

4.1. Grade Determination

The primary optimum sample mass can be estimated using the FSE equation, assuming that several basic parameters are known. Once collected, the primary samples need to be processed in their entirety or reduced in size via comminution and splitting. This process can also be managed via the FSE equation. At the laboratory, smart crushers provide a method for crushing and splitting in one unit. Whole sample assaying is the best option to minimise sampling errors (Table 2). Where primary samples or sub-samples are submitted to a laboratory for assay, then large scale assay methods may be required, such as LeachWELL (nominally up to 10 kg), screen fire assay (nominally up to 5 kg), and PhotonAssay (nominally up to 25 kg). All grade determination programmes must be accompanied by QAQC.

4.2. Residue Evaluation

Where there is an expectation of defining resources/reserves, then a comprehensive sampling programme must support the evaluation. With the surveying of the drive floor surface and base of the pits/trenches, the residue volume can be modelled in 3D. Sample grades can be interpolated into the given volume. The survey of pit/trench volumes provides a determination of broken rock bulk density.
Where residue recovery is likely, metallurgical testwork should be undertaken to optimise gold recovery. Residues are often two, three, or more times the grade of the original primary ore, and/or could contain higher concentrations of deleterious elements (e.g., the concentration of arsenopyrite in the residues).
If gold loss is being investigated as part of a reconciliation study, then the entire mine does not need to be sampled. A pragmatic approach is to identify low, medium, and high-grade areas, and then sample these so that a potential relationship between gold loss and grade can be established. If established, this can then be applied across the mine area, based on grade to evaluate the overall loss to residue effect.

4.3. Reporting Residue Resources and Reserves

The results of residue evaluation programme can be reported in accordance with the 2012 JORC code, the 2014 CIM standard, and the PERC standard [17,18,19]. In some instances, this may result in the definition of a mineral resource and ore/mineral reserve. All aspects of the code/standard must be adhered too, including the consideration of reasonable prospects for eventual economic extraction (“RPEEE”). Clause 41 of the JORC code [17] and Appendix 1 of the PERC standard [18] refer specifically to “mineralised fill”, noting that it should be treated like in-situ mineralisation for the purposes of reporting. All matters must be declared in the JORC/PERC Table 1 checklist of assessment and reporting criteria, including those pertaining to sampling techniques and data, as indicated in JORC Table 1 Section 1 and PERC Table 1 Section 3 [17,18].
Key to RPEEE is safe access to the drives and/or stopes containing the residues. It may be that access is either impossible or too costly, resulting in no RPEEE. In this case, a mineral resource cannot to reported. Following any mineral resource supported by appropriate RPEEE, a feasibility study must be undertaken to determine project viability. A successful feasibility study will lead to the definition of ore/mineral Reserves.
Even if a resource is defined, it is possible that the feasibility study may show that reclamation is uneconomic. Viability is driven by grade and reclamation cost (including mine recovery and processing). In another case study, a resource was defined, but was ultimately shown not to display RPEEE because the mining cost was increased by safety and infrastructure work required to ensure that the project was safely implemented.

4.4. Residue Reclamation

The case study presented here was based on the hand recovery of floor residues. This is an arduous process that can be improved by the application of vacuum technology [10]. The mobile Supersucker system can recover c. 40 t per shift with 2 operators and, thus, up to 2400 t per month based on 2 shifts per day (Figure 6). This provides substantive advantage to the operator, providing that all services, access, and safety matters can be addressed. Operating costs for the Supersucker are likely to be in the US$100–130 per tonne range [10].
In addition, the mobile Supersucker provides an effective way of collecting drive or stope samples during the evaluation process. Material can be selectively sucked from pits or trenches and loaded into a Load Haul Dumper for transport out of the mine to a pilot plant or sampling tower.

5. Conclusions

5.1. General Conclusions

  • The underground mining cycle results in some of the metal inventory being left as broken residues within underground mine workings. The mucking process itself can enhance the “milling” of ore yielding liberated fine-ore minerals within the broken rock pile.
  • The study of broken ore residues presented here is relevant for both review of reconciliation and evaluation of residue with a view to reclamation.
  • It is possible for >5% or more of the original metal inventory to remain as broken residues, which will have a material effect on reconciliation and project economics.
  • The residual pile can be strongly gold enriched in comparison to the original in-situ ore. Gold segregation can be observed within the residue pile, where the base is enriched with respect to the upper portion.
  • Given that the material in question is already broken, the sampling strategy will be based on digging trenches or pits into the mine floor to extract a pre-determined mass of material for assay. Grab sampling is the only practical method for sampling stopes, given their variable distribution of residues.
  • Safety considerations are paramount during both the sampling and reclamation process. If drive/stope access cannot be attained safely, then any estimate may not achieve RPEEE.
  • Application of TOS is key to ensuring that sampling is representative. The FSE equation can be used to determine the sample mass required and any subsequent preparation-assay steps at a given DQO.
  • Broken residues can be reported as mineral resources and ore/mineral reserves in accordance with JORC/PERC/CIM code/standards, provided that all relevant matters in Table 1 are disclosed (as applicable to the JORC and PERC code/standard) [17,18].
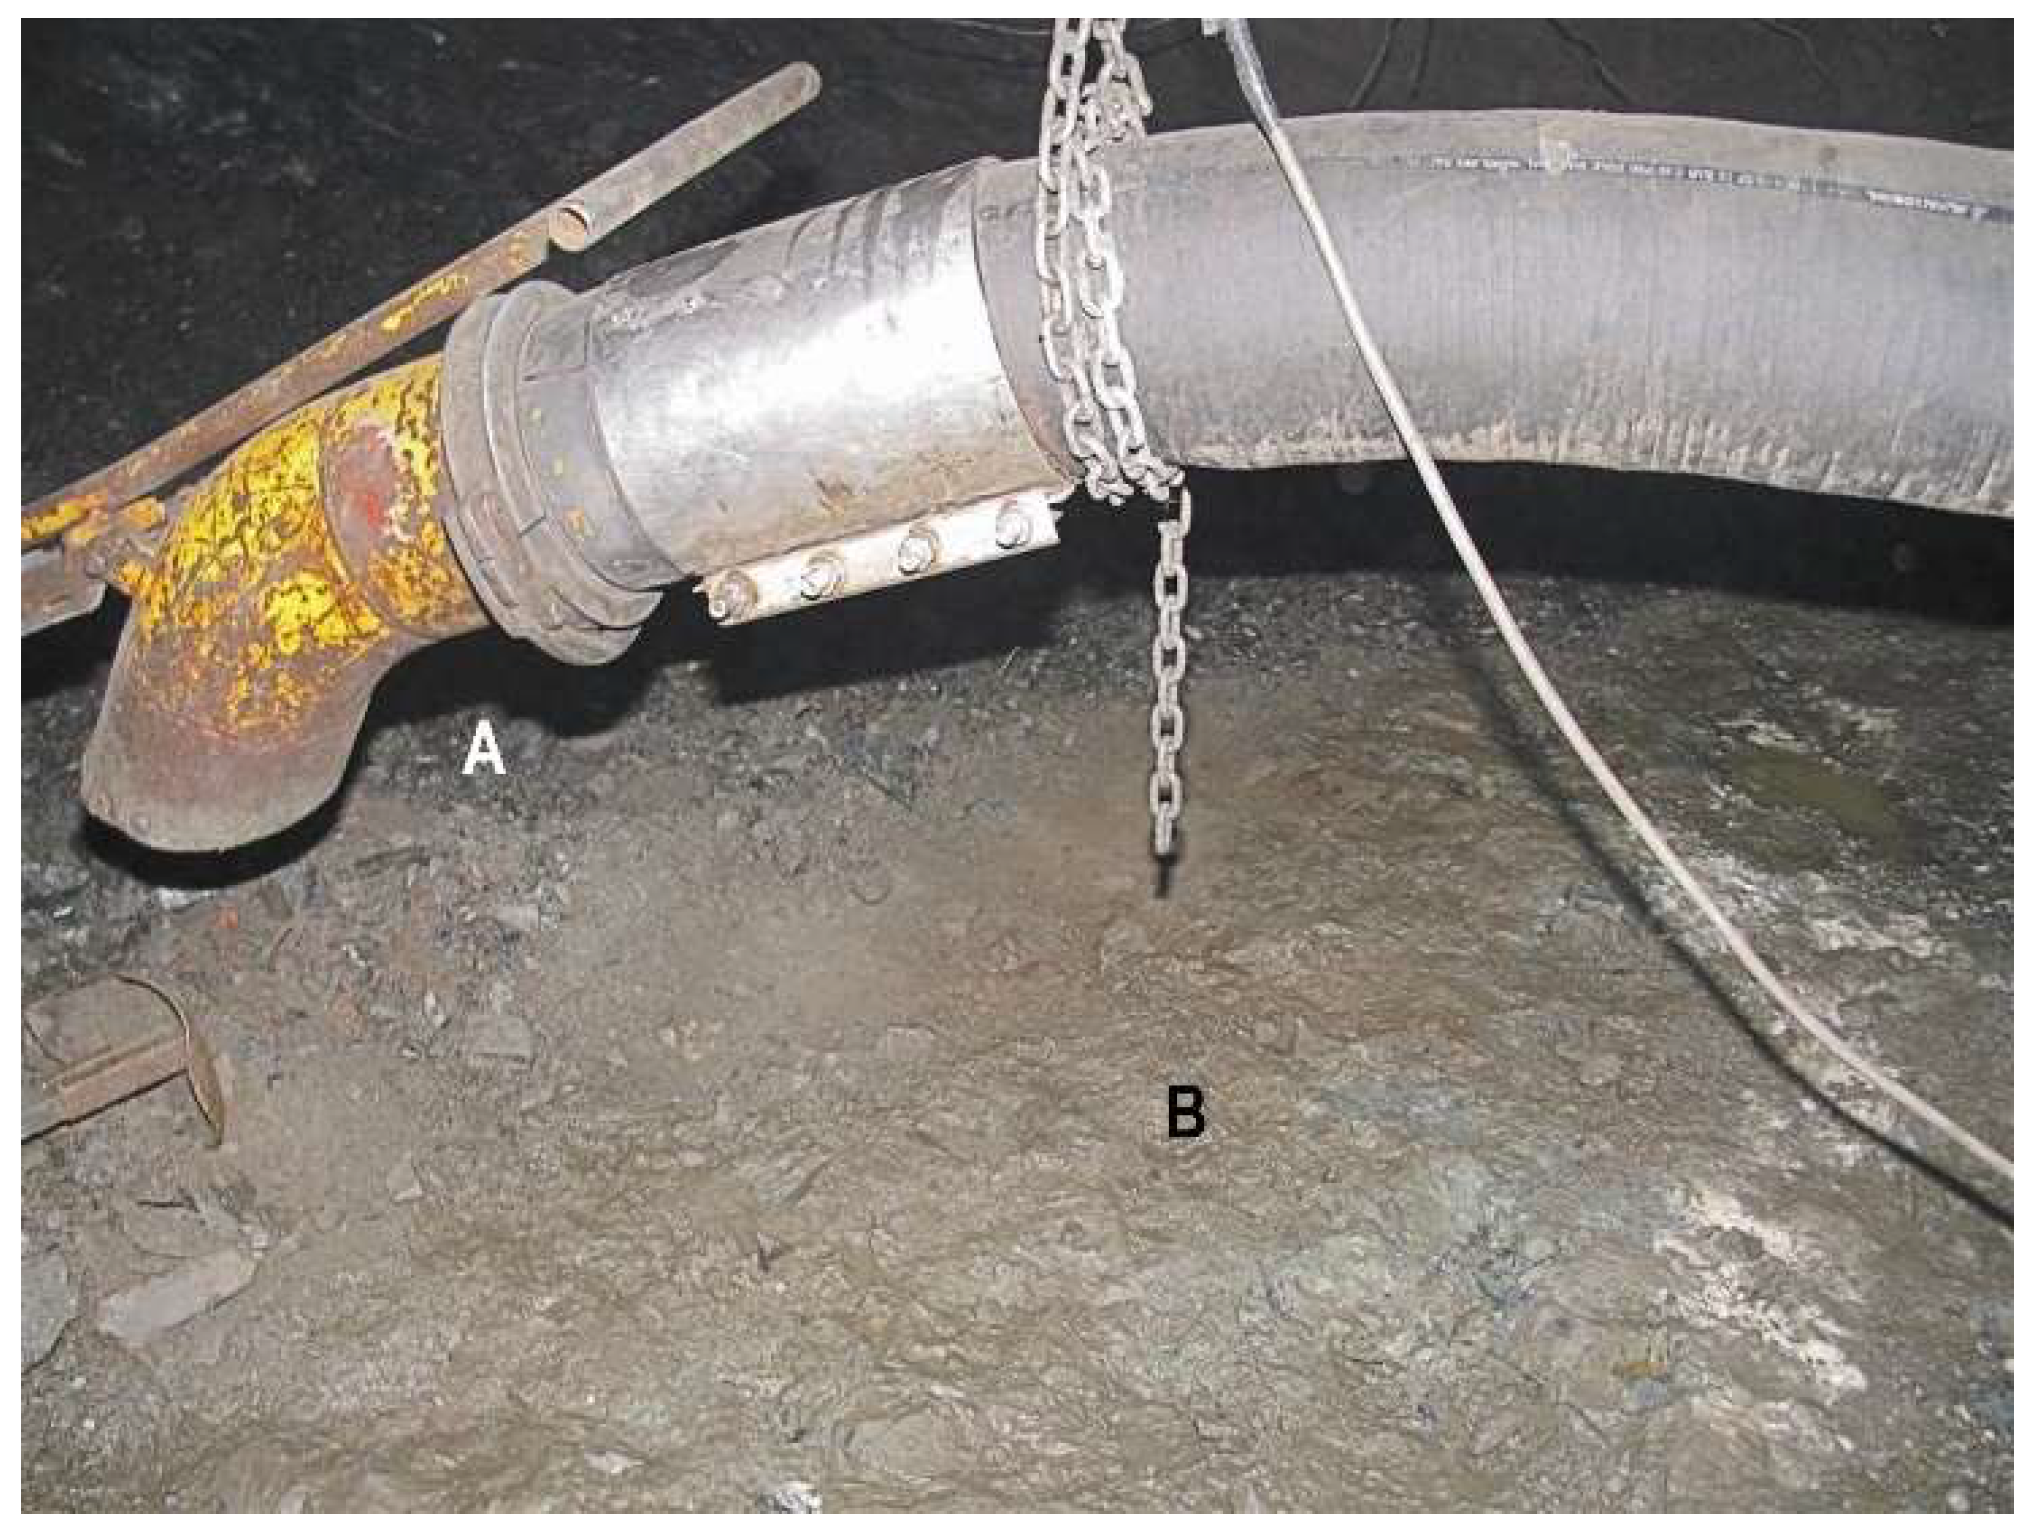
  • If a resource is defined, then a feasibility study is required to evaluate economic viability. If the quantity of gold found is deemed to be economic to extract, vacuum technology enables a cost-effective reclamation method.
  • This discussion covers underground operations, though similar loss is also possible during open pit bench blasting. The nature of open pit mining does not allow for residue recovery due to consecutive benching. If some residues are dispersed within the mining area, they will be recovered.
  • Other commodities can also be prone to fines loss (e.g., nickel sulphides)and, thus, similar studies may be appropriate.

5.2. Case Study Conclusions

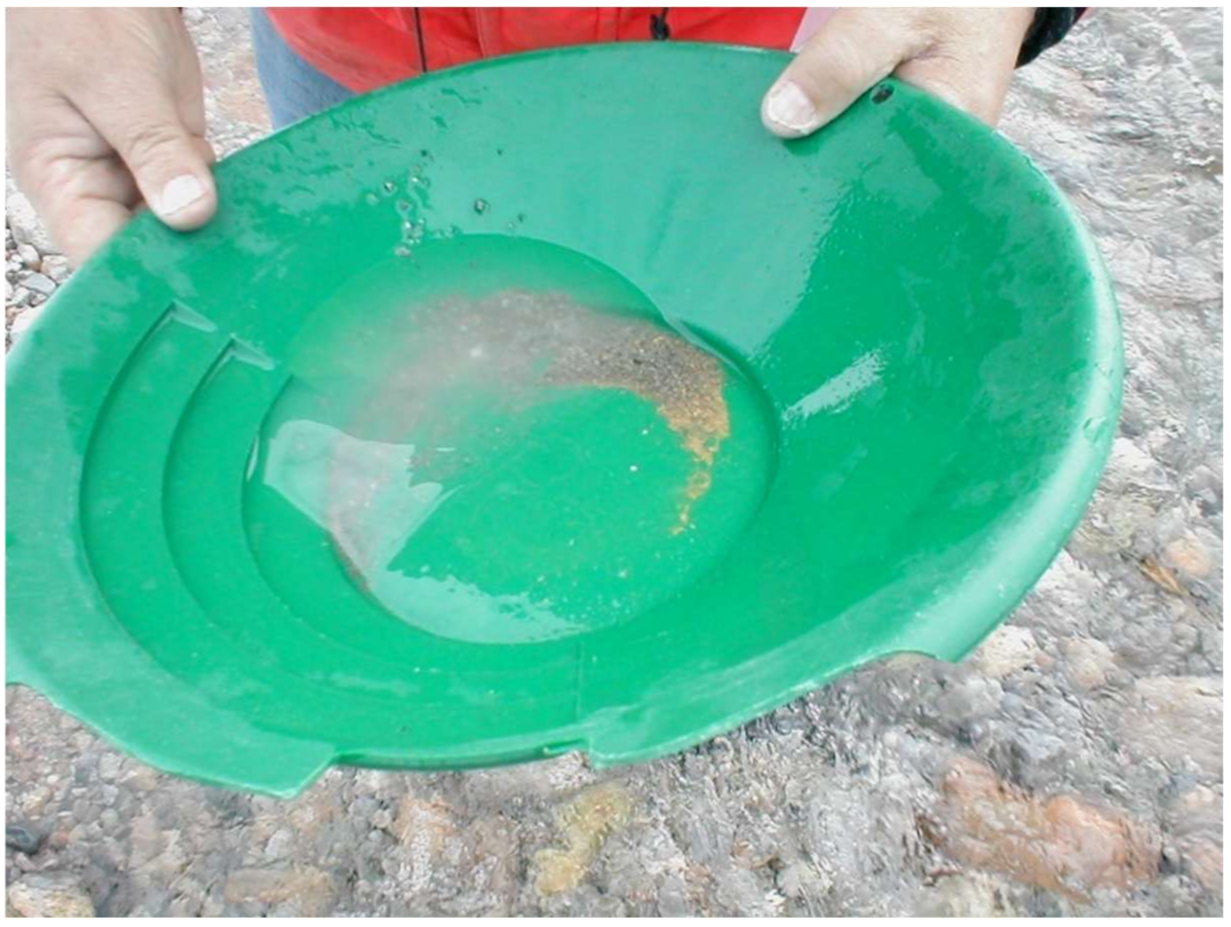
  • A preliminary sampling programme involved digging pits into the drive floors and producing a concentrate by panning.
  • An initial bulk residue sample of 7.5 t was composited from 7 trenches across a test drive. This was processed through a pilot plant as a series of size fractions to provide a granulometric analysis and head grade. Review of the concentrates indicated that most of the gold was in the 500 µm to 1200 µm size range.
  • It was found that 97% of the contained gold was hosted in the −5 cm fraction, representing 90% of the total sample mass. The entire bulk sample displayed a 270% enrichment in gold compared to a bulk sample of primary blasted ore.
  • A more detailed sampling programme was undertaken across 4 drives totalling c. 1650 m of strike. This involved collecting 200–250 kg trench samples along each drive (5–6 m separation) to provide a total sample mass of c. 6 t per drive (screened at 50 mm). The 6 t target was an optimised estimate using the FSE equation with the aim of achieving a precision of ±15% at the 90% confidence limit.
  • All sample data was combined to estimate an indicated mineral resource of 2650 t at 28.1 g/t Au for 2394 oz Au contained. A feasibility study defined a probable ore reserve of 2600 t at 27.9 g/t Au for 2332 oz Au contained. The study indicated that the project had a pre-tax NPV of US$1.7 M and an IRR of 550% in 2016.
  • A reclamation programme of the broken ore residues produced 2412 t at 30.6 g/t Au for 2372 oz Au recovered, which generated a post-tax profit of US$1.4 M.
  • The case study presented shows that 22% of the original estimate across the reclaimed area can be attributed to “lost” gold. Reclamation of the residues recovered 18.5% of the original estimate. The additional 3.5% was attributed to gold lost in stopes (not estimated or recovered here), gold lost elsewhere (e.g., in trucks, surface stockpiles, etc.), and sampling/estimation error.

6. Recommendations to the Practitioner

  • Characterisation should build a picture of residue tonnes and grade. A first pass programme could include the digging of pits in drive floors or taking grab samples from stope, and panning the samples to identify gold and/or sulphides as appropriate.
  • When physically accessible, undertake mini-bulk sampling (100–250 kg samples) and testwork, and integrate with mineralogical and metallurgical needs. Initial assaying programmes should commence with screen fire assaying and/or tabling (e.g., Wilfley or Gemeni tables) after size reduction to identify the presence of coarse gold and/or sulphides.
  • It should become clear early on if the grades achieved, and if the likely recovery area will yield a resource. If a mineral resource is defined (assuming RPEEE), then a feasibility study must be undertaken to prove viability.
  • Embrace new technologies, such as smart crushers and PhotonAssay, to achieve large volume assays. Any proposed protocol will require validation during initial implementation through the application of sample duplicates where possible. In coarse gold-dominated residues, laboratory-scale or pilot plant facilities, or a sampling tower may be required for grade determination. A QAQC programme will be required for all testwork.
  • With prior sampling and assaying, such as that provided in Table 3, Table 4 and Table 5, it may be possible to evaluate the quantum of gold that might be lost during mining. This knowledge should be factored into project feasibility studies to account for potential lost revenue.

Author Contributions

Conceptualization, S.C.D.; methodology, S.C.D.; formal analysis, S.C.D.; resources, S.C.D.; data curation, S.C.D.; writing—original draft preparation, S.C.D., H.J.G. and R.C.A.M.; writing—review and editing, S.C.D., H.J.G. and R.C.A.M.; project administration, S.C.D. All authors have read and agreed to the published version of the manuscript.

Funding

This research received no external funding.

Data Availability Statement

Not applicable.

Acknowledgments

The authors acknowledge OCX Gold Group for permission to publish the case study material. Kris Biegaj (Ausvac Mining Pty Ltd., Western Australia) is thanked for discussions on the economics of broken ore residues and their reclamation by vacuuming. Figure 4 and Figure 6 are reproduced thanks to Ausvac Mining Pty Ltd.

Conflicts of Interest

The authors declare no conflict of interest.

References

  1. Gy, P.M. Sampling of Particulate Materials: Theory and Practice; Elsevier: Amsterdam, The Netherlands, 1982; p. 431. [Google Scholar]
  2. Minnitt, R.C.A. Sampling: The impact on costs and decision making. J. South Afr. Inst. Min. Metall. 2007, 107, 451–462. [Google Scholar] [CrossRef]
  3. Dominy, S.C. Importance of good sampling practice throughout the gold mine value chain. Mining Tech. 2016, 125, 129–141. [Google Scholar] [CrossRef]
  4. Pitard, F.F. Theory of Sampling and Sampling Practice; CRC Press: Boca Raton, FL, USA, 2019; p. 693. [Google Scholar]
  5. Esbensen, K.H. Introduction to the Theory and Practice of Sampling; IM Publications: West Sussex, UK, 2020. [Google Scholar] [CrossRef]
  6. Dominy, S.C.; Glass, H.J.; Purevgerel, S. Sampling for resource evaluation and grade control in an underground gold operation: A case of compromise. In Proceedings of the WCSB10 Conference 2022, Kristiansand, Norway, 31 May–2 June 2022; IM Publications: West Sussex, UK; pp. 375–395. [Google Scholar]
  7. Dominy, S.C.; Platten, I.M.; Glass, H.J.; Purevgerel, S.; Cuffley, B.W. Determination of gold particle characteristics for sampling protocol optimisation. Minerals 2021, 11, 1109. [Google Scholar] [CrossRef]
  8. François-Bongarçon, D.M.; Gy, P.M. The most common error in applying Gy’s formula in the theory of mineral sampling and the history of the liberation factor. J. South. Afr. Inst. Min. Metall. 2002, 102, 475–479. [Google Scholar]
  9. Hargreaves, R.; Morley, C. Mining reconciliation—An overview of data collection points and data analysis. In Mineral Resource and Ore Reserve Estimation; Australasian Institute of Mining and Metallurgy: Melbourne, Australia, 2014; pp. 739–748. [Google Scholar]
  10. Biegaj, K.; Dominy, S.C. Mine floor material recovery must become part of the Life-of-Mine plan. In Proceedings of the International Future Mining Conference Melbourne, Online, 6–10 December 2021; Australasian Institute of Mining and Metallurgy: Melbourne, Australia,, 2021; pp. 358–365. [Google Scholar]
  11. De Jager, E.J. The Analysis of the Mine Call Factor in Gold Mining with Specific Reference to Western Holdings Mine. PhD Thesis, University of the Witwatersrand, Johannesburgm, South Africa, 1996; p. 112. [Google Scholar]
  12. Storrar, C.D. South African Mine Valuation; Chamber of Mines of South Africa: Johannesburg, South Africa, 1981; p. 470. [Google Scholar]
  13. Xingwana, L. Monitoring ore loss and dilution for mine-to-mill integration in deep gold mines: A survey-based investigation. J. South. Afr. Inst. Min. Metall. 2016, 116, 149–160. [Google Scholar] [CrossRef] [Green Version]
  14. Fourie, A.; Minnitt, R.C.A. Review of gold reef sampling and its impact on the mine call factor. J. South. Afr. Inst. Min. Metall. 2016, 116, 1001–1010. [Google Scholar] [CrossRef] [Green Version]
  15. Dominy, S.C.; Glass, H.J.; Lam, C.K.; O’Connor, L.; Purevgerel, S.; Minnitt, R.C.A. Integrating the Theory of Sampling into underground grade control strategies. Minerals 2018, 8, 232. [Google Scholar] [CrossRef] [Green Version]
  16. Dominy, S.C. Grab sampling for underground gold mine grade control. J. South Afr. Inst. Min. Metall. 2010, 110, 277–287. Available online: http://www.scielo.org.za/pdf/jsaimm/v110n6/04.pdf (accessed on 1 April 2022).
  17. JORC. Australasian Code for Reporting of Exploration Results, Mineral Resources and Ore Reserves, the JORC Code; Joint Ore Reserves Committee of the Australasian Institute of Mining and Metallurgy; Australian Institute of Geoscientists and Minerals Council of Australia: Melbourne, Australia, 2012; 44p, Available online: https://www.jorc.org/docs/JORC_code_2012.pdf (accessed on 1 April 2022).
  18. PERC. Pan-European Standard for the Public Reporting of Exploration Results; Mineral Resources and Mineral Reserves: The PERC Reporting Standard; Pan European Reserves and Resources Reporting Committee: Brussels, Belgium, 2021; 68p, Available online: https://percstandard.org/wp-content/uploads/2021/09/PERC_REPORTING_STANDARD_2021_RELEASE_01Oct21_full.pdf (accessed on 1 April 2022).
  19. CIM. CIM Definition Standards for Mineral Resources and Mineral Reserves; CIM Standing Committee on Reserve Definitions: Westmount, QC, Canada, 2014; p. 19. Available online: https://mrmr.cim.org/media/1128/cim-definition-standards_2014.pdf (accessed on 1 April 2022).
  20. Dominy, S.C. Predicting the unpredictable—Evaluating high-nugget effect gold deposits. In Mineral Resource and Ore Reserve Estimation; Australasian Institute of Mining and Metallurgy: Melbourne, Australia, 2014; pp. 659–678. [Google Scholar]
  21. Tuck, M. Stope cleaning: Historical methods and future developments. In Proceedings of the Gravity Gold Conference 2010, Ballarat, Australia, 21–22 September 2010; Australasian Institute of Mining and Metallurgy: Melbourne, Australia, 2010; pp. 25–26. [Google Scholar]
  22. François-Bongarçon, D.M. Theory of sampling and geostatistics: An intimate link. Chemom. Intell. Lab. Syst. 2004, 74, 143–148. [Google Scholar] [CrossRef]
  23. Minnitt, R.C.A.; Assibey-Bonsu, W. A comparison between the duplicate series method and the heterogeneity test as methods for calculating the sampling constants. J. South. Afr. Inst. Min. Metall. 2010, 110, 251–268. [Google Scholar]
  24. Dominy, S.C.; Purevgerel, S.; Esbensen, K.H. Quality and sampling error quantification for gold mineral resource estimation. Spectrosc. Eur. 2020, 32, 21–27. [Google Scholar] [CrossRef]
Figure 1. Liberated gold panned directly from a drive floor sample.
Minerals 12 00667 g001
Figure 2. Development drive and low-angle stope floor after mucking by scraper. Remaining fine material in both the drive and stope floor contain liberated gold. Stope width approx. 2 m.
Minerals 12 00667 g002
Figure 3. Drive floor showing the high level of fine material accumulated after blasthole drilling. Some of this material will remain even after removal of the blast round. Drive width 5 m.
Minerals 12 00667 g003
Figure 4. Approximately 0.3 m broken ore left on the drive floor before (A) and after (B) vacuuming. Supersucker hose diameter 200 mm.
Minerals 12 00667 g004
Figure 5. View of stope footwalls with accumulated residues. Stope height approx. 1.5 m.
Minerals 12 00667 g005
Figure 6. Ausvac Supersucker unit underground in an ore drive. The accumulation of broken ore residues on the drive floor in front of the Supersucker is clear.
Minerals 12 00667 g006
Table 1. Examples of the gold content of broken ore residues. A DDH: diamond drill core; Face: chip or channel samples. Reserve grade is based on block models using the reserve input data. Mined grade is back-calculated from gold yield and tailing samples. The estimate of gold in residues is based on a sampling of drive and/or stope floors.
Deposit TypeCoarse GoldReserve Grade (g/t Au)Mined Grade (g/t Au)Reserve Model InputsEstimate of Gold in ResiduesMine Call Factor
(Mined/Reserve)
Vein 1.0–1.5 m low-dip; long-holeHigh20.216.4Face15–20%75%
Sub-vertical 3–5 m vein; long-holeMed9.57.0DDH & Face10–12%74%
Sub-vertical 1–2 m vein; long-holeLow10.49.4DDH5–10%90%
Vertical 2–4 m vein; long-holeHigh10.26.7DDH & Face20–25%66%
Sub-vertical 1–1.5 m; long-hole & shrinkageMed22.224.6DDH<5%111%
Table 2. TOS sampling errors during drive residue trenching.
Sampling ErrorAcronymError TypeEffect on SamplingSource of ErrorPractical Implication
FundamentalFSECorrect Sampling Error (CSE)Random Errors—Precision GeneratorCharacteristics of the ore type. Relates to constitution and distribution heterogeneityTo achieve a given level of precision, the mass of sample collected will need to be sufficient to reduce the FSE. The Gy FSE equation can be used to optimise the sample mass
Grouping and SegregationGSEOnce rock is broken, there will be segregation of rock and mineral particles across the residue. The residue must be sampled across its full depth
DelimitationDEIncorrect Sampling Error (ISE)Systematic Errors—Bias GeneratorSampling method, equipment and materials handlingA consistent trench width is required. Trench depth will vary will residue depth. Residue must be sampled to its full depth
ExtractionEEAll fragments within the delineated volume must be extracted
PreparationPE
Refers to issues during sample transport and storage e.g., mix-up, damage, loss and alteration, preparation (contamination and/or losses), and intentional actions (sabotage and salting), as well as unintentional actions (carelessness and non-adherence to protocols)
AnalyticalAE-Analytical processRelates to all errors during assay and analytical processes, including issues related to rock matrix effects, analytical equipment maintenance, faulty calibration, etc.
Table 3. Potential FSE-optimised sample mass for a fine- to coarse-gold ore based on achieving a precision of ±15% at the 90% confidence limit. In this contribution the following values are used for all FSE equation parameters, as follows: alpha = 1.5; f = 0.30; g = 0.25; gold fineness = 850; dn = 10 cm, with values generally between 5 cm and 10 cm. Grade and liberation diameter values are given in this table. The residue dn is taken as 10 cm.
Lot Grade
(g/t Au)
Liberation Diameter
Very Fine Gold
[50 µm]
Fine Gold
[100 µm]
Coarse Gold
[250 µm]
Very Coarse Gold [1000 µm]
5345 kg1 t3.8 t30.7 t
10170 kg0.5 t1.9 t15.4 t
2085 kg250 kg1 t7.7 t
3060 kg165 kg0.7 t5.1 t
6030 kg80 kg350 kg2.6 t
Table 4. Potential sample preparation and assay protocol based on reducing a 250 kg sample to 2.5 kg for assay. The FSE values are rounded to the nearest whole %. The FSE calculation is based on a grade of 10 g/t Au, liberation diameter of 1 mm, and nominal material size of 5 cm (assuming dominant concentration of gold in the −5 cm fraction). This protocol accounts for coarse gold, hence a large liberation diameter.
StepStep ActionStage FSE
(68% CL)
Stage FSE
(90% CL)
Comments
1Crush 250 kg to P90 −4 mm split off 25%±12%±18%Post dry, crush entire sample and double riffle split to achieve c. 62.5 kg sub-sample
2Crush 62.5 kg to P90 −1 mm split off 25%±8%±13%Crush entire sample and double riffle split to achieve c. 15.6 kg sub-sample
3Pulverise 15.6 kg to P90 −100 µm and split off 2–4 kg for screen fire assay or PhotonAssay±2%±2%Pulverize via rod mill or LM5. Batch if required. Rotary sample divide to 2–4 kg sub-sample for SFA or PhotonAssay. If more coarse gold expected, tend toward 4 kg assay charge
Total FSE±14%±23%
Table 5. Potential sample preparation and assay protocol based on reducing a 250 kg sample to 2.5 kg for assay. The FSE values are rounded to the nearest whole percent. The FSE calculation is based on a grade of 10 g/t Au, liberation diameter of 1 mm, and nominal material size of 5 cm (assuming dominant concentration of gold in the −5 cm fraction).
StepStep ActionPrimary Lot MassSample MassStage FSE
(68% CL)
Stage FSE
(90% CL)
1Collect 12 × 250 kg samples260 t3 t±13%±20%
2Crush/split3 t750 kg±3%±5%
3Crush/split750 kg188 kg±2%±4%
4Pulverise/split for assay188 kg48 kg<±1%<±1%
Total FSE ±13%±20%
Table 6. Granulometric analysis of a bulk sample of blasted ore.
Size fractionFraction Mass (t)Fraction Grade (g/t Au)Mass Fraction
(%)
Contained Gold (%)
−3 mm3.0744.6725
3 to 6 mm2.4129.8613
6 to 15 mm4.2523.81018
15 to 25 mm1.5318.745
25 to 50 mm5.4310.31310
50 to 100 mm7.589.21813
>100 mm17.315.14216
Total41.5813.2--
Table 7. Granulometric analysis of a bulk sample of drive residue.
Size FractionFraction Mass (t)Fraction Grade (g/t Au)Mass Fraction (%)Contained Gold (%)
−3 mm1.9758.62643
3 to 6 mm1.7745.82330
6 to 15 mm1.1426.71511
15 to 25 mm0.7624.3107
25 to 50 mm1.1314.6156
50 to 100 mm0.569.282
>100 mm0.160.22<1
Total7.5335.6--
Table 8. Granulometric analysis (Sample SEG001) of three consecutive layers through the residue pile.
LayerThickness (m)Fraction (mm)Mass
(kg)
Grade
(g/t Au)
Contained Gold (%)
L1
(top)
0.11−655.634.611
+670.922.49
Total126.527.820
L20.10−660.244.716
+654.831.610
Total115.038.526
L3
(base)
0.12−674.676.933
+663.455.220
Total138.066.954
Total0.33 379.545.2-
Table 9. Granulometric analysis (Sample SEG002) of three consecutive layers through the residue pile.
LayerThickness (m)Fraction (mm)Mass
(kg)
Grade
(g/t Au)
Contained Gold (%)
L1
(top)
0.12−661.221.714
+676.810.58
Total138.015.522
L20.13−666.720.114
+682.818.716
Total149.519.330
L3
(base)
0.13−684.642.136
+663.118.412
Total147.732.148
Total0.38-435.222.4-
Table 10. The FSE-optimised sample mass for a fine- and coarse-gold ore, based on achieving a precision of ±15% at the 90% confidence limits. The residue top size is taken as 10 cm.
Lot Grade
(g/t Au)
Liberation Diameter
500 µm Gold1000 µm Gold
510.8 t30.7 t
105.4 t15.4 t
202.7 t7.7 t
301.8 t5.1 t
600.9 t2.6 t
Table 11. The FSE-optimised sample mass for a fine- and coarse-gold ore, based on achieving a precision of ±15% at the 90% confidence limits. The residue top size is taken as 5 cm.
Lot Grade
(g/t Au)
Liberation Diameter
500 µm Gold1000 µm Gold
50.35 t10.8 t
100.20 t5.4 t
2085 kg2.7 t
3060 kg1.8 t
6030 kg0.9 t
Table 12. Reconciliation between the 200 drive actual extracted (mined and residue) and the original model. All grades back-calculated to head grade. Actual mined based on reconciliation of gold produced from plant and tailings samples. Actual reclaimed residues based on reconciliation of gold produced from pilot plant and tailings samples. Ore reserve head grade based on grade control drilling. Figures may not compute due to rounding.
MeasureTonnes
(t)
Head Grade (g/t Au)Contained Ounces (Gold)
Actual mined537514.02420
Actual reclaimed residues23536.3274
Actual recovered total561014.92694
Probable Ore Reserve571215.82902
Mine call factor (actual/reserve)0.980.940.93
Table 13. Reconciliation between the actual extracted and the residues of the ore reserve for the South Vein area. Ore reserve head grade based on grade control drilling. Actual reclaimed residues based on reconciliation of gold produced from pilot plant and tailings samples. Figures may not compute due to rounding.
MetricTonnes
(t)
Head Grade
(g/t Au)
Recovered Grade
(g/t Au)
Recovered Gold (oz)
Probable Ore Reserve260027.926.52215
Actual reclaimed residues241232.430.62373
Difference−7%+16%+15%+7%
Table 14. Reconciliation between the actual extracted and the original residues models for the entire South Vein area. Actual mined based on reconciliation of gold produced from plant and tailings samples. Actual reclaimed residues based on reconciliation of gold produced from pilot plant and tailings samples. Ore reserve head grade based on grade control drilling. Figures may not compute due to rounding.
MetricTonnes
(t)
Recovered Grade
(g/t Au)
Recovered Gold (oz)Head Grade (g/t Au)Proportion of Recovered Gold to Reserve
Probable Ore Reserve25,80015.312,69316.1-
Actual mined22,95013.4988814.177.8%
Actual reclaimed residues241230.6237332.218.7%
Actual total25,36215.012,26115.896.4%
Table 15. Cost and profit per tonne and ounce. Values rounded to the nearest whole US$.
MetricUS$ per TonneUS$ per Ounce Recovered
Evaluation cost135137
Mining/processing cost260304
Total cost395441
Post-tax profit680573
Publisher’s Note: MDPI stays neutral with regard to jurisdictional claims in published maps and institutional affiliations.

