
Diavik Waste Rock Project: Geostatistical Analysis of Sulfur, Carbon, and Hydraulic Conductivity Distribution in a Large-Scale Experimental Waste Rock Pile

 , ,
, ,
Abstract
:1. Introduction
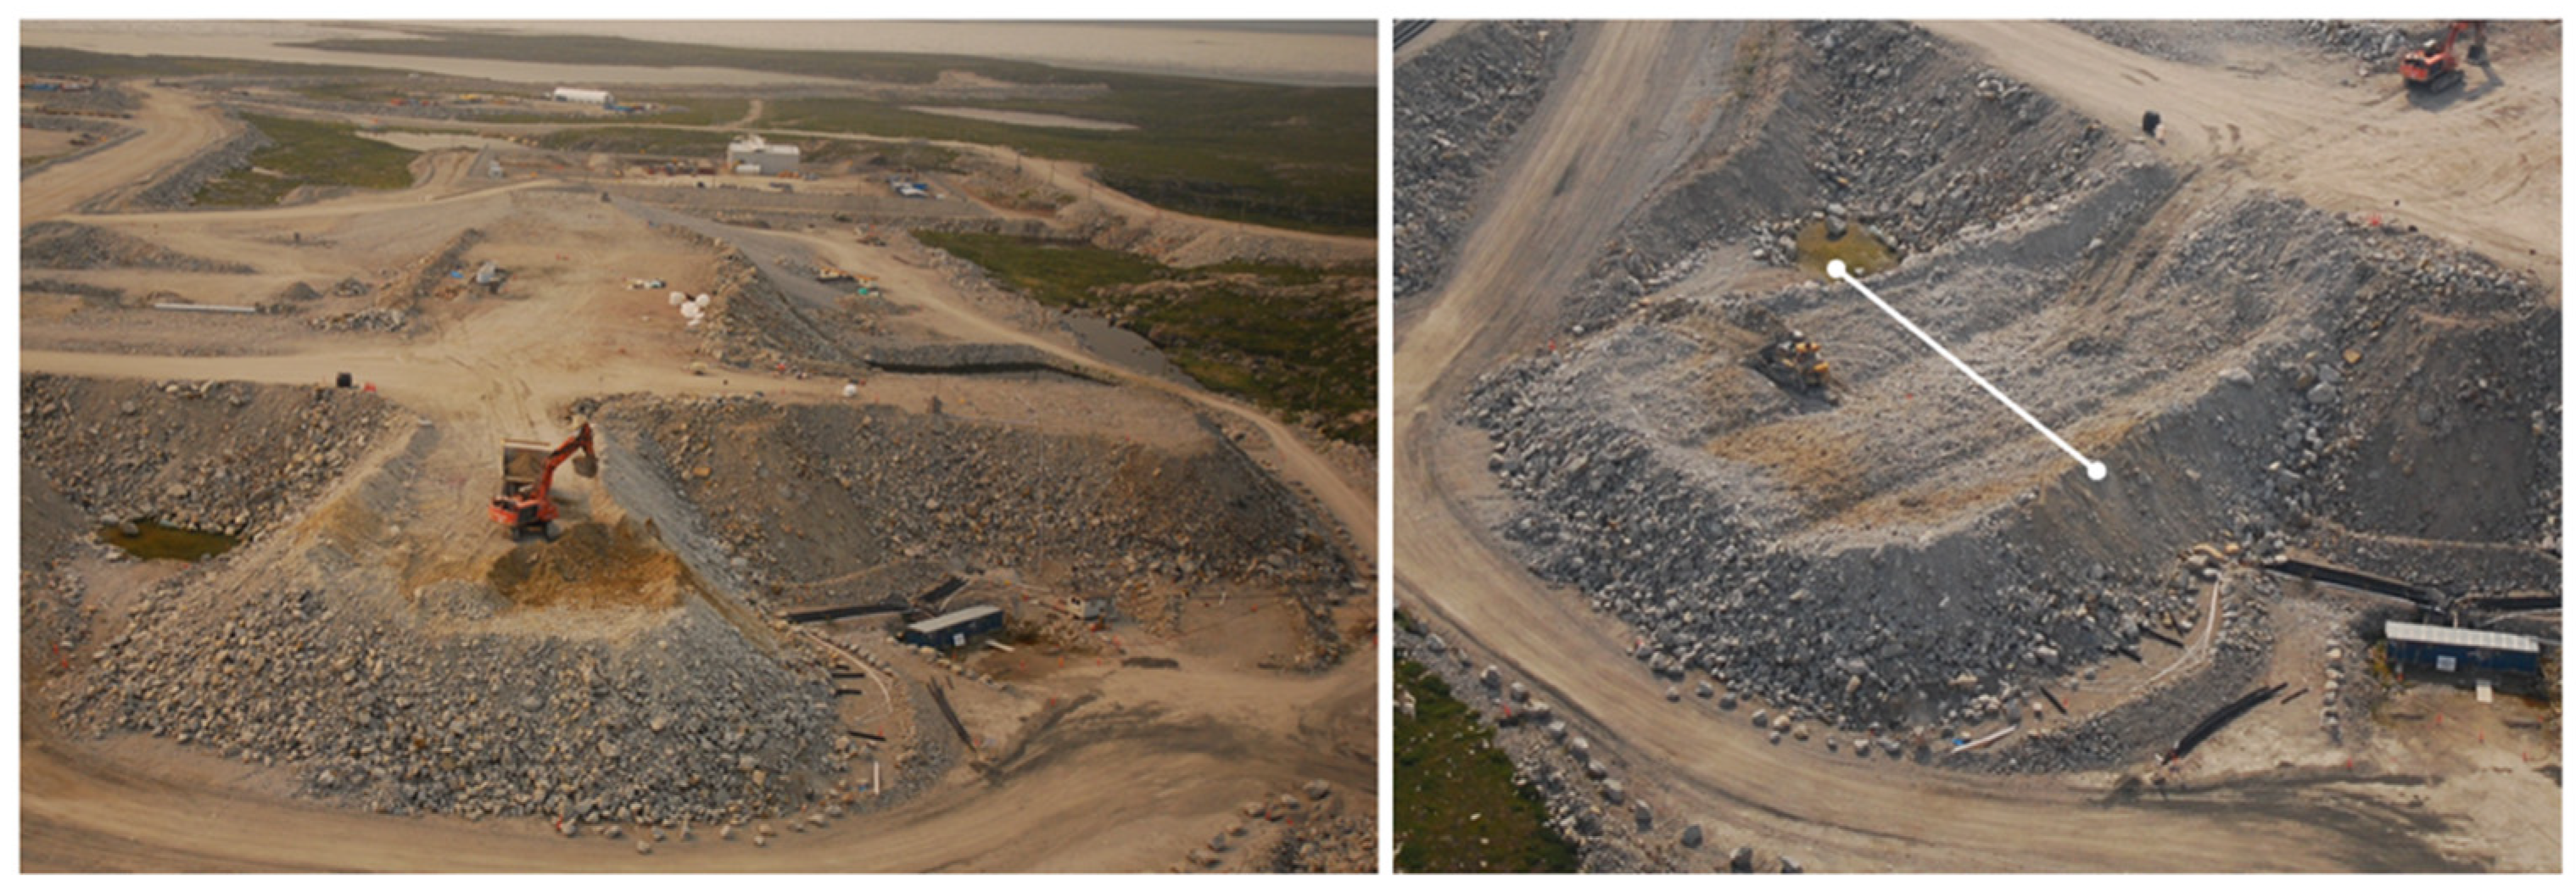
2. Methodology
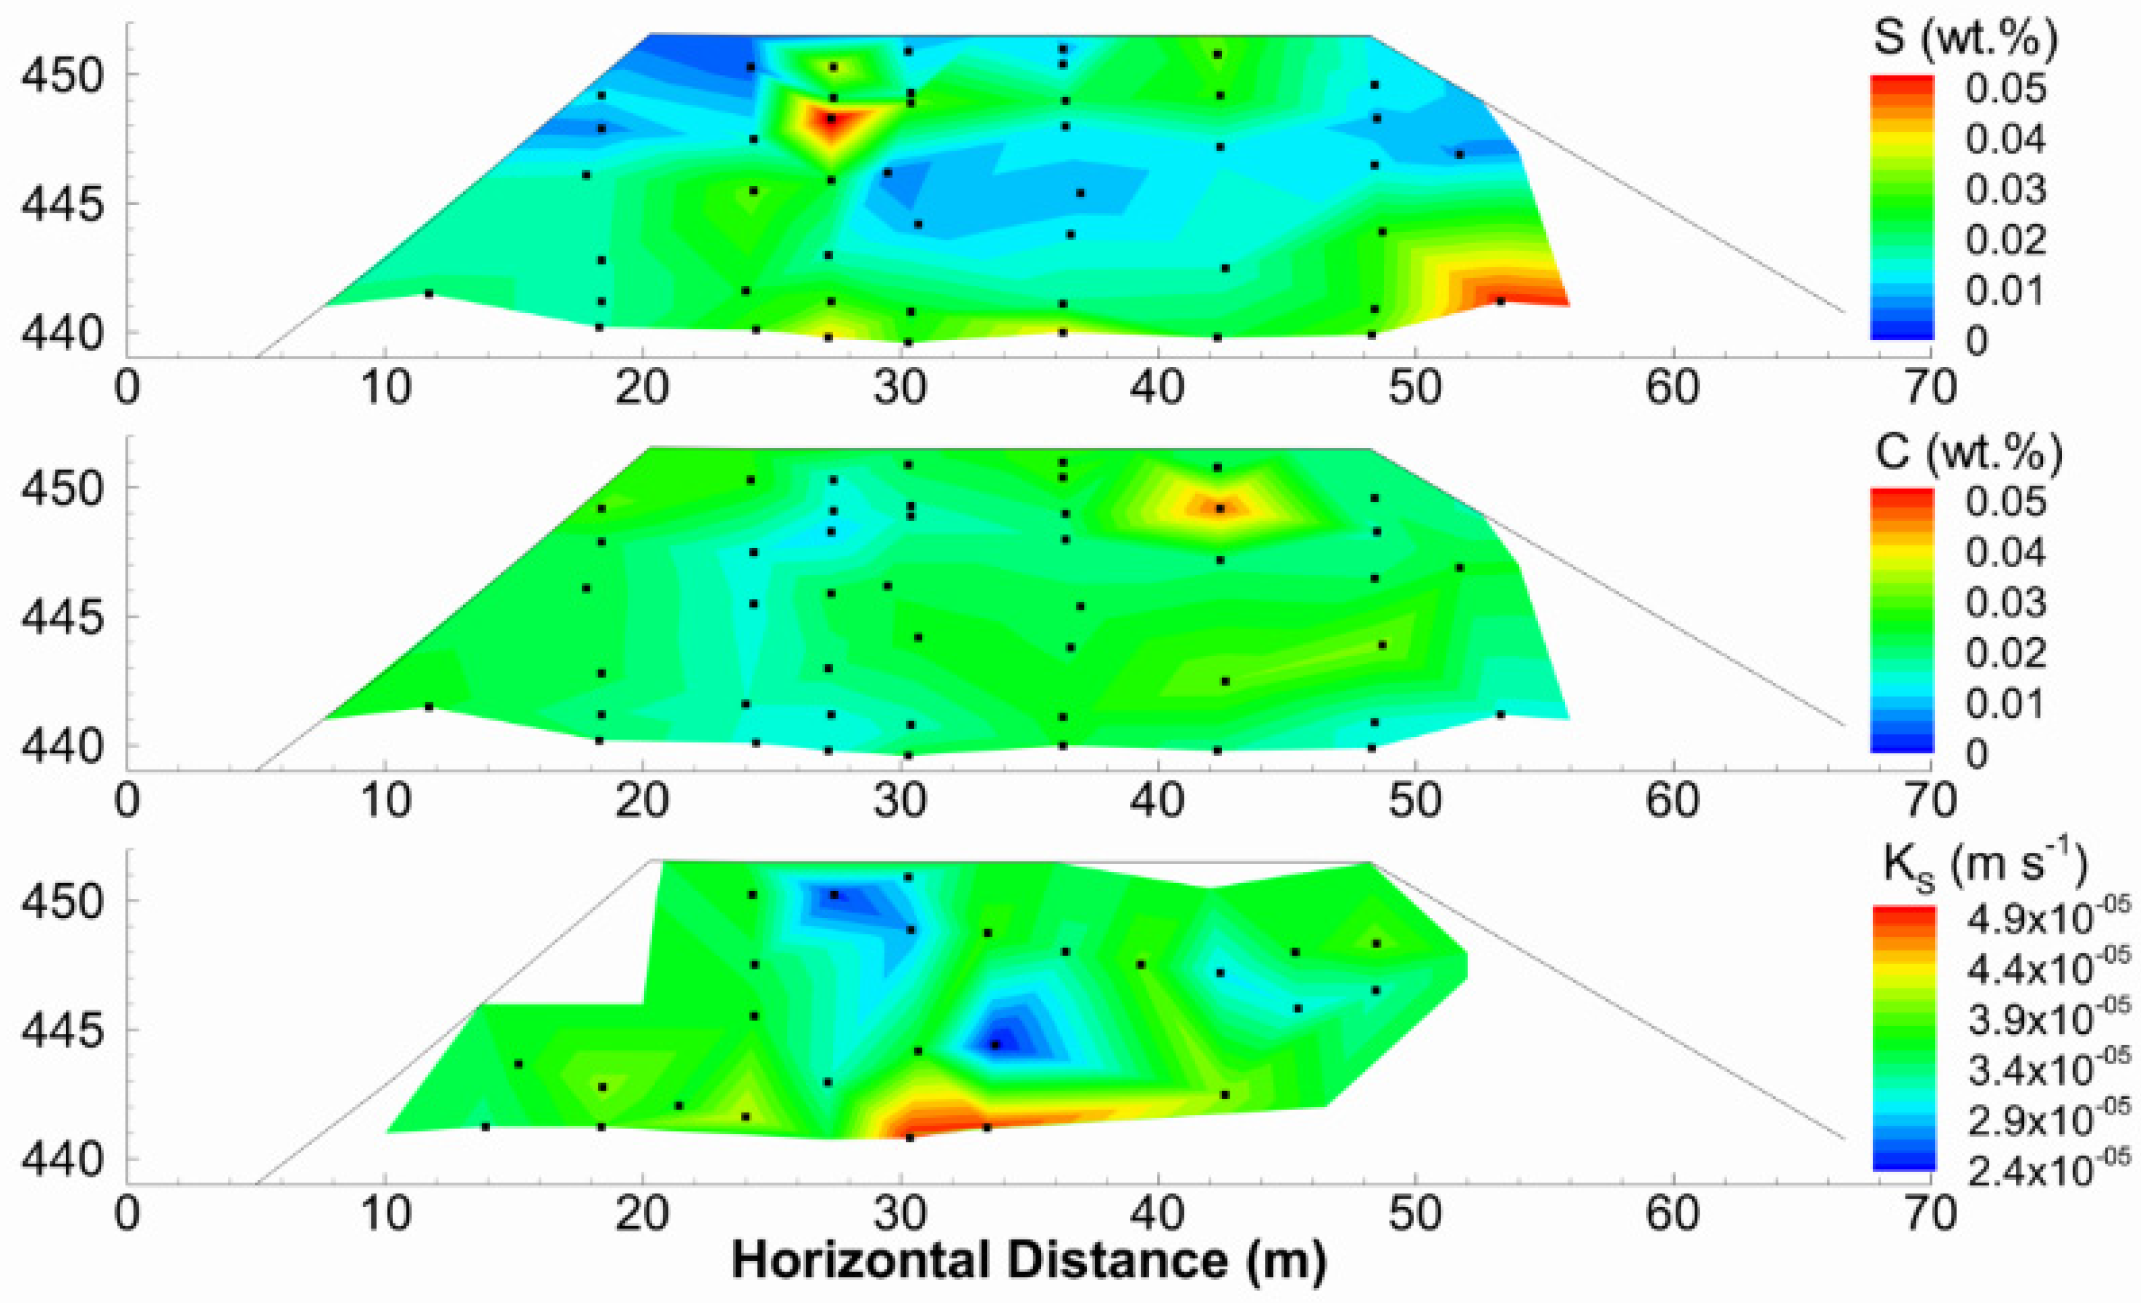
3. Results
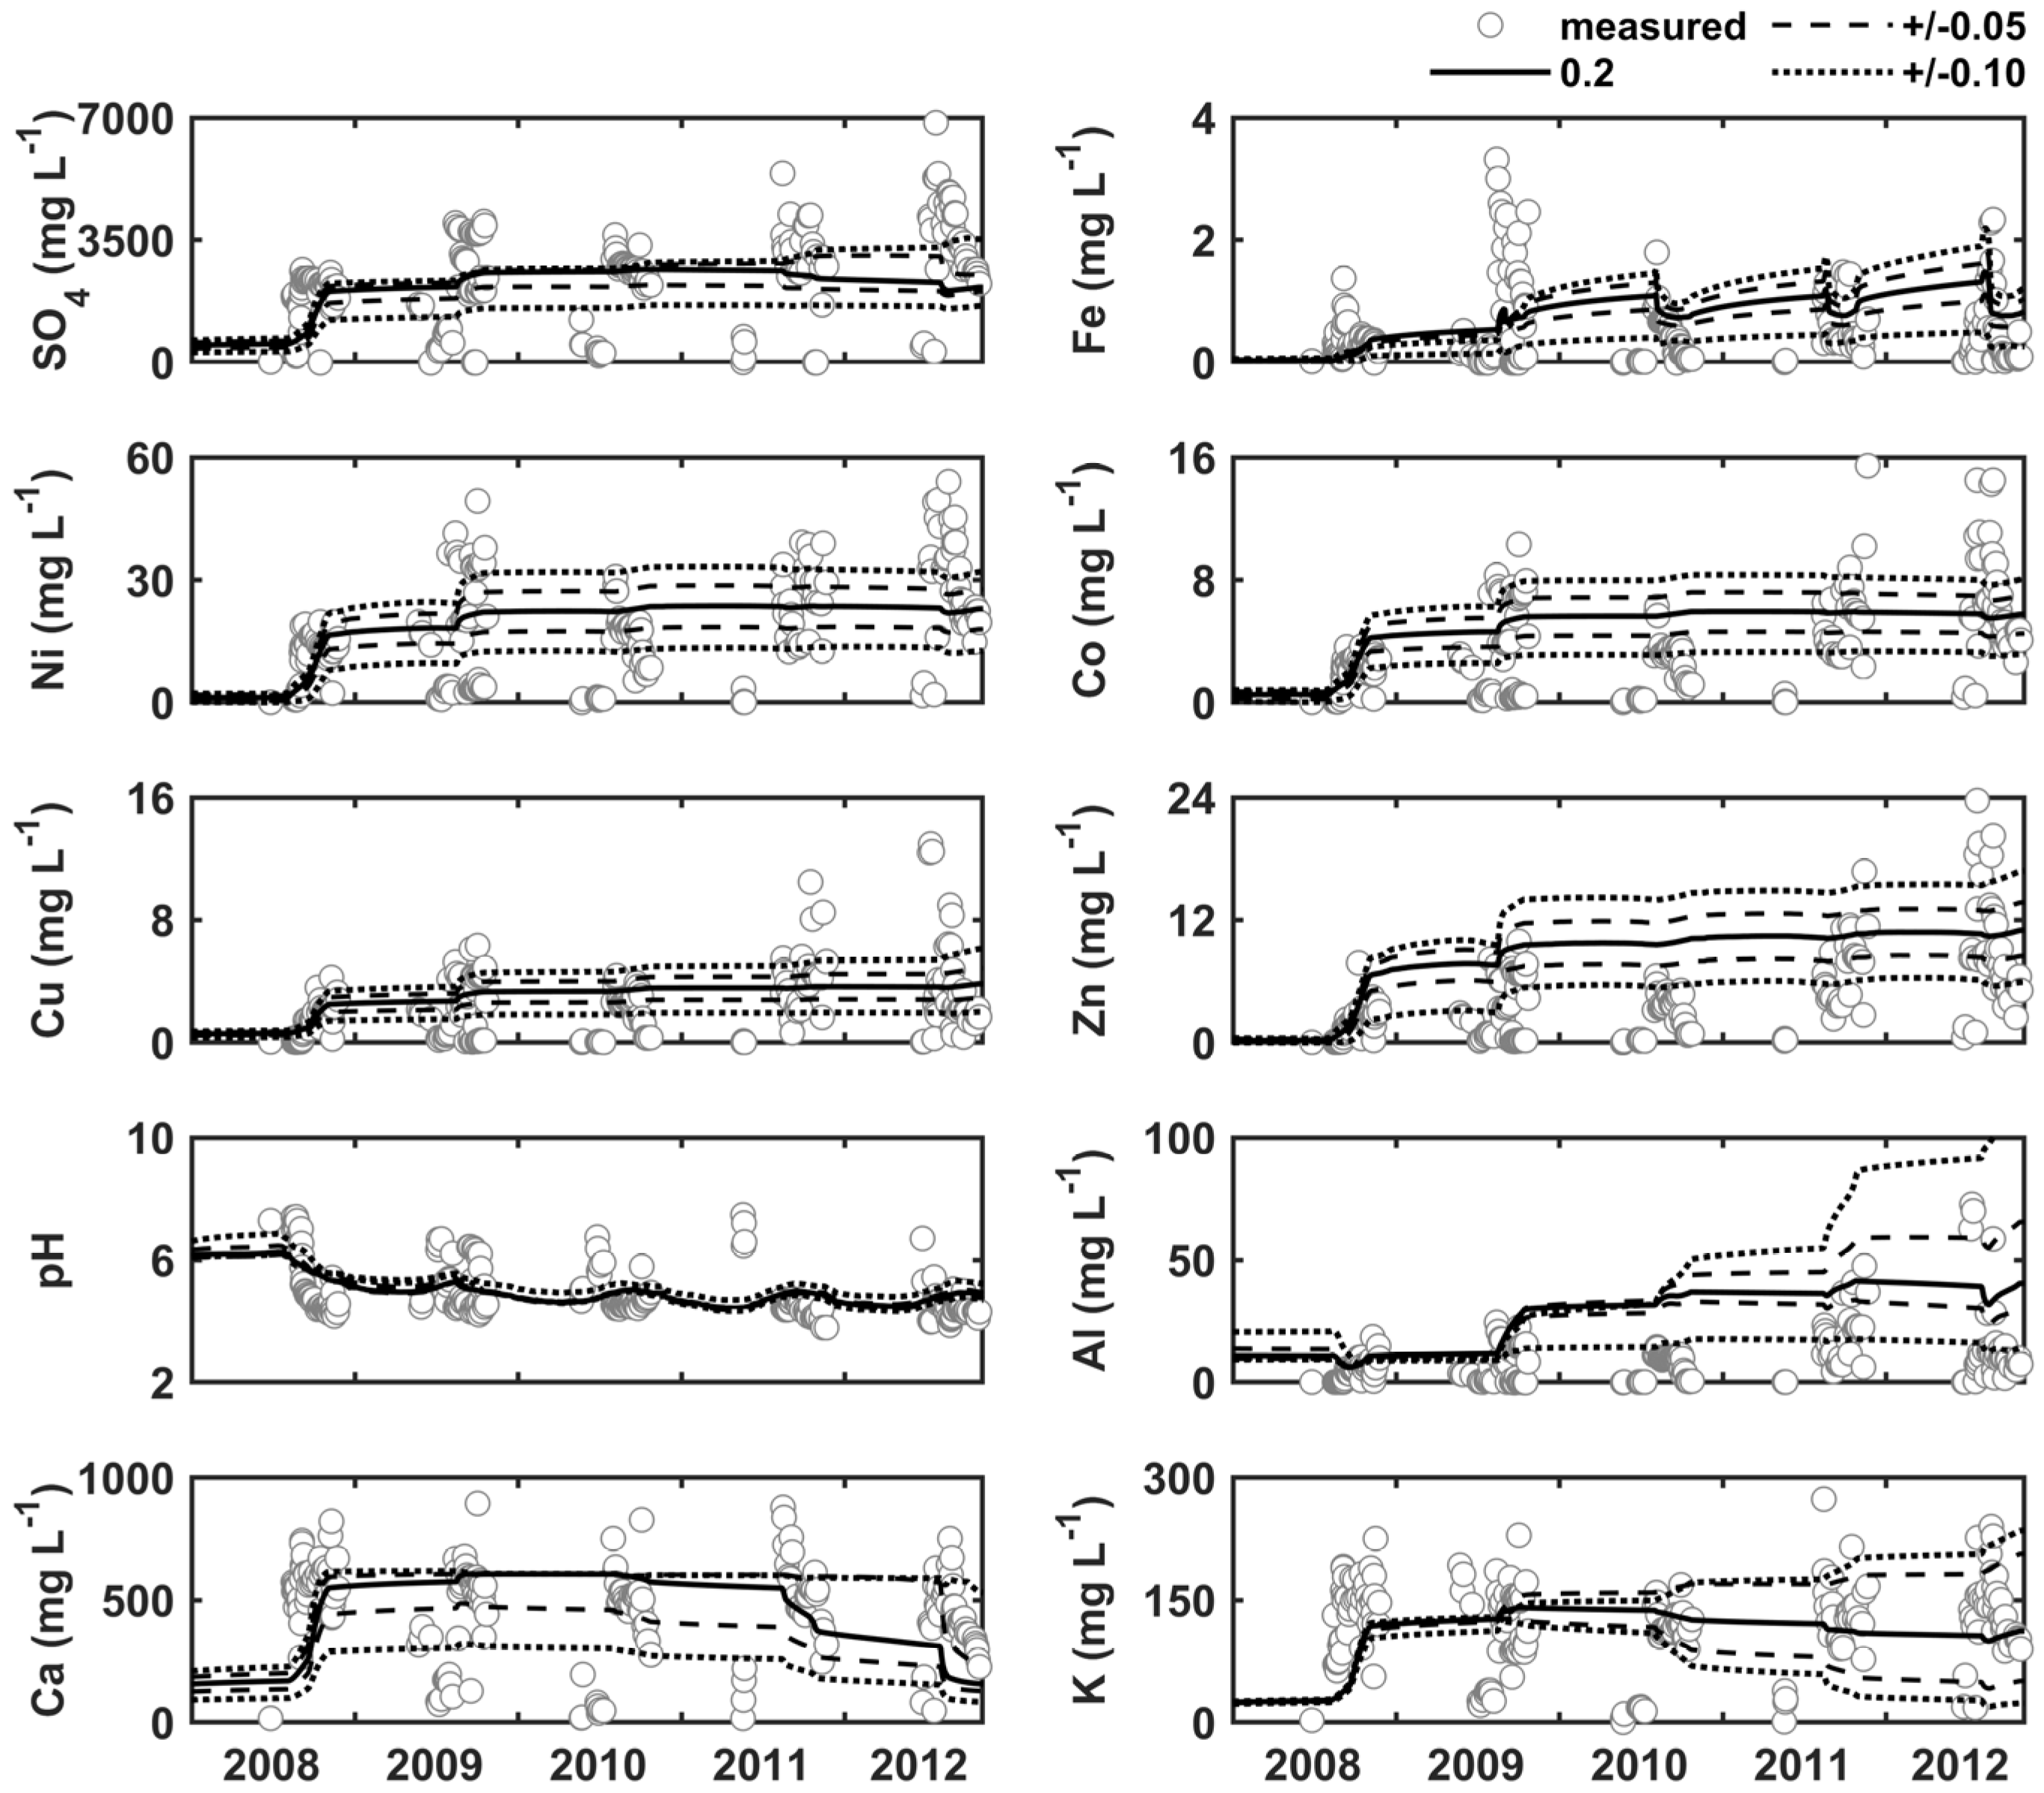
3.1. Calculation of Hydraulic Conductivity
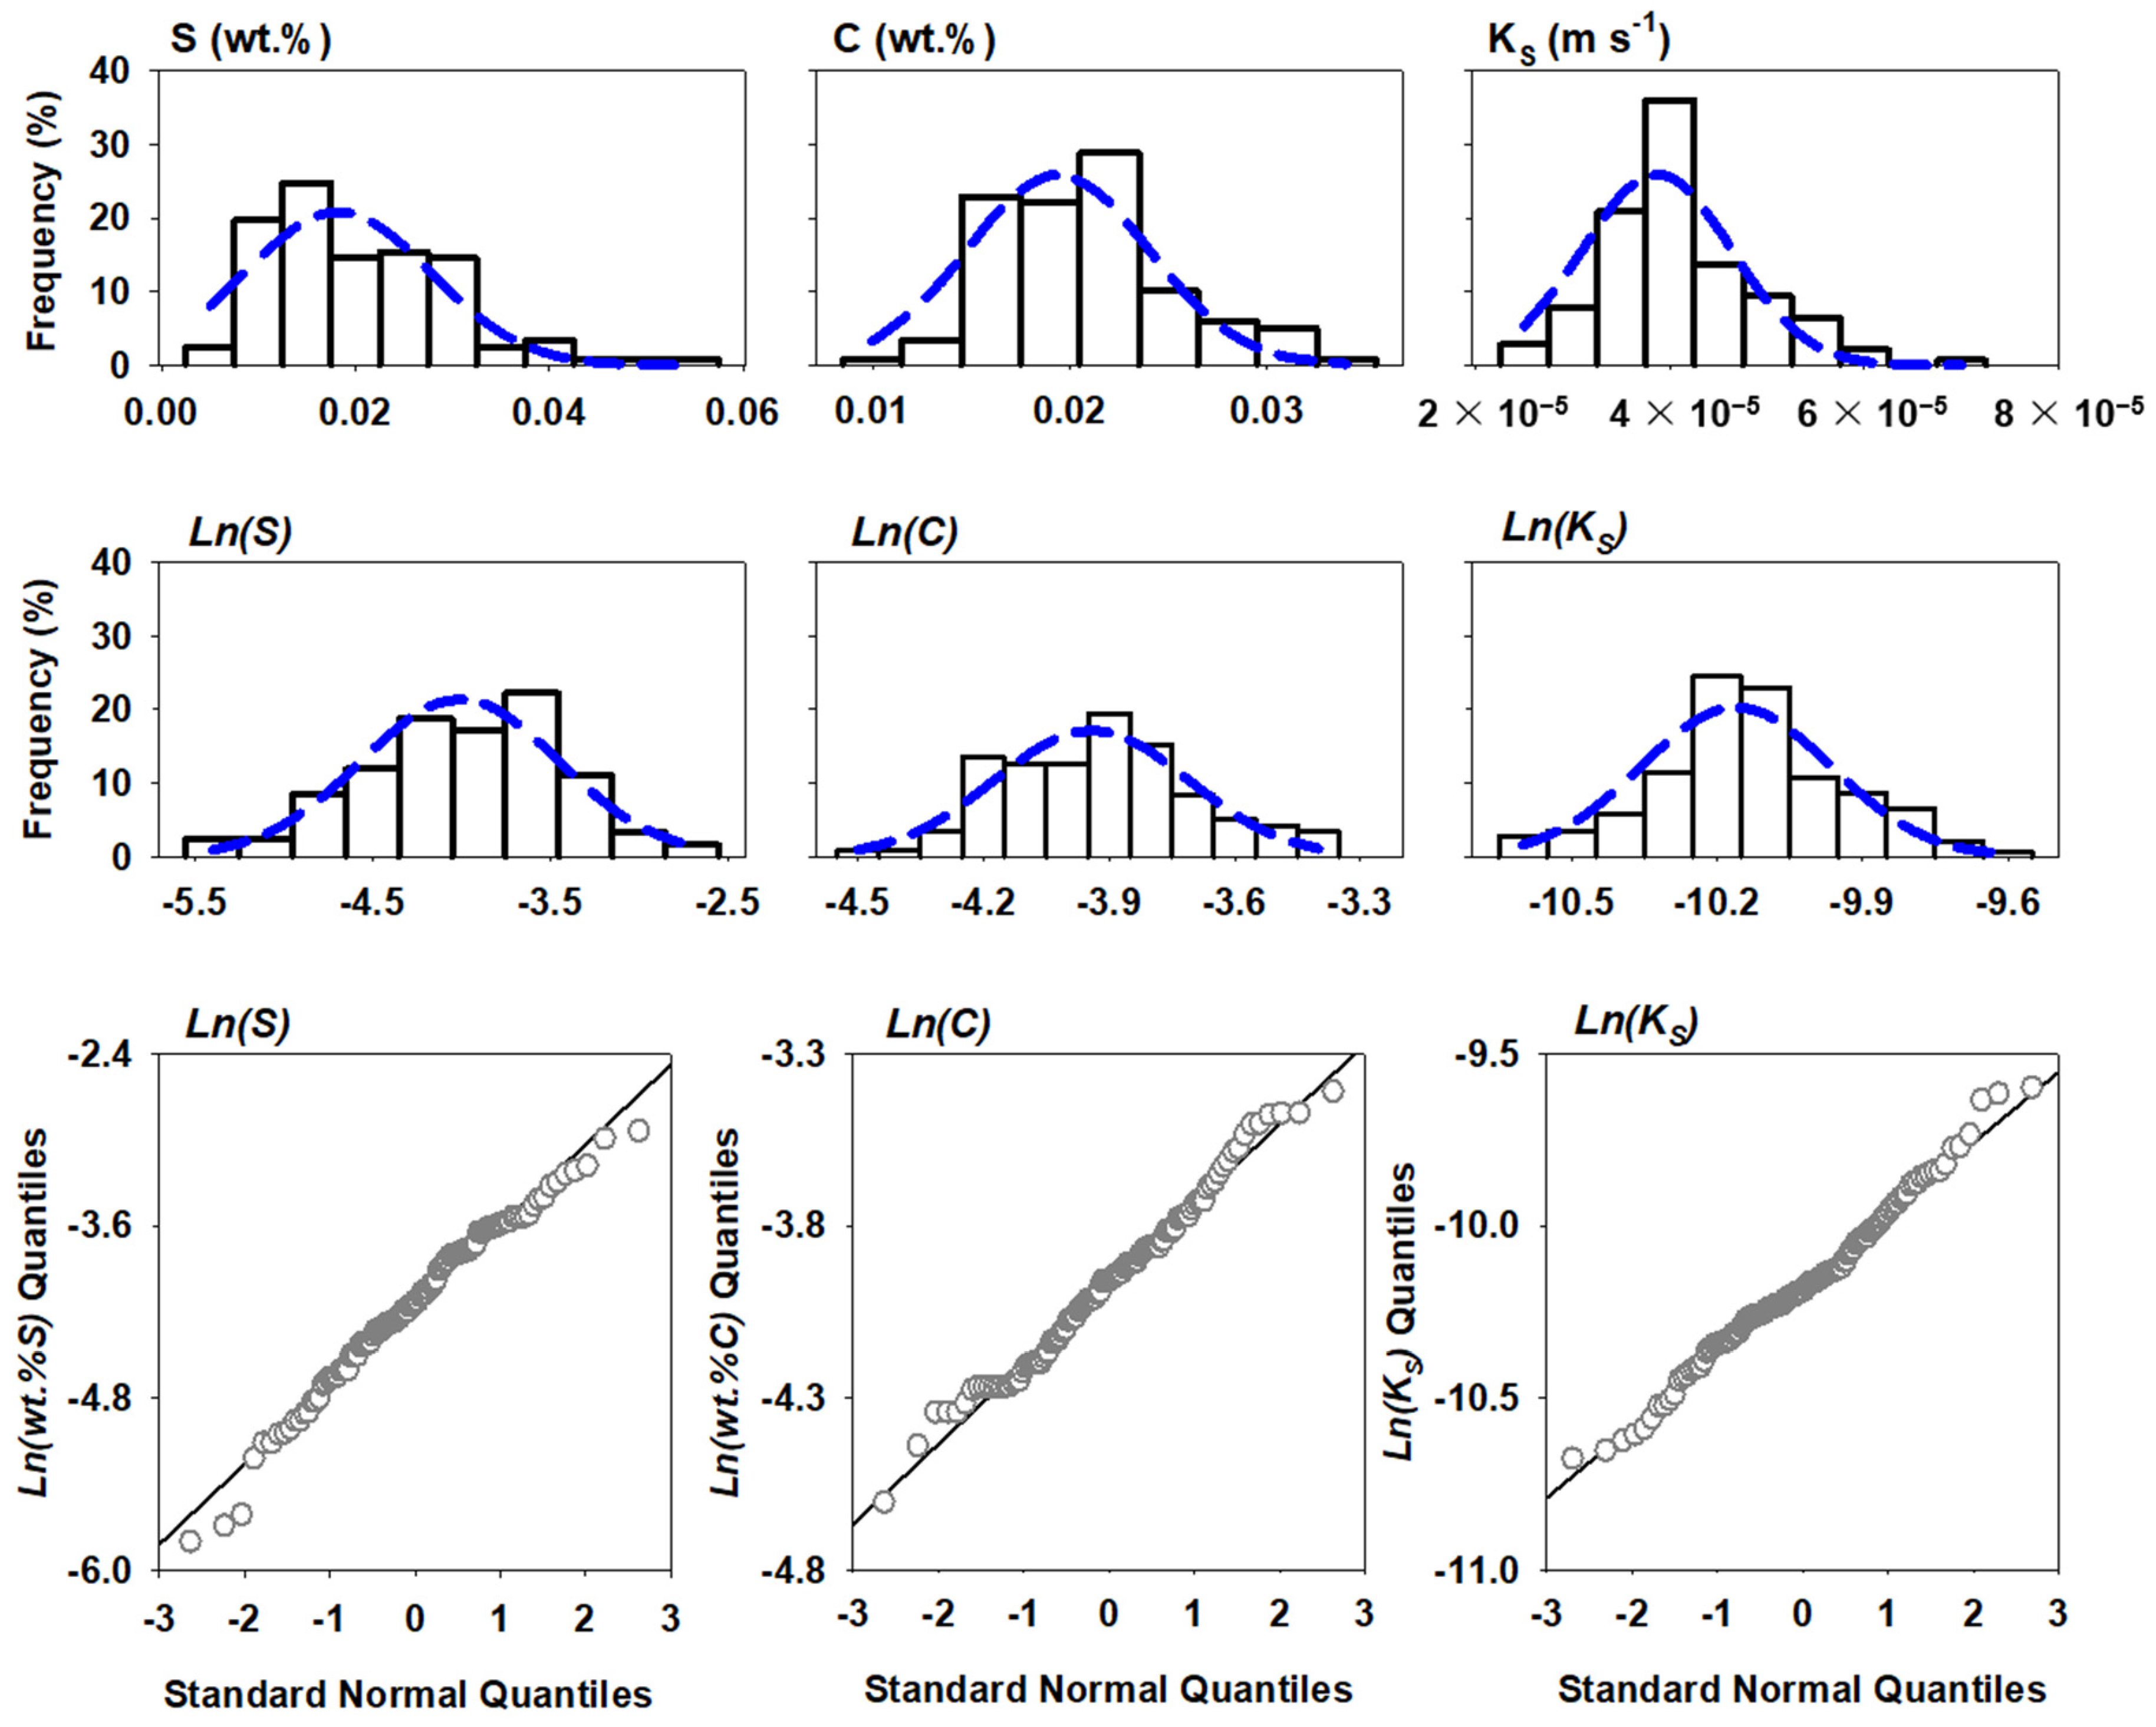
3.2. Statistical Distribution
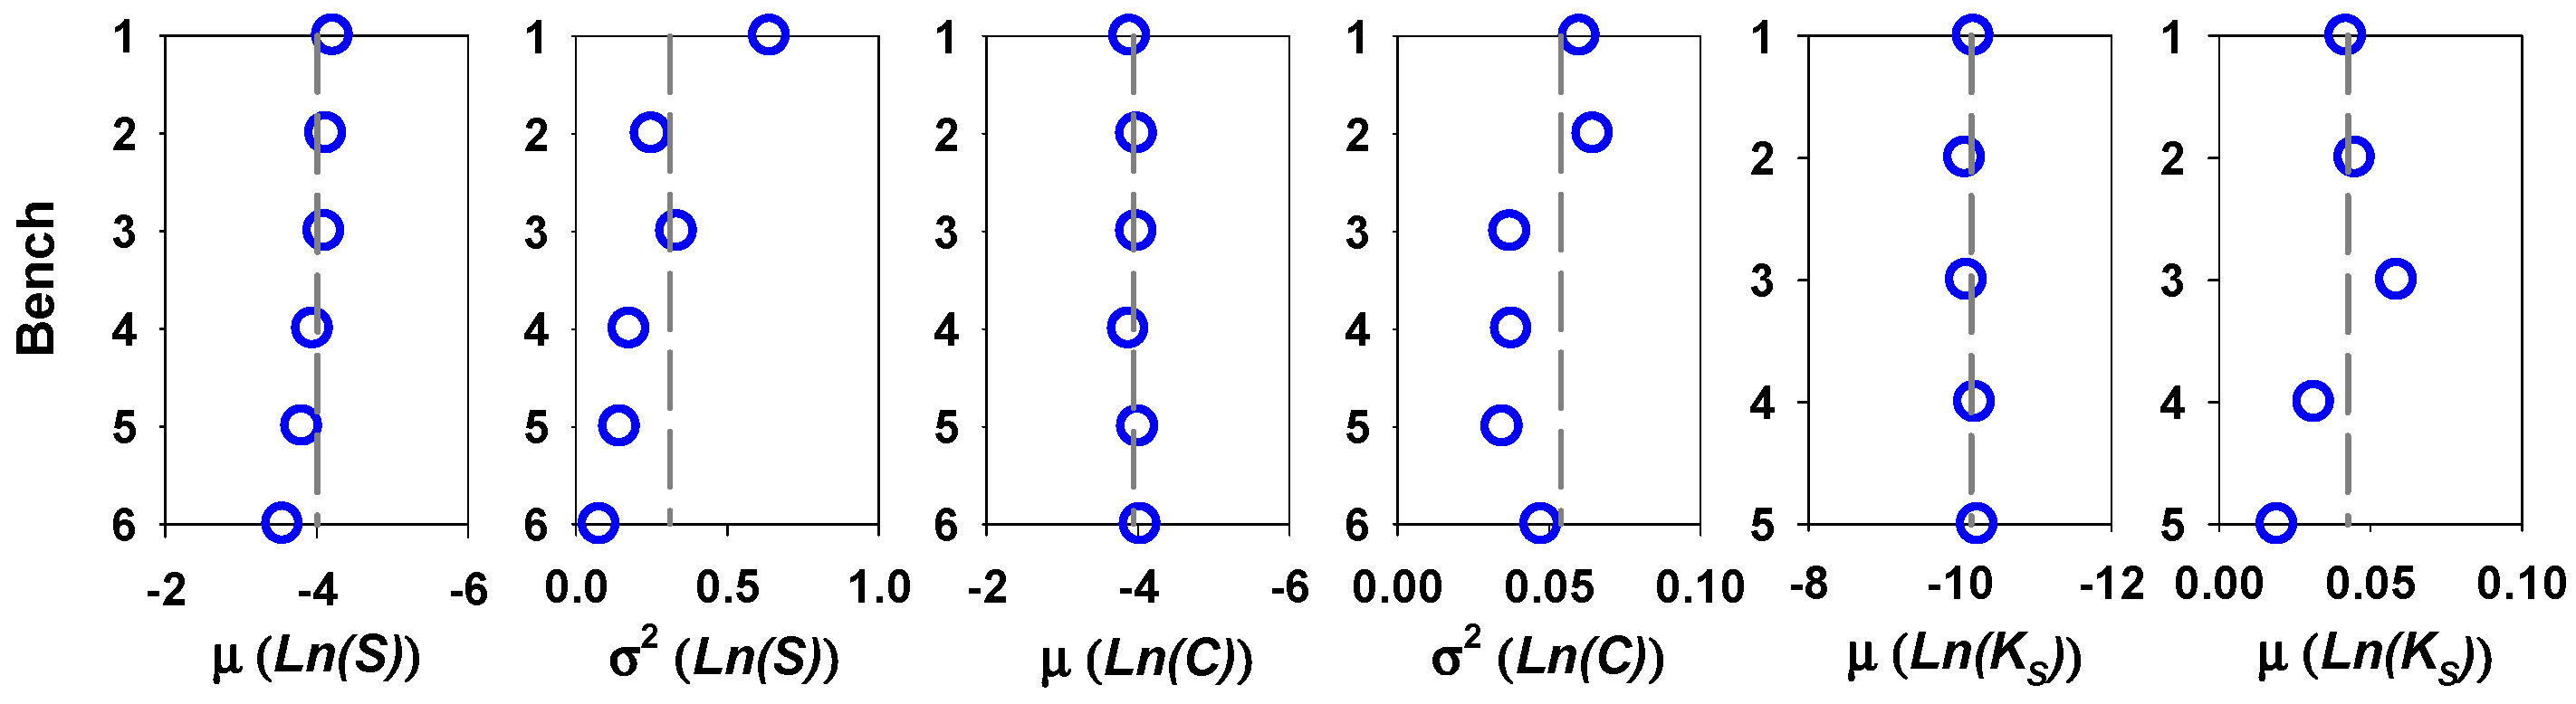
3.3. Stationarity
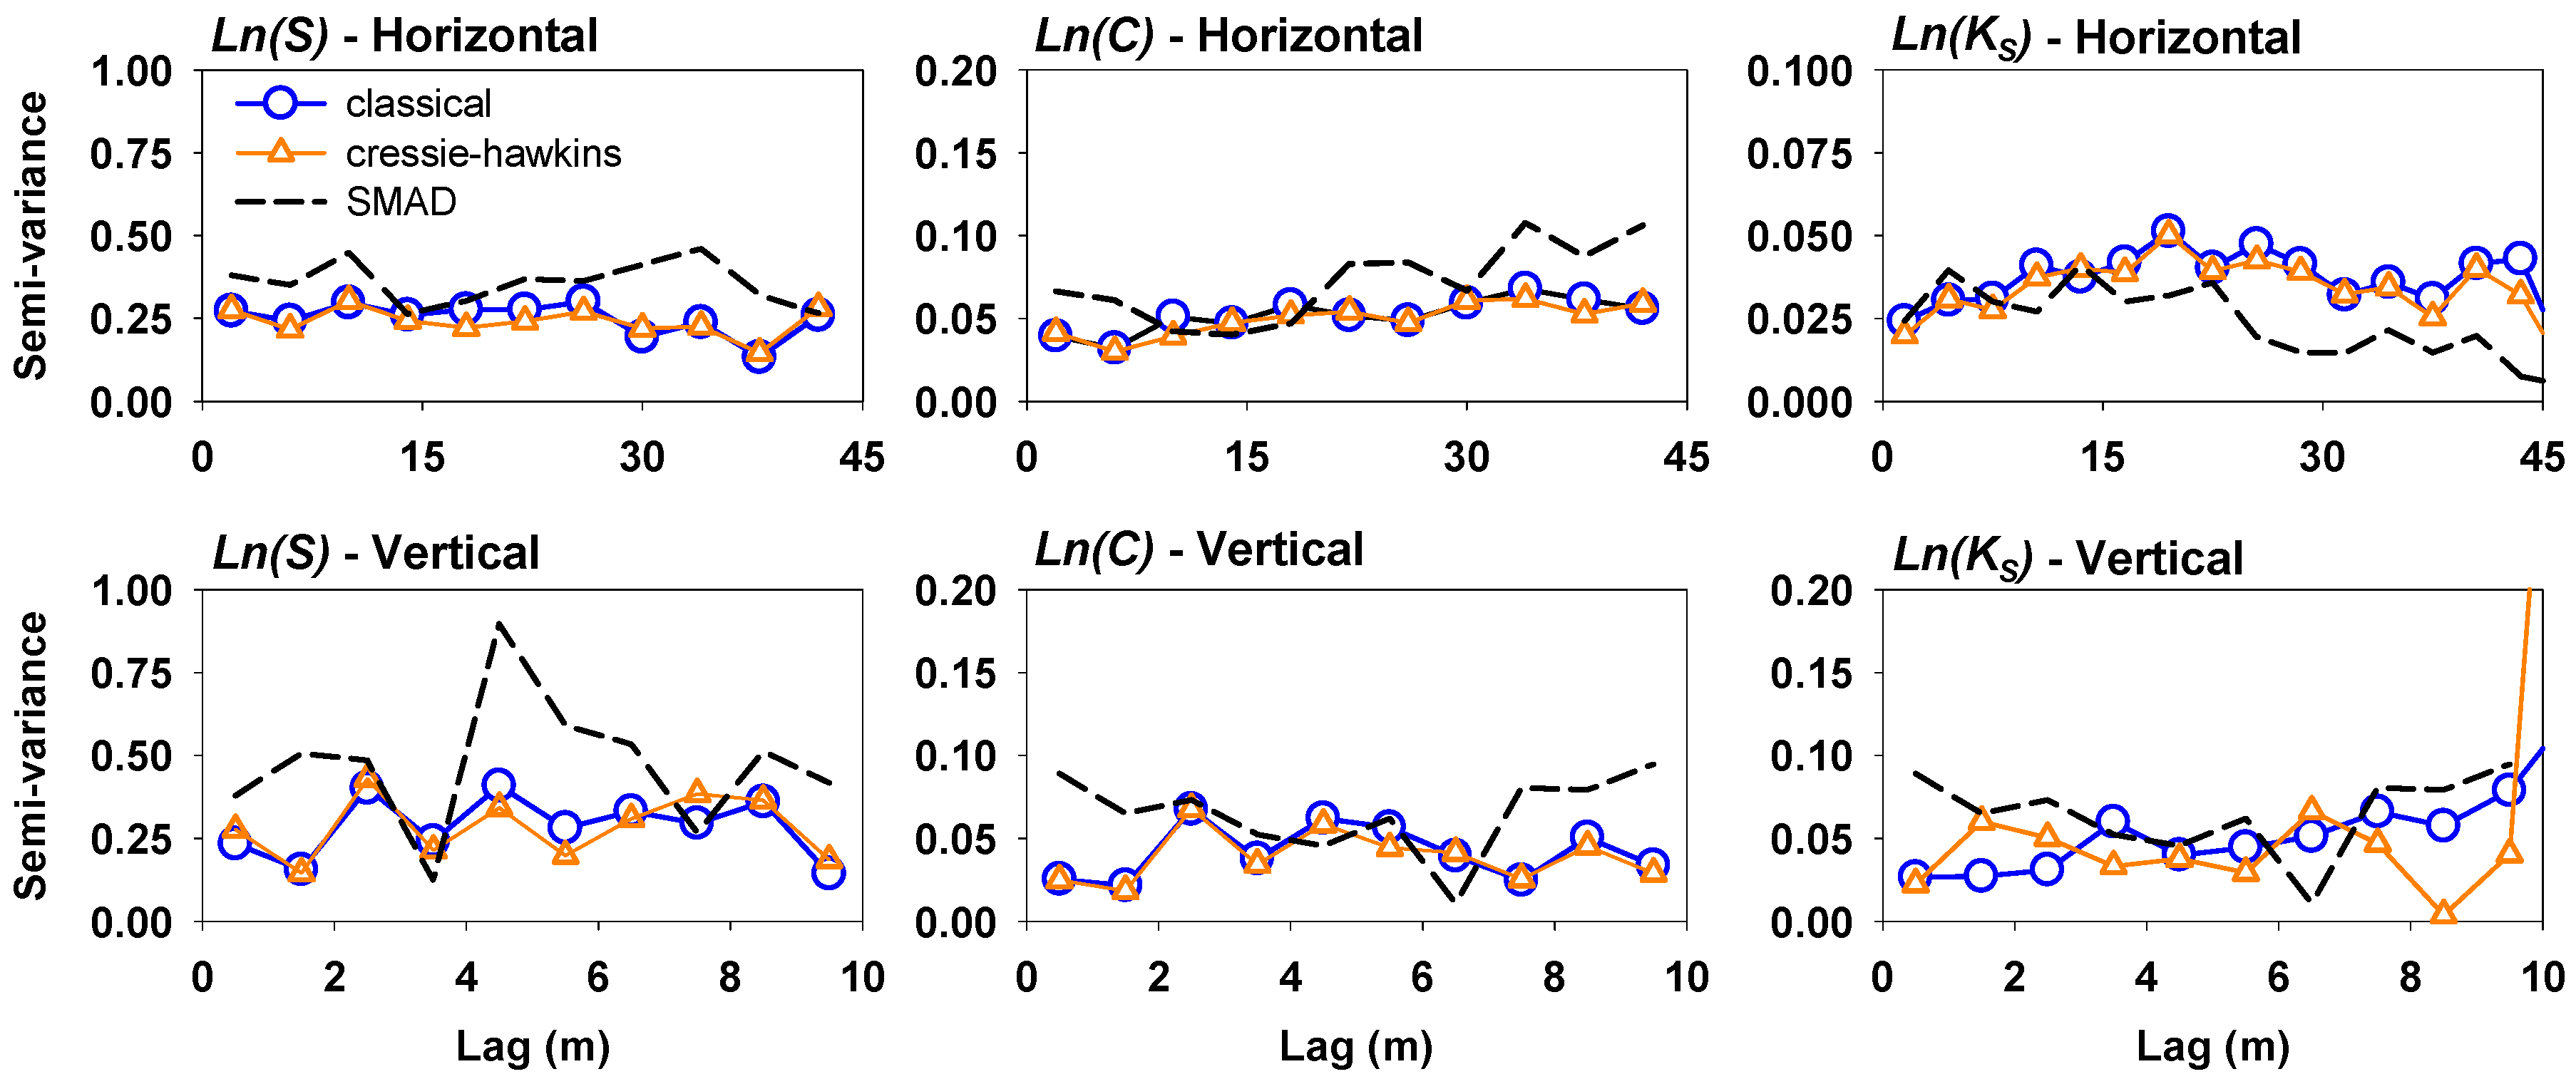
3.4. Experimental Semi-Variogram Estimation
3.5. Theoretical Semi-Variogram Fitting
3.6. Reactive Transport Simulations
4. Discussion
4.1. Statistical Comparison of Construction Samples
4.2. Theoretical Semi-Variogram Fitting
4.3. Reactive Transport Simulations
5. Conclusions
Author Contributions
Funding
Data Availability Statement
Acknowledgments
Conflicts of Interest
References
- Rankin, W.J. Minerals, Metals and Sustainability: Meeting Future Materials Needs; CSRIO Publishing: Melbourne, Australia, 2011; p. 441. [Google Scholar]
- Wunderly, M.D.; Frind, E.O.; Blowes, D.W.; Ptacek, C.J. Sulfide mineral oxidation and subsequent reactive transport of oxidation products in mine tailings impoundments: A numerical model. Water Resour. Res. 1996, 32, 3173–3187. [Google Scholar] [CrossRef]
- Bain, J.; Mayer, K.; Blowes, D.; Frind, E.; Molson, J.; Kahnt, R.; Jenk, U. Modelling the closure-related geochemical evolution of groundwater at a former uranium mine. J. Contam. Hydrol. 2001, 52, 109–135. [Google Scholar] [CrossRef]
- Jurjovec, J.; Blowes, D.W.; Ptacek, C.J.; Mayer, K.U. Multicomponent reactive transport modeling of acid neutralization reactions in mine tailings. Water Resour. Res. 2004, 40, W11202. [Google Scholar] [CrossRef] [Green Version]
- Andrina, J.; Wilson, G.W.; Miller, S.; Neale, A. Performance of the acid rock drainage mitigation waste rock trial dump at Grasberg mine. In Proceedings of the Seventh International Conference on Acid Rock Drainage, St. Louis, MO, USA, 26–30 March 2006. [Google Scholar]
- Brookfield, A.E.; Blowes, D.W.; Mayer, K.U. Integration of field measurements and reactive transport modelling to evaluate contaminant transport at a sulfide mine tailings impoundment. J. Contam. Hydrol. 2006, 88, 1–22. [Google Scholar] [CrossRef] [PubMed]
- Demers, I.; Molson, J.; Bussiere, B.; Laflamme, D. Numerical modeling of contaminated neutral mine drainage from a waste-rock field test cell. Appl. Geochem. 2013, 33, 346–356. [Google Scholar] [CrossRef]
- Fala, O.; Molson, J.; Aubertin, M.; Dawood, I.; Bussiere, B.; Chapuis, R.P. A numerical modelling approach to assess long-term unsaturated flow and geochemical transport in a waste rock pile. J. Min. Reclam. Environ. 2013, 27, 38–55. [Google Scholar] [CrossRef]
- Stockwell, J.; Smith, L.; Jambor, J.L.; Beckie, R. The relationship between fluid flow and mineral weathering in heterogeneous unsaturated porous media: A physical and geochemical characterization of a waste-rock pile. Appl. Geochem. 2006, 21, 1347–1361. [Google Scholar] [CrossRef]
- Khalil, A.; Hanich, L.; Bannari, A.; Zouhri, L.; Pourret, O.; Hakkou, R. Assessment of soil contamination around an abandoned mine in a semi-arid environment using geochemistry and geostatistics: Pre-work of geochemical process modeling with numerical models. J. Geochem. Explor. 2013, 125, 117–129. [Google Scholar] [CrossRef]
- Marescotti, P.; Azzali, E.; Servida, D.; Carbone, C.; Grieco, G.; De Capitani, L.; Lucchetti, G. Mineralogical and geochemical spatial analyses of a waste-rock dump at the Libiola Fe-Cu sulphide mine (Eastern Liguria, Italy). Environ. Earth Sci. 2010, 61, 187–199. [Google Scholar] [CrossRef]
- Blannin, R.; Frenzel, M.; Tolosana-Delgado, R.; Gutzmer, J. Towards a sampling protocol for the resource assessment of critical raw materials in tailings storage facilities. J. Geochem. Explor. 2022, 236, 106974. [Google Scholar] [CrossRef]
- Smith, L.J.D.; Moncur, M.C.; Neuner, M.; Gupton, M.; Blowes, D.W.; Smith, L.; Sego, D.C. The diavik waste rock project: Design, construction, and instrumentation of field-scale experimental waste-rock piles. Appl. Geochem. 2013, 36, 187–199. [Google Scholar] [CrossRef]
- Blowes, D.W.; Logsdon, M.J. Diavik Geochemistry Baseline Report; Canadian Environmental Assessment Agency: Ottawa, ON, Canada, 1998; p. 121. [Google Scholar]
- Langman, J.B.; Moore, M.L.; Ptacek, C.J.; Smith, L.; Sego, D.; Blowes, D.W. Diavik waste rock project: Evolution of mineral weathering, element release, and acid generation and neutralization during a 5-year humidity cell experiment. Minerals 2014, 4, 257–278. [Google Scholar] [CrossRef] [Green Version]
- Jambor, J.L. Mineralogy of the Diavik Lac de Gras Kimberlites and Host Rocks; Canadian Environmental Assessment Agency: Ottawa, ON, Canada, 1997; p. 187. [Google Scholar]
- Atherton, C. An Investigation of Heterogeneity and the Impact of Acidic Regions on Bulk Effluent from a Deconstructed Low Sulfide Waste-Rock Pile. Master’s Thesis, University of Waterloo, Waterloo, ON, Canada, 2017; p. 108. [Google Scholar]
- Sinclair, S.A.; Pham, N.; Amos, R.T.; Sego, D.C.; Smith, L.; Blowes, D.W. Influence of freeze–thaw dynamics on internal geochemical evolution of low sulfide waste rock. Appl. Geochem. 2015, 61, 160–174. [Google Scholar] [CrossRef]
- Bailey, B.L. Geochemical and Microbiological Characterization of Effluent and Pore Water from Low-Sulfide Content Waste Rock. Ph.D. Thesis, University of Waterloo, Waterloo, ON, Canada, 2013; p. 399. [Google Scholar]
- Smith, L.J.D.; Blowes, D.W.; Jambor, J.L.; Smith, L.; Sego, D.C.; Neuner, M. The diavik waste rock project: Particle size distribution and sulfur characteristics of low-sulfide waste rock. Appl. Geochem. 2013, 36, 200–209. [Google Scholar] [CrossRef]
- Smith, L.J.D.; Bailey, B.L.; Blowes, D.W.; Jambor, J.L.; Smith, L.; Sego, D.C. The diavik waste rock project: Initial geochemical response from a low sulfide waste rock pile. Appl. Geochem. 2013, 36, 210–221. [Google Scholar] [CrossRef]
- Amos, R.T.; Blowes, D.W.; Smith, L.; Sego, D.C. Measurement of wind-induced pressure gradients in a waste rock pile. Vadose Zone J. 2009, 8, 953–962. [Google Scholar] [CrossRef]
- Chi, X.; Amos, R.T.; Stastna, M.; Blowes, D.W.; Sego, D.C.; Smith, L. The diavik waste rock project: Implications of wind-induced gas transport. Appl. Geochem. 2013, 36, 246–255. [Google Scholar] [CrossRef]
- Pham, N.; Sego, D.C.; Arenson, L.U.; Blowes, D.W.; Amos, R.T.; Smith, L. The diavik waste rock project: Measurement of the thermal regime of a waste-rock test pile in a permafrost environment. Appl. Geochem. 2013, 36, 234–245. [Google Scholar] [CrossRef]
- Neuner, M.; Smith, L.; Blowes, D.W.; Sego, D.C.; Smith, L.J.D.; Fretz, N.; Gupton, M. The diavik waste rock project: Water flow though waste rock in a permafrost terrain. Appl. Geochem. 2013, 36, 222–233. [Google Scholar] [CrossRef]
- Bailey, B.L.; Blowes, D.W.; Smith, L.; Sego, D.C. The diavik waste rock project: Geochemical and microbiological characterization of drainage from low-sulfide waste rock: Active zone field experiments. Appl. Geochem. 2015, 62, 18–34. [Google Scholar] [CrossRef]
- Bailey, B.L.; Blowes, D.W.; Smith, L.; Sego, D.C. The diavik waste rock project: Geochemical and microbiological characterization of low sulfide content large-scale waste rock test piles. Appl. Geochem. 2016, 65, 54–72. [Google Scholar] [CrossRef]
- Bailey, B.L.; Smith, L.J.D.; Blowes, D.W.; Ptacek, C.J.; Smith, L.; Sego, D.C. The diavik waste rock project: Persistence of contaminants from blasting agents in waste rock effluent. Appl. Geochem. 2013, 36, 256–270. [Google Scholar] [CrossRef]
- Langman, J.B.; Blowes, D.W.; Veeramani, H.; Wilson, D.; Smith, L.; Sego, D.C.; Paktunc, D. The mineral and aqueous phase evolution of sulfur and nickel with weathering of pyrrhotite in a low sulfide, granitic waste rock. Chem. Geol. 2015, 401, 169–179. [Google Scholar] [CrossRef] [Green Version]
- Langman, J.B.; Blowes, D.W.; Sinclair, S.A.; Krentz, A.; Amos, R.T.; Smith, L.J.D.; Pham, H.N.; Sego, D.C.; Smith, L. Early evolution of weathering and sulfide depletion of a low-sulfur, granitic, waste rock in an Arctic climate: A laboratory and field site comparison. J. Geochem. Explor. 2015, 156, 61–71. [Google Scholar] [CrossRef]
- Wilson, D.; Amos, R.T.; Blowes, D.W.; Langman, J.B.; Ptacek, C.J.; Smith, L.; Sego, D.C. Diavik waste rock project: A conceptual model for temperature and sulfide-content dependent geochemical evolution of waste rock—Laboratory scale. Appl. Geochem. 2018, 89, 160–172. [Google Scholar] [CrossRef]
- Wilson, D.; Amos, R.T.; Blowes, D.W.; Langman, J.B.; Smith, L.; Sego, D.C. The diavik waste rock project: Scale-up of a reactive transport model for temperature and sulfide-content dependent geochemical evolution of waste rock. Appl. Geochem. 2018, 96, 177–190. [Google Scholar] [CrossRef]
- Barsi, D.R.; Beier, N.A.; Sego, D.C.; Atherton, C.; Blowes, D.W.; Smith, L.; Amos, R.T. Classifying variability of material properties in mine waste rock. CIM J. 2019, 10, 77–93. [Google Scholar] [CrossRef]
- Hazen, A. Some physical properties of sand and gravel: With special reference to their use in filtration. In Massachusetts State Board of Health 24th Annual Report; Publication No. 34; 1892; pp. 539–556. [Google Scholar]
- Schlichter, C.S. Field Measurements of the Rate of Movement of Underground Waters; U.S. Geol. Surv. Water Supply Paper 140; United States Government Printing Office: Washington, DC, USA, 1905.
- Terzaghi, K. Erdbaumechanik Auf Bodenphysikalischer Grundlage; Franz Deuticke: Wien, Australia, 1925. [Google Scholar]
- Chapuis, R.P. Predicting the saturated hydraulic conductivity of sand and gravel using effective diameter and void ratio. Can. Geotech. J. 2004, 41, 787–795. [Google Scholar] [CrossRef]
- Carman, P.C. Fluid flow through granular beds. Trans. Inst. Chem. Eng. Lond. 1937, 15, 168–188. [Google Scholar] [CrossRef]
- Matheron, G. Principles of geostatistics. Econ. Geol. 1963, 58, 1246–1266. [Google Scholar] [CrossRef]
- Cressie, N.; Hawkins, D. Robust estimation of the variogram. Math. Geol. 1980, 12, 115–125. [Google Scholar] [CrossRef]
- Dowd, P.A. The variogram and kriging: Robust and resistant estimators. In Geostatistics for Natural Resources Characterization, Part 1; NATO ASI Series, Ser. C: 122, 91.107; Springer Nature BV: Dordrecht, The Netherlands, 1984. [Google Scholar]
- Webster, R.; Oliver, M.A. Geostatistics for Environmental Scientists; John Wiley & Sons: New York, NY, USA, 2001; p. 271. [Google Scholar]
- Mayer, K.U.; Frind, E.O.; Blowes, D.W. Multicomponent reactive transport modeling in variably saturated porous media using a generalized formulation for kinetically controlled reactions. Water Resour. Res. 2002, 38, 13-1–13-21. [Google Scholar] [CrossRef]
- Woodbury, A.D.; Sudicky, E.A. The geostatistical characteristics of the Borden aquifer. Water Resour. Res. 1991, 27, 533–546. [Google Scholar] [CrossRef]
- Turcke, M.A.; Kueper, B.H. Geostatistical analysis of the Borden aquifer hydraulic conductivity field. J. Hydrol. 1996, 178, 223–240. [Google Scholar] [CrossRef]
- Sudicky, E.A.; Illman, W.A.; Goltz, I.K.; Adams, J.J.; McLaren, R.G. Heterogeneity in hydraulic conductivity and its role on the macroscale transport of a solute plume: From measurements to a practical application of stochastic flow and transport theory. Water Resour. Res. 2010, 46, W01508. [Google Scholar] [CrossRef]
- Sudicky, E.A. A natural gradient experiment on solute transport in a sand aquifer: Spatial variability of hydraulic conductivity and its role in the dispersion process. Water Resour. Res. 1986, 22, 2069–2082. [Google Scholar] [CrossRef]
- Limpert, E.; Stahel, W.A.; Abbt, M. Log-normal distributions across the sciences: Keys and clues. BioScience 2001, 51, 341–352. [Google Scholar] [CrossRef]
- Smith, L.; Beckie, R. Hydrological and geochemical transport processes in mine waste rock. In Environmental Aspects of Mine Wastes, Short Course; Mineralogical Association of Canada: Quebec City, QC, Canada, 2003; Volume 31, pp. 51–72. [Google Scholar]
- Anterrieu, O.; Chouteau, M.; Aubertin, M. Geophysical characterization of the large-scale internal structure of a waste rock pile from a hard rock mine. Bull Eng. Geol. Environ. 2010, 69, 533–548. [Google Scholar] [CrossRef]
- Strömberg, B.; Banwart, S. Weathering kinetics of waste rock from the Aitik copper mine, Sweden: Scale dependent rate factors and pH controls in large column experiments. J. Contam. Hydrol. 1999, 39, 59–89. [Google Scholar] [CrossRef]
- Nichol, C.; Smith, L.; Beckie, R. Field-scale experiments of unsaturated flow and solute transport in a heterogeneous porous medium. Water Resour. Res. 2005, 41, W05018. [Google Scholar] [CrossRef]


| Parameter | Measured | Hazen | Schlichter | Terzaghi | Chapuis |
|---|---|---|---|---|---|
| geometric mean | 9 × 10⁻⁶ | 5 × 10⁻⁵ | 5 × 10⁻⁶ | 3 × 10⁻⁴ | 4 × 10⁻⁵ |
| standard deviation | 1 × 10⁻⁵ | 1 × 10⁻⁵ | 1 × 10⁻⁶ | 8 × 10⁻⁵ | 8 × 10⁻⁶ |
| minimum | 2 × 10⁻⁶ | 2 × 10⁻⁵ | 3 × 10⁻⁶ | 1 × 10⁻⁴ | 2 × 10⁻⁵ |
| maximum | 3 × 10⁻⁵ | 9 × 10⁻⁵ | 1 × 10⁻⁵ | 6 × 10⁻⁴ | 7 × 10⁻⁵ |
Publisher’s Note: MDPI stays neutral with regard to jurisdictional claims in published maps and institutional affiliations. |
© 2022 by the authors. Licensee MDPI, Basel, Switzerland. This article is an open access article distributed under the terms and conditions of the Creative Commons Attribution (CC BY) license (https://creativecommons.org/licenses/by/4.0/).
Share and Cite
Wilson, D.; Smith, L.; Atherton, C.; Smith, L.J.D.; Amos, R.T.; Barsi, D.R.; Sego, D.C.; Blowes, D.W. Diavik Waste Rock Project: Geostatistical Analysis of Sulfur, Carbon, and Hydraulic Conductivity Distribution in a Large-Scale Experimental Waste Rock Pile. Minerals 2022, 12, 577. https://doi.org/10.3390/min12050577
Wilson D, Smith L, Atherton C, Smith LJD, Amos RT, Barsi DR, Sego DC, Blowes DW. Diavik Waste Rock Project: Geostatistical Analysis of Sulfur, Carbon, and Hydraulic Conductivity Distribution in a Large-Scale Experimental Waste Rock Pile. Minerals. 2022; 12(5):577. https://doi.org/10.3390/min12050577
Chicago/Turabian StyleWilson, David, Leslie Smith, Colleen Atherton, Lianna J. D. Smith, Richard T. Amos, David R. Barsi, David C. Sego, and David W. Blowes. 2022. "Diavik Waste Rock Project: Geostatistical Analysis of Sulfur, Carbon, and Hydraulic Conductivity Distribution in a Large-Scale Experimental Waste Rock Pile" Minerals 12, no. 5: 577. https://doi.org/10.3390/min12050577