
Strong Coupling between Biomineral Morphology and Sr/Ca of Arctica islandica (Bivalvia)—Implications for Shell Sr/Ca-Based Temperature Estimates

 , , , ,
Abstract
:1. Introduction
2. Materials and Methods
2.1. Sample Material and Preparation
2.2. In-Situ Chemical Analysis (LA-ICP-MS)
2.3. Microstructure Morphometry
2.4. Temporal Alignment and Re-Sampling of the Shell Sr/Ca and BMU Data
2.5. Regression Analysis and Detrending of Shell Sr/Ca Data
3. Results
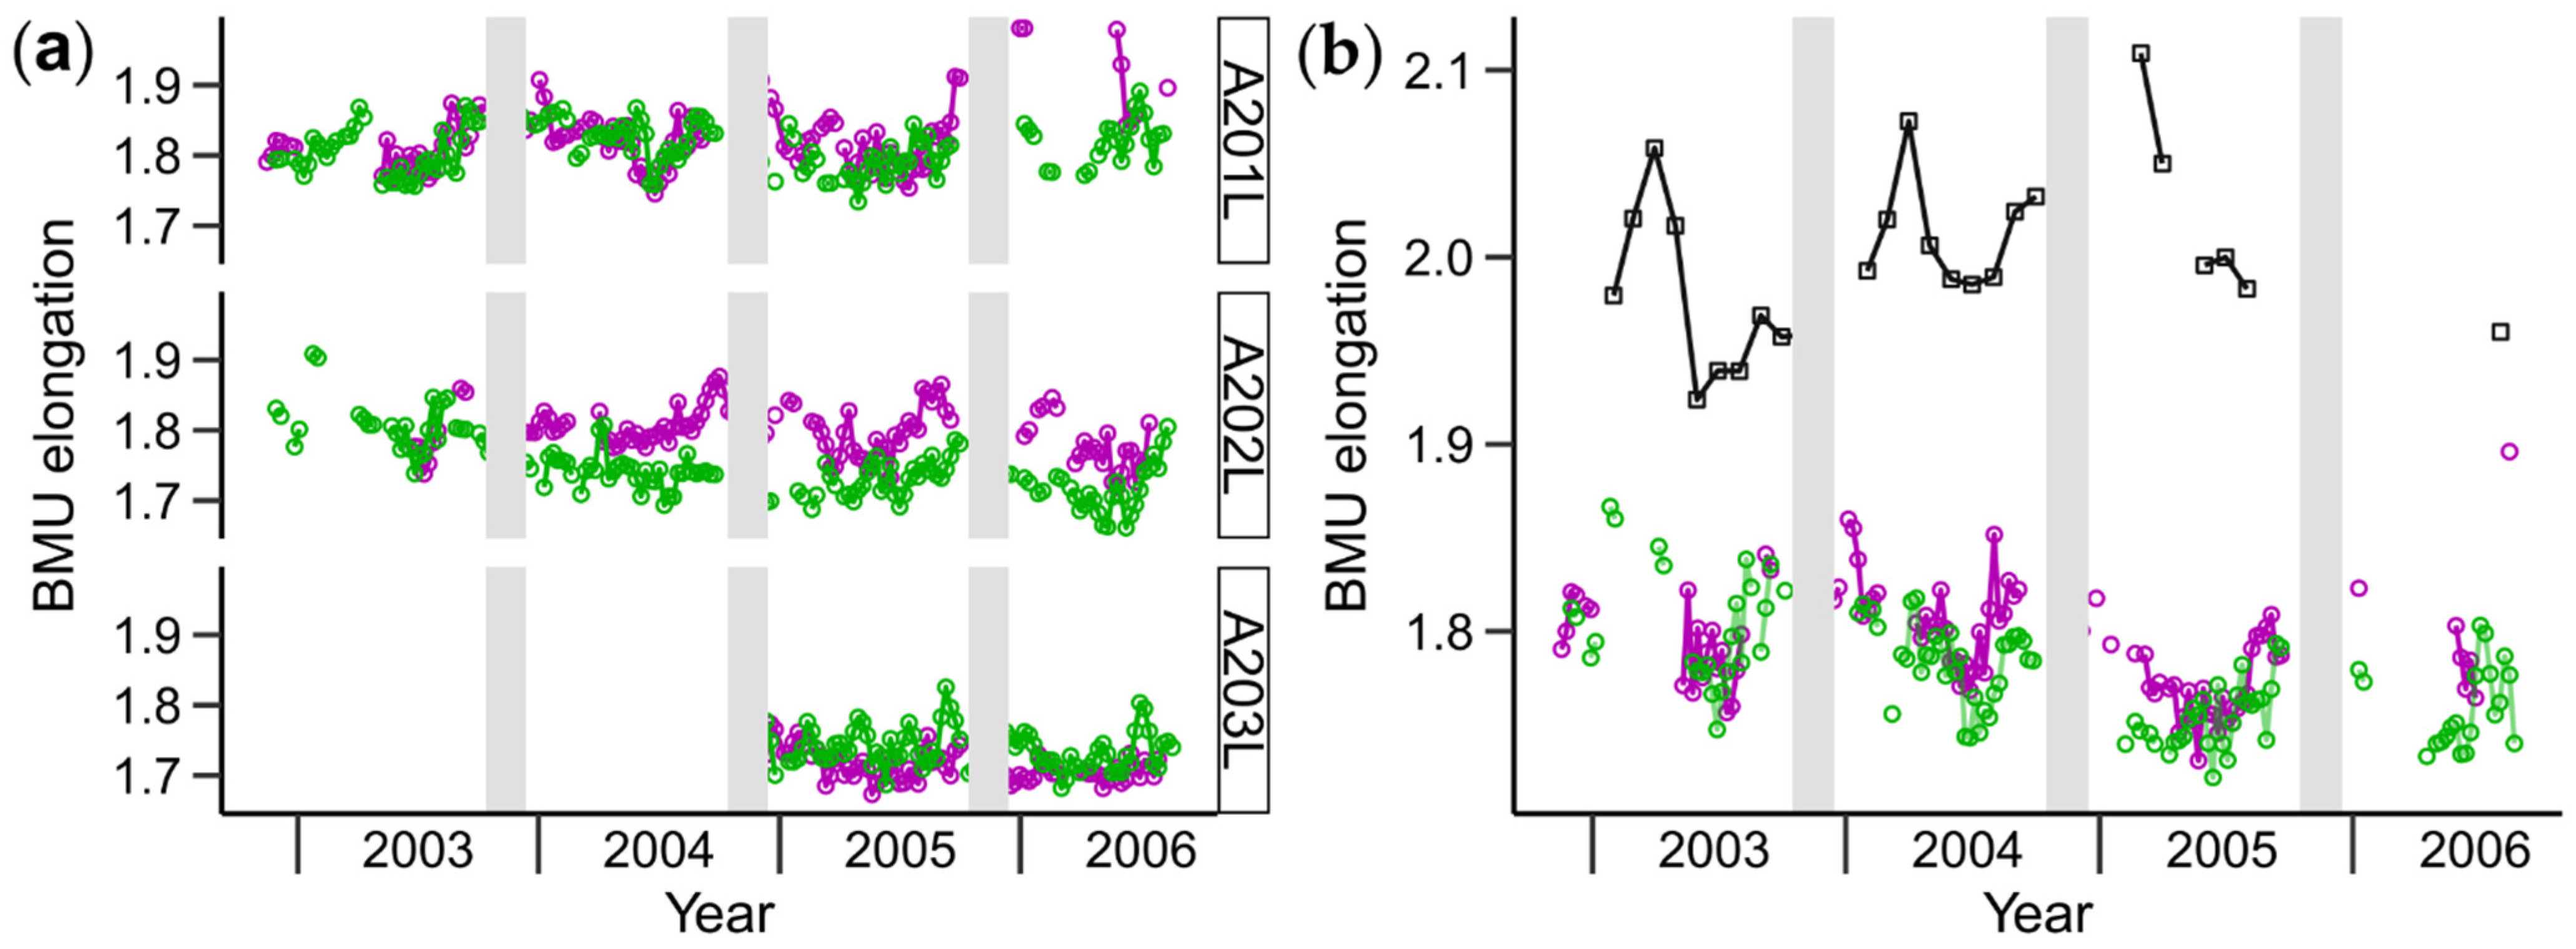
3.1. Shell Strontium-to-Calcium Ratios and BMU Morphology
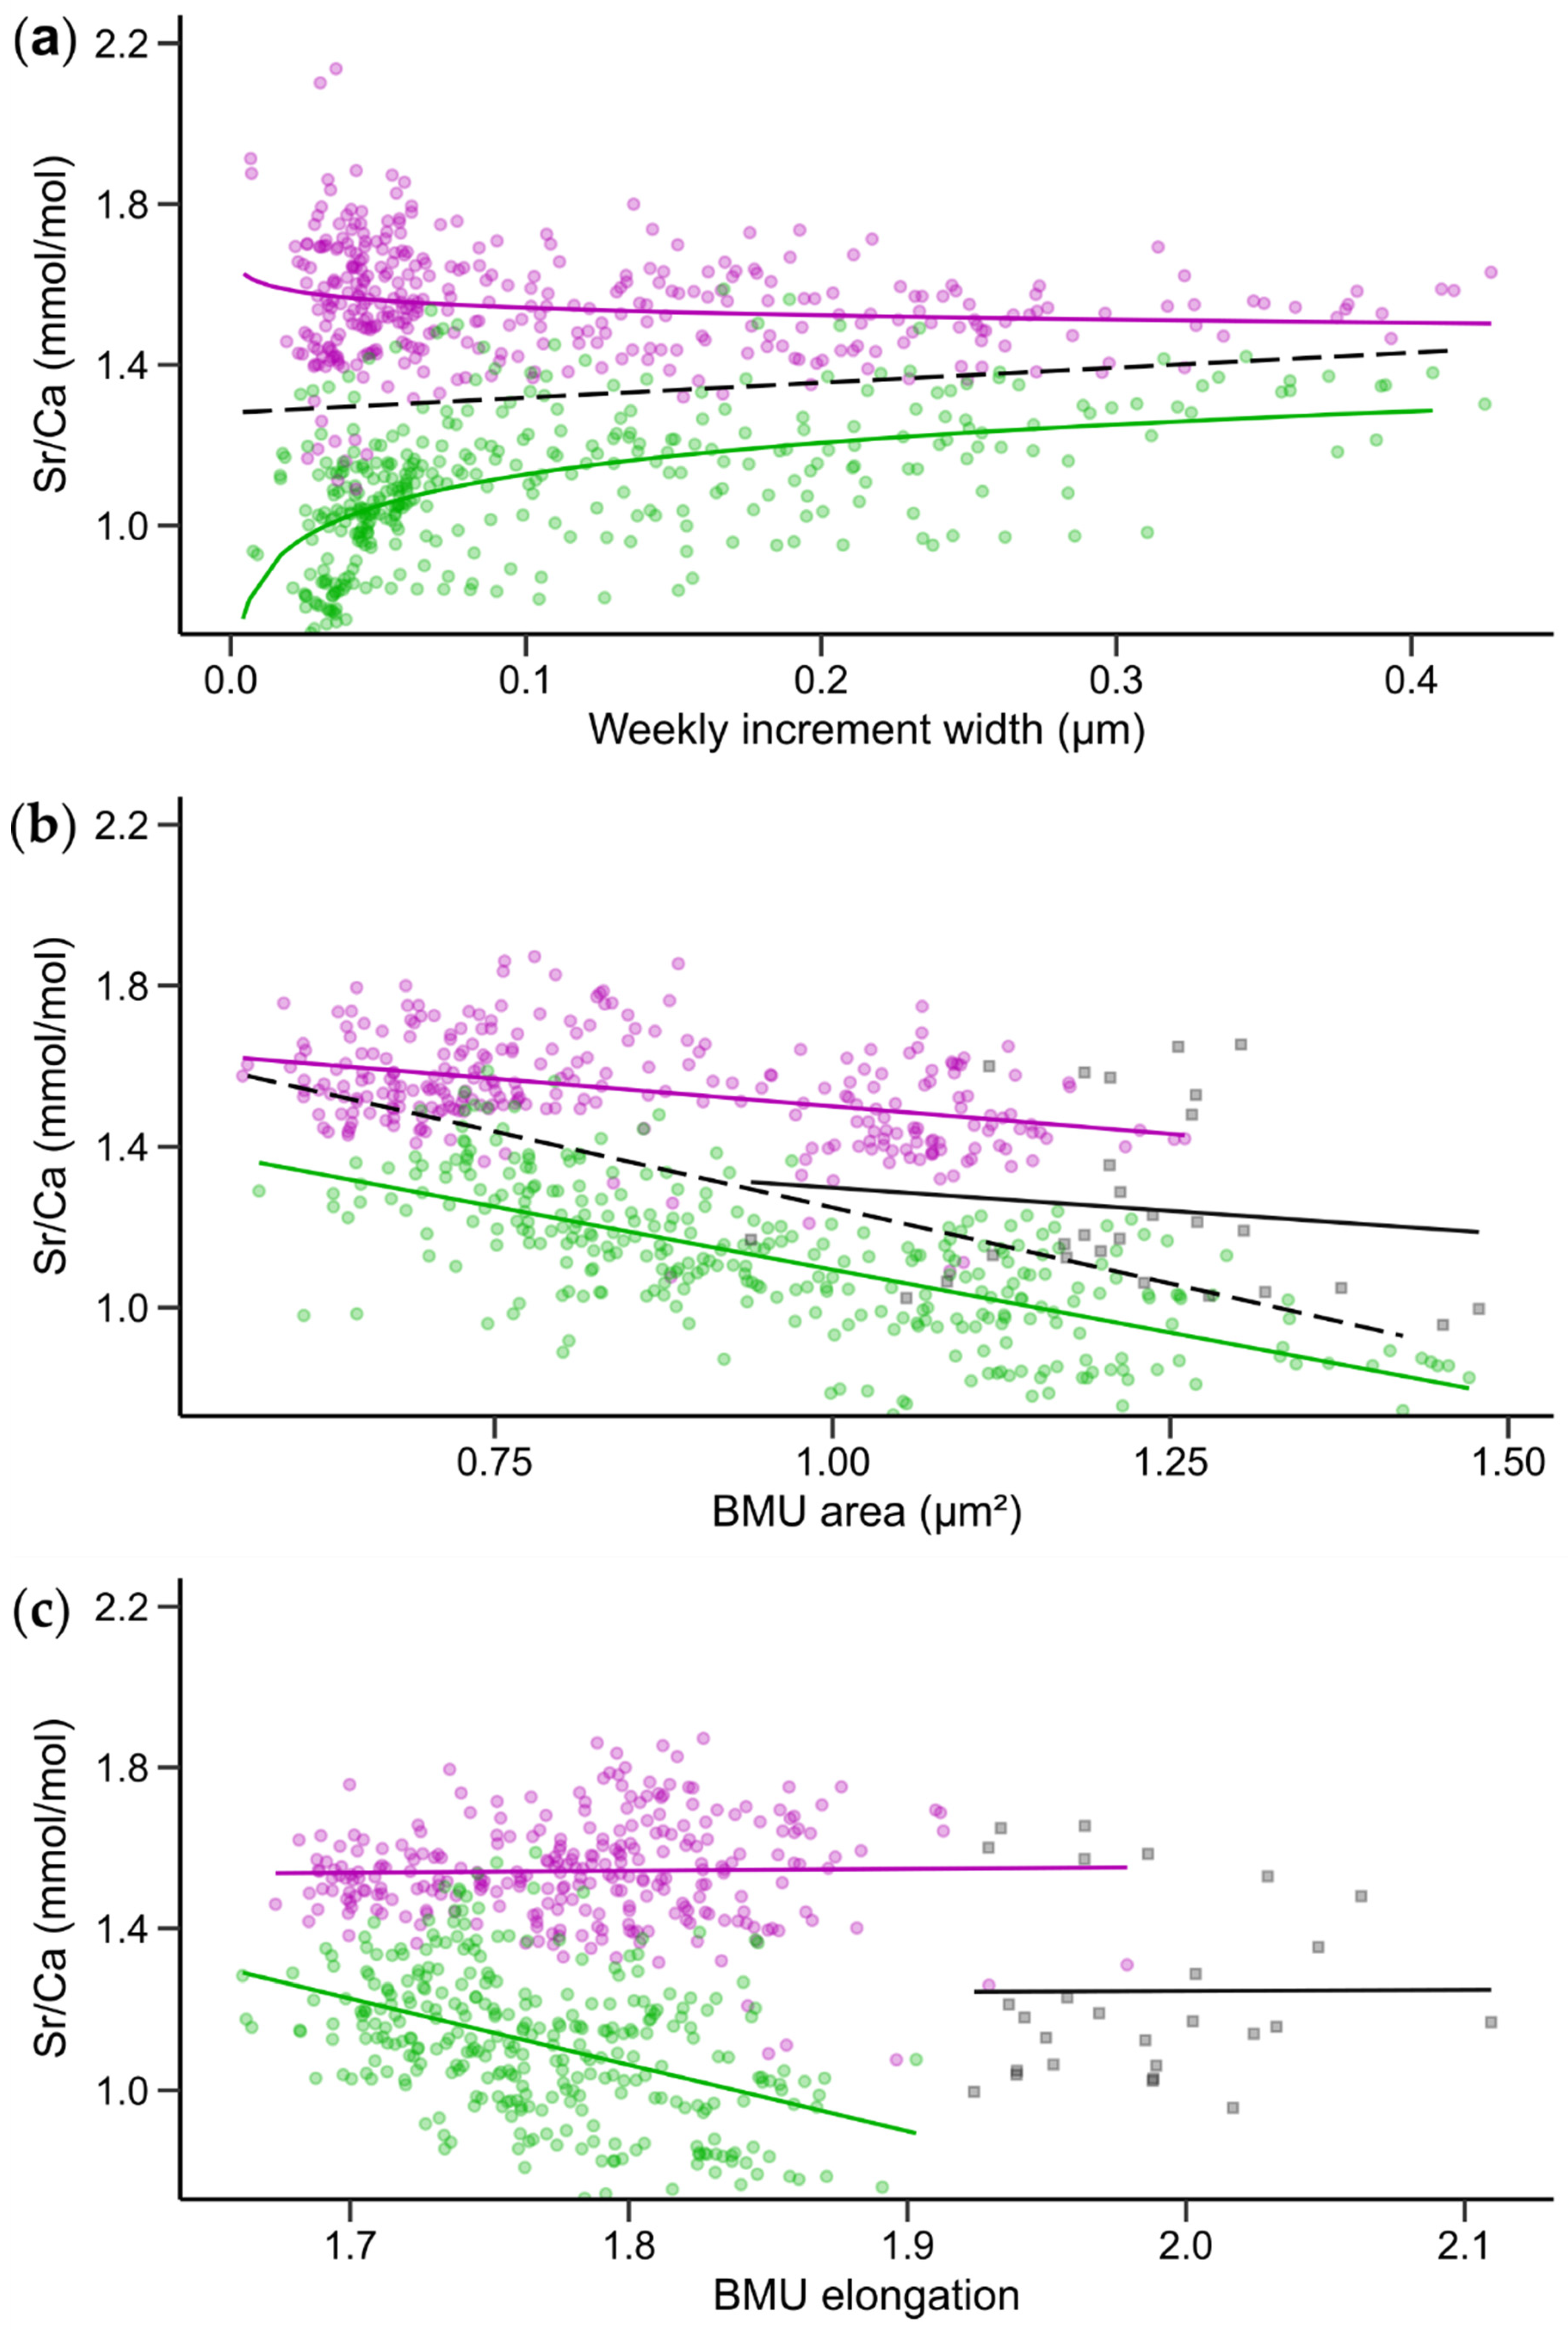
3.2. Relationships between Shell Sr/Ca, Growth Rate and BMU Morphology
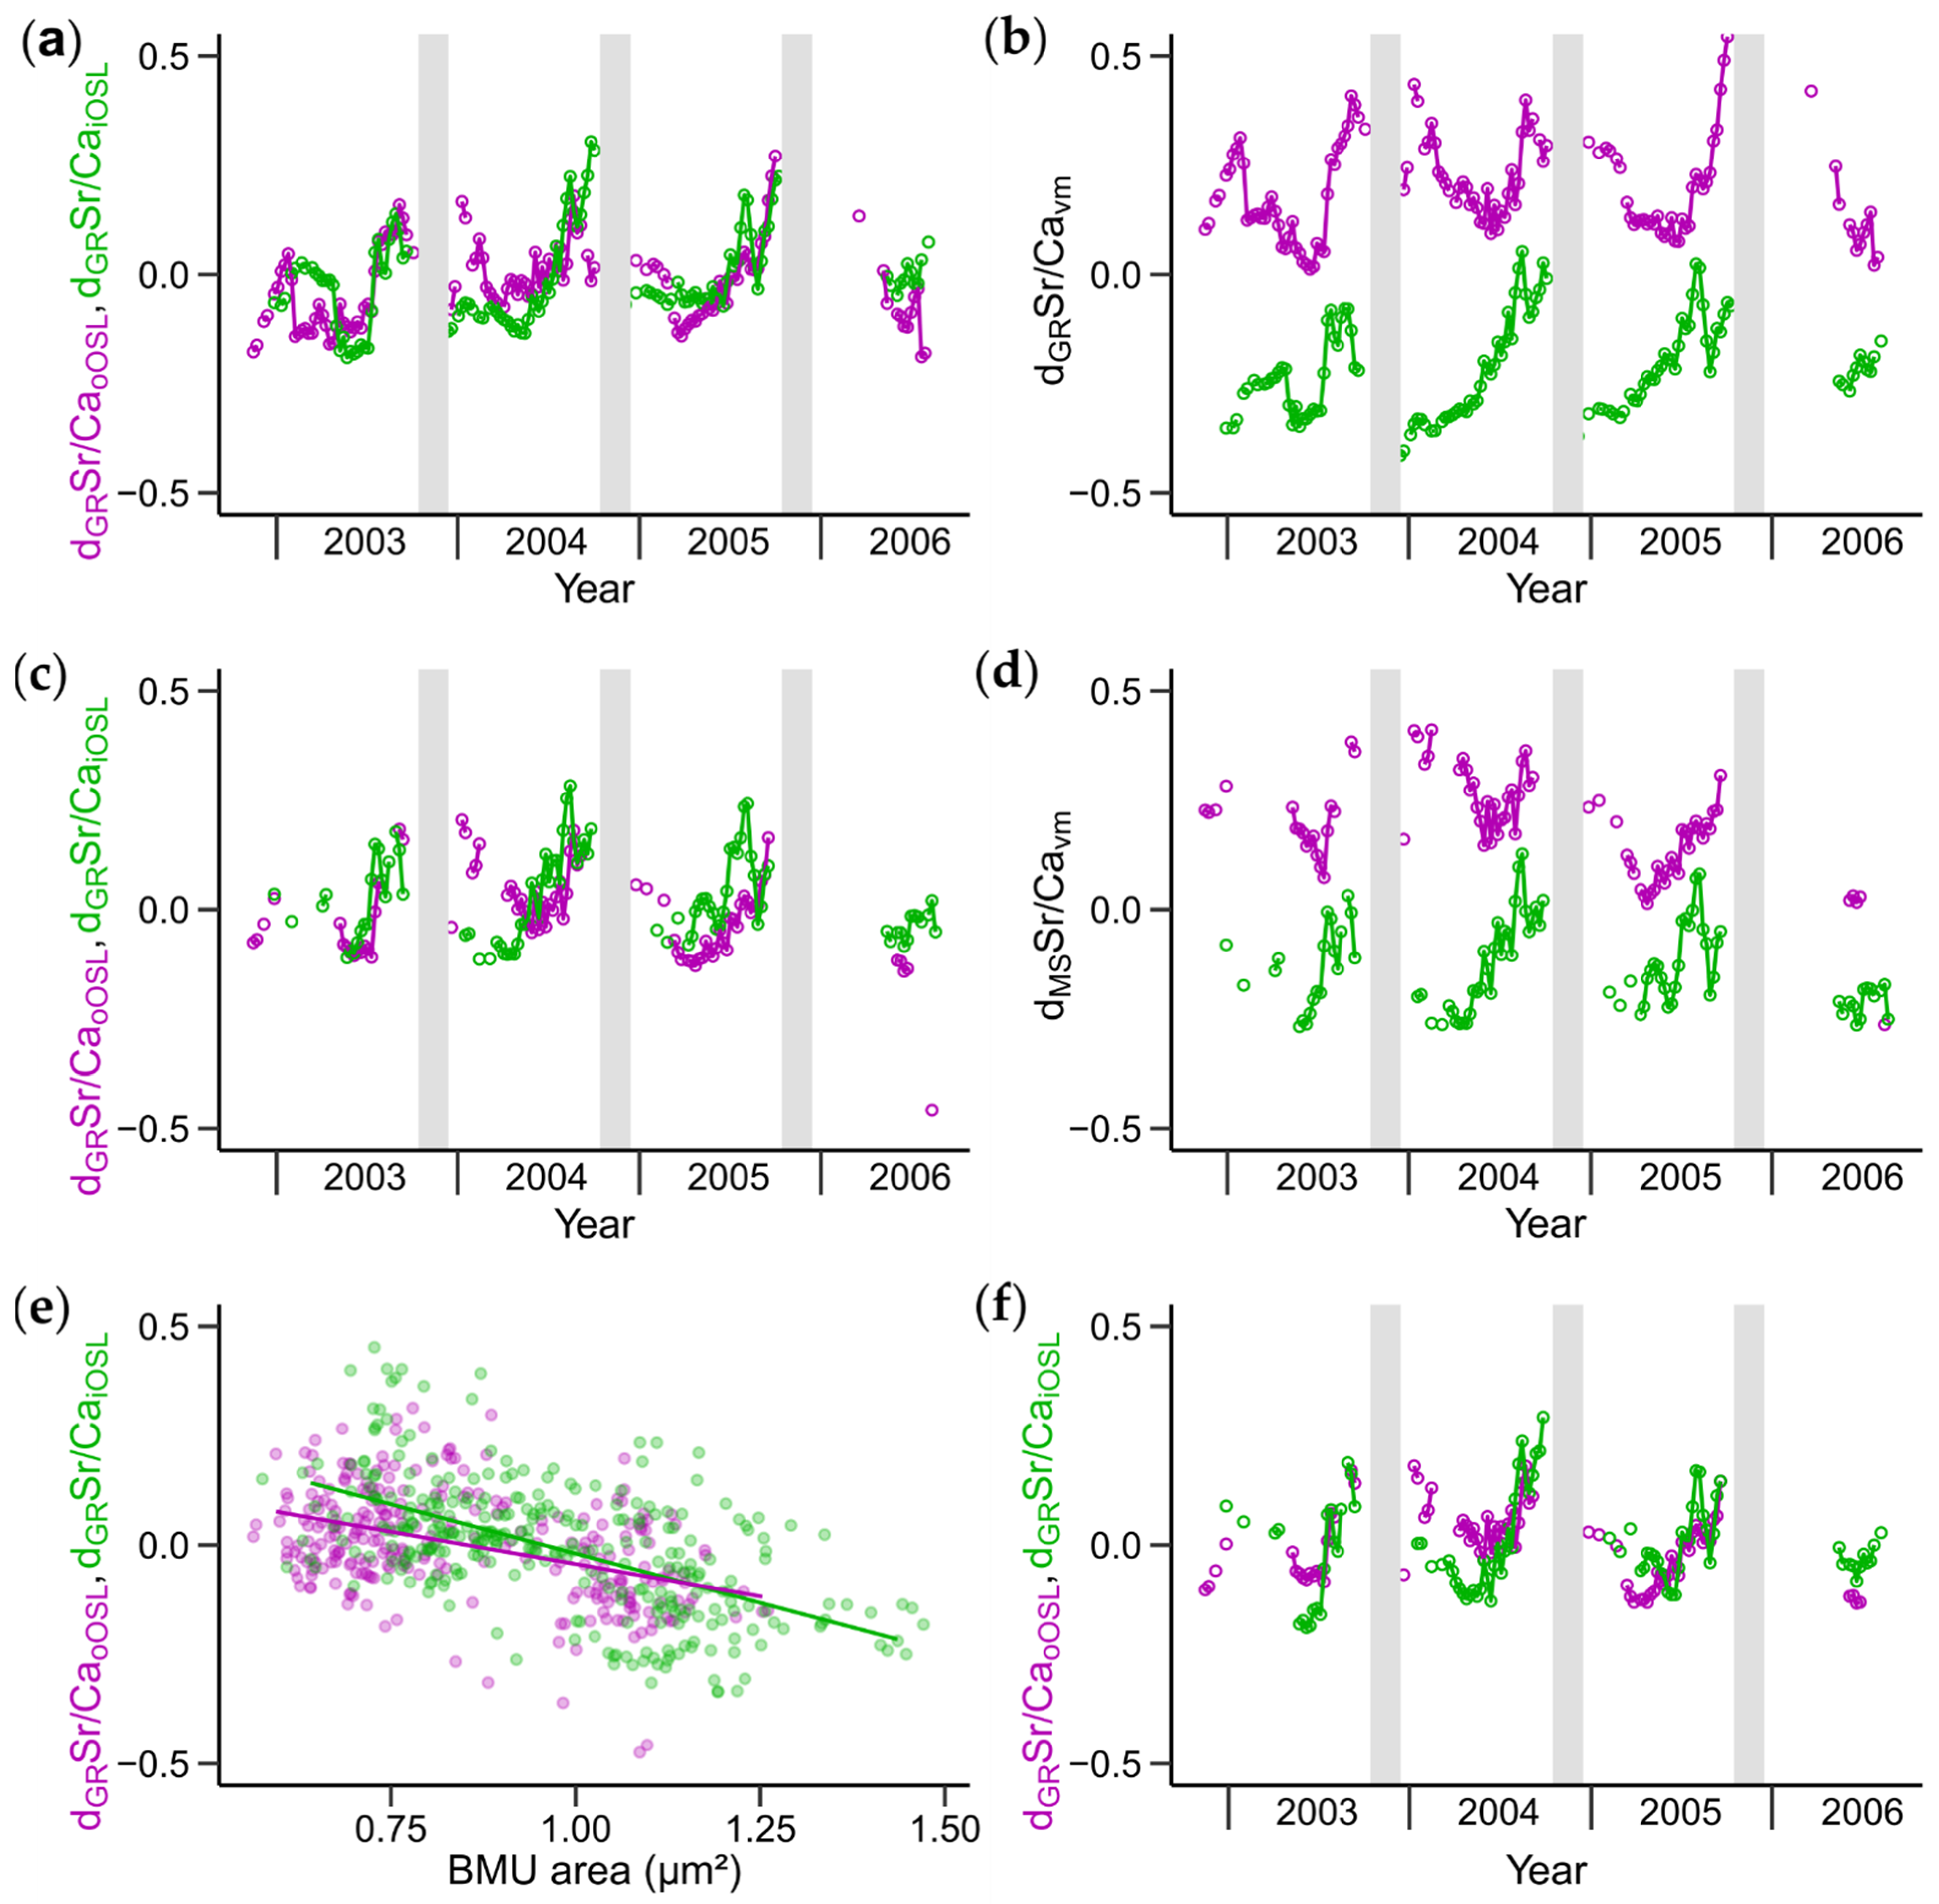
3.3. Growth Rate and BMU Area-Detrended Shell Sr/Ca Ratios
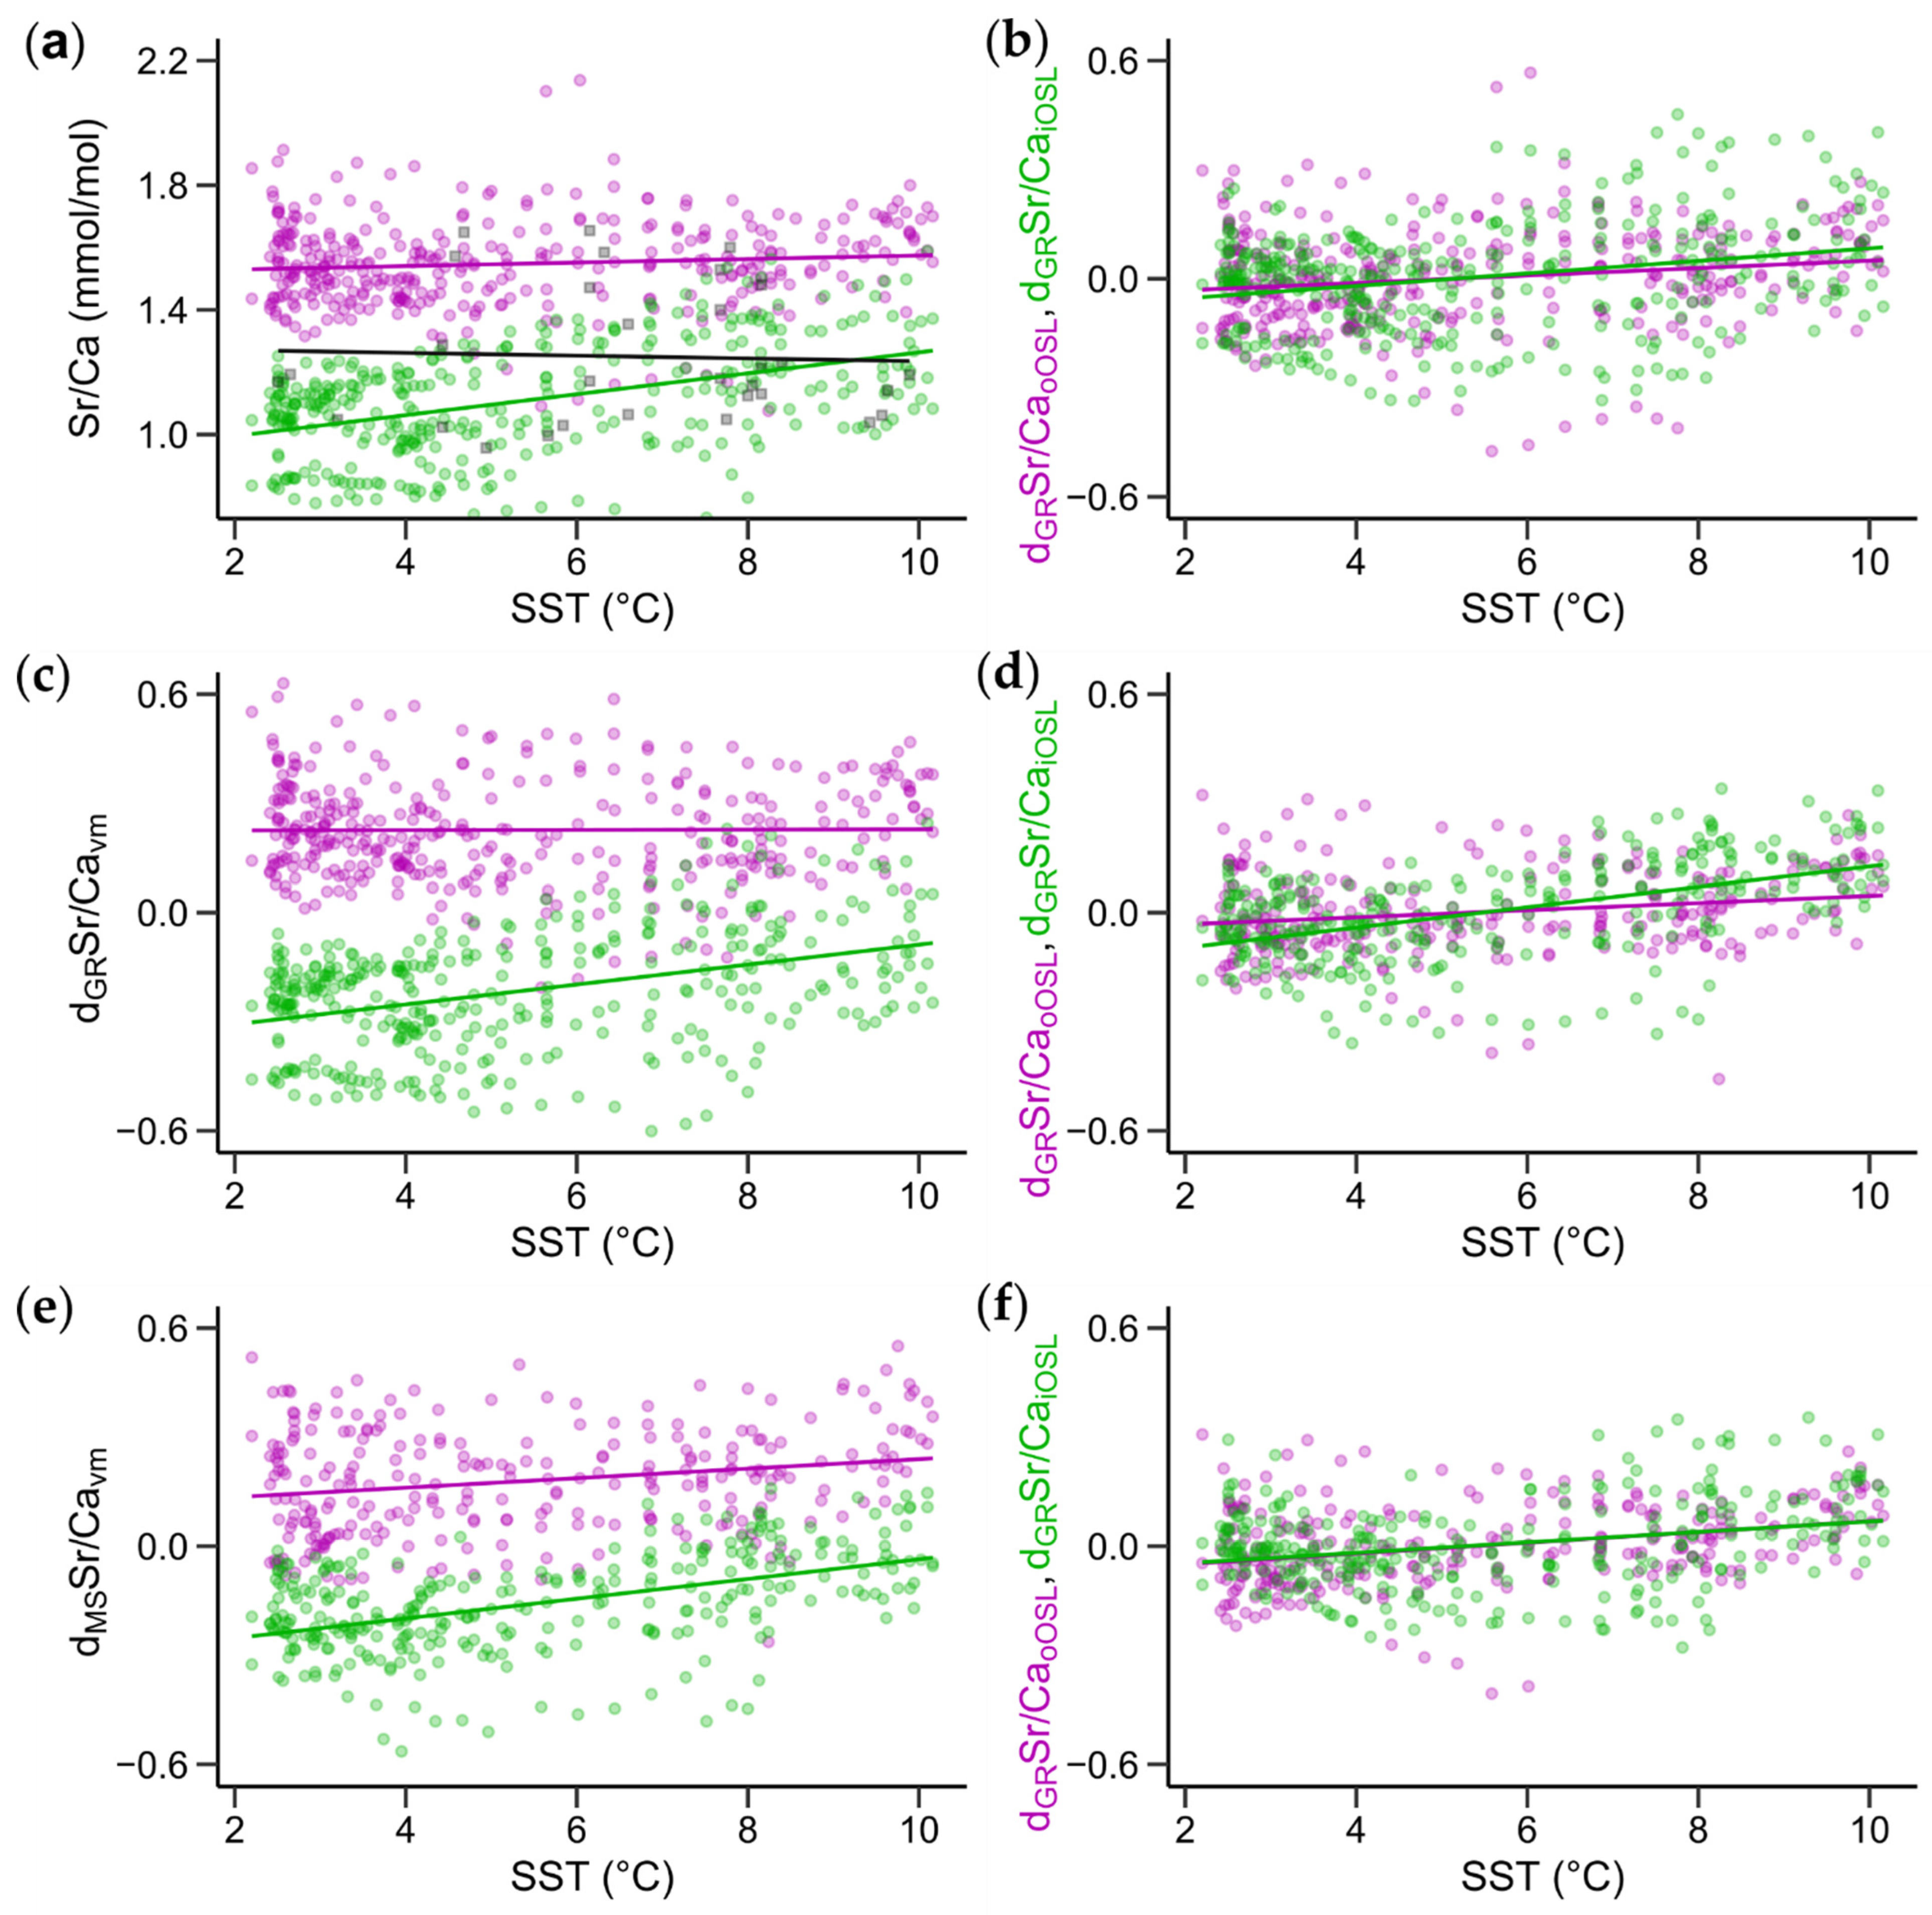
3.4. Relationships between Sr/Ca Ratios and Water Temperature
4. Discussion
4.1. Temperature Control of Shell Sr/Ca?
4.2. Relationship between Sr/Ca and Shell Microstructure
4.3. The Influence of Shell Growth Rate on Sr/Ca
5. Conclusions
Supplementary Materials
Author Contributions
Funding
Data Availability Statement
Acknowledgments
Conflicts of Interest
Appendix A

| Sclerochronology | |
|---|---|
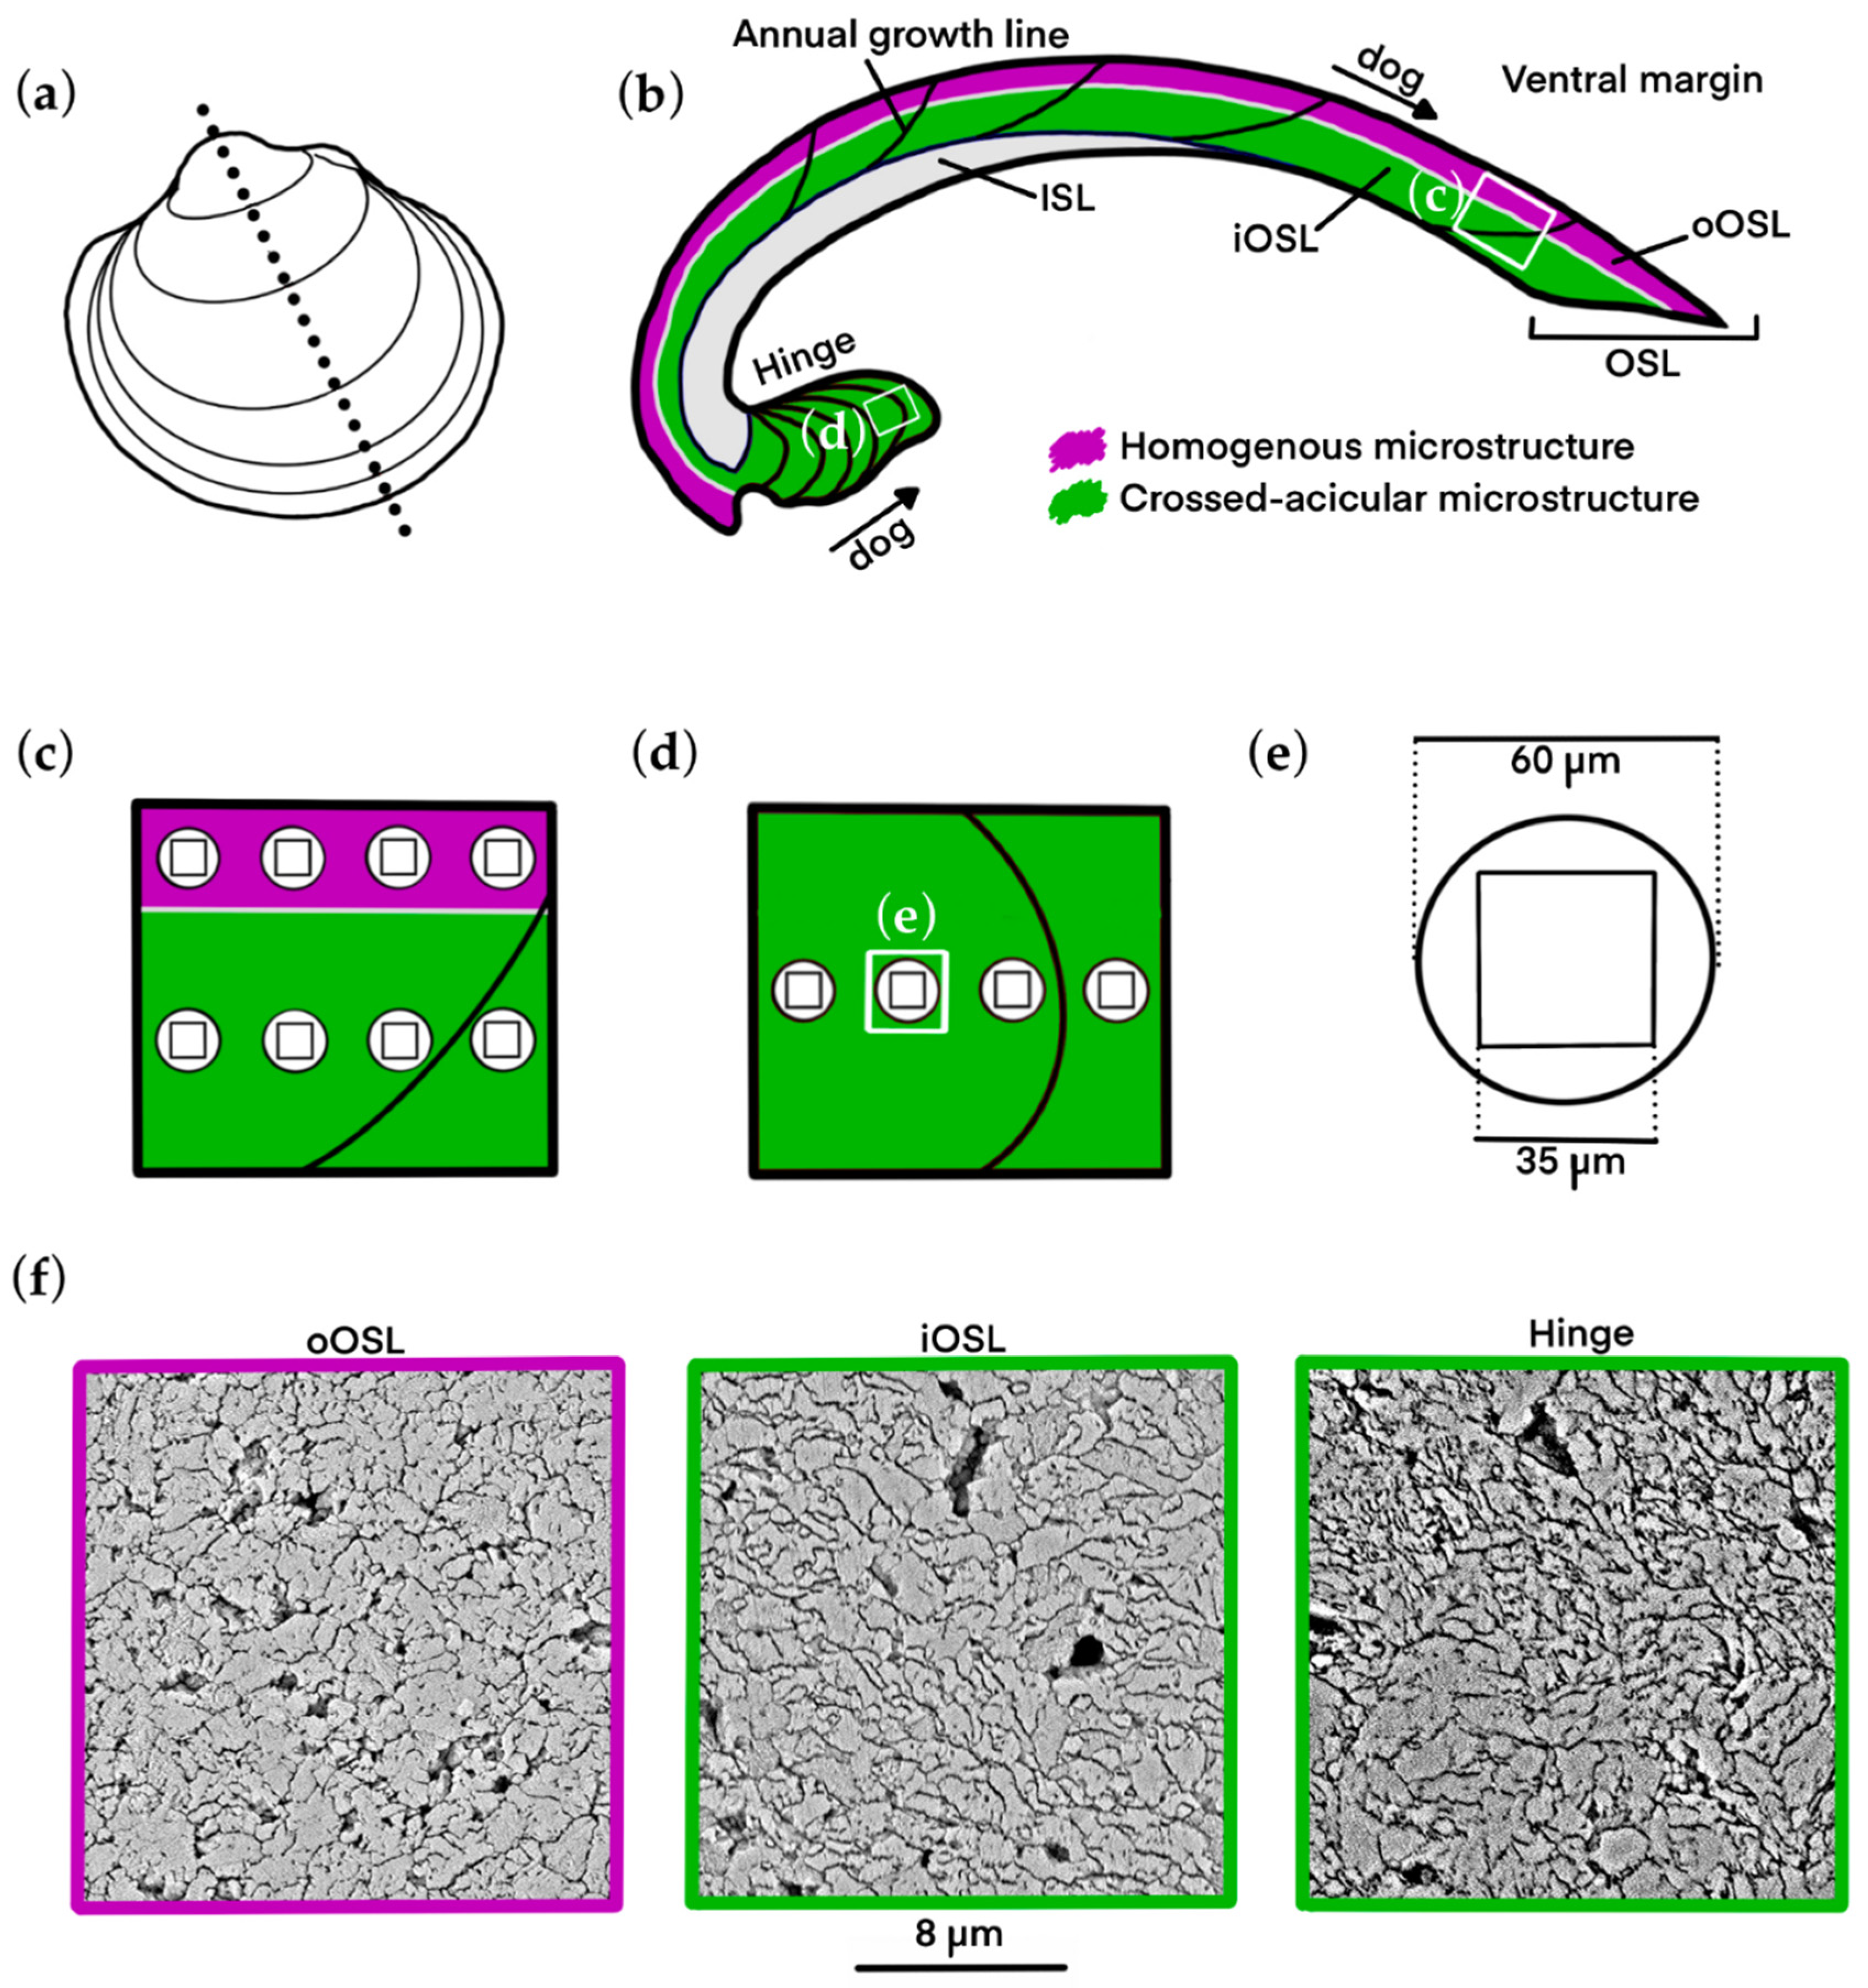
| vm | Ventral margin of the shell |
| OSL | Outer shell layer of the ventral margin of the shell |
| oOSL | Outer part of the OSL |
| iOSL | Inner part of the OSL |
| HOM | Homogenous microstructure, dominating the oOSL |
| CA | Crossed-acicular microstructure, dominating the iOSL and the hinge |
| ISP | Irregular simple prismatic microstructure, found at the annual growth lines |
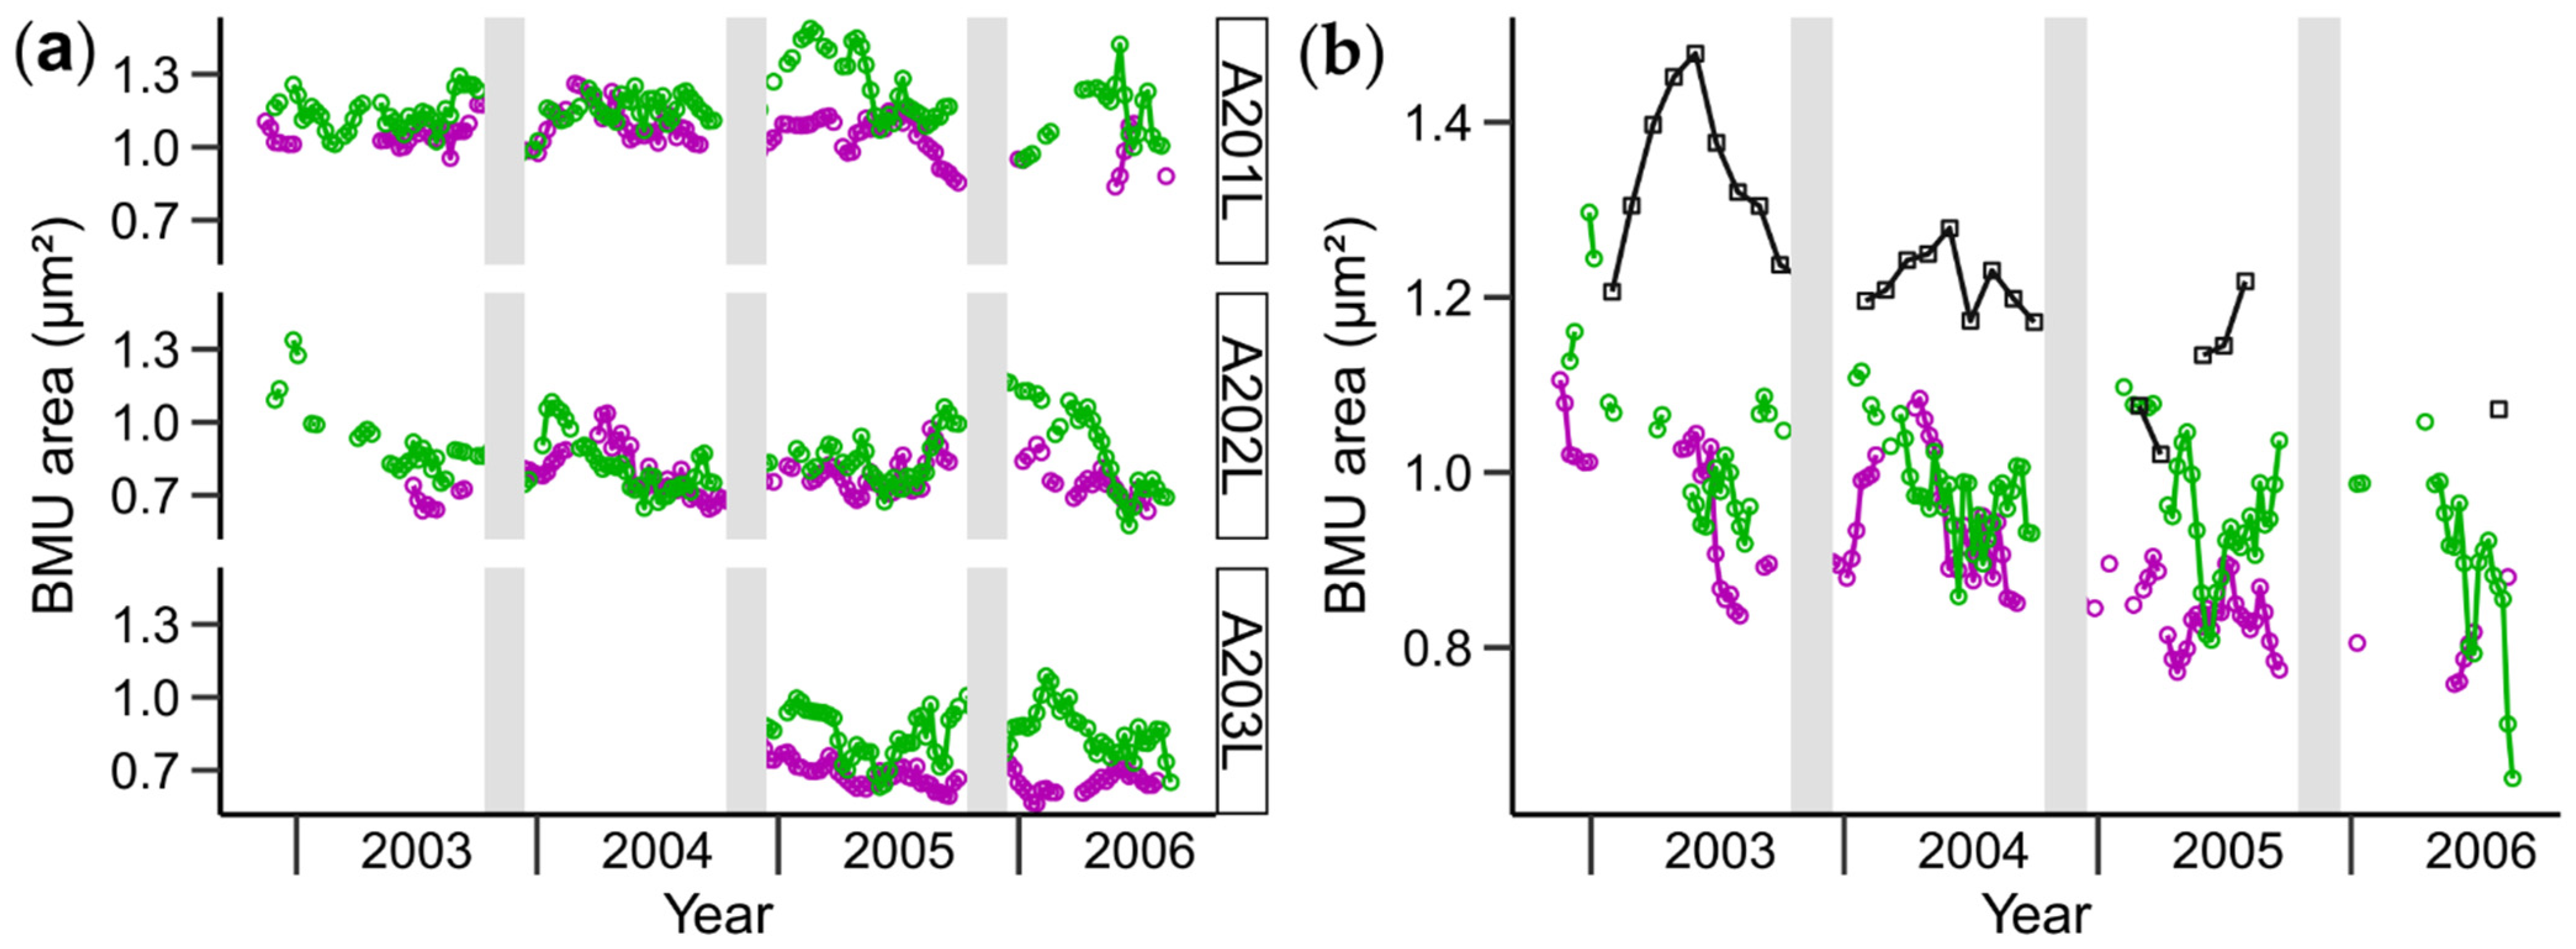
| BMU | Biomineral unit; microstructures are composed of BMUs and organics |
| Sr/Ca data | |
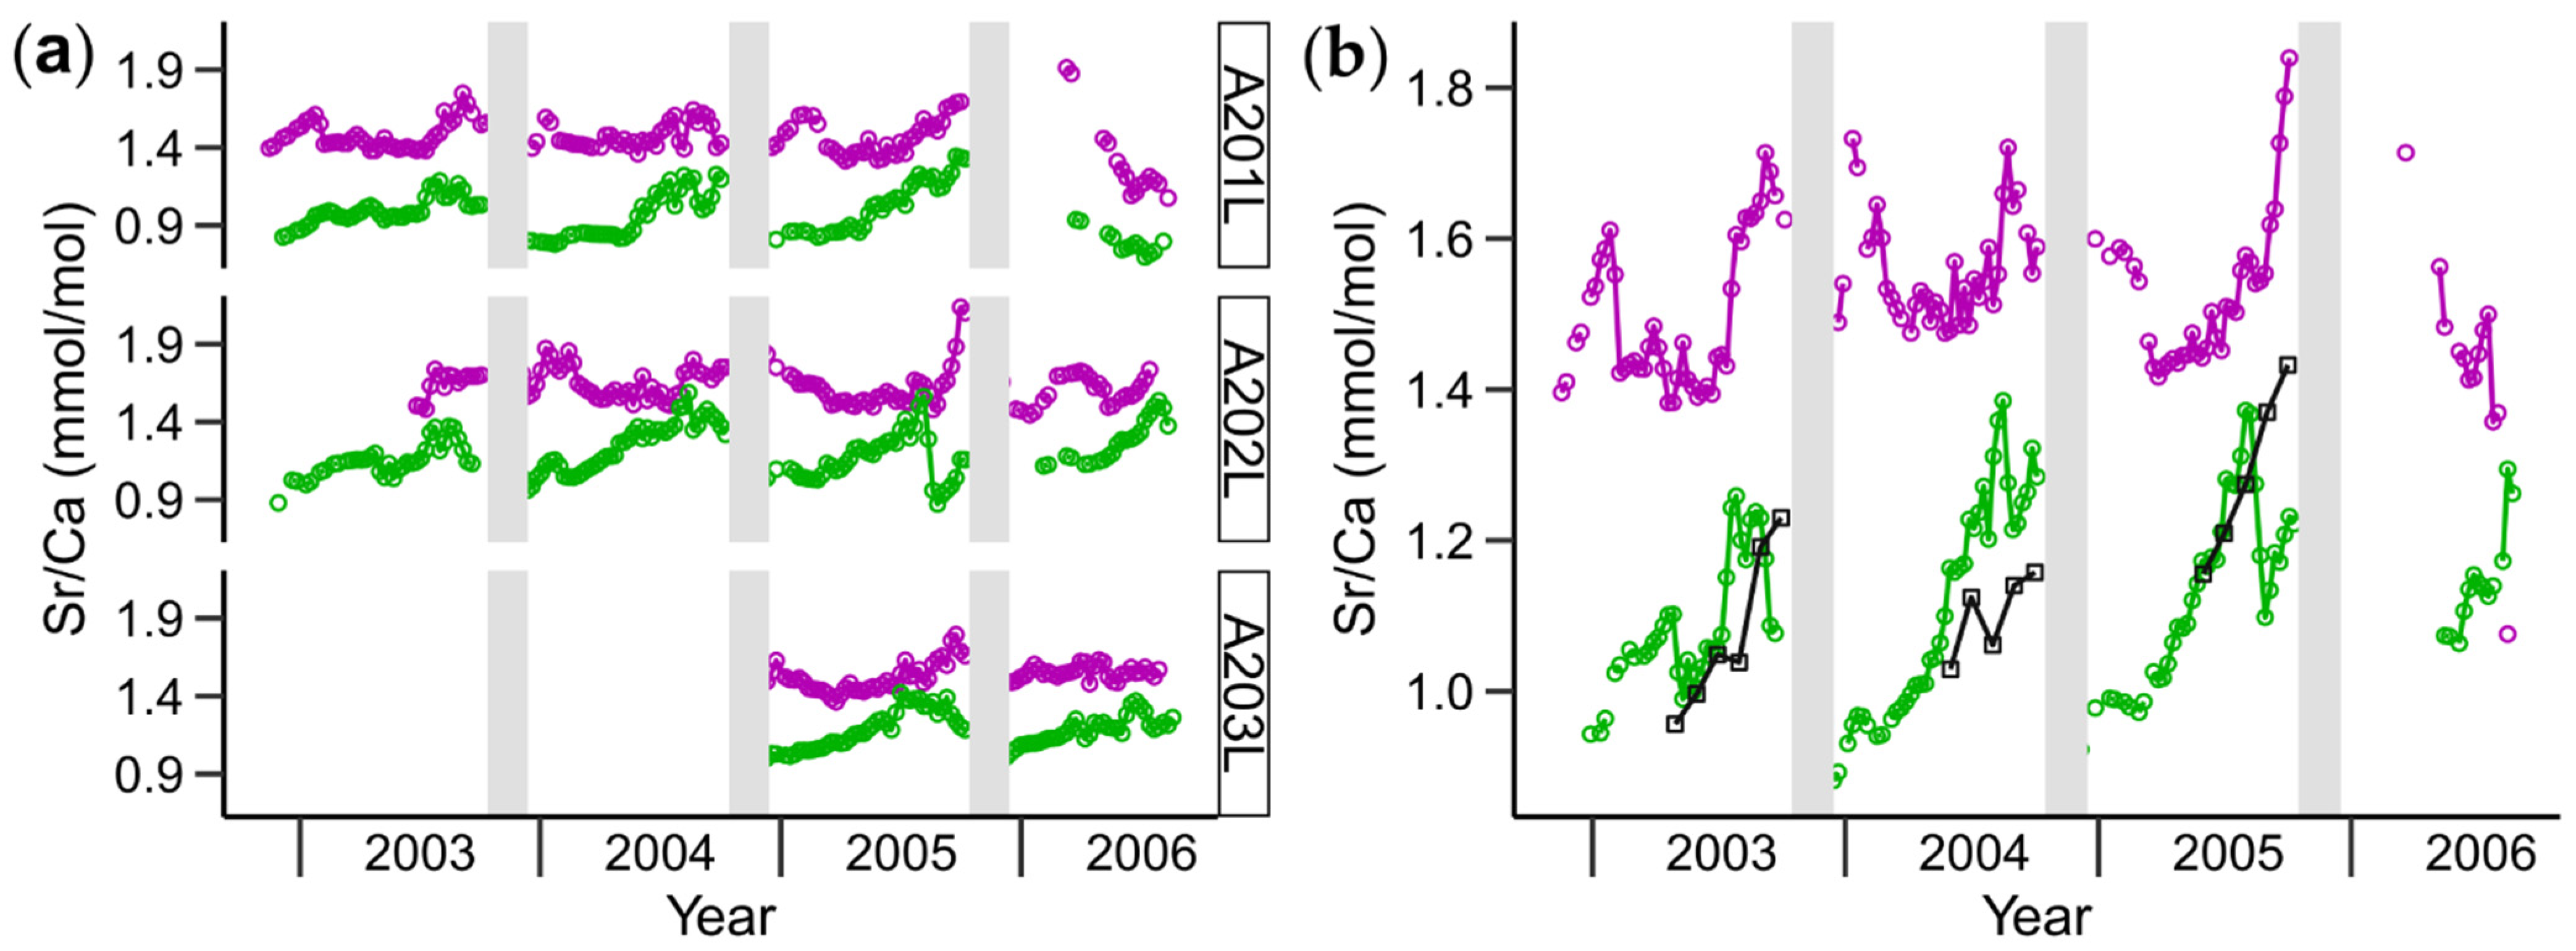
| Sr/Cavm | Sr/Ca in all of the ventral margin (oOSL and iOSL combined) of the shell |
| Sr/CaoOSL | Sr/Ca specifically in the oOSL of the ventral margin of the shell |
| Sr/CaiOSL | Sr/Ca specifically in the iOSL of the ventral margin of the shell |
| Sr/Cahinge | Sr/Ca in the hinge of the shell |
| dGRSr/Cavm | Sr/Ca detrended by a growth rate (GR)-based method for all data from the ventral margin of the shell (colored in magenta or green if the data are for HOM or CA, respectively) |
| dGRSr/CaoOSL | Sr/Ca detrended by a growth rate (GR)-based method specifically for oOSL data |
| dGRSr/CaiOSL | Sr/Ca detrended by a growth rate (GR)-based method specifically for iOSL data |
| dMSSr/Cavm | Sr/Ca detrended by a BMU size (MS)-based method for all data from the ventral margin of the shell (colored in magenta or green if the data are for HOM or CA, respectively) |
| dMSSr/CaoOSL | Sr/Ca detrended by a BMU size (MS)-based method specifically for oOSL data |
| dMSSr/CaiOSL | Sr/Ca detrended by a BMU size (MS)-based method specifically for iOSL data |
| dGRMSSr/Cavm | Sr/Ca detrended by growth rate (GR) and BMU size (MS)-based methods for all data from the ventral margin of the shell (colored in magenta or green if the data are for HOM or CA, respectively) |
| dGRMSSr/CaoOSL | Sr/Ca detrended by growth rate (GR) and BMU size (MS)-based methods specifically for oOSL data |
| dGRMSSr/CaiOSL | Sr/Ca detrended by growth rate (GR) and BMU size (MS)-based methods specifically for iOSL data |
| Environmental data set | |
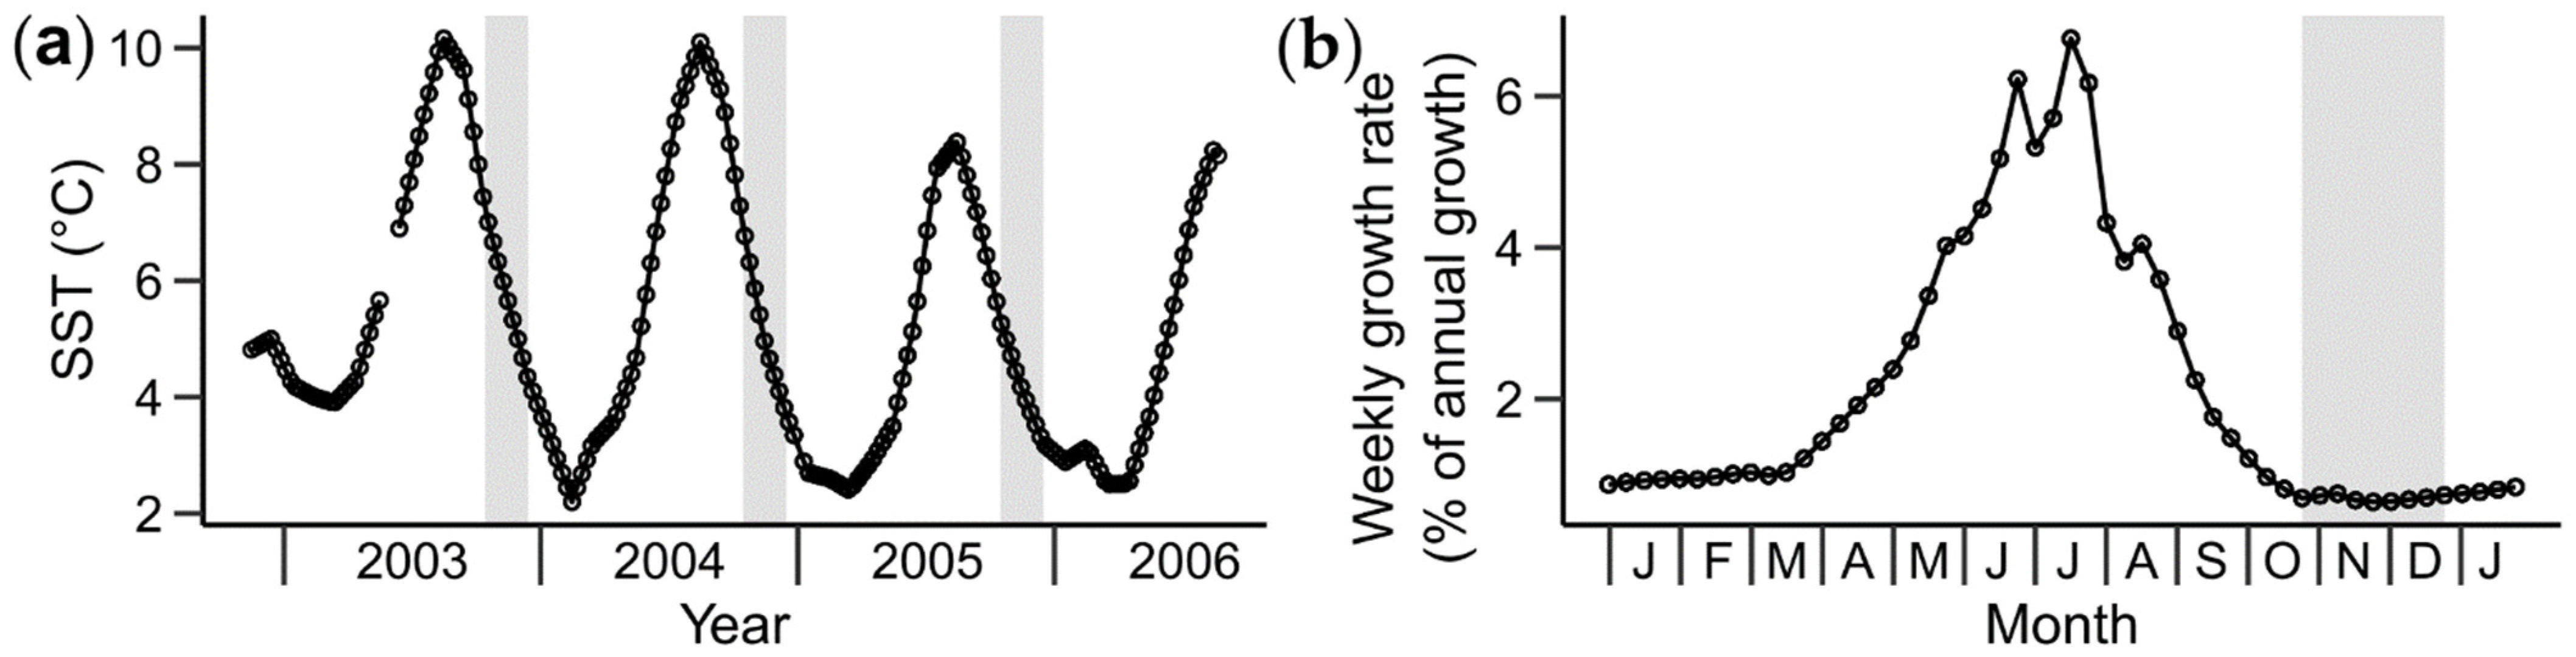
| SST | Sea surface temperature (°C) |
References
- Ivany, L.C.; Brey, T.; Huber, M.; Buick, D.P.; Schöne, B.R. El Niño in the Eocene greenhouse recorded by fossil bivalves and wood from Antarctica. Geophys. Res. Lett. 2011, 38, L16709. [Google Scholar] [CrossRef] [Green Version]
- Wanamaker, A.D.; Butler, P.G.; Scourse, J.D.; Heinemeier, J.; Eiríksson, J.; Knudsen, K.L.; Richardson, C.A. Surface changes in the North Atlantic meridional overturning circulation during the last millennium. Nat. Commun. 2012, 3, 899. [Google Scholar] [CrossRef] [PubMed] [Green Version]
- Butler, P.G.; Wanamaker, A.D.; Scourse, J.D.; Richardson, C.A.; Reynolds, D.J. Variability of marine climate on the North Icelandic Shelf in a 1357-year proxy archive based on growth increments in the bivalve Arctica islandica. Palaeogeogr. Palaeoclimatol. Palaeoecol. 2013, 373, 141–151. [Google Scholar] [CrossRef]
- Lohmann, G.; Schöne, B.R. Climate signatures on decadal to interdecadal time scales as obtained from mollusk shells (Arctica islandica) from Iceland. Palaeogeogr. Palaeoclimatol. Palaeoecol. 2013, 373, 152–162. [Google Scholar] [CrossRef]
- Black, B.A.; Dunham, J.B.; Blundon, B.W.; Brim-Box, J.; Tepley, A.J. Long-term growth-increment chronologies reveal diverse influences of climate forcing on freshwater and forest biota in the Pacific Northwest. Glob. Chang. Biol. 2015, 21, 594–604. [Google Scholar] [CrossRef]
- Black, B.A.; Griffin, D.; van der Sleen, P.; Wanamaker, A.D.; Speer, J.H.; Frank, D.C.; Stahle, D.W.; Pederson, N.; Copenheaver, C.A.; Trouet, V.; et al. The value of crossdating to retain high-frequency variability, climate signals, and extreme events in environmental proxies. Glob. Chang. Biol. 2016, 22, 2582–2595. [Google Scholar] [CrossRef]
- Walliser, E.O.; Mertz-Kraus, R.; Schöne, B.R. The giant inoceramid Platyceramus platinus as a high-resolution paleoclimate archive for the Late Cretaceous of the Western Interior Seaway. Cretac. Res. 2018, 86, 73–90. [Google Scholar] [CrossRef]
- Jones, D.S. Annual cycle of shell growth increment formation in two continental shelf bivalves and its paleoecologic significance. Paleobiol. 1980, 6, 331–340. [Google Scholar] [CrossRef]
- Trutschler, K.; Samtleben, C. Shell growth of Astarte elliptica (Bivalvia) from Kiel Bay (Western Baltic Sea). Mar. Ecol. Prog. Ser. 1988, 42, 155–162. [Google Scholar] [CrossRef]
- Fritz, L.W.; Haven, D.S. Hard clam, Mercenaria mercenaria: Shell growth patterns in Chesapeake Bay. Fish. Bull. 1983, 81, 697–708. [Google Scholar]
- Chauvaud, L.; Thouzeau, G.; Paulet, Y.-M. Effects of environmental factors on the daily growth rate of Pecten maximus juveniles in the Bay of Brest (France). J. Exp. Mar. Biol. Ecol. 1998, 227, 83–111. [Google Scholar] [CrossRef]
- Clark, G.R. Daily growth lines in some living Pectens (Mollusca: Bivalvia), and some applications in a fossil relative: Time and tide will tell. Palaeogeogr. Palaeoclimatol. Palaeoecol. 2005, 228, 26–42. [Google Scholar] [CrossRef]
- Evans, J.W. Tidal growth increments in the cockle Clinocardium nuttalli. Science 1972, 176, 416–417. [Google Scholar] [CrossRef] [PubMed]
- Ohno, T. Palaeotidal characteristics determined by micro-growth patterns in bivalves. Palaeont. 1989, 32, 237–263. [Google Scholar]
- Hallmann, N.; Burchell, M.; Schöne, B.R.; Irvine, G.V.; Maxwell, D. High-resolution sclerochronological analysis of the bivalve mollusk Saxidomus gigantea from Alaska and British Columbia: Techniques for revealing environmental archives and archaeological seasonality. J. Archaeol. Sci. 2009, 36, 2353–2364. [Google Scholar] [CrossRef]
- Thébault, J.; Chauvaud, L.; L’Helguen, S.; Clavier, J.; Barats, A.; Jacquet, S.; Pécheyran, C.; Amouroux, D. Barium and molybdenum records in bivalve shells: Geochemical proxies for phytoplankton dynamics in coastal environments? Limnol. Oceanogr. 2009, 54, 1002–1014. [Google Scholar] [CrossRef] [Green Version]
- Hatch, M.B.A.; Schellenberg, S.A.; Carter, M.L. Ba/Ca variations in the modern intertidal bean clam Donax gouldii: An upwelling proxy? Palaeogeogr. Palaeoclimatol. Palaeoecol. 2013, 373, 98–107. [Google Scholar] [CrossRef]
- Yamanashi, J.; Takayanagi, H.; Isaji, A.; Asami, R.; Iryu, Y. Carbon and oxygen isotope records from Tridacna derasa shells: Toward establishing a reliable proxy for sea surface environments. PLoS ONE 2016, 11, e0157659. [Google Scholar] [CrossRef]
- Kodama, S.; Takayanagi, H.; Yoshii, K.; Nhu Ha, T.T.; Asami, R.; Abe, O.; Iryu, Y. Carbon and oxygen isotope records of Tridacna squamosa shells from two different latitudes in the Ryukyu Islands. Paleontol. Res. 2021, 25, 79–92. [Google Scholar] [CrossRef]
- Shaul, W.; Goodwin, L. Geodock (Panope generosa: Bivalvia) age as determined by internal growth lines in the shell. Can. J. Fish. Aquat. Sci. 1982, 39, 632–636. [Google Scholar] [CrossRef]
- Buick, D.P.; Ivany, L.C. 100 years in the dark: Extreme longevity of Eocene bivalves from Antarctica. Geology 2004, 32, 921. [Google Scholar] [CrossRef]
- Schöne, B.R.; Fiebig, J.; Pfeiffer, M.; Gleβ, R.; Hickson, J.; Johnson, A.L.A.; Dreyer, W.; Oschmann, W. Climate records from a bivalved Methuselah (Arctica islandica, Mollusca; Iceland). Palaeogeogr. Palaeoclimatol. Palaeoecol. 2005, 228, 130–148. [Google Scholar] [CrossRef]
- Wisshak, M.; López Correa, M.; Gofas, S.; Salas, C.; Taviani, M.; Jakobsen, J.; Freiwald, A. Shell architecture, element composition, and stable isotope signature of the giant deep-sea oyster Neopycnodonte zibrowii sp. n. from the NE Atlantic. Deep Sea Res. Part I Oceanogr. Res. Pap. 2009, 56, 374–407. [Google Scholar] [CrossRef]
- Selin, N.I.; Dulenina, P.A. The growth and lifespan of the mussel Crenomytilus grayanus (Bivalvia: Mytilidae) in the Tatar Strait (Sea of Japan) in connection with the conditions of life at the northern border of the species range. Russ. J. Mar. Biol. 2012, 38, 318–324. [Google Scholar] [CrossRef]
- Moss, D.K.; Ivany, L.C.; Silver, R.B.; Schue, J.; Artruc, E.G. High-latitude settings promote extreme longevity in fossil marine bivalves. Paleobiology 2017, 43, 365–382. [Google Scholar] [CrossRef]
- Schöne, B.R.; Flessa, K.W.; Dettman, D.L.; Goodwin, D.H. Upstream dams and downstream clams: Growth rates of bivalve mollusks unveil impact of river management on estuarine ecosystems (Colorado River Delta, Mexico). Estuar. Coast. Shelf Sci. 2003, 58, 715–726. [Google Scholar] [CrossRef]
- Strom, A.; Francis, R.C.; Mantua, N.J.; Miles, E.L.; Peterson, D.L. Preserving low-frequency climate signals in growth records of geoduck clams (Panopea abrupta). Palaeogeogr. Palaeoclimatol. Palaeoecol. 2005, 228, 167–178. [Google Scholar] [CrossRef]
- Scourse, J.; Richardson, C.; Forsythe, G.; Harris, I.; Heinemeier, J.; Fraser, N.; Briffa, K.; Jones, P. First cross-matched floating chronology from the marine fossil record: Data from growth lines of the long-lived bivalve mollusc Arctica islandica. Holocene 2006, 16, 967–974. [Google Scholar] [CrossRef]
- Black, B.A.; Copenheaver, C.A.; Frank, D.C.; Stuckey, M.J.; Kormanyos, R.E. Multi-proxy reconstructions of northeastern Pacific sea surface temperature data from trees and Pacific geoduck. Palaeogeogr. Palaeoclimatol. Palaeoecol. 2009, 278, 40–47. [Google Scholar] [CrossRef]
- Butler, P.G.; Richardson, C.A.; Scourse, J.D.; Wanamaker, A.D.; Shammon, T.M.; Bennell, J.D. Marine climate in the Irish Sea: Analysis of a 489-year marine master chronology derived from growth increments in the shell of the clam Arctica islandica. Quat. Sci. Rev. 2010, 29, 1614–1632. [Google Scholar] [CrossRef]
- Reynolds, D.J.; Scourse, J.D.; Halloran, P.R.; Nederbragt, A.J.; Wanamaker, A.D.; Butler, P.G.; Richardson, C.A.; Heinemeier, J.; Eiríksson, J.; Knudsen, K.L.; et al. Annually resolved North Atlantic marine climate over the last millennium. Nat. Commun. 2016, 7, 13502. [Google Scholar] [CrossRef] [PubMed] [Green Version]
- Mette, M.J.; Wanamaker, A.D.; Retelle, M.J.; Carroll, M.L.; Andersson, C.; Ambrose, W.G. Persistent multidecadal variability since the 15th century in the Southern Barents Sea derived from annually resolved shell-based records. J. Geophys. Res. Oceans 2021, 126, e2020JC017074. [Google Scholar] [CrossRef]
- Holland, H.A.; Schöne, B.R.; Marali, S.; Jochum, K.P. History of bioavailable lead and iron in the Greater North Sea and Iceland during the last millennium—A bivalve sclerochronological reconstruction. Mar. Pollut. Bull. 2014, 87, 104–116. [Google Scholar] [CrossRef]
- Black, B.A.; Andersson, C.; Butler, P.G.; Carroll, M.L.; DeLong, K.L.; Reynolds, D.J.; Schöne, B.R.; Scourse, J.; van der Sleen, P.; Wanamaker, A.D.; et al. The revolution of crossdating in marine palaeoecology and palaeoclimatology. Biol. Lett. 2019, 15, 20180665. [Google Scholar] [CrossRef] [PubMed]
- Peharda, M.; Schöne, B.R.; Black, B.A.; Corrège, T. Advances of sclerochronology research in the last decade. Palaeogeogr. Palaeoclimatol. Palaeoecol. 2021, 570, 110371. [Google Scholar] [CrossRef]
- Grossman, E.L.; Ku, T.-L. Oxygen and carbon isotope fractionation in biogenic aragonite: Temperature effects. Chem. Geol. 1986, 59, 59–74. [Google Scholar] [CrossRef]
- Wefer, G.; Berger, W.H. Isotope paleontology: Growth and composition of extant calcareous species. Mar. Geol. 1991, 100, 207–248. [Google Scholar] [CrossRef]
- Epstein, S.; Buchsbaum, R.; Lowenstam, H.A.; Urey, H.C. Revised carbonate-water isotopic temperature scale. Geol. Soc. Am. Bull. 1953, 64, 1315. [Google Scholar] [CrossRef]
- Mook, W.G.; Vogel, J.C. Isotopic equilibrium between shells and their environment. Science 1968, 159, 874–875. [Google Scholar] [CrossRef]
- Killingley, J.S.; Berger, W.H. Stable isotopes in a mollusk shell: Detection of upwelling events. Science 1979, 205, 186–188. [Google Scholar] [CrossRef]
- Witbaard, R.; Jenness, M.I.; Van Der Borg, K.; Ganssen, G. Verification of annual growth increments in Arctica islandica L. from the North Sea by means of oxygen and carbon isotopes. Neth. J. Sea Res. 1994, 33, 91–101. [Google Scholar] [CrossRef]
- Ansell, A.D. The rate of growth of the hard clam Mercenaria mercenaria(L) throughout the geographical range. ICES J. Mar. Sci. 1968, 31, 364–409. [Google Scholar] [CrossRef]
- Kennish, M.J.; Olsson, R.K. Effects of thermal discharges on the microstructural growth of Mercenaria mercenaria. Environ. Geol. 1975, 1, 41–64. [Google Scholar] [CrossRef]
- Goodwin, D.H.; Flessa, K.W.; Schöne, B.R.; Dettman, D.L. Cross-calibration of daily growth increments, stable isotope variation, and temperature in the Gulf of California bivalve mollusk Chione cortezi: Implications for paleoenvironmental analysis. Palaios 2001, 16, 387–398. [Google Scholar] [CrossRef]
- Witbaard, R.; Duineveld, G.C.A.; Bergman, M. The effect of tidal resuspension on benthic food quality in the southern North Sea. Senckenberg. Marit. 2001, 31, 225–234. [Google Scholar] [CrossRef]
- Eagle, R.A.; Eiler, J.M.; Tripati, A.K.; Ries, J.B.; Freitas, P.S.; Hiebenthal, C.; Wanamaker, A.D.; Taviani, M.; Elliot, M.; Marenssi, S.; et al. The influence of temperature and seawater carbonate saturation state on 13C–18O bond ordering in bivalve mollusks. Biogeosciences 2013, 10, 4591–4606. [Google Scholar] [CrossRef] [Green Version]
- Henkes, G.A.; Passey, B.H.; Wanamaker, A.D.; Grossman, E.L.; Ambrose, W.G.; Carroll, M.L. Carbonate clumped isotope compositions of modern marine mollusk and brachiopod shells. Geochim. Cosmochim. Acta 2013, 106, 307–325. [Google Scholar] [CrossRef]
- Wacker, U.; Fiebig, J.; Tödter, J.; Schöne, B.R.; Bahr, A.; Friedrich, O.; Tütken, T.; Gischler, E.; Joachimski, M.M. Empirical calibration of the clumped isotope paleothermometer using calcites of various origins. Geochim. Cosmochim. Acta 2014, 141, 127–144. [Google Scholar] [CrossRef]
- Fiebig, J.; Bajnai, D.; Löffler, N.; Methner, K.; Krsnik, E.; Mulch, A.; Hofmann, S. Combined high-precision ∆48 and ∆47 analysis of carbonates. Chem. Geol. 2019, 522, 186–191. [Google Scholar] [CrossRef]
- Nürnberg, D.; Bijma, J.; Hemleben, C. Assessing the reliability of magnesium in foraminiferal calcite as a proxy for water mass temperatures. Geochim. Cosmochim. Acta 1996, 60, 803–814. [Google Scholar] [CrossRef] [Green Version]
- Corrège, T. Sea surface temperature and salinity reconstruction from coral geochemical tracers. Palaeogeogr. Palaeoclimatol. Palaeoecol. 2006, 232, 408–428. [Google Scholar] [CrossRef]
- Dodd, J.R. Environmental control of strontium and magnesium in Mytilus. Geochim. Cosmochim. Acta 1965, 29, 385–398. [Google Scholar] [CrossRef]
- Lorrain, A.; Gillikin, D.P.; Paulet, Y.-M.; Chauvaud, L.; Mercier, A.L.; Navez, J.; André, L. Strong kinetic effects on Sr/Ca ratios in the calcitic bivalve Pecten maximus. Geology 2005, 33, 965–968. [Google Scholar] [CrossRef] [Green Version]
- Surge, D.; Walker, K.J. Geochemical variation in microstructural shell layers of the southern quahog (Mercenaria campechiensis): Implications for reconstructing seasonality. Palaeogeogr. Palaeoclimatol. Palaeoecol. 2006, 237, 182–190. [Google Scholar] [CrossRef]
- Foster, L.C.; Allison, N.; Finch, A.A.; Andersson, C. Strontium distribution in the shell of the aragonite bivalve Arctica islandica: Sr in the shell of Arctica islandica. Geochem. Geophys. Geosyst. 2009, 10, Q03003. [Google Scholar] [CrossRef]
- Schöne, B.R.; Zhang, Z.; Radermacher, P.; Thébault, J.; Jacob, D.E.; Nunn, E.V.; Maurer, A.-F. Sr/Ca and Mg/Ca ratios of ontogenetically old, long-lived bivalve shells (Arctica islandica) and their function as paleotemperature proxies. Palaeogeogr. Palaeoclimatol. Palaeoecol. 2011, 302, 52–64. [Google Scholar] [CrossRef]
- Sano, Y.; Kobayashi, S.; Shirai, K.; Takahata, N.; Matsumoto, K.; Watanabe, T.; Sowa, K.; Iwai, K. Past daily light cycle recorded in the strontium/calcium ratios of giant clam shells. Nat. Commun. 2012, 3, 761. [Google Scholar] [CrossRef] [PubMed] [Green Version]
- Vihtakari, M.; Ambrose, W.G.; Renaud, P.E.; Locke, W.L.; Carroll, M.L.; Berge, J.; Clarke, L.J.; Cottier, F.; Hop, H. A key to the past? Element ratios as environmental proxies in two Arctic bivalves. Palaeogeogr. Palaeoclimatol. Palaeoecol. 2016, 465, 316–332. [Google Scholar] [CrossRef] [Green Version]
- Wanamaker, A.D.; Gillikin, D.P. Strontium, magnesium, and barium incorporation in aragonitic shells of juvenile Arctica islandica: Insights from temperature controlled experiments. Chem. Geol. 2019, 526, 117–129. [Google Scholar] [CrossRef]
- Izumida, H.; Yoshimura, T.; Suzuki, A.; Nakashima, R.; Ishimura, T.; Yasuhara, M.; Inamura, A.; Shikazono, N.; Kawahata, H. Biological and water chemistry controls on Sr/Ca, Ba/Ca, Mg/Ca and δ18O profiles in freshwater pearl mussel Hyriopsis sp. Palaeogeogr. Palaeoclimatol. Palaeoecol. 2011, 309, 298–308. [Google Scholar] [CrossRef]
- Gaetani, G.A.; Cohen, A.L. Element partitioning during precipitation of aragonite from seawater: A framework for understanding paleoproxies. Geochim. Cosmochim. Acta 2006, 70, 4617–4634. [Google Scholar] [CrossRef]
- Yan, H.; Shao, D.; Wang, Y.; Sun, L. High resolution Sr/Ca profile of Tridacna gigas from Xisha Islands of South China Sea and its potential application on sea surface temperature reconstruction. J. Earth Environ. 2011, 2, 381–386. [Google Scholar]
- Yan, H.; Shao, D.; Wang, Y.; Sun, L. Sr/Ca profile of long-lived Tridacna gigas bivalves from South China Sea: A new high-resolution SST proxy. Geochim. Cosmochim. Acta 2013, 112, 52–65. [Google Scholar] [CrossRef]
- Yan, H.; Shao, D.; Wang, Y.; Sun, L. Sr/Ca differences within and among three Tridacnidae species from the South China Sea: Implication for paleoclimate reconstruction. Chem. Geol. 2014, 390, 22–31. [Google Scholar] [CrossRef]
- Füllenbach, C.S.; Schöne, B.R.; Mertz-Kraus, R. Strontium/lithium ratio in aragonitic shells of Cerastoderma edule (Bivalvia)—A new potential temperature proxy for brackish environments. Chem. Geol. 2015, 417, 341–355. [Google Scholar] [CrossRef]
- Zhao, L.; Schöne, B.R.; Mertz-Kraus, R. Controls on strontium and barium incorporation into freshwater bivalve shells (Corbicula fluminea). Palaeogeogr. Palaeoclimatol. Palaeoecol. 2017, 465, 386–394. [Google Scholar] [CrossRef]
- Shirai, K.; Takahata, N.; Yamamoto, H.; Omata, T.; Sasaki, T.; Sano, Y. Novel analytical approach to bivalve shell biogeochemistry: A case study of hydrothermal mussel shell. Geochem. J. 2008, 42, 413–420. [Google Scholar] [CrossRef] [Green Version]
- Füllenbach, C.S.; Schöne, B.R.; Shirai, K.; Takahata, N.; Ishida, A.; Sano, Y. Minute co-variations of Sr/Ca ratios and microstructures in the aragonitic shell of Cerastoderma edule (Bivalvia)—Are geochemical variations at the ultra-scale masking potential environmental signals? Geochim. Cosmochim. Acta 2017, 205, 256–271. [Google Scholar] [CrossRef]
- Roger, L.M.; George, A.D.; Shaw, J.; Hart, R.D.; Roberts, M.; Becker, T.; McDonald, B.J.; Evans, N.J. Geochemical and microstructural characterisation of two species of cool-water bivalves (Fulvia tenuicostata and Soletellina biradiata) from Western Australia. Biogeosciences 2017, 14, 1721–1737. [Google Scholar] [CrossRef] [Green Version]
- Schöne, B.R.; Radermacher, P.; Zhang, Z.; Jacob, D.E. Crystal fabrics and element impurities (Sr/Ca, Mg/Ca, and Ba/Ca) in shells of Arctica islandica—Implications for paleoclimate reconstructions. Palaeogeogr. Palaeoclimatol. Palaeoecol. 2013, 373, 50–59. [Google Scholar] [CrossRef]
- Shirai, K.; Schöne, B.R.; Miyaji, T.; Radarmacher, P.; Krause, R.A.; Tanabe, K. Assessment of the mechanism of elemental incorporation into bivalve shells (Arctica islandica) based on elemental distribution at the microstructural scale. Geochim. Cosmochim. Acta 2014, 126, 307–320. [Google Scholar] [CrossRef]
- Höche, N.; Walliser, E.O.; de Winter, N.J.; Witbaard, R.; Schöne, B.R. Temperature-induced microstructural changes in shells of laboratory-grown Arctica islandica (Bivalvia). PLoS ONE 2021, 16, e0247968. [Google Scholar] [CrossRef] [PubMed]
- Jochum, K.P.; Nohl, U.; Herwig, K.; Lammel, E.; Stoll, B.; Hofmann, A.W. GeoReM: A new geochemical database for reference materials and isotopic standards. Geostand. Geoanalyt. Res. 2005, 29, 333–338. [Google Scholar] [CrossRef]
- Jochum, K.P.; Weis, U.; Stoll, B.; Kuzmin, D.; Yang, Q.; Raczek, I.; Jacob, D.E.; Stracke, A.; Birbaum, K.; Frick, D.A.; et al. Determination of reference values for NIST SRM 610-617 glasses following ISO guidelines. Geostand. Geoanal. Res. 2011, 35, 397–429. [Google Scholar] [CrossRef]
- Griffin, W.L. GLITTER: Data reduction software for laser ablation ICP-MS. In Laser Ablation ICP-MS in the Earth Sciences: Current Practices and Outstanding Issues; Mineralogy Association of Canada: Quebec City, QC, Canada, 2008; pp. 308–311. [Google Scholar]
- Jochum, K.P.; Scholz, D.; Stoll, B.; Weis, U.; Wilson, S.A.; Yang, Q.; Schwalb, A.; Börner, N.; Jacob, D.E.; Andreae, M.O. Accurate trace element analysis of speleothems and biogenic calcium carbonates by LA-ICP-MS. Chem. Geol. 2012, 318–319, 31–44. [Google Scholar] [CrossRef]
- Marali, S.; Schöne, B.R.; Mertz-Kraus, R.; Griffin, S.M.; Wanamaker, A.D.; Butler, P.G.; Holland, H.A.; Jochum, K.P. Reproducibility of trace element time-series (Na/Ca, Mg/Ca, Mn/Ca, Sr/Ca, and Ba/Ca) within and between specimens of the bivalve Arctica islandica—A LA-ICP-MS line scan study. Palaeogeogr. Palaeoclimatol. Palaeoecol. 2017, 484, 109–128. [Google Scholar] [CrossRef]
- Höche, N.; Walliser, E.O.; Schöne, B.R. Microstructural mapping of Arctica islandica shells reveals environmental and physiological controls on biomineral size. Front. Earth Sci. 2022, 9, 781305. [Google Scholar] [CrossRef]
- Berg, S.; Kutra, D.; Kroeger, T.; Straehle, C.N.; Kausler, B.X.; Haubold, C.; Schiegg, M.; Ales, J.; Beier, T.; Rudy, M.; et al. ilastik: Interactive machine learning for (bio)image analysis. Nat. Methods 2019, 16, 1226–1232. [Google Scholar] [CrossRef]
- van der Walt, S.; Schönberger, J.L.; Nunez-Iglesias, J.; Boulogne, F.; Warner, J.D.; Yager, N.; Gouillart, E.; Yu, T. Scikit-image: Image processing in Python. PeerJ 2014, 2, e453. [Google Scholar] [CrossRef]
- Höche, N.; Walliser, E.O.; Schöne, B.R. Data for “Microstructural Mapping of A. Islandica Shells Reveals Environmental and Physiological Controls on Biomineral Size” (1.0) [Data set]. Zenodo 2021. [Google Scholar] [CrossRef]
- Hanna, E.; Jónsson, T.; Ólafsson, J.; Valdimarsson, H. Icelandic coastal sea surface temperature records constructed: Putting the pulse on air–sea–climate interactions in the Northern North Atlantic. Part I: Comparison with HadISST1 open-ocean surface temperatures and preliminary analysis of long-term patterns and anomalies of SSTs around Iceland. J. Clim. 2006, 19, 5652–5666. [Google Scholar] [CrossRef] [Green Version]
- Schöne, B.R. Arctica islandica (Bivalvia): A unique paleoenvironmental archive of the northern North Atlantic Ocean. Glob. Planet. Change 2013, 111, 199–225. [Google Scholar] [CrossRef]
- Kinsman, D.J.J.; Holland, H.D. The co-precipitation of cations with CaCO3—IV. The co-precipitation of Sr2+ with aragonite between 16° and 96 °C. Geochim. Cosmochim. Acta 1969, 33, 1–17. [Google Scholar] [CrossRef]
- Gillikin, D.P.; Lorrain, A.; Paulet, Y.-M.; André, L.; Dehairs, F. Synchronous barium peaks in high-resolution profiles of calcite and aragonite marine bivalve shells. Geo-Mar. Lett. 2008, 28, 351–358. [Google Scholar] [CrossRef] [Green Version]
- Dietzel, M.; Gussone, N.; Eisenhauer, A. Co-precipitation of Sr2+ and Ba2+ with aragonite by membrane diffusion of CO2 between 10 and 50 °C. Chem. Geol. 2004, 203, 139–151. [Google Scholar] [CrossRef]
- Hart, S.R.; Blusztajn, J. Clams as recorders of ocean ridge volcanism and hydrothermal vent field activity. Science 1998, 280, 883–886. [Google Scholar] [CrossRef] [PubMed]
- Toland, H.; Perkins, B.; Pearce, N.; Keenan, F.; Leng, M.J. A study of sclerochronology by laser ablation ICP-MS. J. Anal. At. Spectrom. 2000, 15, 1143–1148. [Google Scholar] [CrossRef]
- Stecher, H.A.; Krantz, D.E.; Lord, C.J.; Luther, G.W.; Bock, K.W. Profiles of strontium and barium in Mercenaria mercenaria and Spisula solidissima shells. Geochim. Cosmochim. Acta 1996, 60, 3445–3456. [Google Scholar] [CrossRef]
- Gillikin, D.P.; Lorrain, A.; Navez, J.; Taylor, J.W.; André, L.; Keppens, E.; Baeyens, W.; Dehairs, F. Strong biological controls on Sr/Ca ratios in aragonitic marine bivalve shells: Controls on Sr/Ca ratios. Geochem. Geophys. Geosyst. 2005, 6, Q05009. [Google Scholar] [CrossRef] [Green Version]
- Schleinkofer, N.; Raddatz, J.; Evans, D.; Gerdes, A.; Flögel, S.; Voigt, S.; Büscher, J.V.; Wisshak, M. Compositional variability of Mg/Ca, Sr/Ca, and Na/Ca in the deep-sea bivalve Acesta excavata (Fabricius, 1779). PLoS ONE 2021, 16, e0245605. [Google Scholar] [CrossRef]
- Shen, C.-C.; Liu, K.-K.; Lee, M.-Y.; Lee, T.; Wang, C.-H.; Lee, H.-J. A novel method for tracing coastal water masses using Sr/Ca ratios and salinity in Nanwan Bay, southern Taiwan. Estuar. Coast. Shelf Sci. 2005, 65, 135–142. [Google Scholar] [CrossRef]
- Schöne, B.R.; Zhang, Z.; Jacob, D.; Gillikin, D.P.; Tütken, T.; Garbe-Schönberg, D.; McConnaughey, T.; Soldati, A. Effect of organic matrices on the determination of the trace element chemistry (Mg, Sr, Mg/Ca, Sr/Ca) of aragonitic bivalve shells (Arctica islandica)—Comparison of ICP-OES and LA-ICP-MS data. Geochem. J. 2010, 44, 23–37. [Google Scholar] [CrossRef] [Green Version]
- Ropes, J.H. Procedures for preparing acetate peels and evidence validating the annual periodicity of growth lines formed in the shells of ocean quahogs, Arctica islandica. Mar. Fish. Rev. 1984, 46, 27–35. [Google Scholar]
- Dunca, E.; Mutvei, H.; Göransson, P.; Mörth, C.-M.; Schöne, B.R.; Whitehouse, M.J.; Elfman, M.; Baden, S.P. Using ocean quahog (Arctica islandica) shells to reconstruct palaeoenvironment in Öresund, Kattegat and Skagerrak, Sweden. Int. J. Earth Sci. 2009, 98, 3–17. [Google Scholar] [CrossRef]
- Karney, G.B.; Butler, P.G.; Scourse, J.D.; Richardson, C.A.; Lau, K.H.; Czernuszka, J.T.; Grovenor, C.R.M. Identification of growth increments in the shell of the bivalve mollusc Arctica islandica using backscattered electron imaging: Identification of growth increments in the shell of the bivalve mollusc. J. Microsc. 2011, 241, 29–36. [Google Scholar] [CrossRef] [Green Version]
- Karney, G.B.; Butler, P.G.; Speller, S.; Scourse, J.D.; Richardson, C.A.; Schröder, M.; Hughes, G.M.; Czernuszka, J.T.; Grovenor, C.R.M. Characterizing the microstructure of Arctica islandica shells using NanoSIMS and EBSD. Geochem. Geophys. Geosyst. 2012, 13, Q04002. [Google Scholar] [CrossRef]
- Markulin, K.; Peharda, M.; Mertz-Kraus, R.; Schöne, B.R.; Uvanović, H.; Kovač, Ž.; Janeković, I. Trace and minor element records in aragonitic bivalve shells as environmental proxies. Chem. Geol. 2019, 507, 120–133. [Google Scholar] [CrossRef]
- Goldschmidt, V.M. Die Gesetze der Krystallochemie. Naturwissenschaften 1926, 14, 477–485. [Google Scholar] [CrossRef]
- Amiel, A.J.; Friedman, G.M.; Miller, D.S. Distribution and nature of incorporation of trace elements in modern aragonitic corals. Sedimentology 1973, 20, 47–64. [Google Scholar] [CrossRef]
- Speer, J.A. Chapter 5. Crystal chemistry and phase relations of orthorhombic carbonates. In Carbonates; Reeder, R.J., Ed.; De Gruyter: Washington, DC, USA, 1983; pp. 145–190. ISBN 978-1-5015-0813-4. [Google Scholar]
- Lebrato, M.; Garbe-Schönberg, D.; Müller, M.N.; Blanco-Ameijeiras, S.; Feely, R.A.; Lorenzoni, L.; Molinero, J.-C.; Bremer, K.; Jones, D.O.B.; Iglesias-Rodriguez, D.; et al. Global variability in seawater Mg:Ca and Sr:Ca ratios in the modern ocean. Proc. Natl. Acad. Sci. USA 2020, 117, 22281–22292. [Google Scholar] [CrossRef]
- Boon, P.J.; Cooksley, S.L.; Geist, J.; Killeen, I.J.; Moorkens, E.A.; Sime, I. Developing a standard approach for monitoring freshwater pearl mussel (Margaritifera margaritifera) populations in European rivers. Aquatic. Conserv. Mar. Freshw. Ecosyst. 2019, 29, 1365–1379. [Google Scholar] [CrossRef]
- Plummer, L.N.; Busenberg, E. Thermodynamics of aragonite-strontianite solid solutions: Results from stoichiometric solubility at 25 and 76 °C. Geochim. Cosmochim. Acta 1987, 51, 1393–1411. [Google Scholar] [CrossRef]
- Paquette, J.; Reeder, R.J. Relationship between surface structure, growth mechanism, and trace element incorporation in calcite. Geochim. Cosmochim. Acta 1995, 59, 735–749. [Google Scholar] [CrossRef]
- Mavromatis, V.; Brazier, J.-M.; Goetschl, K.E. Controls of temperature and mineral growth rate on Mg incorporation in aragonite. Geochim. Cosmochim. Acta 2022, 317, 53–64. [Google Scholar] [CrossRef]
- Menadakis, M.; Maroulis, G.; Koutsoukos, P.G. Incorporation of Mg2+, Sr2+, Ba2+ and Zn2+ into aragonite and comparison with calcite. J. Math. Chem. 2008, 46, 484–491. [Google Scholar] [CrossRef]
- Kawano, J.; Sakuma, H.; Nagai, T. Incorporation of Mg2+ in surface Ca2+ sites of aragonite: An ab initio study. Prog. Earth Planet. Sci. 2015, 2, 7. [Google Scholar] [CrossRef]
- Reeder, R.J.; Grams, J.C. Sector zoning in calcite cement crystals: Implications for trace element distributions in carbonates. Geochim. Cosmochim. Acta 1987, 51, 187–194. [Google Scholar] [CrossRef]
- Glazier, D.S. A unifying explanation for diverse metabolic scaling in animals and plants. Biol. Rev. 2010, 85, 111–138. [Google Scholar] [CrossRef]
- Okie, J.G. General models for the spectra of surface area scaling strategies of cells and organisms: Fractality, geometric dissimilitude, and internalization. Am. Nat. 2013, 181, 421–439. [Google Scholar] [CrossRef]
- Gotliv, B.-A.; Addadi, L.; Weiner, S. Mollusk shell acidic proteins: In search of individual functions. ChemBioChem 2003, 4, 522–529. [Google Scholar] [CrossRef]
- Cusack, M.; Freer, A. Biomineralization: Elemental and organic influence in carbonate systems. Chem. Rev. 2008, 108, 4433–4454. [Google Scholar] [CrossRef] [PubMed]
- Ren, D.; Feng, Q.; Bourrat, X. Effects of additives and templates on calcium carbonate mineralization in vitro. Micron 2011, 42, 228–245. [Google Scholar] [CrossRef] [PubMed] [Green Version]
- Wang, D.; Wallace, A.F.; De Yoreo, J.J.; Dove, P.M. Carboxylated molecules regulate magnesium content of amorphous calcium carbonates during calcification. Proc. Natl. Acad. Sci. USA 2009, 106, 21511–21516. [Google Scholar] [CrossRef] [PubMed] [Green Version]
- Lorens, R.B.; Bender, M.L. The impact of solution chemistry on Mytilus edulis calcite and aragonite. Geochim. Cosmochim. Acta 1980, 44, 1265–1278. [Google Scholar] [CrossRef]
- Tanabe, K. Age and growth rate determinations of an intertidal bivalve, Phacosoma japonicum, using internal shell increments. Lethaia 1988, 21, 231–241. [Google Scholar] [CrossRef]
- Yoshimura, T.; Tamenori, Y.; Suzuki, A.; Nakashima, R.; Iwasaki, N.; Hasegawa, H.; Kawahata, H. Element profile and chemical environment of sulfur in a giant clam shell: Insights from μ-XRF and X-ray absorption near-edge structure. Chem. Geol. 2013, 352, 170–175. [Google Scholar] [CrossRef]
- Stemmer, K.; Nehrke, G. The distribution of polyenes in the shell of Arctica islandica from North Atlantic localities: A confocal Raman microscopy study. J. Molluscan Stud. 2014, 80, 365–370. [Google Scholar] [CrossRef]
- Poulain, C.; Gillikin, D.P.; Thébault, J.; Munaron, J.M.; Bohn, M.; Robert, R.; Paulet, Y.-M.; Lorrain, A. An evaluation of Mg/Ca, Sr/Ca, and Ba/Ca ratios as environmental proxies in aragonite bivalve shells. Chem. Geol. 2015, 396, 42–50. [Google Scholar] [CrossRef] [Green Version]
- Takesue, R.K.; van Geen, A. Mg/Ca, Sr/Ca, and stable isotopes in modern and Holocene Protothaca staminea shells from a northern California coastal upwelling region. Geochim. Cosmochim. Acta 2004, 68, 3845–3861. [Google Scholar] [CrossRef]
- Zhong, S.; Mucci, A. Calcite and aragonite precipitation from seawater solutions of various salinities: Precipitation rates and overgrowth compositions. Chem. Geol. 1989, 78, 283–299. [Google Scholar] [CrossRef]
- Sinclair, D.J.; Sherwood, O.A.; Risk, M.J.; Hillaire-Marcel, C.; Tubrett, M.; Sylvester, P.; McCulloch, M.; Kinsley, L. Testing the reproducibility of Mg/Ca profiles in the deep-water coral Primnoa resedaeformis: Putting the proxy through its paces. In Cold-Water Corals and Ecosystems; Freiwald, A., Roberts, J.M., Eds.; Erlangen Earth Conference Series; Springer: Berlin/Heidelberg, Germany, 2005; pp. 1039–1060. ISBN 978-3-540-24136-2. [Google Scholar]
- Carré, M.; Bentaleb, I.; Bruguier, O.; Ordinola, E.; Barrett, N.T.; Fontugne, M. Calcification rate influence on trace element concentrations in aragonitic bivalve shells: Evidences and mechanisms. Geochim. Cosmochim. Acta 2006, 70, 4906–4920. [Google Scholar] [CrossRef]


| Specimen ID | Ontogenic Age (yr) | # SEM Images | # LA Spots | ||
|---|---|---|---|---|---|
| Ventral Margin | Hinge | Ventral Margin | Hinge | ||
| ICE06-6.2-A201L | 7 | 318 | 44 | 315 | 31 |
| ICE06-6.2-A202L | 6 | 353 | 21 | 351 | 21 |
| ICE06-6.2-A203L | 4 | 259 | 15 | 298 | 21 |
| Variables | SST (°C) | BMU Area (µm²) | Weekly Increment Width (µm) | BMU Elongation | |
|---|---|---|---|---|---|
| Sr/Ca | vm | ||||
| oOSL | |||||
| iOSL | |||||
| hinge | |||||
| dGRSr/Ca | vm | ||||
| vm | |||||
| oOSL | |||||
| iOSL | |||||
| dMSSr/Ca | vm | ||||
| vm | |||||
| oOSL | |||||
| iOSL | |||||
| dGRMSSr/Ca | iOSL | ||||
| oOSL | |||||
Publisher’s Note: MDPI stays neutral with regard to jurisdictional claims in published maps and institutional affiliations. |
© 2022 by the authors. Licensee MDPI, Basel, Switzerland. This article is an open access article distributed under the terms and conditions of the Creative Commons Attribution (CC BY) license (https://creativecommons.org/licenses/by/4.0/).
Share and Cite
Brosset, C.; Höche, N.; Shirai, K.; Nishida, K.; Mertz-Kraus, R.; Schöne, B.R. Strong Coupling between Biomineral Morphology and Sr/Ca of Arctica islandica (Bivalvia)—Implications for Shell Sr/Ca-Based Temperature Estimates. Minerals 2022, 12, 500. https://doi.org/10.3390/min12050500
Brosset C, Höche N, Shirai K, Nishida K, Mertz-Kraus R, Schöne BR. Strong Coupling between Biomineral Morphology and Sr/Ca of Arctica islandica (Bivalvia)—Implications for Shell Sr/Ca-Based Temperature Estimates. Minerals. 2022; 12(5):500. https://doi.org/10.3390/min12050500
Chicago/Turabian StyleBrosset, Cornélia, Nils Höche, Kotaro Shirai, Kozue Nishida, Regina Mertz-Kraus, and Bernd R. Schöne. 2022. "Strong Coupling between Biomineral Morphology and Sr/Ca of Arctica islandica (Bivalvia)—Implications for Shell Sr/Ca-Based Temperature Estimates" Minerals 12, no. 5: 500. https://doi.org/10.3390/min12050500