Article

Efficient Rhodamine B Dye Removal from Water by Acid- and Organo-Modified Halloysites

by
Ewa Wierzbicka
1,*,
Krzysztof Kuśmierek
2,
Andrzej Świątkowski
2 and
Izabella Legocka
1
1
Department of Polymer Technology and Processing, Łukasiewicz-Industrial Chemistry Institute, 01-793 Warsaw, Poland
2
Institute of Chemistry, Military University of Technology, 00-908 Warsaw, Poland
*
Author to whom correspondence should be addressed.
Minerals 2022, 12(3), 350; https://doi.org/10.3390/min12030350
Submission received: 26 January 2022 / Revised: 24 February 2022 / Accepted: 11 March 2022 / Published: 14 March 2022
(This article belongs to the Topic Industrial Application of Clays and Clay Minerals)

Abstract

:
The halloysite has been subjected to modification through ultrasound (HU), sulfuric acid (HU-SA), and oligocyclopentadiene resin (HU-OCPD). The modified materials were characterized by scanning electron microscopy and energy-dispersive X-ray spectroscopy (SEM-EDS), Fourier-transform infrared spectroscopy (FTIR), thermogravimetry (TG), and N2 adsorption-desorption isotherms, and tested as low-cost adsorbents for removal of Rhodamine B dye (RhB) from aqueous solutions. Batch experiments were conducted to study the effect of different operational parameters such as adsorbent dose, solution pH, and contact time. It was observed that the adsorption was strongly pH-dependent and that solution pH at 2.0 had the greatest removal efficiency for the dye. The experimental data were modeled using several isotherm and kinetic models such as Freundlich, Langmuir, Temkin as well as pseudo-first-order, pseudo-second-order, and intraparticle diffusion. It was found that the equilibrium adsorption data can be fitted well using the Freundlich isotherm model and the adsorption kinetics follows a pseudo-second-order model. The adsorption capacity of HU, HU-SA, and HU-OCPD was found to be 8.37, 13.1, and 17.8 mg/g, respectively. The results revealed that surface modification of halloysite via acid activation and polymer loading results in a significant increase in the removal of RhB from aqueous solution. This study has shown potential on organo-halloysite for organic dye adsorption from water.

1. Introduction

Growing production and use of dyes in various industries such as dye manufacturing, pharmaceuticals, paper, textiles, and food companies cause harmful effects on the environment. Dyes in water block the direct sunlight which negatively affects photosynthesis and reduces the amount of oxygen available to aquatic living organisms [1]. Moreover, most organic dyes cause significant health risks due to their toxic (carcinogenic, teratogenic, and mutagenic) nature. Therefore, the removal of color pollutants from the water environment is necessary [1,2].
Numerous methods such as filtration, coagulation, flocculation, membrane treatment, advanced oxidation process, biological treatment, and adsorption have been proposed [1,2,3,4]. Several of these methods constitute one or more limitations and cannot completely clear the water of any dye. Adsorption remains one of the most popular and widespread treatment techniques because it is cost-effective, simple, flexible, and easy to operate [3,4]. The use of many different types of adsorbents for the removal of dyes has been reported in the literature, e.g., [5]. To reduce the costs of adsorption processes, various low-cost alternative sorbents have been proposed [3,4,5,6]. In recent years, as a low-cost adsorbent, clay minerals have been increasingly receiving attention [6]. One of such promising clay-based materials seems to be halloysite. This clay mineral is readily available; deposits with high levels of halloysite occur in Brazil, China, Poland, Turkey, the USA, and elsewhere [7]. Moreover, it can be easily modified, e.g., via thermal treatment (calcination) and acid activation to customize the adsorption properties of the mineral for a specific pollutant [8,9]. Consequently, the adsorption of various dyes from water on raw and modified halloysites has been reported in numerous papers [8,9,10,11,12].
The present study investigated the adsorption efficiency of halloysite to remove Rhodamine B (RhB), one of the most important cationic dyes widely used in paper, paint, and textile industries and as a tracer dye [13,14], in water. Rhodamine B, similar to most synthetic dyes, is highly toxic to living organisms and is suspected of having carcinogenic and mutagenic effects [15,16]. Therefore, due to its highly negative environmental impact, its removal from water is very important. Halloysite treated with the ultrasound (HU) was modified by sulfuric acid (HU-SA) and by OCPD resin (HU-OCPD). The halloysite samples were characterized by different techniques including scanning electron microscopy and energy-dispersive X-ray spectroscopy (SEM-EDS), low-temperature N2 adsorption-desorption, Fourier-transform infrared spectroscopy (FTIR), and thermogravimetry (TG). The adsorption experiments were performed with the halloysite samples under different experimental conditions, followed by kinetic and equilibrium studies. The effect of the adsorbent treatment method on adsorption was investigated. To our best knowledge, the ultrasound-treated halloysite as well as acid- and polymer-modified halloysites have not been used for the adsorptive removal of Rhodamine B yet (see reviews [13,14]). Moreover, as far as we know, the OCPD polymer-modified halloysite for any organic dye or other pollutants adsorption has not been reported to date.

2. Materials and Methods

2.1. Chemicals and Materials

The Rhodamine B dye (RhB) was received from Sigma-Aldrich (St Louis, MO, USA). The molecular formula of RhB as well as the selected properties of the dye are given in Table 1.
The halloysite samples were obtained from “Dunino” mine (Intermark Company, Legnica, Poland). Water white cycloaliphatic hydrocarbon resin Escorez 5380 (OCPD resin) used to modification of halloysite was received from ExxonMobile.
All other chemicals used such as sodium hydroxide (98%), hydrochloric acid (37%), and sulfuric acid (95%) were of analytical grade and were purchased from Chempur (Piekary Śląskie, Poland). The solvent used in the halloysite modification process was acetone supplied by Chempur (Piekary Śląskie, Poland).

2.2. Preparation of the Halloysites Used as Dye Adsorbents

The halloysite samples coming from the Dunino deposit are a type of aluminosilicate clay where the basic structural unit is a single crystal surrounded by a silica tetrahedral sheet and the other alumina octahedral sheet. Between these mentioned layers, the interlayer water exists [17].
The first stage involved the preliminary treatment of virgin halloysite fraction with ultrasound of frequency 35 kHz for 2–3 h with use an ultrasound bath IS-7S (Intersonic S.C., Olsztyn, Poland). Sulfuric acid (SA) and an oligomeric resin (OCPD) were used for the halloysite modification process. The amount of compound used for halloysite modification was derived through numerous preliminary experiments. Finally, the weight ratio of halloysite to modifying compound was, respectively: 1:4 for halloysite modified with sulfuric acid (HU-SA) and 1:3 for halloysite modified with OCPD resin (HU-OCPD). Modified halloysite materials were obtained by mixing selected compound and halloysite at room temperature in a solvent (200 mL of acetone) by using a magnetic stirrer. The obtained product was separated from the unreacted monomer to obtain the final modified halloysite. The obtained product was washed several times with a solvent and dried. The modifiers obtained were in the form of a fine powder, which was ground by grinding the product in a ball mill.

2.3. Characterization of Halloysite Samples

For the characterization of halloysite samples, different techniques were used.
Measurements of modified halloysite samples surface chemical compositions were carried out using the JSM–6490LV JEOL Company scanning electron microscope coupled with an energy dispersive X-ray spectrometer (EDS). FTIR spectra for halloysite samples were recorded with the use of Spectrum 1000 spectrometer (Perkin Elmer, Waltham, MA, USA). Spectroscopy analysis was performed at room temperature in the range of 4000 cm−1 to 400 cm−1 with KBr tablets (mass ratio 1:100). Thermal properties (TG and DTG) of the halloysite samples were determined with a TGA Q50 V20.8 Instrument thermogravimetry analyzer. Samples (15 mg) were heated from ambient temperature to 700 °C at a heating rate of 10 °C/min in a nitrogen atmosphere. The low-temperature nitrogen adsorption-desorption isotherms were determined using a TriStar II 3020 V1.03 (Micromeritcs Company, Norcross, GA, USA). Samples were prepared for analysis in a VacPrep 061 apparatus from Micromeritics. A 0.25–0.40 g sample was weighed and degassed under vacuum initially at 40 °C for 1 h and then at 60 °C for 16 h. The vacuum value after degassing should be approximately 100 mTorr. Samples were cooled to room temperature and weighed before analysis.
The ability of halloysite to adsorb water vapors before and after modification was also tested. The changes in mass as a function of time were investigated for halloysite (HU, HU-SA, HU-OCPD) placed in closed vessels with 1 mL of demineralized water. The halloysite did not touch the water surface. Registered changes have been presented graphically.

2.4. Adsorption Procedure

Adsorption studies were carried out at 25 °C in a batch system. In these experiments, the Erlenmeyer flasks containing a knowing concentration of RhB in solution and an appropriate amount of adsorbent were agitated at 100 rpm. All the experiments were carried out in duplicates and average values were recorded.
The change in the removal of the RhB with halloysite dosage was examined for the dye initial concentration of 10 µmol/L. Different amounts of halloysites, 10, 20, 30, 40, and 50 mg, were employed for adsorption. Due to large differences in the adsorption capacity of individual halloysite, different volumes of RhB solutions were used in the studies: 10, 20, and 30 mL for HU, HU-SA, and HU-OCPD, respectively. Thus, the doses of adsorbents ranged from 1 to 5 g/L for HU, from 0.5 to 2.5 g/L for HU-SA, and from 0.33 to 1.66 g/L for HU-OCPD.
The effect of initial pH on the RhB adsorption was studied for an initial dye concentration of 10 µmol/L at different pH values within the range between 2 and 10. In the solution, pH was adjusted by adding 0.1 mol/L HCl or 0.1mol/L NaOH and measured using a pH meter (Elmetron, Model-CP 505, Zabrze, Poland).
In kinetic studies, the RhB concentration used in adsorption experiments was 10 µmol/L, varying the time of contact between dye and halloysites from 0 to 180 min. The adsorption equilibrium runs were carried out over an RhB concentration range between 2 and 20 µmol/L. In both the kinetic and equilibrium studies, the pH of the solutions was about 4.6, and no pH adjustment was performed.
After agitation, samples at different time intervals (kinetic studies) or after 8 h were centrifuged for 2 min at 2000 rpm.
The concentration of the RhB after adsorption was determined using Carry 3E UV-Vis spectrophotometer (Varian, Palo Alto, CA, USA), at the wavelength of 554 nm. A standard calibration curve for the RhB determination (y = 0.081x + 0.016) was fitted in the range of 0.05–20 µmol/L with R2 = 0.997.
The amounts of RhB adsorbed on halloysite at time t (qt, µmol/g), and at equilibrium (qe, µmol/g) were calculated using Equations (1) and (2), respectively.
q t = C 0 C t V m
q e = C 0 C e V m
where: C0, Ct, and Ce (µmol/L) are respectively the initial, the equilibrium, and the concentration at time t (min), m (g) is the mass of halloysite and V (L) is the volume of the aqueous solution.

3. Results

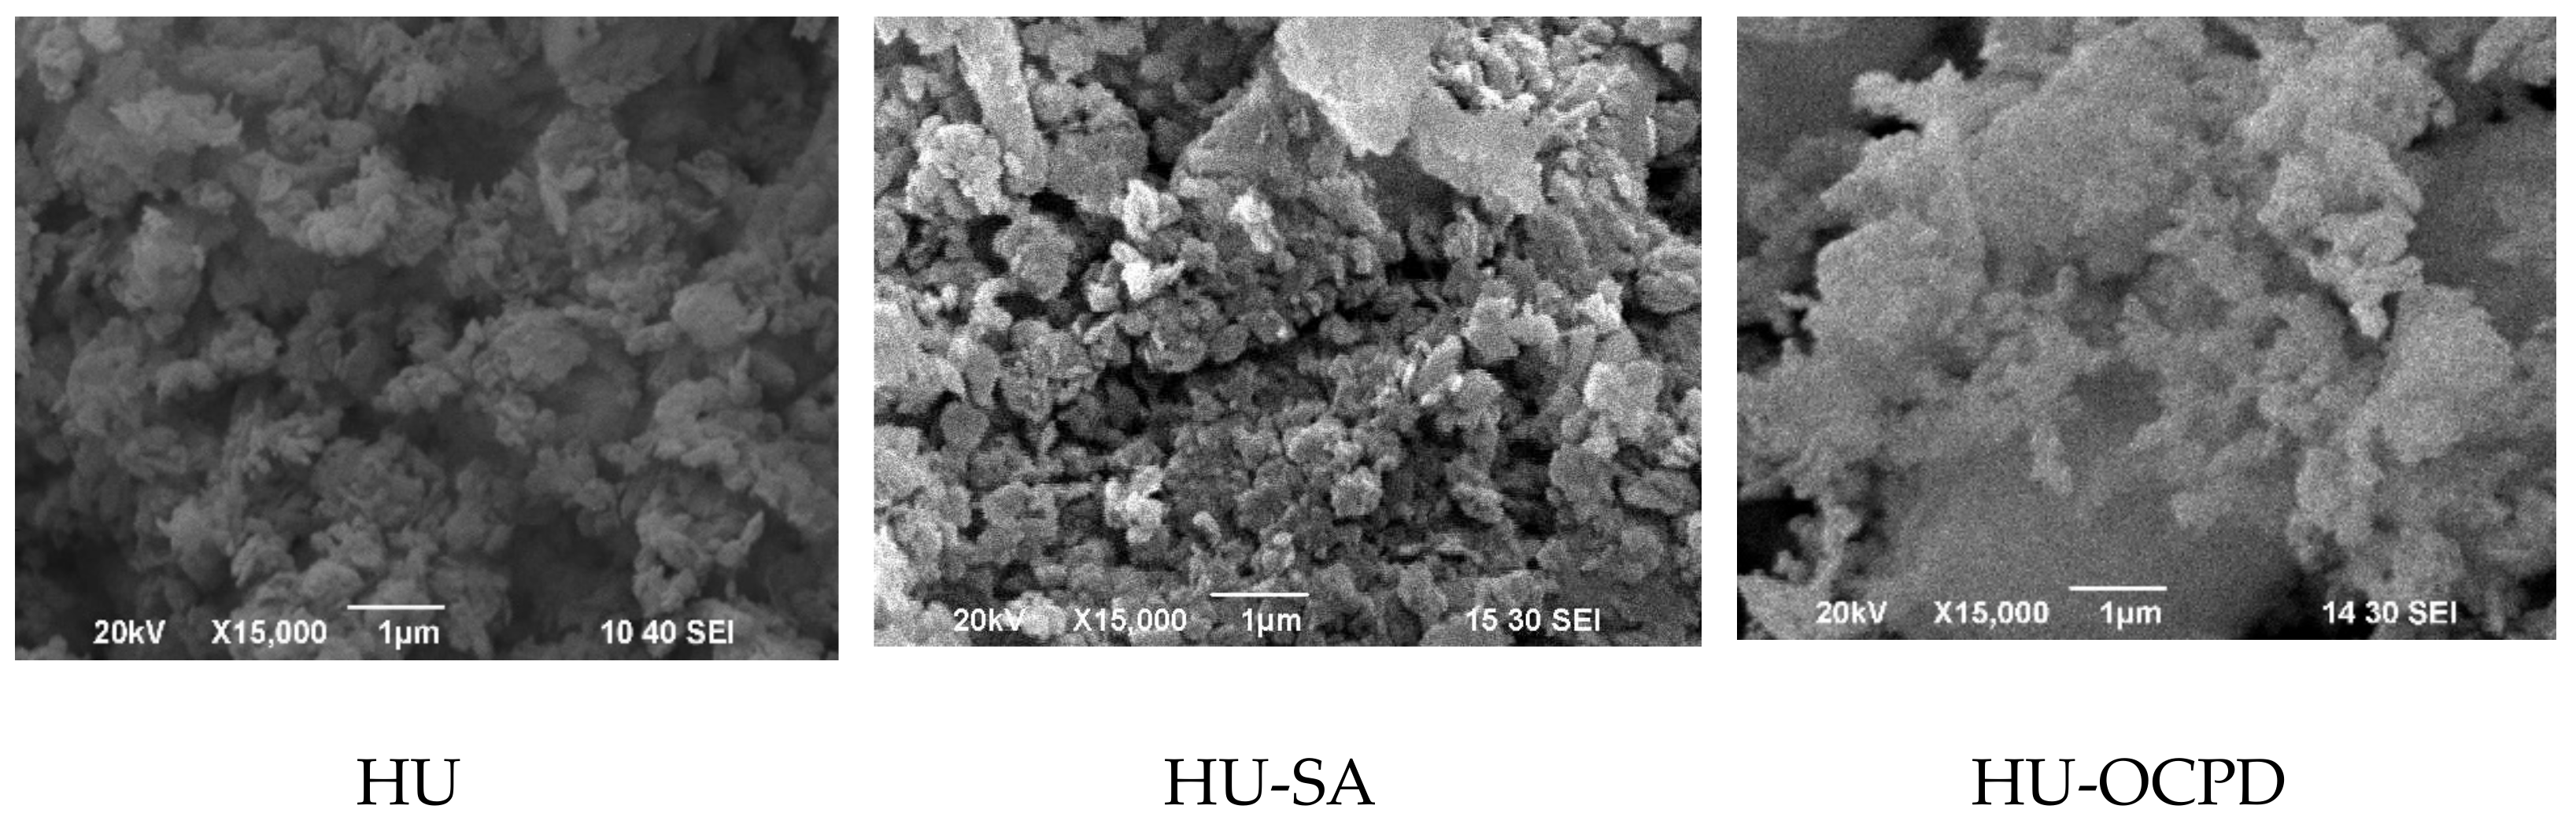
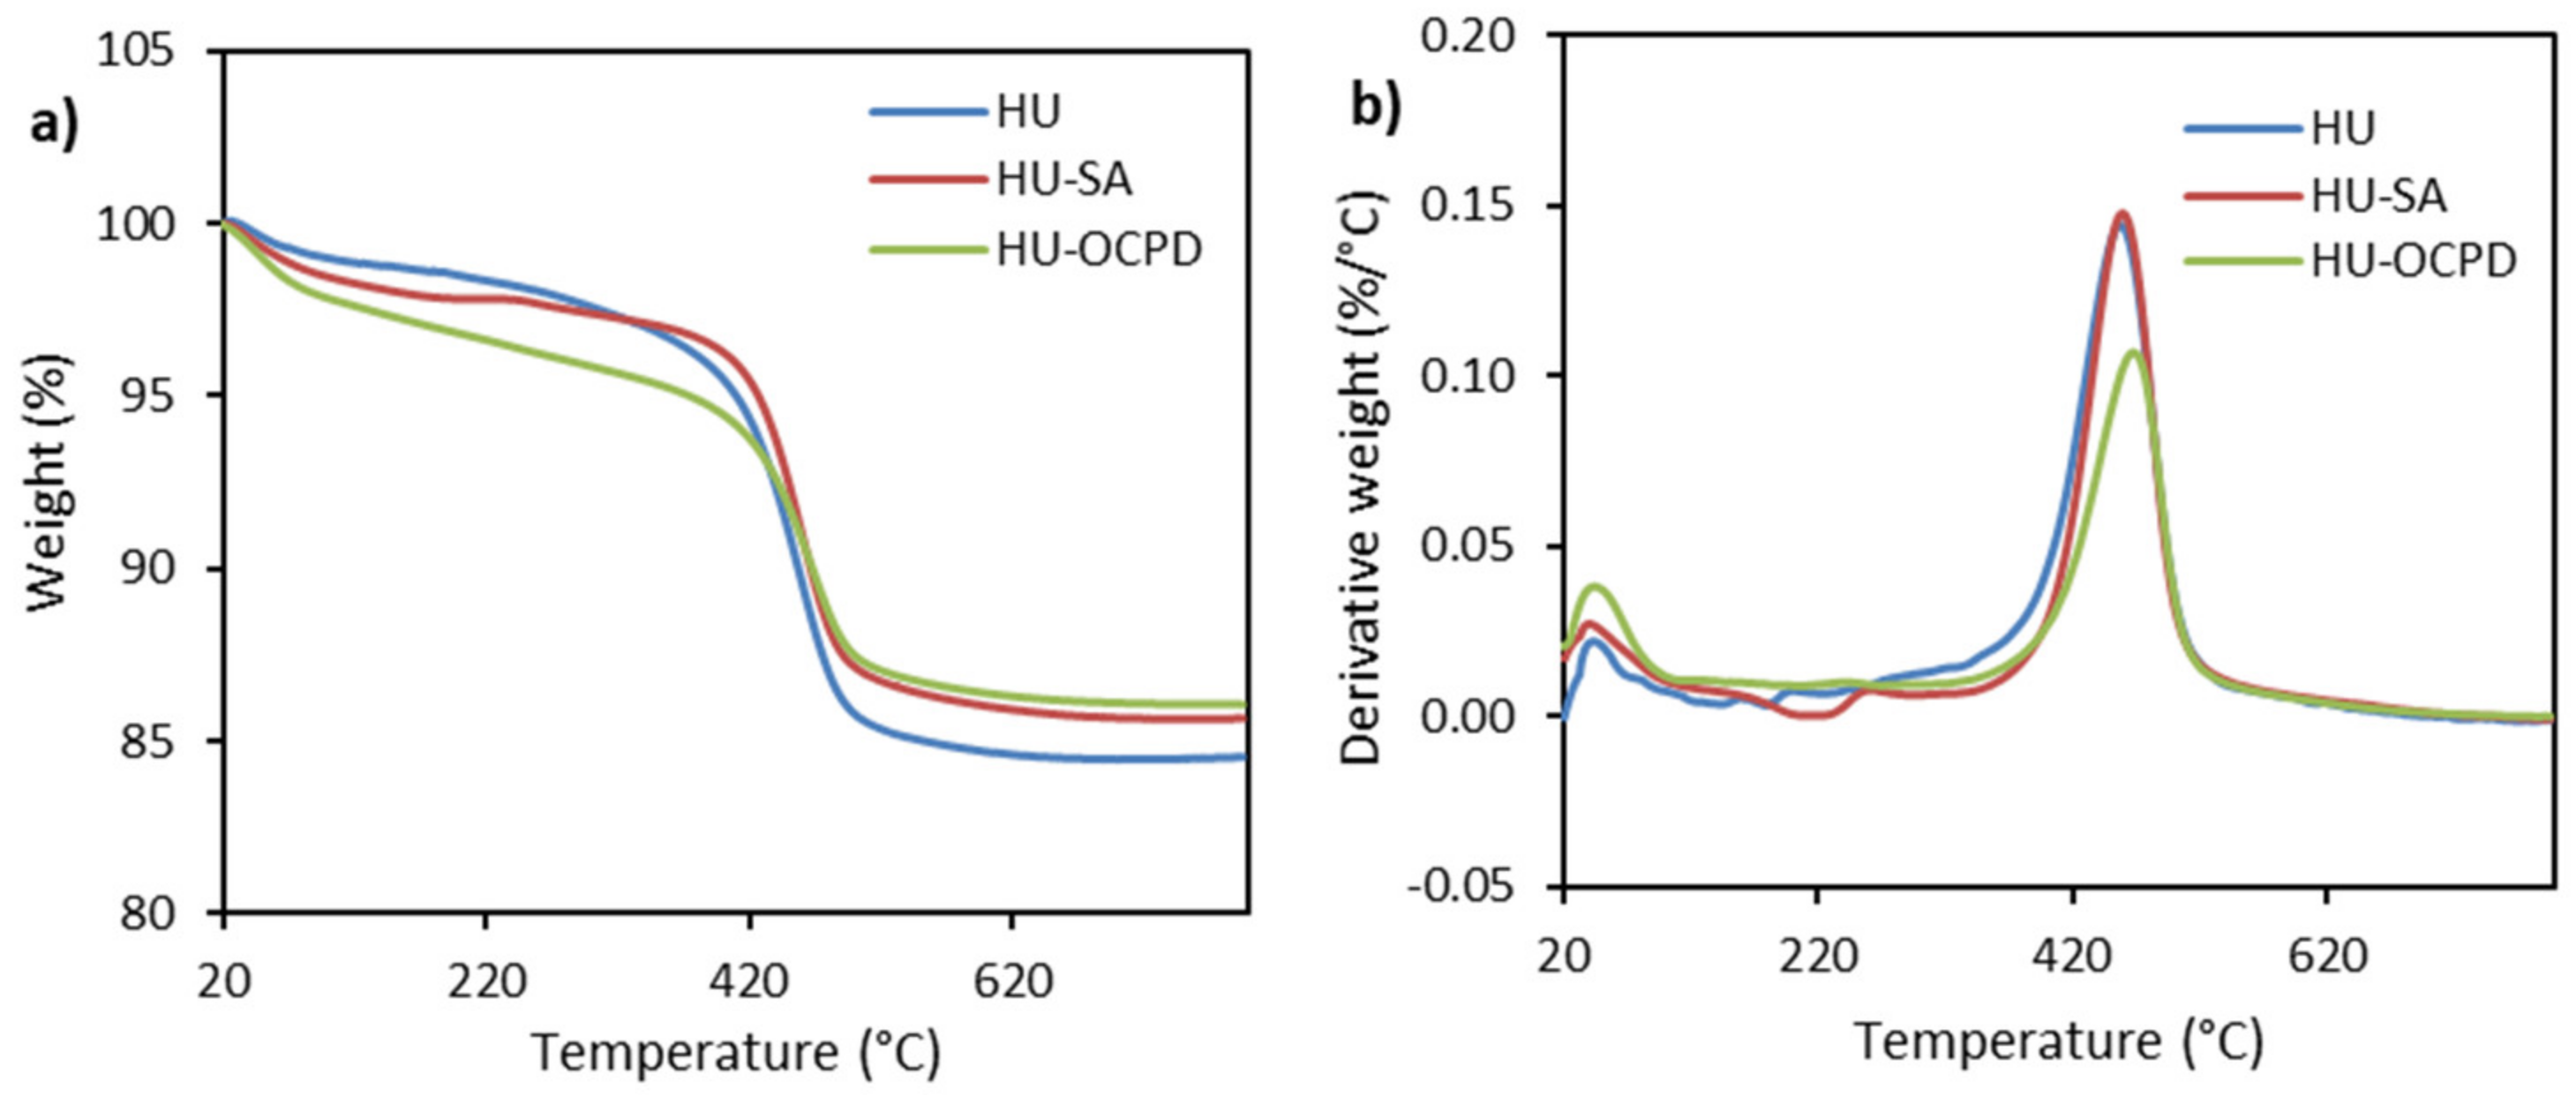
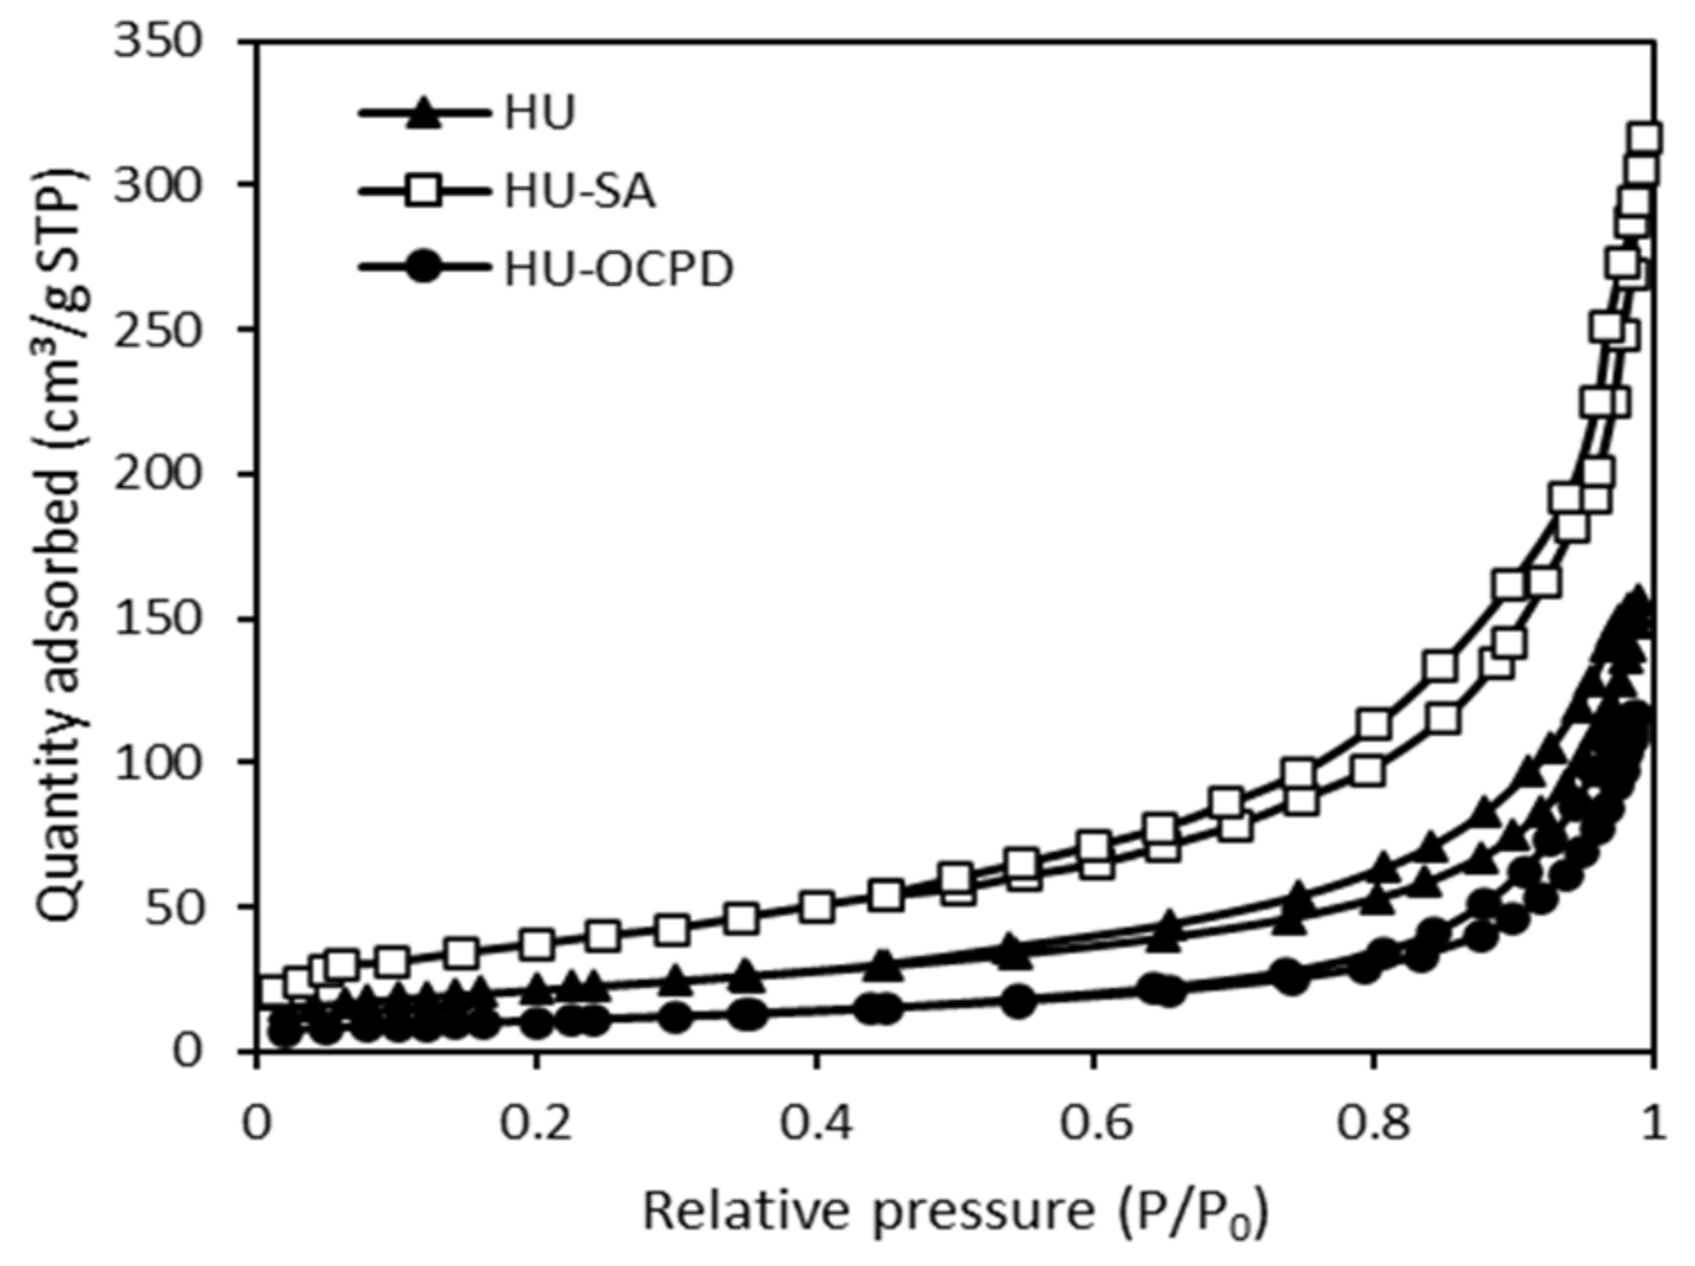
3.1. Physicochemical Characterization of Halloysites

The structure and surface composition of halloysites after modification were measured by scanning electron microscopy and energy-dispersive X-ray spectroscopy. The morphologies of HU, HU-SA, and HU-OCPD samples are shown in Figure 1. It can be seen that the morphology of the studied samples is similar. Tubular, blocky (glued together particles), and flat particles, arranged in different directions were observed in the field of view.
The surface composition of the modified halloysite from EDS analysis was summarized in Table 2. The surface chemistry of the measured samples shows considerable similarity except for sample HU-OCPD. The presence of carbon on the surface of the halloysite modified with OCPD resin was observed. The carbon content in the HU-OCPD sample was 21.8 wt.%, while no carbon was found in the HU and HU-SA samples. This difference is due to the use of an organic compound–oligocyclopentadiene resin in the modification process and a hybrid product was obtained. Modification of halloysite with sulfuric acid does not cause significant changes in O, Al, Si, Fe contents. Similar results were presented in [18]. SEM images in combination with EDS microanalysis of the obtained halloysite materials confirm the modification results.
FTIR spectrum is often used to characterize the structure and coordinative sites of clay-based minerals. Many typical vibration bands can be found on IR spectra of different clay minerals, while the spectra of halloysite in the range 550–1350 cm−1 are similar to kaolinite [19], so the ascriptions are often difficult to be recognized, but they still have some distinctive bands. Each vibration line is assigned to the stretching or deformation of the groups and bonds in the samples according to the literature [20,21,22,23,24]. The FTIR ascriptions of halloysite after modification are shown in Table 3. The double absorption bands at around 3696 cm−1 and 3620 cm−1 were ascribed to the stretching vibration of the adsorbed water. The peaks at 3696 cm−1 corresponded to the stretching of perpendicular surface –OH groups, and the band at around 3620 cm−1 is ascribed to the stretching of –OH coordinated with the tetrahedral sheet and octahedral sheet located in the unit cell of halloysite structural. The peak at 1642–1650 cm−1 could be ascribed to the bending of –OH groups in adsorbed water. The broad bands in the range absorption band at 950–1150 cm−1 originated from the Si–O stretching vibrations in all kinds of silicate-based clay minerals. The spectral bands from 690–800 cm−1 could be designated to the stretching of the Si–O lattice. The double absorption peaks at 534 cm−1 and 468 cm−1 were ascribed to the bending vibration of the Si–O groups. The former should result from the deformation of Al–O–Si frames, and the latter should have originated from the deformation of Si–O–Si bonds. A peak at 1453 cm−1 was observed in the FTIR spectrum of HU-OCPD, which is also present in the OCPD resin spectrum. Additionally, after the modification in the spectrum of halloysite modified with OCPD resin, peaks at 2864 cm−1 and 2964 cm−1 characteristic for CH– bonds present in the structure of OCPD resin were observed.
Figure 2 shows the TG and DTA curves obtained for natural halloysite and its modified samples. As can be seen, TG curves exhibit two main weight loss stages. The first stages in the TG curves observed at 30–53 °C are related to the dehydration of physically adsorbed water and interlayer water [25], while the second stages in the TG curves in the range 456–470 °C regarding the dehydroxylation of structural water. In the TG curves of halloysite modified with the compounds used in this work, additional weight loss stages were observed at 260 °C (HU-SA) and 216 °C (HU-OCPD) confirming the thermal decomposition of the modifying compounds used [26].
According to the International Union of Pure and Applied Chemistry (IUPAC), the experimental nitrogen adsorption-desorption isotherms of the tested samples (Figure 3) are type IV, which indicates a mesoporous character of these materials. IUPAC classified pores into three types: macropores (≥50 nm), mesopores (2–50 nm), and micropores (≤2 nm) [27]. Therefore, for all halloysite materials, it would be appropriate to classify the pore size in the range of 2 nm to 50 nm, as mesopores.
The values of structural parameters calculated from N2 adsorption isotherms are presented in Table 4. The specific surface area values increase in the order HU-OCPD < HU < HU-SA. The mesoporous volumes are much larger than the micropore volumes for each sample. Modification of halloysite by OCPD resin led to a decrease in the specific surface area, while the acid-activation gives the halloysite samples significantly increased specific surface areas as well as the mesopore volumes. These observations are consistent with the results obtained in our earlier work [12,18] or by other authors [28,29], who studied in detail the effect of time and concentration of acid on the halloysite activation.
Adsorption of water vapors tests were also carried out as a function of time for halloysite samples obtained in this work. The results obtained, shown in Figure 4, confirmed the effect of the aluminosilicate modification. The HU-SA sample showed the highest adsorption of water vapors and the HU-OCPD sample was the lowest. This is probably due to the most specific surface area and the presence of sulfuric acid, which is hygroscopic. Ultrasound modification leads to surface development, thus facilitating the adsorption of water vapors. In contrast, modification with ultrasound and a hydrophobic chemical compound (OCPD resin) cause a “sticking” of the pores and a lower adsorption capacity. This was confirmed by TGA analysis, where the highest weight loss was observed for the HU-OCPD sample, which was associated with the greatest changes in halloysite structure. The lowest wettability of HU-OCPD may also be due to the presence of poorly wettable –CH2– groups on its surface (Table 3), which indicates the hydrophobic nature of HU-OCPD.

3.2. Batch Adsorption Studies

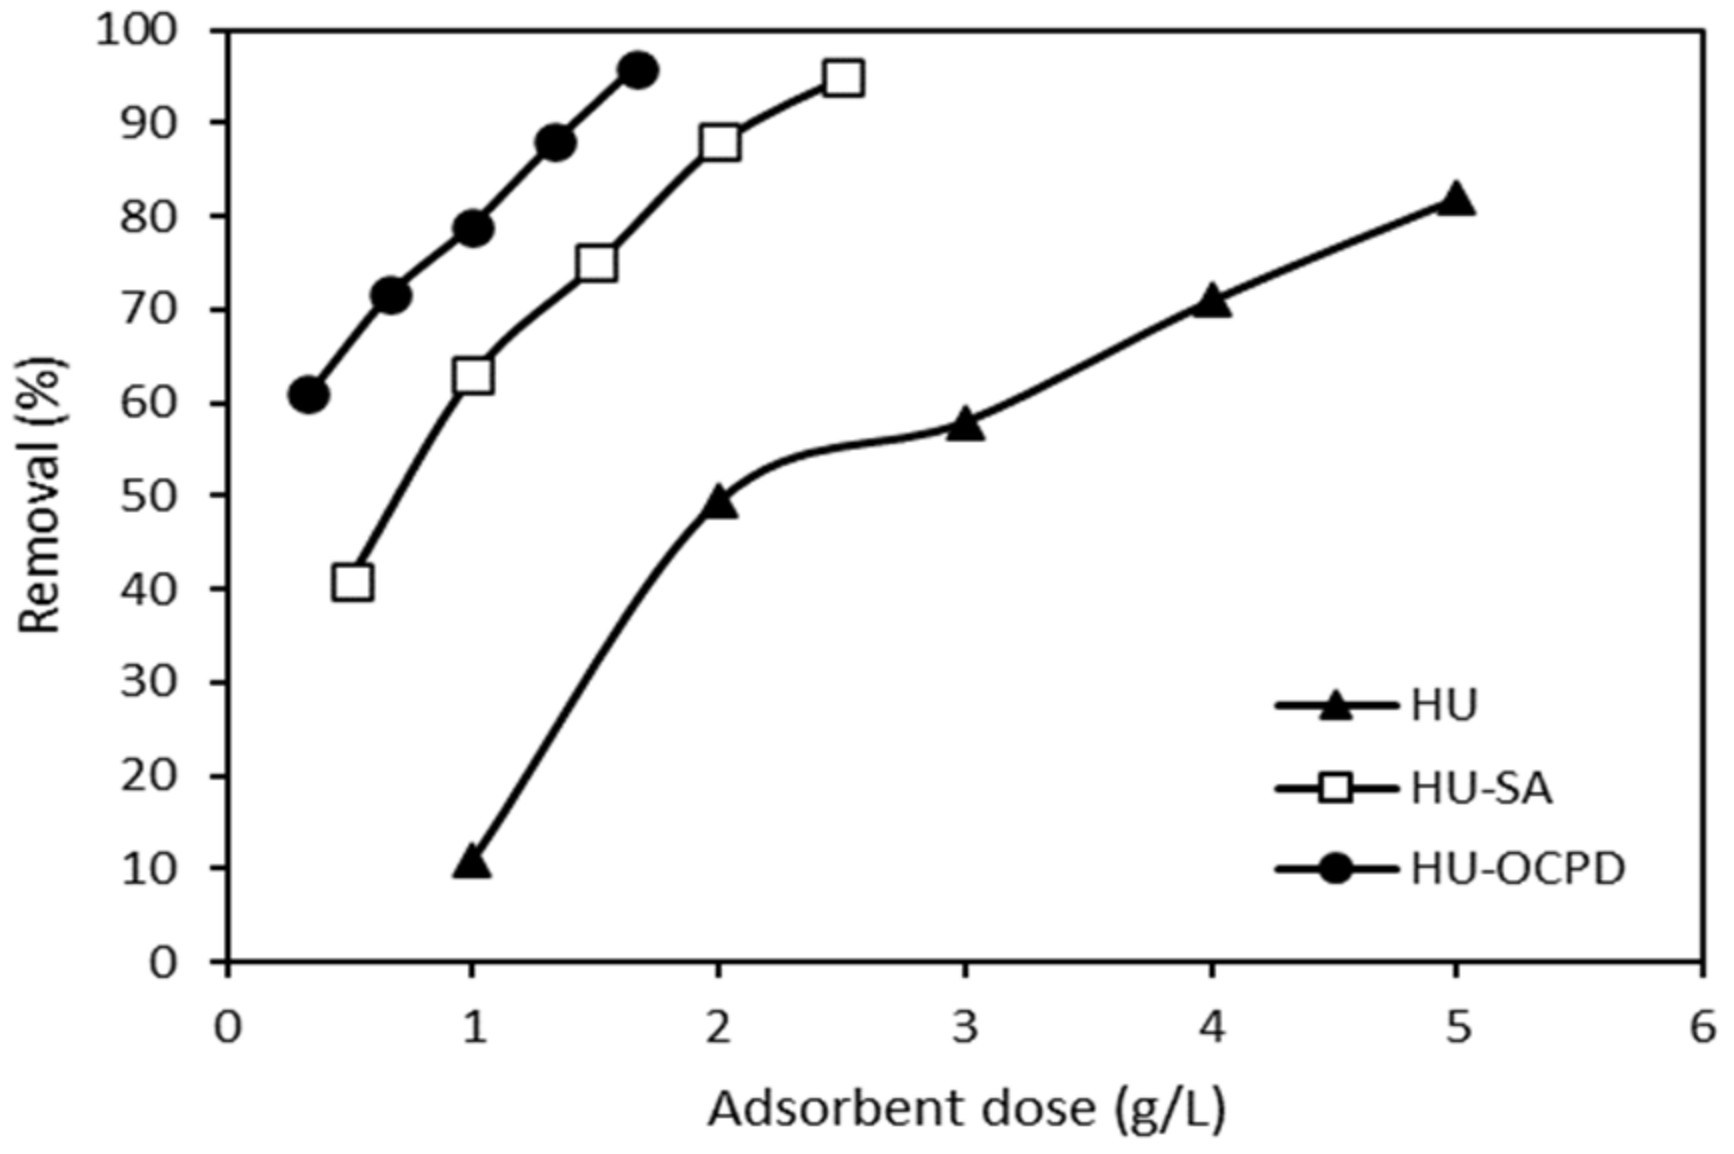
3.2.1. Effect of Adsorbent Dosage

The effect of adsorbent dosage was studied by varying the dose of HU, HU-SA, and HU-OCPD from 1 to 5 g/L, from 0.5 to 2.5 g/L, and from 0.33 to 1.66 g/L, respectively, with the concentration of the dye fixed at 10 µmol/L. The relation between adsorbent dose and adsorption is shown in Figure 5. As can be seen, adsorption of RhB increases with the increase in halloysite dose which is due to the availability of more binding sites for adsorption with an increase in adsorbent dose. Therefore, 0.02 g/10 mL (2 g/L), 0.02 g/20 mL (1 g/L), and 0.02 g/30 mL (0.667 g/L) doses were considered optimum for HU, HU-SA, and HU-OCPD, respectively, and were kept constant in all subsequent adsorption studies.

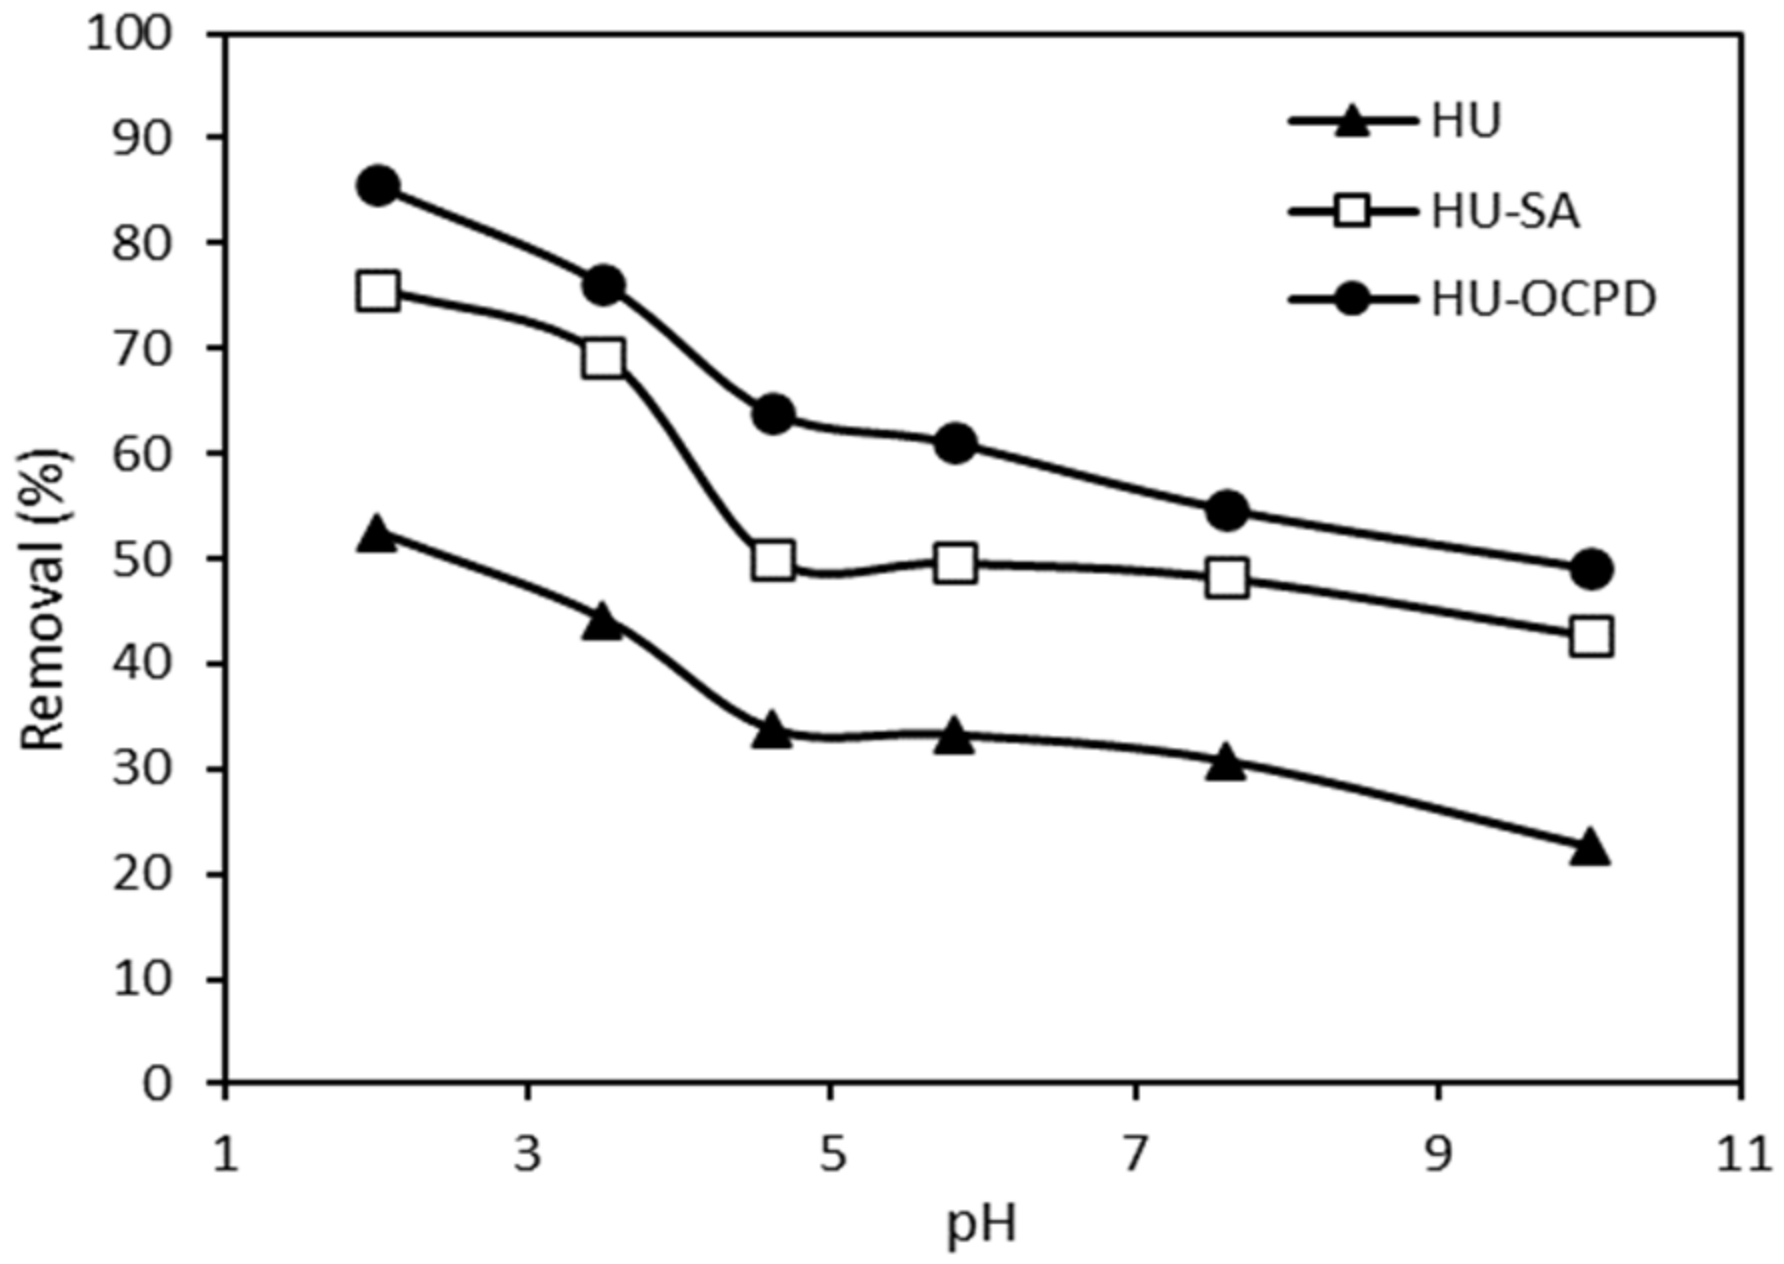
3.2.2. Effect of Solution pH

It is well known that solution pH is a very important parameter that influences the adsorption process because it affects the degree of dissociation and ionization of adsorbate molecules as well as the charge on the adsorbent surface. Thus, the adsorption of RhB on the halloysites with an initial dye concentration of 10 µmol/L was studied by adjusting the solution pH from 2 to 10, and the results are presented in Figure 6.
It can be observed that the adsorption of RhB onto halloysites favored acidic pH value. The optimum adsorption capacity was achieved at pH 2 and as the pH increased from 2 to 10, the adsorption of RhB decreased significantly.
The knowledge of pKa and pHpzc may help explain the adsorption mechanism. The pKa of the RhB is 3.7 which means, that it exists as a cationic form (at pH below pH 3.7) and as a zwitterionic form (at pH above 3.7). The points of zero charge of the halloysites were determined and the pHpzc values for HU, HU-SA, and HU-OCPD were found to be 6.5, 4.5, and 6.4, respectively. Consequently, the adsorbent surface had positive charges at pH < pHpzc, whereas the adsorbent becomes negatively charged at pH > pHpzc.
Dye molecules can interact with the adsorbent surface through electrostatic interactions, hydrophobic-hydrophobic interaction, and hydrogen bonding [30]. If electrostatic interactions were dominant then rhodamine B adsorption should be preferred in an alkaline environment due to adsorbent-adsorbate electrostatic attraction and should be weak in an acidic environment due to electrostatic repulsion between the positively charged adsorbent surface and cationic dye molecules. The obtained results (Figure 6) show an inverse dependence of adsorption on pH. The highest adsorption was noted at a pH of 2.0 which suggests that the hydrophobic-hydrophobic interaction was a dominant mechanism at acidic pH. As it can also be observed from Figure 6, the RhB adsorption efficiency decreased with increasing pH. This may be because at high pH, the adsorbent surface is negatively charged so the adsorption efficiency is reduced due to the electrostatic repulsion between halloysite surface and zwitterionic form of RhB. This suggests that the adsorption of rhodamine B in an alkaline environment is determined by the hydrophobic interactions as well as the hydrogen bonding between the adsorbate molecules and the adsorbent.
It is also worth mentioning that the pH of the solution not only affects the degree of dissociation and ionization of the RhB molecule but also determines the form in which it occurs in the aqueous solution. At lower pH, rhodamine B is present as a monomer, while at a higher pH the attractive electrostatic interaction between the carboxyl and xanthene groups of RhB monomers may raise the aggregation of the dye molecules to bigger dimer forms. The smaller monomeric dye molecules may diffuse into the micropores of the adsorbent more readily than the dimer form which favors adsorption in an acidic environment.
Similar results, a decrease in adsorption with increasing pH, was also reported for adsorption of RhB onto natural zeolites modified with graphene oxide [30], rice husk [31], sugar cane bagasse [32], walnut shells [33], and Casuarina equisetifolia needles [34].

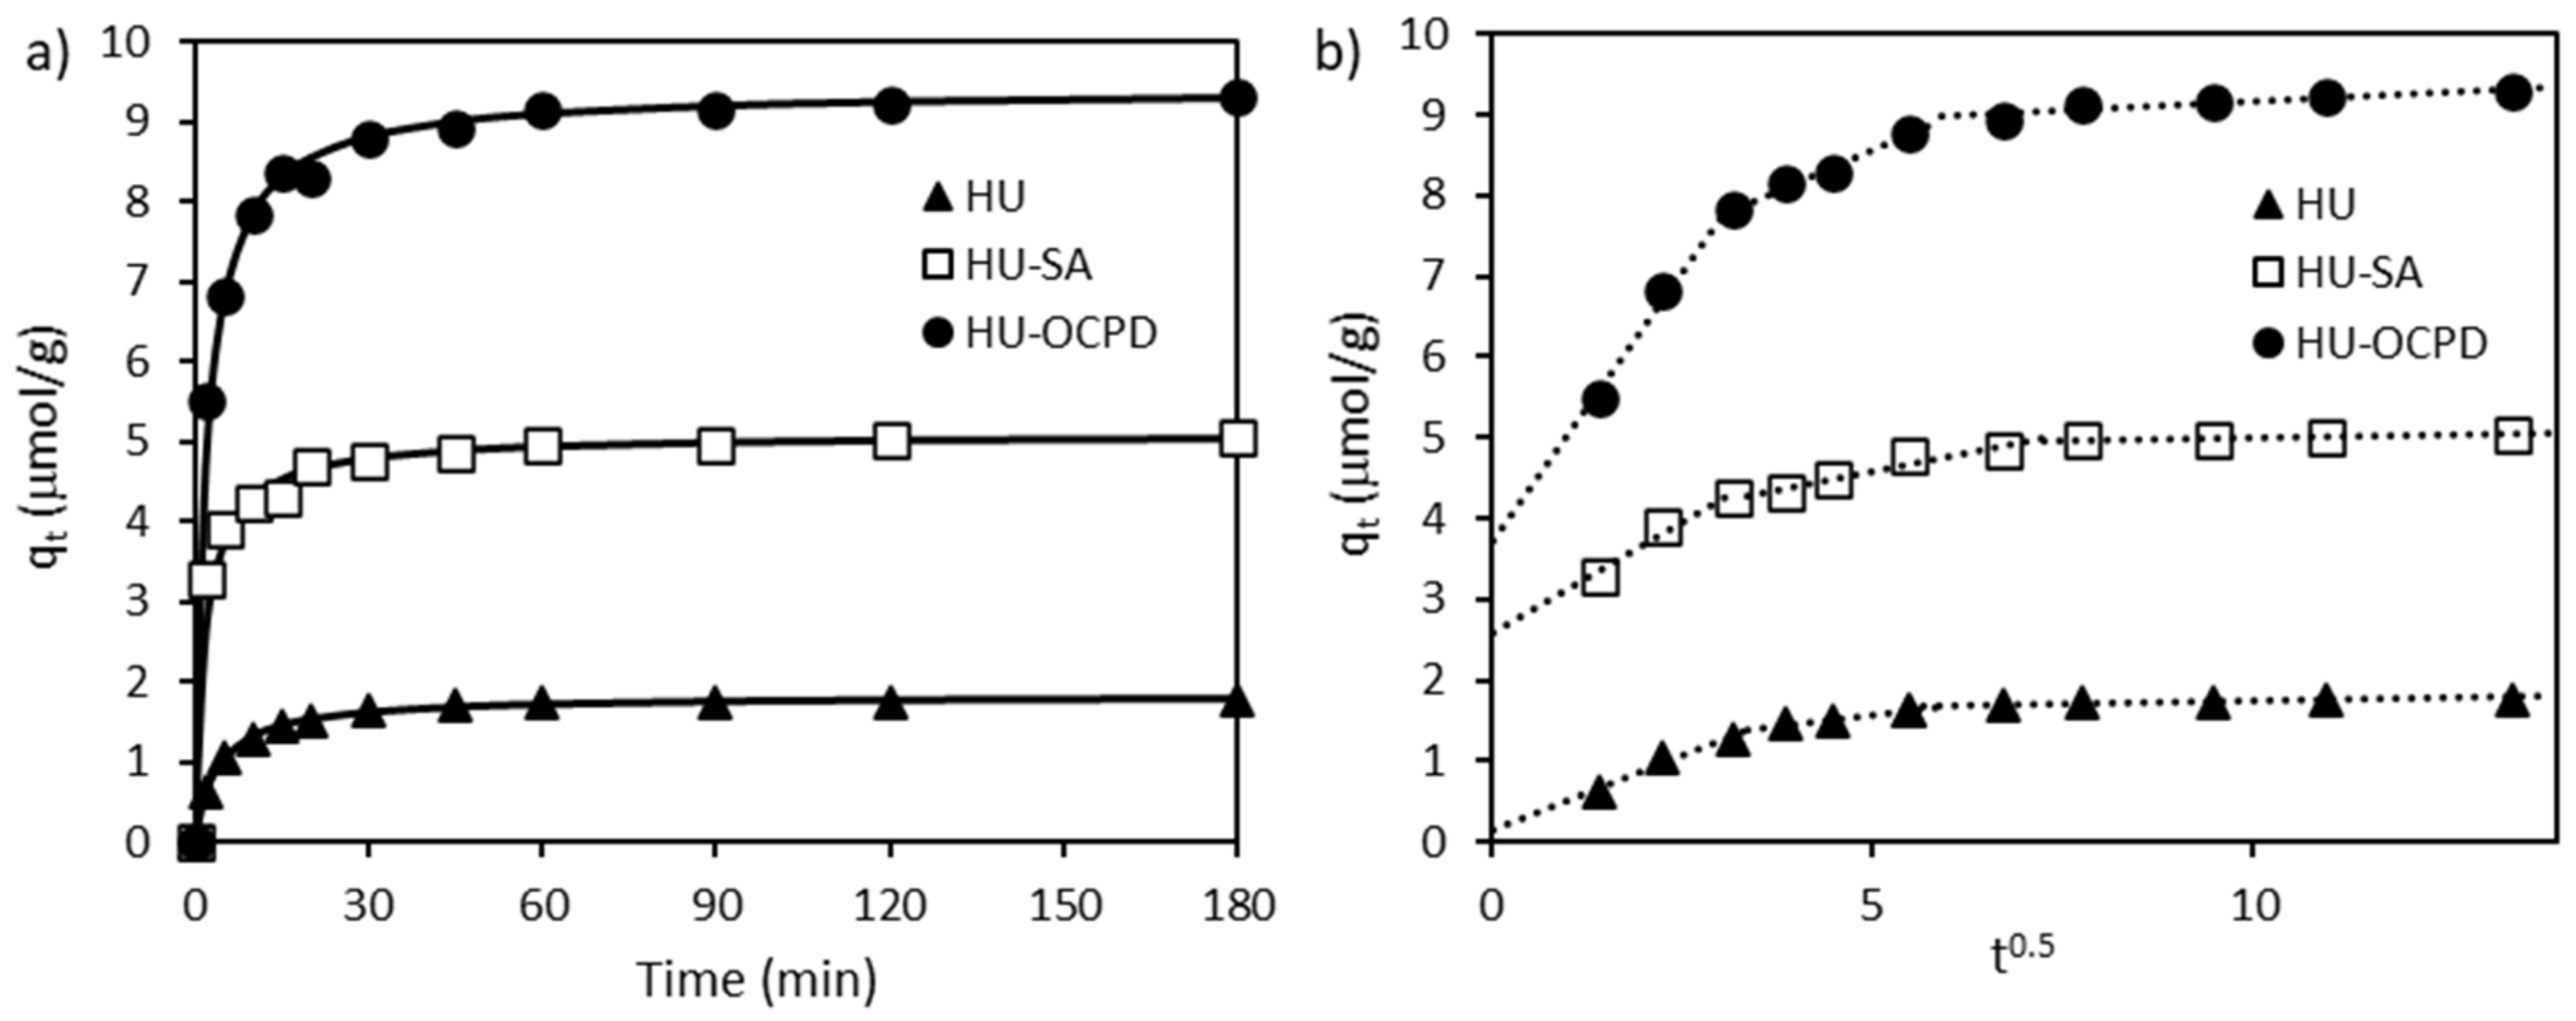
3.2.3. Kinetic Studies

The effect of contact time on Rhodamine B adsorption onto halloysites was investigated in the time range of 0–180 min and the results are presented in Figure 7a. The adsorption of the dye increased precipitously during the first 15 min of the adsorption process and next slowed until equilibrium was reached at about 60 min.
The experimental adsorption data were fitted to pseudo-first-order (PFO) and pseudo-second-order (PSO) kinetic models [35].
The linear form of the PFO kinetics is expressed as follows:
log q e q t = log q e k 1 2.303 t  
where k1 is the PFO rate constant (1/min).
The linear form of the PSO kinetic model is given by the following equation:
t q t = 1 k 2 q e 2 + 1 q e t  
where k2 is the PSO rate constant (g/µmol∙min).
To identify a suitable kinetic model for the adsorption of the RhB on halloysites correlation coefficients and chi-square tests were applied. Higher values of R2 and lower values of χ2 show a better fit of the model to the description of experimental data. The rate constants for both kinetic models are presented in Table 5. As can be seen, the kinetic model that best fits the adsorption of RhB on halloysites with the lower χ2 and higher R2 values for the two models was the pseudo-second-order equation. Moreover, calculated qe values recorded for the pseudo-second-order model were closely fitted with the experimental data. Thus, the results suggest that the adsorption of RhB on all of the halloysites followed the pseudo-second-order kinetic model and that the adsorption rate was controlled by the chemisorption process.
The HU-SA exhibits a faster rate as compared to HU and HU-OCPD. The order of time taken to reach equilibrium follows the following trend: HU-OCPD < HU < HU-SA. Rhodamine B was adsorbed faster on the HU-SA than on the HU due to its higher mesopore volume. Mesopores, as well as macropores, are responsible for the “transport” of adsorbate molecules to the micropores. Thus, a higher mesopore volume increases the rate of adsorption. It was observed that RhB adsorbed slower on the HU-OCPD than on the HU and HU-SA. This phenomenon can be explained by its smallest mesopore volume as well as by the hydrophobic nature of the HU-OCPD surface. High hydrophobicity hinders the wettability of the adsorbent in the first stages of adsorption, which makes it difficult for dye molecules to access the active sites on the adsorbent surface, and thus the rate of adsorption decreases.
To explain the diffusion mechanisms involved in the adsorption of RhB on the halloysites a Weber-Morris kinetic model was used [35]. This intraparticle diffusion model is expressed as follows:
q t = K i d t 0.5 + C
in which Kid is the intraparticle diffusion rate constant (µmol/g⋅min−0.5) and C is the intercept related to the boundary layer effect.
By adjusting the intraparticle diffusion model (Figure 7b), the formation of three stages was observed. The multi-linearity indicates that more than one kinetic stage or sorption rate is involved. The first fastest stage is associated with external mass transfer factors and diffusion of adsorbate molecules towards adsorbent, the second stage is responsible for intrapore or intraparticle diffusion within the adsorbent, and the third line region is related to diffusion through the small pores once the system has reached equilibrium. Moreover, as can be seen in Figure 7b, none of the lines passed through the origin indicating that intraparticle diffusion is not the only mechanism controlling the adsorption process of RhB onto halloysites.

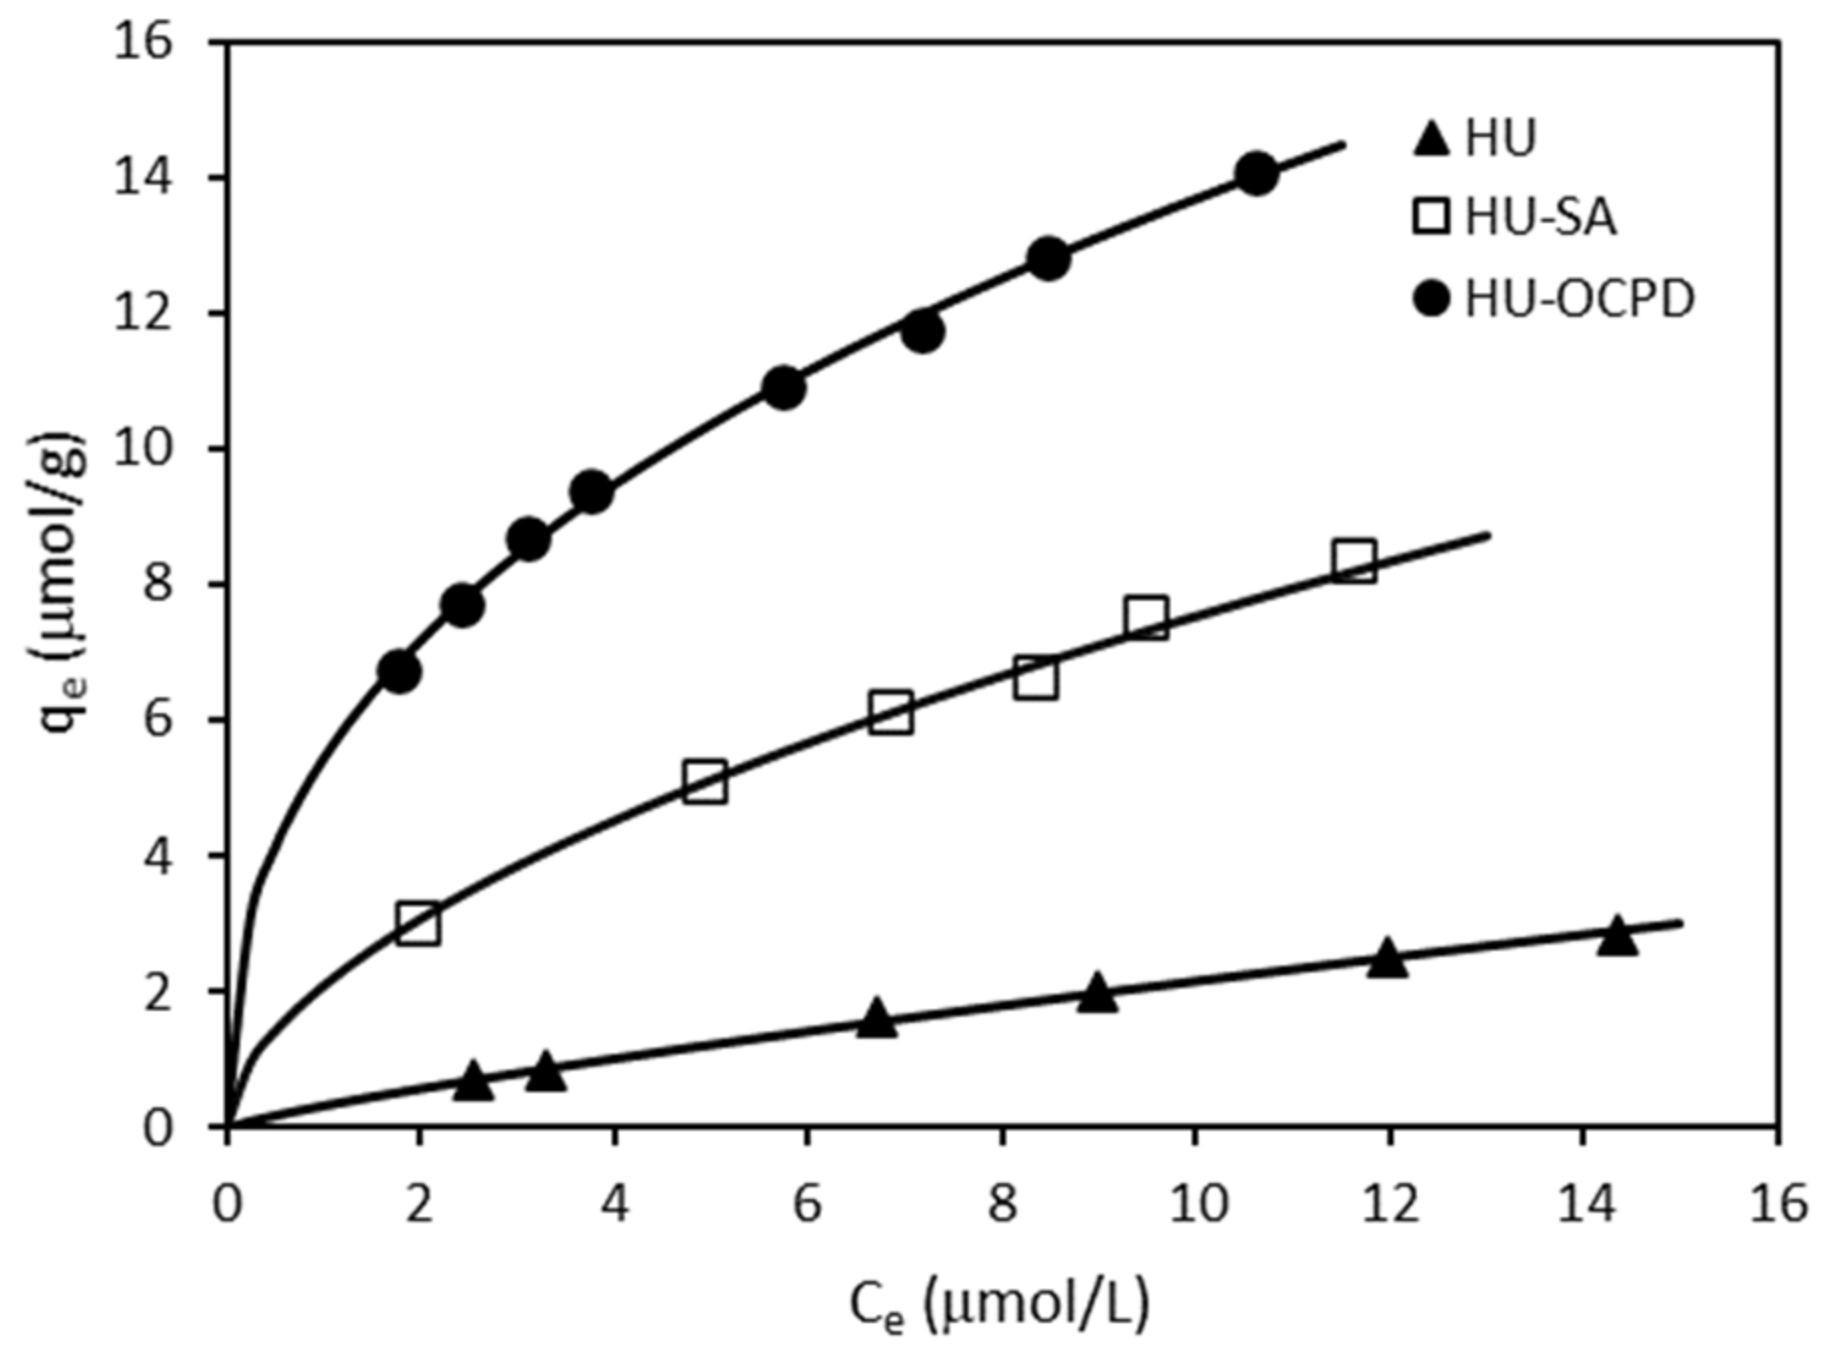
3.2.4. Equilibrium Studies

Figure 8 presents the adsorption isotherms of RhB on all of the halloysites. To better understand the adsorption process of RhB on halloysites, the obtained experimental adsorption data at equilibrium were applied to employ three isotherm models including Freundlich, Langmuir, and Temkin.
The Freundlich model is assumed that adsorption occurs at heterogeneous and non-uniform surfaces [36], and is expressed by the following equation:
q e = K F C e 1 / n  
where: KF ((µmol/g)(L/µmol)1/n) and n are the Freundlich constants.
The Langmuir isotherm assumes that monolayer adsorption occurs at homogeneous active sites in the adsorbent structure [36], and is given by:
q e = q m b L C e 1 + b L C e  
where qm is the maximum adsorption capacity (µmol/g) and bL is the Langmuir constant (L/µmol).
The Temkin isotherm equation assumes that the heat of adsorption of molecules in a layer decreases linearly with the coverage of the adsorbent surface due to the reduction of adsorbent-adsorbate interactions [36]. Temkin’s adsorption isotherm can be given as follows:
q e = R T b T l n A T C e  
where: bT is the Temkin isotherm constant related to adsorption heat (J/mol); AT is the equilibrium binding constant corresponding to the binding energy (L/g), R is the gas constant (8.314 J/mol K), and T (K) is the absolute temperature.
The adsorption parameters for these adsorption isotherms were evaluated and are compiled in Table 6. It can be observed from the mathematical calculation that all of the isotherm models adequately described the adsorption data, however, the higher R2 and lower χ2 values recorded for the Freundlich equation indicate that this isotherm was the best-suited model to describe the RhB adsorption on halloysites. The better fit obtained with the Freundlich model suggests the heterogeneous nature of the halloysite surfaces, and multi-layer adsorption of the dye onto the adsorbent.
The heterogeneous character of the halloysite surface is also confirmed by the n parameter from the Freundlich equation (Table 6). The 1/n describes the intensity of the adsorption or surface heterogeneity indicating the relative distribution of energy and the heterogeneity of adsorption sites [36]. For a favorable adsorption, 0 < 1/n < 1, while 1/n > 1 represents unfavorable adsorption, and the process is irreversible when 1/n = 1. The 1/n values were found to be 0.816 for HU, 0.556 for HU-SA, and 0.401 for HU-OCPD, respectively, indicating that the adsorption could be considered as favorable and the adsorbent surface as heterogeneous.
The nature of the adsorption can also be estimated by the Langmuir separation factor (RL). The following is its equation [36]:
R L = 1 1 + b L C 0
where bL is the Langmuir constant (L/µmol) and C0 is the initial adsorbate concentration (µmol/L).
According to the RL values adsorption can be classified as: unfavorable (RL > 1), linear (RL = 1), favorable (0 < RL < 1) or irreversible (RL = 0). In this study, the RL values were found to be in the ranges 0.581–0.874 for HU, 0.267–0.593 for HU-SA, and 0.139–0.448 for HU-OCPD, indicating that the adsorption of RhB is a favorable process.
From the isotherms (Figure 8) and the data shown in Table 6, it is clear that the adsorbed quantities of RhB increase along the sample sequence HU < HU-SA < HU-OCPD. The RhB was preferably adsorbed on the polymer-modified halloysite, followed by the acid-activated halloysite, and the worst on the ultrasound-treated mineral. The HU-SA showed a much better adsorption capacity than HU due to its larger specific surface area. On the other hand, HU-OCPD showed better adsorption properties than HU-SA, even though its surface was much lower (Table 4). This phenomenon can be explained by the greater hydrophobicity of the HU-OCPD surface as compared to the other two adsorbents. As described in Section 3.2.2, the adsorption of RhB on the halloysite surface occurs mainly as a result of hydrophobic-hydrophobic interactions. So, the more hydrophobic nature of the HU-OCPD surface favors adsorption, and thus the adsorption efficiency increases.
The adsorption capacities of the halloysites were compared to other low-cost materials reported in the literature (Table 7). For comparison, Langmuir’s maximum adsorption capacities (qm) were used. Moreover, all the units have been standardized and converted to mg/g. As can be seen, our adsorbents demonstrated more or less comparable ability for RhB removal to many other materials.

4. Conclusions

This study demonstrated adsorption of Rhodamine B from aqueous solutions on halloysite treated with ultrasound (HU) and modified by sulfuric acid (HU-SA) and OCPD polymer (HU-OCPD). It was found that the pH parameter was a key factor for the RhB removal and that solution pH at 2.0 had the greatest removal efficiency for the dye. Experimental data were analyzed by pseudo-first-order, pseudo-second-order, and intraparticle diffusion kinetic models as well as by Freundlich, Langmuir, and Temkin adsorption isotherms. The kinetic and equilibrium adsorption data were fitted well using the pseudo-second-order and Freundlich models, respectively. Based on the Langmuir adsorption model, the calculated maximum RhB adsorption capacity values for HU, HU-SA, and HU-OCPD were found to be 8.37, 13.1, and 17.8 mg/g, respectively. The results revealed that the modification of halloysite with sulfuric acid and OCPD polymer significantly improved RhB dye removal from water. Therefore, the development of adsorbents derived from halloysite is a good alternative, generating satisfactory removal results towards RhB dye.

Author Contributions

Conceptualization, E.W. and K.K.; methodology, E.W. and K.K.; software, K.K. and A.Ś.; validation, E.W., A.Ś. and K.K.; formal analysis, E.W. and K.K.; investigation, E.W. and K.K.; resources, A.Ś. and I.L.; data curation, E.W., K.K. and A.Ś.; writing—original draft preparation, K.K., E.W. and A.Ś.; writing—review and editing, A.Ś. and I.L.; visualization, K.K. and A.Ś.; supervision, E.W. and A.Ś.; project administration, E.W.; funding acquisition, E.W. All authors have read and agreed to the published version of the manuscript.

Funding

This research received no external funding.

Conflicts of Interest

The authors declare no conflict of interest.

References

  1. Hussain, S.; Khan, N.; Gul, S.; Khan, S.; Khan, H. Contamination of Water Resources by Food Dyes and Its Removal Technologies. In Water Chemistry; Intech Open: London, UK, 2019; pp. 1–14. [Google Scholar]
  2. Pavithra, K.G.; Jaikumar, V. Removal of colorants from wastewater: A review on sources and treatment strategies. J. Ind. Eng. Chem. 2019, 75, 1–19. [Google Scholar] [CrossRef]
  3. Yagub, M.T.; Sen, T.K.; Afroze, S.; Ang, H. Dye and its removal from aqueous solution by adsorption: A review. Adv. Colloid Interface Sci. 2014, 209, 172–184. [Google Scholar] [CrossRef] [PubMed]
  4. Dutta, S.; Gupta, B.; Srivastava, S.K.; Gupta, A.K. Recent advances on the removal of dyes from wastewater using various adsorbents: A critical review. Mater. Adv. 2021, 2, 4497–4531. [Google Scholar] [CrossRef]
  5. Mittal, J. Recent progress in the synthesis of Layered Double Hydroxides and their application for the adsorptive removal of dyes: A review. J. Environ. Manag. 2021, 295, 113017. [Google Scholar] [CrossRef] [PubMed]
  6. Adeyemo, A.A.; Adeoye, I.O.; Bello, O.S. Adsorption of dyes using different types of clay: A review. Appl. Water Sci. 2015, 7, 543–568. [Google Scholar] [CrossRef] [Green Version]
  7. Wilson, I.; Keeling, J. Global occurrence, geology and characteristics of tubular halloysite deposits. Clay Miner. 2016, 51, 309–324. [Google Scholar] [CrossRef]
  8. Matusik, J. Halloysite for adsorption and pollution remediation. In Nanosized Tubular Clay Minerals—Halloysite and Imogolite; Elsevier: Amsterdam, The Netherlands, 2016; Volume 7, pp. 606–627. [Google Scholar] [CrossRef]
  9. Yu, L.; Wang, H.; Zhang, Y.; Zhang, B.; Liu, J. Recent advances in halloysite nanotube derived composites for water treatment. Environ. Sci. Nano 2015, 3, 28–44. [Google Scholar] [CrossRef]
  10. Bessaha, F.; Marouf-Khelifa, K.; Batonneau-Gener, I.; Khelifa, A. Characterization and application of heat-treated and acid-leached halloysites in the removal of malachite green: Adsorption, desorption, and regeneration studies. Desalin. Water Treat. 2015, 57, 14609–14621. [Google Scholar] [CrossRef]
  11. Anastopoulos, I.; Mittal, A.; Usman, M.; Mittal, J.; Yu, G.; Núñez-Delgado, A.; Kornaros, M. A review on halloysite-based adsorbents to remove pollutants in water and wastewater. J. Mol. Liq. 2018, 269, 855–868. [Google Scholar] [CrossRef]
  12. Kuśmierek, K.; Świątkowski, A.; Wierzbicka, E.; Legocka, I. Enhanced adsorption of Direct Orange 26 dye in aqueous solutions by modified halloysite. Physicochem. Probl. Miner. Process. 2020, 56, 693–701. [Google Scholar] [CrossRef]
  13. Imam, S.S.; Babamale, H.F. A Short Review on the Removal of Rhodamine B Dye Using Agricultural Waste-Based Adsorbents. Asian J. Chem. Sci. 2020, 7, 25–37. [Google Scholar] [CrossRef]
  14. Saigl, Z.M. Various Adsorbents for Removal of Rhodamine B Dye: A Review. Indones. J. Chem. 2021, 21, 1039–1056. [Google Scholar] [CrossRef]
  15. Skjolding, L.; Jørgensen, L.; Dyhr, K.; Köppl, C.; McKnight, U.; Bauer-Gottwein, P.; Mayer, P.; Bjerg, P.; Baun, A. Assessing the aquatic toxicity and environmental safety of tracer compounds Rhodamine B and Rhodamine WT. Water Res. 2021, 197, 117109. [Google Scholar] [CrossRef] [PubMed]
  16. Mittal, J. Permissible Synthetic Food Dyes in India. Resonance 2020, 25, 567–577. [Google Scholar] [CrossRef]
  17. Lutyński, M.; Sakiewicz, P.; Lutyńska, S. Characterization of Diatomaceous Earth and Halloysite Resources of Poland. Minerals 2019, 9, 670. [Google Scholar] [CrossRef] [Green Version]
  18. Wierzbicka, E.; Legocka, I.; Skrzypczyńska, K.; Świątkowski, A.; Kuśmierek, K. Halloysite as a Carbon Paste Electrode Modifier for the Detection of Phenol Compounds. Int. J. Electrochem. Sci. 2019, 4114–4123. [Google Scholar] [CrossRef]
  19. Cheng, H.; Frost, R.L.; Yang, J.; Liu, Q.; He, J. Infrared and infrared emission spectroscopic study of typical Chinese kaolinite and halloysite. Spectrochim. Acta Part A Mol. Biomol. Spectrosc. 2010, 77, 1014–1020. [Google Scholar] [CrossRef] [PubMed] [Green Version]
  20. Alberola, J.A.; Mondragón, R.; Juliá, J.E.; Hernández, L.; Cabedo, L. Characterization of halloysite-water nanofluid for heat transfer applications. Appl. Clay Sci. 2014, 99, 54–61. [Google Scholar] [CrossRef] [Green Version]
  21. Ouyang, J.; Guo, B.; Fu, L.; Yang, H.; Hu, Y.; Tang, A.; Long, H.; Jin, Y.; Chen, J.; Jiang, J. Radical guided selective loading of silver nanoparticles at interior lumen and out surface of halloysite nanotubes. Mater. Des. 2016, 110, 169–178. [Google Scholar] [CrossRef]
  22. Szczepanik, B.; Słomkiewicz, P.; Garnuszek, M.; Czech, K.; Banaś, D.; Kubala-Kukuś, A.; Stabrawa, I. The effect of chemical modification on the physico-chemical characteristics of halloysite: FTIR, XRF, and XRD studies. J. Mol. Struct. 2015, 1084, 16–22. [Google Scholar] [CrossRef]
  23. Zainuddin, S.; Fahim, A.; Shoieb, S.; Syed, F.; Hosur, M.V.; Li, D.; Hicks, C.; Jeelani, S. Morphological and mechanical behavior of chemically treated jute-PHBV bio-nanocomposites reinforced with silane grafted halloysite nanotubes. J. Appl. Polym. Sci. 2016, 133, 43994. [Google Scholar] [CrossRef]
  24. Dawei, M.J.; Yi, Z.; Huaming, Y. Mineralogy and Physico-Chemical Data of Two Newly Discovered Halloysite in China and Their Contrasts with Some Typical Minerals. Minerals 2018, 8, 108. [Google Scholar] [CrossRef] [Green Version]
  25. Zhang, A.-B.; Pan, L.; Zhang, H.-Y.; Liu, S.-T.; Ye, Y.; Xia, M.-S.; Chen, X.-G. Effects of acid treatment on the physico-chemical and pore characteristics of halloysite. Colloids Surf. A Physicochem. Eng. Asp. 2012, 396, 182–188. [Google Scholar] [CrossRef]
  26. Legocka, I.; Wierzbicka, E.; Al-Zahari, T.; Osawaru, O. Modified halloysite as a filler for epoxy resins. Pol. J. Chem. Technol. 2011, 13, 47–52. [Google Scholar] [CrossRef] [Green Version]
  27. Rouquerol, F.; Rouquerol, J.; Sing, K. Adsorption by Powders and Porous Solids: Principles, Methodology and Application; Academic Press: London, UK, 1999. [Google Scholar] [CrossRef]
  28. Szczepanik, B.; Słomkiewicz, P.; Garnuszek, M.; Czech, K. Adsorption of chloroanilines from aqueous solutions on the modified halloysite. Appl. Clay Sci. 2014, 101, 260–264. [Google Scholar] [CrossRef]
  29. Szczepanik, B.; Rędzia, N.; Frydel, L.; Słomkiewicz, P.; Kołbus, A.; Styszko, K.; Dziok, T.; Samojeden, B. Synthesis and Characterization of Halloysite/Carbon Nanocomposites for Enhanced NSAIDs Adsorption from Water. Materials 2019, 12, 3754. [Google Scholar] [CrossRef] [PubMed] [Green Version]
  30. Yu, Y.; Murthy, B.N.; Shapter, J.; Constantopoulos, K.T.; Voelcker, N.; Ellis, A. Benzene carboxylic acid derivatized graphene oxide nanosheets on natural zeolites as effective adsorbents for cationic dye removal. J. Hazard. Mater. 2013, 260, 330–338. [Google Scholar] [CrossRef]
  31. Jain, R.; Mathur, M.; Sikarwar, S.; Mittal, D.A. Removal of the hazardous dye rhodamine B through photocatalytic and adsorption treatments. J. Environ. Manag. 2007, 85, 956–964. [Google Scholar] [CrossRef]
  32. Abou-Gamra, Z.M.; Medien, H.A.A. Kinetic, thermodynamic and equilibrium studies of Rhodamine B adsorption by low cost biosorbent sugar cane bagasse. Eur. Chem. Bull. 2013, 2, 417–422. [Google Scholar]
  33. Shah, J.; Jan, M.R.; Haq, A.; Khan, Y. Removal of Rhodamine B from aqueous solutions and wastewater by walnut shells: Kinetics, equilibrium and thermodynamics studies. Front. Chem. Sci. Eng. 2013, 7, 428–436. [Google Scholar] [CrossRef]
  34. Kooh, M.R.R.; Dahri, M.K.; Lim, L.B. The removal of rhodamine B dye from aqueous solution using Casuarina equisetifolia needles as adsorbent. Cogent Environ. Sci. 2016, 2, 1140553. [Google Scholar] [CrossRef]
  35. Tan, K.L.; Hameed, B.H. Insight into the adsorption kinetics models for the removal of contaminants from aqueous solutions. J. Taiwan Inst. Chem. Eng. 2017, 74, 25–48. [Google Scholar] [CrossRef]
  36. Al-Ghouti, M.A.; Da’ana, D.A. Guidelines for the use and interpretation of adsorption isotherm models: A review. J. Hazard. Mater. 2020, 393, 12238. [Google Scholar] [CrossRef]
  37. Singh, S.; Parveen, N.; Gupta, H. Adsorptive decontamination of rhodamine-B from water using banana peel powder: A biosorbent. Environ. Technol. Innov. 2018, 12, 189–195. [Google Scholar] [CrossRef]
  38. Alcântara, R.R.; Muniz, R.O.R.; Fungaro, D.A. Full factorial experimental design analysis of Rhodamine B removal from water using organozeolite from coal bottom ash. Int. J. Energy Environ. 2016, 7, 357–374. [Google Scholar]
  39. Khan, T.A.; Ali, I.; Singh, V.V.; Sharma, S. Utilization of fly ash as low-cost adsorbent for the removal of methylene blue, malachite green and Rhodamine B dyes from textile wastewater. J. Environ. Prot. Sci. 2009, 3, 11–22. [Google Scholar]
  40. Jayarajan, M.; Arunachala, R.; Annadurai, G. Agricultural Wastes of Jackfruit Peel Nano-Porous Adsorbent for Removal of Rhodamine Dye. Asian J. Appl. Sci. 2011, 4, 263–270. [Google Scholar] [CrossRef] [Green Version]
  41. Shen, K.; Gondal, M. Removal of hazardous Rhodamine dye from water by adsorption onto exhausted coffee ground. J. Saudi Chem. Soc. 2017, 21, S120–S127. [Google Scholar] [CrossRef] [Green Version]
  42. Cheng, W.Y.; Li, N.; Pan, Y.Z.; Jin, L.H. The Adsorption of Rhodamine B in Water by Modified Zeolites. Mod. Appl. Sci. 2016, 10, 67. [Google Scholar] [CrossRef] [Green Version]
  43. Koyuncu, M.; Kul, A.R. Thermodynamics and adsorption studies of dye (rhodamine-b) onto natural diatomite. Physicochem. Probl. Miner. Process. 2014, 50, 641–643. [Google Scholar] [CrossRef]
  44. Parab, H.; Sudersanan, M.; Shenoy, N.; Pathare, T.; Vaze, B. Use of Agro-Industrial Wastes for Removal of Basic Dyes from Aqueous Solutions. CLEAN—Soil Air Water 2009, 37, 963–969. [Google Scholar] [CrossRef]
  45. Vijayakumar, G.; Tamilarasan, R.; Dharmendirakumar, M. Adsorption, kinetic, equilibrium and thermodynamic studies on the removal of basic dye Rhodamine-B from aqueous solution by the use of natural adsorbent perlite. J. Mater. Environ. Sci. 2012, 3, 157–170. [Google Scholar]
  46. Witek-Krowiak, A.; Mitek, M.; Pokomeda, K.; Szafran, R.G.; Modelski, S. Biosorption of cationic dyes by beech sawdust I. Kinetics and equilibrium modelling. Chem. Process Eng. 2010, 31, 409–420. [Google Scholar]
  47. Zimmermann, B.M.; Dotto, G.L.; Kuhn, R.C.; Mazutti, M.A.; Treichel, H.; Foletto, E.L. Adsorption of hazardous dye Rhodamine B onto Brazilian natural bentonite. Int. J. Environ. Technol. Manag. 2016, 19, 1–15. [Google Scholar] [CrossRef]
  48. Damiyine, B.; Guenbour, A.; Boussen, R. Rhodamine B adsorption on natural and modified Moroccan clay with cetyltrimethylammonium bromide: Kinetics, equilibrium and thermodynamics. J. Mater. Environ. Sci. 2017, 8, 860–871. [Google Scholar]
  49. Vijayakumar, G.; Yoo, C.K.; Elango, K.G.P.; Dharmendirakumar, M. Adsorption characteristics of Rhodamine B from aqueous solution onto baryte. Clean 2010, 38, 202–209. [Google Scholar] [CrossRef]
Figure 1. The SEM pictures of the halloysite samples (magnification 15,000×).
Minerals 12 00350 g001
Figure 2. TG (a) and DTA (b) curves of the halloysite samples.
Minerals 12 00350 g002
Figure 3. Nitrogen adsorption-desorption isotherms for halloysite samples at 77.4 K.
Minerals 12 00350 g003
Figure 4. Adsorption of water vapors on the halloysite samples.
Minerals 12 00350 g004
Figure 5. Effect of adsorbent doses on the removal of Rhodamine B from water.
Minerals 12 00350 g005
Figure 6. Effect of solution pH on the adsorptive removal of RhB dye on the halloysites.
Minerals 12 00350 g006
Figure 7. (a)—Kinetic curves of RhB adsorption on the halloysites (line—fitting of pseudo-second-order kinetic model); (b)—Plots for intraparticle diffusion of RhB dye onto halloysites.
Minerals 12 00350 g007
Figure 8. Adsorption isotherms of RhB dye on the halloysites (line—fitting of Freundlich isotherm).
Minerals 12 00350 g008
Table 1. Properties of Rhodamine B.
IUPAC Name[9-(2-Carboxyphenyl)-6-(diethylamino)xanthen-3-ylidene]-diethylazanium Chloride
CAS Number81–88–9
Molar mass479.02 g/mol
Molecular formulaC28H31ClN2O3
Molecular structure Minerals 12 00350 i001
Table 2. EDS analysis for the halloysite samples (wt.%).
AdsorbentCOAlSiFeTi
HU-51.221.422.25.2-
HU-SA-46.920.826.35.01.0
HU-OCPD21.841.815.217.42.80.7
Table 3. FTIR spectra of modified halloysite samples and modifier (bold—bands characteristic of all samples, italics—bands characteristic of OCPD).
HU-SAHUHU-OCPDOCPD-Resin
Wavenumber (cm−1)
3696
3621
1634
999
911
752
3697
3622
3461
1631
1385
1108
1024
913
791
753
694
540
470
3696
3621
3043
2939
2864
1652
1453
1039
912
762
751
687
539
469
3043
2862
1739
1465
1455
1374
1293
1162
1009
967
916
791
Table 4. Parameters of the porous structure of modified halloysite samples.
AdsorbentSBETVmiVmeVt
(m2/g)(cm3/g)(cm3/g)(cm3/g)
HU780.0330.1790.212
HU-SA1290.0570.3420.399
HU-OCPD370.0160.1430.159
Table 5. Pseudo-first- and pseudo-second-order kinetic parameters for adsorption of RhB on halloysites.
Kinetic ModelAdsorbent
HUHU-SAHU-OCPD
qe exp (µmol/g)1.7685.0539.307
Pseudo-first-order
k1 (1/min)0.0420.0460.034
qe1 cal (µmol/g)0.8841.6742.610
R20.9390.9160.891
χ20.8291.0582.214
Pseudo-second-order
k2 (g/µmol∙min)0.1040.1570.063
qe2 cal (µmol/g)1.8075.0979.398
R20.9980.9990.999
χ20.0610.0400.041
Table 6. The Freundlich, Langmuir and Temkin isotherm parameters for RhB adsorption on halloysites.
Isotherm ModelAdsorbent
HUHU-SAHU-OCPD
Freundlich
KF ((µmol/g)(L/µmol)1/n)0.3322.0915.438
n1.2261.7982.494
R20.9970.9990.998
χ20.0350.0240.031
Langmuir
qm (µmol/g)8.36813.1417.80
bL (L/µmol)0.0360.1370.308
R20.9440.9650.969
χ20.0880.0650.064
Temkin
bT (kJ/mol)2.0270.8490.621
AT (L/g)0.6331.3082.876
R20.9320.9290.950
χ20.1280.1350.074
Table 7. Comparison of RhB Langmuir’s adsorption capacities of various sorbents.
Sorbentqm (mg/g)References
Ultrasound treated halloysite (HU)4.01This study
Acid-activated halloysite (HU-SA)6.29This study
Organo-modified halloysite (HU-OCPD)8.53This study
Sugar cane bagasse1.25[32]
Banana peel powder1.66[37]
Surfactant-modified zeolite2.03[38]
Raw walnut shells2.29[33]
Fly ash2.30[39]
Jack fruit peel4.36[40]
Coffee ground5.25[41]
Mordenite7.95[42]
Diatomite8.13[43]
Rice husk28.1[31]
Coir pith55.5[44]
Perlite67.9[45]
Beech sawdust70.4[46]
Brazilian natural bentonite77.3[47]
Casuarina equisetifolia needle82.3[34]
Raw Moroccan clay83.9[48]
Baryte163.9[49]
Publisher’s Note: MDPI stays neutral with regard to jurisdictional claims in published maps and institutional affiliations.

