Article

An Experimental Study of Pressure Drop Characteristics and Flow Resistance Coefficient in a Fluidized Bed for Coal Particle Fluidization

1
School of Minerals Processing and Bioengineering, Central South University, Changsha 410083, China
2
Key Laboratory of Hunan Province for Clean and Efficient Utilization of Strategic Calcium-Containing Mineral Resources, Central South University, Changsha 410083, China
3
College of Chemistry and Chemical Engineering, Central South University, Changsha 410083, China
*
Authors to whom correspondence should be addressed.
Minerals 2022, 12(3), 289; https://doi.org/10.3390/min12030289
Submission received: 10 January 2022 / Revised: 20 February 2022 / Accepted: 23 February 2022 / Published: 25 February 2022

Abstract

:
Liquid–solid fluidized beds have a wide range of applications in metallurgical processing, mineral processing, extraction, and wastewater treatment. Great interest on their flow stability and heterogeneous fluidization behaviors has been aroused in research. In this study, various fluidization experiments were performed by adjusting the operating conditions of particle size, particle density, and liquid superficial velocity. For each case, the steady state of liquid–solid fluidization was obtained, and the bed expansion height and pressure drop characteristics were analyzed. The time evolution of pressure drop at different bed heights can truly reflect the liquid–solid heterogeneous fluidization behaviors that are determined by operating conditions. With the increase in superficial liquid velocity, three typical fluidization stages were observed. Accordingly, the flow resistance coefficient was obtained based on the experimental data of bed expansion height and pressure drop. The flow resistance coefficient experiences a decrease with the increase in the modified particle Reynolds number and densimetric Froude number.

1. Introduction

Liquid–solid fluidized beds have been widely used in metallurgical processing, mineral processing, extraction, and wastewater treatment [1,2,3,4,5,6,7,8,9] for their excellent fluid–solid coupling as well as heat and mass transfer performance. Heterogeneous fluidization behaviors have recently aroused great interest for the purpose of operation stability and optimized operating conditions [10,11]. The transition from the homogeneous to heterogeneous regime occurs at some critical operating conditions. The intensity of turbulence is much higher in the heterogeneous regime, resulting in higher rates of heat, mass, and momentum transfer and better mixing. Such conditions are preferable in many applications. However, too much turbulence may be detrimental to the performance in operations such as flotation, causing higher rates of detachment of particles from the bubble surface. Therefore, an insight into the heterogeneous flow structures of liquid–solid fluidized systems is critical.
Generally, liquid–solid fluidization systems are homogeneous when compared with gas–solid systems. As a result, liquid–solid fluidization has received little attention despite its wide applications. Liquid–solid fluidized beds have unique characteristics, such as low solid–fluid density ratio, and thus, homogeneous fluidization phenomena have been frequently observed [12,13]. For small and light particles, particle entrainment occurs easily in the fluidized state. Severe heterogeneous liquid–solid fluidization phenomena (i.e., particle clustering, bubbling, and velocity fluctuations) occur only under some extreme conditions [14,15,16,17,18,19,20,21,22].
In the past few decades, various experiments and numerical simulations have been carried out to study liquid–solid flow characteristics. The earliest research on the liquid–solid heterogeneous fluidization phenomenon can be traced back to 1948 when Wilhelm and Kwauk performed the fluidization of lead particles in water [23]. Later, Di Felice [13] found that solid–fluid density ratio, particle morphology, particle size, and size distribution were responsible for heterogeneity. In recent years, experimental techniques have improved greatly for visualizing multiphase flow fields. Razzak et al. [24,25,26] measured the liquid phase holdup and velocity distribution using resistance tomography, whereas the solid phase holdup was measured using a pressure sensor. The solid phase holdup decreases with the increase in liquid superficial velocity. Similarly, Zbib et al. [27,28] measured the particle phase holdup by electrical resistance tomography in a liquid–solid fluidized bed. Reddy et al. [29] performed flow visualization experiments using particle image velocimetry. They found that a liquid–solid fluidized bed was a homogenous system for particle Reynolds number (Ret) in the range of 51–759.
Additionally, computational fluid dynamics (CFD) simulations have great advantages in investigating the hydrodynamic characteristics of liquid–solid fluidized beds, particularly for the purpose of scaling up. The accuracy of a CFD model can be validated by experimental data. An entire flow field can be captured using a CFD simulation, including turbulence intensity, particle concentration, particle velocity, and particle clusters, which are beneficial to clarify the fluidization mechanism. Some studies consider the local heterogeneity of liquid–solid flow in CFB when calculating the drag force. Liu et al. [30] showed that compared with experimental data, the multi-scale resistance coefficient model predicted better particle concentration distribution by taking into account the effect of mesoscale cluster structure. In addition, Xie et al. proposed an effective resistance closure method for fluidization of coarse coal particles in transition liquid–solid two-phase flow by clarifying the relationship between resistance coefficient and Reynolds number, Froude number and Stokes number. The output prediction is in good agreement with the experimental data [11].
The effects of operating conditions, such as liquid superficial velocity, particle properties, and fluidized bed structures on fluidization behaviors have been widely investigated in recent years [31,32,33,34,35]. It is also generally accepted that liquid–particle and particle–particle interactions play an important role in determining liquid–solid fluidization characteristics [36,37,38,39,40]. However, there is still limited research on heterogeneous fluidization phenomena [41,42]. Moreover, the flow stability and flow resistance in a liquid–solid fluidized bed have received limited attention [28,43,44].
This study aims to investigate the heterogeneous fluidization and flow resistance in a square liquid–solid fluidized bed where coarse coal particles and water are the solid and liquid phases, respectively. Various fluidization experiments were carried out by adjusting the operating conditions such as particle size, particle density, and liquid superficial velocity. The bed-expansion height and pressure drop under different conditions were measured and used to analyze the flow stability and resistance. According to the measured experimental data, relationships between the flow resistance coefficient and the modified particle Reynolds number (Res) and densimetric Froude number (Frp) are obtained. To the best of our knowledge, the experimental data of the bed expansion height and pressure drop obtained can provide insight into the fluidization mechanism of a liquid–solid fluidized bed.

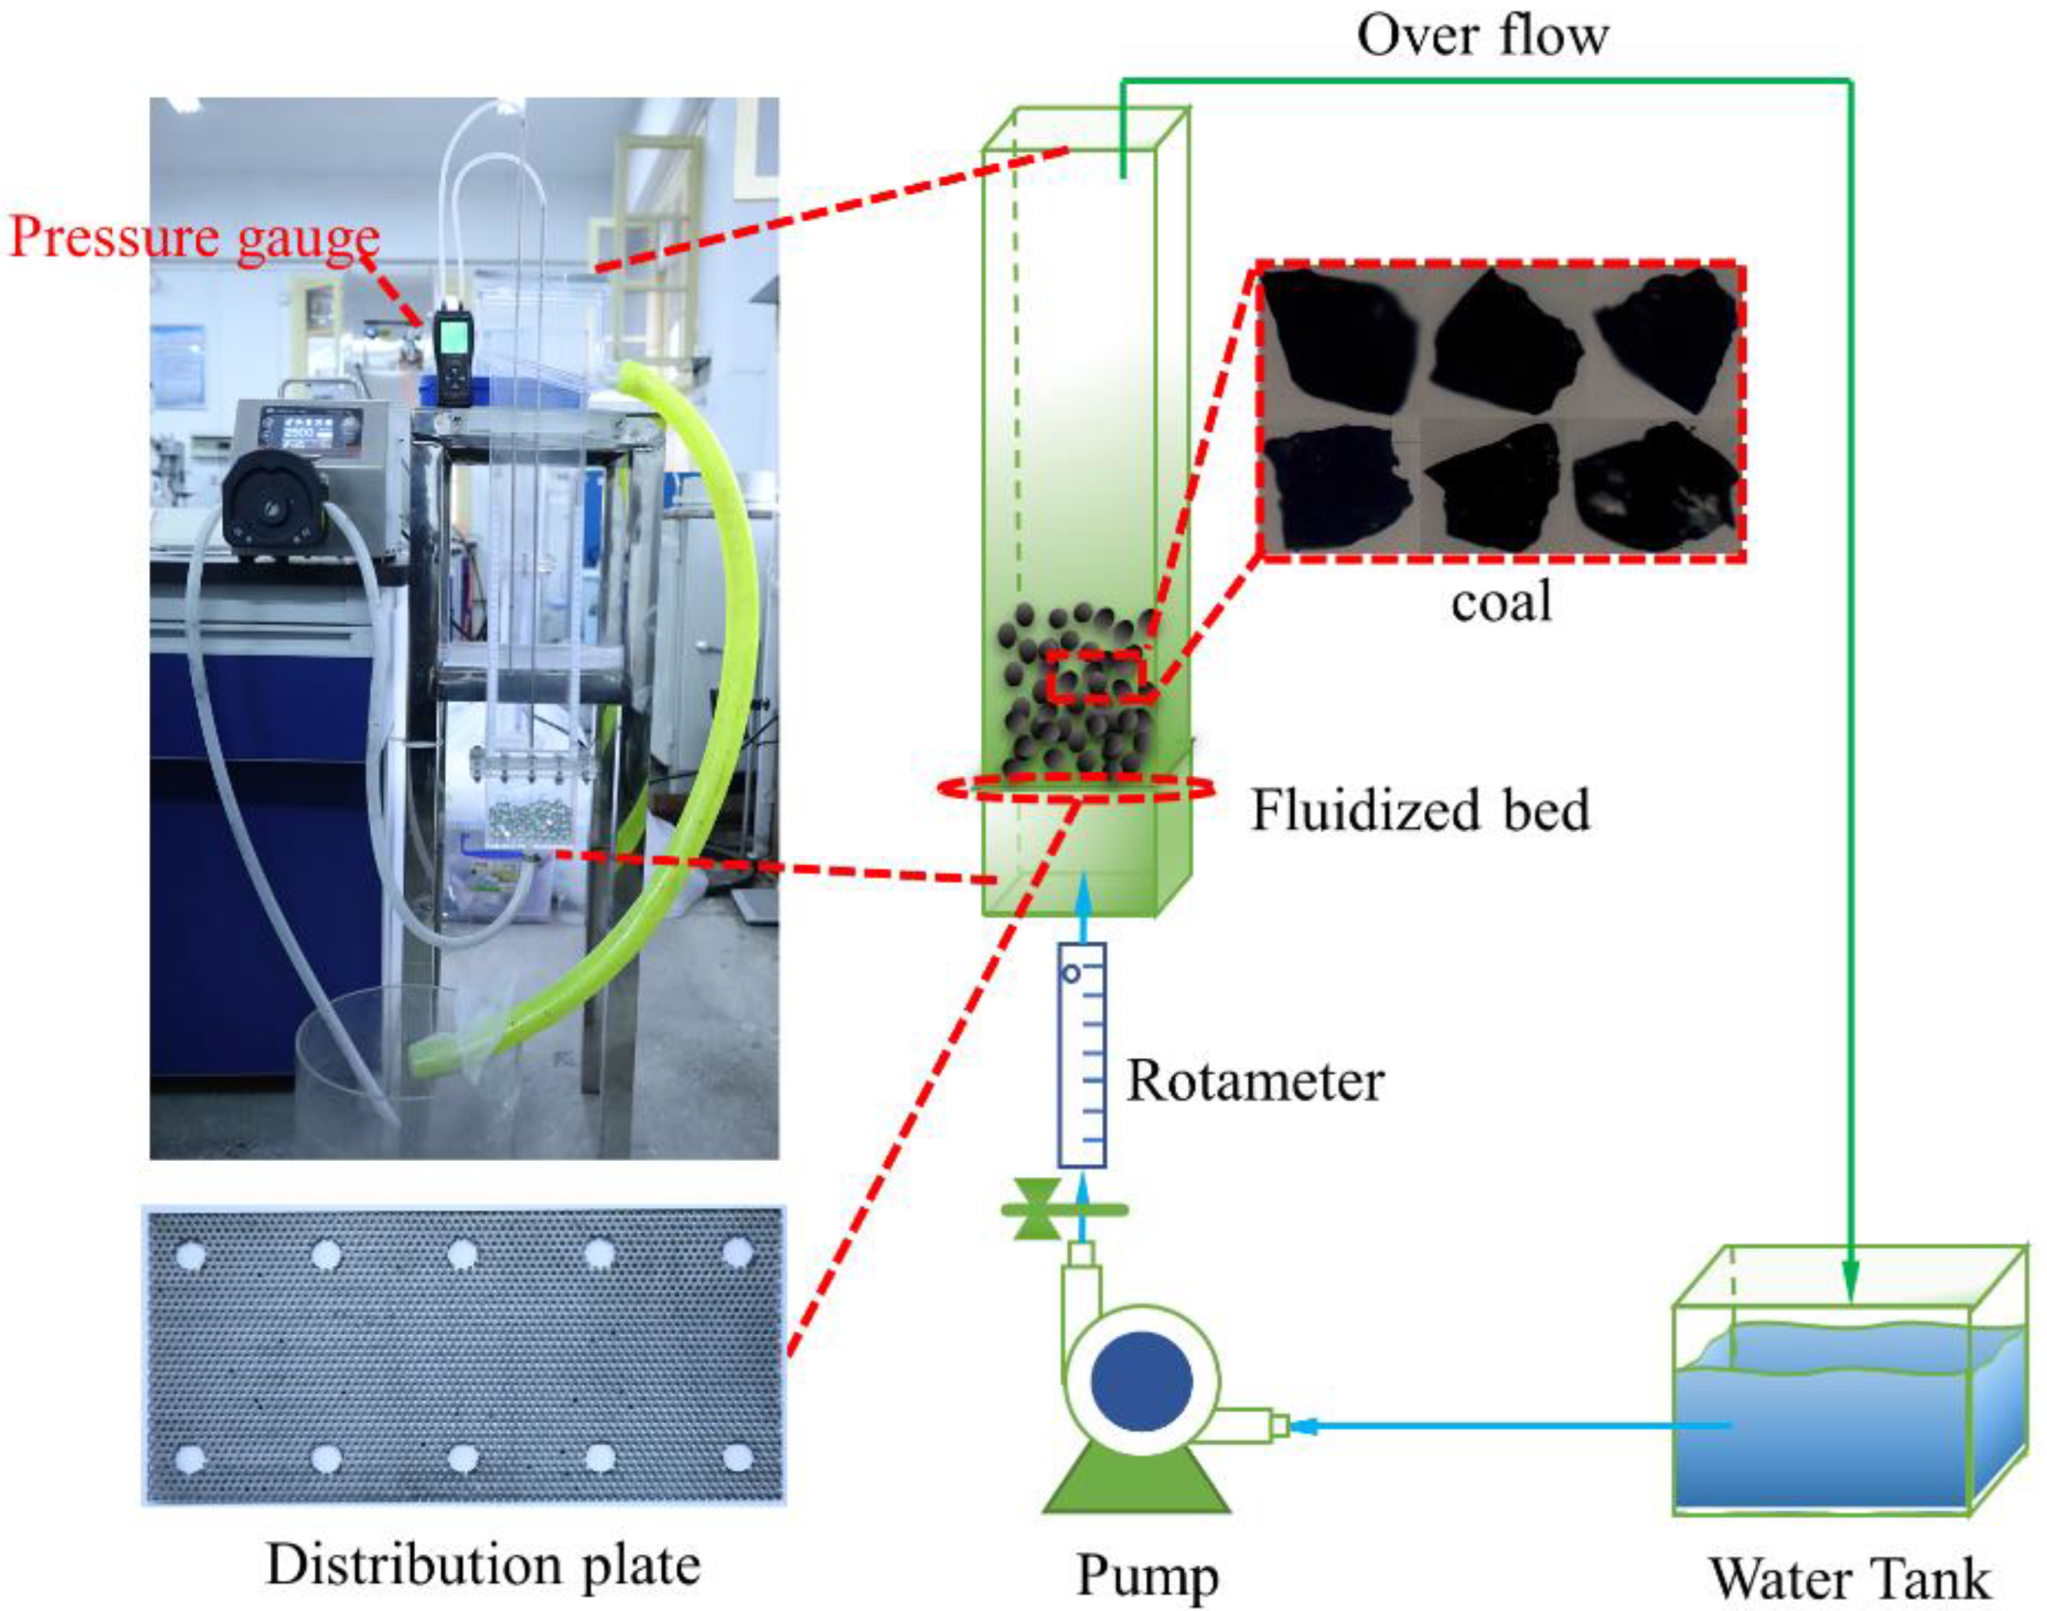
2. Experimental Design and Procedures

The lab-grade fluidized bed unit shown in Figure 1 is constructed of clear plexiglass of 100 mm in length, 20 mm in width, and 500 mm in height. A rectangular distributor is arranged at the bottom of the fluidized bed. The distributor has an opening ratio of 40% and a pore size of 1 mm. The coal particle samples for the solid phase were purchased from Pingdingshan Coal Industry Group Co. Ltd., located in Henan, China. Raw coal was crushed by a laboratory jaw crusher and then sieved to produce two large size fractions (0.7 ± 0.1 and 1.25 ± 0.25 mm). Two methods were employed to determine the particle size of each sample: classical sieve analysis and microscopic static image analysis. These were further subdivided according to different densities using the ZnCl2 heavy liquid method. Five density fractions of coal samples (1500 ± 50 and 1700 ± 50 kg/m3) were obtained. As a result, four different coal particle samples were used in this study. The physical properties of the coal particles are given in Table 1.
The fluidization experiment was carried out as follows. The prepared coal sample is initially placed on the distribution plate with an initial filling height of 100 mm. Water is delivered to the bottom of the fluidized bed by a peristaltic pump (WT600-3J) manufactured by Longer Precision Pump Co., Ltd. (Baoding, China). The flow error of the peristaltic pump is less than ±0.5%. The inlet speed at the bottom of the fluidized bed is controlled by the speed of the peristaltic pump. When the superficial velocity of the water exceeds the minimum fluidization velocity, the coal particles leave the distribution plate and are suspended in the fluidized bed. Then, a ruler is used to record the expansion height of the bed. When the particle fluidization reaches a steady state, the bed expansion height is measured three times, and the average value is taken as the final experimental measurement value.
Then, the bed expansion ratio can be calculated as follows:
χ = H H 0 H 0 × 100 %
where χ is the bed expansion ratio, H 0 is the initial bed height, and H is the bed height after fluidization.
Additionally, the pressure drop continues to fluctuate with flow time, even though the bed height is stable. In this study, four sections, namely, z = 50 mm, z = 100 mm, z = 150 mm, and z = 200 mm are selected, and the time evolutions of the pressure drop are recorded. The differential pressure gauge is composed of two pressure-measuring copper tubes, digital display pressure gauge (Xima AS510) manufactured by Dongguan Wanchuang Electronic Products Co., Ltd. (Dongguan, China), and rubber hose. The accuracy of the pressure gauge is ±3 Pa and the resolution is ±1 Pa. When measuring the pressure drop, the pressure drop at the end of two copper tubes is directly read by the digital differential pressure gauge. The total duration of pressure drop measurement is 30 s, and a data point is recorded every 0.5 s. Distilled water from the laboratory was employed as the fluidizing medium. The density and viscosity of water are 998.2 kg/m3 and 0.001 Pa, respectively. The experiments were performed at a temperature of 20 °C under atmospheric conditions.
In this study, 31 groups of fluidization experiments (see Figure 2) were performed based on the developed fluidized bed equipment. Figure 2 shows the bed expansion ratio at different superficial velocities for four different coal particles. Two different fluidization characteristics by particle size are observed. For small coal particles (0.7 ± 0.1 mm), the bed expansion ratio almost increases linearly with the superficial velocity. Generally, small particles achieve homogeneous fluidization easier, and the bed height increases uniformly and does not change abruptly. For large coal particles with sizes of 1.25 ± 0.25 mm, however, the linear relationship between bed expansion ratio and superficial velocity is only observed at low superficial velocity (<0.025 m/s). When the superficial velocity exceeds minimum fluidization velocity, the bed expansion ratio meets a significant increase, deviating from the linear growth trend. We guess that this trend may also be applicable to small particles if the superficial velocity is high enough. As shown in Figure 2, the growth trend of the bed expansion ratio is accelerated for small particles when the superficial velocity is higher than 0.02 m/s. Additionally, the bed expansion ratio decreases with the increase in particle density and particle size. When compared with particle density, the effect of particle size is more significant. When the superficial velocity is 0.0208 m/s, the bed expansion ratio decreases from 190% to 37.5% as the particle size increases from 0.7 ± 0.1 to 1.25 ± 0.25 mm. For both particle sizes, particle density has a limited effect on the bed expansion ratio at low superficial velocity. The particle density effect can only be highlighted at high superficial velocity. It should be noted that the local solid holdup is still fluctuating even though the whole bed height is stable. This fluctuation is reflected by the pressure drop of the cross section and will be analyzed in Section 3.1.

3. Results and Discussion

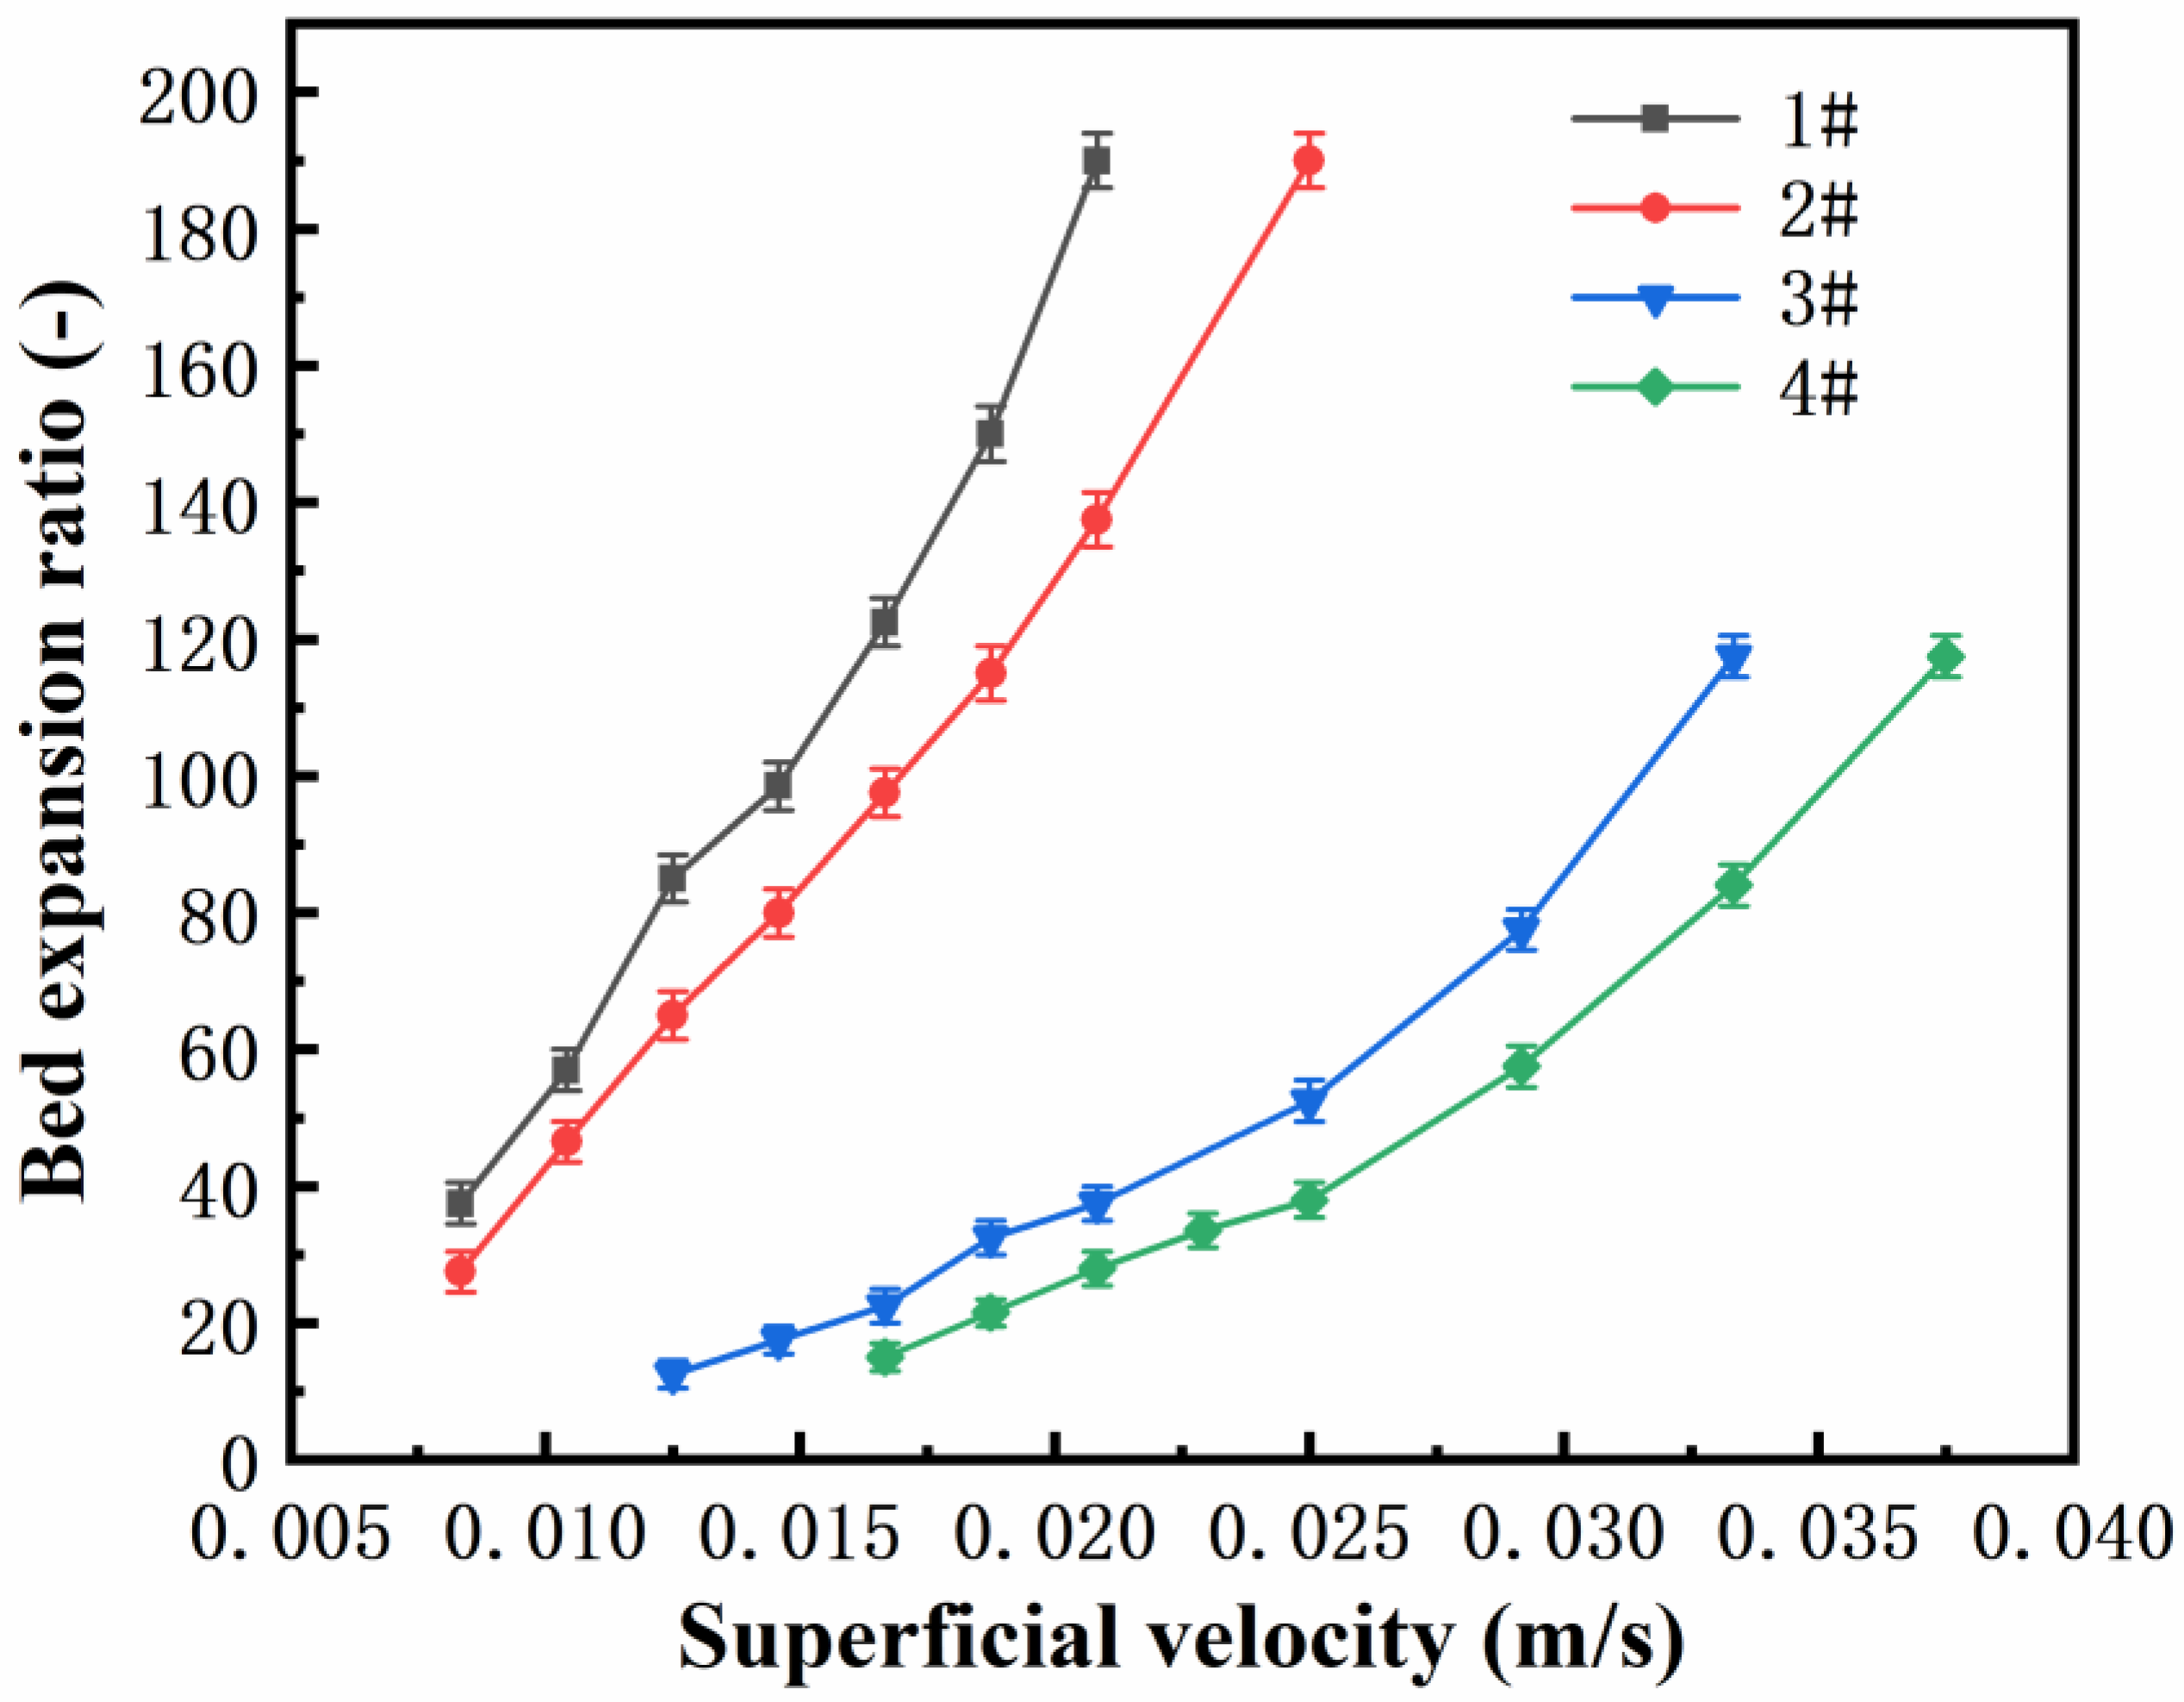
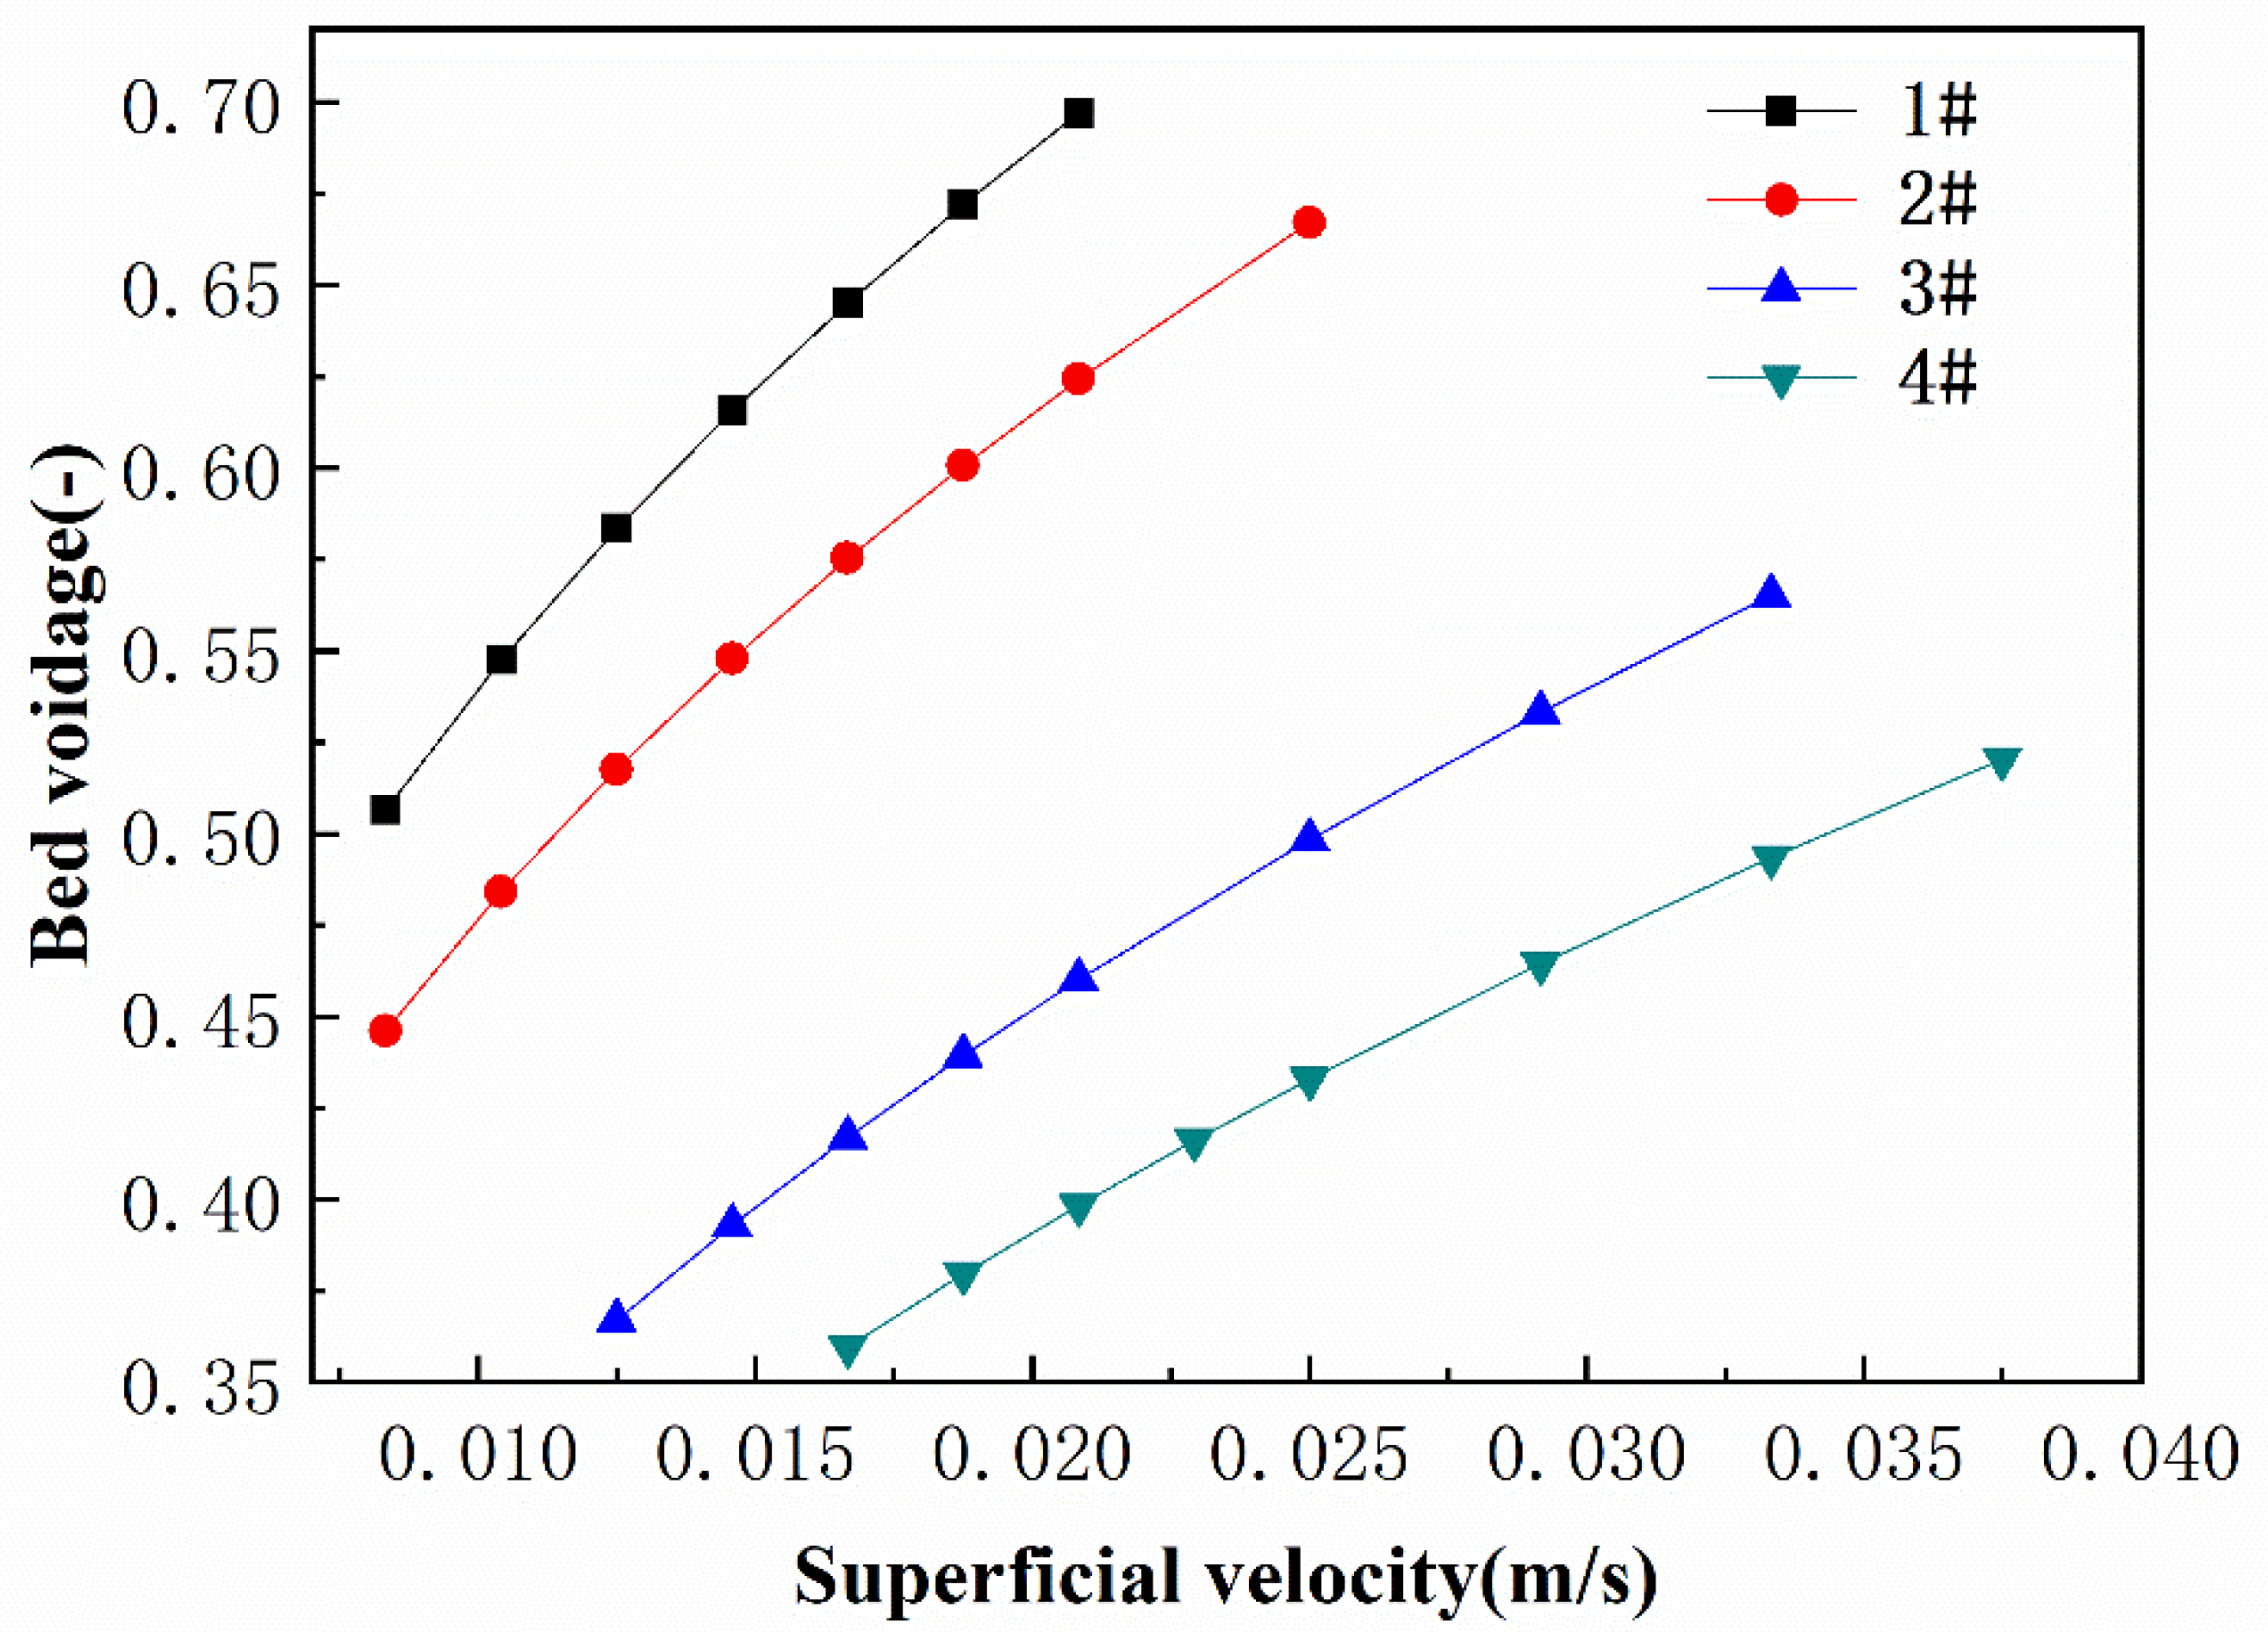
3.1. Pressure Drop Characteristics

In this section, the pressure drop was measured at different bed heights when the steady state of liquid–solid fluidization was obtained, for example, when the average bed expansion height remained constant. Generally, the pressure drop continues to fluctuate even though the bed height is stable. Therefore, the pressure drop can be written as
Δ p = Δ p ¯ + Δ p
Δ p ¯ = 1 t 1 0 t 1 Δ p d t
Then, the fluctuation intensity of the pressure drop can be defined as:
I = ( 1 N Δ p 2 ) / N Δ p ¯
where Δ p is the fluctuating pressure drop and Δ p ¯ is the time-averaged pressure drop.
Figure 3 shows the time evolution of the pressure drop at different bed heights and superficial velocities when the particle size is 0.7 ± 0.1 mm and particle density is 1500 kg/m3. The fluctuation of the pressure drop is very small at low flow rates (see Figure 3A). The calculated fluctuation intensities of the pressure drops are 0.097, 0.049, 0.029, and 0.031, respectively, indicating that the particle fluidization is homogeneous. With the increase in superficial velocity, however, the heterogeneous fluidization phenomenon was first observed at the top of the bed, accompanied by significant fluctuations in the pressure drop (see Figure 3B,C). The possible reason is liquid void motion. Nijssen and Kramer et al. also observed the formation of voids through experiments and numerical simulation in the study of liquid–solid heterogeneous fluidization behavior [10]. Small liquid voids are generated at the bottom of the fluidized bed for low superficial liquid velocity. These liquid voids will grow in the process of rising up, and finally break up at the top of the fluidized bed. The liquid void motion and breakage lead to changes in the local solid phase holdup, which is reflected by fluctuations in the pressure drop. When the superficial liquid velocity further increases to 0.0188 m/s (see Figure 3D), the fluctuation in the pressure drop mainly appears at the bottom of the fluidized bed. Of course, this is exactly the opposite phenomenon when compared with that at low superficial liquid velocity. High superficial liquid velocity is often accompanied by high bed expansion height. However, high superficial liquid velocity may only influence particle fluidization at the bottom of the fluidized bed, and homogeneous fluidization is observed at the top of the fluidized bed.
When the particle density increases to 1700 kg/m3, the fluidization becomes more stable at the same superficial liquid velocity (see Figure 4). The fluctuation intensity of the pressure drop is less than 0.065 when the superficial liquid velocity increases from 0.0125 m/s to 0.0167 m/s. That is to say, heavy particle fluidization is insensitive to the superficial liquid velocity. In this study, we observed a large fluctuation in the pressure drop only when the superficial liquid velocity increases to 0.0208 m/s. The pressure drop shows a periodic trend throughout the fluidized bed, indicating that liquid–solid fluidization reaches a steady state.
Figure 5 shows the time evolution of the pressure drop at different bed heights and superficial velocities when the particle size further increases to 1.25 ± 0.25 mm. In determining fluidization behaviors, gravity dominates for large and heavy particles, while drag force dominates for small and light particles. With the increase in particle size, the fluidized bed also becomes more stable at the same superficial liquid velocity (less than 0.025 m/s), although a significant decrease in bed expansion height is observed. Similarly, when the superficial liquid velocity increases to 0.0292 m/s, a very chaotic pressure drop trend is monitored, indicating that the local particle concentration varies greatly.
From Figure 3, Figure 4 and Figure 5, it can be concluded that liquid–solid fluidization behavior is highly dependent on the superficial liquid velocity, particle size, and particle density. In most cases, the liquid–solid fluidized bed is in a homogeneous fluidization state. With the increase in particle size and particle density, the fluidized bed will become more stable. As the superficial liquid velocity increases, however, the homogeneous fluidization will change into heterogeneous fluidization. Particle fluidization behavior is controlled by the drag force, gravity, and the heterogeneous flow structure. For small and light particles, the drag force is much larger than gravity. As superficial liquid velocity continues to increase, heterogeneous flow structures, such as liquid voids, may evolve and determine the particle fluidization behaviors. For the large and heavy particles, gravity is greater than the drag force at low superficial liquid velocity. As a result, the particles are inclined to stay at the bottom of the fluidized bed. When the drag force increases to the same level as gravity, the liquid–solid flow is unstable and will produce oscillations. In the following, we will provide explanations by analyzing the relative magnitudes of the drag force, inertia force, and gravity.

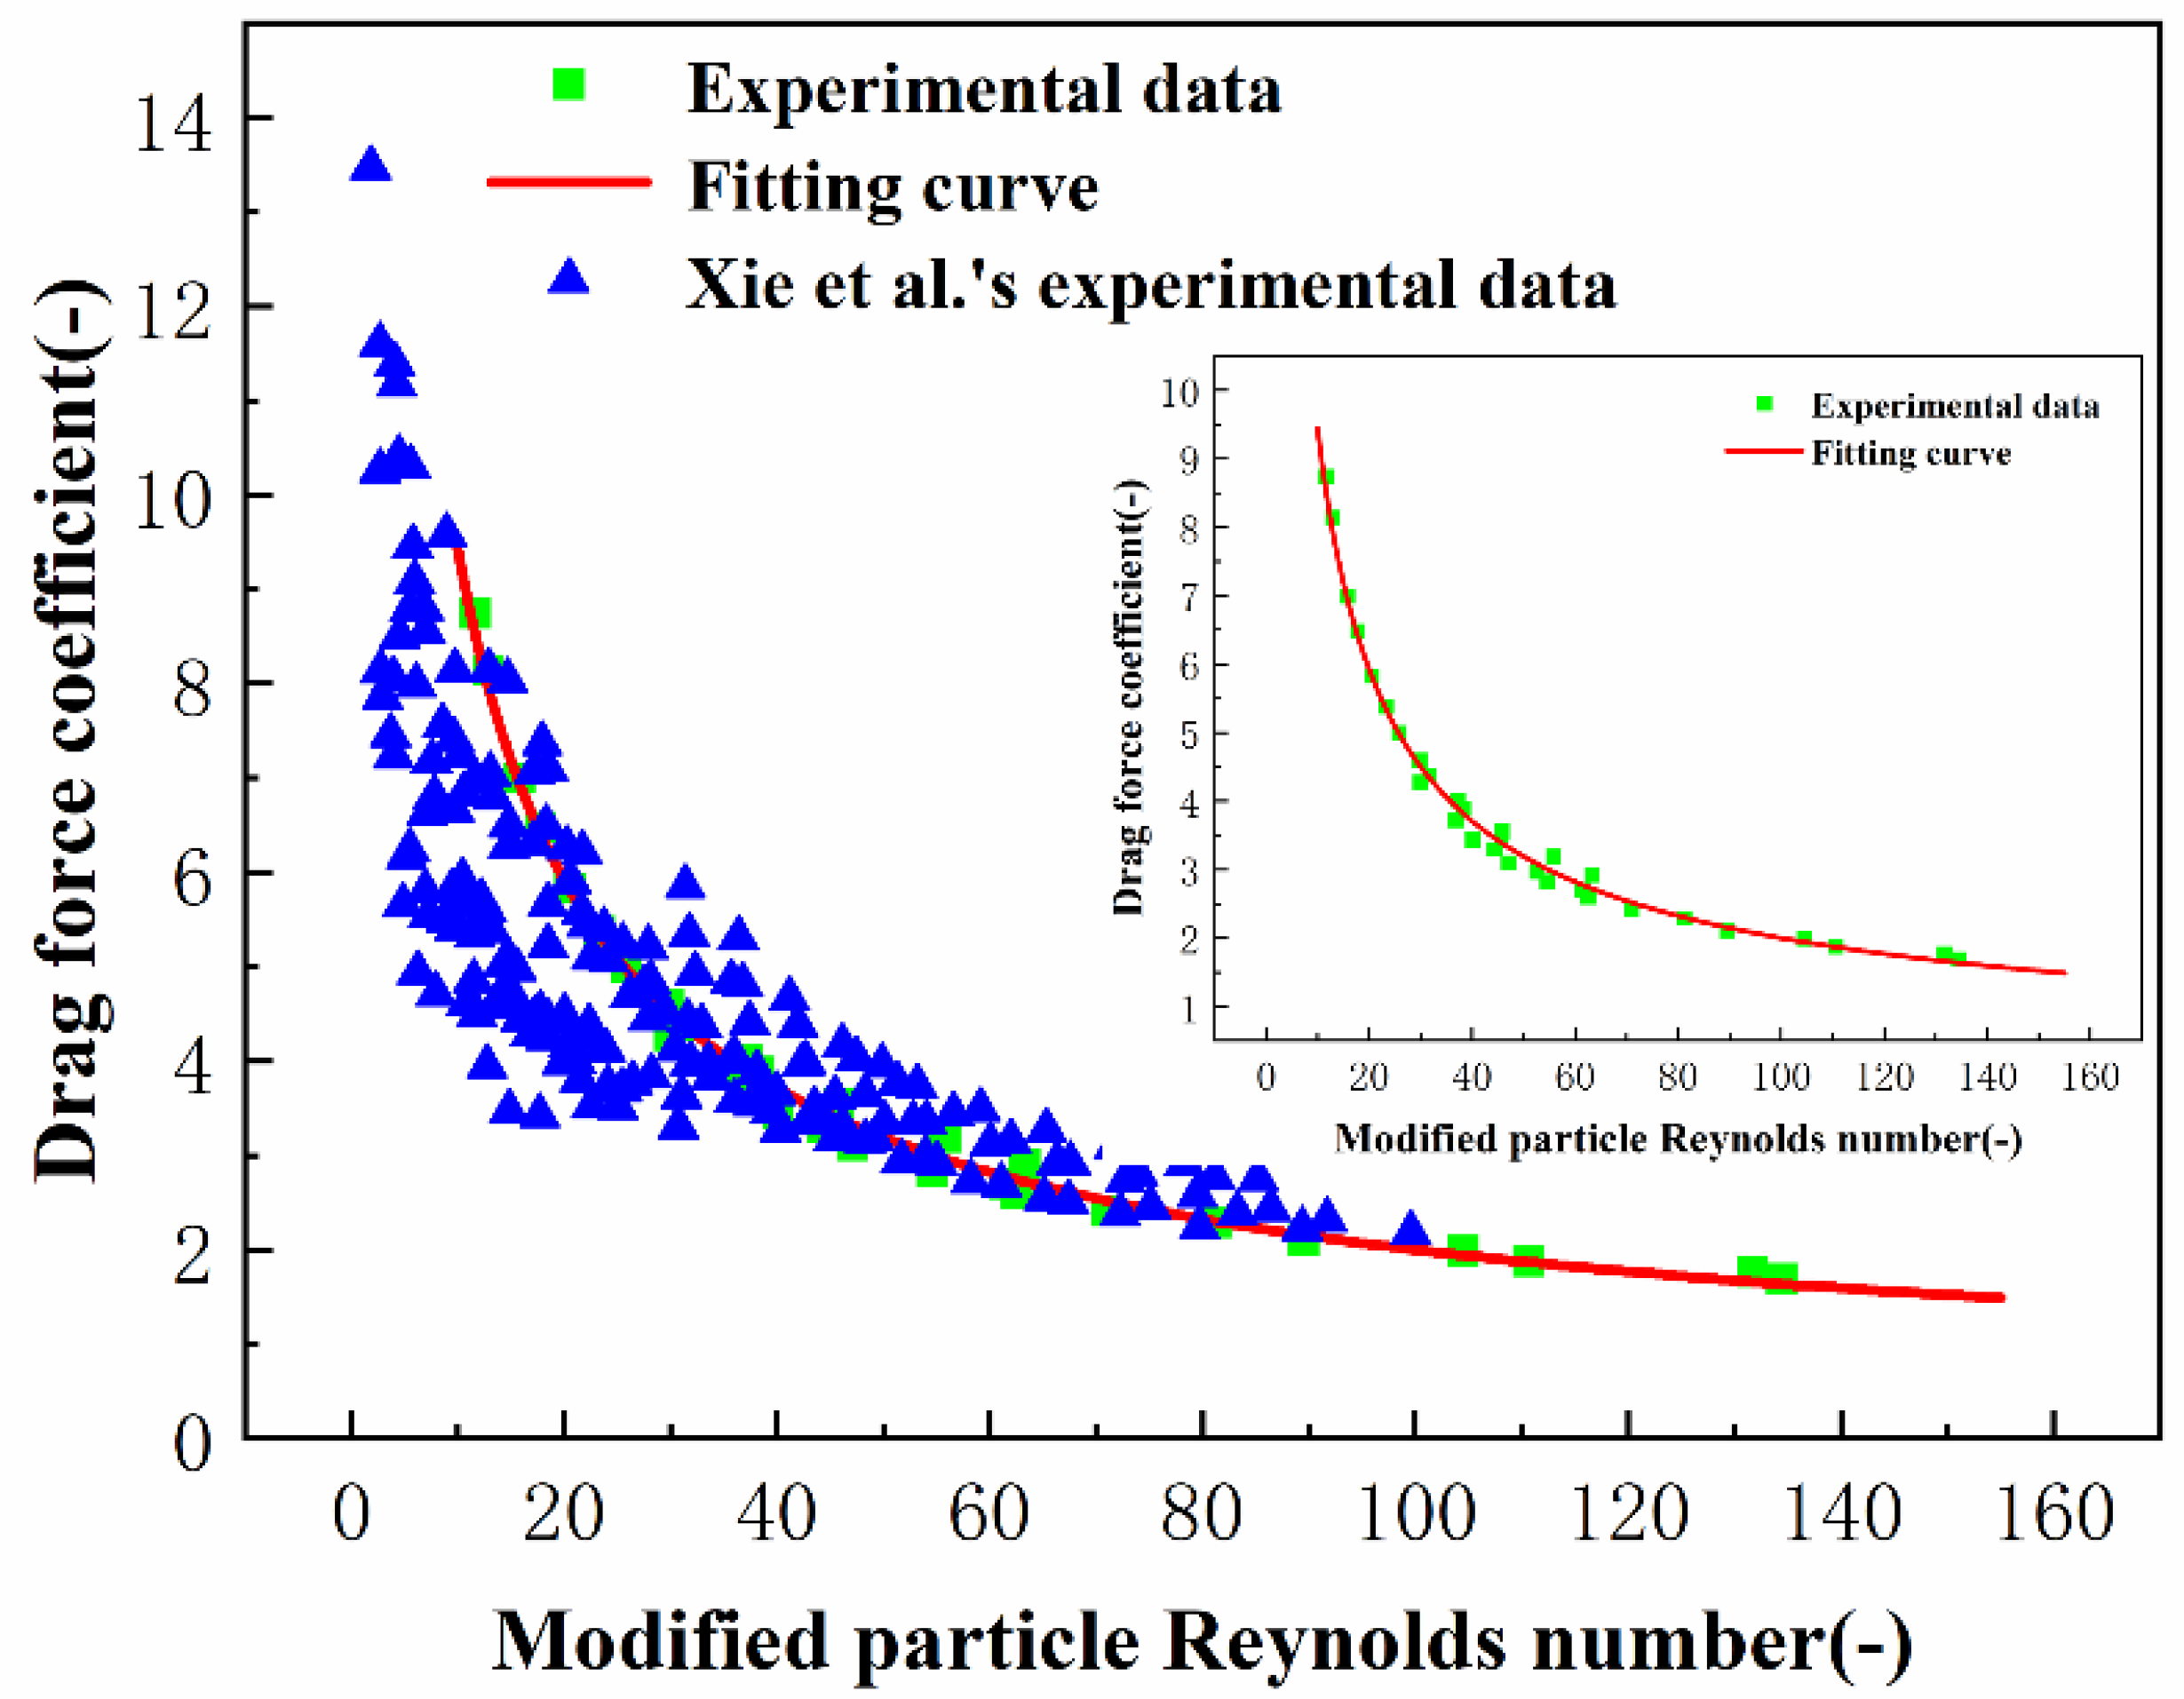
3.2. Drag Force Coefficient

In fluidized beds, the fluid will be accompanied by a pressure drop when passing through a granular bed due to frictional loss and inertia. Even though the fluidization reaches steady state, for example, when the bed height is nearly constant, the pressure drop may still fluctuate because of local changes in the bed voidage. As recommended by Ergun [45], the pressure drop in a fluidized bed is defined as:
Δ p = f H v 0 2 ρ l ( 1 ε ) d s ε 3
where Δ p , f , v 0 , ρ l , H , d s , and ε are the pressure drop, drag coefficient, flow velocity, fluid density, bed height, particle size, and bed voidage, respectively. For a fluidized bed, the pressure drop can be calculated as follows [46,47,48]:
Δ p = ( ρ s ρ l ) g ( 1 ε ) H
As shown in Equation (6), the pressure drop is determined by the bed voidage and bed expansion height. Generally, the bed voidage is also one of the most important evaluation indexes for the fluidization performance. The Richardson–Zaki relation has been widely used to calculate the bed voidage [48]:
ε n = v s v t
where vs, is the superficial velocity, which can be determined by the flow rate and pipe diameter; vt is the terminal velocity of an isolated particle in an unbounded fluid. Stokes has derived the famous expression for the settling velocity of a sphere, now known as Stokes’ settling velocity vts.
v t s = g 18 ( ρ s ρ l ) d s 2
Phillip P. Brown and Desmond F. Lawler [49] obtained a new settlement velocity expression based on 480 data points, which can predict settlement velocity very accurately when the terminal Reynolds number is less than 4000.
v t = v t s 3.13 + R e t 0.682 3.13 + R e t 0.682 + 0.409 R e t 0.682 + 1 / 3 + 0.00985 R e t 0.682 + 2 / 3
In Equation (7), n is the Richardson–Zaki coefficient, which is highly dependent on the Reynolds number. A number of researchers have modified this correlation. In the literature, a collection of equations is given to estimate the Richardson–Zaki index n of which the most popular are presented in Table 2.
In Table 2, the particle Reynolds number Ret under terminal settling conditions and the Archimedes number Ar can be determined as follows:
Re t = d s v t ρ l μ l
A r = g d s 3 ρ l ( ρ s ρ l ) μ l 2
Kramer et al. [54] obtained a new expression for n based on more ideal fluidization experiments:
4.8 n n 2.4 = 0.043 Re t 0.75
4.8 n n 2.4 = 0.015 A r 0.5
which improves the accuracy deviation of the Richardson–Zakie equation from 15% to 3%.
Figure 6 shows the relationship between bed voidage and superficial velocity for the four different coal particle samples. With the increase in superficial velocity, the bed voidage significantly increases, especially for the small and light particles. The maximum bed voidage is 0.74 when the particle size is 0.7 ± 0.1 mm, the particle density is 1500 kg/m3, and the superficial velocity is 0.0208 m/s. For the large and heavy particles, the bed voidage is 0.65 even though the superficial velocity increases to 0.0375 m/s. As discussed above, the linear relationship between bed expansion ratio and superficial velocity was only observed at low superficial velocities. It can be seen in Figure 6 that there is a power function relationship between bed voidage and superficial velocity throughout the entire range of velocities. The goodness of fit (R2) is higher than 0.988. The reliable and straightforward voidage prediction model obtained by Kramer et al. [55] in a fluidization system is also a power function relationship.
The dimensionless drag force coefficient can be determined as follows:
f = ( ρ s ρ l ) ρ l g d s v 0 2 ε 3
In addition to the modified particle Reynolds number (Res), the densimetric Froude number (Frp) is also commonly used in liquid–solid fluidization. These values are defined as follows:
Re s = ρ l d s v 0 μ l 1 1 ε
F r p = v s ( ρ s / ρ l 1 ) g d s
By adjusting particle size, particle density, and apparent velocity, 31 fluidization experimental datasets (see Figure 2 and Figure 6) were obtained. Figure 7 shows the relationship between the drag force coefficient and the modified particle Reynolds number. The drag force coefficient decreases as the particle Reynolds number increases. In this study, the least squares method is used to fit the experimental data. As reported in the literature, the relationship between drag coefficient and Reynolds number satisfies a power function [45,56,57,58,59]. Therefore, a power function is considered as the target fitting function in this study. The following drag coefficient functional relationship is obtained:
f = 44.56 Re s 0.674    R 2 = 0.9909
As shown, the goodness of fit (R2) is higher than 0.99. Additionally, our experimental data are compared with those reported by Xie et al., who investigated the drag coefficient correlation for coarse coal particle fluidization in a transitional flow regime [11]. Although the experimental conditions are different, the calculated dimensionless drag coefficients agree well with the reported data, thus validating the rationality of our experimental data. In addition, the regularity of our experimental data is better. Therefore, the proposed drag force coefficient correlation may have wider application prospects.
The densimetric Froude number is widely used to evaluate the fluidization characteristics of a liquid–solid fluidization system. As early as 1948, Wilhelm and Kwauk proposed that the two fluidization states, namely particulate fluidization and aggregative fluidization, can be distinguished according to the Froude number [17]. The Froude number expresses the influence of gravity on flow; its physical meaning is the ratio of inertial force to gravity. A plot of the drag force coefficient versus Froude number is shown in Figure 8. In this study, the Froude number ranges from 0.12 to 0.43. This means that the fluidization of coal particles does not belong to particulate fluidization or aggregative fluidization but is in the transition stage between the two. Generally, the drag force coefficient decreases with the increase in Froude number. The relationship between drag coefficient and Froude number also satisfies a power function. However, these functional relationships are related to particle density and particle size.
As can be seen from Equations (18) and (20), both particle size and density have an impact on drag force coefficient and Froude number. In the case of a constant apparent flow rate, the drag force coefficient increases with the increase in particle size and density, while Froude number decreases with the increase of particle size and density.
In Figure 8, the experimental comparison of 1# and 2# shows that the particle sizes are both 0.7 mm, and the particle density increases from 1500 to 1700 m3/kg. Compared with curve 1#, curve 2# deviates to the lower left, indicating that the influence of particle density on Froude number is greater than the drag force coefficient. The comparison of test 1# and 3# shows that the particle density is the same, and the particle size increases from 0.7 mm to 1.25 mm. Compared with curve 1#, curve 3# moves to the lower left with a larger amplitude, indicating that the influence of particle size on Froude number is greater than the drag force coefficient.

4. Conclusions

In this study, the heterogeneous fluidization and flow resistance in a square liquid–solid fluidized bed were investigated. Various fluidization experiments were performed by adjusting the operating conditions of particle size, particle density, and liquid superficial velocity. For each case, the bed expansion height and the pressure drop were measured and used to analyze the flow stability and flow resistance.
In most cases, the liquid–solid fluidized bed is in a homogeneous fluidization state. With the increase in particle size and particle density, the fluidized bed will become more stable. As the superficial liquid velocity increases, however, the homogeneous fluidization will change to heterogeneous fluidization, which is reflected by fluctuations in the pressure drop.
The relationships between the flow resistance coefficient and the Reynolds number and Froude number both satisfy a power function. The relationship between the drag coefficient and Froude number is dependent on particle density and particle size, while the relationship between the drag coefficient and Reynolds number is independent of particle density and particle size. The obtained experimental data provide insight into the fluidization characteristics for liquid–solid fluidized beds. In future work, attention will focus on the fluidization mechanism of liquid–solid systems.

Author Contributions

Conceptualization, J.P.; Formal analysis, J.P., Y.X.; Investigation, J.P.; Methodology, J.P.; Project administration, W.S.; Software, J.P.; Supervision, H.H. and L.X.; Validation, J.P.; Visualization, J.P.; Writing—Original draft preparation, J.P.; Writing—Review and Editing, H.H. and L.X. All authors have read and agreed to the published version of the manuscript.

Funding

This research received no external funding.

Data Availability Statement

The data presented in this study are available on request from the corresponding author.

Acknowledgments

This research was supported by the National Natural Science Foundation of China (NSFC) (No. 52122406), Hunan High-tech Industry Technology Innovation Leading plan (No. 2022GK4056), the Fundamental Research Funds for the Central Universities of Central South University (No.2020zzts204), and the Hunan Provincial Innovation Foundation for Postgraduate (No. CX20200249).

Conflicts of Interest

The authors declare no conflict of interest.

Nomenclature

ArArchimedes number, [-]
dsDiameter of particles, [mm]
fDrag force coefficient, [-]
FrFroude number, [-]
FrpDensimetric or particle Froude number, [-]
gGravitational acceleration, [m s−2]
HBed expansion height, [mm]
H0Initial bed expansion height, [mm]
IFluctuation intensity of the pressure drop, [-]
nRichardson–Zaki coefficient, [-]
pPressure, [Pa]
RetParticle Reynolds number, [-]
ResModified particle Reynolds number, [-]
tTime, [s]
νsSuperficial velocity, [m s−1]
νtTerminal velocity, [m s−1]
νtsStokes’ settling velocity, [m s−1]
ρsSolid density, [kg m−3]
ρlLiquid density, [kg m−3]
μViscosity, [Pa s]
εVoidage, [-]
χBed expansion ratio, [-]

References

  1. Galvin, K.P.; Zhou, J.; van Netten, K. Dense medium separation in an inverted fluidised bed system. Miner. Eng. 2018, 126, 101–104. [Google Scholar] [CrossRef]
  2. Jameson, G.J.; Cooper, L.; Tang, K.K.; Emer, C. Flotation of coarse coal particles in a fluidized bed: The effect of clusters. Miner. Eng. 2020, 146, 106099. [Google Scholar] [CrossRef]
  3. Lu, L.Q.; Yoo, K.; Benyahia, S. Coarse-grained-particle method for simulation of liquid-solids reacting flows. Ind. Eng. Chem. Res. 2016, 55, 10477–10491. [Google Scholar] [CrossRef]
  4. Sowmeyan, R.; Swaminathan, G. Performance of inverse anaerobic fluidized bed reactor for treating high strength organic wastewater during start-up phase. Bioresour. Technol. 2008, 99, 6280–6284. [Google Scholar] [CrossRef] [PubMed]
  5. Tripathy, A.; Bagchi, S.; Biswal, S.K.; Meikap, B.C. Study of particle hydrodynamics and misplacement in liquid-solid fluidized bed separator. Chem. Eng. Res. Des. 2017, 117, 520–532. [Google Scholar] [CrossRef]
  6. Liu, B.; Li, X.; Li, Z.; Sui, H.; Li, H. Fluidized countercurrent solvent extraction of oil pollutants from contaminated soil. Part 1: Fluid mechanics. Chem. Eng. Res. Des. 2015, 94, 501–507. [Google Scholar] [CrossRef]
  7. Yang, W.-C. Handbook of fluidization and fluid-particle systems. China Particuology 2003, 1, 137. [Google Scholar] [CrossRef]
  8. Gibilaro, L.G. Fluidization-dynamics, the formulation and applications of a predictive theory for the fluidized state. In Fluidization-Dynamics, the Formulation and Applications of a Predictive Theory for the Fluidized State; Gibilaro, L.G., Ed.; Butterworth-Heinemann: Oxford, UK, 2001; pp. 1–7. [Google Scholar]
  9. Epstein, N. Applications of liquid-solid fluidization. Int. J. Chem. React. Eng. 2002, 1. [Google Scholar] [CrossRef]
  10. Nijssen, T.M.J.; Kramer, O.J.I.; de Moel, P.J.; Rahman, J.; Kroon, J.P.; Berhanu, P.; Boek, E.S.; Buist, K.A.; van der Hoek, J.P.; Padding, J.T.; et al. Experimental and numerical insights into heterogeneous liquid-solid behaviour in drinking water softening reactors. Chem. Eng. Sci. X 2021, 11, 100100. [Google Scholar] [CrossRef]
  11. Xie, L.; Wang, D.; Wang, H. Effective drag coefficient correlation for coarse coal particle fluidization in transitional flow regime. Chem. Eng. Res. Des. 2021, 172, 109–119. [Google Scholar] [CrossRef]
  12. Wang, S.Y.; Li, X.Q.; Wu, Y.B.; Li, X.; Dong, Q.; Yao, C.H. Simulation of flow behavior of particles in a liquid-solid fluidized bed. Ind. Eng. Chem. Res. 2010, 49, 10116–10124. [Google Scholar] [CrossRef]
  13. Di Felice, R. Hydrodynamics of liquid fluidisation. Chem. Eng. Sci. 1995, 50, 1213–1245. [Google Scholar] [CrossRef]
  14. Cheng, Y.; Zhu, J. Hydrodynamics and scale-up of liquid-solid circulating fluidized beds: Similitude method vs. Cfd. Chem. Eng. Sci. 2008, 63, 3201–3211. [Google Scholar] [CrossRef]
  15. Esteghamatian, A.; Bernard, M.; Lanced, M.; Hammouti, A.; Wachs, A. Micro/meso simulation of a fluidized bed in a homogeneous bubbling regime. Int. J. Multiph. Flow 2017, 92, 93–111. [Google Scholar] [CrossRef]
  16. Esteghamatian, A.; Euzenat, F.; Hammouti, A.; Lance, M.; Wachs, A. A stochastic formulation for the drag force based on multiscale numerical simulation of fluidized beds. Int. J. Multiph. Flow 2018, 99, 363–382. [Google Scholar] [CrossRef]
  17. Kasat, G.R.; Khopkar, A.R.; Ranade, V.V.; Pandita, A.B. Cfd simulation of liquid-phase mixing in solid-liquid stirred reactor. Chem. Eng. Sci. 2008, 63, 3877–3885. [Google Scholar] [CrossRef]
  18. Kramer, O.J.I.; Padding, J.T.; van Vugt, W.H.; de Moel, P.J.; Baars, E.T.; Boek, E.S.; van der Hoek, J.P. Improvement of voidage prediction in liquid-solid fluidized beds by inclusion of the froude number in effective drag relations. Int. J. Multiph. Flow 2020, 127, 103261. [Google Scholar] [CrossRef]
  19. Sardeshpande, M.V.; Juvekar, V.A.; Ranade, V.V. Hysteresis in cloud heights during solid suspension in stirred tank reactor: Experiments and cfd simulations. Aiche J. 2010, 56, 2795–2804. [Google Scholar] [CrossRef]
  20. Sardeshpande, M.V.; Sagi, A.R.; Juvekar, V.A.; Ranade, V.V. Solid suspension and liquid phase mixing in solid-liquid stirred tanks. Ind. Eng. Chem. Res. 2009, 48, 9713–9722. [Google Scholar] [CrossRef]
  21. Song, Y.F.; Sun, Z.N.; Zhang, C.; Zhu, J.; Lu, X.F. Numerical study on liquid-solid flow characteristics in inverse circulating fluidized beds. Adv. Powder Technol. 2019, 30, 317–329. [Google Scholar] [CrossRef]
  22. Song, Y.; Zhu, J.; Zhang, C.; Sun, Z.N.; Lu, X.F. Comparison of liquid-solid flow characteristics in upward and downward circulating fluidized beds by cfd approach. Chem. Eng. Sci. 2019, 196, 501–513. [Google Scholar] [CrossRef]
  23. Wilhelm, R.; Kwauk, M. Fluidization of solid particles. Chem. Engng. Prog. 1948, 44, 201–208. [Google Scholar]
  24. Razzak, S.A.; Barghi, S.; Zhu, J.X. Electrical resistance tomography for flow characterization of a gas-liquid-solid three-phase circulating fluidized bed. Chem. Eng. Sci. 2007, 62, 7253–7263. [Google Scholar] [CrossRef]
  25. Razzak, S.A.; Barghi, S.; Zhu, J.X. Axial hydrodynamic studies in a gas-liquid-solid circulating fluidized bed riser. Powder Technol. 2010, 199, 77–86. [Google Scholar] [CrossRef]
  26. Razzak, S.A.; Barghi, S.; Zhu, J.X.; Mi, Y. Phase holdup measurement in a gas-liquid-solid circulating fluidized bed (glscfb) riser using electrical resistance tomography and optical fibre probe. Chem. Eng. J. 2009, 147, 210–218. [Google Scholar] [CrossRef]
  27. Zbib, H.; Ebrahimi, M.; Ein-Mozaffari, F.; Lohi, A. Comprehensive analysis of fluid-particle and particle-particle interactions in a liquid-solid fluidized bed via cfd-dem coupling and tomography. Powder Technol. 2018, 340, 116–130. [Google Scholar] [CrossRef]
  28. Zbib, H.; Ebrahimi, M.; Ein-Mozaffari, F.; Lohi, A. Hydrodynamic behavior of a 3-D liquid-solid fluidized bed operating in the intermediate flow regime-application of stability analysis, coupled cfd-dem, and tomography. Ind. Eng. Chem. Res. 2018, 57, 16944–16957. [Google Scholar] [CrossRef]
  29. Reddy, R.K.; Sathe, M.J.; Joshi, J.B.; Nandakumar, K.; Evans, G.M. Recent developments in experimental (piv) and numerical (dns) investigation of solid-liquid fluidized beds. Chem. Eng. Sci. 2013, 92, 1–12. [Google Scholar] [CrossRef]
  30. Liu, G.; Wang, P.; Wang, S.; Sun, L.; Yang, Y.; Xu, P. Numerical simulation of flow behavior of liquid and particles in liquid–solid risers with multi scale interfacial drag method. Adv. Powder Technol. 2013, 24, 537–548. [Google Scholar] [CrossRef]
  31. Cornelissen, J.T.; Taghipour, F.; Escudie, R.; Ellis, N.; Grace, J.R. Cfd modelling of a liquid-solid fluidized bed. Chem. Eng. Sci. 2007, 62, 6334–6348. [Google Scholar] [CrossRef]
  32. Dadashi, A.; Zhu, J.X.; Zhang, C. A computational fluid dynamics study on the flow field in a liquid-solid circulating fluidized bed riser. Powder Technol. 2014, 260, 52–58. [Google Scholar] [CrossRef]
  33. Hua, L.N.; Lu, L.Q.; Yang, N. Effects of liquid property on onset velocity of circulating fluidization in liquid-solid systems: A cfd-dem simulation. Powder Technol. 2020, 364, 622–634. [Google Scholar] [CrossRef]
  34. Wang, S.Y.; Guo, S.; Gao, J.S.; Lan, X.Y.; Dong, Q.; Li, X.Q. Simulation of flow behavior of liquid and particles in a liquid-solid fluidized bed. Powder Technol. 2012, 224, 365–373. [Google Scholar] [CrossRef]
  35. Ye, X.; Chu, D.Y.; Lou, Y.Y.; Ye, Z.L.; Wang, M.K.; Chen, S.H. Numerical simulation of flow hydrodynamics of struvite pellets in a liquid-solid fluidized bed. J. Environ. Sci. 2017, 57, 391–401. [Google Scholar] [CrossRef]
  36. Luo, H.; Zhang, C.; Zhu, J. Development of a numerical model for the hydrodynamics simulation of liquid-solid circulating fluidized beds. Powder Technol. 2019, 348, 93–104. [Google Scholar] [CrossRef]
  37. Koerich, D.M.; Lopes, G.C.; Rosa, L.M. Investigation of phases interactions and modification of drag models for liquid-solid fluidized bed tapered bioreactors. Powder Technol. 2018, 339, 90–101. [Google Scholar] [CrossRef]
  38. Wu, Y.C.; Yang, B. An overview of numerical methods for incompressible viscous flow with moving particles. Arch. Comput. Methods Eng. 2019, 26, 1255–1282. [Google Scholar] [CrossRef]
  39. Xie, L.; Luo, Z.H. Modeling and simulation of the influences of particle-particle interactions on dense solid-liquid suspensions in stirred vessels. Chem. Eng. Sci. 2018, 176, 439–453. [Google Scholar] [CrossRef]
  40. Liu, G.D.; Yu, F.; Lu, H.L.; Wang, S.; Liao, P.W.; Hao, Z.H. Cfd-dem simulation of liquid-solid fluidized bed with dynamic restitution coefficient. Powder Technol. 2016, 304, 186–197. [Google Scholar] [CrossRef]
  41. Fan, L.; Grace, J.R.; Epstein, N. Investigation of nonuniformity in a liquid-solid fluidized bed with identical parallel channels. Aiche J. 2010, 56, 92–101. [Google Scholar] [CrossRef]
  42. Mazzei, L.; Lettieri, P. Cfd simulations of expanding/contracting homogeneous fluidized beds and their transition to bubbling. Chem. Eng. Sci. 2008, 63, 5831–5847. [Google Scholar] [CrossRef]
  43. Ghatage, S.V.; Peng, Z.B.; Sathe, M.J.; Doroodchi, E.; Padhiyar, N.; Moghtaderi, B.; Joshi, J.B.; Evans, G.M. Stability analysis in solid-liquid fluidized beds: Experimental and computational. Chem. Eng. J. 2014, 256, 169–186. [Google Scholar] [CrossRef]
  44. Palkar, R.R.; Patnaikuni, V.S.; Shilapuram, V. Step by step methodology of designing a liquid-solid circulating fluidized bed using computational fluid dynamic approach. Chem. Eng. Res. Des. 2018, 138, 260–279. [Google Scholar] [CrossRef]
  45. Ergun, S. Fluid flow through packed column. Chem. Eng. Prog. 1952, 48, 89–94. [Google Scholar]
  46. Chen, X.Z.; Shi, D.P.; Gao, X.; Luo, Z.H. A fundamental cfd study of the gas-solid flow field in fluidized bed polymerization reactors. Powder Technol. 2011, 205, 276–288. [Google Scholar] [CrossRef]
  47. Islam, M.T.; Nguyen, A.V. Effect of particle size and shape on liquid-solid fluidization in a hydrofloat cell. Powder Technol. 2021, 379, 560–575. [Google Scholar] [CrossRef]
  48. Richardson, J.F.; Zaki, W.N. Sedimentation and fluidization: Part i. Chem. Eng. Res. Des. 1997, 75, S82–S100. [Google Scholar] [CrossRef]
  49. Brown Phillip, P.; Lawler Desmond, F. Sphere drag and settling velocity revisited. J. Environ. Eng. 2003, 129, 222–231. [Google Scholar] [CrossRef]
  50. Siwiec, T. The experimental verification of Richardson-Zaki law on example of selected beds used in water treatment. Electron. J. Pol. Agric. Univ. 2007, 10. Available online: http://www.ejpau.media.pl/volume10/issue2/art-05.html (accessed on 1 January 2022).
  51. Garside, J.; Al-Dibouni, M.R. Velocity-voidage relationships for fluidization and sedimentation in solid-liquid systems. Ind. Eng. Chem. Process Des. Dev. 1977, 16, 206–214. [Google Scholar] [CrossRef]
  52. Rowe, P.N. A convenient empirical equation for estimation of the Richardson-Zaki exponent. Chem. Eng. Sci. 1987, 42, 2795–2796. [Google Scholar] [CrossRef]
  53. Khan, A.R.; Richardson, J.F. The resistance to motion of a solid sphere in a fluid. Chem. Eng. Commun. 1987, 62, 135–150. [Google Scholar] [CrossRef]
  54. Kramer, O.J.I.; de Moel, P.J.; Baars, E.T.; van Vugt, W.H.; Padding, J.T.; van der Hoek, J.P. Improvement of the richardson-zaki liquid-solid fluidisation model on the basis of hydraulics. Powder Technol. 2019, 343, 465–478. [Google Scholar] [CrossRef]
  55. Kramer, O.J.I.; de Moel, P.J.; Padding, J.T.; Baars, E.T.; Hasadi, Y.M.F.E.; Boek, E.S.; van der Hoek, J.P. Accurate voidage prediction in fluidisation systems for full-scale drinking water pellet softening reactors using data driven models. J. Water Process Eng. 2020, 37, 101481. [Google Scholar] [CrossRef]
  56. Carman, P.C. Fluid flow through granular beds. Trans. Inst. Chem. Eng. 1937, 15, 150–166. [Google Scholar] [CrossRef]
  57. Dallavalle, J.M. Micromeritics: The Technology of Fine Particles, 2nd ed.; Pitman: London, UK, 1948. [Google Scholar]
  58. Schiller, V.L. Uber die grundlegenden berechnungen bei der schwerkraftaufbereitung. Z. Vernes Dtsch. Inge 1933, 77, 318–320. [Google Scholar]
  59. Dijk, J.; Wilms, D.A. Water treatment without waste material; fundamentals and state of the art of pellet softening. Aqua 1991, 40, 263–280. [Google Scholar]
Figure 1. Schematic of the liquid–solid fluidized bed experimental setup.
Minerals 12 00289 g001
Figure 2. The bed expansion ratio at different superficial velocities for the various samples 1#, 2#, 3#, and 4#.
Minerals 12 00289 g002
Figure 3. The time evolution of the pressure drop at different bed heights and superficial velocities when the particle size is 0.7 ± 0.1 mm and particle density is 1500 kg/m3: (A) νs = 0.0125 m/s; (B) νs = 0.0146 m/s; (C) νs = 0.0167 m/s; (D) νs = 0.0188 m/s.
Minerals 12 00289 g003
Figure 4. The time evolution of the pressure drop at different bed heights and superficial velocities when the particle size is 0.7 ± 0.1 mm and particle density is 1700 kg/m3: (A) νs = 0.0125 m/s; (B) νs = 0.0167 m/s; (C) νs = 0.0208 m/s.
Minerals 12 00289 g004
Figure 5. The time evolution of the pressure drop at different bed heights and superficial velocities when the particle size is 1.25 ± 0.25 mm and particle density is 1500 kg/m3: (A) νs = 0.0167 m/s; (B) νs = 0.0208 m/s; (C) νs = 0.025 m/s; (D) νs = 0.0292 m/s.
Minerals 12 00289 g005
Figure 6. The relationship between bed voidage and superficial velocity.
Minerals 12 00289 g006
Figure 7. The relationship between drag force coefficient and modified particle Reynolds number [11].
Minerals 12 00289 g007
Figure 8. The relationship between drag force coefficient and modified particle Froude number.
Minerals 12 00289 g008
Table 1. Operating conditions for fluidization experiments.
SchemeParticle Density/kg/m3Particle Size/mm Condition/State
1#1500 ± 500.7 ± 0.1Fluidized bed
2#1700 ± 500.7 ± 0.1100 mm × 20 mm × 500 mm
3#1500 ± 501.25 ± 0.25Initial bed height: 100 mm
4#1700 ± 501.25 ± 0.25Superficial velocity: 0.008–0.04 m/s
Table 2. Richardson–Zaki index equations from literature.
ReferencesEquation
Classical Richardson–Zaki equation[48] n = { 4.65    Re t < 0.2 4.4 Re t 0.03     0.2 Re t < 1 4.4 Re t 0.1    1 Re t < 500 2.4     Re t 500 (10)
General expression[50] n = c 1   Re t c 2 (11)
Garside and Al-Dibouni equation[51,52] n L n n n T = α   Re t β (12)
Khan and Richardson[53] n L n n n T = α A r β (13)
Publisher’s Note: MDPI stays neutral with regard to jurisdictional claims in published maps and institutional affiliations.

