Article

Reassessing Depositional Conditions of the Pre-Apulian Zone Based on Synsedimentary Deformation Structures during Upper Paleocene to Lower Miocene Carbonate Sedimentation, from Paxoi and Anti-Paxoi Islands, Northwestern End of Greece

by
Nicolina Bourli
1,*,
George Iliopoulos
2 and
Avraam Zelilidis
1
1
Laboratory of Sedimentology, Department of Geology, University of Patras, 26504 Patras, Greece
2
Laboratory of Paleontology and Stratigraphy, Department of Geology, University of Patras, 26504 Patras, Greece
*
Author to whom correspondence should be addressed.
Minerals 2022, 12(2), 201; https://doi.org/10.3390/min12020201
Submission received: 7 January 2022 / Revised: 31 January 2022 / Accepted: 2 February 2022 / Published: 4 February 2022
(This article belongs to the Special Issue The Deformation Structures of Carbonates)

Abstract

:
The studied area is situated in northwestern Greece and corresponds to the northern end of the Pre-Apulian Zone, in contact with the Apulian platform to the west and the Ionian Basin to the east. The proposed model is based on fieldwork, measured deformation structures, and age determination of the studied deposits. Until now, the known Pre-Apulian platform or Pre-Apulian zone represents the margins of the Apulian platform to the Ionian Basin and was formed due to the normal faults’ activity during the Mesozoic to Cenozoic Eras. Soft sediment deformation (SSD) structures are widespread within the upper Paleocene to lower Miocene limestones/marly limestones that are exposed in both Paxoi and Anti-Paxoi Islands, mostly along their eastern coasts, across sections of 2–3 km long and up to 60 m high. SSD structures, with a vertical thickness up to 10 m, have been observed in limestones and were formed during or immediately after deposition, during the first stage of sediment consolidation. SSD structures are cross-cut by normal faults, indicating their development during the rift stage. There are at least five different SSD horizons, and most of them present either an eastward or a westward progradation. These SSD structures are classified into four (4) different types of deformations: (1) thick synclines and anticlines, formed due to strong synsedimentary deformation; (2) strong and thick SSD structures that produced erosional contacts both with the underlying and the overlying undeformed horizons; (3) thin slumps, having sharp contacts with the underlying undeformed horizons and erosional contacts with the overlying undeformed horizons; and (4) thin slump horizons passing laterally to undeformed deposits in the same horizon. The studied SSD structures and their age of development introduce active margins between the Apulian platform and the Ionian Basin that have been influenced by normal fault activity. These normal faults have been active since the Ionian Basin changed gradually to a foreland basin, and after the tectonic regime changed from extension to compression, during the early to middle Eocene. It seems that compression in the studied Apulian platform margins arrived later and after the lower Miocene, and after the development of the SSD structures. The confinement of the lower Miocene deposits, both northwards and southwards (in Anti-Paxoi Island), indicates the presence of active transfer faults, with flower structure geometry, that were formed during sedimentation, producing highs and troughs. The present open anticline geometry of Paxoi Island indicates that the Island represents the forebulge area of the middle Miocene Ionian Foreland due to Ionian Thrust activity.

1. Introduction

Soft sediment deformation (SSD) structures are mostly studied and identified in clastic deposits, in which soft-sediment deformation structures are saturated with water. The strength loss in the sediment is related to the liquefaction and/or fluidity of the water, which develops because of the pore water pressure [1,2]. Additionally, SSD structures have also been observed in carbonate rocks [3,4,5], where some researchers defined them as seismites [6,7,8,9,10,11,12]. According to the above-mentioned researchers, the SSD developed just after the initial sediment consolidation, because at that time, the deposits are weakest and pore fluid can be most easily and rapidly expelled. Therefore, if pore fluid is mobilized, then the factors causing the formation of the SSD could also be enhanced abruptly and significantly [13].
The most obvious gravity-driven structures in unconsolidated soft sediments are folds and faults found in slumps or mass-transport deposits [14]. The dominant structures in slumps may reflect the orientation of the paleoslope in ancient settings [15,16,17,18,19,20,21,22,23,24,25,26,27,28].
The objective of this study is to recognize the generating mechanism of SSD structures to understand their relationship with the basin geometry and evolution, to relate them with fault activity and the age of their formation, and finally to compare the studied SSD structures with those formed within the Ionian Basin during the Cretaceous to Paleocene.

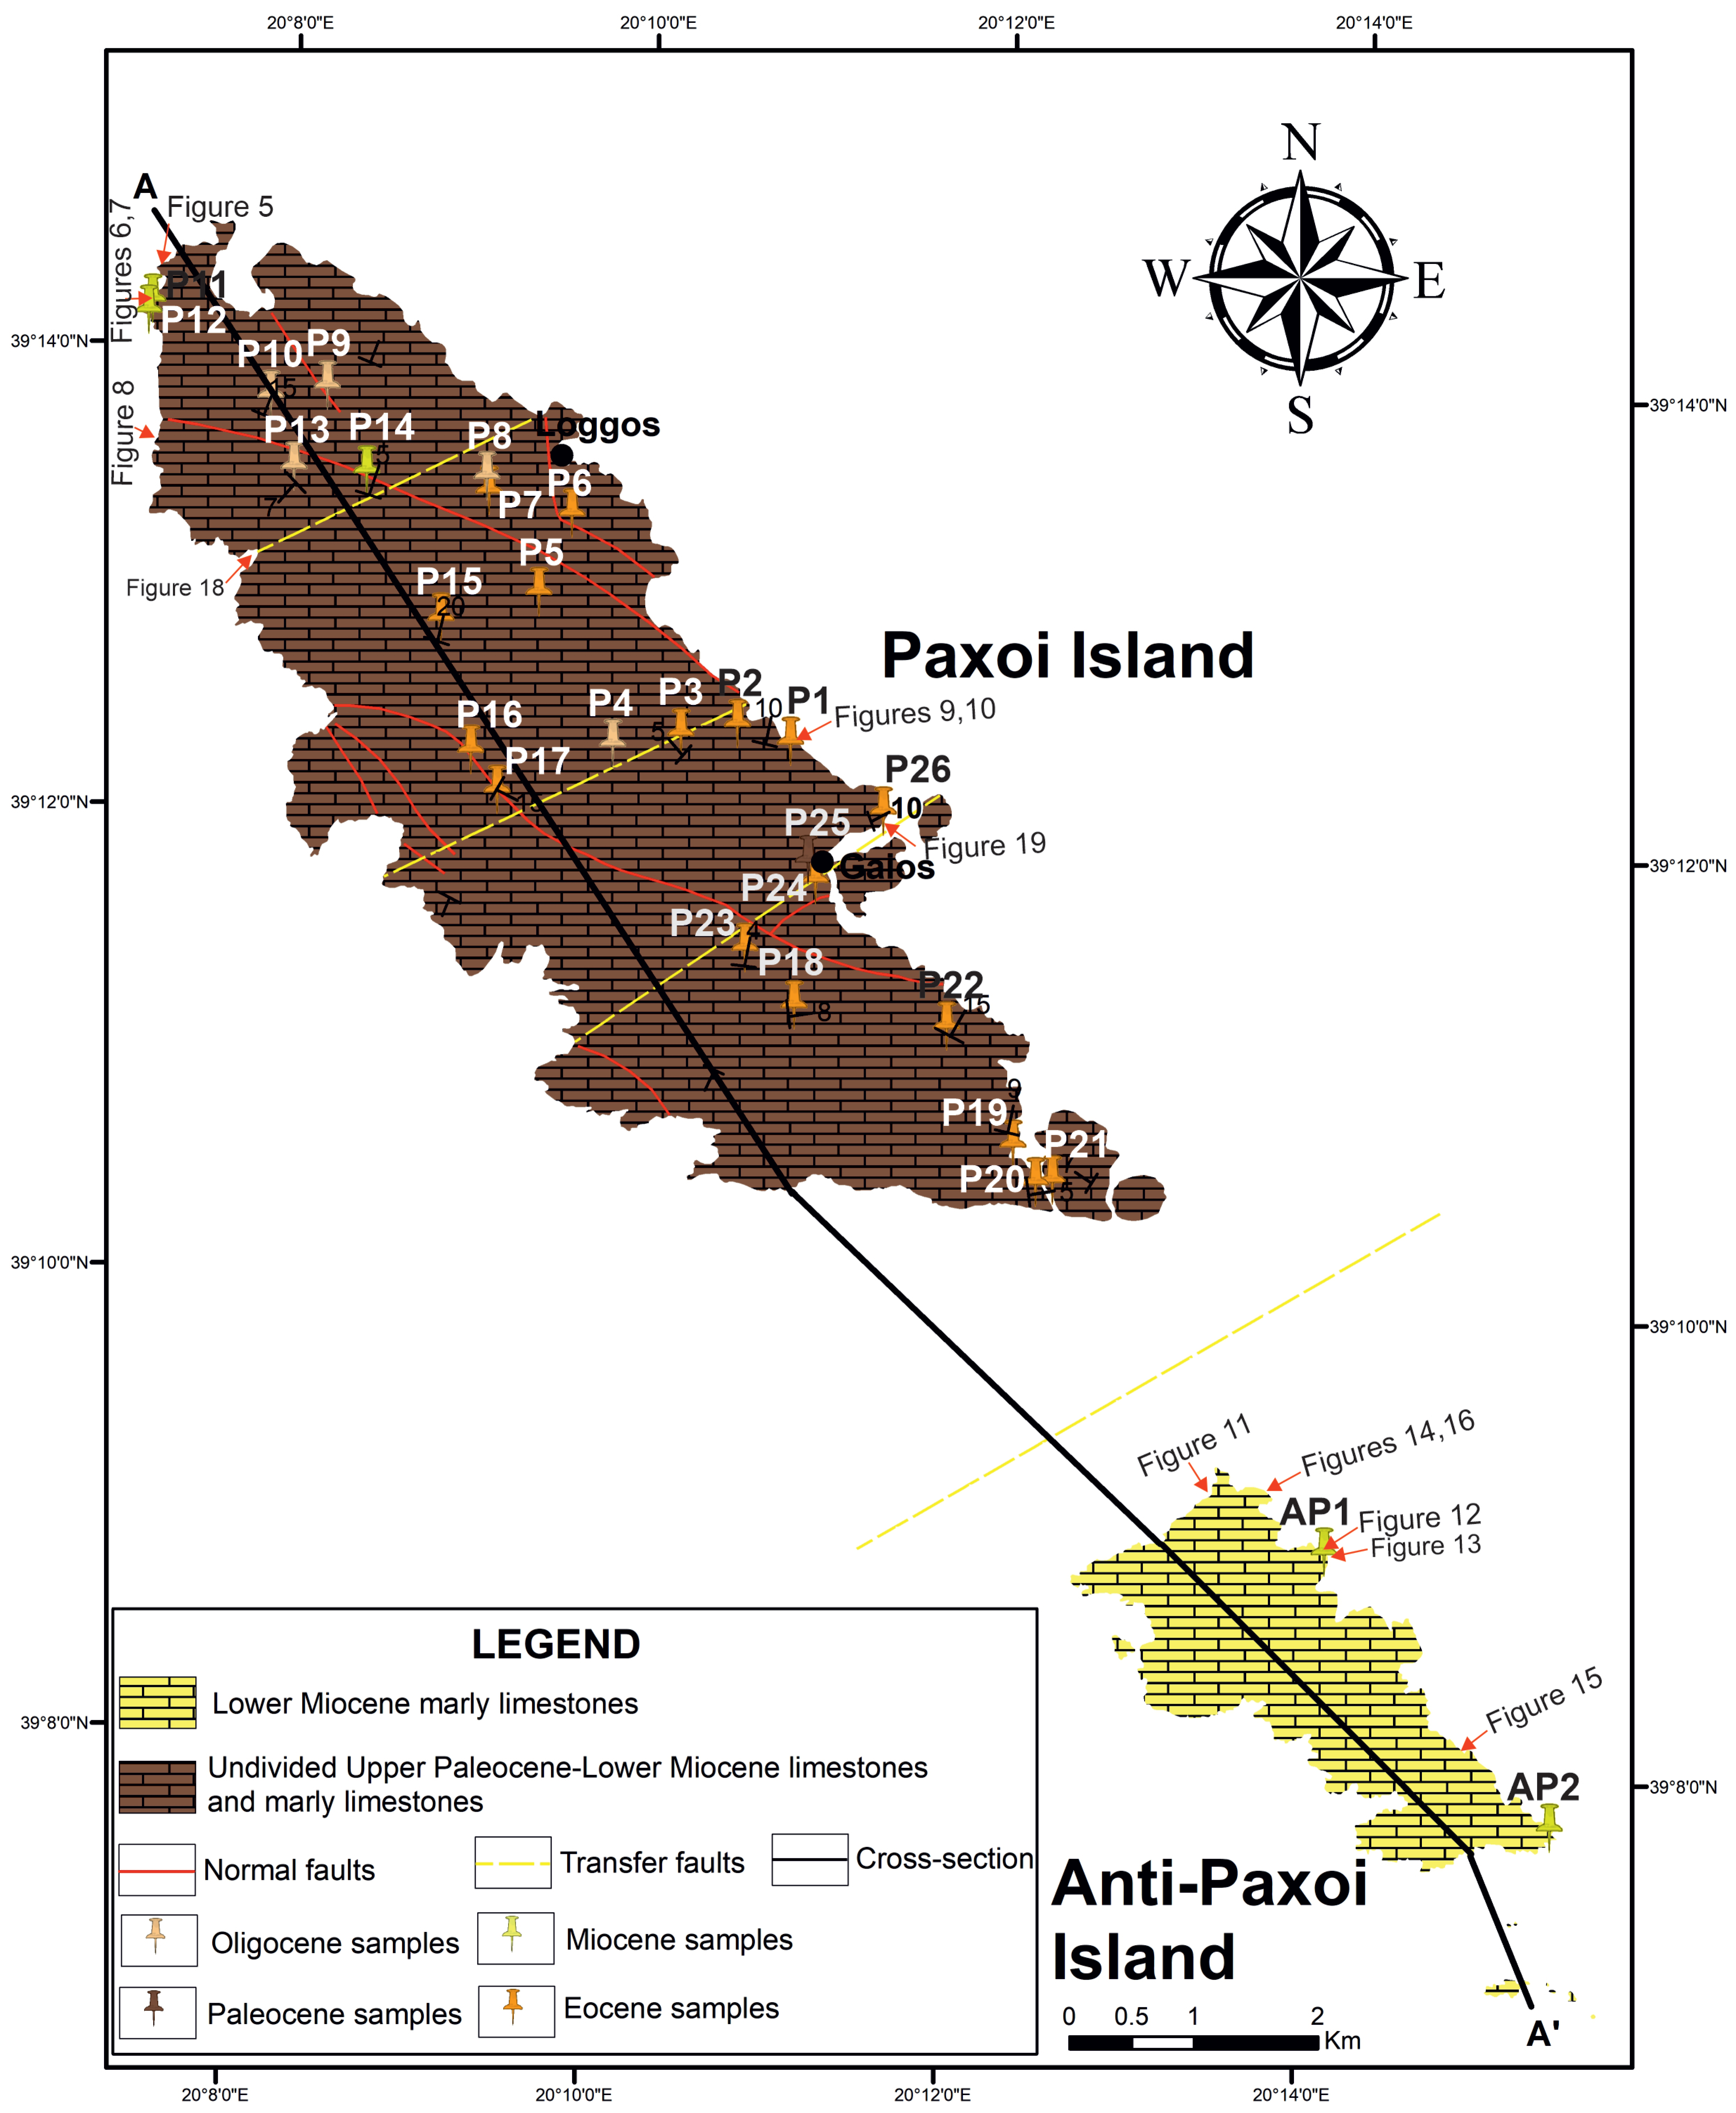
2. Materials and Methods

The depositional conditions and the age determinations were based on selected samples from which thin sections were prepared, from both islands, and especially below and above the SSD structures. Sampling was run along the Islands, in deposits of different ages, according to the pre-existing geological map of Paxoi Island [29] (Figure 1).
The classification of the studied SSD horizons was based on the following: (1) their total vertical thickness; (2) their total lateral extent; (3) the change in the thickness of SSD structures with respect to the presence of faults; (4) measurements of fault orientations and their relationship with the deformed horizons; (5) measurements of the orientation of structures within the deformed horizons, such as syncline or anticline axial planes, and their height (thickness variation) and length (lateral extent).
The above-mentioned detailed study allowed the interpretation of the paleo-displacement direction, the impact of faults on the SSD structures, and the time relationship between SSD and tectonic activity.

3. Geological Setting

The Hellenic Fault and Thrust Belt (HFTB) dominates the External Hellenides (Figure 2) and has mainly been controlled by the collision and the continued convergence of the African and Eurasian plates since the Mesozoic [30,31,32]. The most important structural control in the studied area was the contractual deformation, as suggested by the constant occurrence of evaporites throughout the thrust boundary between the Pre-Apulian platform and the Ionian Basin. Evaporites represent the lowest detachment level of the individual thrust.
The Pre-Apulian (or Paxoi) zone is the continuation of the Apulian platform and its transition to the Ionian Basin through some edge-slope facies that are exposed in several Ionian Islands, mainly in the southwestern margins of the Hellenic FTB (e.g., Kefalonia, Zakynthos) and south of Corfu (Paxoi islands). This transitional zone is absent from the NW part (Corfu Island), suggesting that the Ionian formations are directly over-thrusting over the South Apulia basin [33].
Strike-slip faults have also controlled the regional tectonic setting. The South Salento-North Corfu fault system [34] and smaller scale strike-slip faults have dissected the Ionian Thrust [35,36]. Furthermore, the Kefalonia transfer fault (KTF) to the south separates Western Greece in an ocean–continent subduction and a continent–continent collision regime, whereas the Borsh–Khardhiqit strike-slip fault to the north of Corfu controls the evolution of the broader region (Figure 2).
Based on seismic data, Kokkinou et al. [37] have suggested that normal faults that influenced Mesozoic deposits were reactivated as thrust faults during the Eocene to Miocene and were further reactivated as normal faults during the Plio-Quaternary. In addition, Basilone and Sulli [38] and Bourli et al. [36] suggested that Mesozoic normal and transfer faults were re-activated during the compressional stage as thrust or back-thrusts and strike-slip faults, respectively.
Lefkas, Kefalonia, and Zakynthos islands, in the Ionian Sea, where both the Ionian Thrust (IT) and the KTF are outcropped, are the keys for studying the regional structural evolution. This remote area has been the target of previous expeditions resulting in diverging structural interpretations [37]. Additionally, Paxoi and Anti-Paxoi islands are situated far from the interaction and influence of KTF, and only the Ionian thrust seems to be influencing the islands.
Furthermore, it has been observed that the thrusting activity of the branches of the main Ionian Thrust has led to the evolution of smaller, confined sub-basins, at least as it has been recorded on Kefalonia Island [39].
Collisional deformation across the Ionian Islands was recognized in seismic profiles, revealing the different structures near and far from the KTF [33,40,41].
The Ionian Basin (IB) is bounded westwards by the Ionian Thrust and eastwards by the Gavrovo Thrust (Figure 2). The Pre-Apulian or Paxoi zone to the west of the Ionian Basin is regarded as the eastern margin of the Apulian platform, in Albania, Croatia, and Italy, where similar rocks occur [40,42,43,44]. The APM consists of Triassic to Miocene deposits, mainly neritic carbonate rocks (Figure 3).
According to Karakitsios et al. [46], a characteristic slump horizon was observed in the Anti-Paxoi Island (Pre-Apulian zone, Western Greece), which could be followed in a zone of about 2000 m, at the eastern coast of the Island, and is overlain and underlain by undeformed strata. This slump has an average thickness of 15 m and a width of 200 m. Deformation axes present an NNW–SSE direction, coinciding with the general direction of the Pre-Apulian zone. Based on their biostratigraphic analysis, they believe that the slump and the surrounding sediments have an Early Oligocene age.

4. Depositional Conditions and Age Determination

The depositional environment conditions of the carbonate sequence in Paxoi and Anti-Paxoi islands were based on the microfacies analysis, whereas the taphonomy and paleoecology of the microfauna were also used in order to find the depositional environments and dynamic conditions in different positions across the basin and to support the previous lithofacies results. Additionally, the results were used for the revision of the existing geological maps.
Biostratigraphic results of the studied thin sections showed that sedimentation of the studied sequences from the two Islands ranged from the upper Paleocene (Thanetian) to lower Miocene (Aquitanian) (Table 1). It seems that the younger deposits are restricted in the northern part of the Paxoi Island and in the Anti-Paxoi Island as well as (Figure 4). There is a transition from the Paleocene (in the central part of Paxoi Island, sample P25) to the Eocene, then to the Oligocene and finally to the lower Miocene (northwards or southwards) (Figure 4 and Figure 5). The results indicate that during the Miocene, the basin was restricted both northwards and southwards.
The microfacies analysis (Table 1) showed that the standard microfacies that prevail in the studied area are SMF3,4,5, and in only one case SMF6 was determined, indicating deposition in zones FZ1, FZ3, and FZ4. In addition, one sample (P24) was determined as SMF18-19 that introduces FZ8 (Figure 6). In general, depositional environments correspond to deep-sea, toe of slope, and slope environments. Sample P24 classified as FZ8 representing the platform interior and especially the restricted area of the platform is of late Eocene age (Figure 4). The age determination was based on a detailed analysis, mainly on foraminifera, where characteristic fossils assemblages were determined.
The absence of lateral or vertical changes in the depositional conditions from the Paleocene to the Miocene, as facies zones changed independently with the age, introduce mostly the regional tectonic influence in this part of the APM than the total changes of the APM configuration, as it can be seen in Kefalonia Island (see their position in Figure 2).
The presence of an Eocene sample representing the platform Interior indicates the presence of a large exoclast, which supports the idea of the above-introduced regional tectonic influence but even more introduces the close position of the Apulian platform.

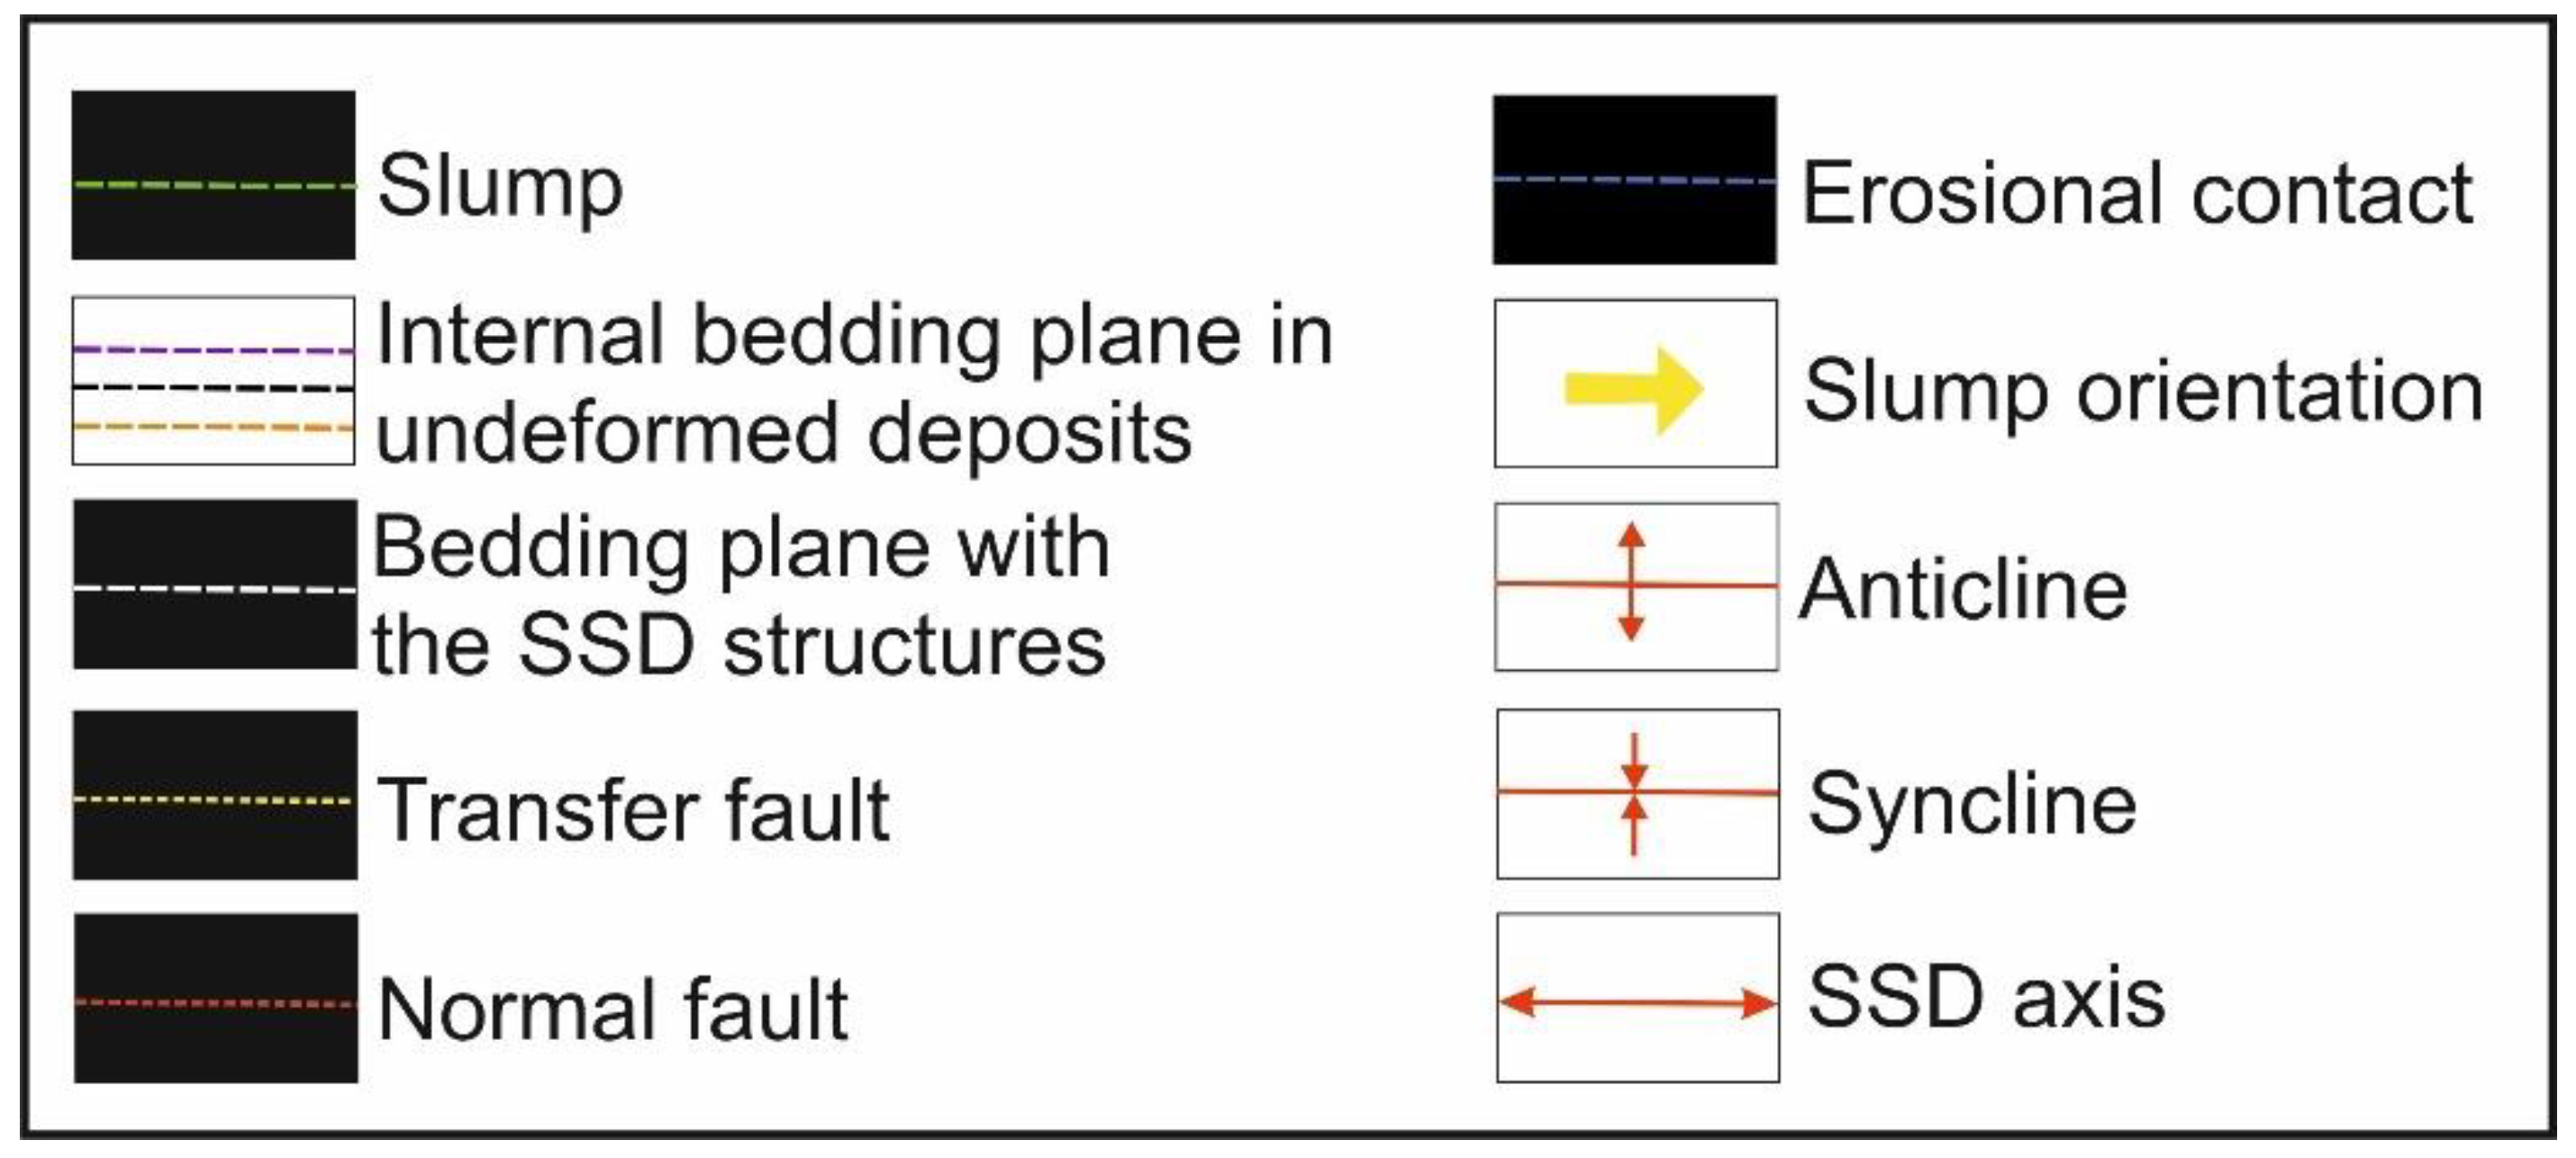
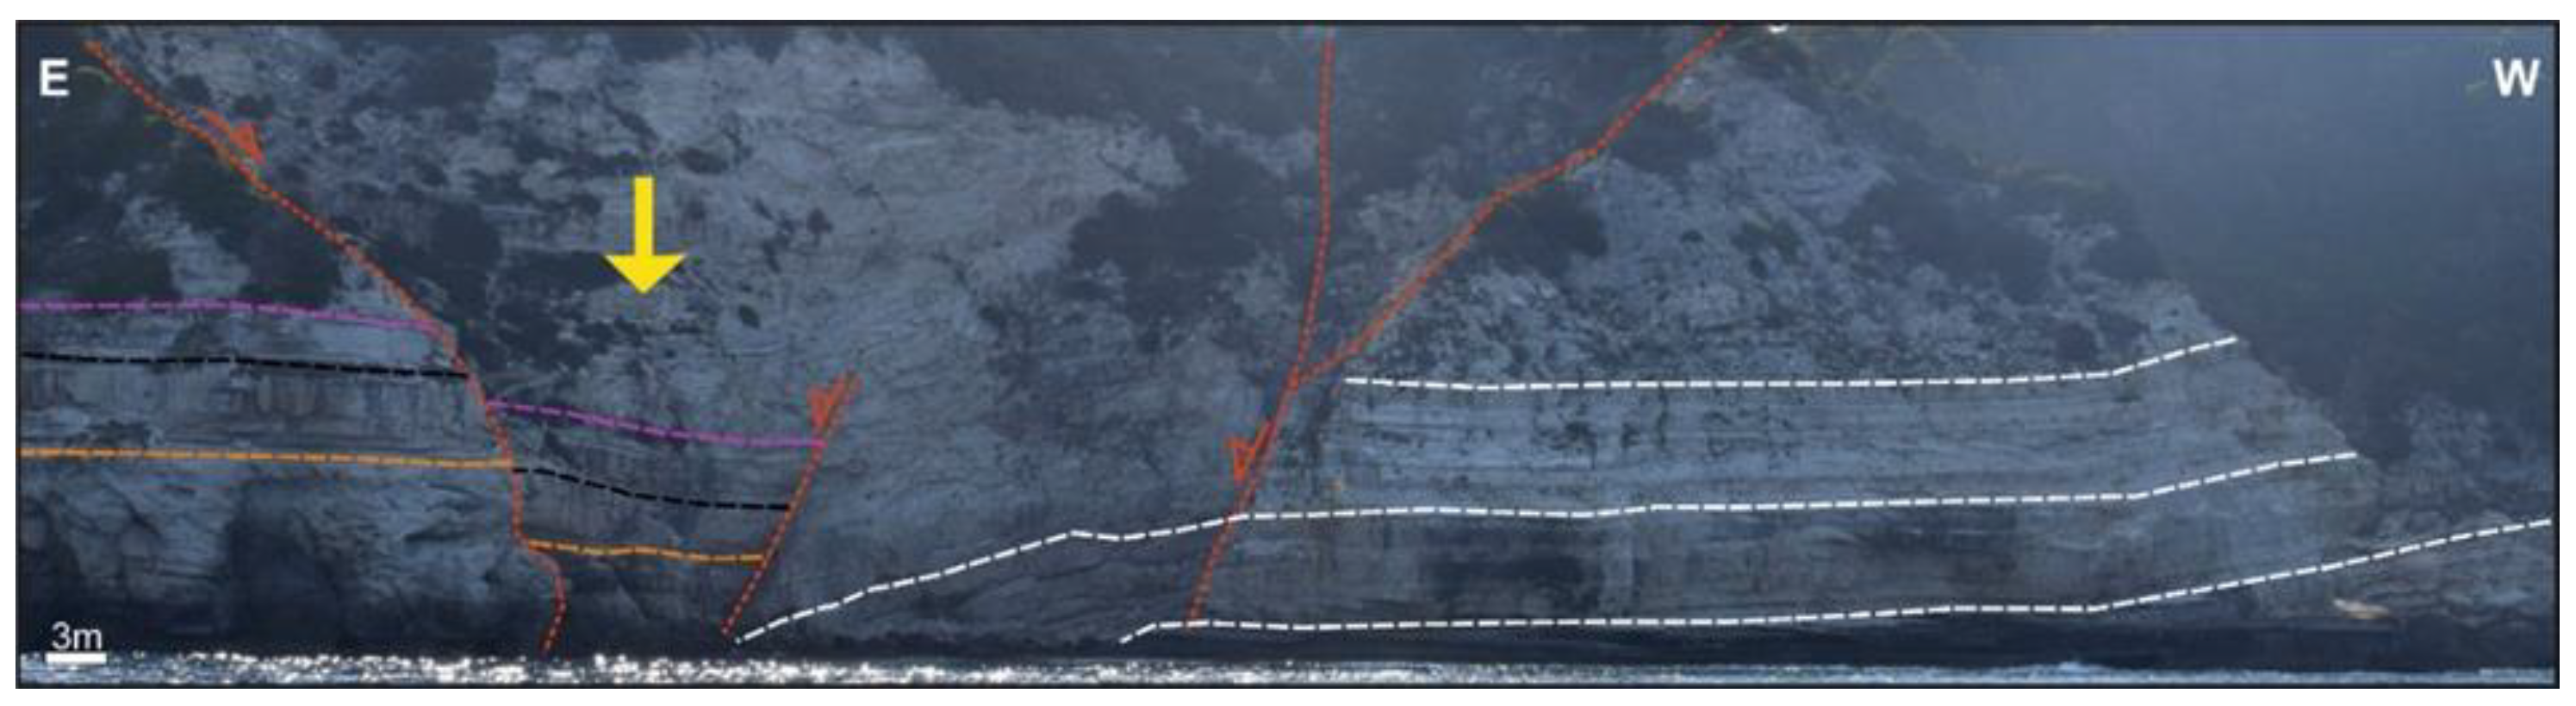
5. Soft Sediment Deformation Structures

The study of SSD structures is presented independently for the two islands, due to the fact that in the Anti-Paxoi Island there are only lower Miocene deposits, whereas in Paxoi Island there are SSD structures in Eocene to lower Miocene deposits (Figure 4). Both Islands present an elongated geometry with a general NNW–SSE direction (Figure 4). In both islands, there are cliffs at both the western and eastern coasts, with up to 80 m thick limestones, where the SSD structures are outcropping. These SSD structures could be traced for at least 2 km, although their appearance is interrupted by coasts with different directions. Most of the long coasts (up to 3 km long) have an NNW–SSE direction, parallel to the NNW–SSE directed normal faults. Shorter coasts (up to 800 m long) with an ENE–WSW direction were formed due to transfer faults with the same ENE–ESW directions (Figure 4).
Figure 7 shows the used lines and symbols for the interpretation of all photos that are used for the depiction of structures in both islands.

5.1. Paxoi Island SSD Structures Description

SSD horizons have been observed either between undeformed horizons (Figure 8) or with the one over the other (Figure 9), with strong erosional contacts, and which are related with normal fault activity, showing a westward progradation.
Commonly, the SSD structures were produced from the uplifted footwall block and stopped their migration–progradation at the subsiding hanging wall block of a neighboring fault (Figure 10).
Synthetic and antithetic faults produced troughs and influenced the movements of the SSD structures (Figure 11).
The thin SSD horizons within the Eocene deposits are characterized by sharp contacts, both with the underlying and the overlying thin to medium bedded limestones (Figure 12).
Finally, there are characteristic horizons where the progradation of the deformation took place with an eastward direction, and within the same horizon undeformed limestones developed laterally (Figure 13).

5.2. Anti-Paxoi Island SSD Structures Description

In the small Anti-Paxoi Island where only lower Miocene deposits are outcropping, the SSD structures are very thick and strong (Figure 14, Figure 15, Figure 16, Figure 17 and Figure 18) and were recognized in Miocene deposits. In detail,
Most of the SSD structures showed eastward progradation directions with their movements towards the subsiding fault plane of normal faults that present westward dipping surface planes. The thickness of these strong SSD deformation structures are up to 10 m (Figure 14a) and more than 250 m wide. The overlying deposits are characterized by erosional contacts with the SSD structures (Figure 14a).
Synthetic and antithetic faults produced troughs and influenced the movements of the SSD structures (Figure 15). Normal faults are responsible for the instability of the basin floor and the SSD structures development, whereas the antithetic faults act as the barge where the movement stopped.
There are SSD structures, up to 3 m thick and up to 70 m wide, that are characterized by sharp contacts with the underlying undeformed deposits, erosional contacts with the overlying deposits (Figure 16). Synthetic and antithetic normal faults acting synchronously with the deformation produced the necessary instability conditions for the slump triggering. Within these horizons, there are no clear evidences for the progradation direction, probably because they must have developed far away from the starting point and present a wide range of progradation.
There are also a few examples where the SSD structures, up to 4 m thick and 50 m wide, produced strong deformation to the underlying deposits, with high relief surfaces (up to 50 cm), whereas the erosional contact with the overlying deposits is seen with low relief surfaces (Figure 17).
It seems that when the SSD structures were strong and as they started their movement from the uplifted footwall of a normal fault, they could bypass the subsiding area of the hanging wall, overstepping the uplifted footwall of the neighboring normal fault, and progradating until they reached the next block (Figure 18).
Finally, there are also a few cases where two SSD horizons show opposite progradation directions and which are situated close to normal faults and probably could be related with the normal fault activity, occupying the existing space in every case and following the direction of the basement surface inclination (Figure 19). The alternative idea that the normal fault acted later and after the SSD structures must be excluded, as after the development of SSD structures, the whole area was influenced by a compressional regime, and the expected faults must have been reverse faults.

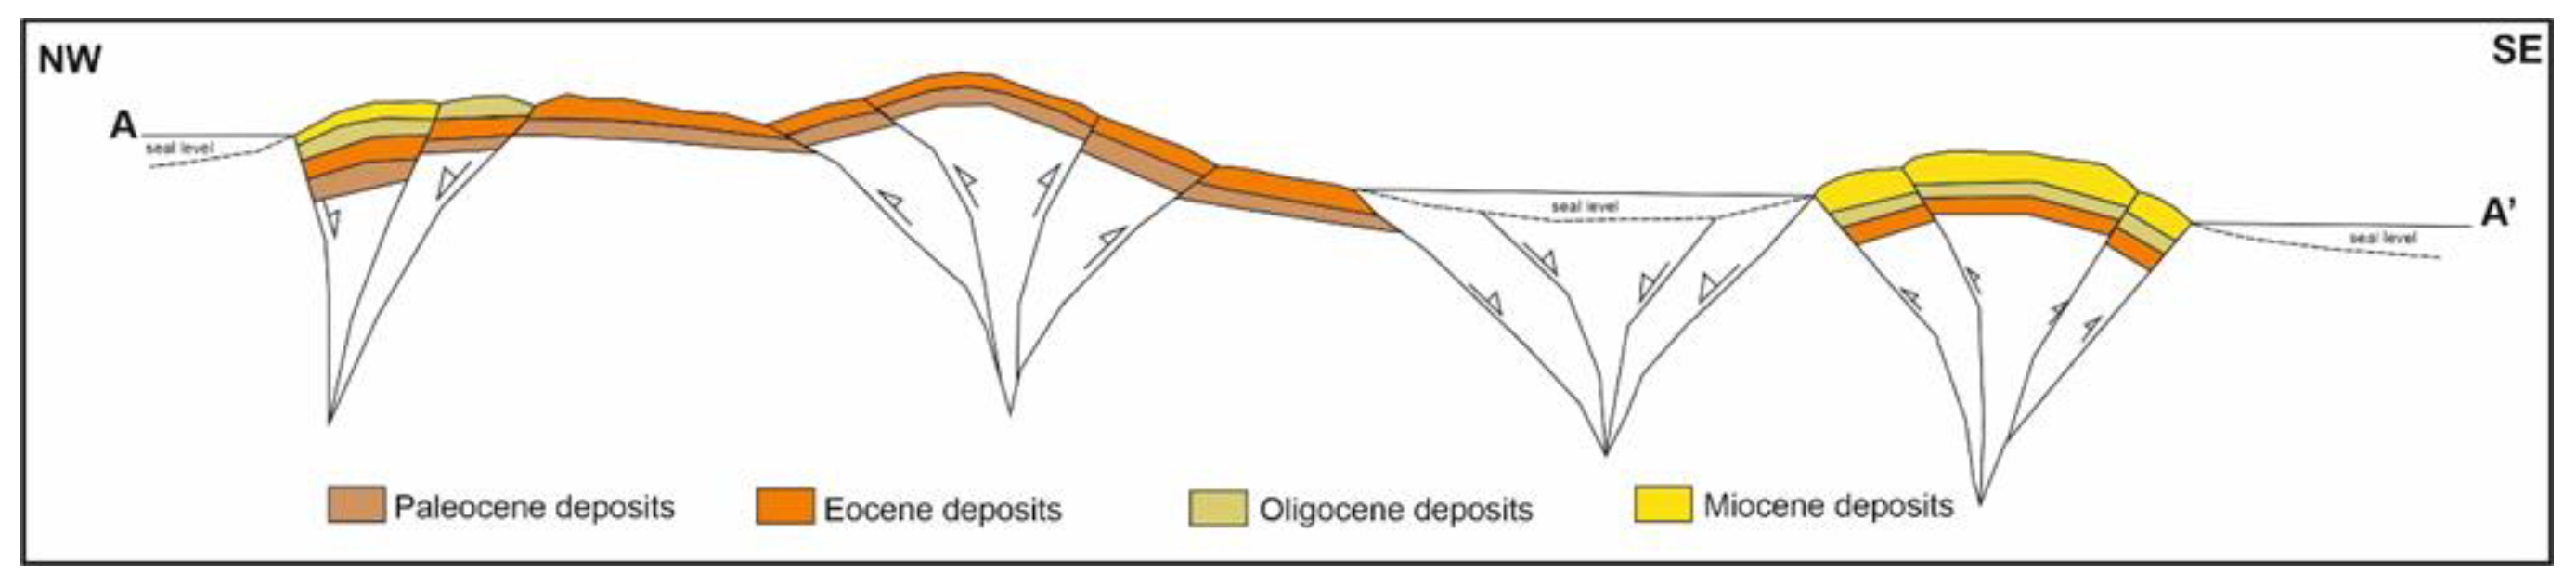
5.3. General Results Based on the SSD Structures

The deformation structures (Figure 8 and Figure 19) developed as gravity flows, during the rift stage, and presented thicker and stronger deformation within their final stage of development, as displayed by the lower Miocene deposits. There are at least five different SSD horizons, and most of them have been recognized in lower Miocene deposits; their thicknesses could reach 10 m, their width could be as wide as 300 m, and they could be traced across 2–3 km (see Figure 14, Figure 15 and Figure 18).
As there are many synsedimentary faults and although SSD structures could be traced for many kilometers, it is not clear if the above SSD structures are different horizons or if they are the same. At least three different horizons, in lower Miocene deposits, and two in Eocene deposits, were recognized.

6. Discussion

The boundary-margins of the stable Apulian platform with the Ionian Basin are so far considered as the Pre-Apulian platform e.g., Refs. [40,53]. The platform was influenced by inverted tectonics and particularly by an extensional regime (Jurassic to middle Eocene to the east and the early Miocene to the west) (Figure 20a) to a compressional regime (middle Eocene to middle Miocene, from east to west) (Figure 20b). This shift in the tectonic regime has revealed characteristic structures. The compressional regime migrated from east to west, started its activity during the middle Eocene in the eastern part and reaching during the middle Miocene the western parts of the Ionian Basin. During the above described change of the tectonic regime, the pre-existing normal faults were reactivated as thrust faults and the respective transfer faults as strike-slip faults, producing different structures [36]. The type of these structures depends on both the existing displacement of the marginal normal faults and the proximity of the IT to the KTF.
The presence of normal faults, cross cutting the SSD structures (Figure 14 and Figure 21), indicates that at least until the lower Miocene, the studied area was influenced only by extensional tectonism, supporting the idea that the compressional regime in the studied area arrived after sedimentation was completed and probably during the middle Miocene.
The fact that there is a gradual restriction of the basin both northwards and southwards, and from the upper Paleocene to the early Miocene, indicate that this restriction took place during sedimentation and could be related with the activity of transfer faults. These transfer faults had a flower structure geometry with a positive structure in the central part of the Paxoi Island and a negative structure (Figure 21d and Figure 22) between the two islands and in the northern side of Paxoi Island (Figure 23).
These transfer faults were reactivated during the compressional regime as strike-slip faults. These transfer faults with a negative flower structure geometry could be the reason for the outcropped Paleocene deposits in the central part of the Paxoi Island (Figure 4).
Relating the fact that the present geomorphology of the Paxoi Island shows an anticline geometry without any obvious activity of thrust faults, which could be related with the activity of the Ionian thrust. Thus, the activity of the Ionian thrust produced in the studied area the forebulge area, supporting the idea of the produced anticlinal geometry as a response to the shortening due to the Ionian thrust activity (Figure 20c).
The presence of the platform interior (sample P24) could be related with the Apulian platform, which is indicated to be very close to the studied region.
According to the previously published results from the Ionian Basin [14], it seems that although the previous work referred to SSD structures developed internally to the Ionian Basin, during the Cretaceous to Paleocene, the mechanism remains the same. In both regions, the produced SSD structures were related to fault activity and were produced from the uplifted footwall block. They were flowed towards the subsided hanging wall of a neighboring normal fault, and many times when the deformation was very strong, they overstepped the space in between and continued progradating to the next hanging wall until either slumping ended.
According to the previous results by Karakitsios et al. [46], there are two subjects that should be mentioned. One is the thickness and the second is the age. In relation with the thickness (15 m thick), the difference could be explained with the fact that there are SSD structures one above the other, either with the presence of undeformed horizons between them or with an erosional contact between them. In relation to age, their age determination (early Oligocene) was based on nannofossils, whereas the present study (early Miocene for the selected samples from the northeastern part of the Anti-Paxoi Island) relied on a detailed analysis based mainly on foraminifera, where characteristic fossils assemblages (e.g., Paragloborotalia kugleri, Paragloborotalia mayeri, Trilobatus primordius, Trilobatus trilobus, Globigerinoides altiaperturus, Globoquadrina dehiscens) were found determining the lower Miocene age of the respective rocks.
Finally, the pre-existing geological map was changed due to the new findings. Cretaceous deposits were not determined, and thus the late Paleocene was only found as the lowermost part of the exposed outcrops. More details were added on the new map, showing the bedding directions, and the new proposed transfer faults (Figure 24).
In order to redraw accurately the pre-existing geological map, more samples are required to cover all of the islands in order to add not only the different age deposits but also the faults that influenced their outcropping.

7. Conclusions

The known Pre-Apulian platform represents the Apulian platform margin (APM) to the Ionian Basin (IB) and was formed because of normal fault activity until the early Miocene (Aquitanian) Epoch. SSD structures in Paxoi and Anti-Paxoi islands document the presence of gravity flow processes. Gravity flows developed due to an inclined basin floor where the instability was responsible for the slumping. SSD structures were cross-cut by normal faults, indicating their development during the rift stage since the early Miocene. Most of the SSD structures progradate either eastwards (especially to Anti-Paxoi Island) or westwards (in the northern part of Paxoi Island), all of them moved towards the subsided fault planes of normal faults.
SSD structures are classified into four (4) different types of deformations: (1) Thick synclines and anticlines, formed due to strong synsedimentary deformation, which were produced mostly from N–S directed normal faults or from the interaction between normal and transfer faults, are situated between undeformed horizons. The movement of the deformation seems to have started from the uplifted footwall of a normal fault. (2) Strong and thick SSD structures, due to their strong power, produced erosional contacts both with the underlying and overlying undeformed horizons. (3) Thin slumps, with sharp contacts with the underlying undeformed horizons and erosional contacts with the overlying undeformed horizons. The upper erosional contact was formed due to the existing relief of the SSD structures with the end of the deformation. (4) Thin slump horizons passing laterally to undeformed deposits in the same horizon, show the short distance of movement. Finally, it seems that the SSD structures are stronger and thicker in the lower Miocene deposits in relation to the SSD structures within the Eocene deposits, indicating more intense tectonic activity during the early Miocene than during the Eocene.

Author Contributions

Conceptualization, N.B. and A.Z.; methodology, N.B, G.I. and A.Z.; software, N.B; formal analysis, N.B. and G.I.; investigation, N.B., G.I. and A.Z.; resources, N.B.; data curation, N.B.; writing—original draft preparation, N.B., G.I. and A.Z.; writing—review and editing N.B., G.I. and A.Z.; supervision, A.Z. All authors have read and agreed to the published version of the manuscript.

Funding

This research was funded by Hellenic Hydrocarbon Resources Management S.A. (HHRM S.A.), Dim. Margari 18, 115 25 Athens, Greece. Grant number 81774.

Institutional Review Board Statement

Not applicable.

Informed Consent Statement

Written informed consent has been obtained from the patient(s) to publish this paper.

Acknowledgments

Nicolina Bourli is a Post-Doc Researcher, and she was financially supported by the “Hellenic Hydrocarbon Resources Management S.A. (HHRM S.A.)”. The authors would like to thank anonymous reviewers for their improvements on the manuscript.

Conflicts of Interest

The authors declare no conflict of interest.

References

  1. Allen, J.R.L. Sedimentary Structures: Their Character and Physical Basis. Developments in Sedimentology; Elsevier: Amsterdam, The Netherlands, 1982. [Google Scholar]
  2. Owen, G. Deformation processes in unconsolidated sands. In Deformation of Sediments and Sedimentary Rocks; Jones, M.E., Preston, R.M.F., Eds.; Geological Society Special Publication: London, UK, 1987; Volume 29, pp. 11–24. [Google Scholar]
  3. Demicco, R.V.; Hardie, L.A. Sedimentary structures and early diagenetic features of shallow marine carbonate deposits. SEPM Atlas Ser. 1994, 1, 265. [Google Scholar]
  4. Korneva, I.; Tondi, E.; Jablonska, D.; Di Celma, C.; Alsop, I.; Agosta, F. Distinguishing tectonically and gravity-driven synsedimentary deformation structures along the Apulian platform margin (Gargano Promontory, southern Italy). Mar. Pet. Geol. 2016, 73, 479–491. [Google Scholar] [CrossRef] [Green Version]
  5. Jablonska, D.; Di Celma, C.N.; Alsop, G.I.; Tondi, E. Internal architecture of mass-transport deposits in basinal carbonates: A case study from southern Italy. Sedimentology 2018, 65, 1246–1276. [Google Scholar] [CrossRef] [Green Version]
  6. Weaver, J.D.; Jeffcoat, R.E. Carbonate ball and pillow structures. Geol. Mag. 1978, 115, 245–253. [Google Scholar] [CrossRef]
  7. Pratt, B.R. Molar-tooth structure in Proterozoic carbonate rocks: Origin from synsedimentary earthquakes, and implications for the nature and evolution of basins and marine sediment. Geol. Soc. Am. Bull. 1998, 110, 1028–1045. [Google Scholar] [CrossRef]
  8. Pratt, B.R. Tepees in peritidal carbonates: Origin via earthquake induced deformation, with example from the Middle Cambrian of western Canada. Sediment. Geol. 2002, 153, 57–64. [Google Scholar] [CrossRef]
  9. Kahle, C.F. Seismogenic deformation structures in microbialities and mudstones, Silurian Lockport Dolomite, Northwestern Ohio, USA. J. Sediment. Res. 2002, 72, 201–216. [Google Scholar]
  10. Jewell, E.; Ettenshon, R. An ancient seismite response to Taconian far-field forces: The Cane Run Bed, Upper Ordovician (Trenton) exington Limestone, central Kentucky (USA). J. Geod. 2004, 37, 487–511. [Google Scholar] [CrossRef]
  11. McLaughlin, P.I.; Brett, C.E. Eustatic and tectonic control on the distribution of marine seismites: Examples from the Upper Ordovician of Kentucky, USA. Sedim. Geol. 2004, 168, 165–192. [Google Scholar] [CrossRef]
  12. Jablonska, D.; Di Celma, C.; Korneva, I.; Tondi, E.; Alsop, I. Mass-transport deposits within basinal carbonates from southern Italy. Ital. J. Geosci. 2016, 135, 30–40. [Google Scholar] [CrossRef]
  13. Sylvester, Z.; Lowe, D.R. Fluid escape structures. In Sedimentology. Encyclopedia of Earth Science; Springer: Berlin/Heidelberg, Germany, 1978. [Google Scholar]
  14. Bourli, N.; Maravelis, A.G.; Zelilidis, A. Classification of soft-sediment deformation in carbonates based on the Lower Cretaceous Vigla Formation, Kastos, Greece. Int. J. Earth Sci. 2020, 109, 2599–2614. [Google Scholar] [CrossRef]
  15. Woodcock, N.H. Ludlow series slumps and turbidites and the form of the Montgomery trough, Powys, Wales. Proc. Geol. Assoc. 1976, 87, 169–182. [Google Scholar] [CrossRef]
  16. Woodcock, N.H. Structural style in slump sheets: Ludlow series, Powys, Wales. J. Geol. Soc. 1976, 132, 399–415. [Google Scholar] [CrossRef]
  17. Woodcock, N.H. The use of slump structures as palaeoslope orientation estimators. Sedimentology 1979, 26, 83–99. [Google Scholar] [CrossRef]
  18. Maltman, A. On the term soft-sediment deformation. J. Struct. Geol. 1984, 6, 589–592. [Google Scholar] [CrossRef]
  19. Maltman, A.J. Introduction and overview. In The Geological Deformation of Sediments; Maltman, A.J., Ed.; Chapman & Hall: London, UK, 1994; pp. 1–35. [Google Scholar]
  20. Maltman, A.J. Deformation structures from the toes of accretionary prisms. J. Geol. Soc. Lond 1998, 155, 639–650. [Google Scholar] [CrossRef]
  21. Collinson, J. Sedimentary deformational structures. In The Geological Deformation of Sediments; Maltman, A., Ed.; Chapman & Hall: London, UK, 1994; pp. 95–125. [Google Scholar]
  22. Strachan, L.J.; Alsop, G.I. Slump folds as estimators of palaeoslope: A case study from the FisherStreet Slump of County Clare, Ireland. Basin. Res. 2006, 18, 451–470. [Google Scholar] [CrossRef]
  23. Debacker, T.N.; Sintubin, M.; Verniers, J. Large-scale slumping deduced from structural and sedimentary features in the Lower Palaeozoic Anglo-Brabant fold belt, Belgium. J. Geol. Soc. 2001, 158, 341–352. [Google Scholar] [CrossRef] [Green Version]
  24. Debacker, T.N.; Dumon, M.; Matthys, A. Interpreting fold and fault geometries from within the lateral to oblique parts of slumps: A case study from the Anglo-Brabant Deformation Belt (Belgium). J. Struct. Geol. 2009, 31, 1525–1539. [Google Scholar] [CrossRef]
  25. Waldron, J.W.F.; Gagnon, J.F. Recognizing soft-sediment structures in deformed rocks of orogens. J. Struct. Geol. 2011, 33, 271–279. [Google Scholar] [CrossRef]
  26. Alsop, G.I.; Marco, S.; Weinberger, R.; Levi, T. Upslope-verging back thrusts developed during downslope-directed slumping of mass transport deposits. J. Struct. Geol. 2017, 100, 45–61. [Google Scholar] [CrossRef] [Green Version]
  27. Alsop, G.I.; Weinberger, R.; Marco, S.; Levi, T. Identifying soft sediment deformation in rocks. J. Struct. Geol. 2019, 125, 248–255. [Google Scholar] [CrossRef] [Green Version]
  28. Alsop, G.I.; Weinberger, R. Are slump folds reliable indicators of downslope flow in recent mass transport deposits? J. Struct. Geol. 2020, 135, 104037. [Google Scholar] [CrossRef]
  29. Institute for Geology and Subsurface Research. Geological Map of Greece: Paxi Sheet; Institute for Geology and Subsurface Research: Athens, Greece, 1969.
  30. Zelilidis, A.; Piper, D.J.W.; Vakalas, J.; Avramidis, P.; Getsos, K. Oil and gas plays in Albania: Do equivalent plays exist in Greece? J. Pet. Geol. 2003, 26, 29–48. [Google Scholar] [CrossRef]
  31. Karakitsios, V.; Rigakis, N. Evolution and petroleum potential of Western Greece. J. Pet. Geol. 2007, 30, 197–218. [Google Scholar] [CrossRef]
  32. Basilone, L. Seismogenic rotational slumps and translational glides in pelagic deepwater carbonates. Upper Tithonian-Berriasian of Southern Tethyan margin (W Sicily, Italy). Sediment. Geol. 2017, 356, 1–14. [Google Scholar] [CrossRef]
  33. Del Ben, A.; Mocnika, A.; Volpib, V.; Karvelis, P. Old domains in the South Adria plate and their relationship with the West Hellenic front. J. Geodyn. 2015, 89, 15–28. [Google Scholar] [CrossRef]
  34. Gambini, R.; Tozzi, M. Tertiary geodynamic evolution of the Southern Adria microplate. Terra Nova 1996, 8, 593–602. [Google Scholar] [CrossRef]
  35. Avramidis, P.; Zelilidis, A. The nature of deep-marine sedimentation and palaeocurrent trends as an evidence of Pindos foreland basin fill conditions. Episodes 2001, 24, 252–256. [Google Scholar] [CrossRef] [Green Version]
  36. Bourli, N.; Pantopoulos, G.; Maravelis, A.G.; Zoumpoulis, E.; Iliopoulos, G.; Pomoni-Papaioannou, F.; Kostopoulou, S.; Zelilidis, A. Late Cretaceous to early Eocene geological history of the eastern Ionian Basin, southwestern Greece: A sedimentological approach. Cretac. J. 2019, 98, 47–71. [Google Scholar] [CrossRef]
  37. Kokinou, Ε.; Kamberis, Ε.; Vafidis, A.; Monopolis, D.; Ananiadis, G.; Zelilidis, A. Deep seismic reflection data from offshore western Greece: A new crustal model for the Ionian Sea. J. Pet. Geol. 2005, 28, 81–98. [Google Scholar] [CrossRef]
  38. Basilone, L.; Sulli, A. Basin analysis in the Southern Tethyan margin: Facies sequences, stratal pattern and subsidence history highlight extension-to-inversion processes in the Cretaceous Panormide carbonate platform (NW Sicily). Sediment. Geol. 2018, 363, 235–251. [Google Scholar] [CrossRef]
  39. Tserolas, P.; Maravelis, A.; Pasadakis, N.; Zelilidis, A. Organic geochemical features of the Upper Miocene successions of Lefkas and Cephalonia islands, Ionian Sea, Greece: An integrated geochemical and statistical approach. Arab. J. Geosci. 2018, 11, 105. [Google Scholar] [CrossRef]
  40. Zelilidis, A.; Maravelis, A.G.; Tserolas, P.; Konstantopoulos, P.A. An overview of the Petroleum systems in the Ionian zone, onshore NW Greece and Albania. J. Pet. Geol. 2015, 38, 331–348. [Google Scholar] [CrossRef]
  41. Cooper, M.; Warren, M.J. Inverted fault systems and inversion tectonic settings. In Regional Geology and Tectonics: Principles of Geologic Analysis, 2nd ed.; Scarselli, N., Adam, J., Chirella, D., Roberts, D.G., Bally, A.W., Eds.; Elsevier: Amsterdam, The Netherlands, 2020; Volume 1, pp. 169–204. [Google Scholar]
  42. Zelilidis, A.; Bourli, N.; Zoumpouli, E.; Maravelis, A. Tectonic inversion and deformation differences in the transition from Ionian basin to Apulian platform: The example from Ionian Islands, Greece. In Proceedings of the 2nd Conference of the Arabian Journal of Geosciences (CAJG), Sousse, Tunisia, 25–28 November 2019. [Google Scholar]
  43. Cazzini, F.; Zotto, O.D.; Fantoni, R.; Ghielmi, M.; Ronchi, P.; Scotti, P. Oil and gas in the Adriatic foreland, Italy. J. Pet. Geol. 2015, 38, 255–279. [Google Scholar] [CrossRef]
  44. Skourtsis-Coroneou, V.; Solakius, N.; Constantinidis, I. Cretaceous stratigraphy of the Ionian zone, Hellenides, western Greece. Cretac. Res. 1995, 16, 539–558. [Google Scholar] [CrossRef]
  45. Bourli, N.; Iliopoulos, G.; Papadopoulou, P.; Zelilidis, A. Microfacies and depositional conditions of Jurassic to Eocene carbonates: Implication on Ionian basin evolution. Geosciences 2021, 11, 288. [Google Scholar] [CrossRef]
  46. Karakitsios, V.; Triantaphyllou, M.; Panoussi, P. Preliminary study of the slump structures of the Early Oligocene sediments of the pre-apulian zone (Antipaxos island, North-western Greece). Bull. Geol. Soc. Greece 2010, 18, 634–642. [Google Scholar] [CrossRef] [Green Version]
  47. Dunham, R.J. Classification of carbonate rocks according to depositional texture. In Classification of Carbonate Rocks; Ham, W.E., Ed.; American Association of Petroleum Geologists: Tulsa, OK, USA, 1962; pp. 108–121. [Google Scholar]
  48. Flügel, E. Microfacies Analysis of Carbonate Rocks; Springer: Berlin, Germany, 2004. [Google Scholar]
  49. Embry, A.F.; Klovan, J.E. A late Devonian reef tract on northeastern Banks Island, N.W.T. Bull. Can. Pet. Geol. 1971, 19, 730–781. [Google Scholar]
  50. Pomoni-Papaioannou, F.; Zoumpouli, E.; Zelilidis, A.; Iliopoulos, G. Microfacies and benthic foraminiferal assemblages of the carbonate succession of the Cretaceous platform in the Sami area (NW of Kefallinia, W Greece): Biostratigraphy and palaeo-environments. In Proceedings of the 29th IAS Meeting of Sedimentology, Schladming, Austria, 10–13 September 2012. [Google Scholar]
  51. Hottinger, L. Alveolinids, Cretaceous-Tertiary larger Foraminifera. Exxon Production Research Company, Technical In-for-mation Services. Laboratories 1974, 87, 106. [Google Scholar]
  52. Hottinger, L. Shallow benthic foraminiferal assemblages as signals for depth of their deposition and their limitations. Bull. Société Géologique Fr. 1997, 168, 491–505. [Google Scholar]
  53. Karakitsios, V. Western Greece and Ionian Sea petroleum systems. AAPG Bull. 2013, 97, 1567–1594. [Google Scholar] [CrossRef] [Green Version]
Figure 1. The pre-existing geological map of studied Islands of Paxoi and Anti-Paxoi [29].
Minerals 12 00201 g001
Figure 2. Simplified geological map of the Ionian Basin and Pre-Apulian margins, with the major structural elements. The studied Paxoi and Anti-Paxoi Islands are marked with a red box. Modified from [14].
Minerals 12 00201 g002
Figure 3. Detailed lithostratigraphic column of the Pre-Apulian zone (Apulian platform margins) [45].
Minerals 12 00201 g003
Figure 4. The new geological map, produced from the new sampling and the age determination. Numbers of samples and their age are presented on the map. Moreover, the location of the photos used in the following text figures are also marked on the map. AA’ represents a cross-section along the two Islands.
Minerals 12 00201 g004
Figure 5. Thin section microphotographs of representative planktonic foraminifera of the studied samples. (a) Igorina albeari, sample P25 (X40); (b) Morozovella acuta, sample P25 (X40); (c) Pseudohastigerina micra, sample P2 (X100); (d) Morozovelloides crassatus, sample P2 (X40); (e) Catapsydrax dissimilis, sample P3 (X100); (f) Pseudohastigerina naguewichiensis, sample P3 (X100); (g) Turborotalia cunialensis, sample P3 (X100); (h) Subbotina yeguaensis, sample P3 (X100); (i) Turborotalia cerroazulensis, sample P19 (X100); (j) Ciperoella ciperoensis, sample P9 (X400); (k) Globigerinoides altiaperturus, sample AP2 (X100); (l) Trilobatus primordius, sample AP2 (X400).
Minerals 12 00201 g005
Figure 6. Thin section microphotographs of the representative microfacies of the studied samples. (a) Sample AP1 shows a pelagic wackestone with planktonic foraminifera, SMF3/FZ1 (X40); (b) Sample P3 shows a pelagic wackestone with planktonic foraminifera, SMF3/FZ3 (X40); (c) Sample P2 shows a bioclastic and lithoclastic packstone with planktonic and a few benthic foraminifera, SMF4/FZ3 (X40); (d) Sample P14 shows a bioclastic and lithoclastic packstone with planktonic and benthic foraminifera, SMF4/FZ4 (X40); (e) Sample P1 shows a bioclastic and lithoclastic packstone with planktonic and benthic foraminifera, SMF5/FZ4 (X40); (f) Sample P17 shows a packstone–rudstone with benthic foraminifera, mollusks and mollusk fragments, SMF6/FZ4 (X40).
Minerals 12 00201 g006
Figure 7. A chart showing the used symbols and the different colors of all different lines for the interpretation of the following photos in both islands.
Minerals 12 00201 g007
Figure 8. Three deformed horizons between undeformed horizons close to a normal fault. Two of them were shaped on the uplifted footwall of the fault, and one of them on the subsiding hanging wall. SSD structures were recognized in Miocene deposits.
Minerals 12 00201 g008
Figure 9. Two stacked SSD horizons with strong erosional contacts, found between them and with the overlying undeformed horizons. SSD structures were recognized in Miocene deposits.
Minerals 12 00201 g009
Figure 10. (a) Panoramic view of three SSD horizons within undeformed deposits; (b) From a closer distance the three deformed horizons between undeformed horizons. The upper deformation diminishes close to the subsiding hanging wall of a synthetic fault on the progradation direction. SSD structures were recognized in Miocene deposits.
Minerals 12 00201 g010
Figure 11. The synchronous activity of synthetic and antithetic faults produced a subsiding trough where strong deformed deposits were accumulated. SSD structures were recognized in Eocene depositions.
Minerals 12 00201 g011
Figure 12. (a,b) in both photos a thin SSD structure is presented, between undeformed, thin to medium bedded, limestones, and with no erosional contacts with the over- and the under-lying beds. SSD structures were recognized in Eocene deposits.
Minerals 12 00201 g012
Figure 13. Two characteristic SSD horizons where the progradation of the deformation eastwards showed the transition from undeformed to deformed structures, within the same horizon, indicating the proximity with the starting point of the slumping. SSD structures were recognized in Eocene deposits.
Minerals 12 00201 g013
Figure 14. (a) Panoramic view shows the development of SSD structures after normal fault activity; (b) From a closer distance the SSD horizon with an up to 10 m thick SSD deformation structure; (c,d) show several deformation structures within the deformed horizon.
Minerals 12 00201 g014
Figure 15. (a) Panoramic view shows the development of SSD structures in relation to fault activity; (b) From a closer distance the synchronous activity of synthetic and antithetic faults produced a sub-siding trough. Notice the strong and thick deformation close to the hanging wall of the normal fault and the overlapping of the footwall with the accumulation of the deformed deposits within the trough.
Minerals 12 00201 g015
Figure 16. (a) Panoramic view of an SSD horizon within undeformed deposits; (b) shows the antithetic faults in the underlying undeformed deposits and the high relief erosional contact with the overlying undeformed deposits; (c) shows two directions of deformation progradation.
Minerals 12 00201 g016
Figure 17. (a) A panoramic view of a strong deformation horizon with high relief erosional contact with the underlying deposits and a low relief erosional contact with the overlying deposits; (b) from close view the internal deformation of the deformed horizon; (c) the underlying deposits were also strongly deformed either due to the movement of the overlying deformation or because they represent an independent strongly deformed horizon.
Minerals 12 00201 g017
Figure 18. (a) Panoramic view of strong and thick SSD structures with repeated horizons, showing an eastward progradation, with thick synclines and anticlines; (b) from a close view the deformation structures with the internally undeformed horizons.
Minerals 12 00201 g018
Figure 19. Two deformed horizons with undeformed deposits between them. It seems that the SSD structures were produced on the uplifted footwall of a normal fault. Notice the two internal deformation structures within the lower structure. It seems that each of them tried to fill up the existing space due to fault activity, giving the sense of two different directions of progradation.
Minerals 12 00201 g019
Figure 20. Evolutionary stages of development of the studied region; (a) represents the rifting stage, whereas (b) shows the change of the extensional regime to the compressional regime with the reactivation of normal faults as reverse faults (inverted tectonic) and the gradual change of the studied area from the Apulian platform margins to the forebulge area of the Ionian foreland. Stage (c) represents the present morphology of the studied area where the islands Paxoi and Anti-Paxoi formed an open anticline geometry due to the Ionian thrust movement.
Minerals 12 00201 g020
Figure 21. (a) Synsedimentary deformation took place due to active normal fault activity; (b) normal fault activity took place after the development of the deformation structures; (c,d) synchronous activity of normal and transfer faults; (d) the negative flower structure produced from the transfer faults.
Minerals 12 00201 g021
Figure 22. Transfer faults, cross-cut the undeformed limestones, (ac) producing negative flower structures.
Minerals 12 00201 g022
Figure 23. A cross-section along the two studied islands showing giant transfer fault zones producing negative flower structures (the reason for the separation of two islands) and a positive flower structure (the reason for the anticline-like geometry of the Paxoi Island). The cross-section AA′ is marked on the geological map of the studied islands in Figure 4 and Figure 24b.
Minerals 12 00201 g023
Figure 24. The geological maps of the studied region. (a) The pre-existing geological map of I.G.S.R. [29]; (b) the new geological map produced from the results of this study and cross-section AA’ shown in Figure 4 and Figure 23.
Minerals 12 00201 g024
Table 1. Microfacies analysis of thin sections from selected samples, age determination based on identified fossils. Index fossils for every sample are highlighted in red. The textural characters of microfacies’ types were defined according to Dunham’s 1962 [47] classification modified by Embry and Klovan in 1971 [48] and Flügel in 2004 [49], and their description includes biogenic and inorganic dominant components of depth and depositional environment [50,51,52].
S/NLocationSamplesAge Based on
Geological Map
Description/
Facies Zone
FossilsAge
1Paxoi IslandP1Late Cretaceous–Middle EoceneBioclastic and lithoclastic packstone. SMF5/FZ4Algae, Lithothamnium sp., Miliolidae, rotalidae Pyrgo sp., Spiroloculina sp., Globigerinatheka sp., Catapsydrax sp., Globoturborotalia ouachitaensis, Operculina sp., Fabiana sp., Chapmanina sp., Actinocyclina sp., Asterigerina sp., Amphistegina sp., Lepidocyclina sp., Discocyclina sp., Nummulites sp.Upper Eocene (Late Bartonian–Priabonian)
2Paxoi IslandP2Late Cretaceous–Middle EoceneBioclastic and lithoclastic packstone. SMF4/FZ3Radiolaria (Spumellaria), Miliolidae, rotaliidae, Alveolina sp., Spiroloculina sp., Globigerinatheka sp., Pseudohastigerina micra, Pseudohastigerina naguewichiensis, Catapsydrax sp., Morozovelloides crassatus, Morozovelloides coronatus, Morozovelloides lehneri, Planorotalites capdevilensisLower to Upper Eocene (Late Lutetian–Early Bartonian)
3Paxoi IslandP3Late Cretaceous–Middle EoceneWackestone.
SMF3/FZ3
Radiolaria (Spumellaria), Subbotina gortanii, Subbotina yeguaensis, Catapsydrax dissimilis, Globigerinatheka semiinvoluta, Globigerinatheka sp., Turborotalia increbescens, Turborotalia cunialensis, Globoturborotalia ouachitaensis, Pseudohastigerina micra, Pseudohastigerina naguewichiensisUppermost Eocene (Late Priabonian)
4Paxoi IslandP4Late Cretaceous–Middle EoceneBioclastic and lithoclastic packstone, with Mudstone clasts and with planctonic foraminifera.
SMF5/FZ4
Mollusk fragments, algae, Lithothamnium sp., Turborotalia sp., Catapsydrax sp., Ciperoella ciperoensis, Miliolidae, Rotalidae, Fabiana sp., Asterocyclina sp., Asterigerina sp., Amphistegina sp., Eulepidina sp., Lepidocyclina sp., Discocyclina sp., Nummulites sp.Lower Oligocene (Rupelian)
5Paxoi IslandP5Late Eocene–Middle MioceneWackestone.
SMF3/FZ3
Radiolaria (Spumellaria), Catapsydrax dissimilis, Catapsydrax sp., Globigerinatheka sp., Subbotina gortanii, Subbotina yeguaensis, Turborotalia ampliapertura, Globoturborotalia ouachitaensisUpper Eocene (Priabonian)
6Paxoi IslandP6Late Eocene–Middle MioceneWackestone.
SMF3/FZ3
Radiolaria (Spumellaria), Catapsydrax dissimilis, Catapsydrax sp., Globigerinatheka sp., Subbotina gortanii, Subbotina yeguaensis, Pseudohastigerina cf. micra, Turborotalia ampliapertura, Globoturborotalia ouachitaensis, Acarinina collactea, Acarinina topilensis, Hantkenina sp.Upper Eocene (Priabonian)
7Paxoi IslandP7Late Eocene–Middle MioceneWackestone.
SMF3/FZ3
Radiolaria (Spumellaria), Globigerinatheka sp., Catapsydrax dissimilis, Subbotina gortanii, Subbotina yeguaensis, Pseudohastigerina cf. micra, Turborotalia increbescens, Globoturborotalia ouachitaensis, Acarinina cf. collactea.Upper Eocene (Priabonian)
8Paxoi IslandP8Late Eocene–Middle MioceneWackestone.
SMF3/FZ3
Subbotina yeguaensis, Catapsydrax dissimilis, Globoturborotalita ouachitaensis, Ciperoella cf. ciperoensis, Turborotalia ampliaperturaLower Oligocene (Rupelian)
9Paxoi IslandP9Late Eocene–Middle MioceneBioclastic and lithoclastic packstone, with small planctonic foraminifera. SMF3/FZ3Mollusk fragments, Radiolaria (Spumellaria), Nodosariidae, Catapsydrax cf. dissimilis, Paragloborotalia pseudokugleri, Globoturborotalita ouachitaensis, Ciperoella angulisuturalis, Ciperoella ciperoensisUpper Oligocene –Lower Miocene (Late Chattian–Early Aquitanian)
10Paxoi IslandP10Late Eocene–Middle MioceneBioclastic and lithoclastic packstone, geopetal structures. Stylolite. SMF5/FZ4Algae, Rotaliidae, Heterostegina sp., Eulepidina sp., Lepidocyclina sp., Operculina sp., Catapsydrax sp., Paragloborotalia sp., Trilobatus primordiusUpper Oligocene (Chattian)
11Paxoi IslandP11Late Eocene–Middle MioceneWackestone, with several porouses filled with bitoumenia and several small sized Globigerinidae. SMF3/FZ1Radiolaria (Spumellaria), Catapsydrax dissimilis, Paragloborotalia pseudokugleri, Paragloborotalia sp., Trilobatus primordius, Paragloborotalia siakensis, Ciperoella ciperoensisUppermost Oligocene–Lower Miocene (late Chattian–Aquitanian)
12Paxoi IslandP12Late Eocene–Middle MioceneWackestone, with a few porouses filled with bitoumenia and several small sized Globigerinidae, stylolite is present. SMF3/FZ1Catapsydrax dissimilis, Paragloborotalia kugleri, Paragloborotalia cf. pseudokugleri, Paragloborotalia sp., Trilobatus primordius, Trilobatus quadrilobatus, Ciperoella ciperoensisLower Miocene (Aquitanian)
13Paxoi IslandP13Late Eocene–Middle MioceneBioclastic and lithoclastic packstone, locally wackestone. Geopetal structures. Mudstone clasts with planctonic foraminifera.
SMF5/FZ4
Algae, Lithothamnium sp., Rotaliidae, Globigerinoides sp., Heterostegina sp., Amphistegina sp., Eulepidina sp., Cycloclypeus sp., Lepidocyclina sp., Uvigerina sp., Operculina sp., Spiroclypeus sp., Asterigerina sp., Paragloborotalia pseudokugleri, Subbotina cf. gortanii, Globoturborotalita ouachitaensis, Ciperoella ciperoensisUpper Oligocene (Chattian)
14Paxoi IslandP14Late Eocene–Middle MioceneBioclastic and lithoclastic packstone.
SMF4/FZ4
Algae, Turborotalia sp., Rotalia sp., Globoquadrina dehiscens, Paragloborotalia kugleri, Asterigerina sp., Amphistegina sp., Eulepidina sp., Myogypsinoides sp., Austrotrilina sp., Quinqueloculina sp., Pyrgo sp., Triloculina sp., Spiroloculina sp.Lowermost Miocene (Early Aquitanian)
15Paxoi IslandP15Late Eocene–Middle MioceneBioclastic and lithoclastic packstone. SMF4/FZ4Algae, Nummulites sp., Subbotina gortanii, Catapsydrax sp., Subbotina sp., Turborotalia sp., Rotalia sp., Asterigerina sp., Amphistegina sp., Lokhartia sp., Spiroloculina sp.Lower part of Upper Eocene (Bartonian)
16Paxoi IslandP16Late Eocene–Middle MioceneWackestone.
SMF3/FZ3
Subbotina linaperta, Catapsydrax cf. dissimilis, Turborotalia increbescens, Turborotalia cerroazulensis, Turborotalia cocoaensis, Turborotalia ampliapertura, Globigerinatheka sp.Uppermost Eocene (Late Priabonian)
17Paxoi IslandP17Late Eocene–Middle MiocenePackstone/rudstone, external reef. SMF6/FZ4Mollusk fragments, gastropods Milliolidae, Quinqueloculina sp.Uppermost Eocene
18Paxoi IslandP18Late Eocene–Middle MioceneWackestone/packstone, lithoclasts with benthic foraminifera and oolites. Microbrecciated clasts. Stylolites. SMF4/FZ4Mollusk fragments, Milliolidae, rotaliidae, Triloculina sp., Spiroclypeus sp., Asterigerina sp., Rotalia sp., Nummulites sp., Subbotina linaperta, Subbotina yeguaensis, Turborotalia increbescens, Globigerinatheka sp., Catapsydrax cf. dissimilisUpper Eocene (Priabonian)
19Paxoi IslandP19Late Cretaceous–Middle EoceneMudstone.
SMF3/FZ3
Radiolaria (Spumellaria), Subbotina sp., Globigerina sp., Catapsydrax cf. dissimilis, Pseudohastigerina sp., Turborotalia increbescens, Turborotalia cerroazulensis, Globoturborotalia ouachitaensis, Globigerinatheka sp., Acarinina sp.Upper Eocene (Late Bartonian–Priabonian)
20Paxoi IslandP20Late Cretaceous–Middle EoceneMudstone.
SMF3/FZ3
Subbotina linaperta, Subbotina gortanii, Subbotina senni, Subbotina sp., Globigerinatheka sp., Globigerinatheka semiinvoluta, Catapsydrax dissimilis, Pseudohastigerina cf. micra, Turborotalia increbescens, Globoturborotalia ouachitaensisUpper Eocene (Late Bartonian)
21Paxoi IslandP21Late Cretaceous–Middle EoceneBioclastic and lithoclastic packstone, fenestral cavities.
SMF4/FZ4
Rotaliidae, Subbotina yeguaensis, Subbotina cf. gortanii, Subbotina sp., Globigerinatheka sp., Globigerinatheka semiinvoluta, Catapsydrax dissimilis, Acarinina sp., Turborotalia increbescens, Morozovelloides cf. coronatus, Asterigerina sp.Upper Eocene (Late Bartonian)
22Paxoi IslandP22Late Eocene–Middle MioceneWackestone.
SMF3/FZ1
Radiolaria (Spumellaria), small Rotaliidae, Subbotina linaperta, Catapsydrax dissimilis, Pseudohastigerina cf. wilcoxensis, Globigerinatheka kugleri, Globigerina sp., Globanomalina sp., Subbotina cf. eocena, Subbotina sp., Turborotalia frontosa, Acarinina esnaensisLower to Upper Eocene (Late Lutetian–Early Bartonian)
23Paxoi IslandP23Late Eocene–Middle MioceneBioclastic and lithoclastic packstone. SMF4/FZ4Radiolaria (Spumelleria), algae, Discocyclina sp., Chapmanina sp., Cuvillierina sp., Subbotina yeguaensis, Globigerinatheka kugleri, Catapsydrax dissimilis, Acarinina aquiensisLower part of Upper Eocene (Bartonian)
24Paxoi IslandP24Late Cretaceous–Middle EoceneGrainstone but locally wackestone. Internal platform. Fenestral cavities and peloids. SMF18-19/FZ8Miliolidae, algae, bivalves (filaments), Quinqueloculina sp., Austrotrillina sp.Upper Eocene
25Paxoi IslandP25Late Cretaceous–Middle EoceneWackestone, with a few porouses filled with bitoumenia.
SMF3/FZ1
Morozovella pasionensis, Morozovella acutispira, Morozovella angulata, Morozovella acuta, Morozovella occlusa, Morozovella aequa, Igorina albeari, Subbotina sp., Acarinina pseudotopilensis, Acarinina intermediaUpper Paleocene (Thanetian)
26Paxoi IslandP26Late Eocene–Middle MiocenePackstone, with fragmented large benthic foraminifera and algae and rounded clasts (mudstone) containing plactonic foraminifera.
SMF4/FZ4
Algae (Lithothamnium), mollusk fragments, Miliolidae, Rotaliidae, Quinqueloculina sp., Coskinolina sp., Discocyclina sp., Lepidocyclina sp., Discocyclina cf dispansa, Alveolina sp., Assilina sp., Turborotalia frontosa, Pseudohastigerina sp., Catapsydrax sp., Morozovelloides crassatus, Morozovelloides coronatus, Morozovella aragonensis, Acarinina bullbrookiUpper part of Lower Eocene (Late Lutetian (P11))
27Anti-Paxoi IslandAP1Late Eocene–Middle MioceneWackestone, with a few porouses filled with bitoumenia.
SMF3/FZ1
Radiolaria (Spumellaria), Catapsydrax sp., Paragloborotalia kugleri, Paragloborotalia mayeri, Trilobatus primordius, Trilobatus trilobus, Globigerinoides altiaperturus, Globoquadrina dehiscensLower Miocene (Aquitanian)
28Anti-Paxoi IslandAP2Late Eocene–Middle MioceneWackestone.
SMF3/FZ1
Radiolaria (Spumellaria), Catapsydrax cf. dissimilis, Paragloborotalia sp., Subbotina gortanii, Trilobatus primordius, Trilobatus trilobus, Globigerinoides altiaperturusLower Miocene (Aquitanian)
Publisher’s Note: MDPI stays neutral with regard to jurisdictional claims in published maps and institutional affiliations.

