1. Introduction
The use of explosives to obtain aggregates is crucial from an economic perspective, especially for medium- and high-strength rocks, as well as abrasive materials. In this regard, a lot of research has been focused on the geologic considerations [
1,
2], geotechnical characteristics [
3,
4], design of the blast [
5] and different types of mining activities [
6,
7], analyzing the size of the material blasted in some cases [
8]. However, there is a lack of information integrating vibrations and other environmental constraints, together with the study of achieving an efficient blast.
This holistic approach is becoming more important in the mining sector, especially in quarries, due to the scarcity of resources, the proximity to the consumer sources and the limited added value of the aggregates [
9]. This proximity creates complex situations between the regular production of the quarry and nearby infrastructures and constructions due to vibration and air blast impacts, being essential to the prediction of their maximum values [
10,
11].
Vibrations are caused by the transmission of an energy fraction from an explosive in the form of seismic waves, being the most common impact derived from blasting. Therefore, it is necessary to implement a methodology to manage these and to comply with the legal requirements established in the UNE 22.381-93. The impact of vibrations has long been studied [
12,
13], resulting in important advancements in their control and reduction [
14,
15]. Ainails et al. [
16] have undertaken extensive revision of vibration analysis, including the main literature in the field and the latest advances. Currently, it is possible to make the execution of blasting operations compatible with the limitation of vibrations by using appropriate reduction, control, and prediction techniques [
17,
18,
19], even in situations where nearby buildings and infrastructures are present [
20,
21,
22]. On the other hand, the air generated by the blast does not have any specific regulation or limit value, although it has an effect on the environment and surrounding constructions in terms of noise [
23]. Indications and recommendations about air blast are features of some national standards.
The complexity of the vibration induced by blasting, mainly due to the rock mass heterogeneity, can usually be tackled by means of empirical methods such as ground vibration attenuation laws, which are very useful to predict the level of vibration and air blast [
11,
24]. Both variables were recorded to determine the empirical law for the case study. Data are obtained for the peak particle velocity, the frequency of vibration, and the maximum air blast for each blast, requiring data from considerable number of blasts [
25]. This fact means that the quarry has to undertake a considerably expensive study for quite a long time, which can be difficult to apply in small-medium mine sites. In this regard, Rodríguez et al. [
26] proposes a different approach to determine the attenuation law from a reduced number of blasts, which are applicable under certain circumstances.
Navarro Torres et al. [
27] presents an interesting methodology to control the vibration impact, but there is still a lack of a global approach regarding all the implications and constraints that a mine or quarry can involve. Vibration and air blast generated can create a huge environmental impact, being necessary to control their levels and have a well-established procedure, especially with the current trend towards sustainable mining [
28,
29]. Prediction of both impacts can be very useful in an open pit mine or quarry [
30,
31] due to the fact their location is usually near to different type of structures, especially in Europe. The main parameters influencing the blast-induced vibration are the geological conditions, properties of blasting work (free faces, decoupling, hole diameter and depth, charge type, and blasting time delay) [
18], and explosive material used. Different explosives have different blasting properties, meaning different energy contributions influence the peak particle velocity (PPV) level.
Although the analysis of vibrations from the distance and maximum load per delay is very widespread, based on the momentum theory, Müller and Böhnke [
32] state that the estimated peak particle velocities according to the charge-weight–distance relations, or other relationships, for vibration prediction mentioned in the literature are commonly reducible to the predominant influence of the distance [
33]. Another important aspect studied by these authors, in line with defining an environmentally friendly blasting technique, is achieving adequate fragmentation while keeping vibrations in an acceptable range [
34,
35]. Moreover, the process of drill and blast [
36] and the type of explosive [
37] have an important influence in CO
2 generation, and it is necessary to include these parameters in the analysis of the most efficient blast to reduce the environmental impact from the obtaining of aggregates.
The trend towards green mining requires that all the environmental variables previously detailed are included in the mid- and long-term planning of a quarry [
38]. Determining the future expansion areas that are viable, the bench height, and the blast hole characteristics is crucial. However, it is quite uncommon to do this in the aggregates sector as it requires long-term data collection and monitoring.
The goal of this study is to characterize mine blasts from a holistic point of view, comprising aggregate quality, safety, and minimization of environmental impact. In this sense, the attenuation vibration law is defined by the direction and area of the quarry, including the geological features and legal constraints.
Research Significance
A global procedure to tackle the main issues generated by open pit activity using explosives, when the mining activity is close to inhabited areas or involves special protection requirements, is presented in this paper. The approach presented could be very useful to solve similar problems in other activities. This study integrates different characteristics, usually analyzed separately, in order to study the viability of real cases from a global perspective. Moreover, most of the analysis presented so far has not included a large amount of collected data or analyses of its evolution over a long period of time. On the other hand, there is still a gap in the literature regarding main parameters when predicting vibrations using an empirical methodology, despite the fact this is one of the most common systems used in the industry.
2. Case Study
El Perecil quarry, owned by Cementos Tudela Veguín S.A., is located in the North of Spain (Asturias); it extracts limestone and schist and also has layers of sandstone. Limestone is exploited as the main material by blasting, while schists are obtained by 20% blasting and 80% ripping. On the other hand, there are several inhabited areas around the quarry that can be potentially affected by the blasting impact, vibrations, and air blasts.
Important fractures and faults are found in the center of the quarry, with an anticlinal and synclinal formation,
Figure 1 and
Figure 2. The axis of the main synclinal shows a N70° E direction, while the main set of fractures have the following directions: N40° W, NE–SW, and N27° W. Materials are from two periods of the Paleozoic era: Carboniferous (limestone in blue) and Devonian (ferruginous sandstone in yellow, reef limestone in green, and an additional layer of ferruginous sandstone in orange).
In this quarry, blasting consists of one or two rows of 10–12 holes per row. The length of the holes varies with the bench height, which ranges between 15 and 21 m.
The quarry is usually drilled with two diameters 115 and 105 mm, and its corresponding grid. When drilling with 115 mm, the burden is 4 m and the spacing 5 m; when drilling with 105 mm the burden and spacing are reduced to 3.5 m and 4 m, respectively; and 80 mm diameter cartridges are always used as bottom charge, varying in number depending on the diameter.
At the beginning of the study, in 2006, the quarry had an average production of around 1.5 million tons per year in 80 blasts, 1–2 per week, with a distance to the nearest constructions around 500–600 m and with no problems related to vibrations, airwave, or aggregate quality standards. The blasting scheme depended on whether the blast hole was dry or wet, with a diameter ranging from 105–115 mm. In the first case, it had 80 mm cartridges of high shattering power explosive and several high-power water gel cartridges, with Ammonium Nitrate Fuel Oil (ANFO) as explosive column and around 2 m of steaming backfill. When the blast hole had water, ANFO was replaced by watergel as column explosive. The difference between the cartridge and borehole diameter is small enough, 25–35 mm, to be considered coupled. The scale difference in the scheme from
Figure 3 is done to properly see the different parts of the blasting design.
The initiation could be achieved by only one detonator connected to the primer cartridge at the bottom (single sequence with a single detonator). Nevertheless, as it can be seen in
Figure 3, two primer cartridges with detonators of equal micro-delay were used in the previous design to reduce the probability of an initiation failure, one at the bottom charge and one at the top of the column charge (single sequence and two detonators); both detonators were initiated and detonated simultaneously.
Two types of connection were common: central (
Figure 3) and side connection. An electric detonator is connected to the exploder to initiate the sequence. This detonator initiates the signal in a transmission tube, yellow, that is connected to the first hole (the central one). The initiation continues to both sides, right and left. The blue line is the connection to the bottom detonator, the green line is the detonating cord along the borehole, and the red line is the connection to the top detonator.
The quarry production increased up to 4.2 million tons per year between 2007 and 2010, diminishing the distance of the blasts to 300–400 m and generating airwave and vibration problems. The blast-monitoring during this period allowed one to propose an initial new design, which was calibrated and improved until 2014. This improved design has been extensively used over time.
Hence, the study was proposed for three main reasons: proximity to inhabited areas, the planned long-term expansion of the quarry and a production increase. All these factors could jeopardize the viability of the quarry in terms of negative environmental impacts, especially vibration and air blasts, and problems with the surrounding communities. Therefore, an in-depth study was required to improve both the design and the execution of the blasting to make them compatible with the environment, as well as with very demanding quality standards of the aggregate. Three designs are analyzed in this study, called (1) previous design, (2) initial design, and (3) improved design.
3. Methodology
The usage of explosives is intrinsically associated with vibrations. The vibration wave is generated in the elastic stage, created by the initiation of the blast, and progressively attenuated by the volume increase due to its expansion in a spherical shape [
39]. In general terms, there are three groups of methodologies to predict vibrations: analytic, empirical, and numerical approaches. All of them have been extensively used and validated in different case studies [
10,
30,
40,
41]. All three methods were used to study the ground vibrations in this research.
The analytical approach is based on the measurement of test blasts to make an adjustment of the mathematical expressions, which usually are charge and distance [
24]. On the other hand, López-Jimeno et al. [
39] and Kumar et al. [
3] also consider several factors related to explosive, rock mass characteristics, and design of the blast. In addition, some studies have been focused on numerical modelling of the shockwave propagation generated by the explosive [
16,
42].
The empirical method uses production blast measurements to predict vibrations [
43], being only adequate for the case study conditions or similar conditions. In this regard, Balsa [
25] presents a transmissivity law based on data from the explosive charge, distance between seismograph and blasting point, type of triggering, and velocity.
where
PPV is the peak particle velocity (mm/s),
Q is the maximum load per time delay (kg) and
D is the distance between the seismograph and the blasting point (m).
K,
α, and
β parameters are constants to be obtained by empirical correlation and include all the other factors, which are mainly related to the characteristics of the excavated rock mass.
Equation (1), initially proposed by [
44,
45], was used by [
25] to characterize typical rock masses in Spain, determining the empirical parameters from an extensive database. Thus, the expression from Equation (1) can also be defined as follows in Equation (2).
where
SD is the scaled distance, determined by the expression
(m/kg). Parameter α varies depending on local rock mass conditions [
13,
46,
47].
The transmissivity law is crucial to define the vibrations related to each blast design and, in this regard, predictions using scaled distance regression analysis are a widely used method [
48]. The data required have been recorded from different seismographs. Individual triggered explosive charges are used to obtain the PPV for a known distance and define the K, α, and β parameters from Equation (1), which are characteristic of the tested area. The K coefficient is related to the part of explosive power transformed to vibrations, which varies depending on the rock mass. The α coefficient indicates the dependence level to the maximum charge per time delay in the blast, while β is related to the distance attenuation of the vibrations.
Distances between seismographs and the blast, as well as the explosive charges, have been varied in different recorded blasts to obtain an attenuation law that is as representative as possible and define the maximum distance of impact according to the current regulation. Wave frequencies have also been recorded and analyzed.
Singh et al. [
49] studied in detail the influence of blast design features in the vibration level in limestone quarries, such as total charge, detonation time delays, blasting pattern, sequence of the blast, and direction of the vibration propagation. Being especially important, the overall explosive charge and operational charge are 150 m below the blast, attenuating its influence as there is more distance. The load coupling degree is also found as relevant for its generation. Moreover, Blair and Armstrong [
50] mention that the level of vibration is not dependent on the burden, which is against the classical theory, while rock mass fracturing is highly relevant in its transmission. In the same vein, De Cospedal [
51] mentions that the geological characteristics and structures have a major role in the affectation of vibrations at long distances. Several tests have been done to define the influence of the geology, due to its irregular conditions in the case study, on the attenuation law.
The classic control method is monitoring the potential affected area, adjusting the mathematical expressions by means of the measurements [
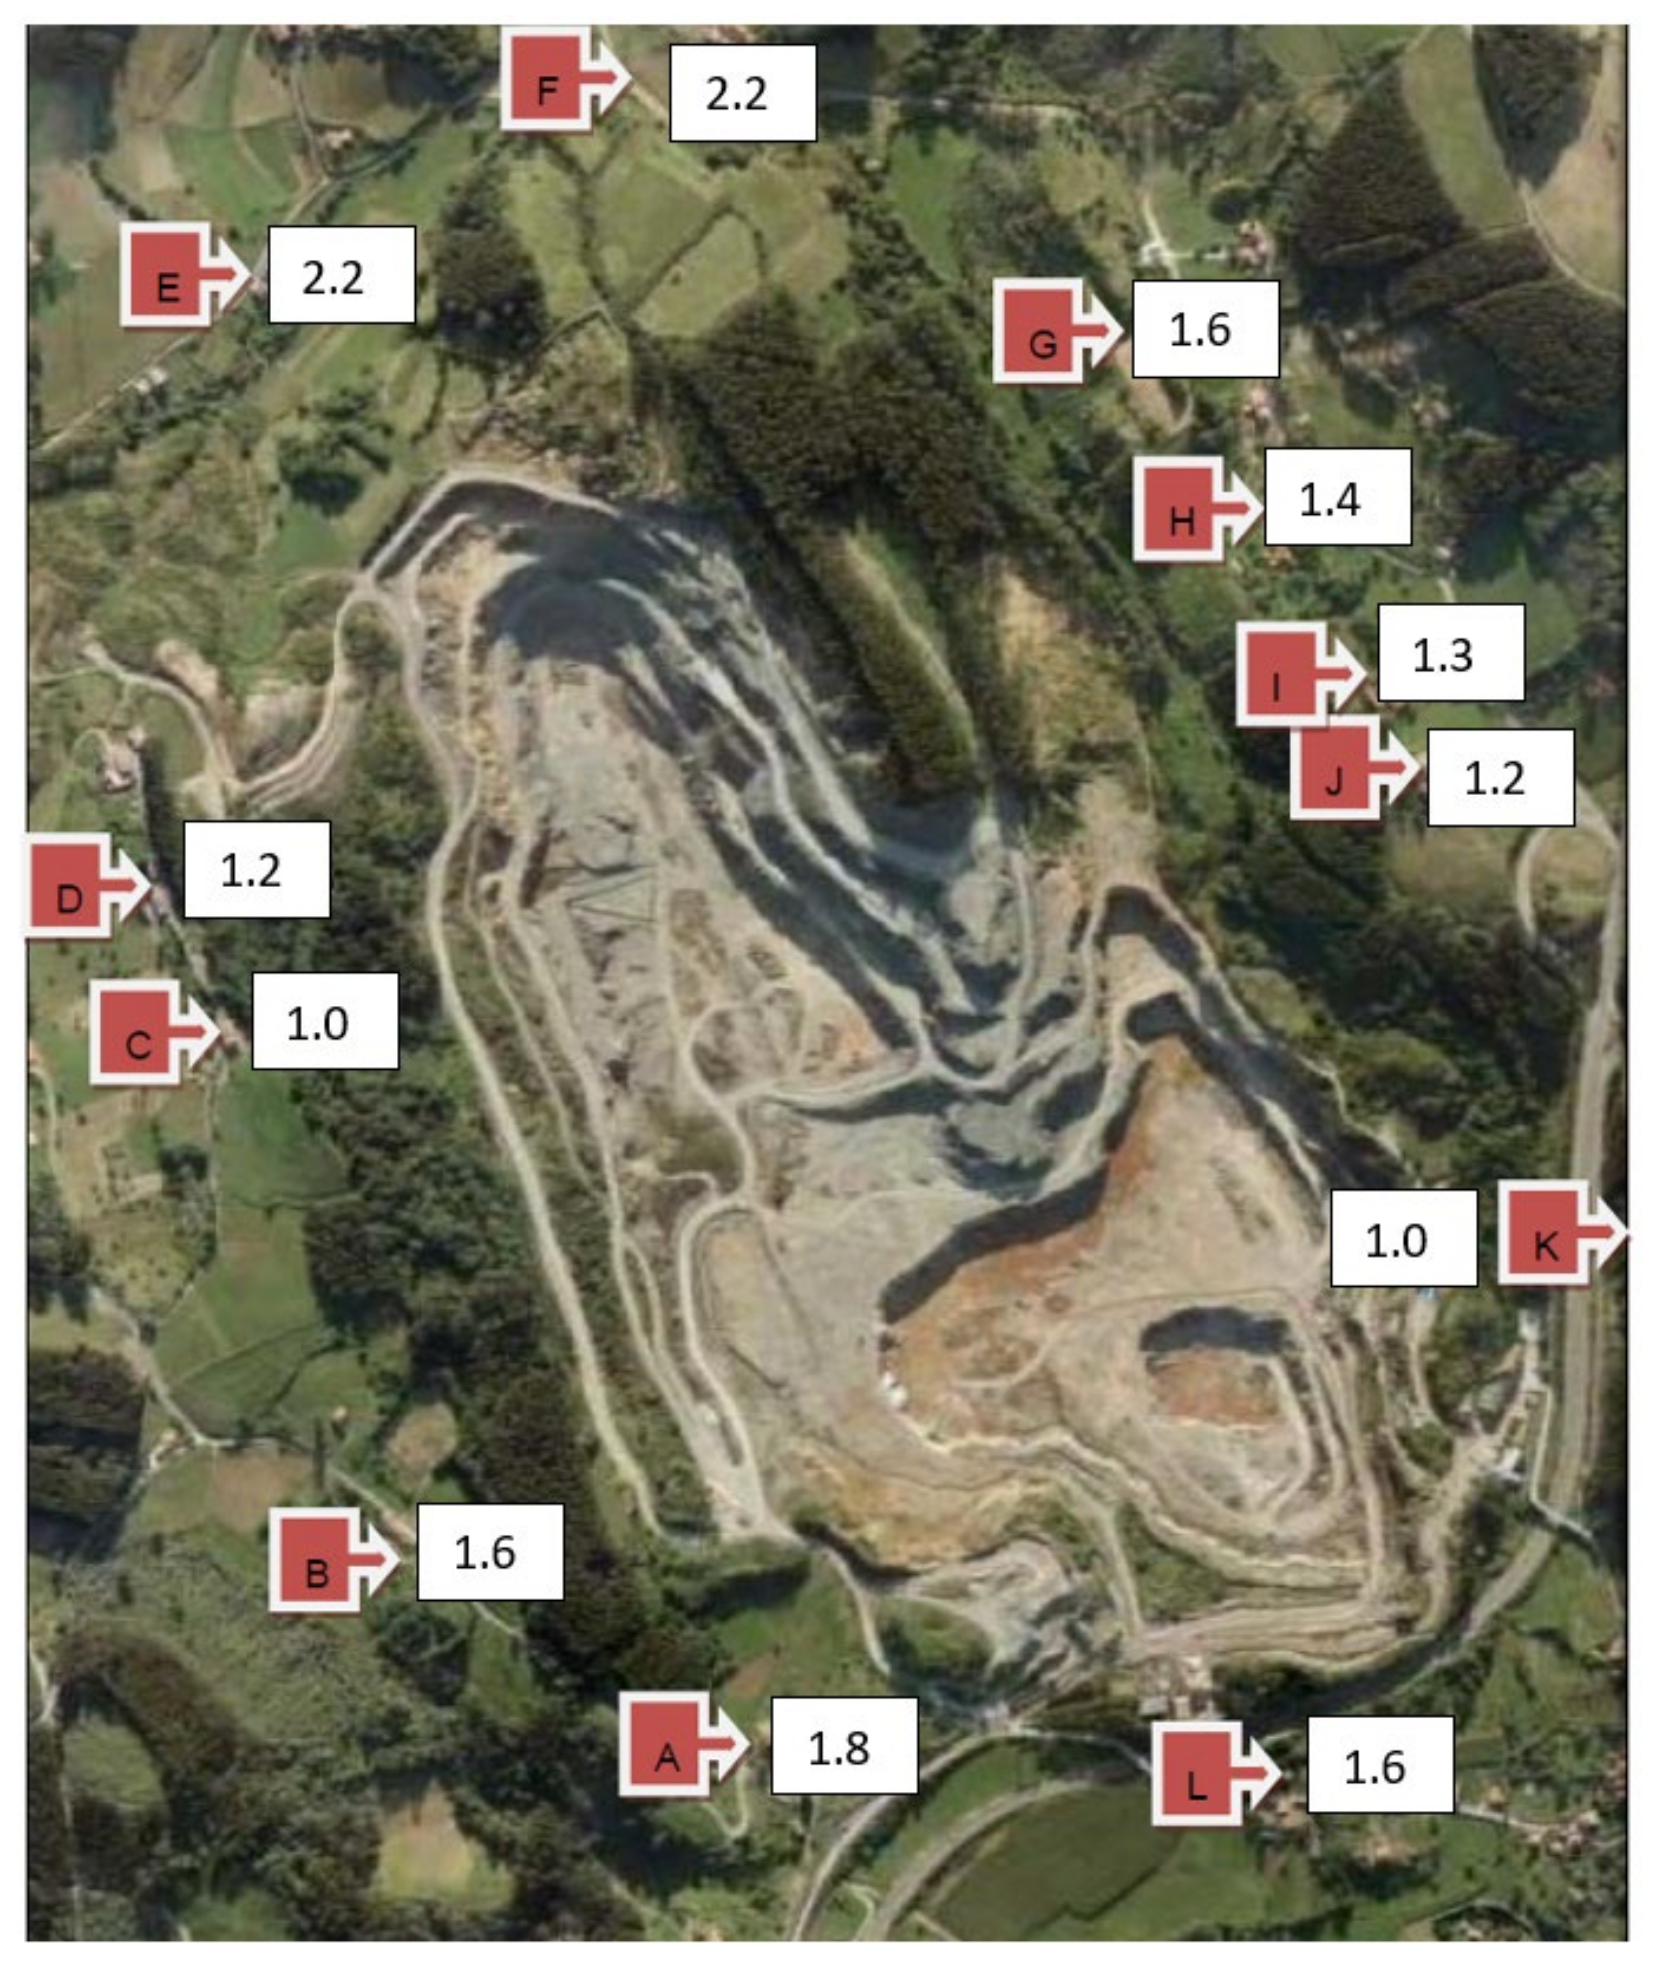
25]. The expressions obtained can be validated with further in situ measurements. In this regard, 12 recording measurement points close to constructions around the quarry have been set,
Figure 4, in order to control the vibration generated during the development of the study. The influence area of each measurement point, based on the production benches, is also included.
3.1. Vibration Recording
The vibration generated was recorded by Instantel-Minimate and Vibracord seismographs. Both have the characteristics required by the Spanish standard UNE 22381 on vibration control regarding: three seismic channels for measuring vertical, longitudinal, and transverse velocity waves; velocity measurement with the range 0–125 mm/s; frequency range of 2–250 Hz; an additional channel for low-frequency sound pressure measurements (air wave), and sampling period of 1 ms. Seismographs are normally calibrated once a year.
A seismic analysis of the quarry surrounding was done, controlling the PPV generated by the blast and determining the influence of its scheme and time delays. The vibration monitoring was done from 2007 to 2019. The procedure to measure and process the data has to follow certain indications in order to obtain reliable and adequate information [
52].
Figure 5 displays the different levels of vibration and safe range, according to the type of constructions around the blasting area, considering the main component of the vibration velocity measured in situ. Groups I–III correspond to industrial structures, housing, and monuments, and delicate structures, respectively. These values are in accordance with the Spanish standard UNE 22.381-93.
3.2. Blast Constraints
Several standards are imposed in terms of production, particle size, efficiency, and level of vibrations, according to the current regulations or internal requirements of the company. Moreover, the environmental impact of the blasting process is also analyzed. All these variables restrict the potential type of blast design. The general attenuation law of the quarry was based on the detonation of independent blast holes of variable length and explosive charge for the two types of materials, limestone and schist, with the following characteristics.
Time delays between 325 and 520 ms, allowing to analyze each blast hole individually by the seismographs;
Blast lengths from 9 to 23 m;
Recording distances from 75 to 832 m;
Explosive charges from 25 to 125 kg.
The previous features allowed for many different combinations; they had a recorded velocity between 0.51 and 49.15 mm/s, with a frequency range between 16 and 52 Hz. The main component varied from longitudinal to transversal depending on the blast.
Regarding rock fragmentation, a certain particle size is required, avoiding rock size above 1 m3, which is the maximum acceptable for the processing plant. The accumulated rock fractions used to analyze the sieve sizing curve from the blasts were the P20, P50, P80, and Top Size from the primary crushing feed, with a sieve opening between 50 and 1000 mm. Twenty production blasts were analyzed with two different blast hole diameters, 105 and 120 mm; different explosive charges; and time delays. Overall, P20 is for a particle size of 88.9 mm, while there is 6% of material with a larger size of 1000 mm.
In terms of environmental restrictions, the quarry required that 100% of the blasts were below the vibration legal requirements, and that 80% of the blasts were below 40% of the maximum legal value, which working with a safety factor SF > 2. All blasts had to have an air blast below 130 dB and 80% below 120 dB as well. The CO2 generated had be reduced as much as possible. Thus, the operating charge had to be reduced to decrease the level of vibrations. Hence, the total charge of the borehole had to be divided so that it detonated at two separate times.
With respect to blast hole load and its connection, they had to be able to reduce the maximum charge per delay without reducing the height of the bench. The connection was such that the top detonator detonated first, together with the explosive charge, and the detonation of the bottom explosive was done by means of a connector that introduced a delay of 25 ms with respect to the top charge. In order to avoid instantaneous transmission of the detonation from the upper charge to the lower one, a backfill was introduced to separate both charges. Several combinations were tested, and the following was found to be the most appropriate design.
Bottom: usage of non-electric detonator, together with a 10 g/m reinforced detonating cord, inside an explosive with high shattering power as bottom-loading. Two detonators with the same micro-delay, and initiated simultaneously, are always included to avoid failure in the initiation.
Intermediate stemming: 2-m backfill. Its length is based on experience and the recommendations from literature [
39].
Column: loading of the second sequence of the hole. Initially as step 1, with a lower caliber cartridge, and the rest of blast hole filled with ANFO, or similar. Cartridge explosive is used if the borehole is wet.
Upper backfill stemming, with a variable length depending on the drilling diameter.
Double detonation sequence (with three detonators) in each blast hole to reduce vibration.
Connections of the blast can be done from one of its side or the center,
Figure 6.
Figure 6.
Side connection (left) and central connection (right).
Figure 6.
Side connection (left) and central connection (right).
The explosive charge is always greater at the bottom than at the top in the design from
Figure 6. For that reason, the maximum charge per delay is equal to the bottom charge, not to the entire charge of the borehole as in the previous design (
Figure 3).
Regarding the initiation of the scheme from
Figure 6, it has the same elements as in
Figure 3 but with the double sequence. In turn, the transmission cable of the bottom detonator transmits the signal to the next hole with a 25 ms delay.
The design evolution from
Figure 3,
Figure 4,
Figure 5 and
Figure 6 was a process achieved by several years of testing. The previous design is only used in particular cases when it is verified that the environmental impact is below the established standards.
The optimal trigger sequence to reduce vibration was determined through several blasts. At first, the initial design was defined, modifying the detonation times in combinations of 9, 25, and 42 ms, as well as the total explosive charge and its distribution in each blast hole, achieving the improved design. The best detonation sequence was with a 25 ms time delay. On the other hand, the sequence of 9 ms was the option that had more frequency attenuation. The use of electronic detonators did not match the approach of the study, because the vibration level reduction was reached at the expense of a high-cost increase. The final blast design detailed in
Figure 6 required a process of analysis from an initial stage.
Previous design: situation before the research developed in later years, used until 2006. No problems related to vibrations or airwave. However, it did not comply with the established quality and environmental requirements for shorter distances.
Initial design: defined according to the quality characteristics required for a continuous distance decrease between benches and constructions. The explosive charge in each blast hole is divided and the initiation system is modified, with a double detonation sequence (with three detonators) in each blast hole as a general rule. A double sequence is only used when there are geologically adverse conditions such as faults or hollows. Results from the blast are initially recorded with this system.
Improved design: the initial design from the previous point remains the same, but the explosive type and charges are adjusted to reduce the potential impacts of the blast.
4. Results and Discussion
The analysis is carried out from the following points of view: (a) costs, (b) efficiency of the blast, and (c) environmental impact.
Table 1 and
Table 2 gather the blast characteristics of the three designs studied. They have been elaborated from the actual yearly output and consumption of each type of explosive. Actual data are from the three periods in which one of the three blast designs was more frequently used: up to 2006 for the previous design, from 2012 to 2013 for the initial design, and from 2015 to 2019 for the improved design. The bench height varies depending on the blast, but the most common and used for the analysis is 18 m. There are some differences in the specific consumption depending on the grid and exact height of the bench, but the average values are gathered in
Table 1.
The initial tests showed that the required accuracy does not allow to use a single vibration transmissivity law for the whole quarry, but different local laws are required. The different laws vary in different directions as they are mainly influenced by geological characteristics.
The specific explosive consumption has been reduced by a 29.8% over time, from 0.151 to 0.106 kg/t. Introducing the dynamite as part of the explosive used and decreasing the usage oh high-energy watergel. The quantity of ANFO has also been slightly reduced.
4.1. Vibration Attenuation Laws Obtained
Two different approaches have been applied over time. A general vibration attenuation law for the whole quarry and several local expressions based on the geological conditions.
Previous studies have demonstrated that parameters of the general attenuation law for limestone after [
25] (α = 0.707, β = 1.651, and α/β = 0.458) could be used in this quarry. Then, the analysis of vibrations would determine parameter K. The procedure for vibration analysis was based on the assumption that the entire quarry belonged to the same homogeneous rock mass until 2006, where a single ground vibration attenuation law was applied. All vibration monitoring data from around the quarry were used indiscriminately to determine this single attenuation law.
Figure 7 (left) shows the results of 46 blasts monitored in 2006. By adjusting the point cloud to a straight line that left 95% of the points below, it turns out that the vibration attenuation law in this quarry was similar to the general attenuation law for limestone used in Spain. The general expressions of the case study are defined in Equations (3) and (4). The K factor obtained was 30% higher than [
25] expression for limestone quarries, K = 4010 and K = 3085, respectively, as can be seen in
Figure 7 (left).
If the exponent Q in Equation (4), α/β = 0.458, is replaced by α/β = 0.5, it becomes in the USBM formula proposed by Duvall and Petkof [
53] and Duvall and Fogelson [
54]. This knowledge allowed one to design the blasting so that the vibration level was within the legal requirements in all cases, as shown in
Figure 7 (right).
Figure 7.
Representation of the general law according to the case study data from 2006 and Balsa [
25].
Figure 7.
Representation of the general law according to the case study data from 2006 and Balsa [
25].
However, it became clear as early as 2006 that it was not possible to use the same conditions in all areas of the quarry. The vibration level was higher or lower than the predicted values at some points. Moreover, the proximity of constructions around the quarry,
Figure 1, and the specific geological characteristics described in
Section 2 made it necessary to define local attenuation laws in each point, taking into account the maximum component and the mean frequency value. The local attenuation law in each point is also compared with the expression defined for limestone quarries by Balsa [
25], L
L.
The transmissivity laws were adjusted, in a continuous process with data monitored from 2006 to 2010, using the SD given by [
25], while K was adjusted so that the number of points below the straight line were 95% of the cases and α/β = 0.458.
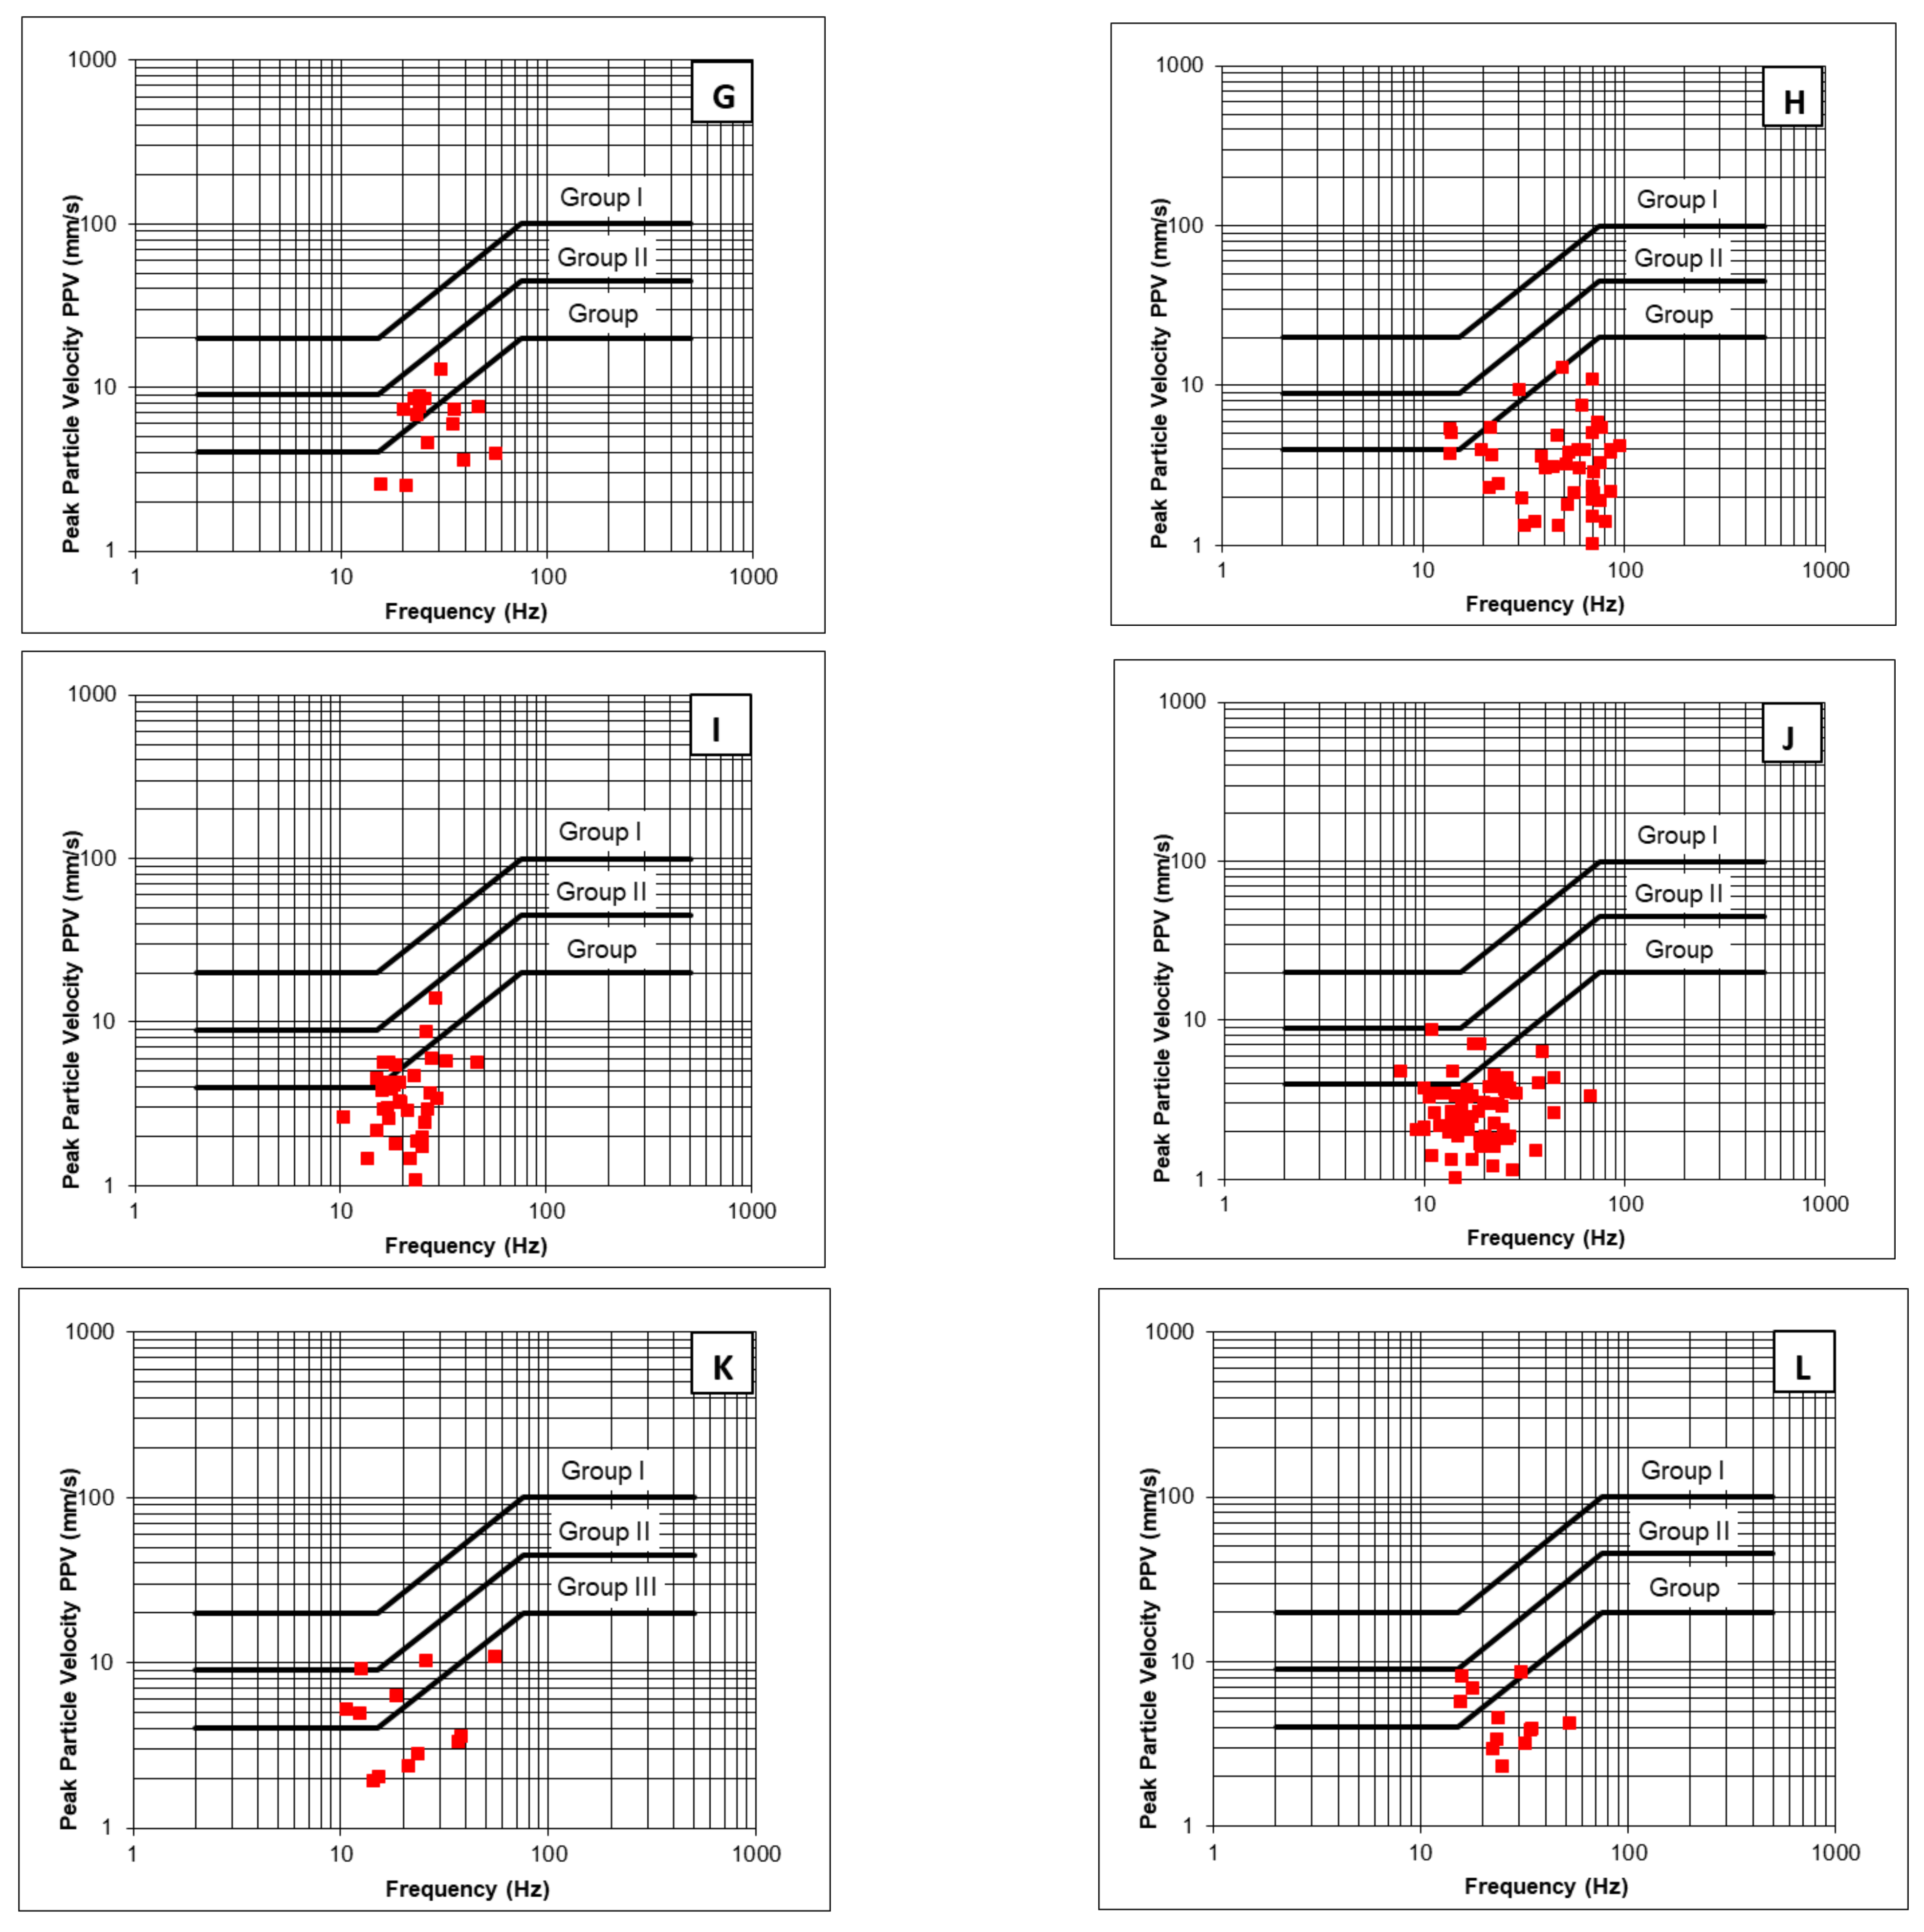
Figure 8 displays the results from the 12 control points.
Table 3 gathers all the expressions, with a 95% confidence interval, and its comparison with the values detailed. As an example, the vibration level at points D and E are 2.2 and 1.2 times the values predicted by Balsa [
25], respectively.
This work is a very long-term retrospective analysis based on the results of actual blasting controls, which are always done in the closest surrounding structures. The problem is that, with real blasting data, the operating load does not vary in a very large range of the quarry design features, such as rock type or bench height. On the other hand, distance to structures is practically constant when doing a single direction analysis. That makes the range of variation of the reduced distance relatively small, and the point cloud does not show the linear trend it should. In fact, the trend is more visible if results from all blasts are plotted together. However, as demonstrated in previous studies in the same area [
41], experimental blasting has been done with different explosive charges and when recording the vibration at different distances, showing that the vibration attenuates with distance as predicted by the general law of limestones, i.e., it is acceptable to use the distance coefficient −1.651.
PPV was also studied considering the associated frequency in each point.
Figure 9 displays the results of the 12 control points. In points D, F, and E, the limit for Group III is not exceeded in any blast. In points A, B, C, G, H, I, and L, the limit for Group III is exceeded by at least one blast, while none of the control points reached Group II. The worst conditions exist in points K and J.
As can be seen in
Figure 10 and
Table 3, lower vibration values are found perpendicular to the axis of the synclinal (points C, K). On the other hand, vibration increases in the boundaries of the synclinal when the blast is aligned to its axis, either in the north side (G, H) or the south side (A and B). Points E and F are highly influenced by a rotational fault, giving the highest levels of vibration. The rest of the control points give intermediate values due to a direction of the blast between parallel and perpendicular to the synclinal.
The distribution analysis of the attenuation laws was not part of the study, but the obtaining of the vibration to comply with the legal values and quality requirements mentioned in
Section 3 was part of the study. The local laws have a K value that ranges between 1.0 and 2.2 times the general attenuation law for limestone quarries published by [
21]. Expressions from
Table 3 were validated over the years with actual blasts.
4.2. Reduction of the Vibration and Air Blast Levels
Expressions from
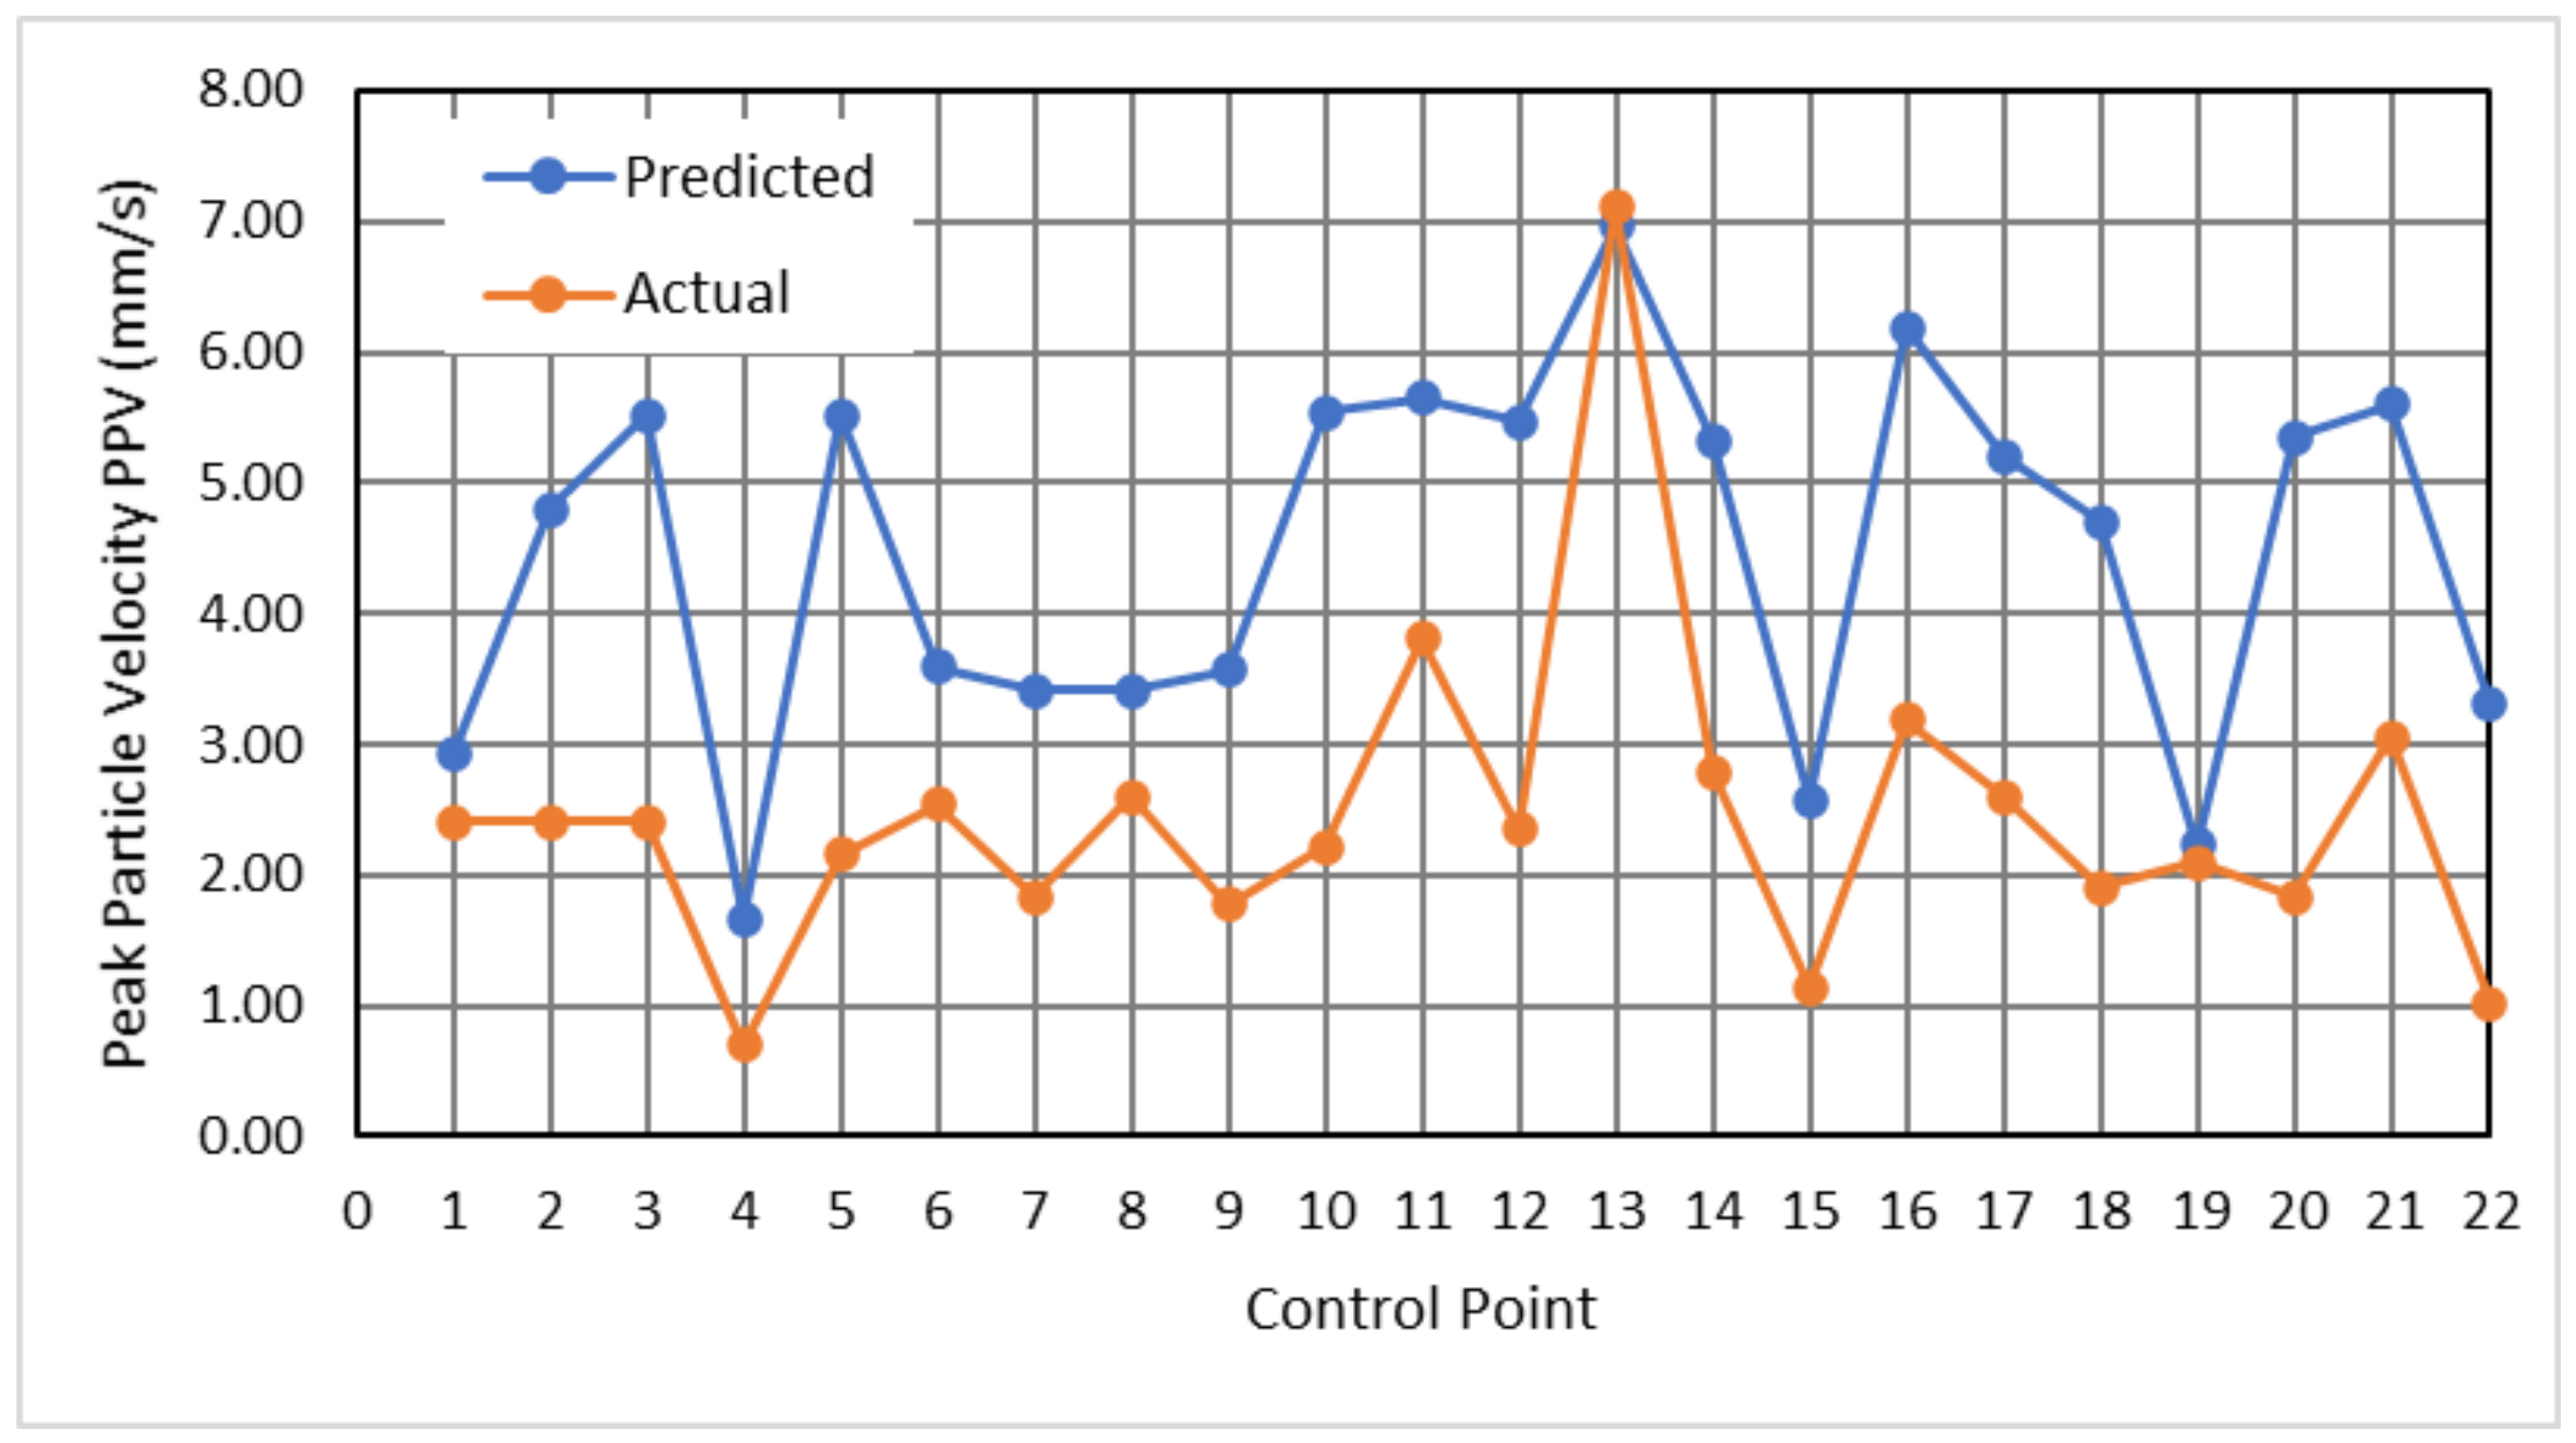
Table 3 were validated over two years with actual blasts.
Table 4 and
Figure 11 gather the blasting characteristics for the in-situ measurements, the prediction values, and their comparison. The control points chosen are the ones closer to the 20 production blasts used for the validation process. The actual PPV values can be compared with the predicted and maximum PPV values, with their corresponding frequency, for the protection of Group II structures, based on the Spanish standard UNE 22.381-93.
All the main parameters, defined by [
18], affecting the blast-induced vibration have been considered. However, the free face is highly influenced by the topography, planning of the quarry, and placement and quality of the materials extracted.
Only 4.5% of the blasts gave an actual value higher than predicted, with many potential intrinsic characteristics as the source of the abnormal value. Nonetheless, the PPV predicted will fulfil with the requirement in 95% of the cases in general terms.
The behavior of the different blasts was associated with the geological characteristics based on the vibration recording in the control points,
Figure 10. The southern area of the mine, points A to D, and K to L are the least exposed to vibration. There is a geological alteration (reverse fault) that marks the end of the exploitation in this direction, bringing the Devonian sandstones into contact with the Carboniferous limestones.
The vibration laws obtained allow one to determine the maximum load per micro-time delay so as not to exceed the vibration level established in the damage prevention criterion of the UNE 22.381-93 standard.
Table 5 gathers the blasts recorded over the years and their characteristics in terms of vibrations and air blasts generated. The number of measurements was higher during the initial implementation phase and decreased as the operating system was adjusted. The higher number of blasts between 2007 and 2010 was due to an abnormal production during that period.
Despite the there is no limit value of the air blasts, they do not exceed the peak value established by the legislation on prevention of occupational risks, 137 dB, and the damage range defined by [
11].
Table 6 displays the different levels of air blasts recorded in the control points.
In terms of vibration, at least, 80% of them are below 40% of the value defined in
Figure 5. Moreover, 99% of the blasts have an air blast below 130 dB, and 88% of them are also under 120 dB. Therefore, the main negative impacts caused by blasts, vibration, and air blast did not worsen due to the improved design, and compliance with the product requirements.
This fact can be considered a clear improvement because results from 2006 to 2010,
Figure 9, are equivalent to those from 2006,
Figure 7, when the average distance from the blast area to constructions diminished by more than 200 m (control points A, E, and H).
Table 7 displays the average distance evolution from benches to the nearest constructions over time; some benches were stopped between 2015 and 2019.
4.3. Blast Cost and Efficiency
As was previously mentioned, the blast design was modified and tested over time until the most efficient option was achieved in terms of cost, product characteristics, and environmental constraints.
Table 8 synthesizes the percentage of each blast design and each grid used over time, while
Table 9 compares results from the three periods in which one of the three blast designs was more frequently used.
The improved blasting design allows one to use the wider grid 4 × 5 m more frequently and, consequently, the number of blastholes, mass of explosive, and quantity of accessories per cubic meter of rock diminishes.
The price of explosives fluctuates depending on the supply and demand of the area. Relevant civil infrastructures were developed in Asturias during the first years of the period studied and, consequently, the price of the explosives was higher than the rest of the period studied. The price of explosives is given in terms of A, price of the ANFO, in order to carry out a homogeneous analysis.
The initial design proposed has the following percentage of explosives, based on
Table 9: 60.6% cartridge explosive (7% dynamite and 53.6% high-energy watergel) and 39.4% ANFO, reaching an annual production of aggregates of 605,907 tones and an associated cost (€/t) of 0.2975 × A (factor A equals to €/kg of ANFO). The modification of the blasting system means savings of 19.12% in the cost of explosives compared to the previous blast design detailed in
Section 3.
On the other hand, the improved design, done from 2015 to 2019, was done based on the different characteristics of the quarry, obtaining the following percentage of explosives: 65.64% cartridge explosive (16.42% dynamite and 49.22% high-energy watergel) and 34.36% ANFO, reducing an additional 6.85% of the explosive cost. The analysis corresponds to a mean production per year of 574,961 tones and an associated cost (€/t) of 0.2771 × A.
If a price correction were done, it would reveal a 7.36% reduction, despite having a 5% increase of cartridge explosive (including a 9% increase of dynamite and a 5.5% reduction of high-energy watergel). This fact is due to an adjustment of the specific consumption, around 10%, due to the improvement in the blasting grid and the distribution of charges.
The refinement of the blast design also allowed for a reduction of the oversized material from 6% to 3.1%. However, the pre-treatment required for the oversized material and other procedures required for the blast have not substantially varied in terms of costs since the initial value was 0.092 €/t, and after the improvement of the design it was 0.095 €/t. After the inflation adjustment, the cost of this operation only increased by 1.8%. On the other hand, the improved design requires longer time for the explosive charge process, 15–20%.
Table 10 shows the time and cost related to the reduction of oversized material for the initial design and its subsequent adjustment.
4.4. Carbon Footprint Reduction
The improved design also impacted on the carbon footprint.
Table 11 gathers a comparison of the different blasting methods used, considering the average blasting production of the last five years, 565,846 tons per year. The CO
2 emitted is calculated assuming an ideal detonation.
There is an important reduction of the CO2 generated by the initial design and its improvement (comprising an overall reduction of 18.04%). This is caused by the quantity of explosive and blast design, not because of the election of the explosive with lower CO2 emission. Therefore, the environmental impact of a blast is mainly generated by the degree of efficiency in terms of material fragmentation. The modifications in blasting design have not implied significant changes in the crushing process.
5. Conclusions
The approach proposed allows one to improve the quality standards of the quarry regarding blasting costs and particle size obtained while maintaining the characteristics of the drilling phase: bench inclination and height, drilling diameter, and grid. In the case of the grid, the wider one is used more frequently. Moreover, the specific explosive consumption has been reduced by 29.8% and, consequently, CO2 emissions per ton of material by 18%. It has been verified that the CO2 emission per type of explosive is not considered relevant in the overall emission of the blast when there are other environmental constraints, such as vibrations or blast air blast, and other technical conditions such as a certain particle size required. The reduction of explosive also involved a more efficient extraction system, reducing around 26% the cost of the explosive consumed while complying with the criteria imposed on the operation.
The PPV prediction in the whole quarry was achieved, defining a general and local expressions of the maximum admissible load per time delay, based on the geological conditions. This knowledge has allowed one to achieve the mentioned improvement and maintain the ground vibration under acceptable limits. Vibration is under the limit value in 100% of cases and under the 40% of this limit value in 85% of cases. Moreover, the blast air blast has been always under 130 dB, the limit accepted by best practices guides, and almost 90% below 120 dB.
Further research should be done regarding the particle size of each blast and the energy consumption of the processing plant in order to determine the CO2 emissions and the overall efficiency of the production process.


