Article

Influence of Chemical Composition and Microvesiculation on the Chromatic Features of the Obsidian of Sierra de las Navajas (Hidalgo, Mexico)

1
Department of Biology, Ecology and Earth Sciences, University of Calabria, Via P. Bucci 15B, 87036 Rende, Italy
2
Department of Physics, University of Calabria, 87036 Rende, Italy
3
Istituto Nazionale di Fisica Nucleare, Division of Frascati, Via E. Fermi 54, 00044 Frascati, Italy
4
Instituto de Investigaciones Antropológicas, Universidad Nacional Autónoma de México, Ciudad de México 04510, Mexico
5
CNR–Nanotec, University of Calabria, Via P. Bucci 31C, 87036 Rende, Italy
6
Instituto Nacional de Antropología e Historia, Ciudad de México 06600, Mexico
7
Department of Informatics, Modellistics, Electronics and Systemistics, University of Calabria, 87036 Rende, Italy
*
Author to whom correspondence should be addressed.
Minerals 2022, 12(2), 177; https://doi.org/10.3390/min12020177
Submission received: 7 January 2022 / Revised: 26 January 2022 / Accepted: 27 January 2022 / Published: 29 January 2022
(This article belongs to the Special Issue Colours in Minerals and Rocks)

Abstract

:
The obsidian of Sierra de las Navajas is well known for its green color and gold hue. In order to relate these features with compositional and microtextural characteristics, we have carried out a microanalytical study by Wave Dispersion System associated to Electron Probe Micro-Analyzer, Scanning Electron Microscope observation, and X-rays micro-tomographic analyses of samples showing different colors (dark to light green, sometimes with bands of different color intensity) and hues (changing, uniform, no hue). In accordance with previous studies, the green color of the obsidian seems to be related to a high iron content, probably in its reduced state. However, no significant difference in composition occurs between dark and light green samples. The SEM observation and microtomographic study revealed the absence of microcrystals and the occurrence of vesicles of different size, shape, and orientation. Lighter green colors are shown by highly vesiculated surfaces, whereas non-vesiculated samples are darker. On the surfaces with a high concentration of coarse vesicles, a uniform golden hue is observed. Decreasing vesiculation gives a hue changing with the angle of incident light. However, when the vesicularity approaches zero, no hue is visible. The iso-orientation of vesicles along preferential directions and their distribution in bands determine the variation in color intensity and hue on differently oriented surfaces. Microvesiculation also influences other characteristics that were important features for the use of obsidian in the past, such as fracture, transparency, and roughness.

1. Introduction

Obsidian is a very peculiar volcanic rock, characterized by a vitreous appearance. Its glassy aspect is related to the rapid cooling of silica-rich, highly viscous magmas during effusive or explosive eruptions. In these conditions, the arrangement of atoms in ordered, crystalline structures is inhibited and the magma solidifies as an amorphous solid.
Obsidian occurs in numerous volcanoes around the world characterized by the eruption of dacitic to rhyolitic magmas, in almost all the tectonic settings. Due to its predictable fracture and sharp edges it is a highly sought-after material, commonly used for the production of weapons, cutting tools, jewelry, and magic-religious artifacts [1]
Most obsidians are macroscopically black, highly homogeneous, and transparent, so that in thin sections (with thickness of about 30 μm) they are colorless. However, obsidians of different colors also occur, often, but not always, associated with the classic black variety. In the few studies focused on the color of obsidian, the anomalous colors have been related to both chemical compositions and to the occurrence of tiny minerals or vesicles. “Mahogany” obsidian shows a combination of red/brown and black color and occurs, together with other varieties, in several sites around the world (e.g., Glass Buttes, Oregon [2]; Sonora, Mexico [3]; Carpathians [4]). The aspect of the Carpathian mahogany obsidian has been related to aggregates of Fe3+-rich hematite nanocrystals [4]. The alignment of nanometric crystals of magnetite on isolated thin layers has been considered responsible for the aspect of another peculiar type of obsidian at Glass Buttes, Oregon, named “fire” obsidian for its vibrant color-reflectance [5]. In the volcanic center of Lami, on the island of Lipari (Aeolian Islands, southern Italy), together with the black obsidian, a grey variety occurs [6]; in this case the color has been related to the occurrence of numerous rounded vesicles of nanometric size and of feldspar nanocrystals [7]. A high content of silicate microlites was also observed in the grey obsidians of the 1300 B.P. eruption of Newberry Volcano, USA [8].
The obsidians of Sierra de las Navajas (state of Hidalgo, Mexico), also known as “Pachuca obsidians”, are characterized by a peculiar light to dark green color with golden hue [7,9,10,11]. Some research attributes the green color of these obsidians to the notably high content of Zn and Zr [10,12]. However, [7] proposed that Fe content is more likely the cause of the green color. Previous work also demonstrated the occurrence of isolated and elongated vesicles, often iso-oriented, that are thought to be responsible for the golden shine [7,9,11,13].
The aim of this work is to relate the chromatic features of the Sierra de las Navajas obsidian (i.e., color and hue) to their chemical composition and microtextural features, in particular to the microvesiculation. With this purpose we have selected obsidians showing different colors (from light to dark green, sometimes with bands of different color intensity) and hue, and we have carried out a microanalytical study by electron probe micro-analyzer (EPMA). Moreover, we have conducted a micro-morphoscopic study including 2-D SEM observation on the surface of obsidians and 3-D X-ray micro-tomography (micro-CT) inspection in order to reconstruct the shape and distribution of vesicles inside the obsidian sample and on its surface.

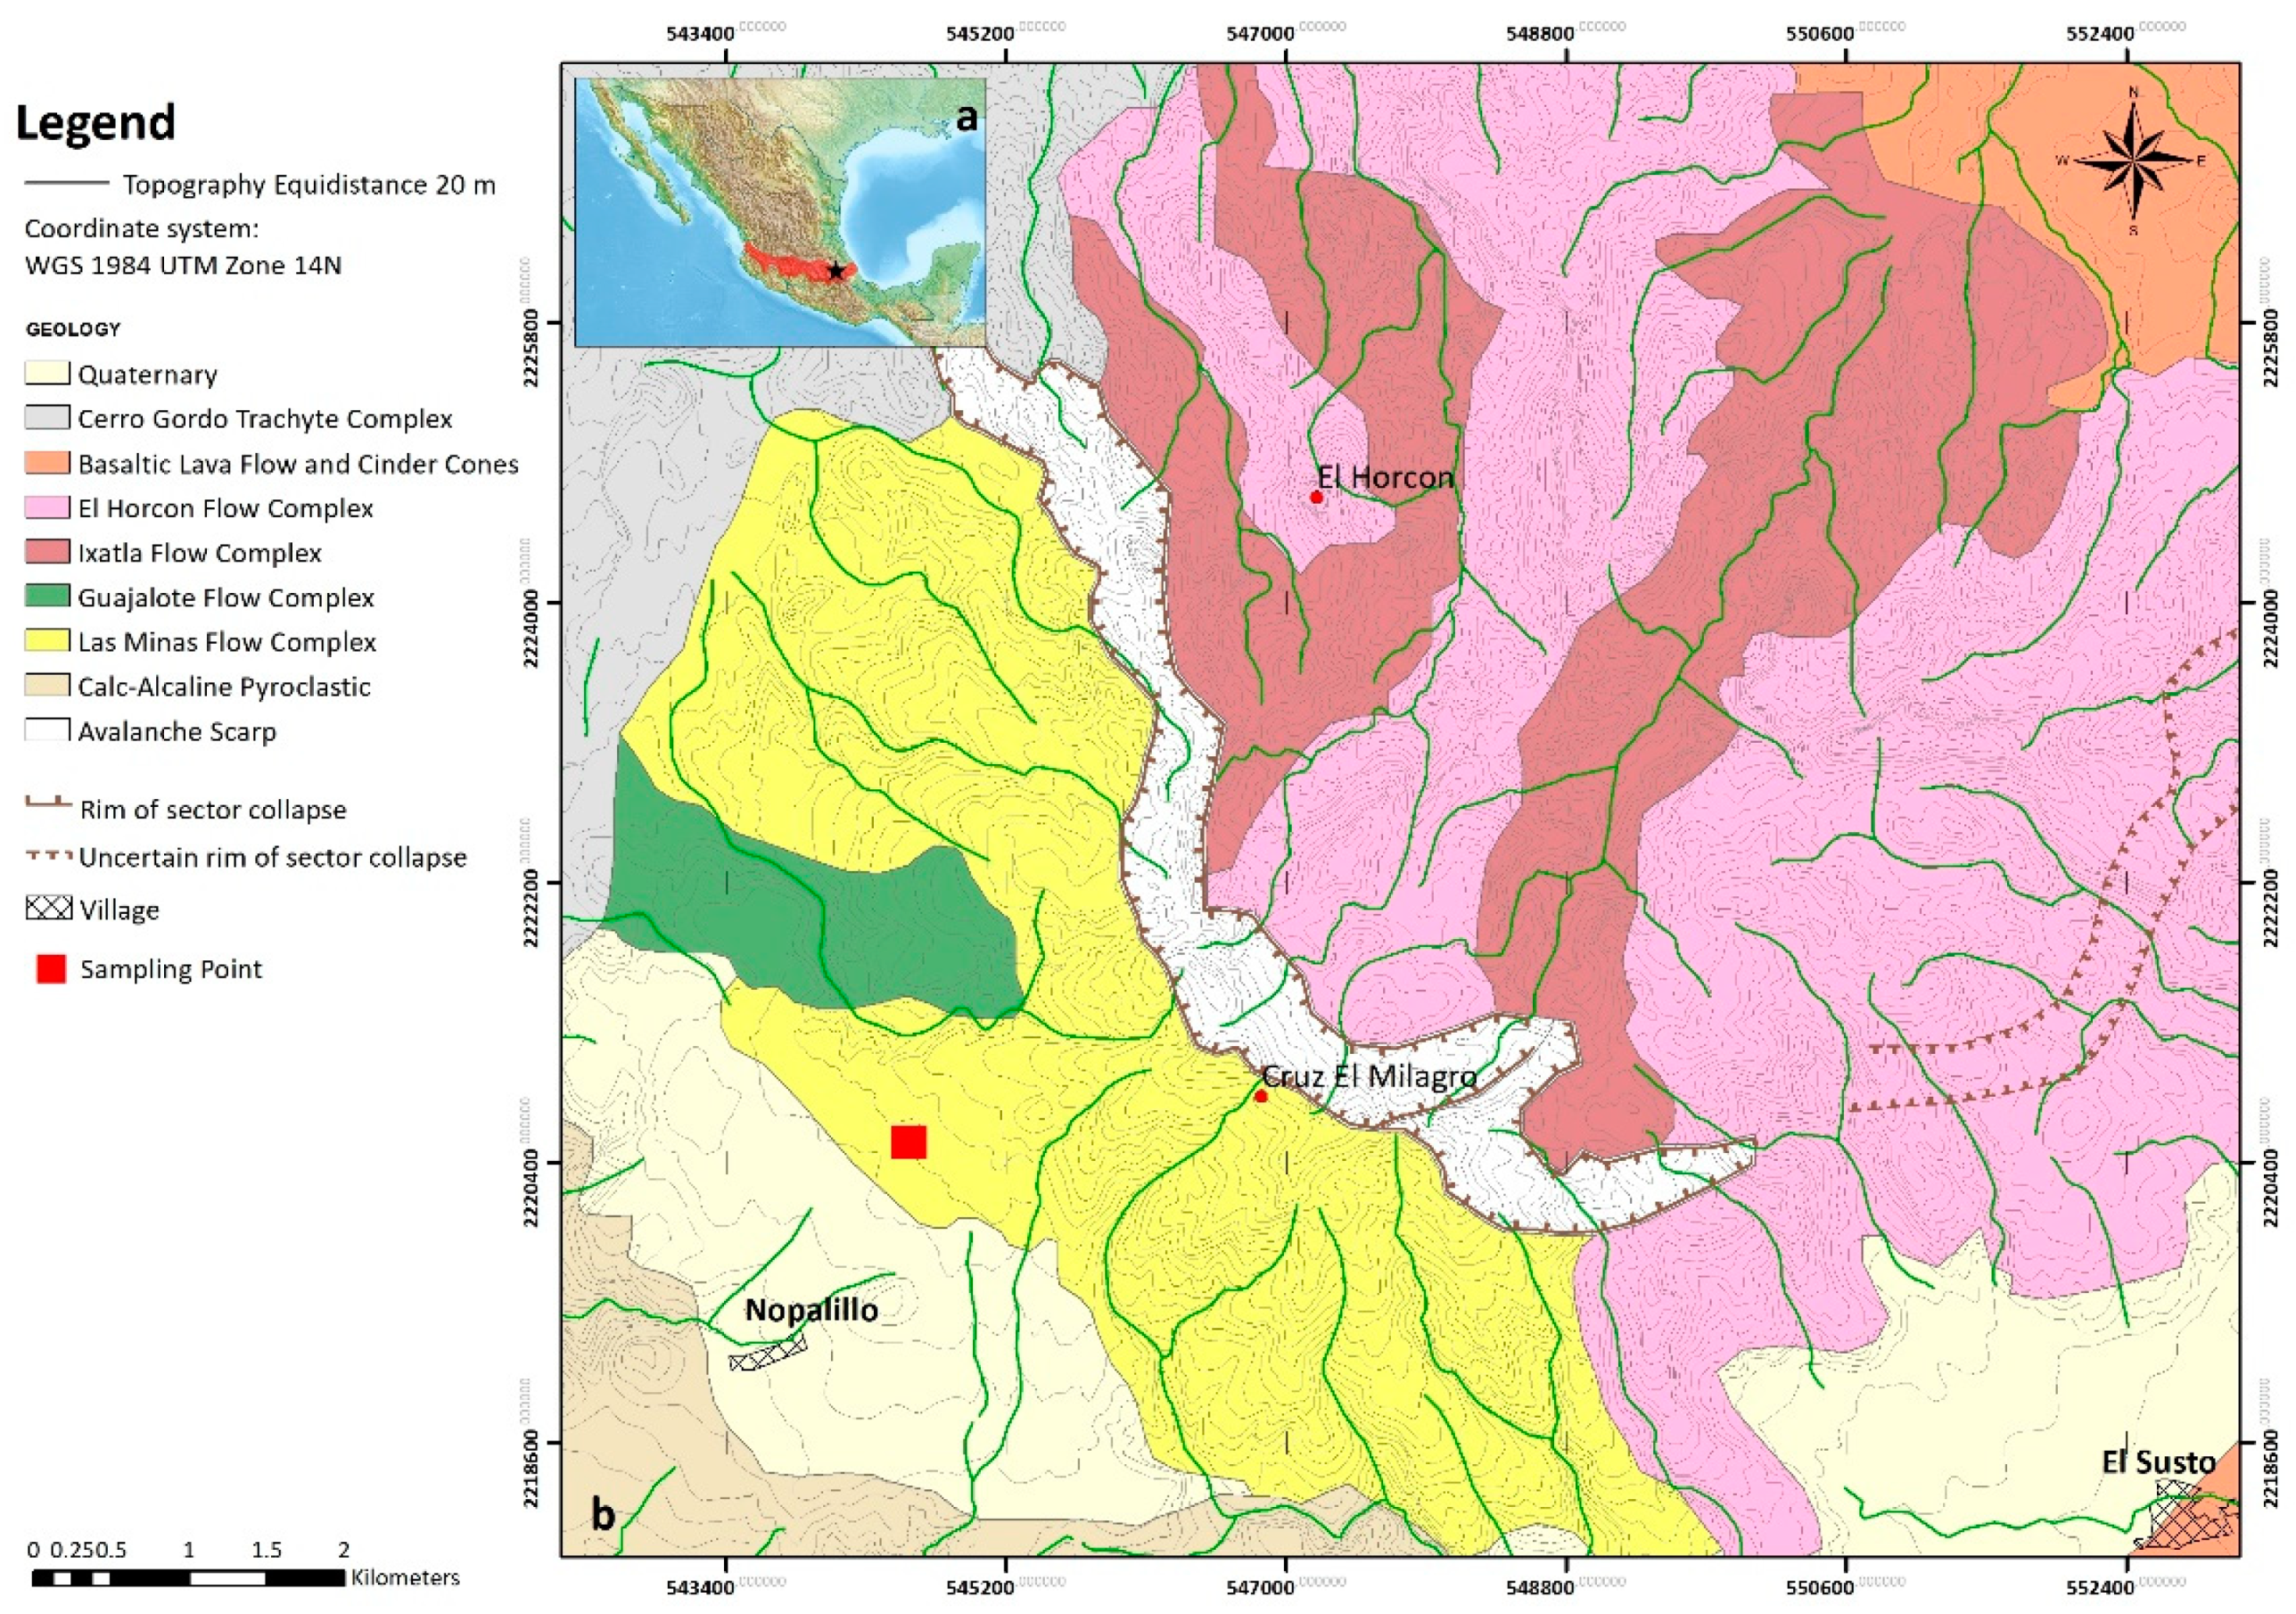
2. Geological Outlines

Sierra de las Navajas, or Sierra de Pachuca, is a rhyolitic peralkaline volcano situated on the northern boundary of the eastern sector of the Trans Mexican Volcanic Belt (Figure 1a).
The volcanic history of Sierra de las Navajas can be divided in three main stages [9] (Figure 1b). The rhyolitic lavas and pyroclastic products of the first stage of activity are grouped in three complexes: (1) the Guajalote Flow Complex in the south-western sector, (2) the Las Minas Flow Complex to the west and south, and (3) the Ixatla Flow Complex in the southern and central sectors. The second stage of activity is marked by a huge sector collapse dissecting the northern portion of the volcano. Finally, the last stage of activity was concentrated in the depression formed after the sector collapse, where the rhyolite lava domes and lava flows of the El Horcón Flow Complex were emplaced [9].
The age of the Sierra de las Navajas volcano is not known; however, its products locally overlie basaltic lavas for which an age of 2.4–2.6 Ma was inferred [9,14].

3. Sierra de las Navajas Obsidian
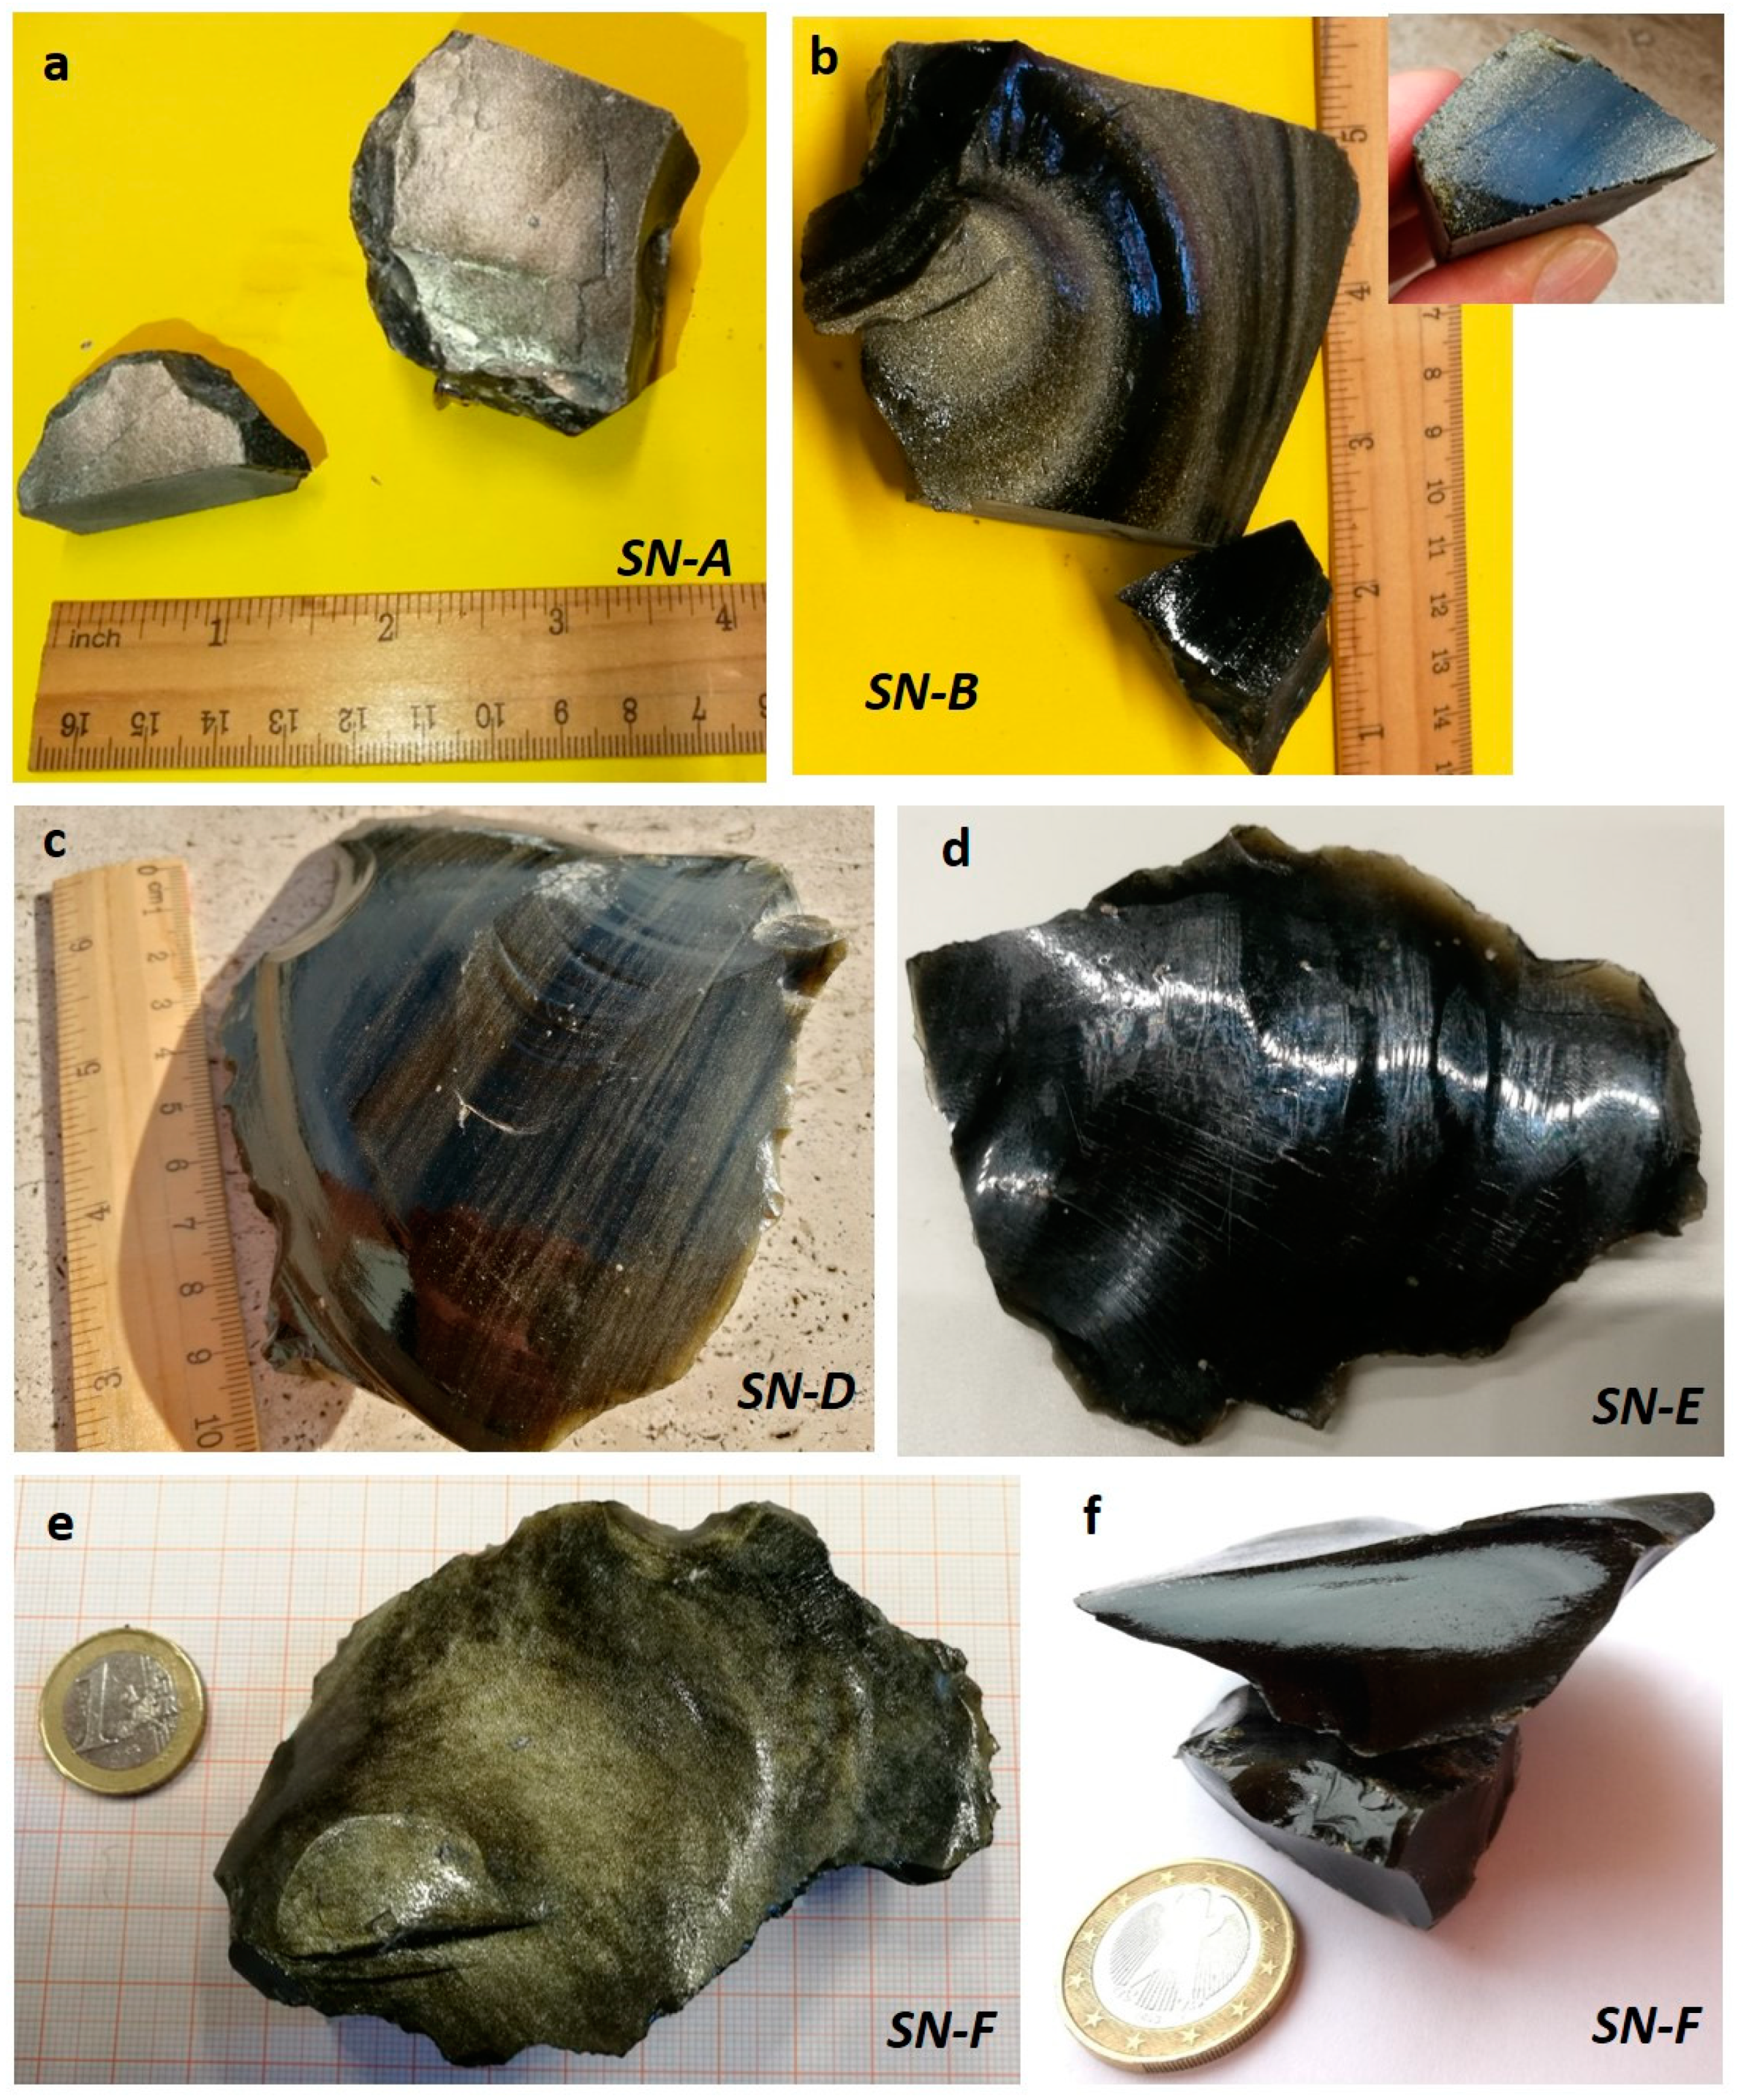
Obsidians are common products in the eruptive history of Sierra de las Navajas. They occur both as lava flows, often gradually passing to rhyolitic lavas, and as pyroclastic fragments, associated with ash and pumices. Most obsidians are green, vitreous, and aphyric, but other varieties also occur, ranging in color from dark grey to dark amber, black, dark brown, or pinkish; all the varieties can sometimes contain feldspar and amphibole phenochrysts [7,9,15].
The best known obsidian deposit, from which the samples used in this study are from, belongs to the Las Minas Complex and consists of obsidian blocks, ranging in size from a few centimeters to more than one meter, set in a white ashy matrix. The deposit never outcrops, but it was intensively mined in the past, and still today several galleries and wells are used for obsidian quarrying and allow us to closely observe and sample the deposit. The abundance of ash led [16] to interpret this deposit as a lahar or a block-and-ash flow. However, other authors [9,17] observed that the deposit also occurs at high elevations, which is not compatible with an emplacement by a lahar or a block and ash flow. Moreover, they noticed that banding in the obsidians can be followed for long distances. On this basis, they proposed that the deposit is a lava flow with obsidianaceous portions and more vesiculated, pumiceous layers whose weathering would have produced the ash matrix.
The whole rock composition of the obsidians here described confirms that they are peralkaline rhyolites with rather high iron content [7,9,10,18].
The obsidians of this deposit have a variable aspect, ranging in color from deep to light green, sometimes forming bands and often showing a variably changing golden hue (see next section). They are almost completely aphyric, with the rare exception of a few quartz microcrystals, and generally have a perfect conchoidal fracture [7,9,10]. A common and peculiar feature of these obsidians is the occurrence of small, elongated vesicles [7,9,13]. Preliminary 2D and 3D studies on the distribution of vesicles demonstrated that they are isolated, often iso-oriented, and range in size from a few to hundreds of micrometers [7,11].
The physical (fracture, smoothness, absence of crystals) and chromatic (color, hue, transparency) features of these obsidians determined their wide use over the centuries [11]. Their high quality in terms of perfect conchoidal fracture and formation of very sharp edges made them particularly requested in pre-Hispanic times for the production of weapons and cutting tools. Moreover, their peculiar green color made them highly desirable for the realization of jewels and magic-religious objects associated with pre-Hispanic warrior gods [19,20,21]. The deposit here described was extensively mined starting from the Teotihuacan civilization (ca. AD 200–600) and during the Toltec culture (AD 950–1100) and the Aztec military Empire (AD 1325–1521) [21]. The percussion (knapping) and polishing technique was used to produce artifacts. Starting from the 16th century, the Spanish prohibited the extraction and use of obsidians to reduce the availability of weapons for indigenous people; the Catholic inquisition further limited the use of obsidians because it was associated with witchcraft [22,23]. Presently, this obsidian is mined and used to make craft items and jewels.

4. Selected Samples

All the obsidians analyzed in this study come from the deposit described in the previous section (red square in Figure 1b) and were sampled in the mining galleries or in the debris carried on the surface by mine workers. In order to investigate the factors influencing the chromatic features of the obsidians, we have selected five fragments with different aspects (Figure 2).
Sample SN-A has a bright green, homogeneous color and shows a flat natural fracture surface (Figure 2a). The hue is homogeneous and almost “metallic”, and the surface is rough to the touch.
Sample SN-B shows, on the natural fracture surface, an alternation of concentric bands, whose thickness is on the order of one centimeter. Some bands are very dark green (black where the thickness is greater than a few millimeters), smooth, and show no hue. Other bands are very light green, rough and have a golden hue. In some cases, the passage between two adjacent bands is sharp, whereas in other cases bands with intermediate color, hue, and smoothness occur (Figure 2b).
Sample SN-D also shows banding, but the single layers are thinner with respect to the previous sample (on the order of one millimeter) and planar. Single bands have colors ranging from light to very dark green. The natural fracture surface is curved (conchoidal fracture) and homogeneously smooth (Figure 2c).
Sample SN-E looks homogeneously black and shows no hue; only at the edges, where thickness is extremely reduced, is a dark green color visible. The natural fracture surface is smooth and curved (Figure 2d).
Finally, sample SN-F has a curved natural fracture surface, rough to the touch, with a rather homogeneous green color and changing golden hue (Figure 2e). It is worth noting that, when artificially hammered to obtain a surface roughly orthogonal to the natural fracture, the sample looks smooth, almost black, and without hue at all (Figure 3f).

5. Analytical Methods

5.1. Scanning Electron Microscope (SEM) Observation and Electron Probe Micro-Analysis (EPMA)

SEM observations and EPMA microanalysis were carried out at CM2 lab (Centro di Microscopia e Microanalisi)–University of Calabria on natural fracture surfaces of obsidian fragments coated with 5 nm of ultra-pure graphite by a Sputter-Carbon Coater QUORUM Q150T-ES.
The natural fracture surfaces of each sample were observed using a field emission scanning electron microscope (FESEM) mod. Quanta 200-FEI equipped with secondary electrons (SE) and back-scattered electrons (BSE) detectors. Both modalities of observation were used.
For glass microanalysis, small fragments of approximately 1 cm × 1 cm size were cut from each sample. The natural fracture surface was smoothed before graphite coating. Microanalysis was carried out with an electron probe micro-analyzer JEOL JXA-8230, equipped with 5 WDS spectrometers with LDE, TAP, PETJ, and LiF crystals. The fifth spectrometer is equipped with large crystals (PETL and LIFL) for trace element analysis. The spectrometers are equipped with proportional counter detectors and Xe-filled detectors. This instrument is also equipped with an EDS spectrometer, secondary electrons (SE), and back-scattered electrons (BSE) detectors as well as an optical microscope. Detector constants and work conditions were as follows: tilt angle 0°, voltage of 15 kV, probe current of 6nA, and working distance of 11 mm. Counting times were 10 sec for NaO and 30 sec for other elements. A defocused beam with a diameter of 10 μm was used. The ZAF quantification correction was used to minimize the matrix effect. The instrument was calibrated using a suite of appropriate mineral standards. The calibration was verified using a standard obsidian provided by SPI supplies (SPI#02757-AB serial 4Ak). To evaluate the accuracy, the mean values of measurements carried out on the quality control standard were compared with those certified. Accuracy, expressed as the relative difference from reference values, is better than 5% for SiO2, Al2O3, FeO and alkalis. The relative difference with certified values is higher for elements with concentration lower than 0.5% (MgO, CaO, TiO2, MnO).
For each sample a number of points ranging from 8 to 16 were analyzed. In the case of heterogeneous samples (e.g., SN-B), both light and dark green bands were analyzed. Analyses for which the sum of oxides was <97 wt% were discarded. Sample totals were normalized to 100 wt% in all plots and tables.

5.2. X-ray Computed Microtomography and Image Analysis

Using a conventional laboratory source at μTomo experimental station @STAR Lab at the University of Calabria, fragments obtained from samples SN-A, SN-B, and SN-D were investigated by means of X-ray computed microtomography (X-ray micro-CT). The micro-CT setup consisted of the following components: an X-ray source (Hamamatsu L12161-07), a flat panel detector, and a six degrees of freedom sample positioning system. The X-ray source operated at a voltage of 100 kV, a current of 100 μA, and a focal spot size of 10 μm. A fixed target of Molybdenum of 50 μm thickness was used to compensate for the low-energy components of the X-ray beam and reduce the beam-hardening effect. The detecting system consisted of a Hamamatsu Flat-panel detector (C7942SK-05) with a pixel-size of 50 μm. The optical magnification was set to 5, thus resulting in an equivalent pixel-size of 10 µm and a field of view of nearly 23 × 23 mm2. The exposure time was set to 3 s/projection, and a set of 1800 projections over an angular range of 360° was acquired. Projections were normalized by conventional flat-fielding, and the FDK algorithm [24] for cone-beam geometry was finally employed to perform tomographic reconstruction.
The image analysis was conducted using the Avizo© 9.3 commercial software. The segmentation of vesicles was performed in two steps. The stack of reconstructed slices was uploaded twice to the memory. The first copy was processed with a “3D median filter” module to reduce image noise, and an “Automatic Thresholding” algorithm [25] was employed to separate the bulk rock from the rest. A series of morphological operators was then used to “close” the rock in order to obtain the binary volume of bulk+vesicles component. The second copy of the reconstructed slices was processed by means of an “Unsharp Masking” filter in order to compensate for image noise while enhancing the edge contrast. Finally, the vesicles were obtained from the latter filtered image employing an “Interactive Thresholding” module and using the binary bulk+vesicles volume as a mask to segment the hosted vesicles.
The analysis to determine the 3D shape of the vesicles, their distribution, and orientation inside the sample was performed in different steps. First, we excluded the contribution to the tomographic image of incomplete vesicles, i.e., those intersecting the border of the sample, as their volume and morphology may not be representative of the real shape. Second, we performed an analysis for investigating the morphological and topological features of the vesicles in the bulk sample. We employed the “Label Analysis” module of Avizo for the estimation of several characteristic of each vesicle, such as: volume, vesicle major axis orientation, flatness (ratio between the minor and the intermediate axes), and elongation (ratio between the intermediate and the major axes). Elongation and flatness were estimated using the ‘’Feret3D attributes’’. For each vesicle, the orientation of the major axis, in spherical coordinates, was estimated as: (1) the angle between the major axis of the vesicle and the Z axis, which is orthogonal to the reconstructed XY slice plane (polar angle θ); and (2) the angle between the X axis and the vesicle major axis projection on the XY slice plane (φ, i.e., azimuthal angle). Values of θ vary from 0 to 90°, whereas φ ranges from −180 to 180°. Additionally, we estimated the vesicularity of the sample by means of the “Volume Fraction” module of Avizo both in 2D and 3D. The 3D version was used to estimate the sample vesicularity, and the 2D one was used to generate the slice-by-slice vesicularity along the main axis of the sample. The latter measurements were performed also including the incomplete vesicles that we excluded for the evaluation of morphological attributes. However, we excluded vesicles below 5 voxels, as they can mostly originate from the image noise level. The 3D visualization was performed by using the ‘Volume Rendering’ module of Avizo.
For the statistical analysis, vesicles below 25 voxels (corresponding to a volume lower than 2.5 × 104 µm3) were filtered out, as 3D morphological attributes of small object can be wrongly estimated by the “Label Analysis” module and can bias the distributions of the different parameters we evaluated. The statistical analysis of the morphological characteristics of the vesicles for each sample was performed in Matlab®.

6. Results

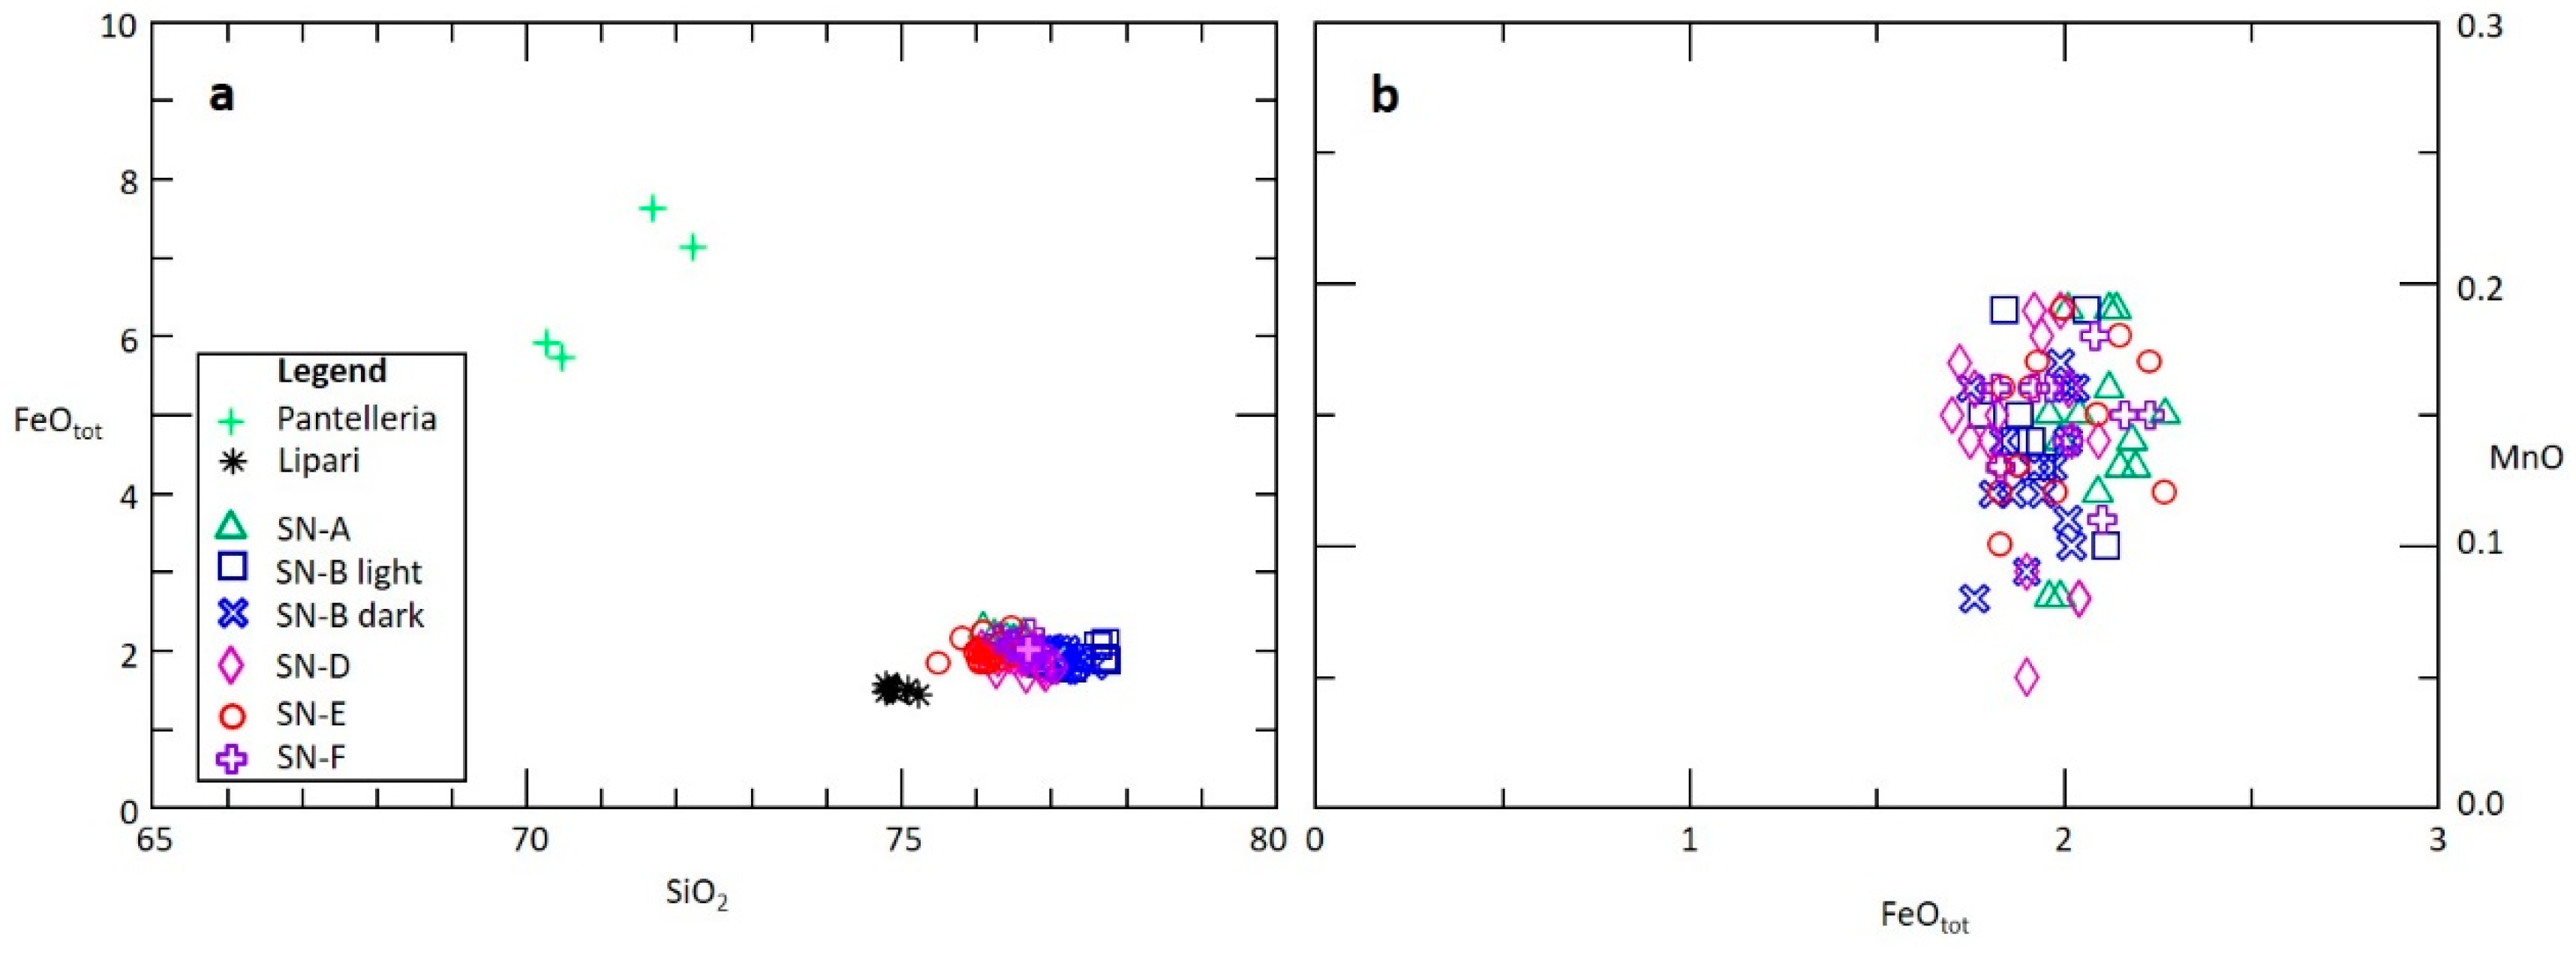
6.1. Chemical Composition of the Glass

Average EPMA compositions are listed in Table 1.
The whole set of data is given in Table S1. Microanalysis confirmed that the composition of Sierra de las Navajas obsidians is homogeneously rhyolitic with silica contents higher than 73 wt%. The rhyolites have a peralkaline affinity, i.e., an excess of alkalis with respect to aluminum on a molar basis (Figure 3a). In the FeOtot vs. Al2O3 diagram [26], all the analyzed points fall in the field of comendites (Figure 3b). The alkalis content ranges between 8 and 11 wt%, generally with a slight excess of Na2O over K2O (Na2O/K2O 0.9–1.4, Figure 3c). The Al2O3 content is approximately 11 wt% and the total iron, expressed as FeO, is higher than 2 wt% (Figure 3b). The chlorine content is rather homogenous, with an average value of c. 0.2 wt% (Figure 3d). MgO is <0.1 wt%, and CaO content is below the detection limit of the instrument.
Figure 3. Chemical composition of the samples’ surface obtained by microanalysis: (a) classification diagram of rhyolites [27]; (b) [26] classification diagram for peralkaline rocks; (c) alkalis ratio vs. sum of alkalis; (d) Chlorine vs. total alkalis.
Minerals 12 00177 g003
The microanalyses revealed that each sample has a rather variable composition of the glass, particularly in terms of sodium and iron content. These differences, however, are not related to the color of the obsidian. An example is given by sample SN-B, where the light green bands and dark green portions do not show any compositional differences. Moreover, despite the sample internal heterogeneity, inter-sample variability is very low, and the compositional fields of different samples overlap in almost all the diagrams.

6.2. 2D Microscopic Observation

All SEM observations were carried out on the surface of natural fracture. The observations revealed the absence of crystals of any size and the occurrence, in almost all the samples, of vesicles with different size and shape (Figure 4).
Sample SN-A (Figure 4a) shows on the surface the occurrence of many flat vesicles, apparently oriented with the two major axes parallel to the natural breakage surface. The shape of the vesicles is highly irregular, and sometimes they seem to be formed by several layers (Figure 4b). Their size is highly variable, and the length of their major axes varies from a few micrometers to a maximum of approximately 250 µm.
In sample SN-B, the bands with different color and hue correspond to zones with different vesiculation. The light green, rough bands show a high concentration of vesicles, whereas the dark green, smooth bands are poorly or non-vesiculated (Figure 4c). Vesicles are mainly elliptical and mostly iso-oriented, with major axes elongated parallel to the bands (Figure 4d). Their dimension ranges from a few tens to several hundreds of micrometers. At places where vesicles are very close to each other, they seem to be plastically deformed (Figure 4e).
Sample SN-D is similar, in shape and distribution of the vesicles, to the previous sample. Additionally, the light green bands are characterized by the occurrence of several elliptical vesicles, roughly iso-oriented, with the major axes elongated in the direction of the bands (Figure 4f). Here, however, the dimension of single vesicles is lower, with major axes usually not exceeding 100 μm.
Very few vesicles, with irregular shape and dimensions in the order of tens of micrometers, are randomly distributed on the surface of the homogeneously dark sample SN-E (Figure 4g).
Finally, on the homogeneously green surface of sample SN-F, very flat vesicles can be observed (Figure 4h). When observed on the orthogonal, dark surface, the vesicles appear extremely thin and highly elongated (Figure 4i), with minor axes of a few micrometers of length and major axes of the order of tens of micrometers (average aspect ratio about 1:15).

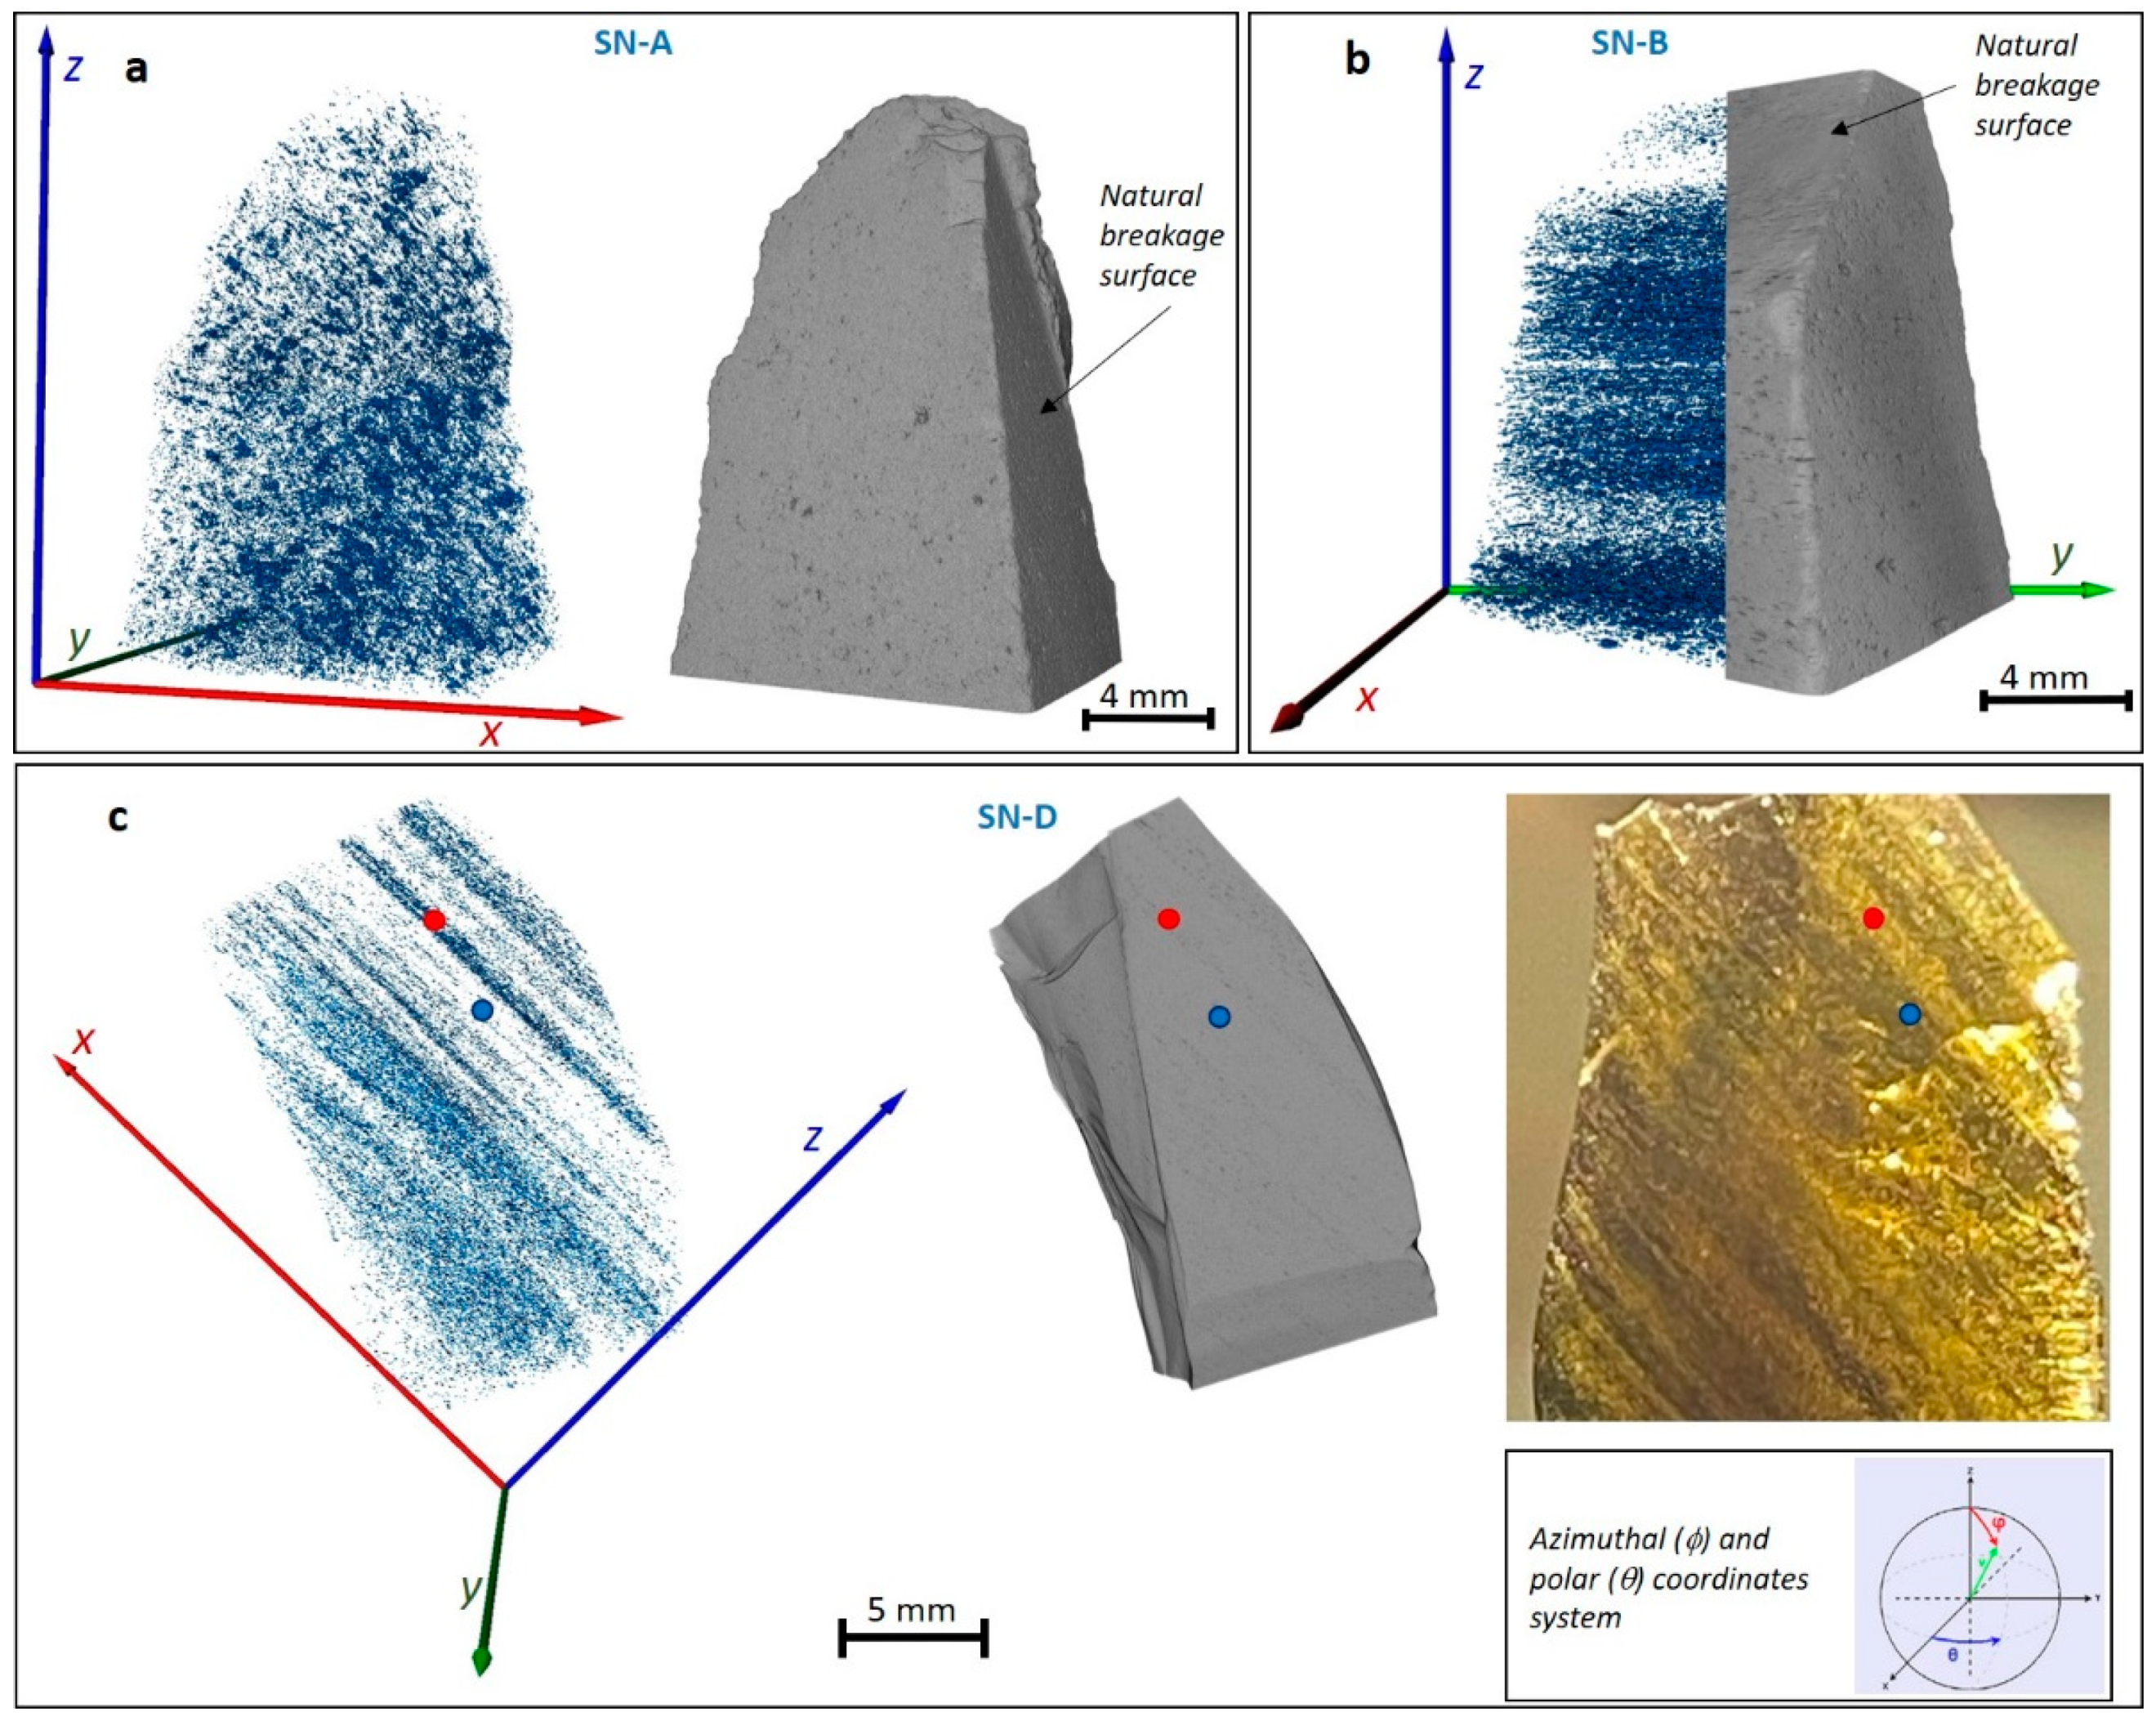
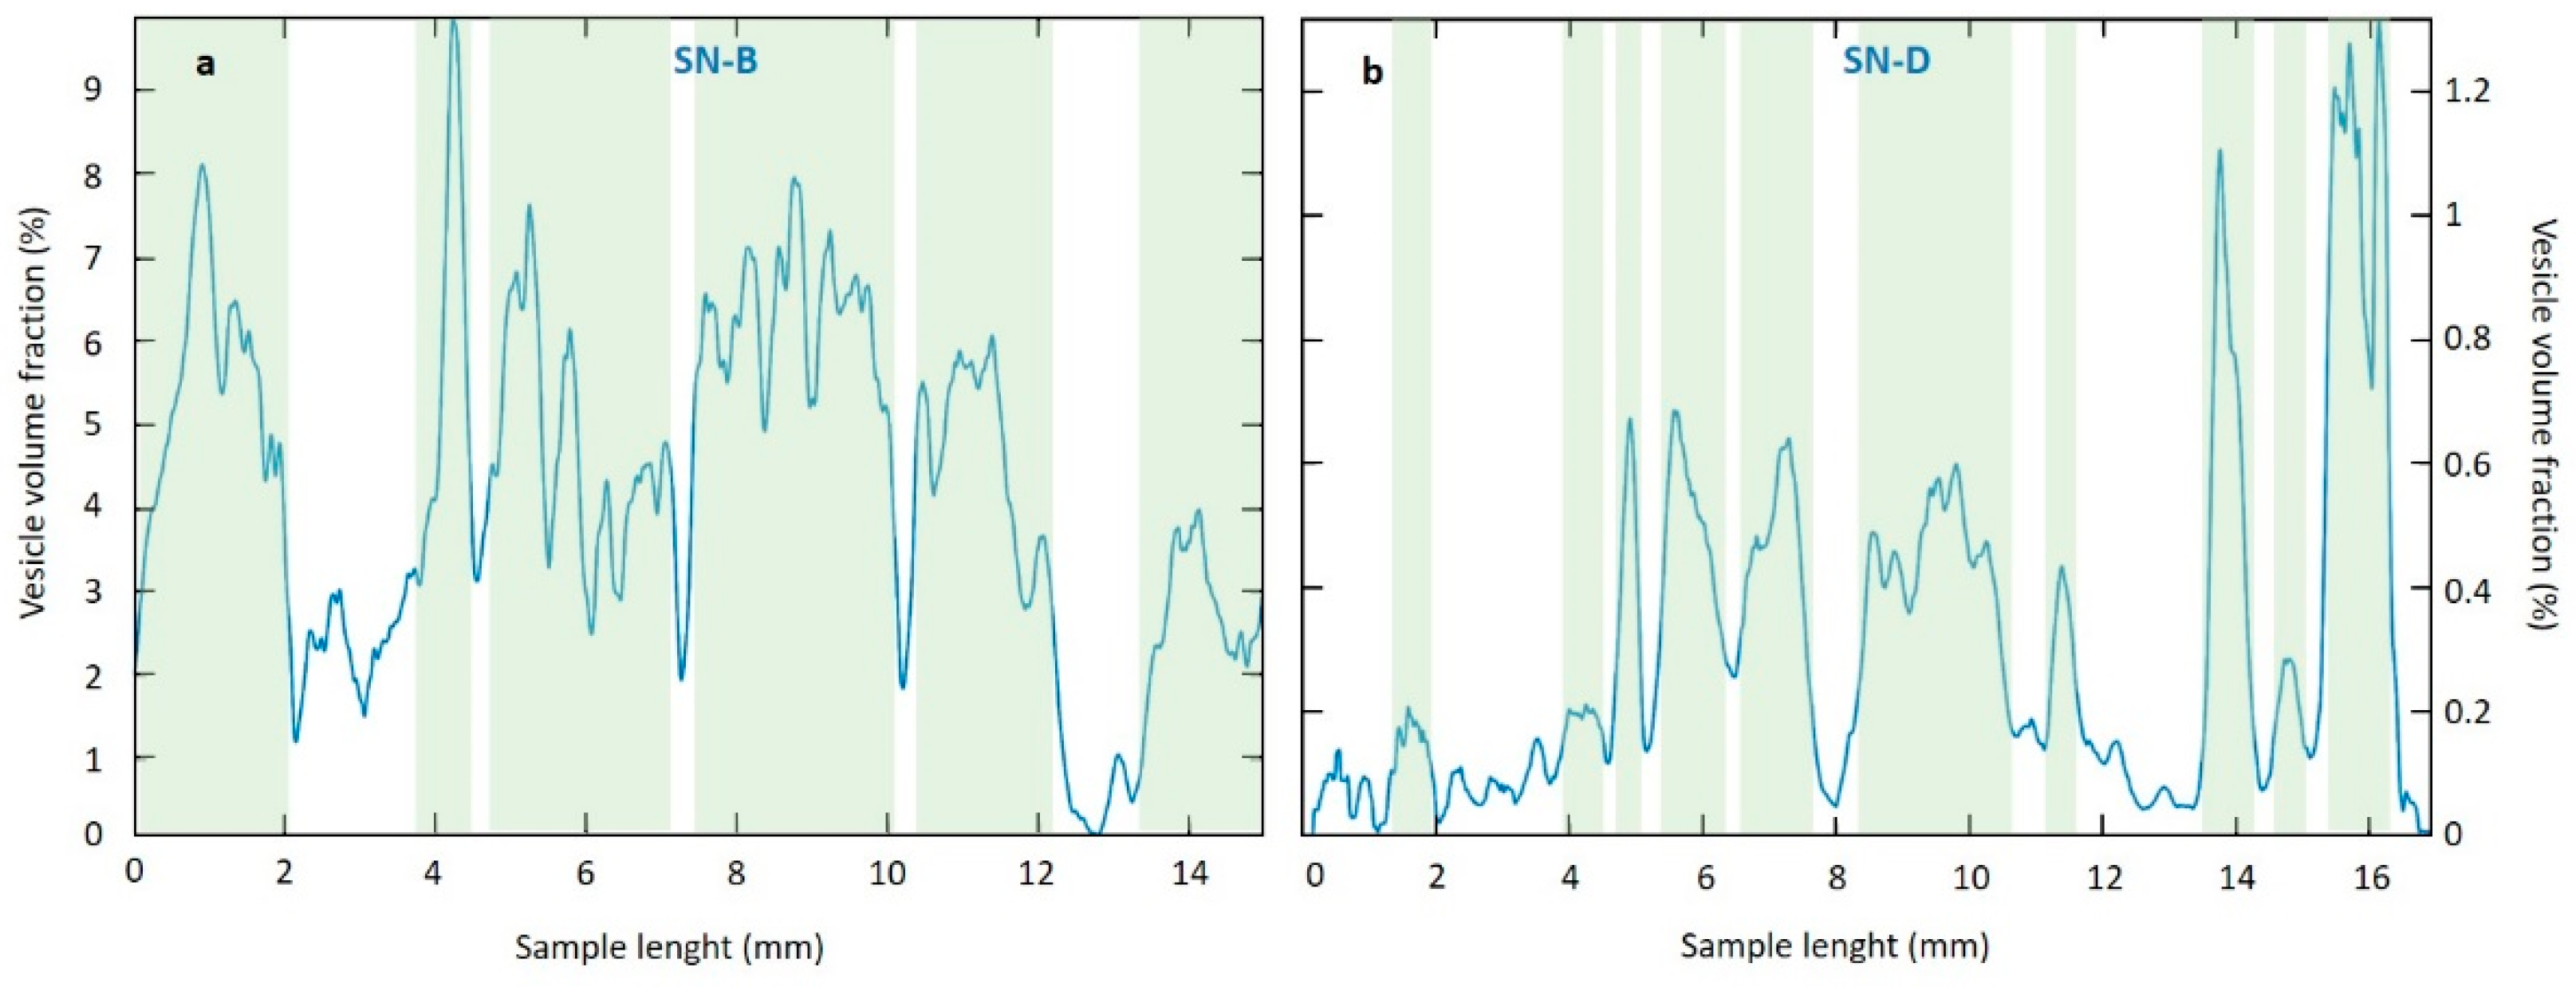
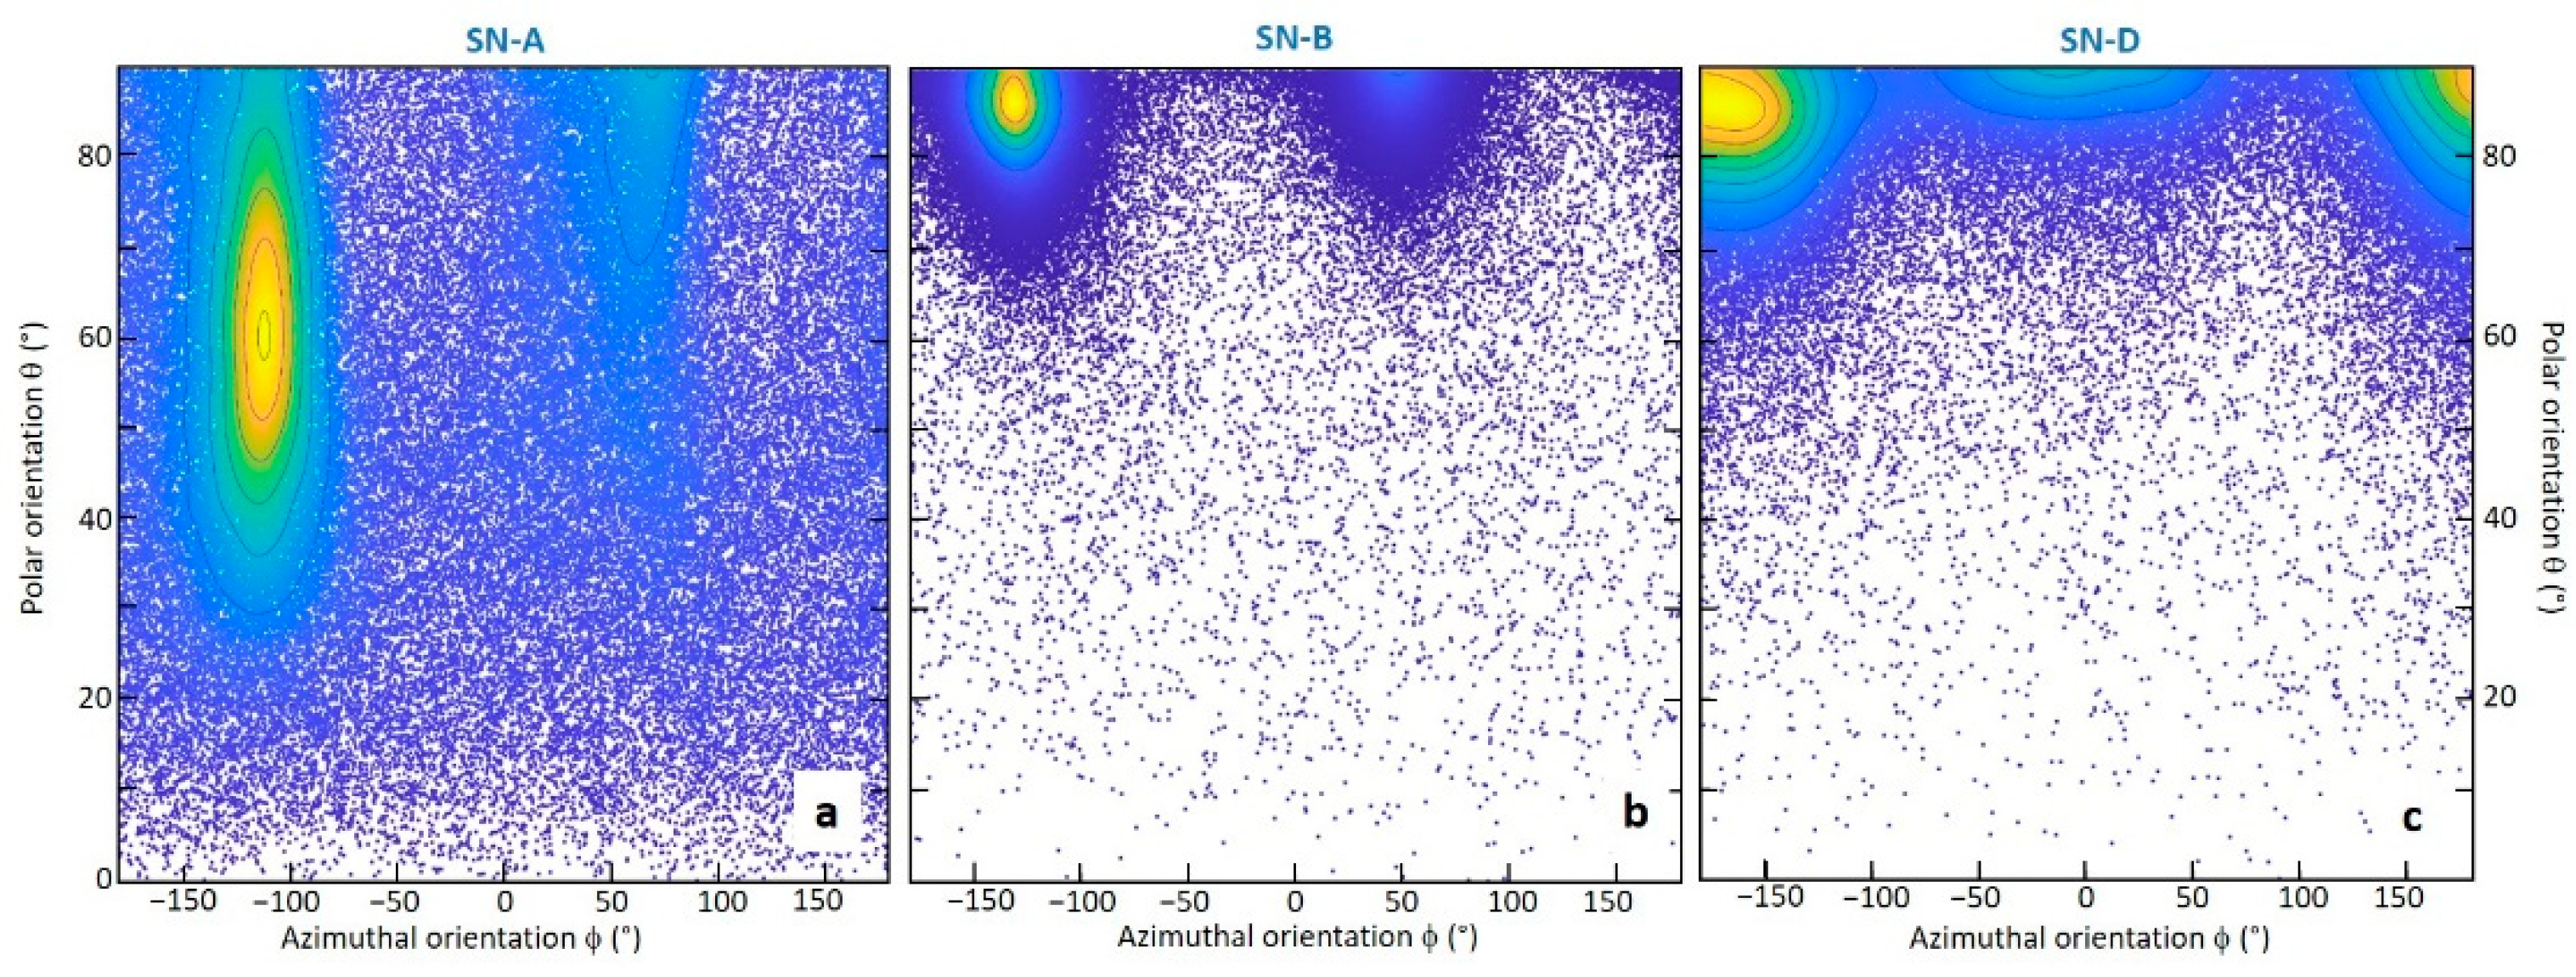
6.3. 3D Shape and Distribution of Vesicles

The X-rays microtomography for the determination of the 3D shape and distribution of the vesicles was conducted on samples SN-A, SN-B, and SN-D. In the other samples the number of vesicles was too low, or their size in at least one dimension was smaller than the equivalent pixel size of the imaging system (10 µm).
In Figure 5, the volume renderings of vesicles and bulk samples are reported for the three analyzed obsidians and show qualitatively the distribution of the vesicles inside the samples. Further videos of the vesicle distribution are available in Videos S1, S2, and S3. In sample SN-A (Figure 5a), the vesicles seem to be randomly distributed in the sample, without a preferential organization. In contrast, in sample SN-B the vesicles are mainly arranged in preferential bands (Figure 5b). The natural breakage surface forms an angle of approximately 45° with the vesiculated bands, and their intersection forms the differently colored portions of the surface of the sample. In sample SN-D the vesicles concentrate in preferential bands corresponding with the light-colored stripes observed in the macroscopic sample (Figure 5c).
The quantitative analysis revealed that there is a strong variability in the vesiculation (calculated as the percentage of the samples’ volume occupied by the vesicles) among the three selected samples. It is very low in samples SN-D and SN-A (0.34% and 0.7%, respectively) and one order of magnitude higher in sample SN-B (Table 2).
For samples SN-B and SN-D, which are macroscopically heterogeneous and in which the tomography renderings have shown an arrangement of the vesicles in preferential bands, the variation in vesiculation has been calculated slice by slice along the direction orthogonal to the bands (Figure 6). The pattern shows, in both cases, an alternance of poorly vesiculated portions and areas where the volume occupied by the vesicles is higher, thus confirming that the bands observed under the SEM on the surface extend along the whole length of the sample.
The volume of the single vesicles is also variable inside each of the three analyzed samples (Table 2). The biggest vesicles are in sample SN-B, with a mode in volume distribution of 4.5 × 104 µm3. In samples SN-A and SN-D, the most represented size is 2.8 × 104 µm3. The probability density function of the log10 of the vesicle volume for each sample is reported in Figure S1.
In order to quantitatively evaluate the distribution of vesicles inside the samples, the polar orientation of the major axis of each vesicle and its azimuthal orientation were calculated and shown with a density scatterplot [28] in Figure 7. In sample SN-A (Figure 7a) the points are rather scattered, thus confirming what was qualitatively observed in Figure 5a; however, most of the vesicles have a restricted range of azimuthal orientation, with the maximum concentration of points at an angle of approximately −112°. A second peak is visible in correspondence of 70°; the two orientations, being at nearly 180° from each other, can be considered as coincident, as they correspond to objects arranged along the same direction (probability density functions were evaluated using equally spaced bins having size of 5°, and each interval is identified using its center value). This direction roughly coincides with that of the natural breakage surface observed under the SEM. The polar angle is highly variable, thus indicating that the vesicles have a preferential orientation only along the azimuth plane.
Sample SN-B (Figure 7b) shows two well defined concentrations of points for coincident azimuthal angles around −130° and 50°. However, in this case, the polar orientation also shows a very narrow range (85–90°) where most of the points are concentrated. This means that the vesicles are strongly iso-oriented in a preferential direction. The natural fracture surface observed under the SEM is not coincident with this preferential direction but forms with it an angle of about 45° (see also Figure 5).
A similar distribution in the orientation of vesicles’ major axes is shown by sample SN-D (Figure 7c), where the points concentrate in three coincident ranges of azimuthal orientation and have a polar orientation between 80° and 90°. However, the ranges of azimuthal and polar orientation are slightly wider than for sample SN-B, thus indicating a less defined iso-orientation.
Two shape parameters, flatness and elongation, were calculated for each vesicle. The first is defined as the ratio between minor and intermediate axes, the second is the ratio between intermediate and major axes. The closer both parameters are to 1, the closer the shape of the vesicle resembles a sphere. The “flatness vs. elongation” scatterplots for the three samples are reported in Figure 8. In the first set of figures (left panels), a density function has been added to the scatterplot. In the second set of figures (right panels), the vesicles were differentiated based on their volume. The highest density of vesicles of sample SN-A is in correspondence of values of elongation of c. 0.45 and values of flatness of c. 0.3 (Figure 8a). The dimensions of the vesicles are not correlated with their shape (Figure 8b). Vesicles of sample SN-B have lower values of both parameters, which means that they are more stretched (Figure 8c). The lowest values are shown by the coarser vesicles, whereas the smaller ones seem to be more rounded (Figure 8d). Most of the vesicles of sample SN-D have higher values of both parameters and are therefore more rounded (Figure 8e). Only vesicles with higher volume are strongly stretched (Figure 8f).

7. Discussion

7.1. Influence of Chemical Composition on Obsidian Color

The green color of Sierra de las Navajas obsidians has been related to their relatively high iron content with respect to more common, black obsidians [7]. Other known coloring elements in glass are the other transition metals. Chromium-bearing artificial glasses have a characteristic green color, and adding nickel changes the color from green to yellow, brown, and purple, depending on its coordination and alkali content of the glass [29].
In Figure 9a, the composition of Sierra de las Navajas obsidians in terms of total iron (expressed as FeO) and silica has been compared with that of calc-alkaline black obsidians of Lipari (data from [30]) and with that of peralkaline obsidians of Pantelleria (data from [31]), for which several authors report a green or greenish color (e.g., [31,32,33]). The results seem to confirm a link between iron content and color: the black Lipari obsidians have a slightly lower FeOtot content than Sierra de las Navajas ones. In contrast, in the greenish obsidians of Pantelleria, the FeOtot content almost reaches 8 wt%. However, it has been demonstrated that the iron content alone does not completely explain the different colors displayed by obsidians, but it also depends on its redox state and on the arrangement of Fe atoms in the structure. In artificial colored glass, Fe3+ is not an efficient coloring agent, whereas Fe2+, although usually less abundant, gives a characteristic green coloration [29]. The black or dark brown color shown by most obsidians is explained with mixed valence iron clusters representing the beginning of an ordered structure around Fe atoms, which can be considered as precursors of ultrananolites of magnetite [34]. Therefore, the green color of the Sierra de las Navajas obsidians could be related to a higher content of ferrous iron and/or to a higher degree of disorder in the glassy structure. With the data here presented it is not possible to confirm this hypothesis.
The effect of other transition elements on colors is difficult to evaluate with available EMPA data, as both chromium and nickel are below or very close to the detection limit. Manganese can reduce the green color arising from iron because it oxidizes Fe2+ into Fe3+ [29]. In Figure 9b, where Manganese content is plotted versus total iron, it is evident that no relation exists between the two elements in the obsidians of Sierra de las Navajas. No data on this element are available for Pantelleria and Lipari obsidians.
Whatever the reason for the green color, common to all the Sierra de las Navajas obsidians, chemical composition cannot be considered the cause of the different aspects of the samples analyzed in this study. As evident from the diagrams of Figure 3 and Figure 9, the only significant difference in terms of chemical composition between the very dark, almost black sample SN-D and the very light green bands of sample SN-B is the alkalis content, which are not known as coloring agents. In addition, the light and dark green bands of the same sample have identical, though rather variable, composition in terms of iron and manganese.

7.2. Influence of Vesiculation on Obsidian Aspects

The SEM observations and the results of the X-rays microtomography clearly demonstrated that obsidians with different macroscopic aspects are characterized by different abundance, size, shape, and distribution of the vesicles.
The light incident on a medium containing round, homogeneous vesicles of dimensions comparable or higher than the wavelength is subject to Mie scattering, and this results in a lighter color with respect to the same non-vesiculated medium. This effect can also commonly be observed in obsidian lavas or pyroclasts containing vesicles of different sizes and shapes. In the Lipari Rocche Rosse lava flow, for instance, glassy, poorly, or non-vesiculated black obsidian layers are found alongside lighter, more volatile-rich material (“frothy obsidian”, with vesicularity = 30–60%) and portions with more or less evident pumiceous aspect [35]. An alternance of light and dark bands was also observed in the Mayor Island (New Zealand) obsidian and was related to different vesicularity, with the lighter bands corresponding to more vesiculated portions [36].
In the studied Sierra de las Navajas obsidian, the total vesicularity never exceeds 10%, a maximum value only reached in the most vesiculated bands of sample SN-B (see Figure 6a). These vesicle contents are low enough to maintain the obsidian-like macroscopic aspect, but significantly contribute to make the color lighter. The total vesiculation alone, however, cannot always explain the chromatic features of the studied obsidians, but the vesicles size, shape, and orientation with respect to the observed surface must also be considered.
The shape of the vesicles is not spherical, but they always appear variously elongated and flattened as an effect of the simple shear acting on the magma during the uplift in the conduit or while flowing on the surface [8]. Moreover, they often are iso-oriented along preferential planes or directions. In sample SN-A, the vesicles are abundant and show variable sizes, with the major axis sometimes reaching several hundreds of microns. The microtomography results show that, whereas most vesicles are iso-oriented with respect to the azimuth, the polar orientation is highly variable (Figure 7a). This means that most of the vesicles are mainly oriented with the major axes on preferential planes, roughly parallel to the natural breakage surface (see Figure 4a,b). However, vesicles are uniformly distributed on these planes and randomly oriented on them. This kind of disposition scatters the light homogeneously in all the directions, giving the homogeneous, almost “metallic” hue that characterizes this variety of obsidian. Moreover, the occurrence of numerous vesicles preferentially oriented on plane-parallel surfaces can be seen as the cause of the flat breakage surface, not common for obsidian glasses, usually showing conchoidal fracture.
Vesicles with a similar shape to SN-A occur on the light green, smooth natural breakage surface of sample SN-F (Figure 4h). In this case, however, they have a much smaller size (of the order of a few tens of micrometers), and they are much less abundant than in the previous case. Due to the insufficient resolution of the imaging system, it was not possible to analyze this sample by X-ray micro-CT to verify if the vesicles are oriented along preferential planes; however, the qualitative observation under SEM seems to confirm a preferential disposition of their major axis on planes parallel to the natural breakage surface, analogously to SN-A. The vesicles are randomly distributed and oriented on this surface. The hue of this sample is less homogeneous than sample SN-A and a changing golden shine can be appreciated when changing the angle of incidence of light on the surface. This difference is probably because in SN-F the vesicles only partially cover the surface and variously reflect and diffract the light. The size and abundance of vesicles are too low to promote the fracture along flat surfaces, and the natural fracture is conchoidal. The curved surface further extolls the effect of changing hue. On an orthogonal surface the vesicles appear strongly elongated and thin, with a minor axis of the order of a few micrometers. The low percentage of surface occupied by vesicles and their extremely low thickness have a negligible effect on light scattering, and the surface appears very dark, without any hue, smooth, and with perfect conchoidal fracture. The effect of absence of vesiculation is also well evident in sample SN-E, which does not show any hue and appears very dark, smooth, and with conchoidal fracture.
Samples SN-B and SN-D show bands with variable hue and color; the thickness of the bands is in the range of several millimeters in SN-B and of one or a few millimeters in SN-D. The vesicles of both samples are characterized by high flatness and elongation and show a marked iso-orientation in a preferential direction. Sample SN-B shows the lowest shape parameters and narrower ranges of polar and azimuthal orientations. However, the parameters that mainly differentiate the two samples are the vesicle size, higher in sample SN-B, and the total vesicularity (one order of magnitude higher in B). With respect to this last parameter, a strong variability has been observed inside the two samples, with an alternance of highly and poorly (or non-) vesiculated bands. In sample SN-B, the highly vesiculated bands (with total volume occupied by the vesicles up to 10%) intersect the surface at an angle of approximately 45° and result in very light-colored stripes with homogeneous gold shine. As in the case of sample SN-A, therefore, the high percentage of surface covered with vesicles highly scatters the light in all the directions; in this case, however, the section of the vesicles cut by the natural surface is elliptical (Figure 4c) and they are strongly iso- oriented in preferential directions. This does not promote the plane breakage surface and gives a higher roughness. The non-vesiculated portions on the surface of the obsidian appear very dark and smooth; transition zones with low vesicularity sometimes show a changing hue. A very similar aspect is shown by sample SN-D. As in the previous case, the concentration of vesicles in preferential bands reflects in alternating light (more vesiculated) and dark (poorly vesiculated) stripes (Figure 5c). In this case, however, the size of vesicles is so small that the surface always remains smooth. The single stripes are also very thin, so that, also in the more vesiculated ones, it is not possible to observe any change in the shine.

8. Conclusions

The integrated microanalytical and microtomographic study carried out in this work demonstrates that the peculiar macroscopic aspects of Sierra de las Navajas obsidians result from a combination of compositional and microtextural factors. Here the main chromatic features and their causes are summarized:
Color: the characteristic green color of these obsidians is probably related to the relatively high iron content. Data presented here do not allow us to infer the iron speciation and the distribution of iron in a partially ordered structure; however, we suggest that the green color could be related to a high Fe2+/Fe3+ ratio and/or to a high degree of disorder.
Color intensity: the lighter or darker shades of green shown by Sierra de las Navajas obsidians are mainly a function of the proportion of the observed surface occupied by vesicles. This, in turn, depends on the total vesicularity of the sample, the vesicles’ shape, and their orientation on the observed surface. The iso-orientation of stretched vesicles along preferential planes or directions and their distribution in bands causes different color effects on differently oriented surfaces. The same sample appears very dark on surfaces orthogonal to the direction of elongation of the vesicles and lighter if they are parallel to the preferential planes of vesicles distribution (e.g., sample SN-F). Very dark colors are also shown by poorly vesiculated samples (SN-E). The striped aspect of some obsidians, showing an alternance of lighter and darker bands, reflects the distribution of vesicles in preferential bands orthogonal or forming a high angle with the observed surface (samples SN-B and SN-D).
Hue: except for the very dark, almost black obsidians, all the samples show a characteristic golden hue. Also in this case, the main cause of the variously changing hue is the abundance of vesicles on the observed surface. High concentration of coarse vesicles (size of the order of hundreds of micrometers) scatter the light homogeneously in all the directions, giving a uniform hue (Sample SN-A and light bands of SN-B). In contrast, lower concentrations favor the formation of variable hue, changing with the angle of incident light (SN-F). When the percentage of surface covered by vesicles is close to zero, no hue is visible.
It is therefore vesicularity, rather than chemical composition, that mainly determines the differences in hue and color intensity of samples from the same lava flow.
In addition to determining the color intensity and hue, the occurrence of vesicles also influences the fracture of obsidian (abundant, flat vesicles oriented on preferential planes determine the fracture along flat, rather than conchoidal surfaces), increases their roughness, and lowers their transparency. All of these vesiculation-related features are the main factors determining the use of obsidians by ancient and modern populations. In particular, the dark, not- or poorly vesiculated variety was preferred to make weapons and cutting tools, because its homogeneity and conchoidal fracture helps in obtaining very sharp edges. In contrast, for the realization of ritual or religious objects and jewels, the vesiculated obsidian, with a brighter green color and charming hues was mainly used [11]. The observation of several pre-Hispanic blades and the experimental knapping workshop revealed that changing the direction of knapping of obsidian cores can change the difficulty in obtaining regular sharp edges. We suggest that this can be due to the occurrence of a high number of iso-oriented vesicles that inhibit the propagation of fractures in the vitric matrix, particularly if they are displaced orthogonally to the knapping direction. Further microtextural and experimental studies are necessary to confirm this hypothesis.
It is beyond the scope of this paper to discuss the processes of formation and emplacement of obsidians; however, it is worth noting that the vesicles size, geometry, and orientation can provide information on the stress regime (pure shear or simple shear) and on time scales and mechanisms of magma ascent and eruptive dynamics (e.g., [8,35]). Post-emplacement processes, such as hydration and devitrification, are also strongly influenced by vesicularity. Data presented here confirm that X-ray micro-CT provides a detailed sight of the 3D shape and inner distribution of the vesicle and can therefore be an invaluable tool for studies aimed at reconstructing the pre- and post-eruptive history of obsidians.

Supplementary Materials

The following are available online at https://zenodo.org/record/5828418#.YdiEaGjMKUk, Figure S1: probability density function of the log10 of the vesicle volume for each sample, Table S1: full set of EPMA microanalyses, Video S1: Sample SN-A: volume rendering of vesicles and bulk sample, Video S2: Sample SN-B: volume rendering of vesicles and bulk sample; Video S3: Sample SN-D: volume rendering of vesicles and bulk sample.

Author Contributions

Conceptualization, P.D., R.F., S.D. and M.C.C.; methodology, P.D., R.F., S.D. and M.C.C.; formal analysis, P.D., R.F., S.D. and M.C.C.; Investigation: sampling, P.D., G.N. and A.P.; SEM and EPMA analysis, M.D. and P.D.; microtomography acquisition, R.F., M.C.C., A.S. and V.F.; microtomography data analysis, A.S. and M.C.C.; resources, R.D.R., L.B., G.M.C. and V.F.; data curation, P.D., R.F., S.D. and M.C.C.; writing—original draft preparation, P.D.; writing—review and editing, S.D., A.P. and M.D.; visualization, P.D., R.F., S.D., M.C.C. and G.N.; supervision, S.D. and P.D.; project administration, P.D. and S.D.; funding acquisition, R.D.R., L.B. and G.M.C. All authors have read and agreed to the published version of the manuscript.

Funding

This research was partially funded by Ministero degli Affari Esteri-MAE, Italy, in the framework of the scientific project “Messa a punto di nuove procedure analitiche LA-ICP-MS per l’individuazione della provenienza delle materie prime usate nell’edilizia storico-archeologica di monumenti precolombiani del Messico” (2011–2013), carried out by the University of Calabria and the National Autonomous University of Mexico.

Data Availability Statement

All the new data obtained in this research are contained in the article or in the supplementary material (available at: https://zenodo.org/record/5828418#.YdiEaGjMKUk (accessed on 1 January 2022)).

Acknowledgments

S.D. has been supported by the “AIM: Attraction and International Mobility”-PON R&I 2014–2020 Calabria. The authors thank two anonymous reviewers for their useful comments.

Conflicts of Interest

The authors declare no conflict of interest. The funders had no role in the design of the study; in the collection, analyses, or interpretation of data; in the writing of the manuscript, or in the decision to publish the results.

References

  1. Glascock, M.D.; Braswell, G.E.; Cobean, R.H. A systematic approach to obsidian source characterization. In Archaeological Obsidian Studies; Springer: Boston, MA, USA, 1998. [Google Scholar]
  2. Ambroz, J.A.; Glascock, M.D.; Skinner, C.E. Chemical differentiation of obsidian within the Glass Buttes Complex, Oregon. J. Archaeol. Sci. 2001, 28, 741–746. [Google Scholar] [CrossRef] [Green Version]
  3. Dolan, S.G.; Shackley, M.S. Is there mahogany obsidian in Northeastern Sonora, Mexico? IAOS Bull. 2017, 56, 11–17. [Google Scholar]
  4. Kasztovszky, Z.; Lázár, K.; Kis, V.K.; Len, A.; Füzi, J.; Markó, A.; Biró, K.T. A novel approach in the mineralogy of Carpathian mahogany obsidian using complementary methods. Quat. Int. 2018, 467, 332–341. [Google Scholar] [CrossRef]
  5. Ma, C.; Rossman, G.R.; Miller, J.A. The origin of color in “fire” obsidian. Can. Mineral. 2007, 45, 551–557. [Google Scholar] [CrossRef] [Green Version]
  6. Davì, M.; De Rosa, R.; Donato, P.; Sulpizio, R. The Lami pyroclastic succession (Lipari, Aeolian Islands): A clue for unravelling the eruptive dynamics of the Monte Pilato rhyolitic pumice cone. J. Volcanol. Geotherm. Res. 2011, 201, 285–300. [Google Scholar] [CrossRef]
  7. Donato, P.; Barba, L.; De Rosa, R.; Niceforo, G.; Pastrana, A.; Donato, S.; Lanzafame, G.; Mancini, L.; Crisci, G.M. Green, grey and black: A comparative study of Sierra de Las Navajas (Mexico) and Lipari (Italy) obsidians. Quat. Int. 2018, 467, 369–390. [Google Scholar] [CrossRef]
  8. Rust, A.C.; Cashman, K.V. Multiple origins of obsidian pyroclasts and implications for changes in the dynamics of the 1300 B.P. eruption of Newberry volcano, USA. Bull. Volcanol. 2007, 69, 825–845. [Google Scholar] [CrossRef]
  9. Ponomarenko, A.L. The Pachuca obsidian source, Hidalgo, Mexico: A geoarchaeological perspective. Geoarchaeology Int. J. 2004, 19, 71–91. [Google Scholar] [CrossRef]
  10. Argote-Espino, D.; Solé, J.; López-García, P.; Sterpone, O. Obsidian subsource identification in the Sierra de Pachuca and Otumba volcanic regions, Central Mexico, by ICP-MS and DBSCAN statistical analysis. Geoarchaeology 2012, 27, 48–62. [Google Scholar] [CrossRef]
  11. Donato, P.; Barba, L.; Crocco, M.C.; Davoli, M.; De Rosa, R.; Donato, S.; Filosa, R.; Lanzafame, G.; Niceforo, G.; Pastrana, A.; et al. Study of the micro-vesiculation of the obsidian source of Sierra de Las Navajas (State of Hidalgo, Mexico). In Inventaria Praehistorica Hungariae (IPH XIV)-beyond the Glass Mountains-Papers Presented for the 2019 International Obsidian Conference 27–29 May 2019; Biró, K.T., Markó, A., Eds.; Magyar Nemzeti Múzeum: Budapest, Hungary, 2019; pp. 9–18. [Google Scholar]
  12. Argote-Espino, D.; Solé, J.; Sterpone, O.; López-García, P. Análisis composicional de seis yacimientos de obsidiana del centro de México y su clasificación con DBSCAN. Arqueol. Segunda Época 2010, 43, 197–215. [Google Scholar]
  13. Tenorio, D.; Cabral, A.; Bosch, P.; Jiménez-Reyes, M.; Bulbulian, S. Differences in coloured obsidians from Sierra de Pachuca, Mexico. J. Archaeol. Sci. 1998, 25, 229–234. [Google Scholar] [CrossRef]
  14. Cantagrel, J.M.; Robin, C. K-Ar dating on Eastern Mexican volcanic rocks-relations between the andesitic and the alkaline provinces. J. Volcanol. Geotherm. Res. 1979, 5, 99–114. [Google Scholar] [CrossRef]
  15. García-Barcena, J. Las minas de obsidiana de La Sierra Las Navajas, Hidalgo, México. In XLI Congreso Internacional de Americanistas 1; Comas, J., Ed.; Instituto Nacional de Antropología e Historia: Ciudad de México, Mexico, 1975; pp. 369–377. [Google Scholar]
  16. Pastrana, A. La explotación Azteca de la Obsidiana en la Sierra de Las Navajas; Instituto Nacional de Antropología e Historia: Ciudad de México, Mexico, 1998. [Google Scholar]
  17. Nelson, S.A.; Lighthart, A. Field excursion to the Sierra Las Navajas, Hidalgo, Mexico—A Pleistocene peralkaline rhyolite complex with a large debris avalanche deposit. In II Convención sobre la Evolución Geologica de México y Recursos Asociados. Libro-guía de las Excursiones Geológicas; Universidad Autónoma de Hidalgo, Instituto de Investigaciones en Ciencias de la Tierra: Pachuca, Mexico, 1997; pp. 89–96. [Google Scholar]
  18. Cobean, R.H.; Vogt, J.R.; Glascock, M.D.; Stocker, T.L. High-precision trace-element characterization of major mesoamerican obsidian sources and further analyses of artifacts from San Lorenzo Tenochtitlan, Mexico. Lat. Am. Antiq 1991, 2, 69–91. [Google Scholar] [CrossRef]
  19. Hirth, K.G. Experimentation and interpretation in mesoamerican lithic technology. In Mesoamerican Lithic Technology: Experimentation and Interpretation; University of Utah Press: Salt Lake City, UT, USA, 2003. [Google Scholar]
  20. Pastrana, A.; Athie, I. The symbolism of obsidian in postclassic central mexico. In Obsidian Reflections: Symbolic Dimensions of Obsidian in Mesoamerica; University Press of Colorado: Boulder, CO, USA, 2014. [Google Scholar]
  21. Pastrana, A.; Domínguez, S. Cambios en la estrategia de la explotación de la obsidiana de Pachuca: Teotihuacan, Tula y la triple alianza. Anc. Mesoam. 2009, 20, 129–148. [Google Scholar] [CrossRef]
  22. Pastrana, A.; Fournier, P. Explotación colonial de obsidiana en el yacimiento de Sierra de Las Navajas. In Primer Congreso Nacional de Arqueología Histórica; Davila, E.F., Gomez Serafin, S., Eds.; Conaculta-INAH: Ciudad de México, Mexico, 1998; pp. 486–496. [Google Scholar]
  23. Pastrana Cruz, A.; Fournier Garcìa, P.; Parry, W.J.; Otis Charlton, C.L. Obsidian production and use in Central Mexico after the Spanish invasion. In Technology and Tradition in Mesoamerica after the Spanish Invasion; Alexander, R.T., Ed.; University of New Mexico Press: Albuquerque, Mexico, 2019; pp. 15–33. [Google Scholar]
  24. Feldkamp, L.A.; Davis, L.C.; Kress, J.W. Practical cone-beam algorithm. J. Opt. Soc. Am. 1984, 1, 612–619. [Google Scholar] [CrossRef] [Green Version]
  25. Otsu, N. A Threshold selection method from gray-level histograms. IEEE Trans. Syst. Man Cybern. 1979, 9, 62–66. [Google Scholar] [CrossRef] [Green Version]
  26. MacDonald, R. Nomenclature and petrochemistry of the peralkaline oversaturated extrusive rocks. Bull. Volcanol. 1974, 38, 498–516. [Google Scholar] [CrossRef]
  27. Maniar, P.D.; Piccoli, P.M. Tectonic discrimination of granitoids. Geol. Soc. Am. Bull. 1989, 101, 635–643. [Google Scholar] [CrossRef]
  28. Eilers, P.H.C.; Goeman, J.J. Enhancing scatterplots with smoothed densities. Bioinformatics 2004, 20, 623–628. [Google Scholar] [CrossRef]
  29. Calas, G.; Galoisy, L.; Cormier, L. The color of glass. In Encyclopedia of Glass Science, Technology, History, and Culture; Richet, P., Ed.; Wiley-American Ceramic Society: Hoboken, NJ, USA, 2020. [Google Scholar]
  30. Foresta Martin, F.; Rotolo, S.G.; Nazzari, M.; Carapezza, M.L. Chlorine as a discriminant element to establish the provenance of central Mediterranean obsidians. Open Archaeol. 2020, 6, 454–476. [Google Scholar] [CrossRef]
  31. Rotolo, S.G.; Carapezza, M.L.; Correale, A.; Martin, F.F.; Hahn, G.; Hodgetts, A.G.E.; la Monica, M.; Nazzari, M.; Romano, P.; Sagnotti, L.; et al. Obsidians of Pantelleria (Strait of Sicily): A petrographic, geochemical and magnetic study of known and new geological sources. Open Archaeol. 2020, 6, 434–453. [Google Scholar] [CrossRef]
  32. Acquafredda, P.; Andriani, T.; Lorenzoni, S.; Zanettin, E. Chemical characterization of obsidians from different Mediterranean sources by non-destructive SEM-EDS analytical method. J. Archaeol. Sci. 1999, 26, 315–325. [Google Scholar] [CrossRef]
  33. Foresta Martin, F.; Di Piazza, A.; D’Oriano, C.; Carapezza, M.L.; Paonita, A.; Rotolo, S.G.; Sagnotti, L. New insights into the provenance of the obsidian fragments of the island of Ustica (Palermo, Sicily). Archaeometry 2017, 59, 435–454. [Google Scholar] [CrossRef]
  34. Galoisy, L.; Calas, G. The unique speciation of iron in calc-alkaline obsidians. Chem. Geol. 2021, 559, 119925. [Google Scholar] [CrossRef]
  35. Shields, J.K.; Mader, H.M.; Caricchi, L.; Tuffen, H.; Mueller, S.; Pistone, M.; Baumgartner, L. Unravelling textural heterogeneity in obsidian: Shear-induced outgassing in the Rocche Rosse flow. J. Volcanol. Geotherm. Res. 2016, 310, 137–158. [Google Scholar] [CrossRef] [Green Version]
  36. Gonnermann, H.M.; Manga, M. Flow banding in obsidian: A record of evolving textural heterogeneity during magma deformation. Earth Planet. Sci. Lett. 2005, 236, 135–147. [Google Scholar] [CrossRef]
Figure 1. (a) The trans-Mexican volcanic belt (File: Eje Neovolcánico Mexico.jpg-Wikimedia Commons, author: Soleincitta, file licensed under the Creative Commons Attribution-Share Alike 3.0 Unported license). The star indicates the position of Sierra de las Navajas volcano. (b) Geological map of the area of Sierra de Las Navajas. Redrawn on the basis of the map of [9]. Topographic background obtained by shapefiles provided by INEGI of Pachuca (Hidalgo). The red square indicates the sampling point.
Minerals 12 00177 g001
Figure 2. Macroscopic aspect of analyzed samples. (a) Sample SN-A. Note the flat surface, the green color, and the homogeneous, “metallic” hue. The microscopic observations and microanalyses were conducted on the upper surface of the smaller fragment. (b) Sample SN-B showing alternating dark and light bands with different roughness. In the inset, the small fragment used for microscopic observation and microanalysis. (c) Sample SN-D, smooth and with thin bands of different colors. (d) Sample SN-E. Note the absence of hue and the green color, visible only on the thinner edges. (e) Sample SN-F, homogeneously green with changing golden hue. Microscopic observations and microanalyses conducted on the upper surface. (f) Sample SN-F. Surface artificially hammered, roughly orthogonal to the surface shown in (e). Note the different, darker color.
Minerals 12 00177 g002
Figure 4. SEM images of the analyzed samples. (a) Sample SN-A, secondary electrons (SE) image in which the rough surface with several flat vesicles is visible; (b) sample SN-A (SE image), detail of one of the “multilayer” flat vesicles; (c) sample SN-B, back-scattered electron (BSE) image. Panoramic view showing the alternation of highly vesiculated bands, corresponding to the light green zones in the macroscopic sample, and non-vesiculated bands, corresponding to dark green, smooth zones; (d) sample SN-B, SE image. Detail of the iso-oriented elliptical vesicles of different size in one of the highly vesiculated bands; (e) sample SN-B, SE image. Plastically deformed, elongated vesicles; (f) sample SN-D, SE image. Iso-oriented elliptical vesicles concentrated in thin bands corresponding to the light green stripes of the macroscopic sample; (g) sample SN-E, BSE image. Rare zone of the sample’s surface with sparse vesicles with irregular shape; (h) sample SN-F, BSE image. Very flat, irregular vesicles on the green surface with golden hue; (i) sample SN-F, BSE image. Dark surface orthogonal to the natural fracture surface. In this direction, the shape of the vesicles is highly elongated and most of the vesicles are iso-oriented.
Minerals 12 00177 g004
Figure 5. 3D renderings obtained from X-ray microtomography analysis. (a) Sample SN-A. Volume rendering of vesicles (left) and bulk sample (right). The natural breakage surface, on which the microanalysis and microscopic observation were carried out, is also indicated; (b) sample SN-B. Integrated volume rendering of vesicles and bulk sample. The natural breakage surface is also indicated. Note the arrangement of vesicles in bands oriented at c. 45° with respect to the external surface; (c) sample SN-D. Volume rendering of vesicles (left) and of bulk sample (center) and macroscopic view of the sample used for X-ray microtomography. Dots with the same color indicate the same point on the three images (red dots: highly vesiculated band, light green in the macroscopic sample; blue dots: poorly vesiculated band, dark green in the macroscopic sample). In all the figures the reference system used to calculate azimuthal (φ) and polar (θ) directions is shown. The two angles are illustrated in the inset.
Minerals 12 00177 g005
Figure 6. Variation of total vesicularity, expressed as vesicles volume fraction, in a direction orthogonal to the bands (z axes in Figure 5). A moving average was used to slightly smooth the plot. (a) Sample SN-B; (b) sample SN-D. The green shaded areas in each plot indicate the corresponding light green color regions in the macroscopic sample.
Minerals 12 00177 g006
Figure 7. Scatterplot of the azimuthal and polar orientation of the major axes of the vesicles. The reference system is shown in Figure 5. A density function has been overlapped to the scatter plots to highlight the preferential orientation(s). Yellow indicates the highest concentration of points, blue the lowest. (a) Sample SN-A; (b) sample SN-B; (c) sample SN-D.
Minerals 12 00177 g007
Figure 8. Vesicles’ flatness vs. elongation scatter diagrams. In the diagrams of the left panels a density function has been overlapped. Yellow indicates the highest concentration of points, blue the lowest. In the diagrams on the right the different colors indicate different vesicles’ size (expressed as base 10 logarithm of the volume). (a,b): Sample SN-A; (c,d): sample SN-B; (e,f): sample SN-D.
Minerals 12 00177 g008
Figure 9. (a) FeOtot vs. silica diagram for Sierra de las Navajas (this work), Pantelleria (data from [31]), and Lipari (data from [30]) obsidians; (b) MnO vs. FeOtot diagram.
Minerals 12 00177 g009
Table 1. Average composition of obsidian glass obtained by EPMA.
SN-A (14)SN-B Light (8)SN-B Dark (16)SN-D (16)SN-E (16)SN-F (10)
wt%st. dev.wt%st. dev.wt%st. dev.wt%st. dev.wt%st. dev.wt%st. dev.
SiO276.500.2277.360.4077.030.2976.610.2876.130.2676.690.23
Al2O311.400.1511.280.1511.180.1111.370.1011.370.1311.190.08
TiO20.230.090.080.080.190.090.130.080.120.070.090.08
Fe2O32.090.101.920.111.920.091.900.131.970.152.010.13
MnO0.140.040.150.030.130.030.140.040.150.030.150.02
MgO0.060.010.050.010.050.010.060.020.050.020.060.01
CaO0.000.000.000.000.000.000.000.000.000.000.000.00
Na2O4.820.234.490.344.820.115.060.175.380.405.060.15
K2O4.500.084.410.064.410.064.480.064.590.124.500.04
Cl0.220.020.200.020.200.030.200.020.200.020.200.03
P2O50.010.020.010.010.010.010.010.020.010.020.010.01
Cr2O30.020.020.030.040.020.020.020.030.010.010.010.01
BaO0.010.020.020.030.030.040.030.060.010.030.030.04
Table 2. Volume, orientation and shape parameters of vesicles.
SampleTotal
Vesicularity (%)
Vesicles
Volume (mm3)
Azimuthal Orientation φ (°)Polar
Orientation θ (°)
Elongation EFlatness F
ModeMode1Mode2Mode3ModeAvsAvs
SN-A0.702.8 × 104−112.572.5 65.50.440.150.380.19
SN-B3.704.5 × 104−132.547.5 87.50.250.100.220.24
SN-D0.342.8 × 104−157.5177.5−7.587.50.490.160.460.25
Publisher’s Note: MDPI stays neutral with regard to jurisdictional claims in published maps and institutional affiliations.

