


Multi-Dimensional Data Fusion for Mineral Prospectivity Mapping (MPM) Using Fuzzy-AHP Decision-Making Method, Kodegan-Basiran Region, East Iran
 ,
,  and
and 
Abstract
:1. Introduction

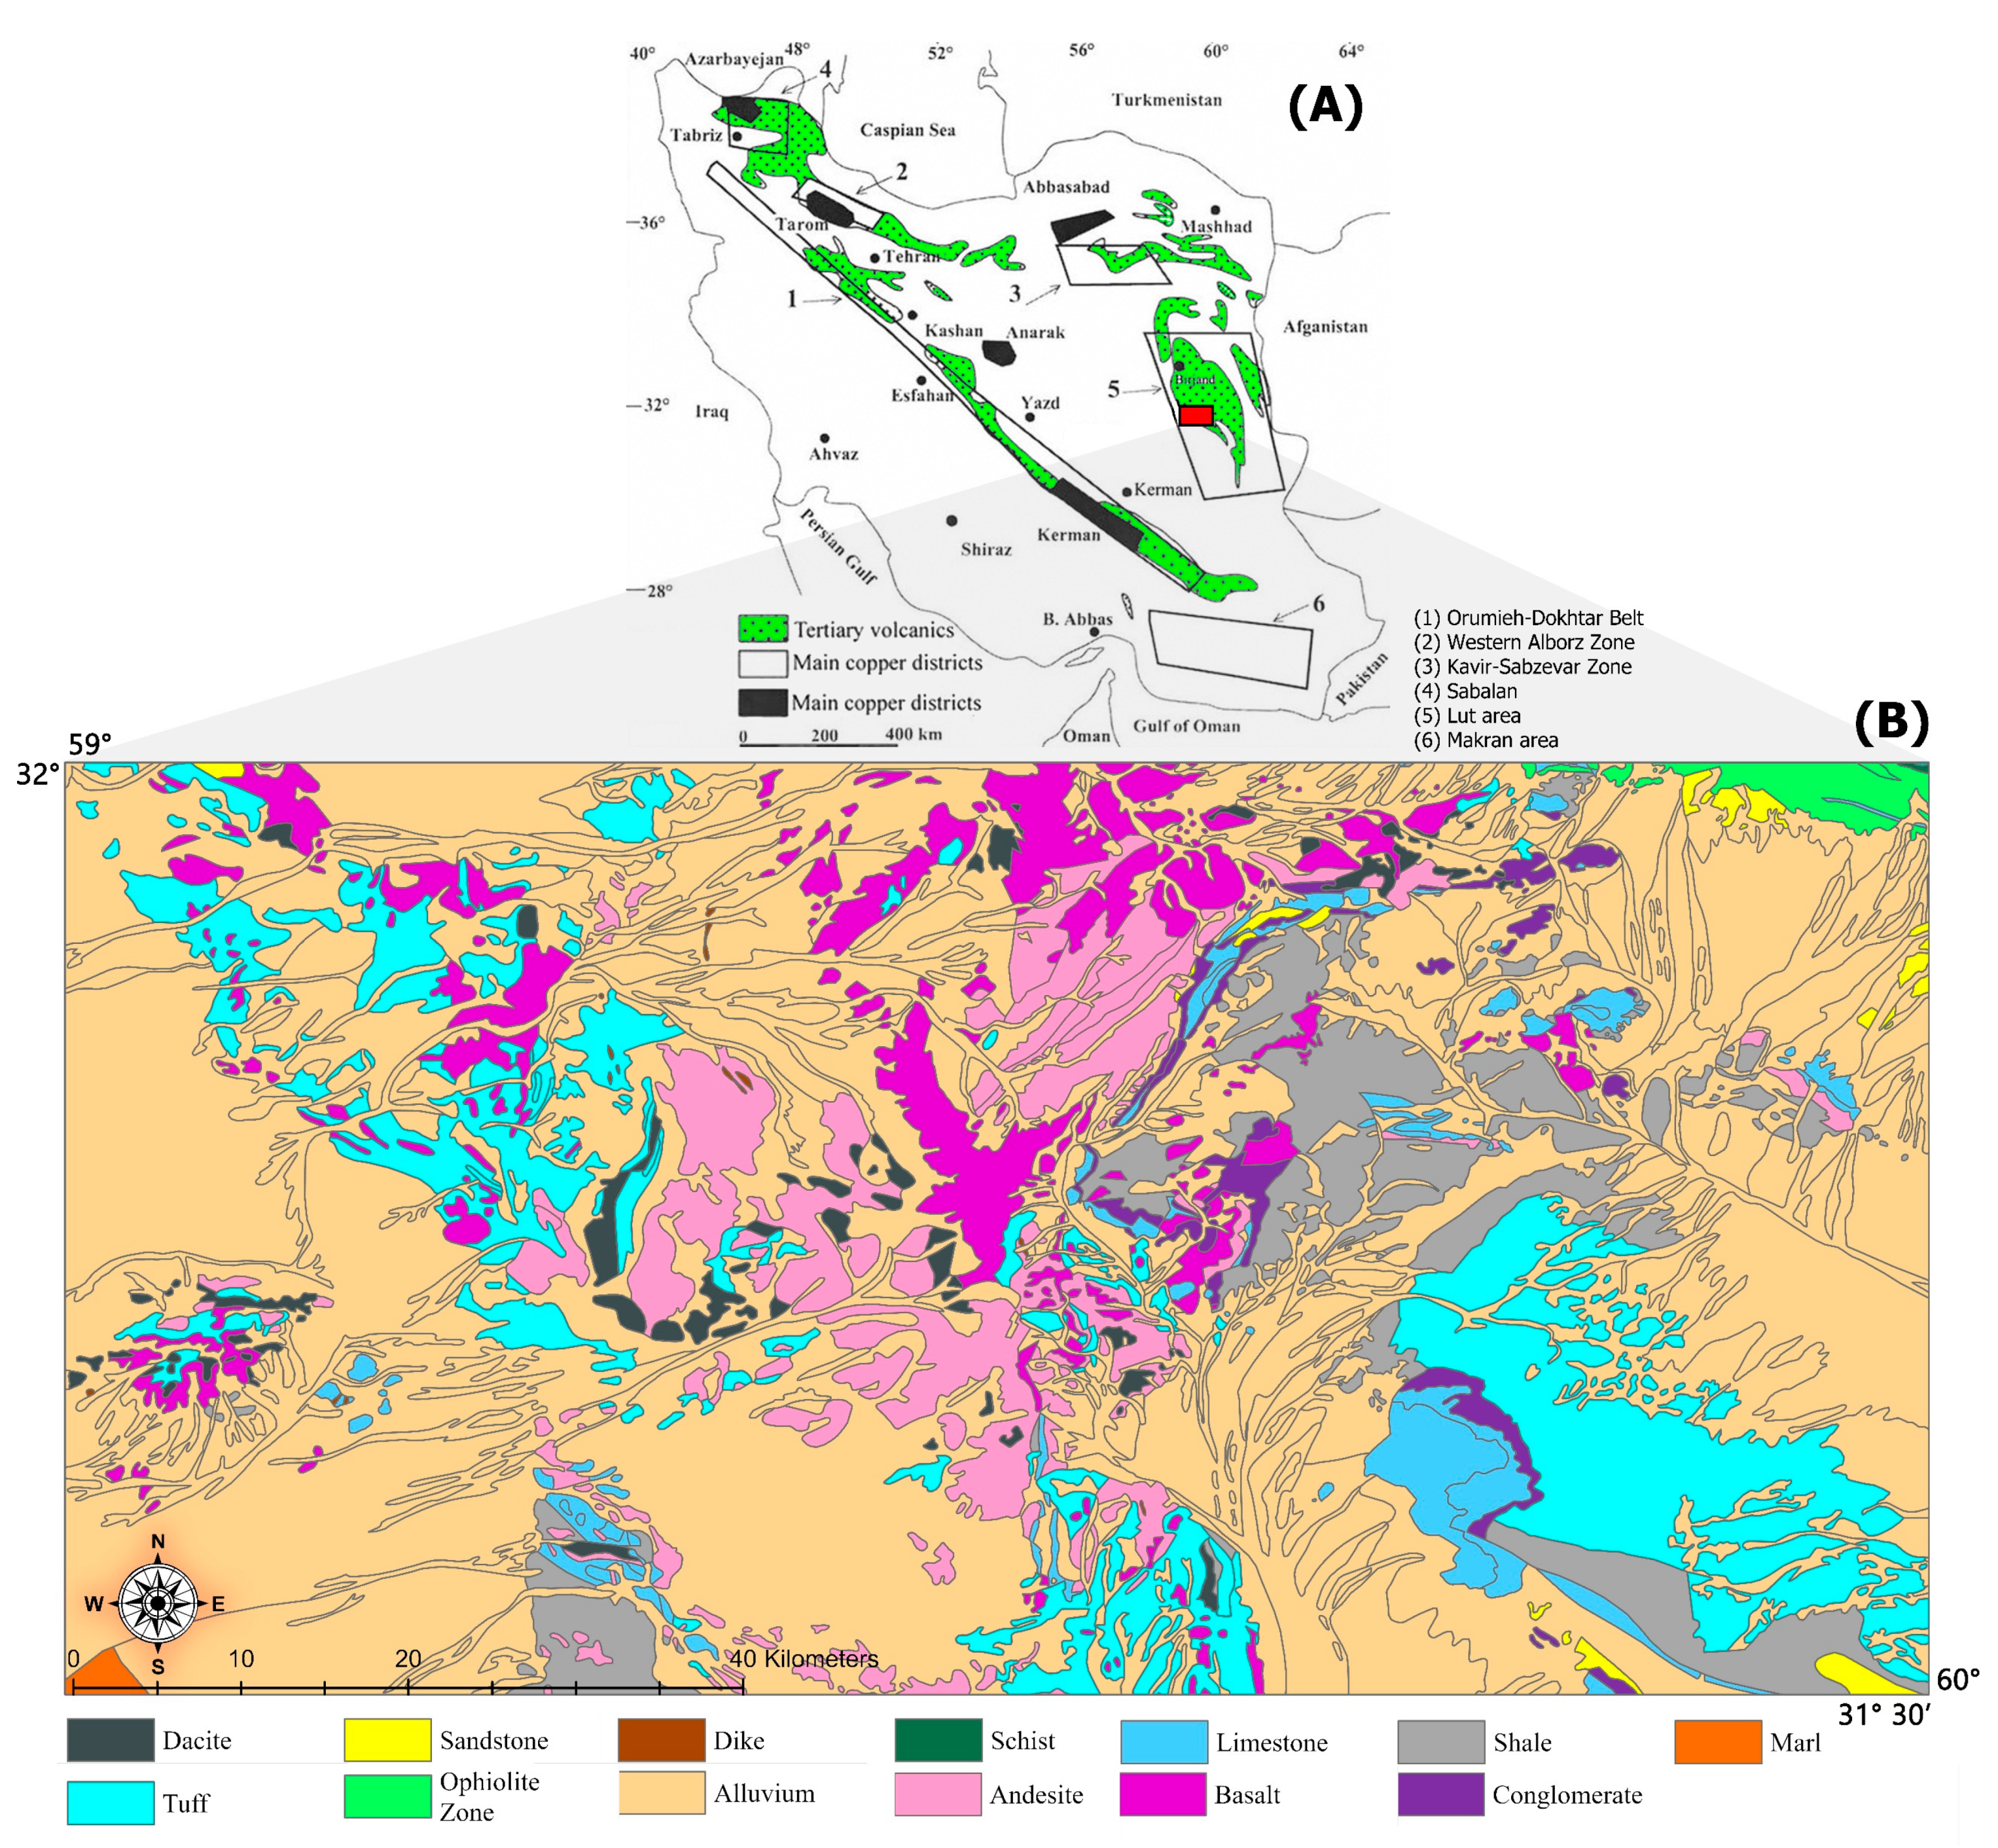
2. Geological Setting
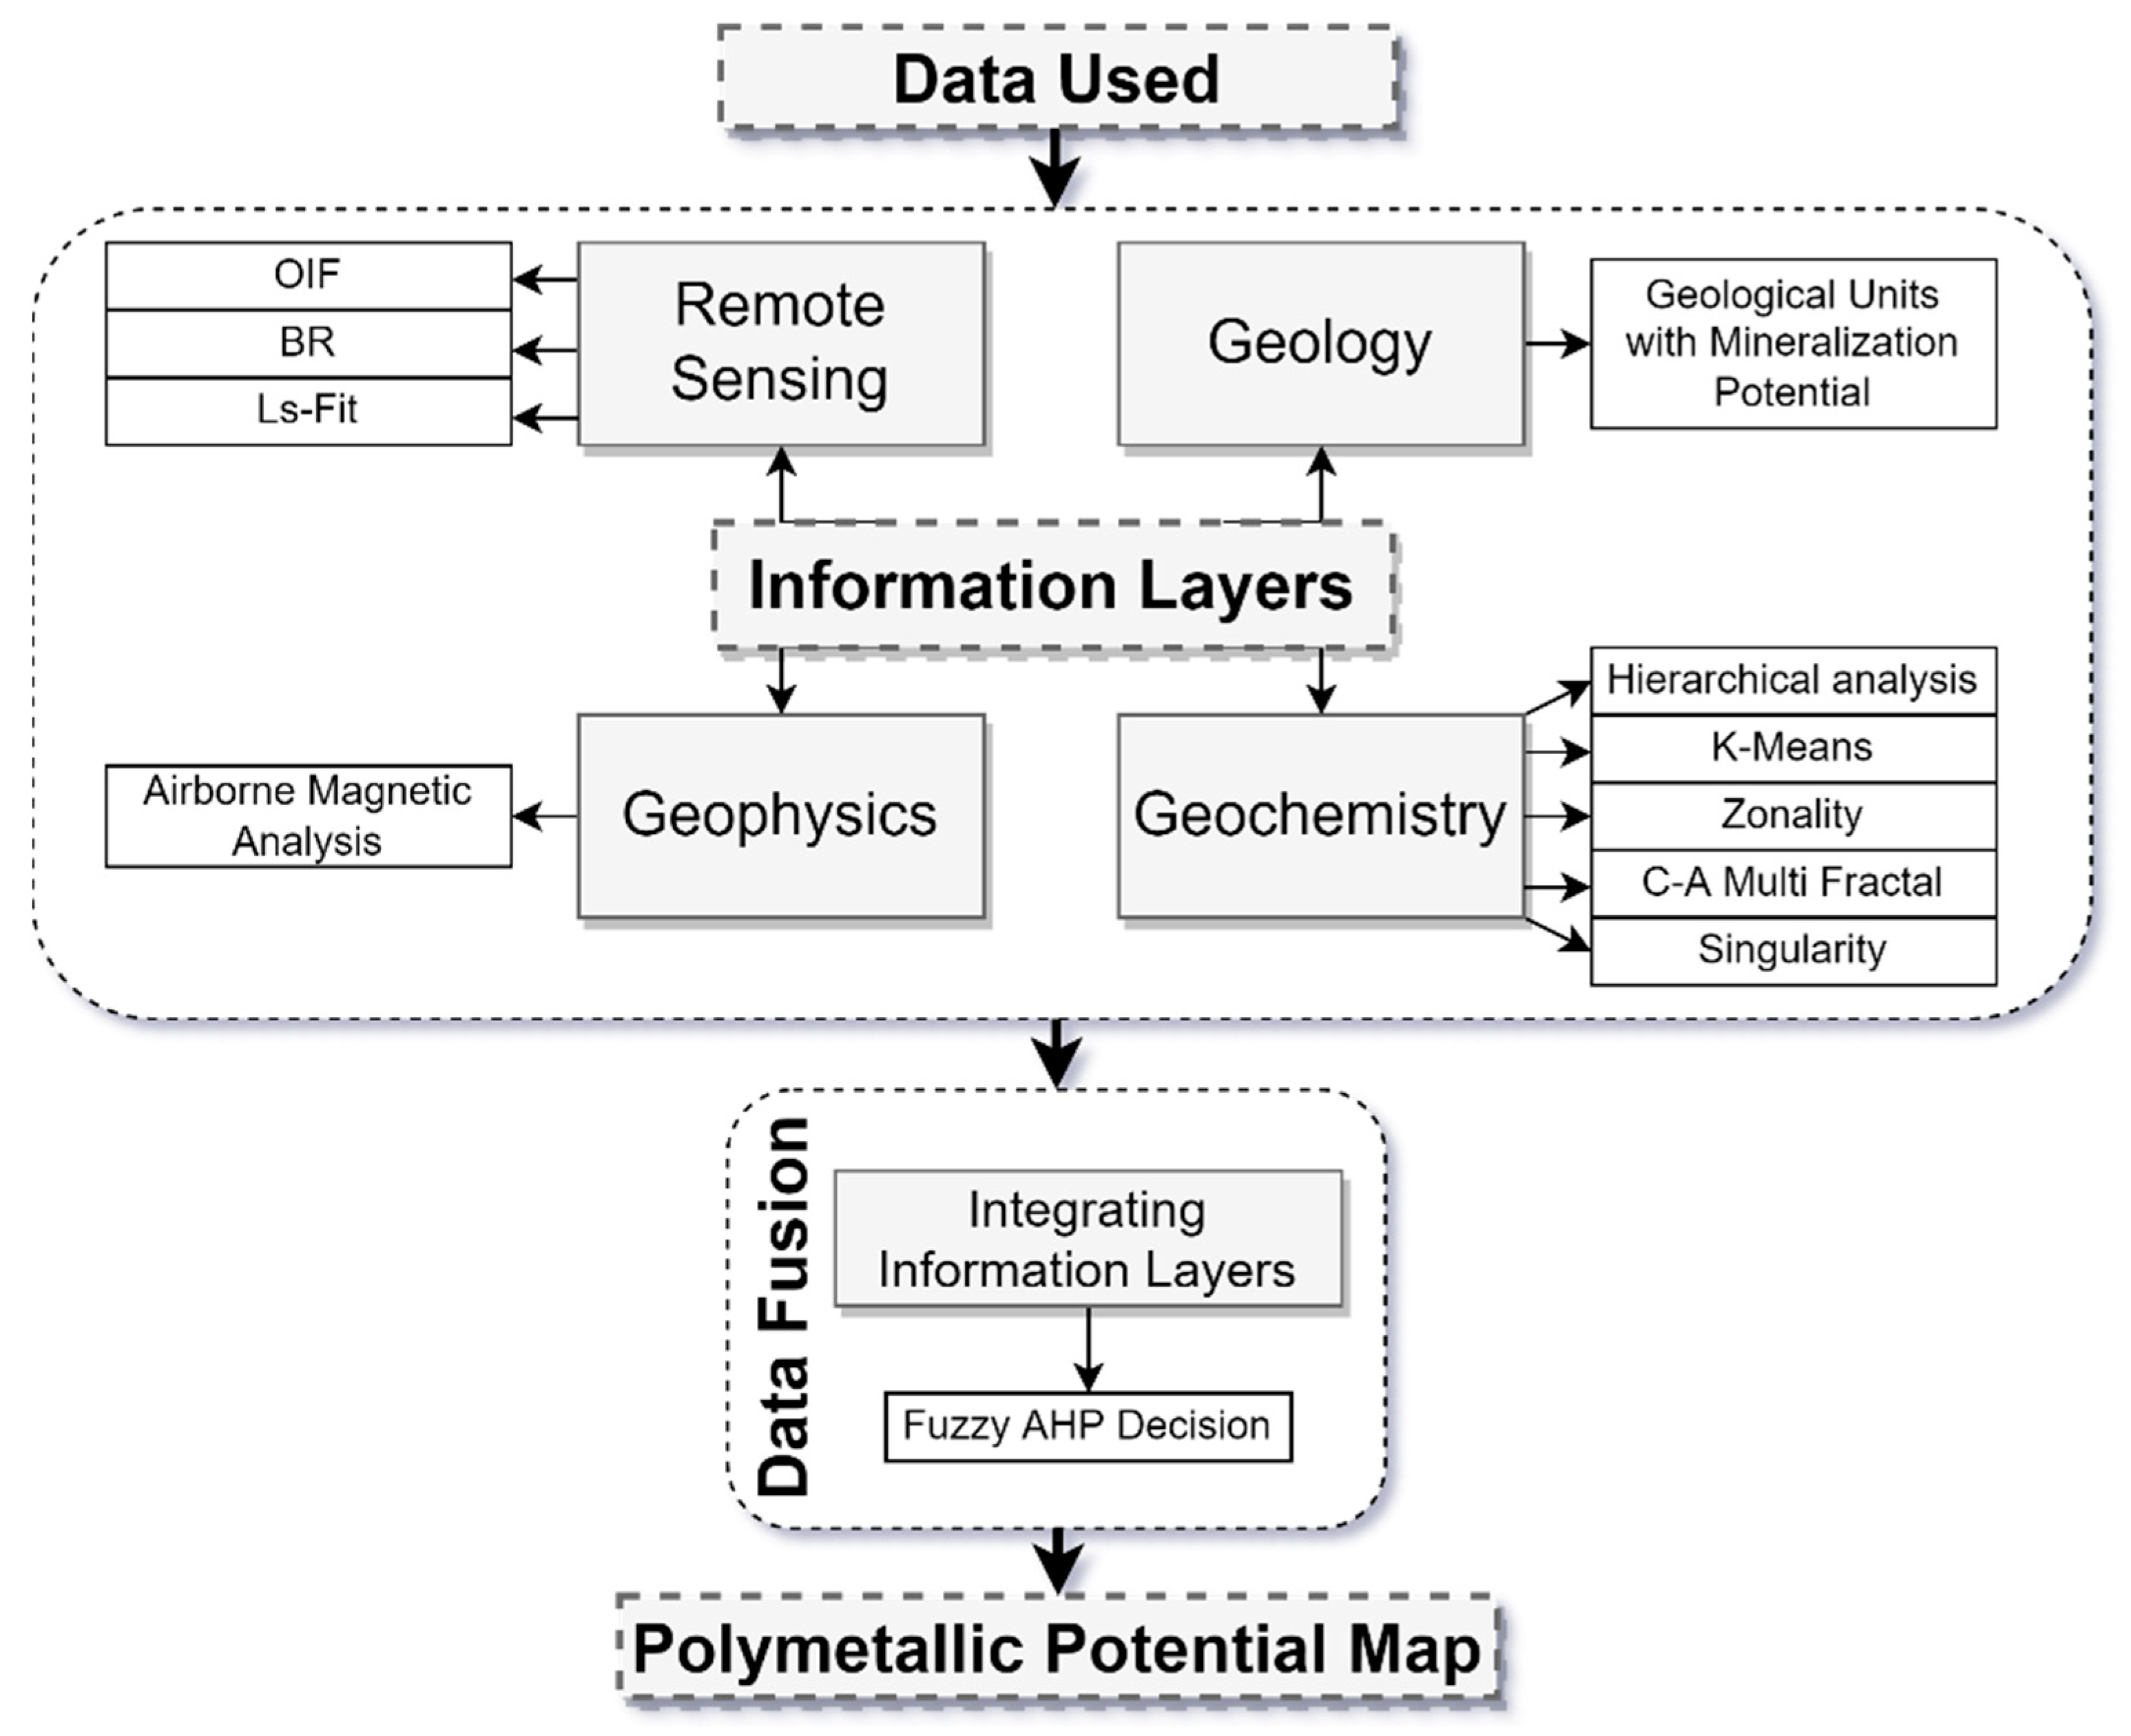
3. Materials and Methods
3.1. Raw Data
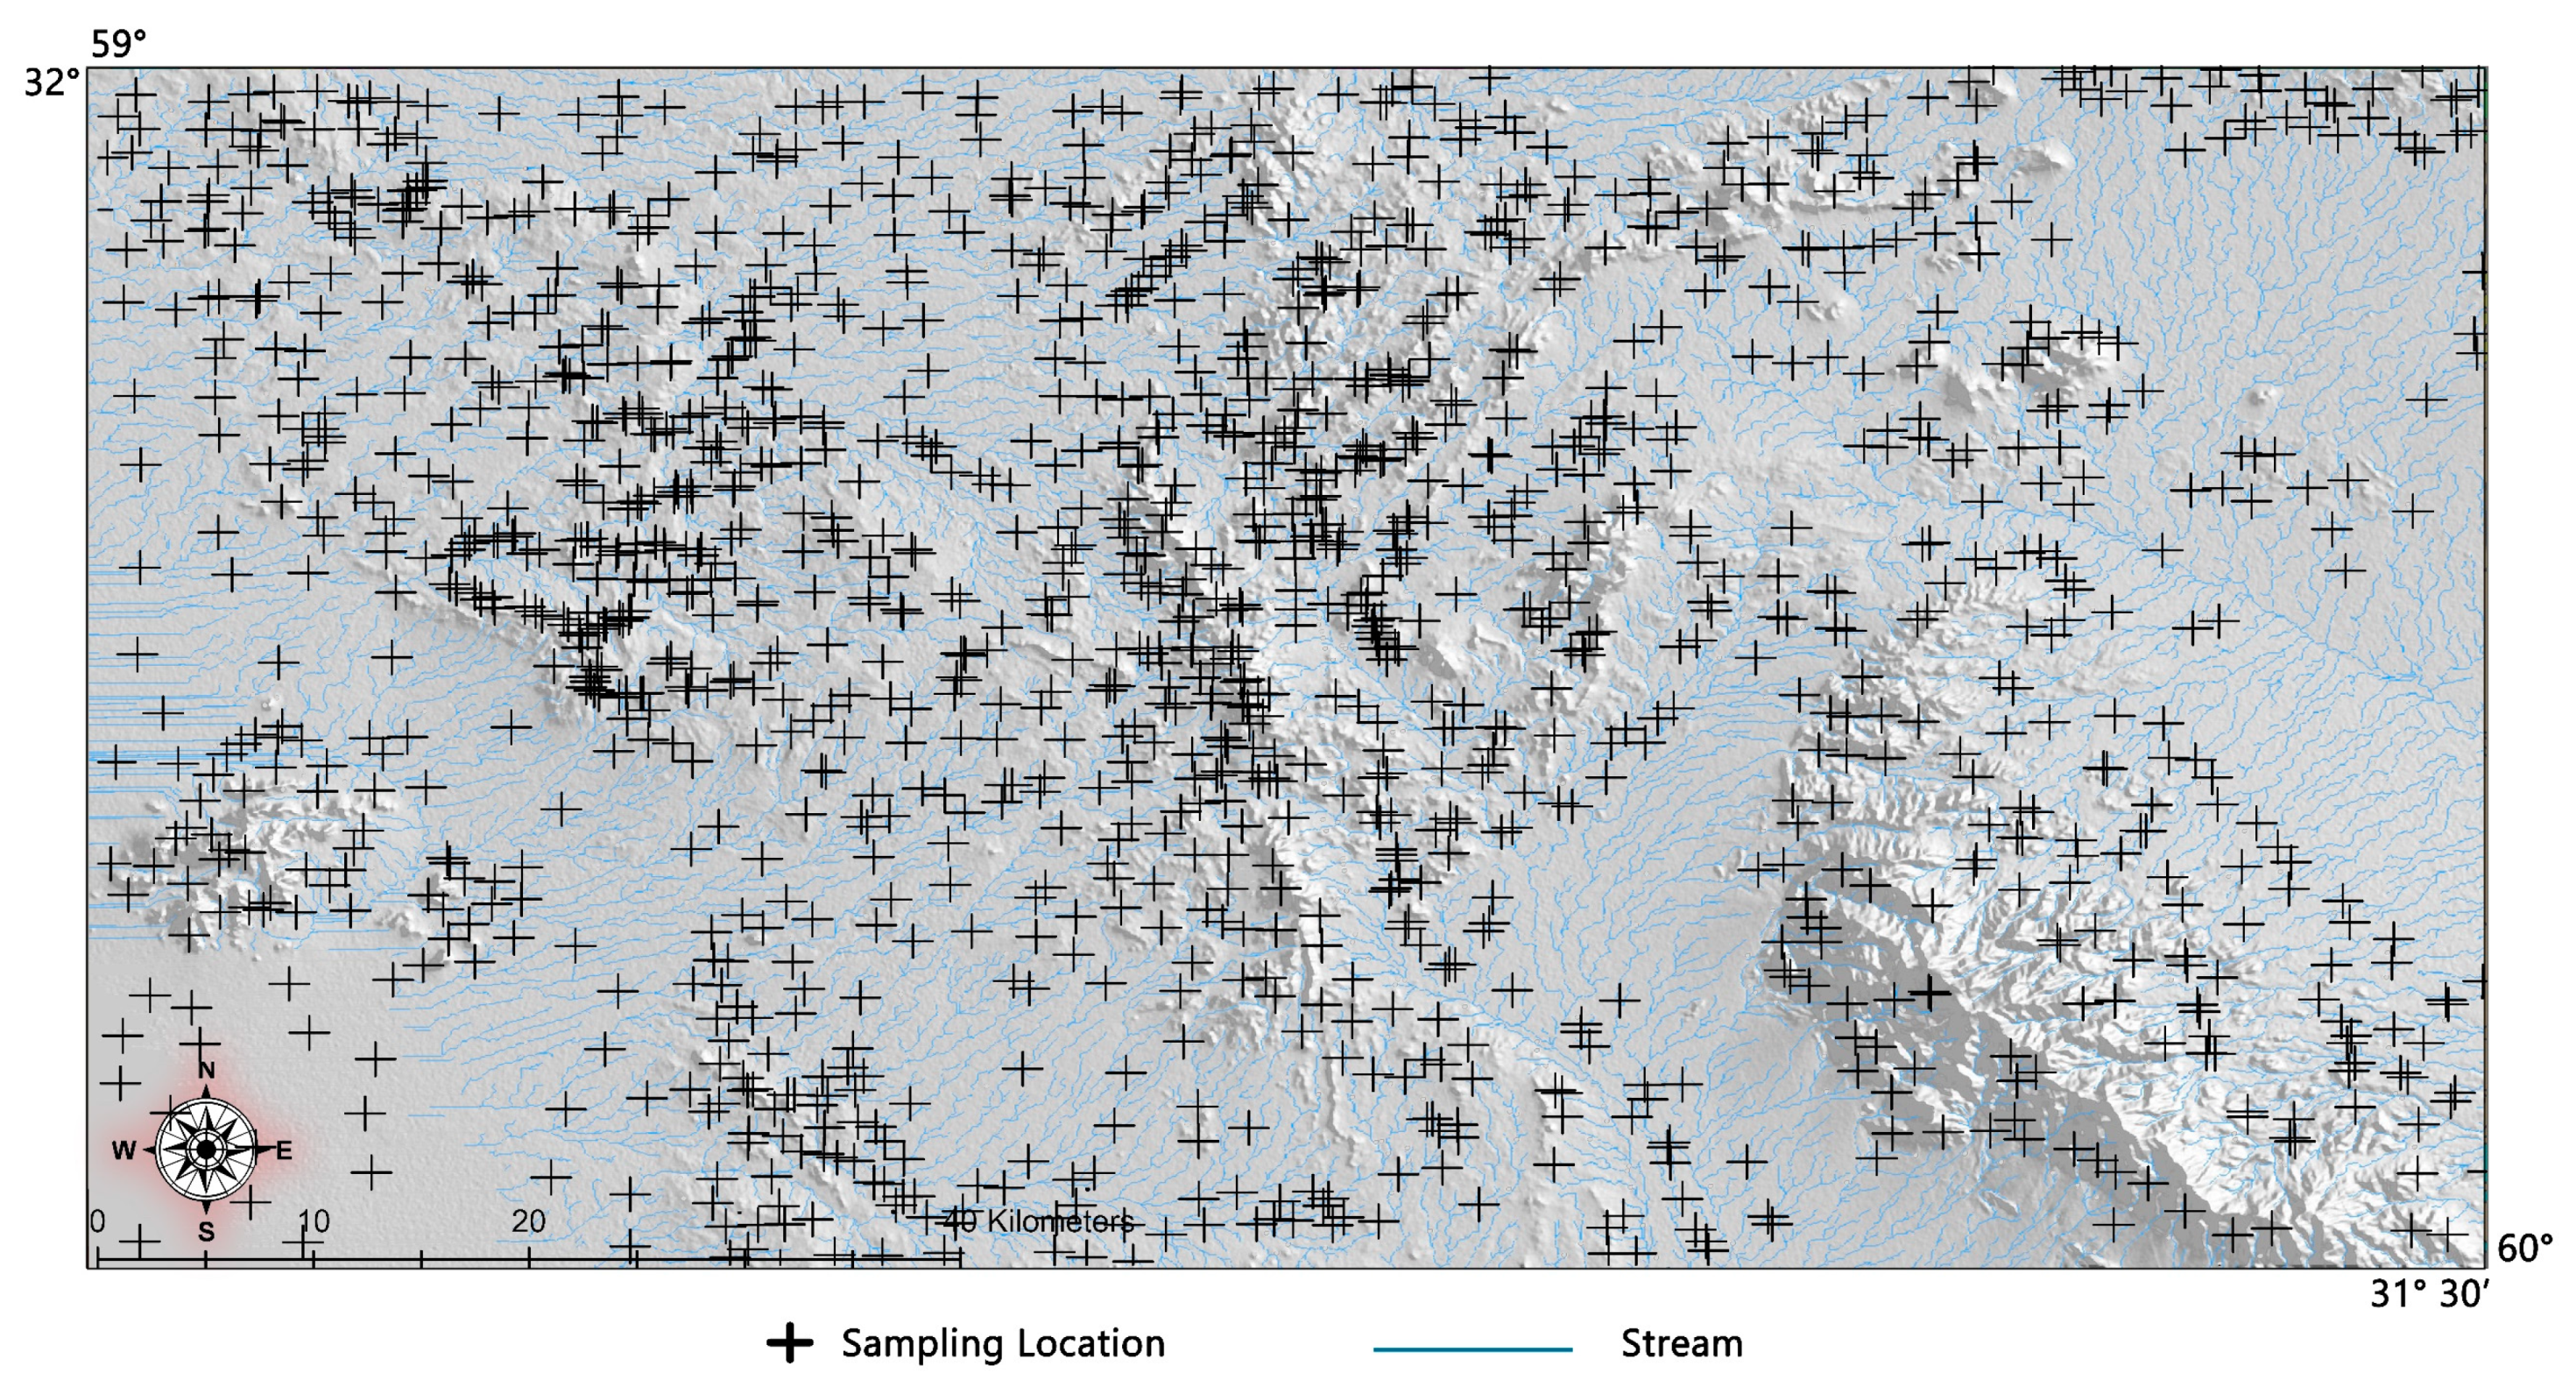
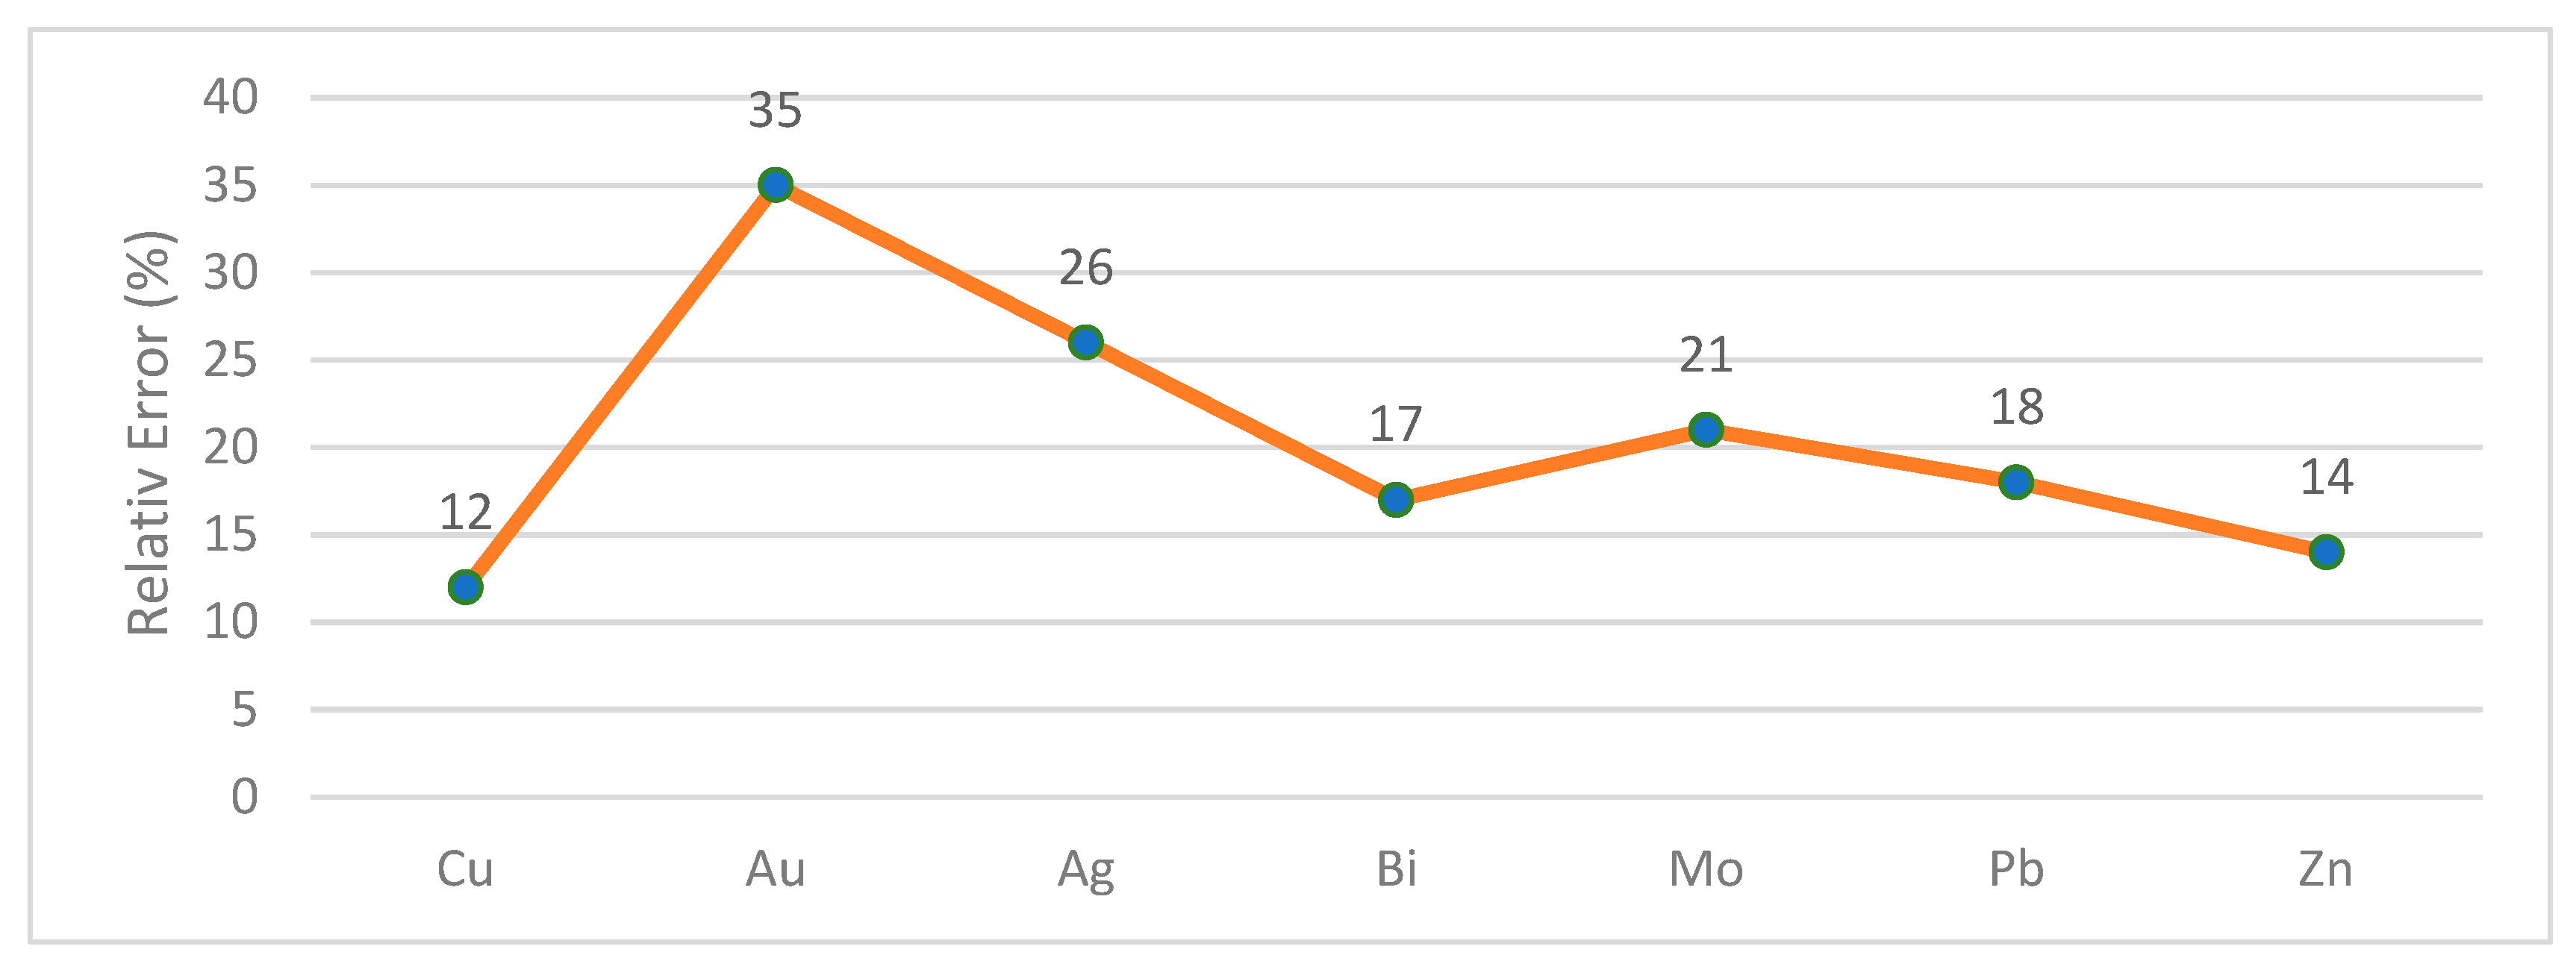
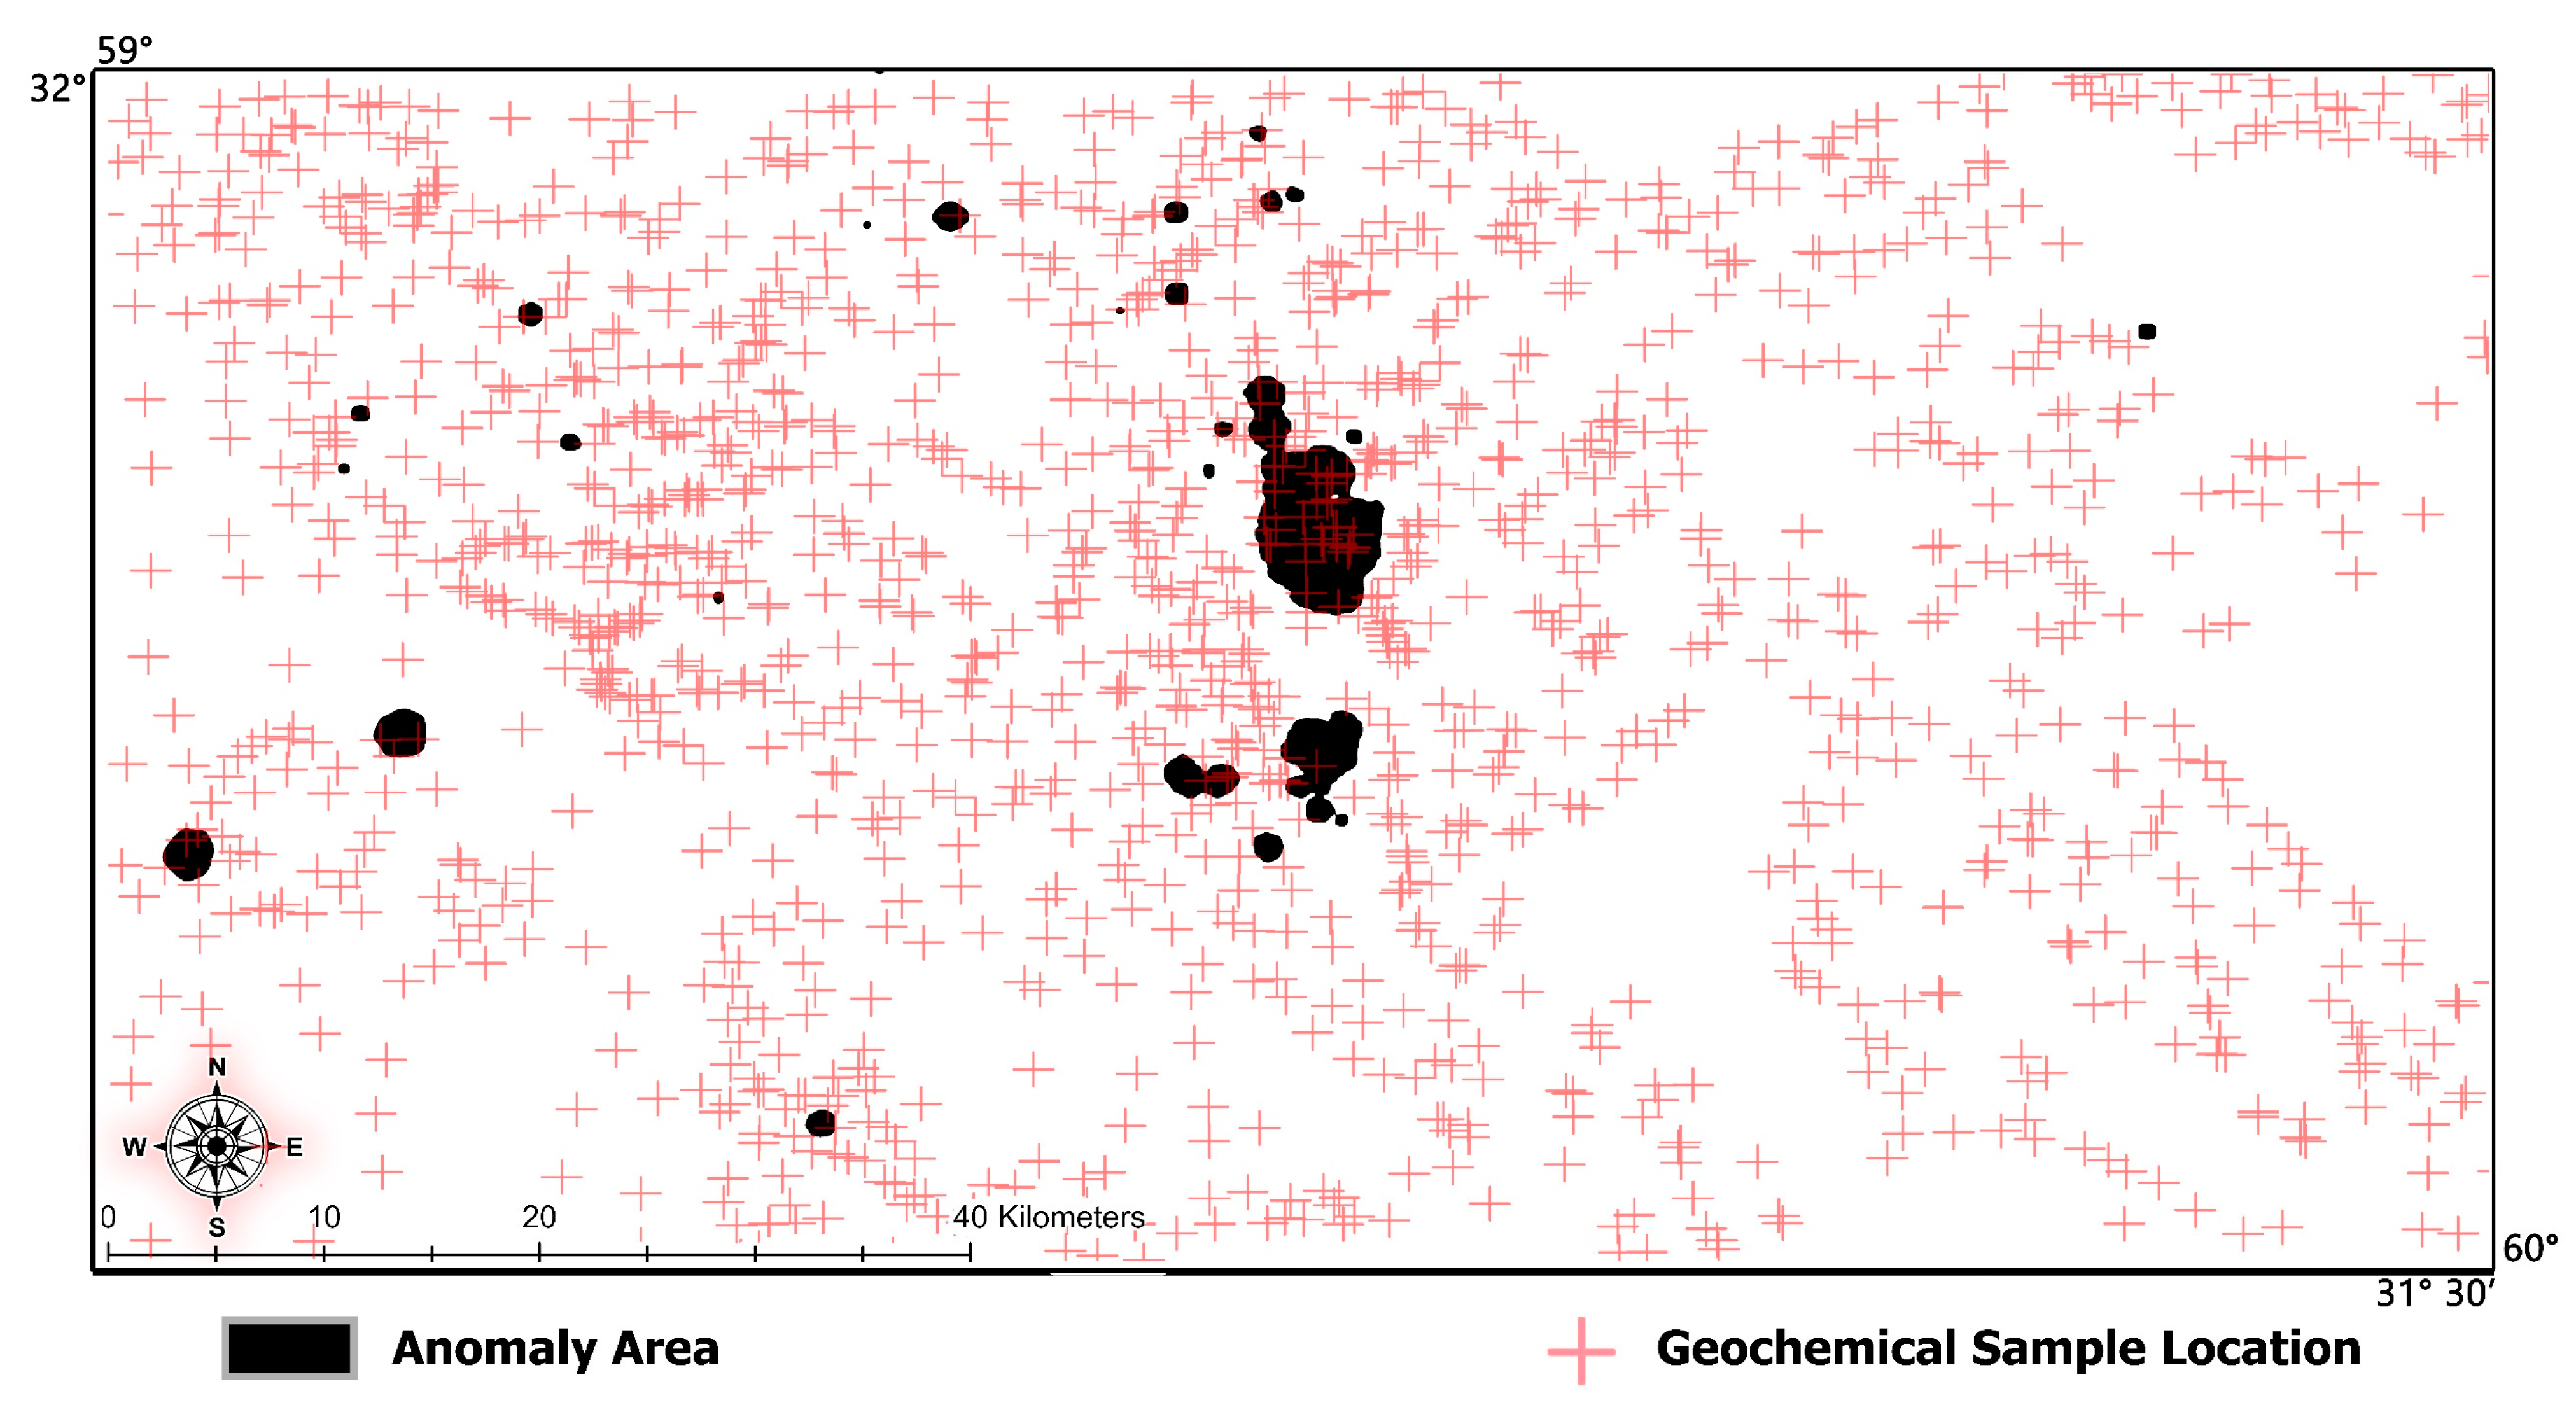
3.1.1. Geochemical Sampling
3.1.2. Remote Sensing Data Characteristics and Pre-Processing
3.2. Methodology
3.2.1. Remote Sensing Data
3.2.2. Geophysical Data
3.2.3. Geochemical Data
- (A)
- Zonality Method
- (B)
- K-means Clustering Method
- (1)
- The number of K is chosen randomly, and all members are divided into K clusters.
- (2)
- The Zj vector is calculated by Formula (1). In the presented equation, Cj is the class center value.
- (3)
- Formula (2) is the calculator of the considered clusters.X: the vector of Cj members; #Cj: The number of Cj members [48].
- (4)
- Formula (2) calculates the objective function, from which the distance of members from the centers is determined.
- (5)
- Finally, the optimal number of clusters (K) is provided according to the minimum objective function.
- (C)
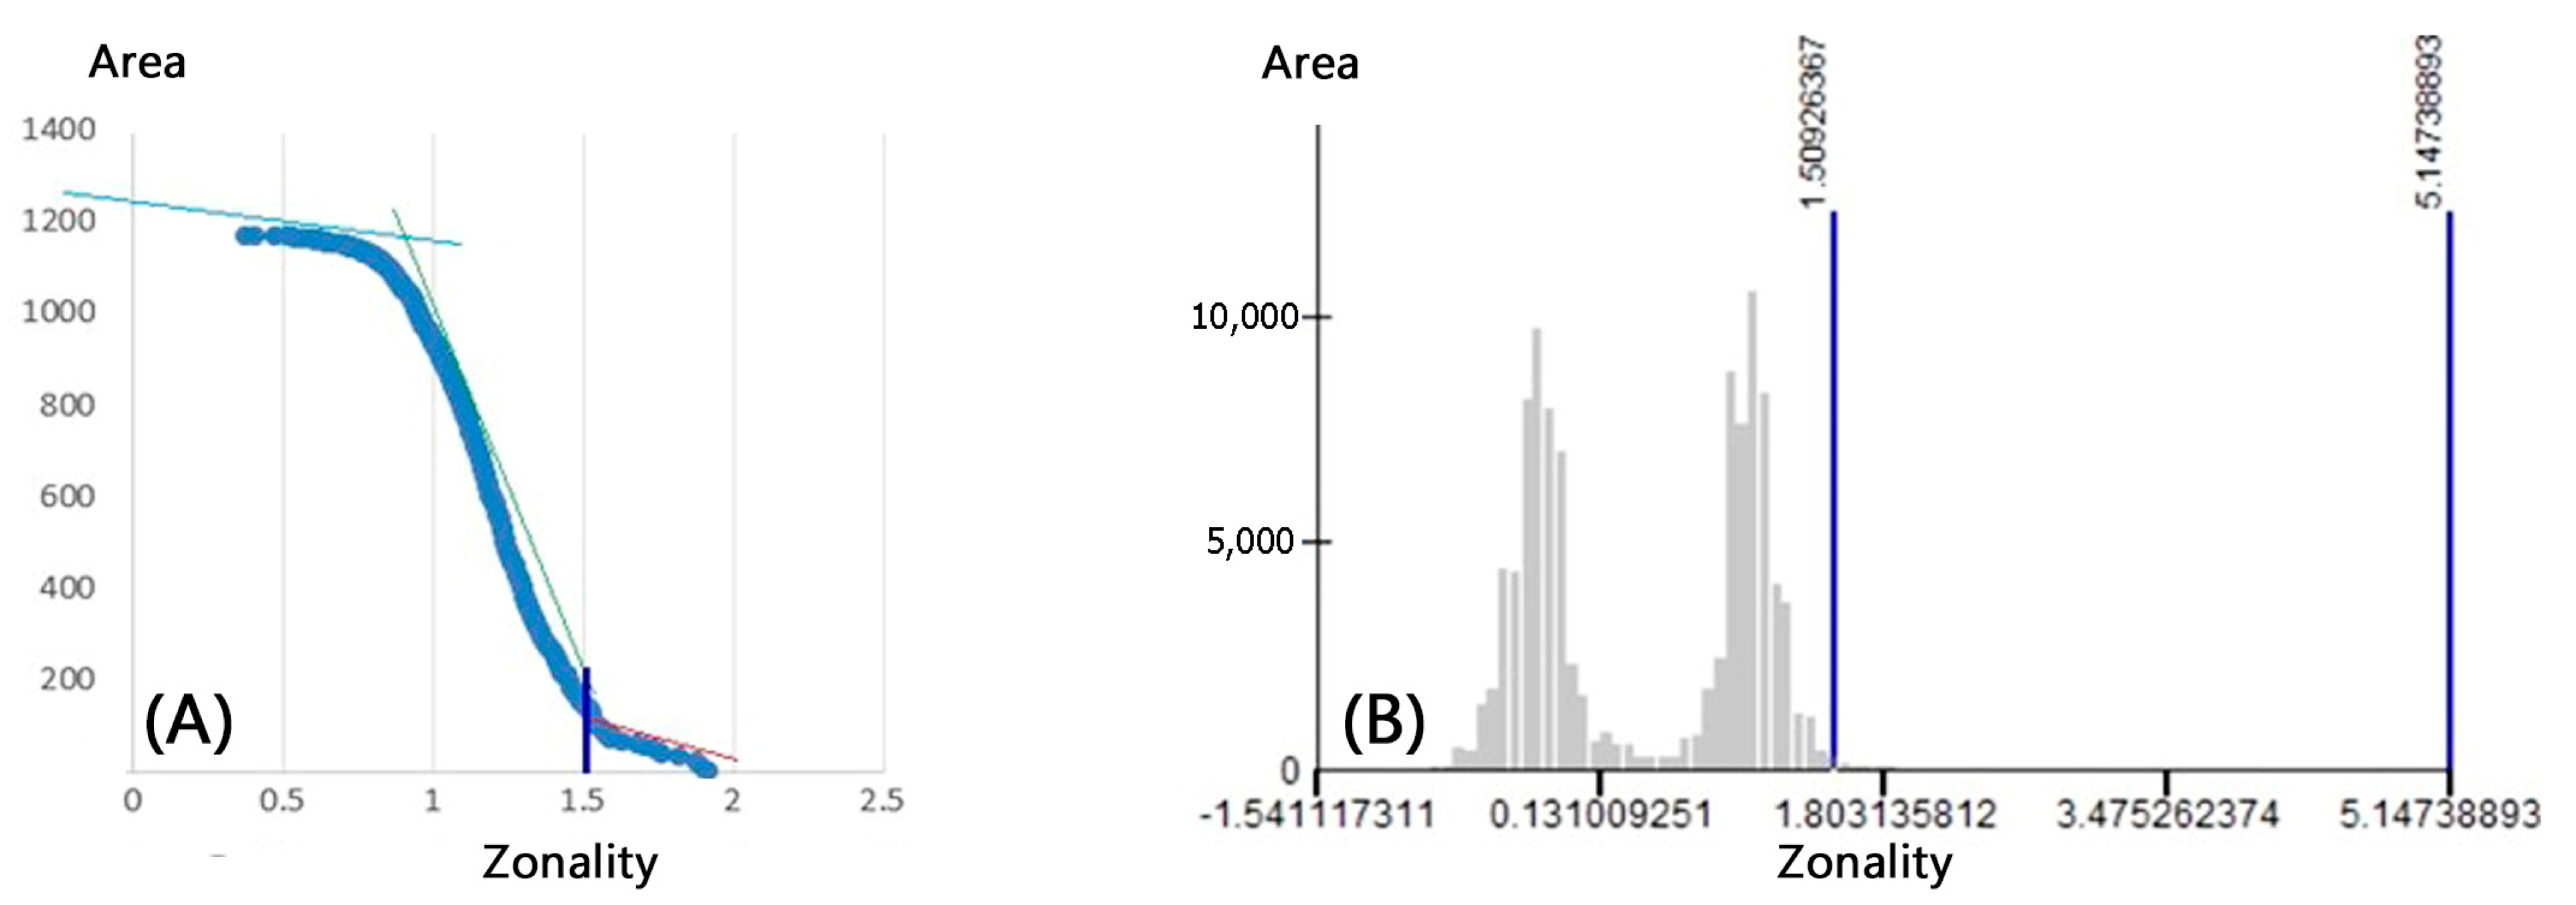
- Concentration-Area (C-A) Fractal Method
- (D)
- Singularity Method
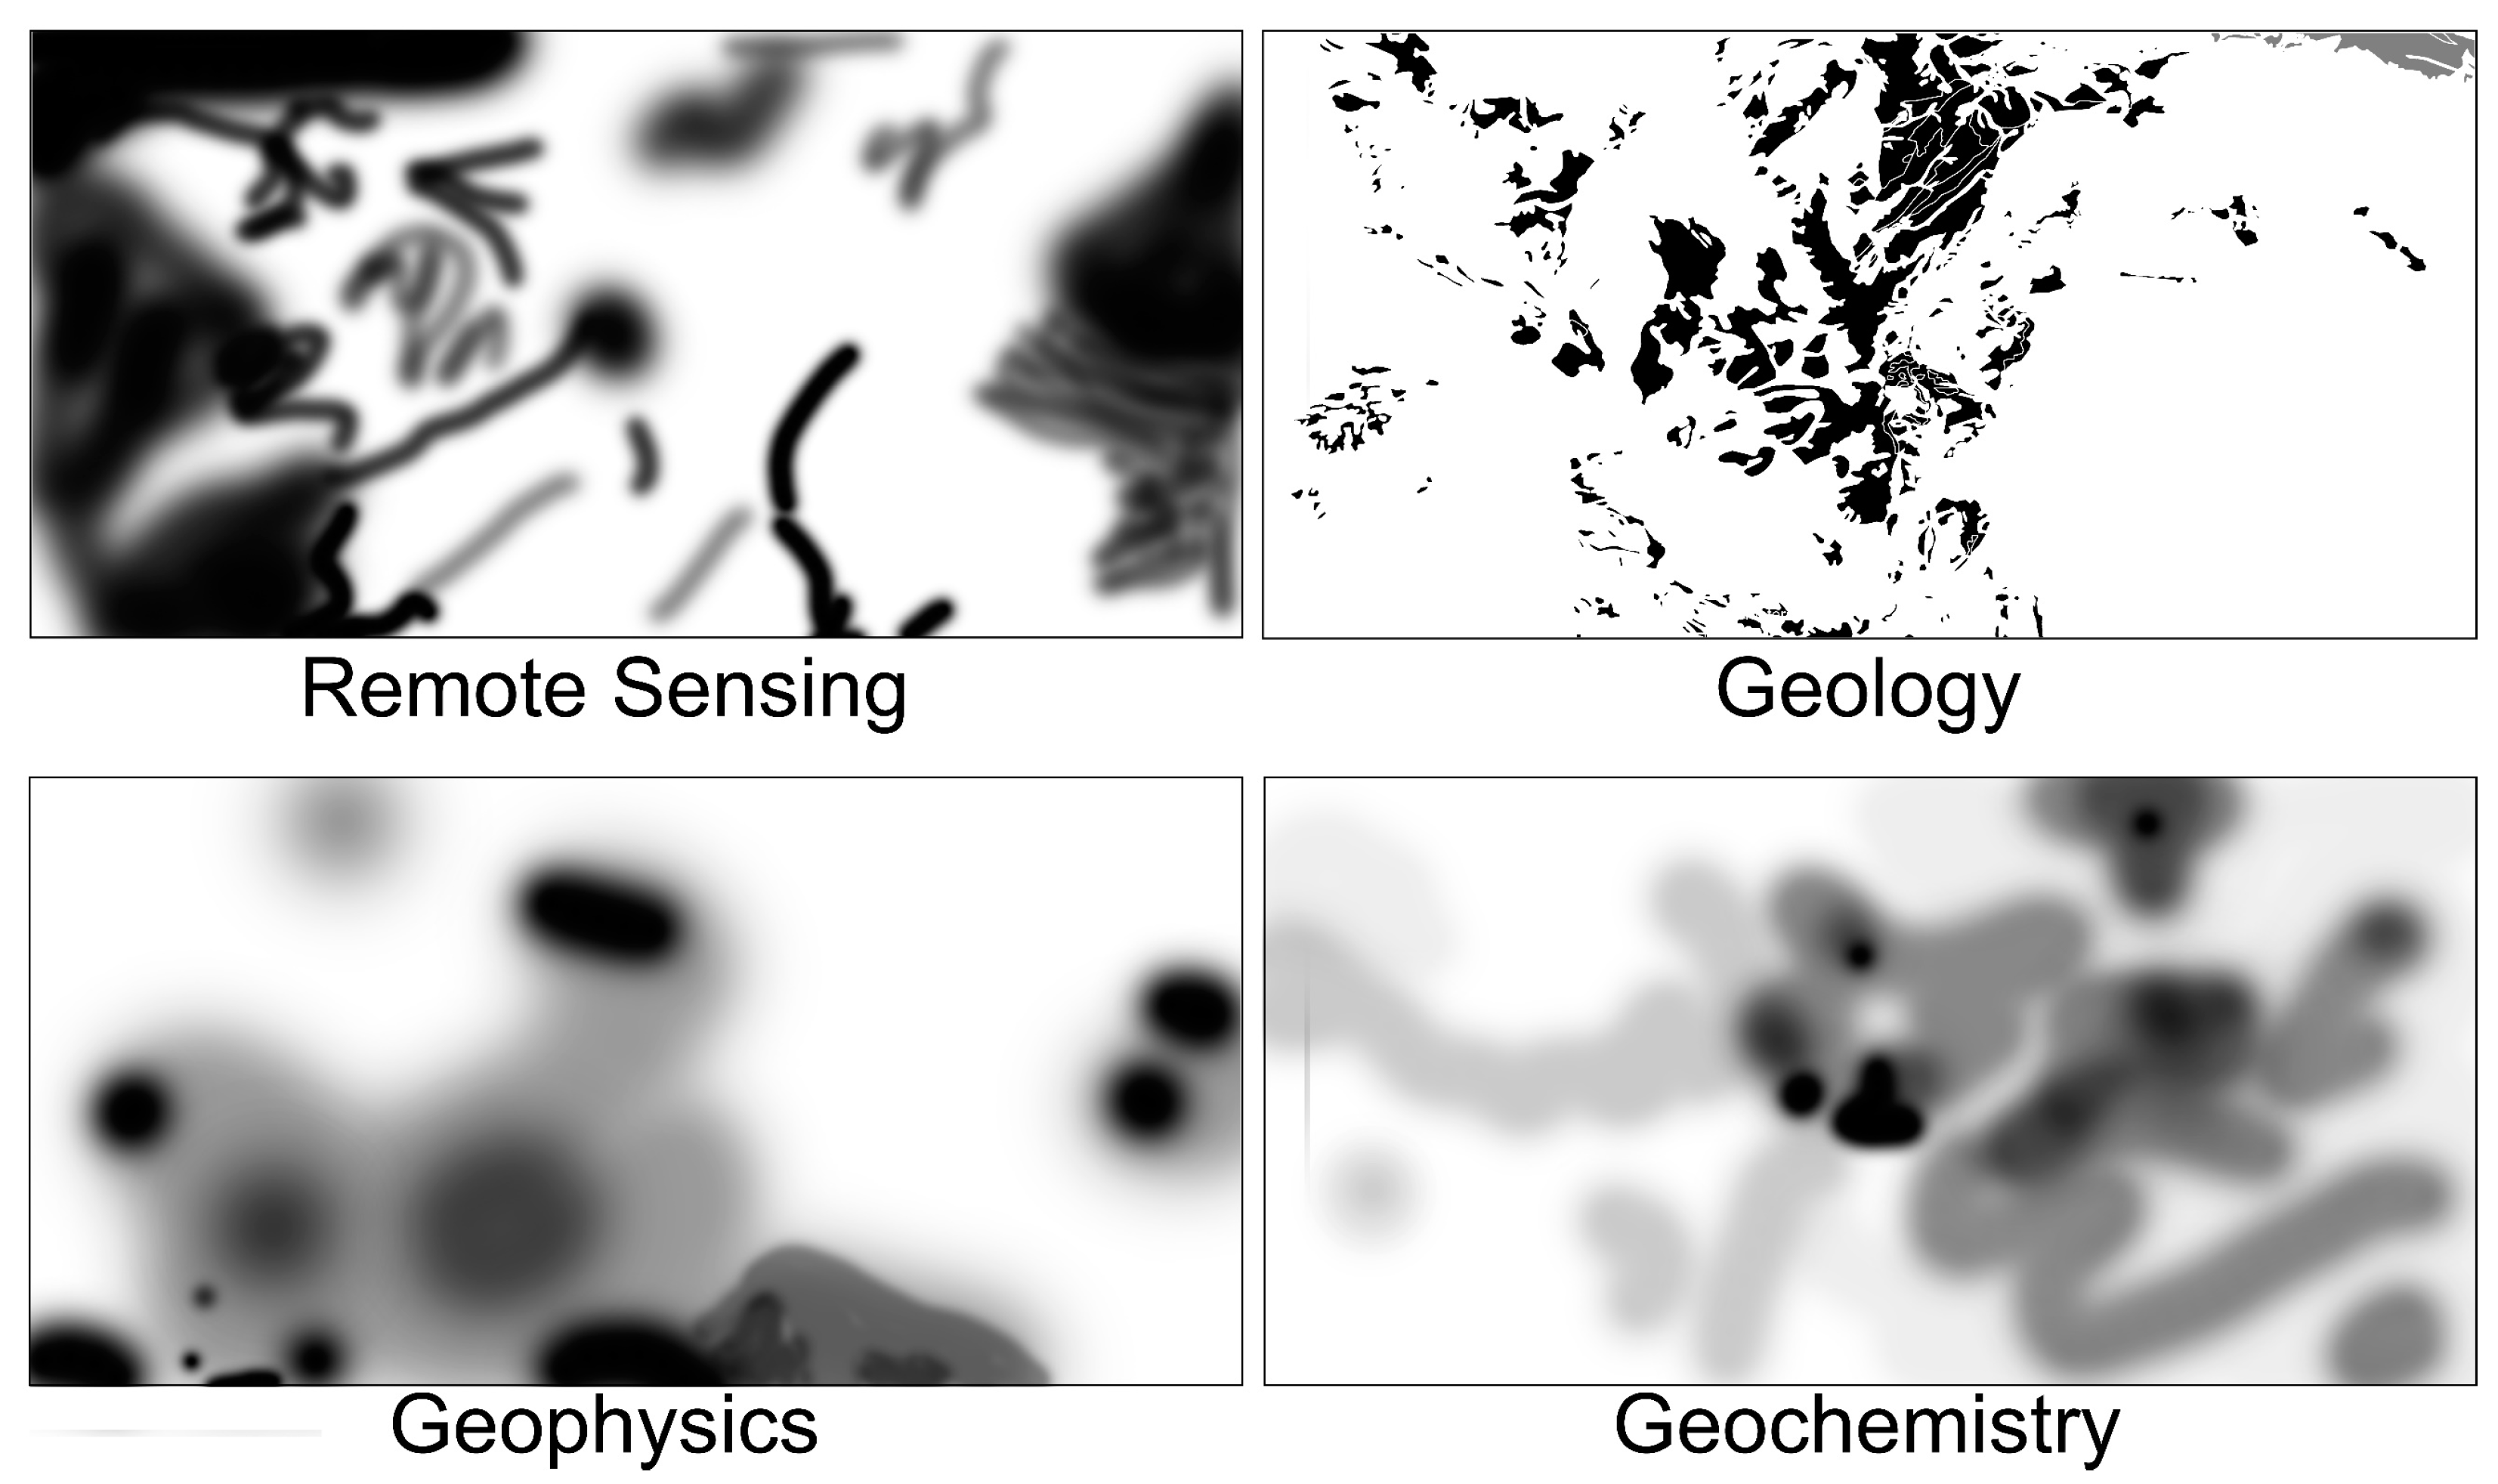
3.2.4. Data Fusion
- (A)
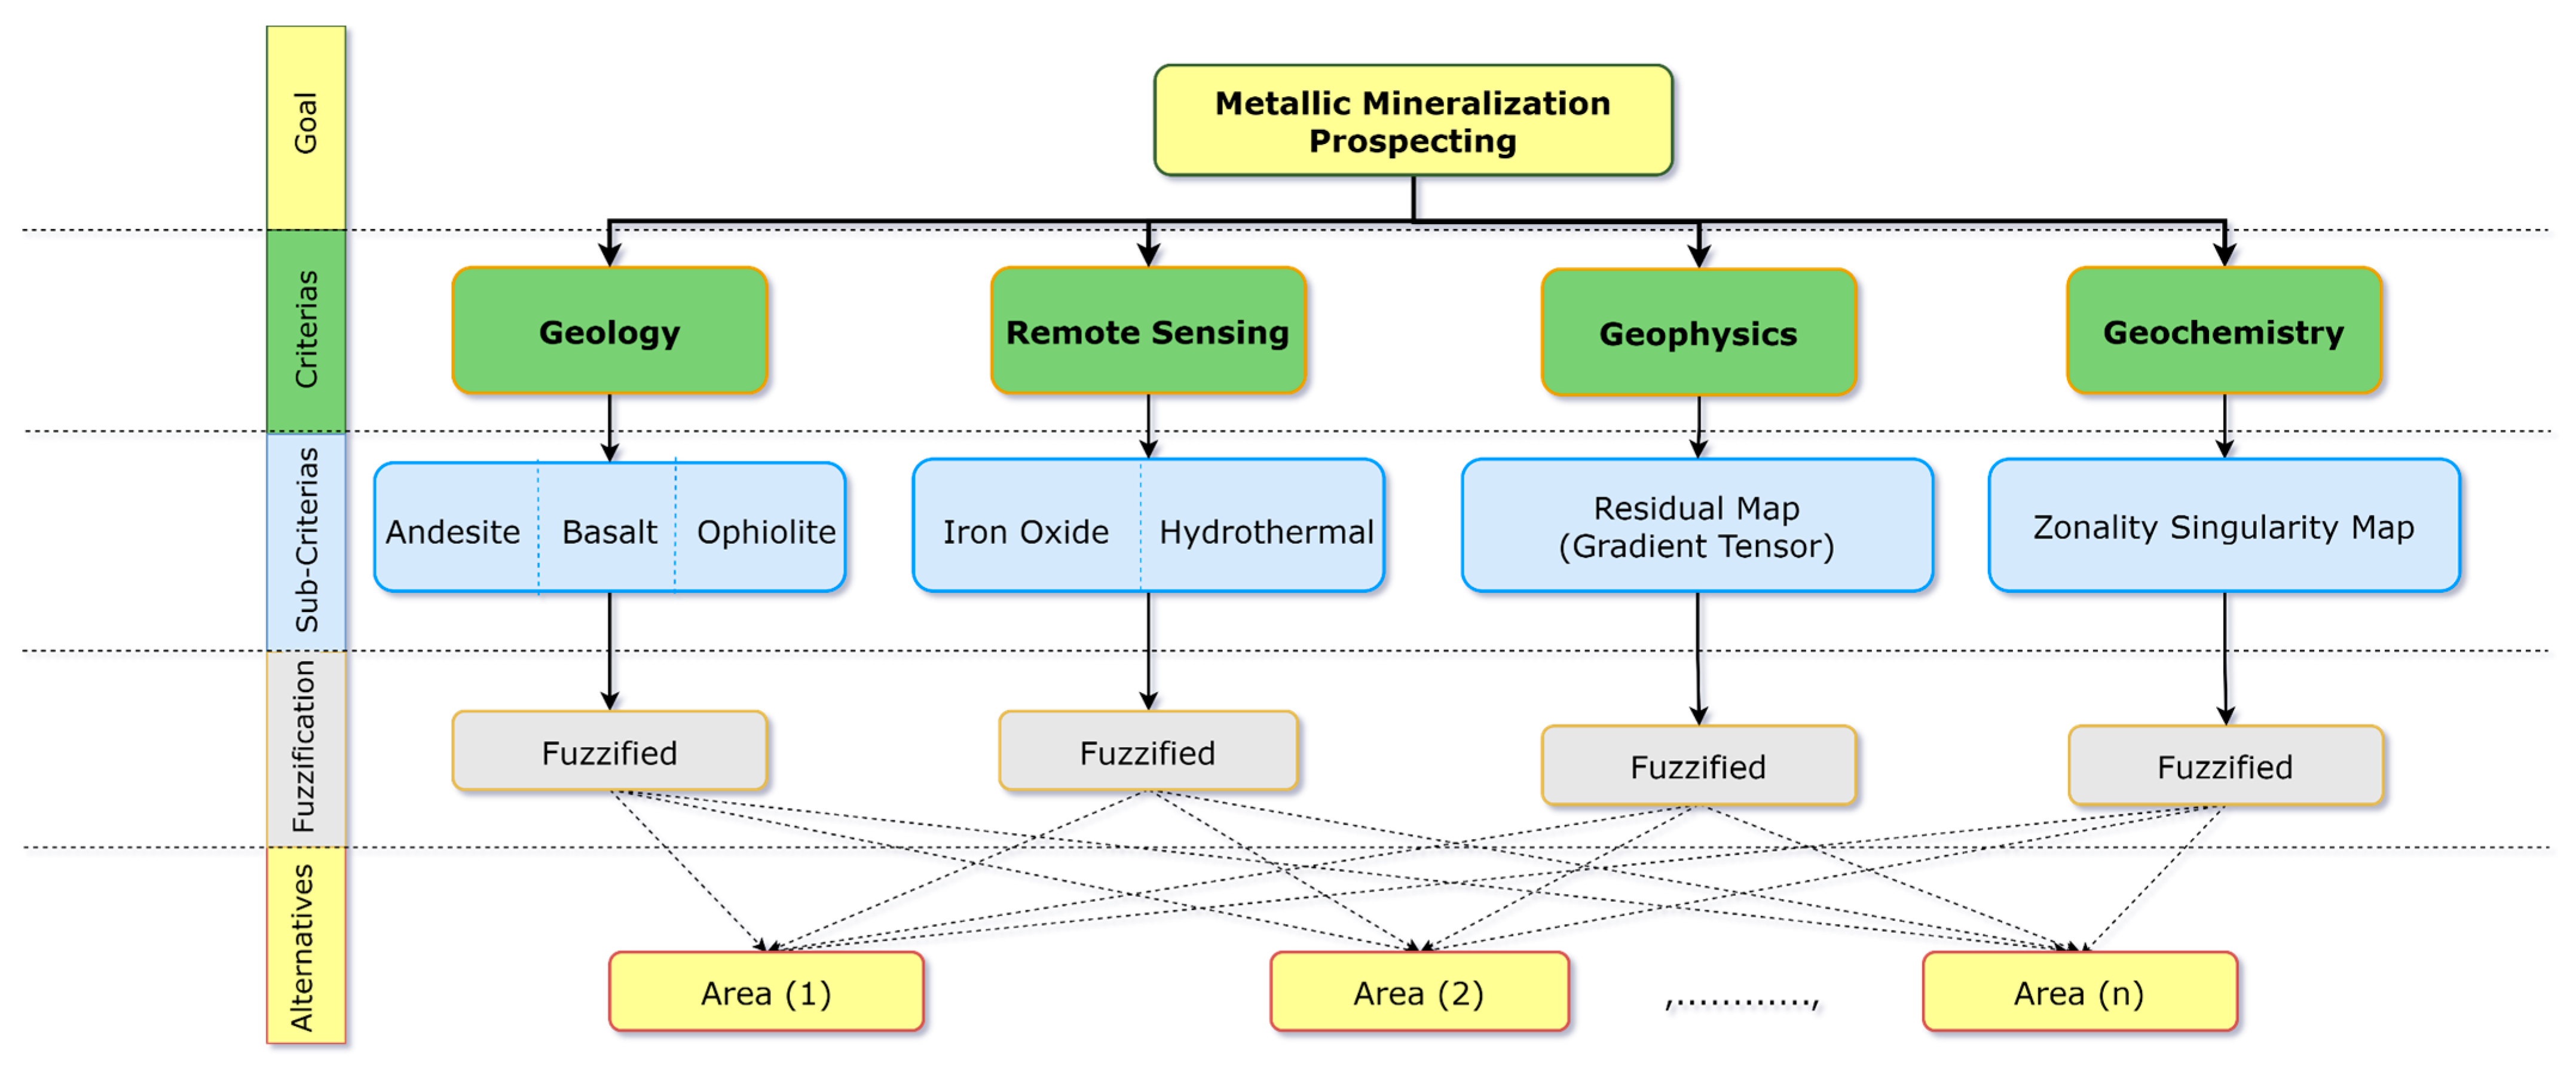
- Hybrid Fuzzy-Analytic Hierarchy Process (Fuzzy-AHP) method
4. Analysis and Results
4.1. Remote Sensing Analysis on ETM+ Satellite Image
4.1.1. Optimum Index Factor (OIF) Analysis
4.1.2. Band Ratio (BR) Analysis
4.1.3. Least Squares Fit (LS-Fit) Analysis
4.2. Airborne Magnetometric Data Analysis
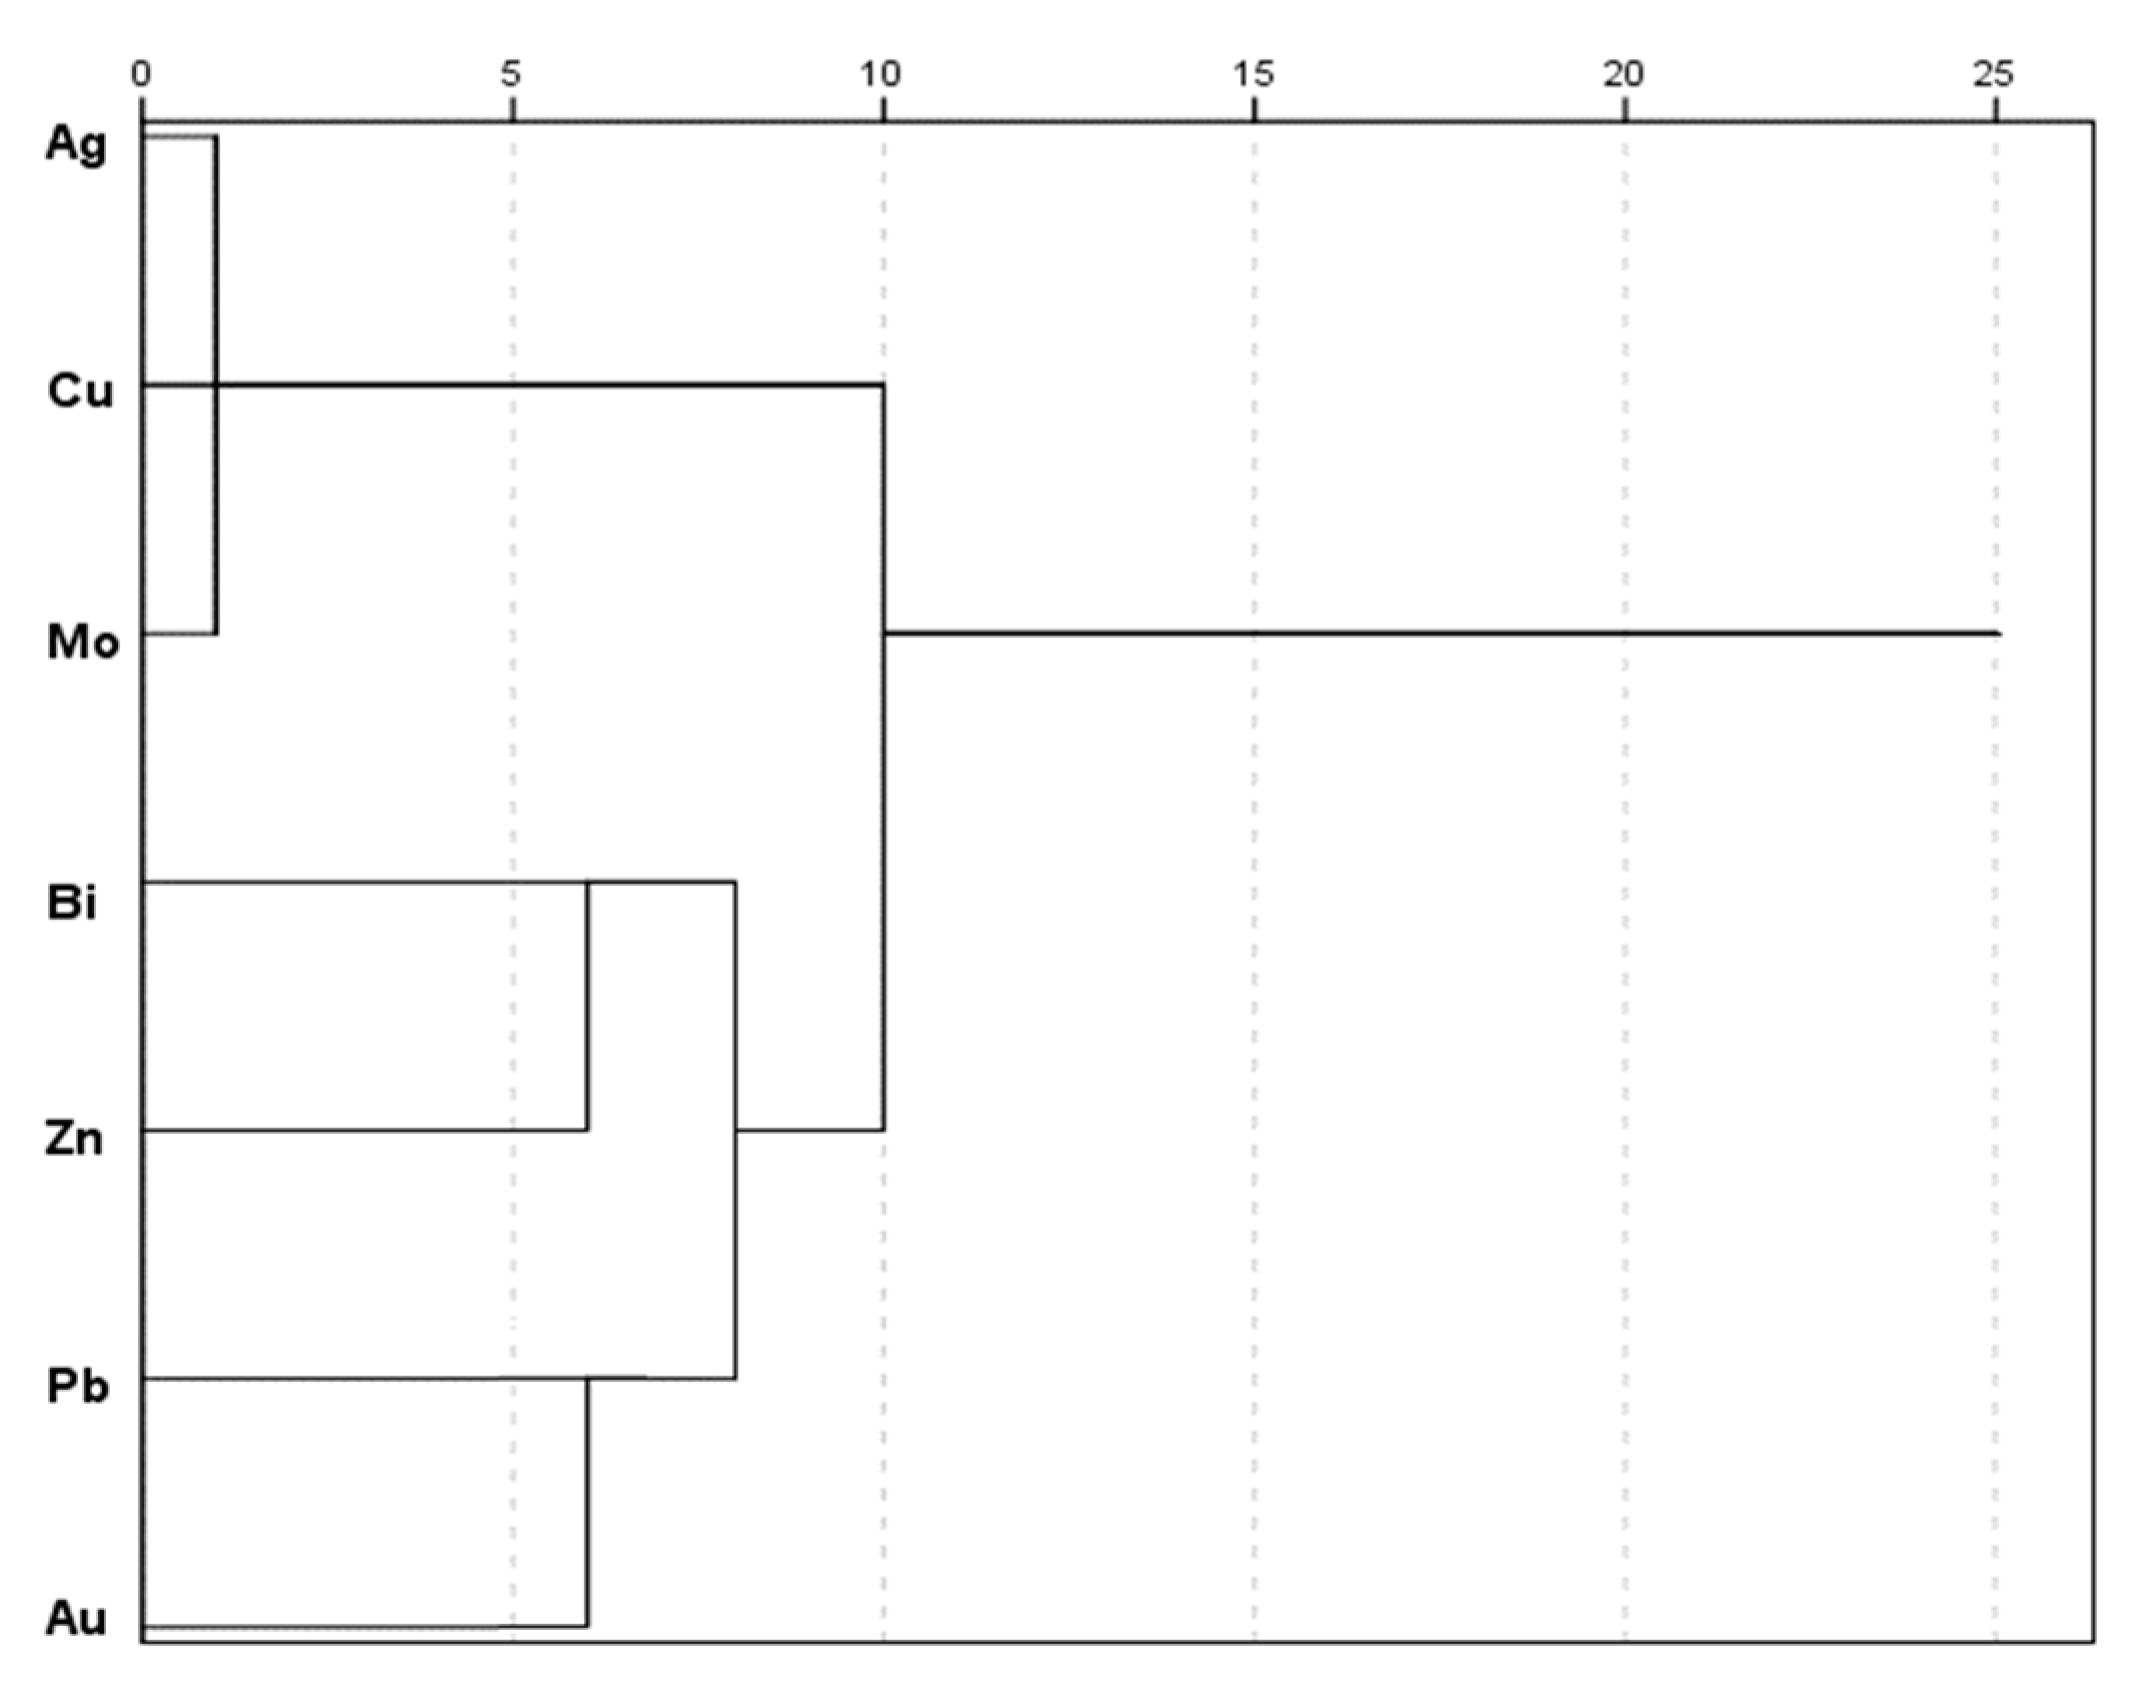
4.3. The Predictor Composition of Cu Mineralization
Hierarchical Clustering Analysis (HCA)
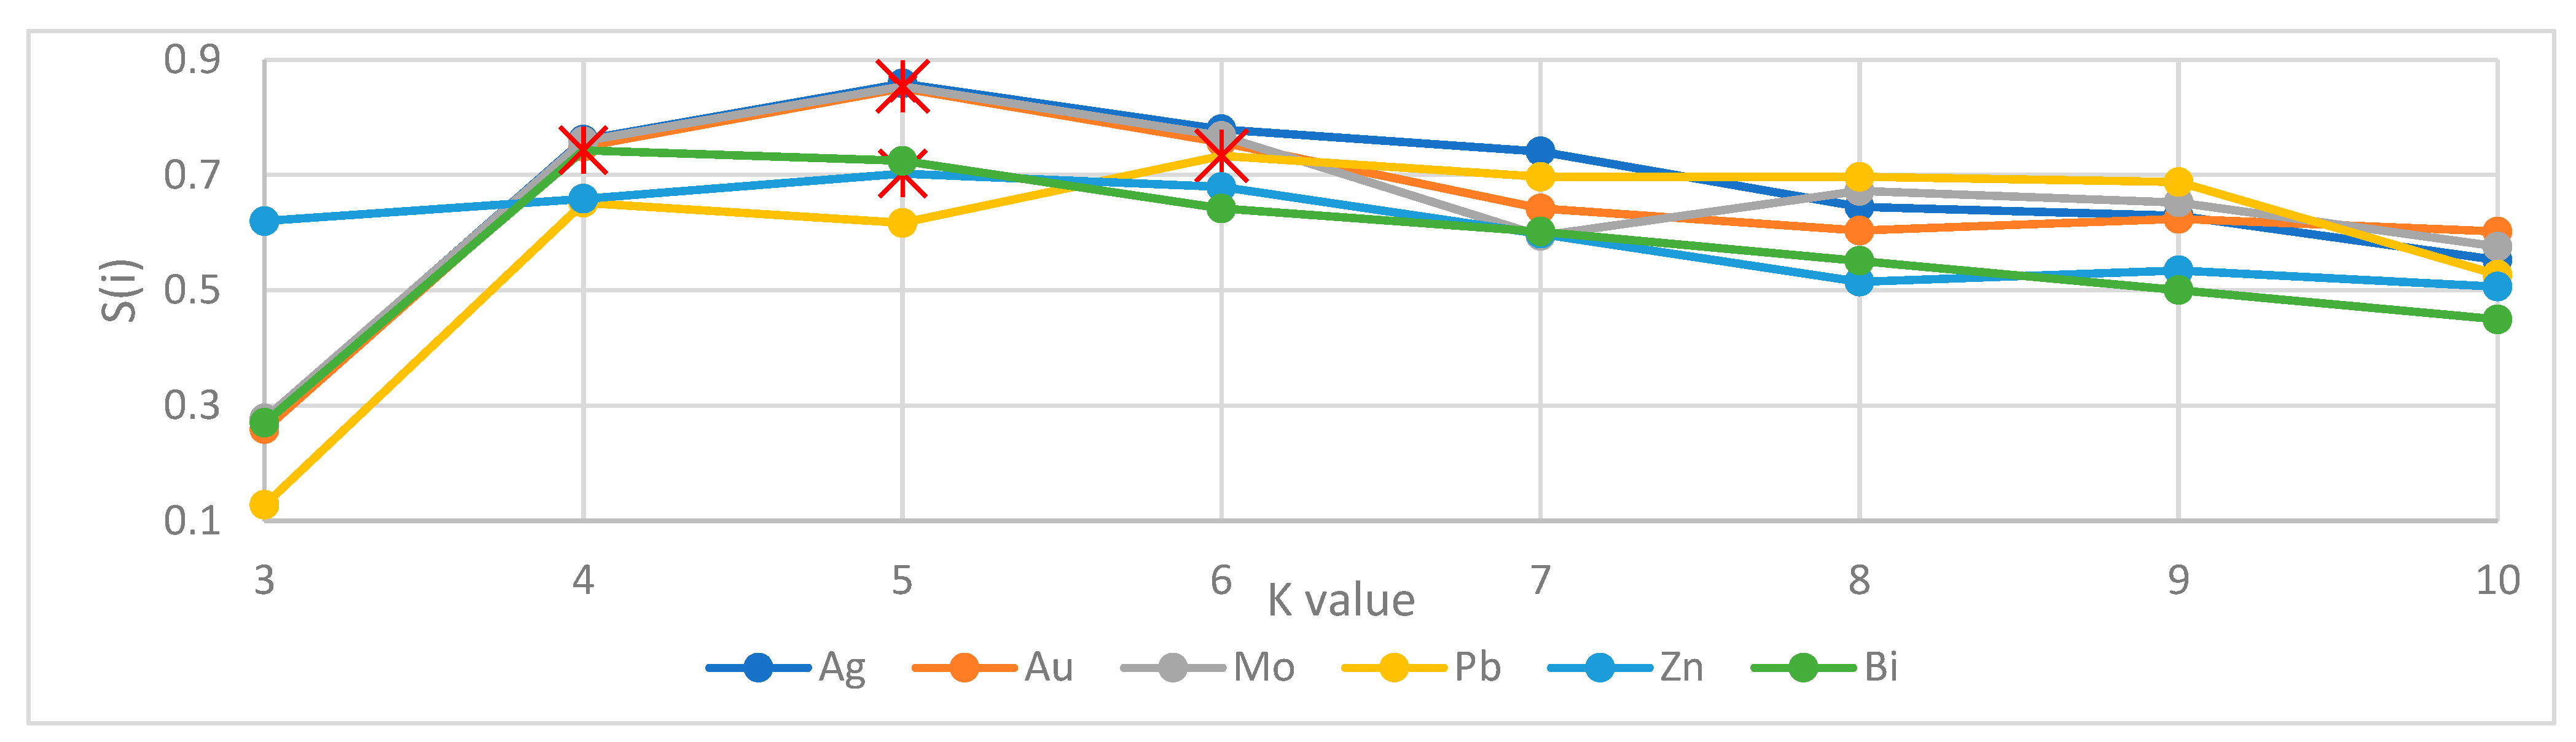
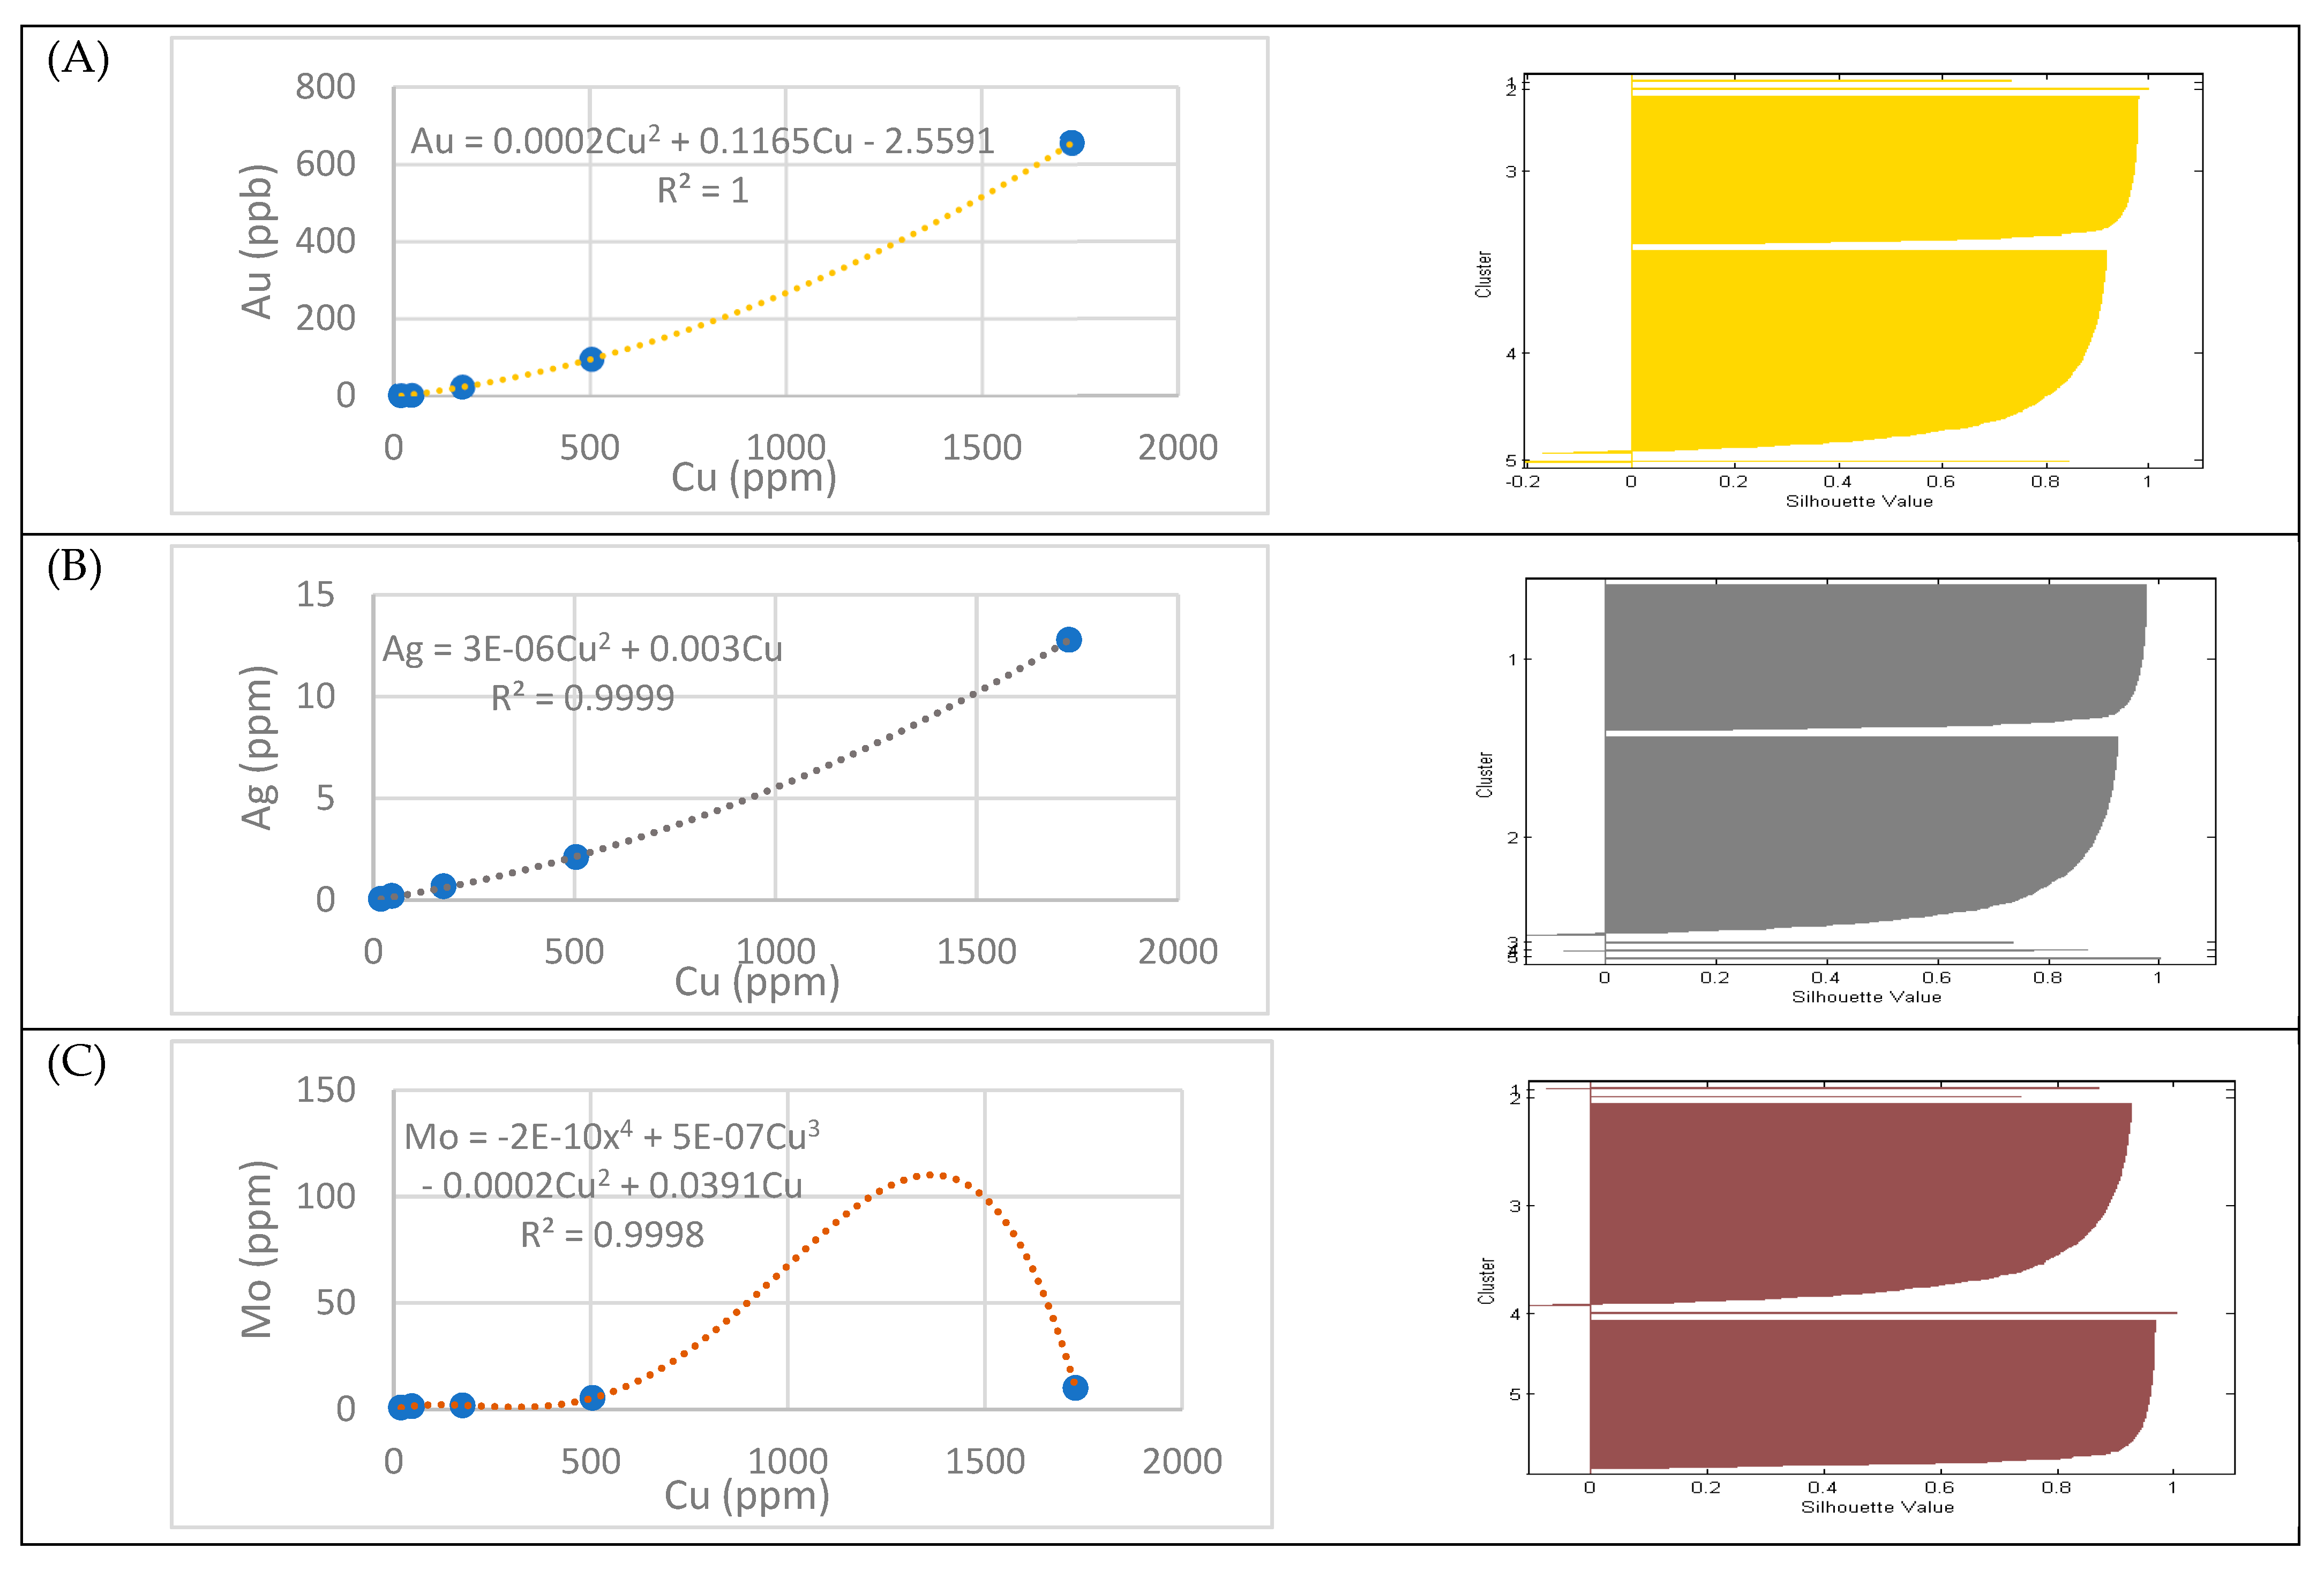
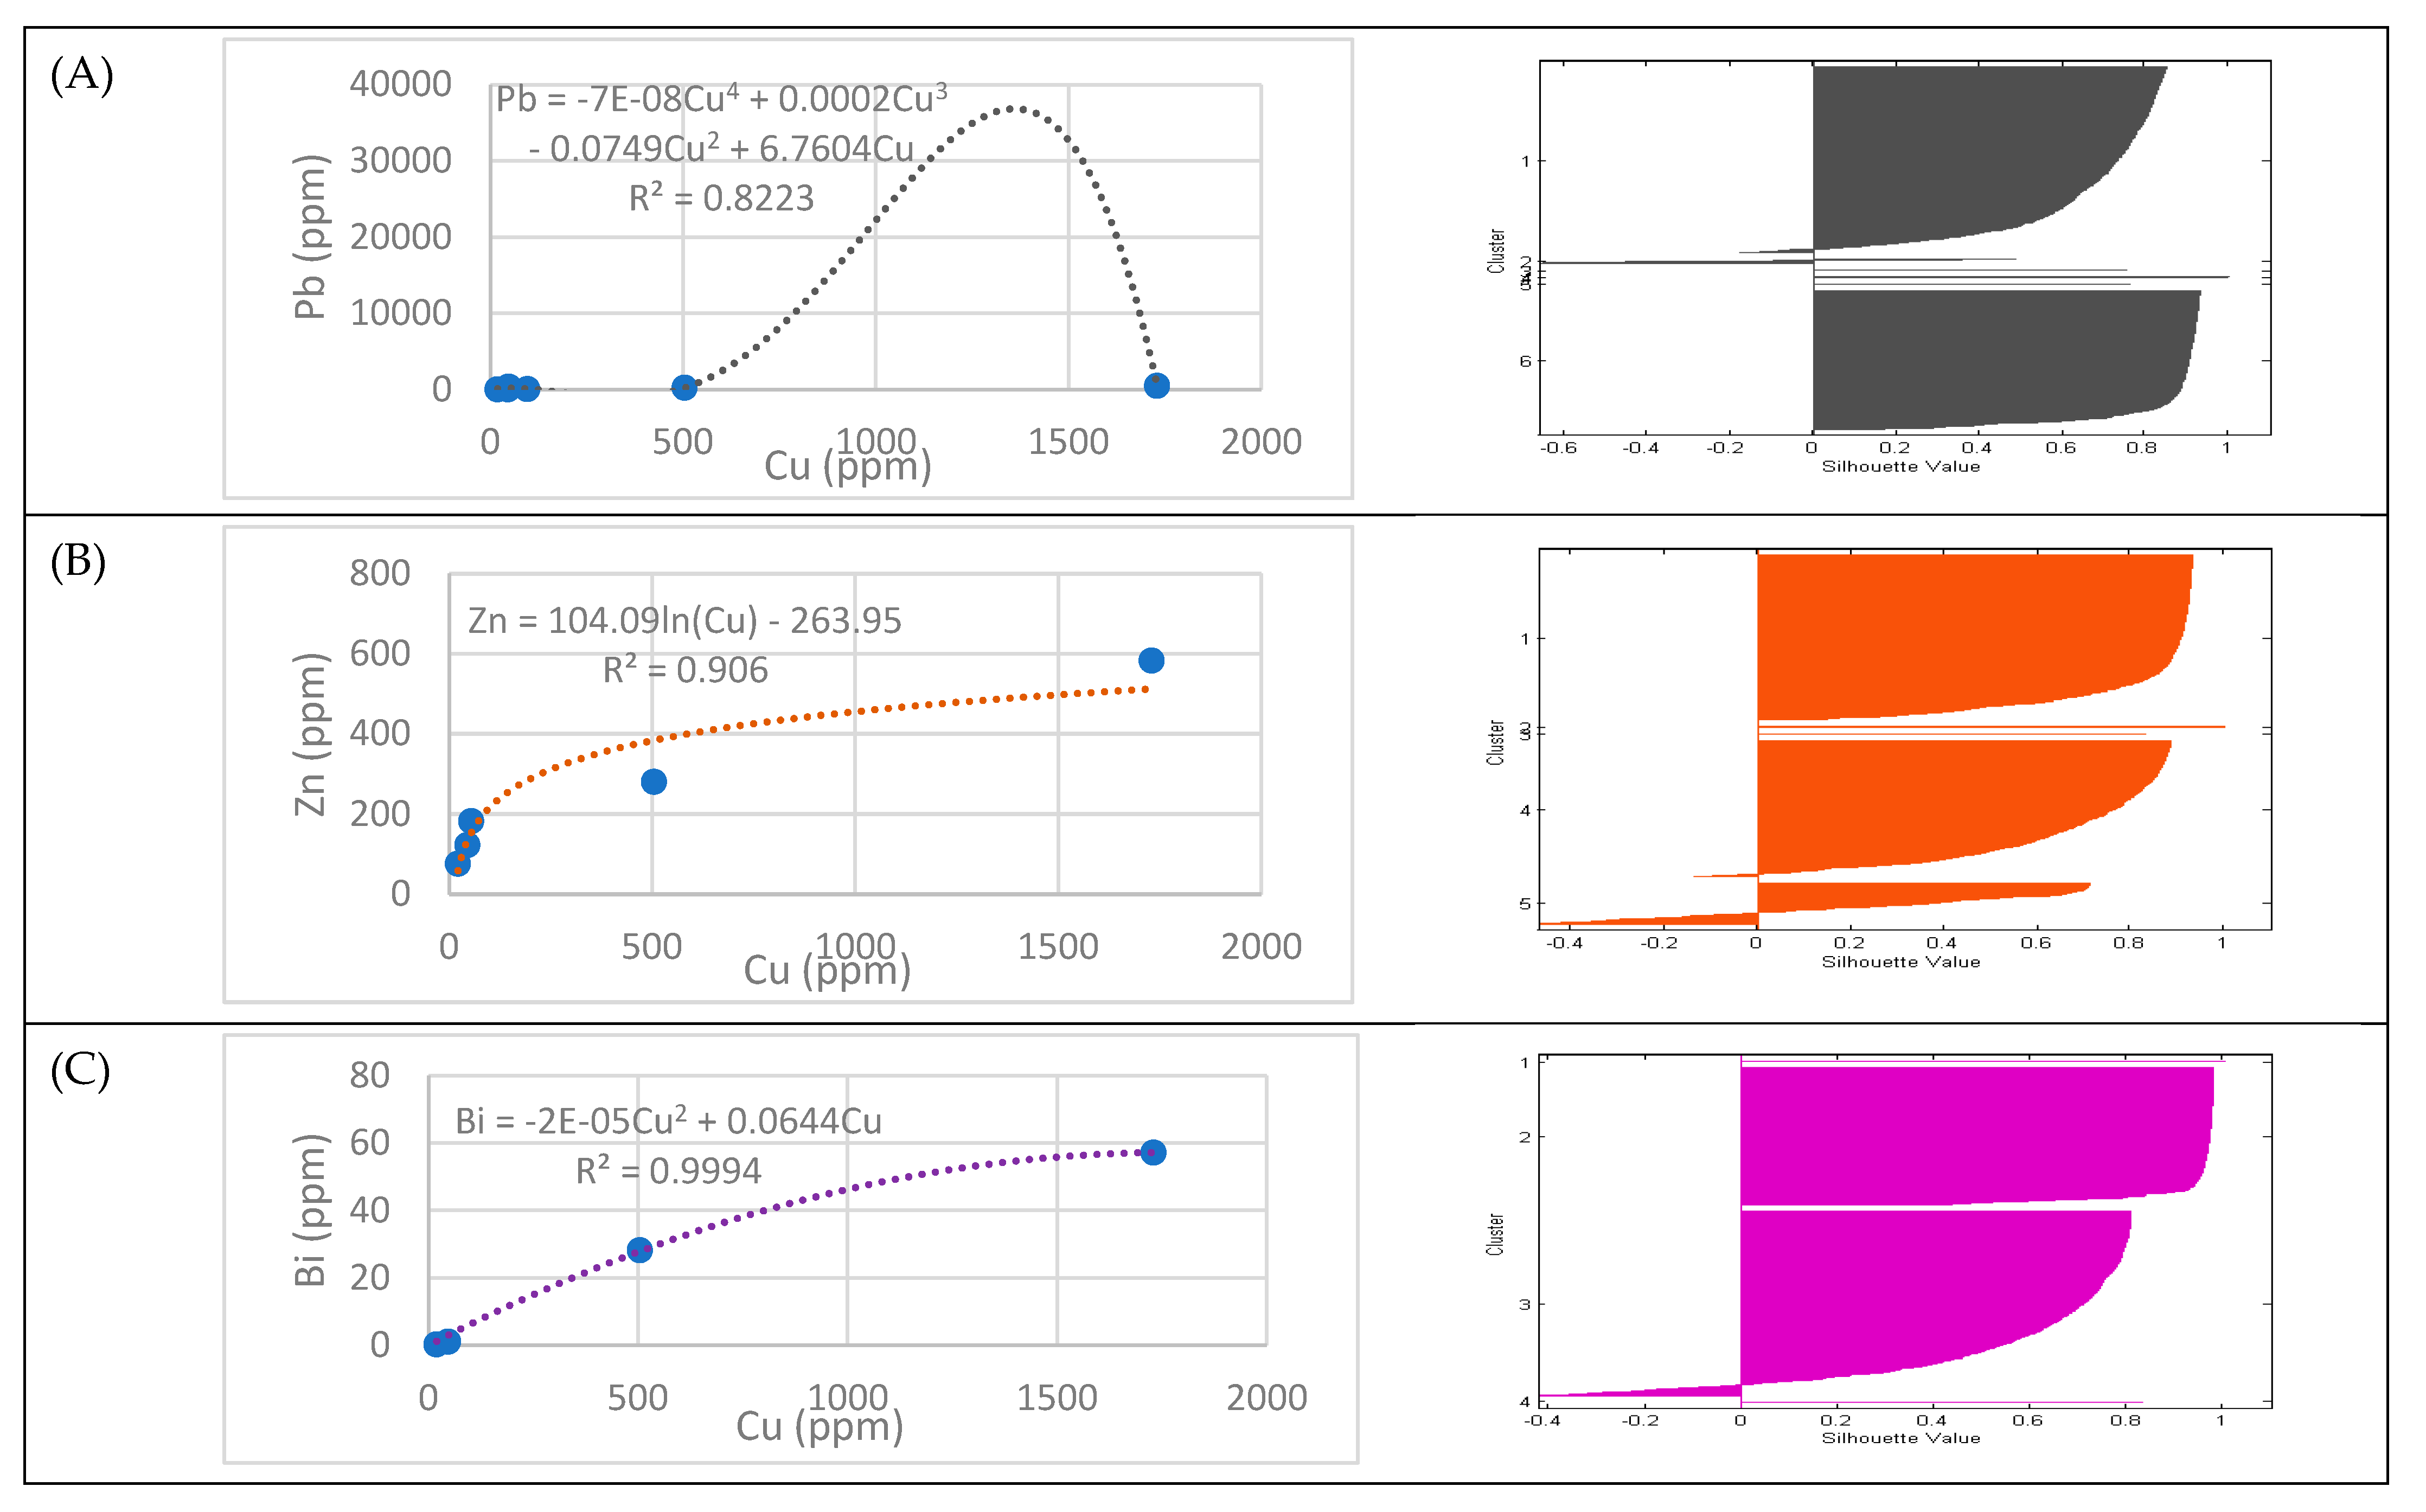
4.4. K-Means Clustering
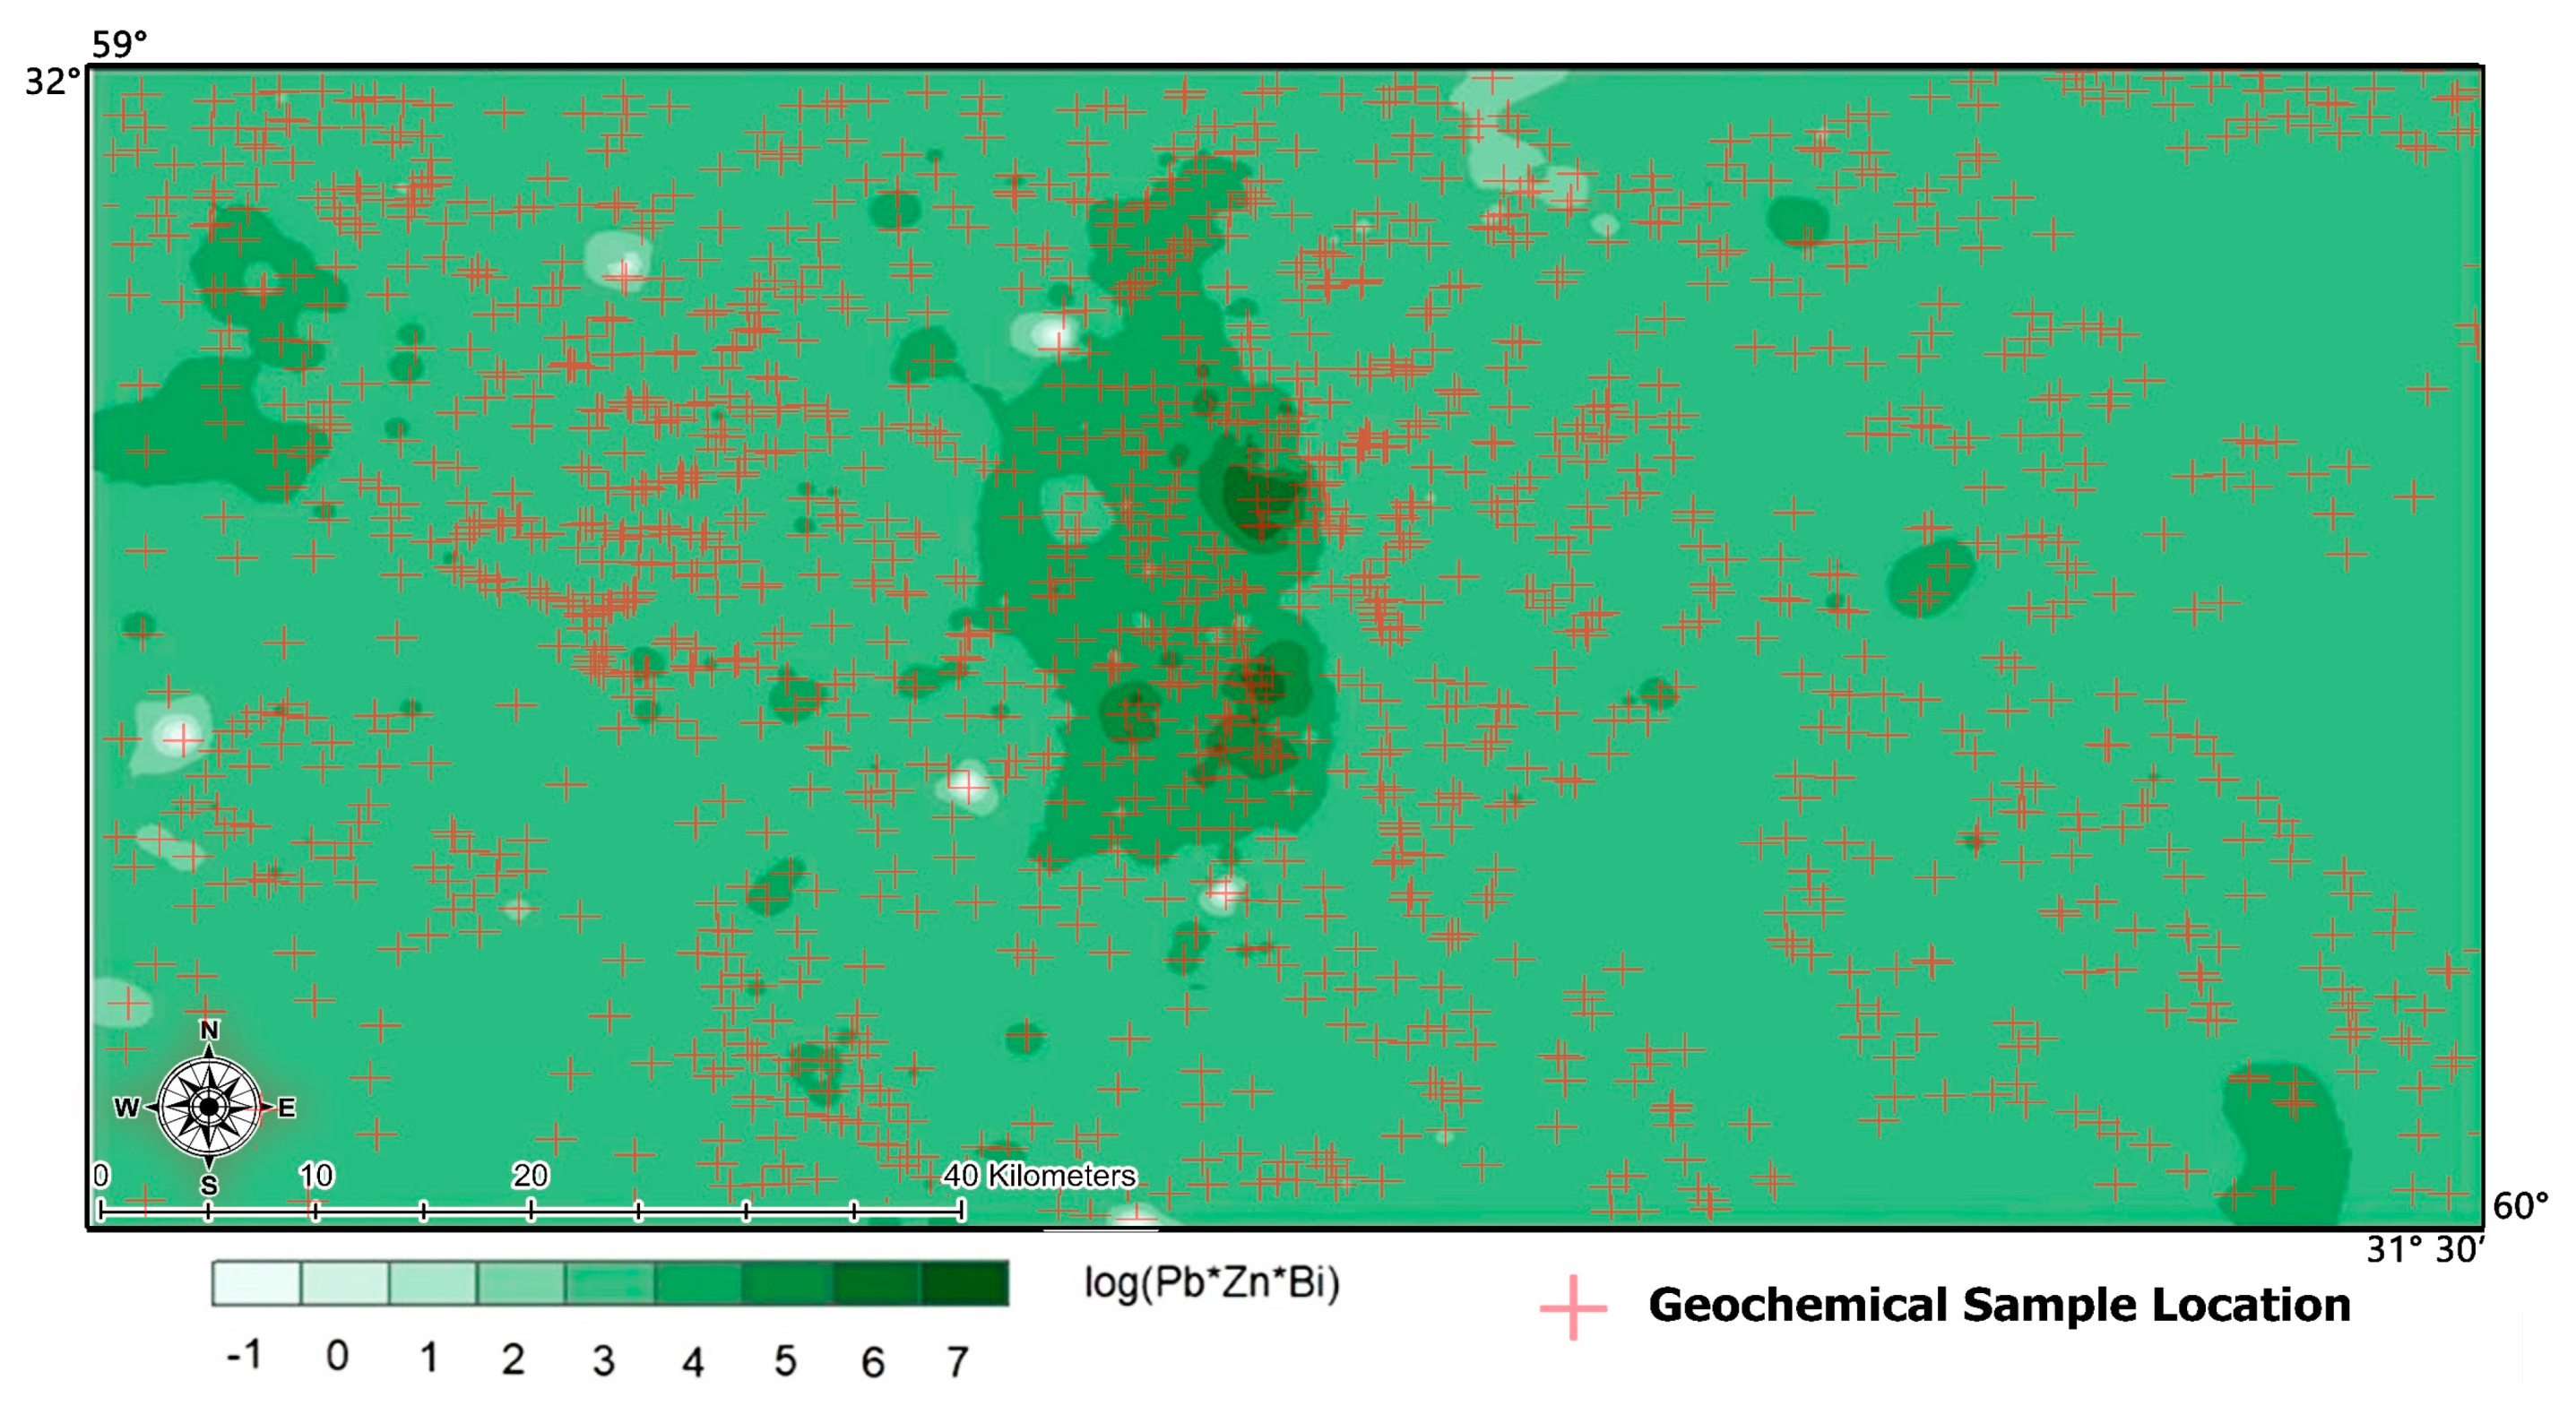
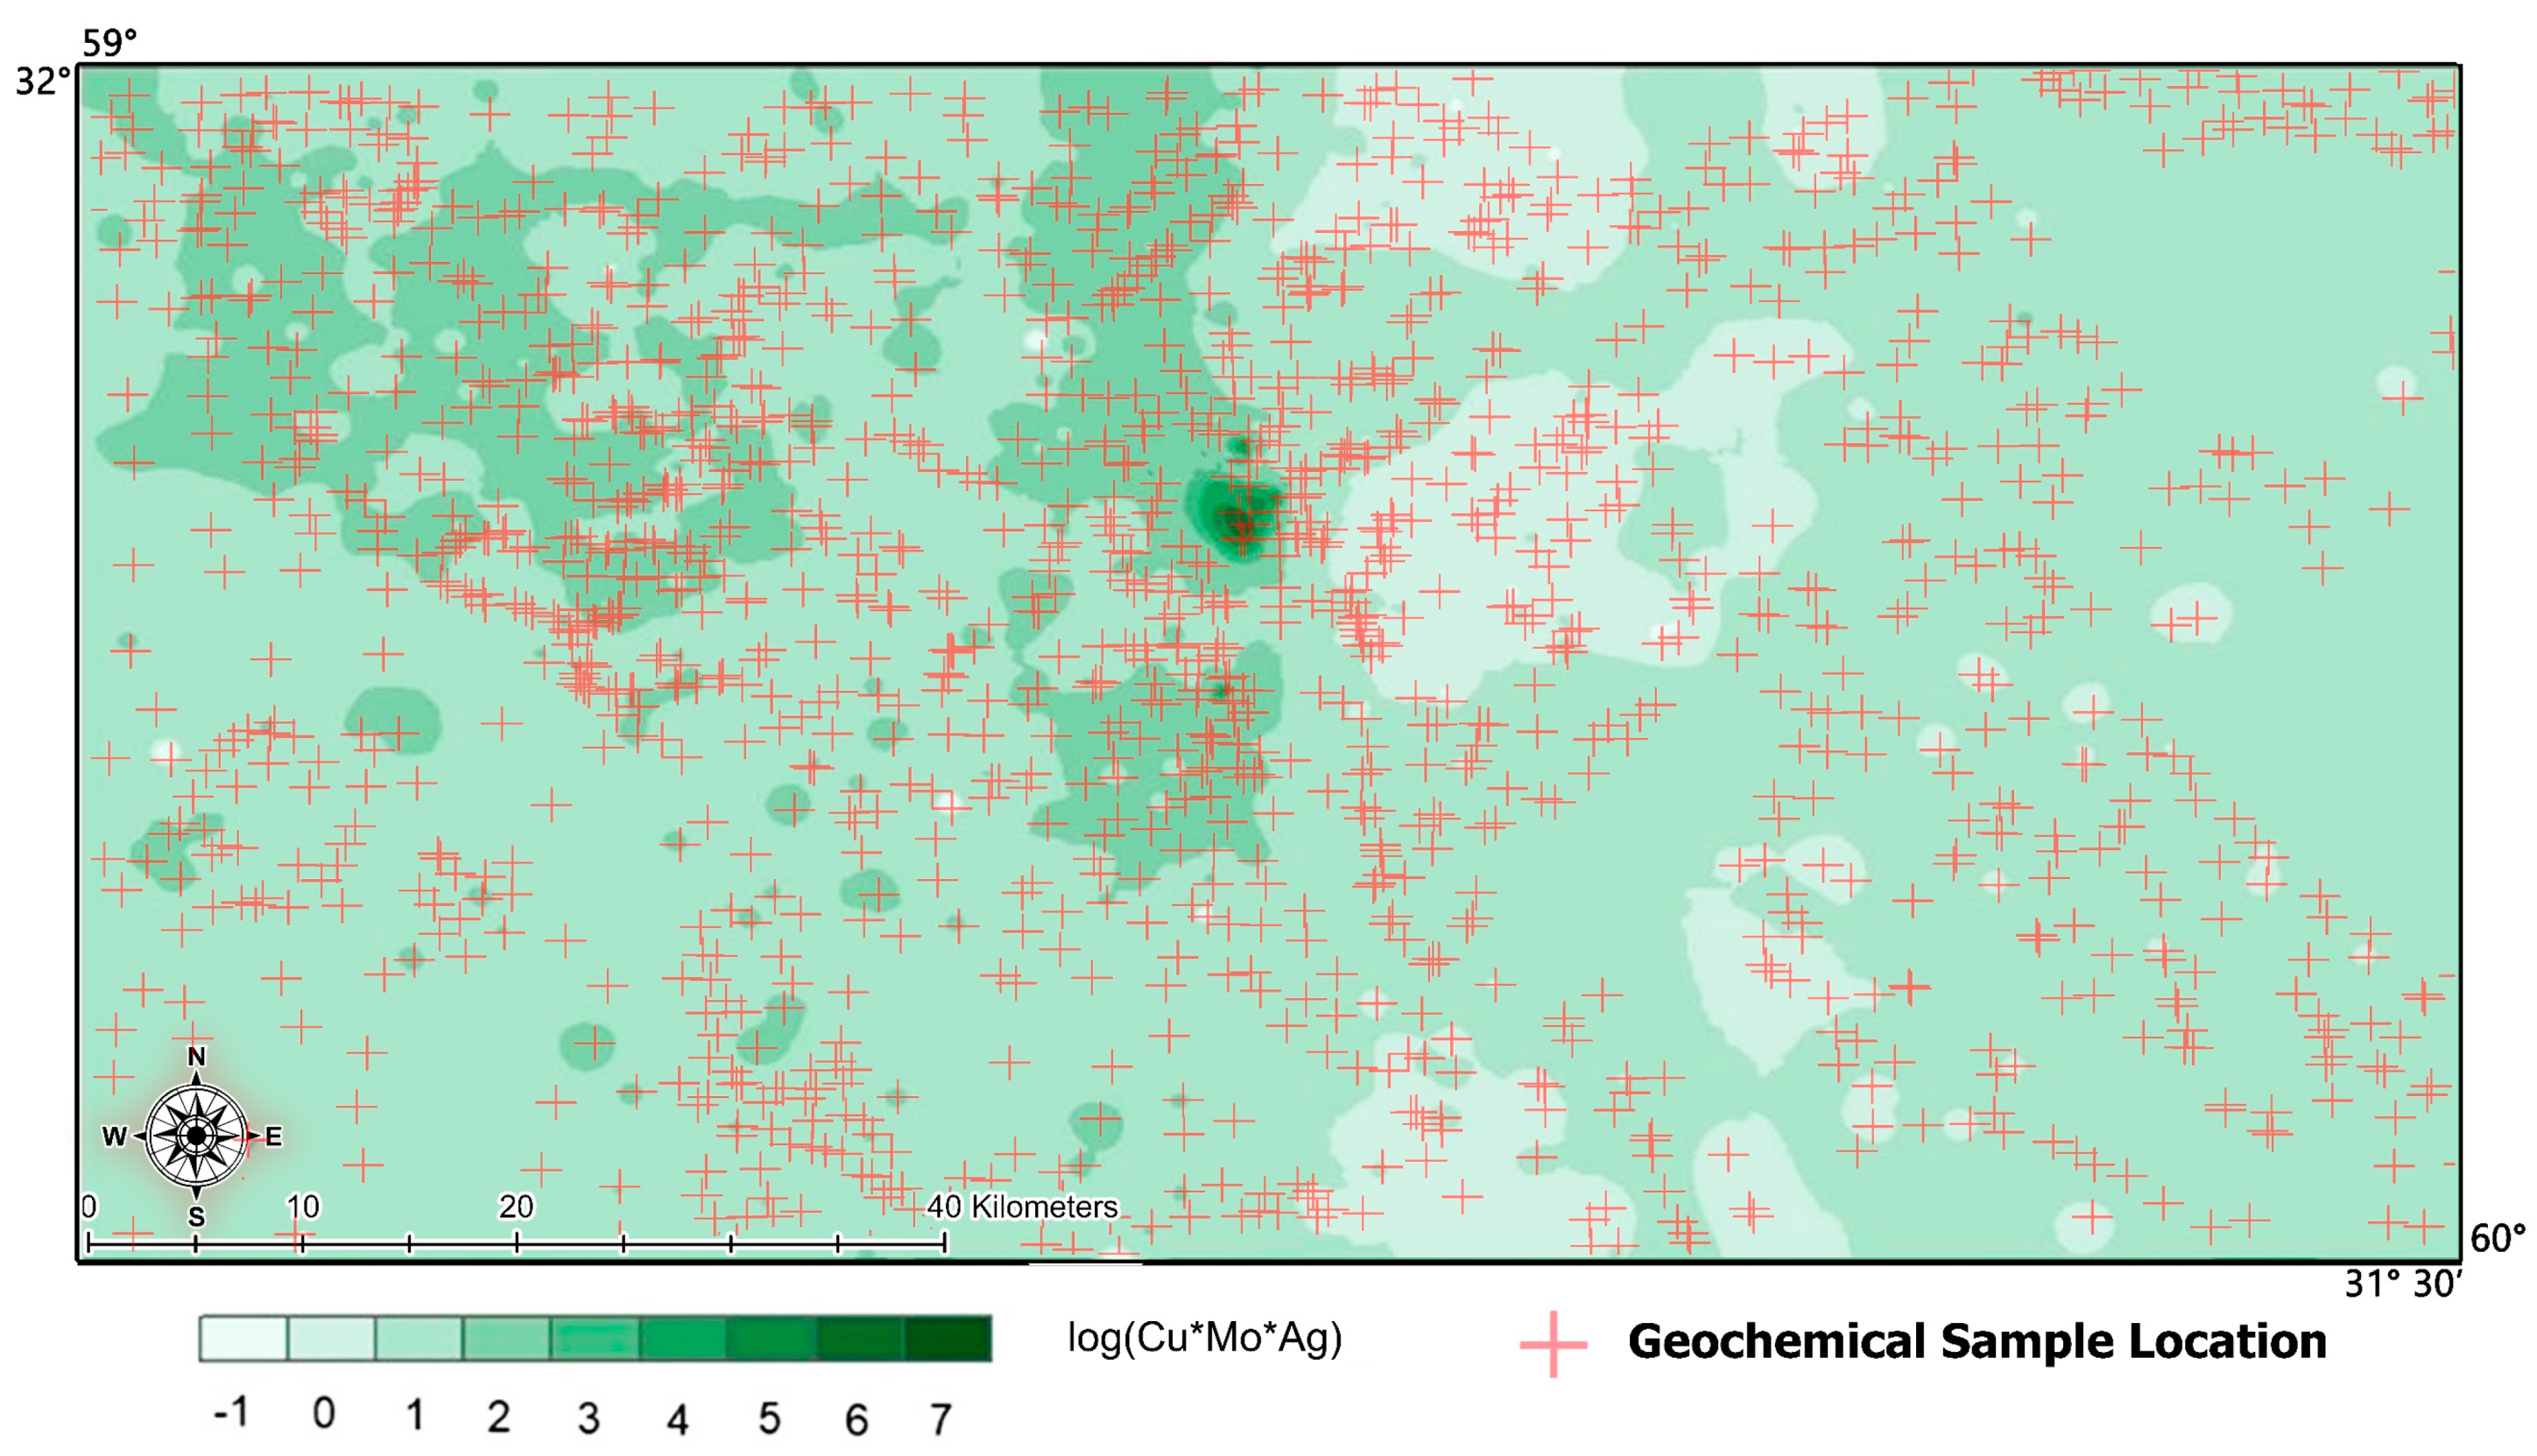
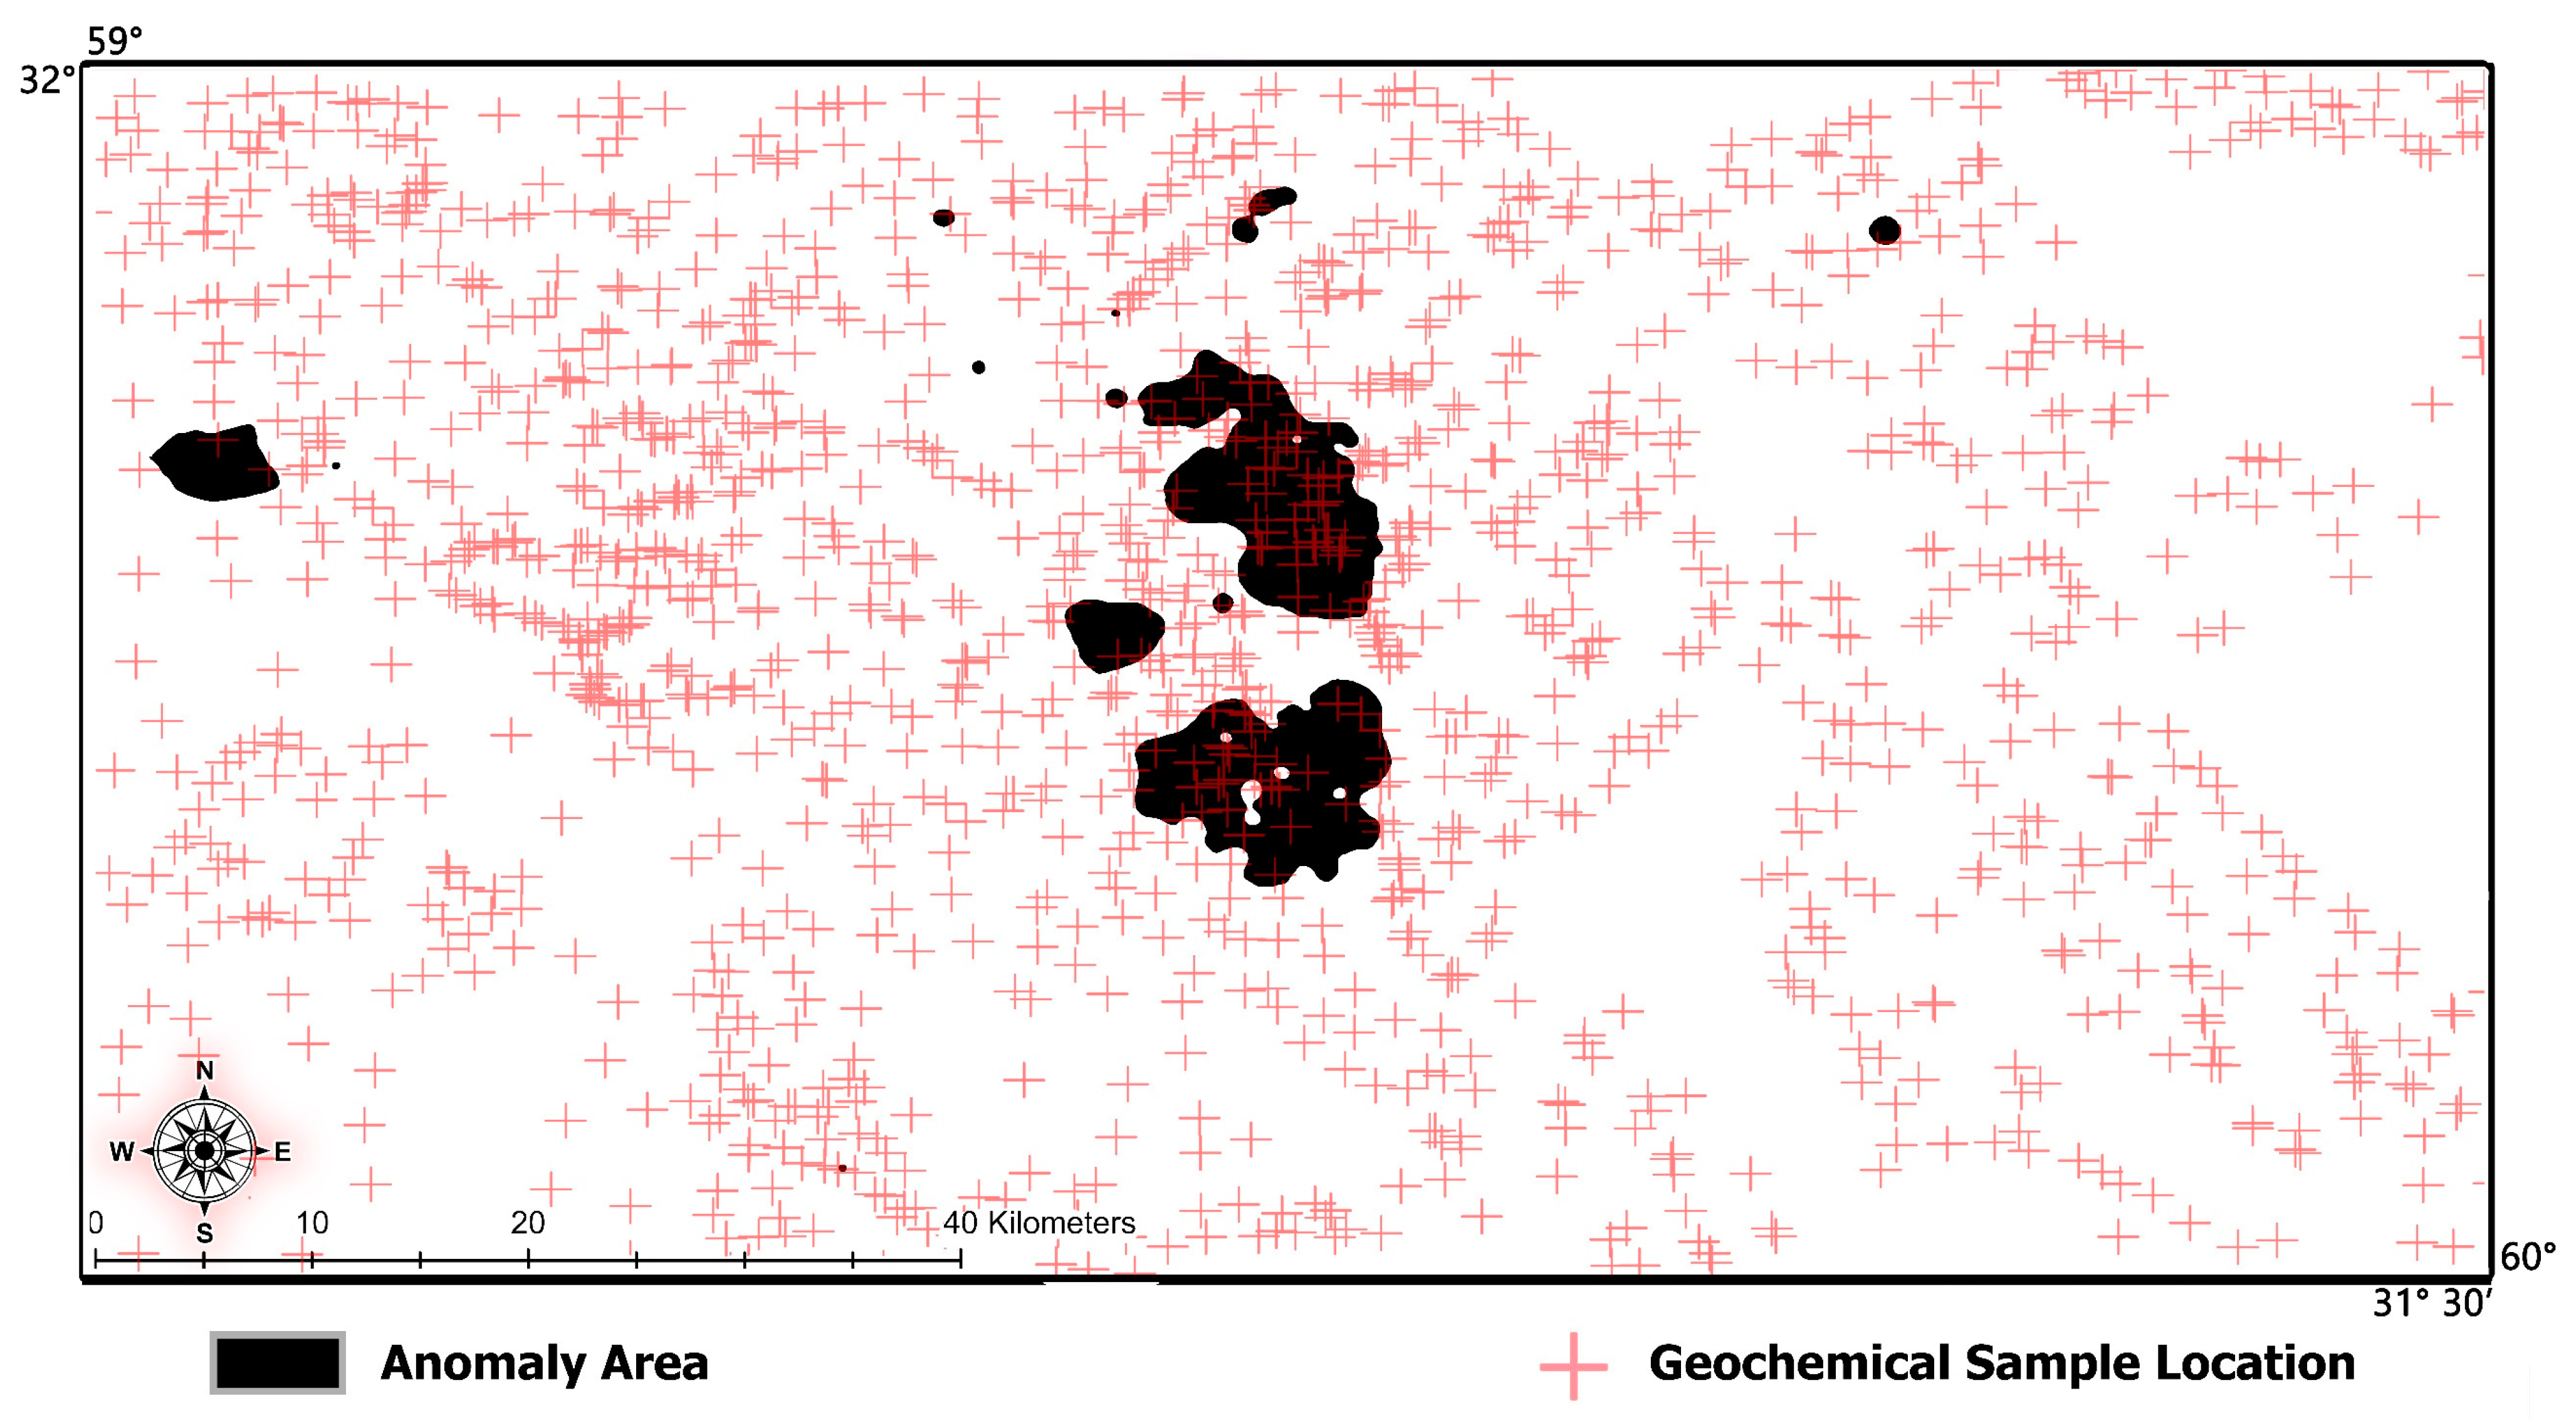
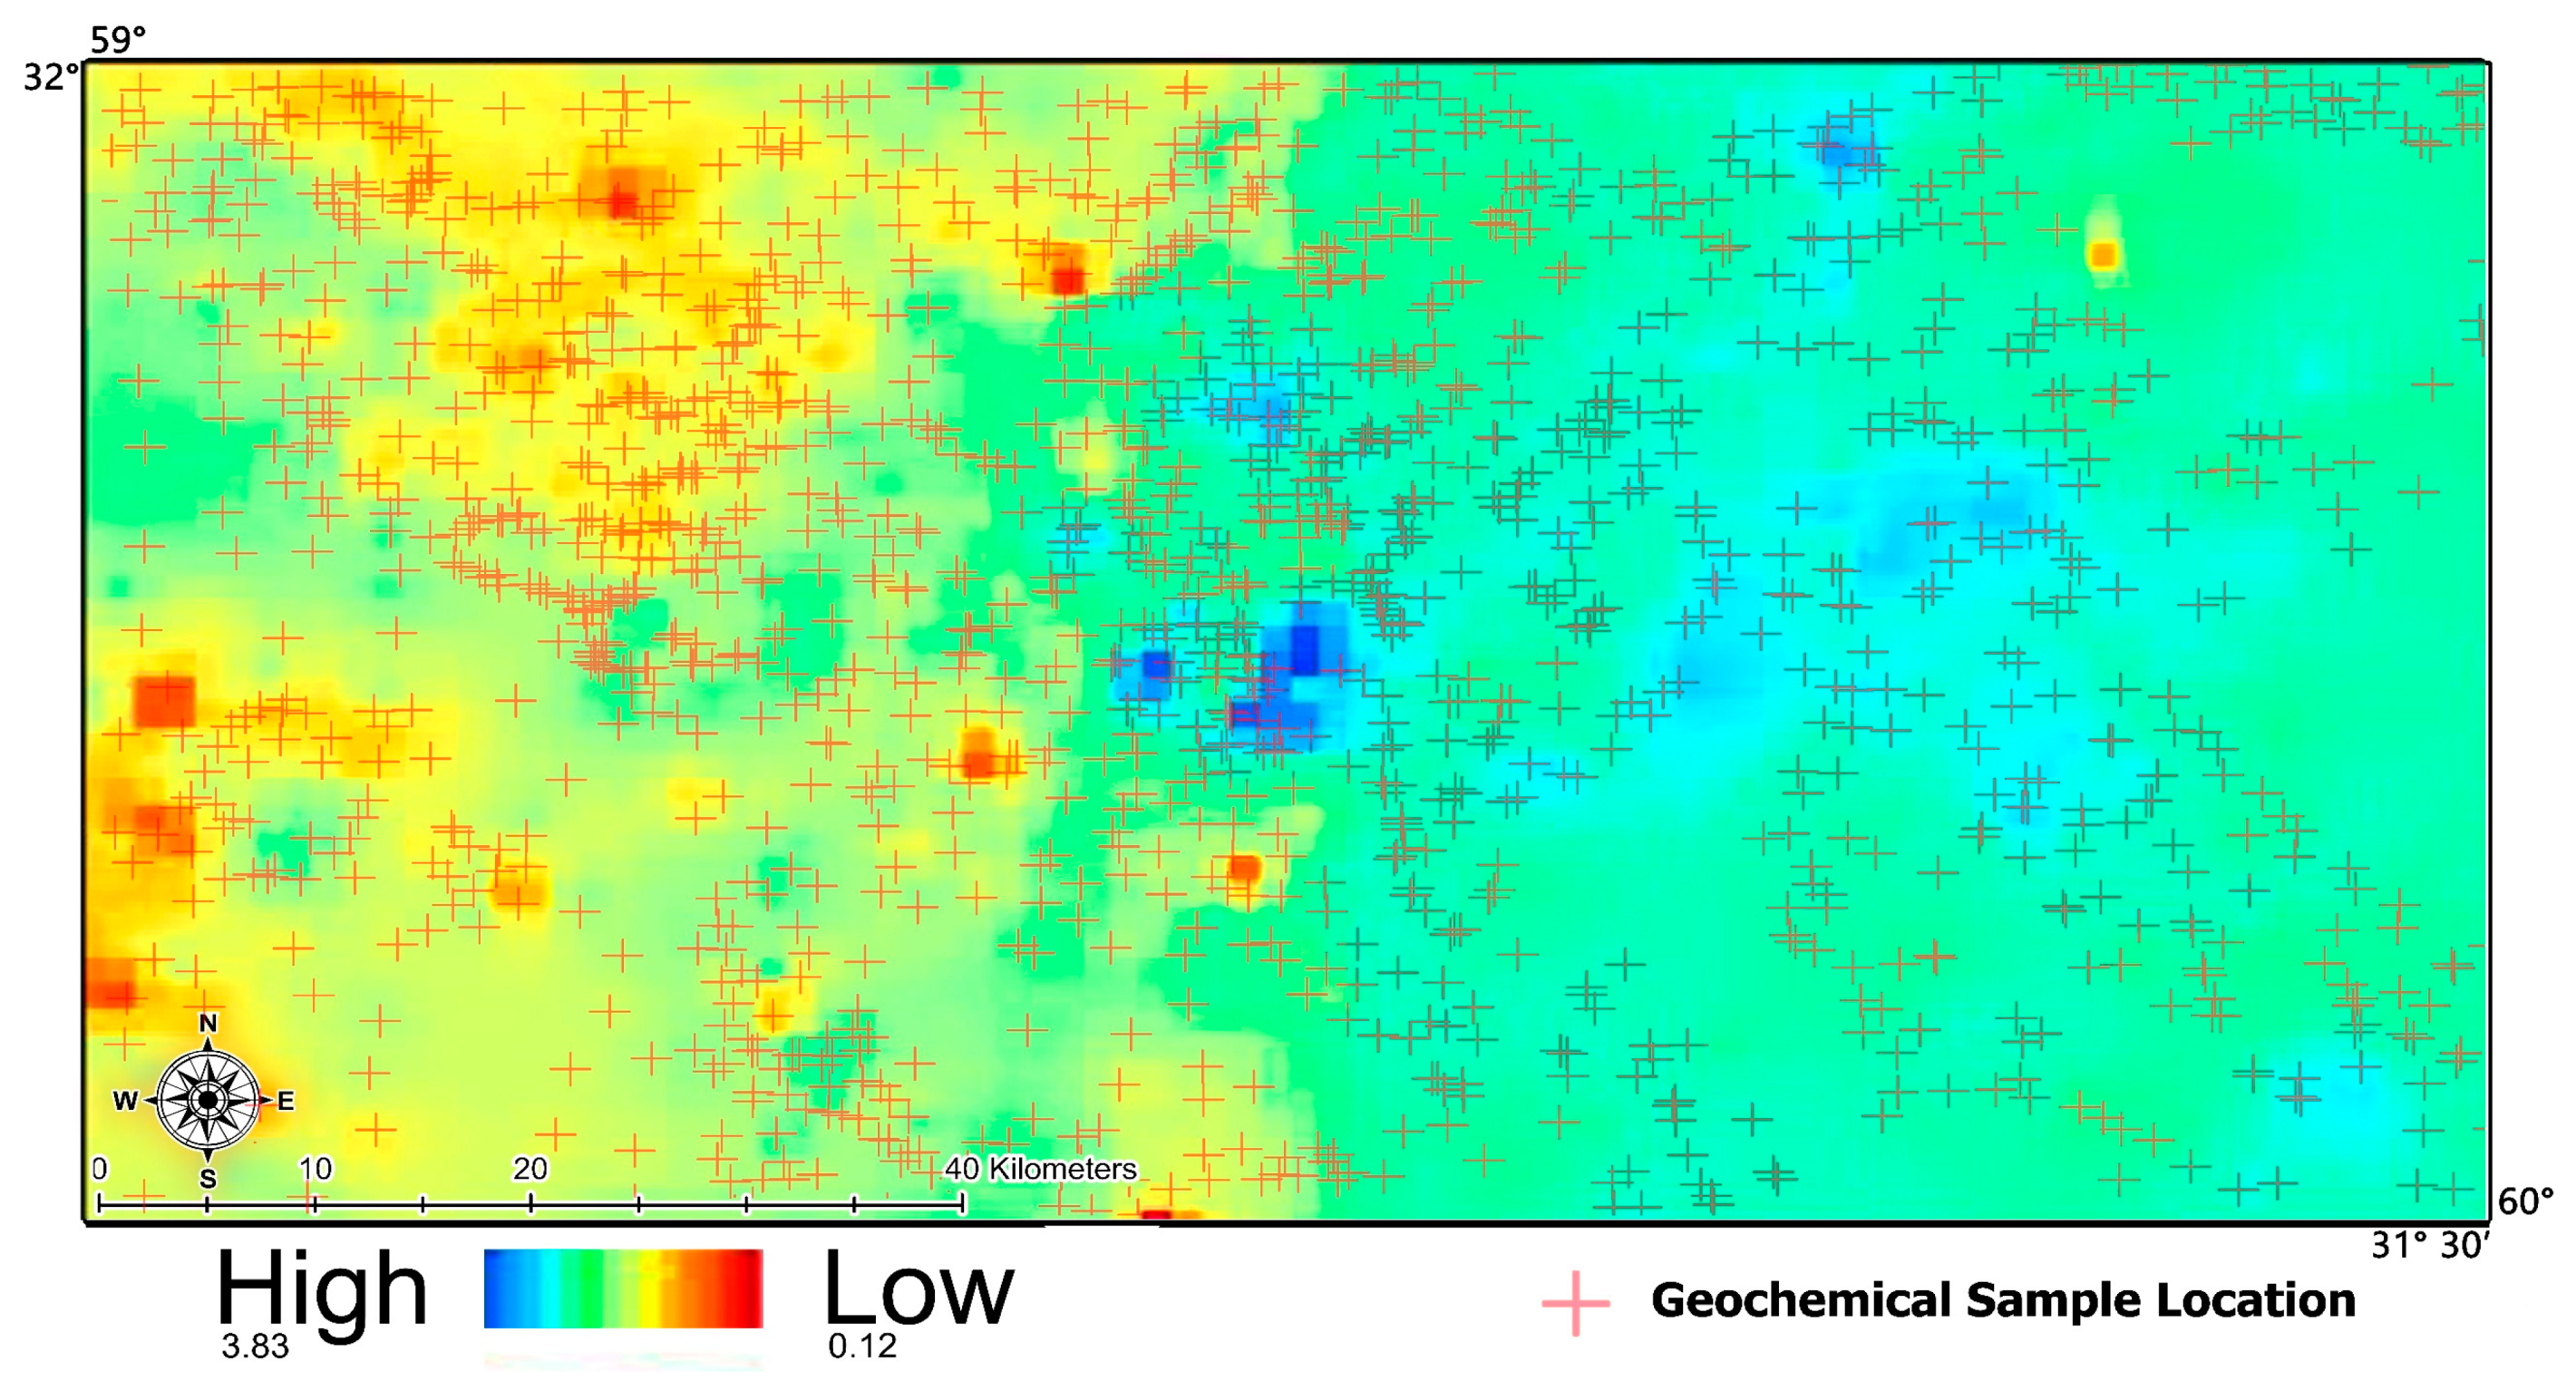
4.5. Geochemical Exploration by G(Vz3) Model
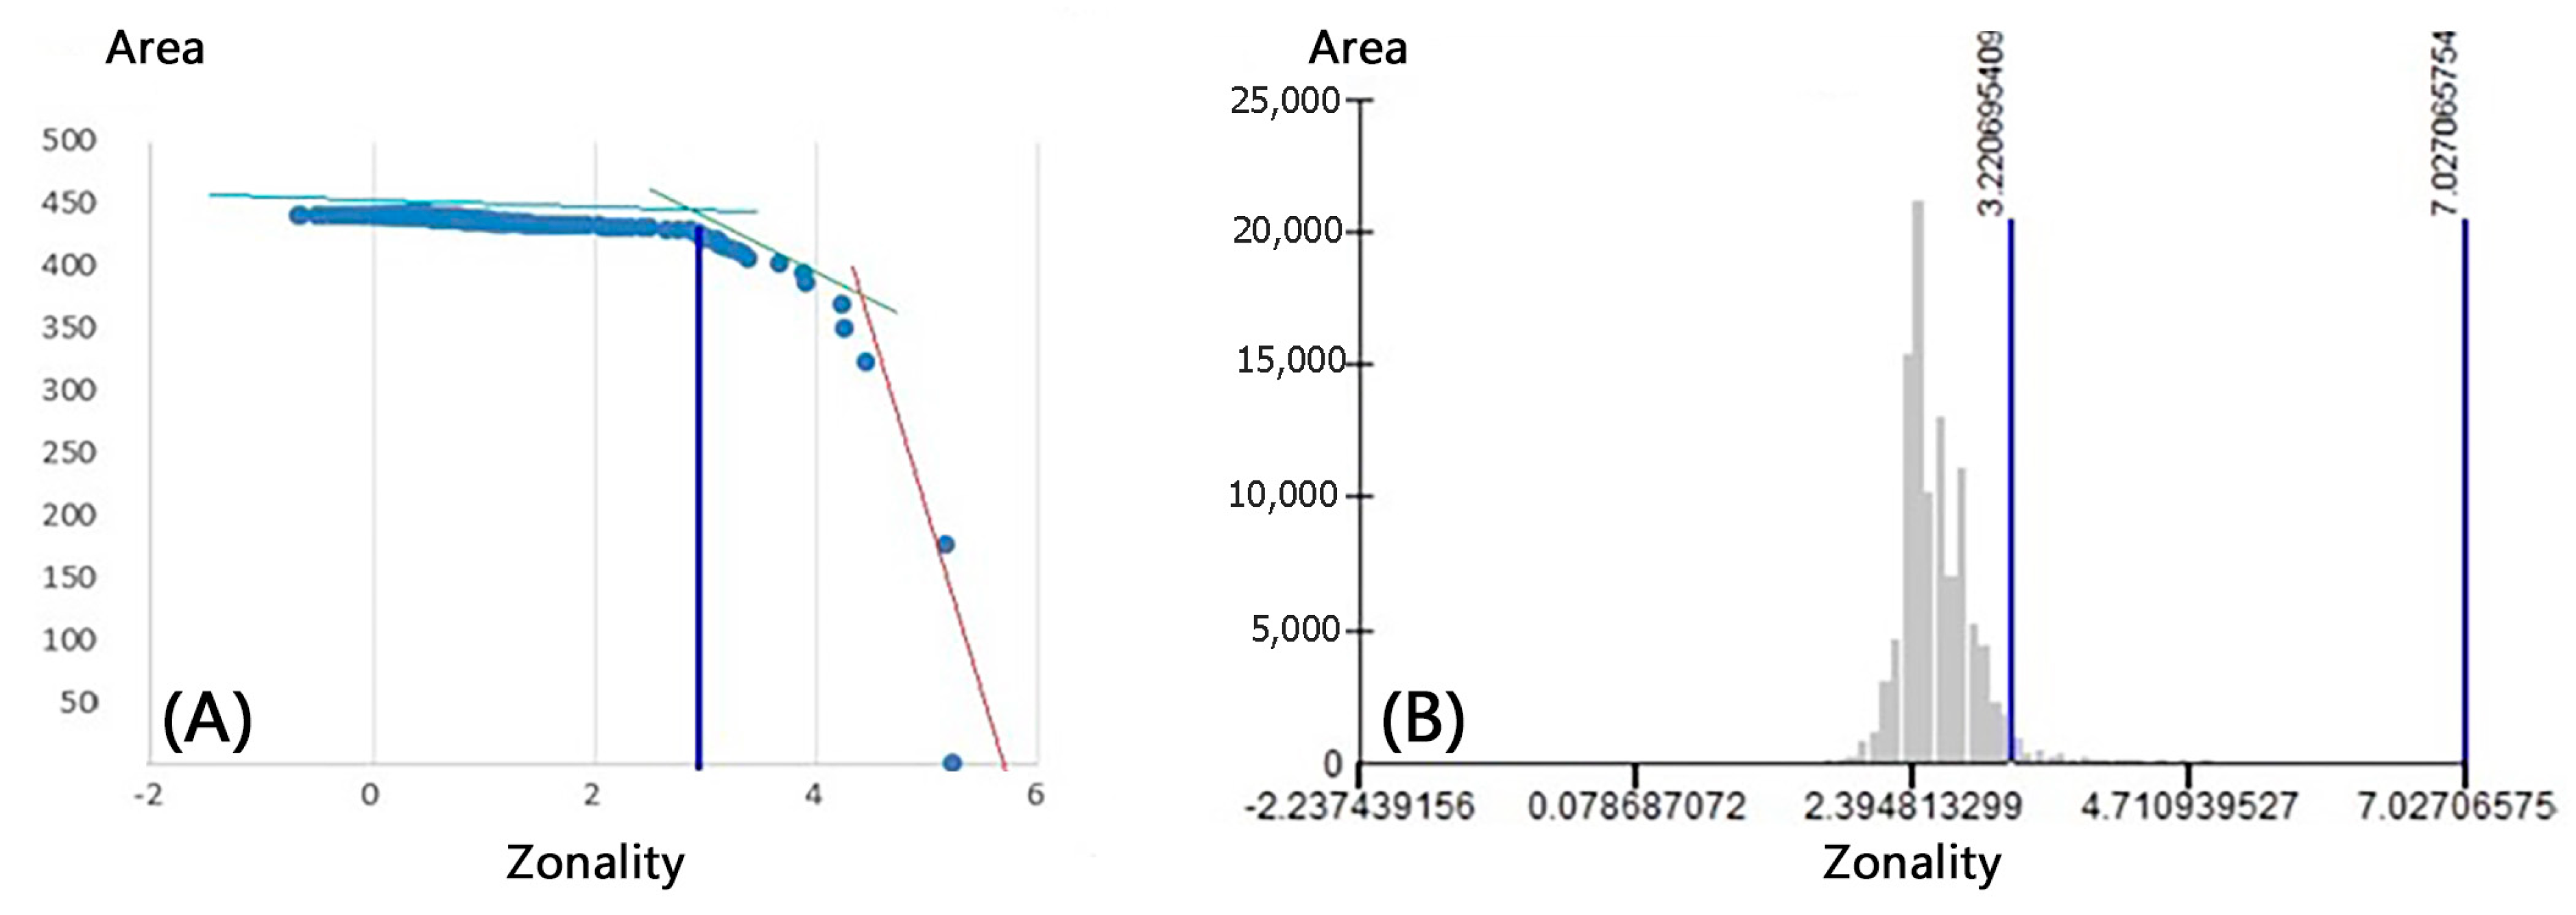
4.6. Concentration-Area (C-A) Multifractal Analysis
4.7. Singularity Analysis
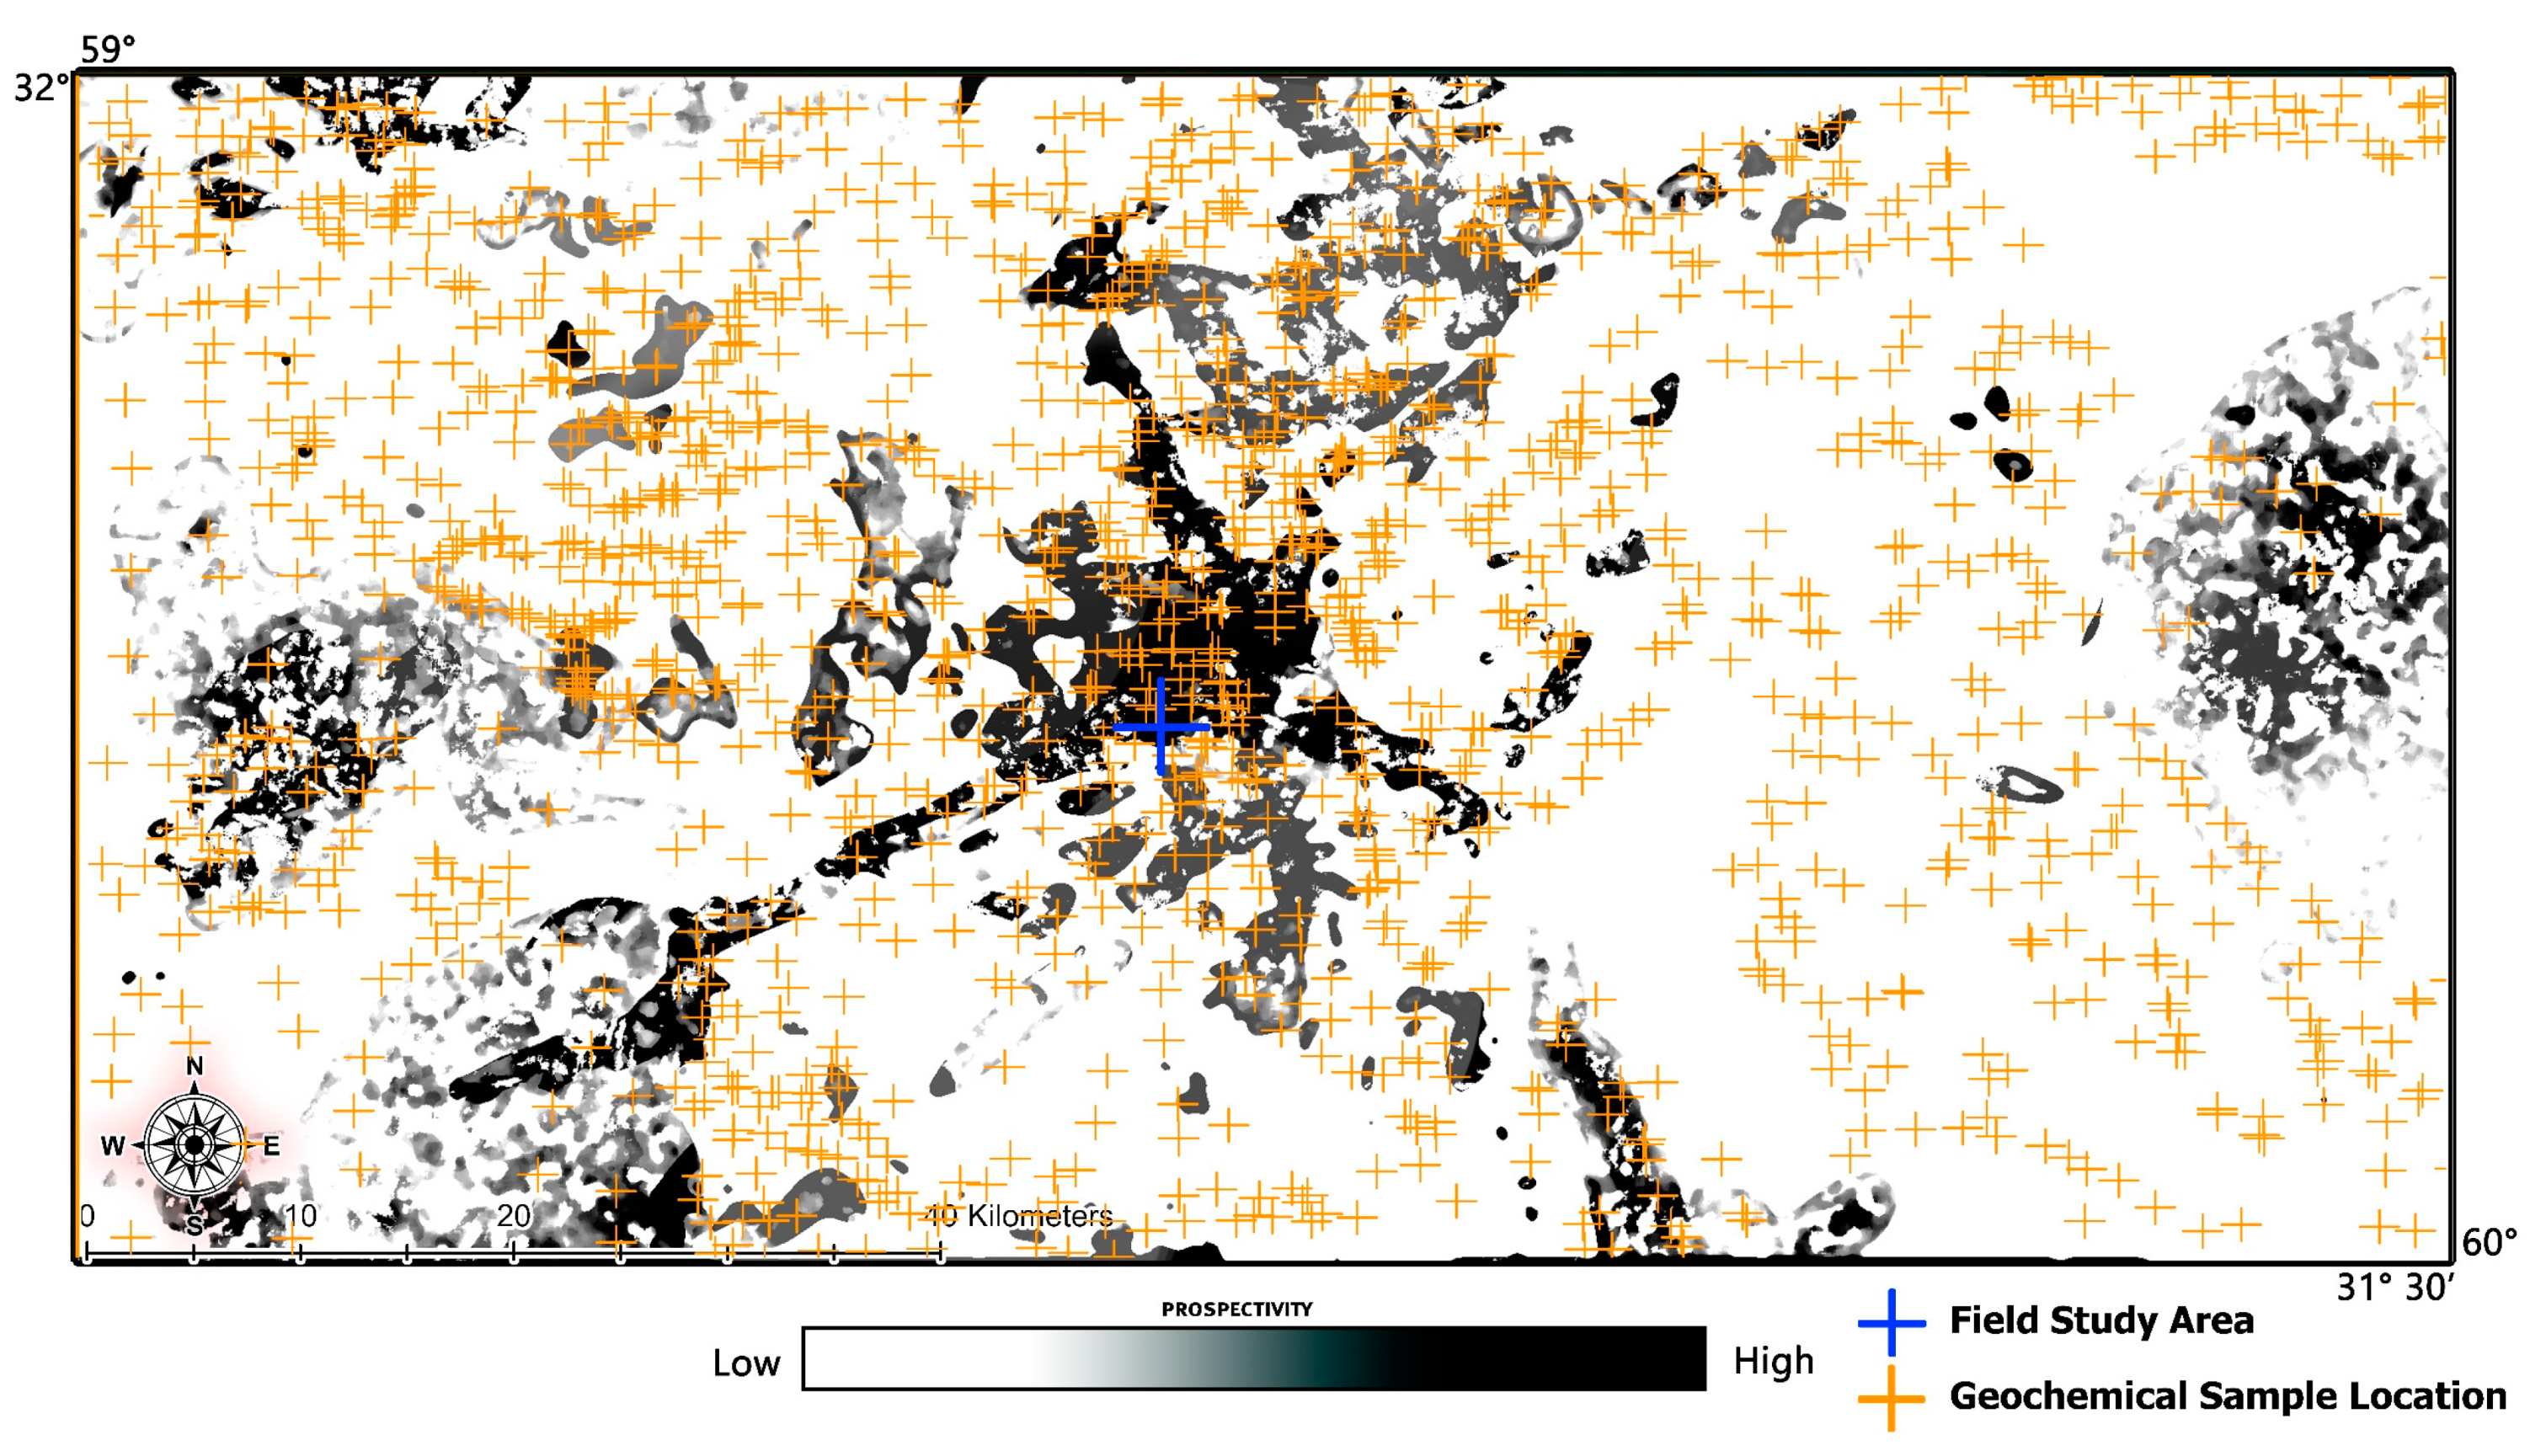
4.8. Hybrid Fuzzy-Analytic Hierarchy Process (Fuzzy-AHP) Method
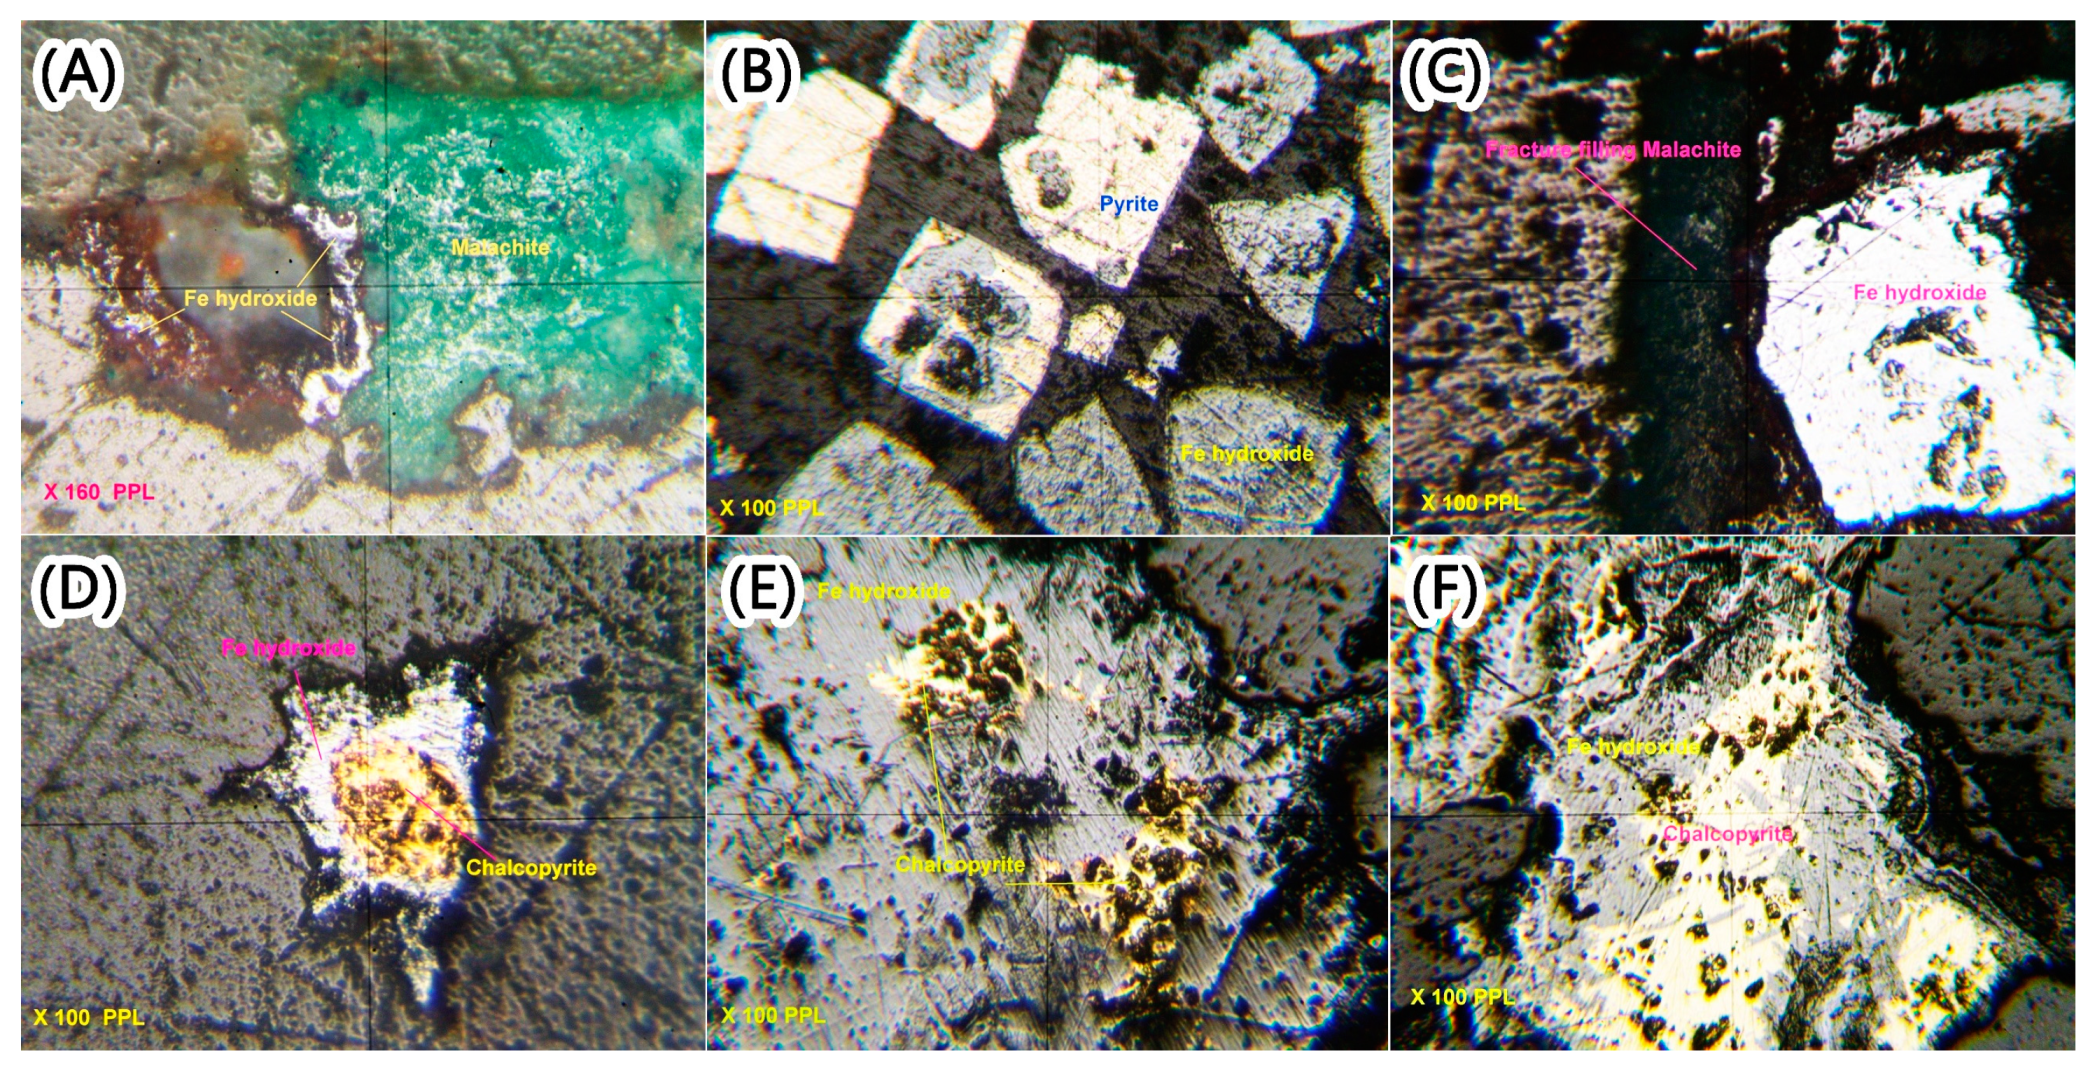
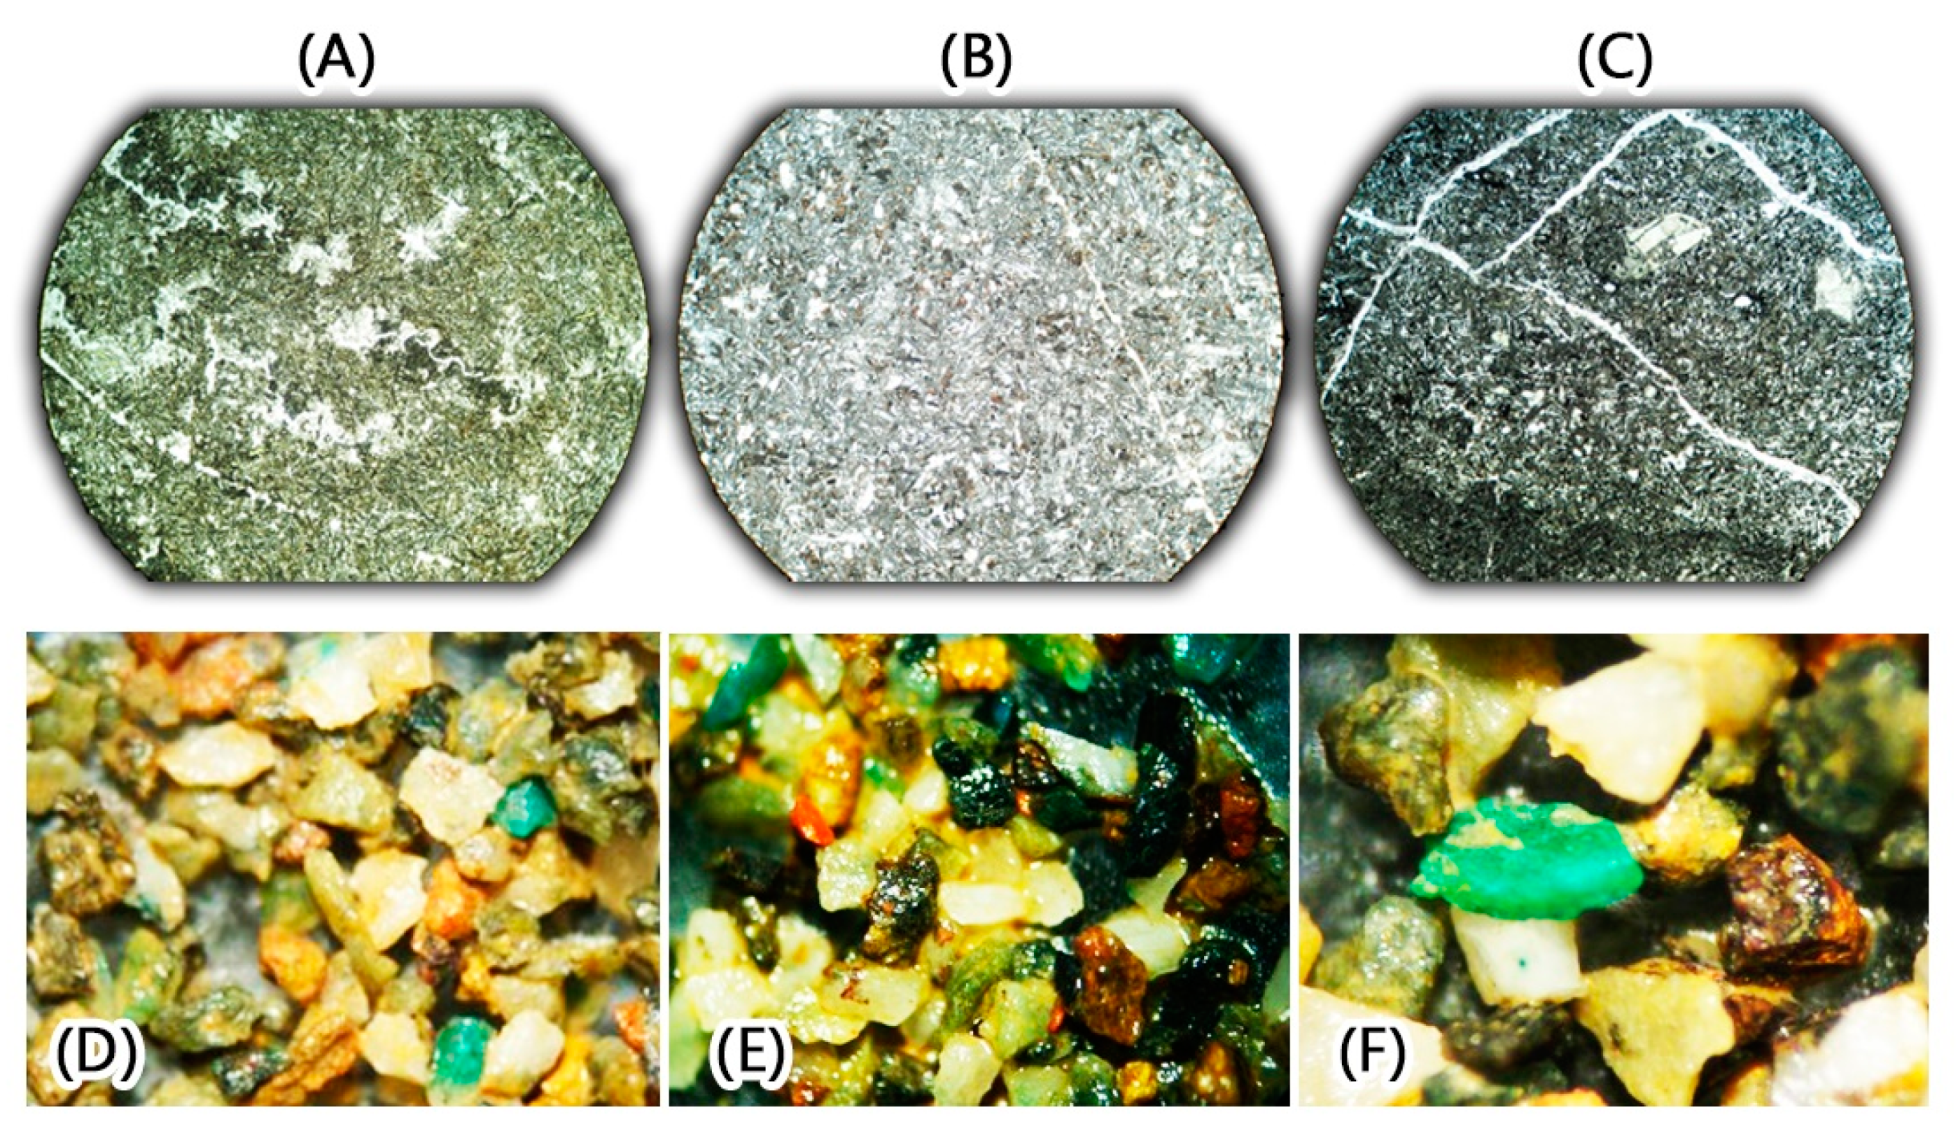
4.9. Fieldwork and Controlled Points
5. Conclusions
Author Contributions
Funding
Data Availability Statement
Acknowledgments
Conflicts of Interest
References
- Shirmard, H.; Farahbakhsh, E.; Pour, A.B.; Muslim, A.M.; Müller, R.D.; Chandra, R. Integration of selective dimensionality reduction techniques for mineral exploration using ASTER satellite data. Remote Sens. 2020, 12, 1261. [Google Scholar] [CrossRef] [Green Version]
- Parsa, M.; Maghsoudi, A. Assessing the effects of mineral systems-derived exploration targeting criteria for Random Forests-based predictive mapping of mineral prospectivity in Ahar-Arasbaran area, Iran. Ore Geol. Rev. 2021, 138, 104399. [Google Scholar] [CrossRef]
- Bahrami, Y.; Hassani, H.; Maghsoudi, A. Spatial modeling for mineral prospectivity using BWM and COPRAS as a new HMCDM method. Arab. J. Geosci. 2022, 15, 394. [Google Scholar] [CrossRef]
- Nafigin, I.O.; Ishmukhametova, V.T.; Ustinov, S.A.; Minaev, V.A.; Petrov, V.A. Geological and Mineralogical Mapping Based on Statistical Methods of Remote Sensing Data Processing of Landsat-8: A Case Study in the Southeastern Transbaikalia, Russia. Sustainability 2022, 14, 9242. [Google Scholar] [CrossRef]
- Bencharef, M.H.; Eldosouky, A.M.; Zamzam, S.; Boubaya, D. Polymetallic mineralization prospectivity modelling using multi-geospatial data in logistic regression: The Diapiric Zone, Northeastern Algeria. Geocarto Int. 2022, 1–36. [Google Scholar] [CrossRef]
- Mahdi, A.M.; Eldosouky, A.M.; El Khateeb, S.O.; Youssef, A.M.; Saad, A.A. Integration of remote sensing and geophysical data for the extraction of hydrothermal alteration zones and lineaments; Gabal Shilman basement area, Southeastern Desert, Egypt. J. Afr. Earth Sci. 2022, 194, 104640. [Google Scholar] [CrossRef]
- Ekwok, S.E.; Akpan, A.E.; Achadu, O.-I.M.; Thompson, C.E.; Eldosouky, A.M.; Abdelrahman, K.; Andráš, P. Towards Understanding the Source of Brine Mineralization in Southeast Nigeria: Evidence from High-Resolution Airborne Magnetic and Gravity Data. Minerals 2022, 12, 146. [Google Scholar] [CrossRef]
- Elkhateeb, S.O.; Eldosouky, A.M.; Khalifa, M.O.; Aboalhassan, M. Probability of mineral occurrence in the Southeast of Aswan area, Egypt, from the analysis of aeromagnetic data. Arab. J. Geosci. 2021, 14, 1514. [Google Scholar] [CrossRef]
- Riahi, S.; Bahroudi, A.; Abedi, M.; Aslani, S.; Elyasi, G.-R. Integration of airborne geophysics and satellite imagery data for exploration targeting in porphyry Cu systems: Chahargonbad district, Iran. Geophys. Prospect. 2021, 69, 1116–1137. [Google Scholar] [CrossRef]
- Riahi, S.; Bahroudi, A.; Abedi, M.; Aslani, S.; Elyasi, G. Evidential data integration to produce porphyry Cu prospectivity map, using a combination of knowledge and data-driven methods. Geophys. Prospect. 2022, 70, 421–437. [Google Scholar] [CrossRef]
- Maleki, M.; Niroomand, S.; Rajabpour, S.; Pour, A.B.; Ebrahimpour, S. Targeting local orogenic gold mineralization zones using data-driven evidential belief functions: The Godarsorkh area, Central Iran. All Earth 2022, 34, 259–278. [Google Scholar] [CrossRef]
- Ghorbani, M. The economic geology of Iran. In Mineral Deposits and Natural Resources; Springer: Berlin/Heidelberg, Germany, 2013; pp. 1–450. [Google Scholar]
- Jung, D.; Keller, J.; Khorasani, R.; Marcks, C.; Baumann, A.; Horn, P. Petrology of the Tertiary magmatic activity in the northern Lut area, east of Iran. Neues Jahrb. Für Geol. Und Paläontologie-Abh. 1983, 168, 417–467. [Google Scholar] [CrossRef]
- Samani, B.; Ashtari, S. Geological evolution of Sistan and Baluchestan area. J. Earth Sci. Geol. Surv. Iran. 1992, 1, 14–25. [Google Scholar]
- Mehrabi, B.; Fazel, E.T.; Yardley, B. Ore geology, fluid inclusions and OS stable isotope characteristics of Shurab Sb-polymetallic vein deposit, eastern Iran. Geochemistry 2019, 79, 307–322. [Google Scholar] [CrossRef]
- Ghorbani, M. Metallogenic and mining provinces, belts and zones of Iran. In The Economic Geology of Iran; Springer: Berlin/Heidelberg, Germany, 2013; pp. 199–295. [Google Scholar]
- Samiee, S.; Karimpour, M.H. Gold Metallogeny in the East of Iran. Period. Di Mineral. 2022, 91. [Google Scholar] [CrossRef]
- Shafaroudi, A.M.; Karimpour, M.H. Mineralogic, fluid inclusion, and sulfur isotope evidence for the genesis of Sechangi lead–zinc (–copper) deposit, Eastern Iran. J. Afr. Earth Sci. 2015, 107, 1–14. [Google Scholar] [CrossRef]
- Karimpour, M.H.; Stern, C.; Malekzadeh, A.; Hidarian, M.; Mazaheri, A. Petrochemistry of the reduced, ilmenite-series granitoid intrusion related to the Hired gold-tin prospect (Basiran), Eastern Iran. J. Appl. Sci. 2009, 9, 226–236. [Google Scholar] [CrossRef] [Green Version]
- Shafaroudi, A.M.; Karimpour, M.H. Geology, mineralization, and fluid inclusion studies of the Howz-e-Rais lead-zinc-copper deposit, Eastern Iran. Adv. Appl. Geol. 2012, 2, 63–73. [Google Scholar]
- Aryafar, A.; Moeini, H.; Khosravi, V. CRFA-CRBM: A hybrid technique for anomaly recognition in regional geochemical exploration; case study: Dehsalm area, east of Iran. Int. J. Min. Geo-Eng. 2020, 54, 33–38. [Google Scholar]
- Keykhay-Hosseinpoor, M.; Kohsary, A.H.; Hossein-Morshedy, A.; Porwal, A. A machine learning-based approach to exploration targeting of porphyry Cu-Au deposits in the Dehsalm district, eastern Iran. Ore Geol. Rev. 2020, 116, 103234. [Google Scholar] [CrossRef]
- Arjmandzadeh, R.; Santos, J. Sr–Nd isotope geochemistry and tectonomagmatic setting of the Dehsalm Cu–Mo porphyry mineralizing intrusives from Lut Block, eastern Iran. Int. J. Earth Sci. 2014, 103, 123–140. [Google Scholar] [CrossRef] [Green Version]
- Shirazi, A.; Hezarkhani, A.; Pour, A.B. Fusion of Lineament Factor (LF) Map Analysis and Multifractal Technique for Massive Sulfide Copper Exploration: The Sahlabad Area, East Iran. Minerals 2022, 12, 549. [Google Scholar] [CrossRef]
- Khosravi, V.; Shirazi, A.; Shirazy, A.; Hezarkhani, A.; Pour, A.B. Hybrid Fuzzy-Analytic Hierarchy Process (AHP) Model for Porphyry Copper Prospecting in Simorgh Area, Eastern Lut Block of Iran. Mining 2021, 2, 1–12. [Google Scholar] [CrossRef]
- Bai, H.; Cao, Y.; Zhang, H.; Zhang, C.; Hou, S.; Wang, W. Combining fuzzy analytic hierarchy process with concentration–area fractal for mineral prospectivity mapping: A case study involving Qinling orogenic belt in central China. Appl. Geochem. 2021, 126, 104894. [Google Scholar] [CrossRef]
- Kharbish, S.; Eldosouky, A.M.; Amer, O. Integrating mineralogy, geochemistry and aeromagnetic data for detecting Fe–Ti ore deposits bearing layered mafic intrusion, Akab El-Negum, Eastern Desert, Egypt. Sci. Rep. 2022, 12, 1–19. [Google Scholar] [CrossRef] [PubMed]
- Iran, G.S.I. Basiran 1:100,000 Geological Map; GSI: Tehran, Iran, 1992. [Google Scholar]
- Iran, G.S.I. Koudakan 1:100,000 Geological Map; GSI: Tehran, Iran, 1993. [Google Scholar]
- Karimpour, M.H.; Stern, C.; Farmer, L.; Saadat, S. Review of age, Rb-Sr geochemistry and petrogenesis of Jurassic to Quaternary igneous rocks in Lut Block, Eastern Iran. Geopersia 2011, 1, 19–54. [Google Scholar]
- Moghaddam, M.J.; Karimpour, M.H.; Shafaroudi, A.M.; Santos, J.F.; Corfu, F. Middle Eocene magmatism in the Khur region (Lut Block, Eastern Iran): Implications for petrogenesis and tectonic setting. Int. Geol. Rev. 2021, 63, 1051–1066. [Google Scholar] [CrossRef]
- Maghfouri, S.; Hosseinzadeh, M.R.; Lentz, D.R.; Tajeddin, H.A.; Movahednia, M.; Shariefi, A. Nature of ore-forming fluids in the Mehdiabad world-class sub-seafloor replacement SEDEX-type Zn-Pb-Ba-(Cu-Ag) deposit, Iran; constraints from geochemistry, fluid inclusions, and OC-Sr isotopes. J. Asian Earth Sci. 2021, 207, 104654. [Google Scholar] [CrossRef]
- Nejad, A.T.; Khalaji, A.A.; Ebrahimi, M.; Biabangard, H.; Esmaeili, R. Petrology, geochemistry, source and tectonic setting of Malek Chah Ruii granitoid (East of Lut Block). Iran. J. Petrol. 2021, 12, 63–92. [Google Scholar]
- Ghorbani, M. A summary of geology of Iran. In The Economic Geology of Iran; Springer: Berlin/Heidelberg, Germany, 2013; pp. 45–64. [Google Scholar]
- Iran, G.S. Geochemical Map Report for Basiran and Kodegan 1:100,000 Map; GSI: Tehran, Iran, 1992. [Google Scholar]
- Shirazi, A.; Hezarkhani, A.; Pour, A.B.; Shirazy, A.; Hashim, M. Neuro-Fuzzy-AHP (NFAHP) Technique for Copper Exploration Using Advanced Spaceborne Thermal Emission and Reflection Radiometer (ASTER) and Geological Datasets in the Sahlabad Mining Area, East Iran. Remote Sens. 2022, 14, 5562. [Google Scholar] [CrossRef]
- Aliabad, F.A.; Shojaei, S.; Zare, M.; Ekhtesasi, M.R. Assessment of the fuzzy ARTMAP neural network method performance in geological mapping using satellite images and Boolean logic. Int. J. Environ. Sci. Technol. 2019, 16, 3829–3838. [Google Scholar] [CrossRef]
- Ahmadi, H.; Uygucgil, H. Targeting iron prospective within the Kabul Block (SE Afghanistan) via hydrothermal alteration mapping using remote sensing techniques. Arab. J. Geosci. 2021, 14, 183. [Google Scholar] [CrossRef]
- Shirazi, A.; Hezarkhani, A.; Shirazy, A. Remote sensing studies for mapping of iron oxide regions, South of Kerman, Iran. Int. J. Sci. Eng. Appl. 2018, 7, 45–51. [Google Scholar] [CrossRef]
- Esmaeili, J.; Khakzad, A.; Abedini, M.V. Integration and analysis of geology data and Remote sensing methods for identification and separate of alternations iron ore of kamoo (Meymeh-Isfahan). Sci. Q. J. Geosci. 2020, 29, 15–22. [Google Scholar]
- Shirazy, A.; Hezarkhani, A.; Timkin, T.; Shirazi, A. Investigation of Magneto-/Radio-Metric Behavior in Order to Identify an Estimator Model Using K-Means Clustering and Artificial Neural Network (ANN) (Iron Ore Deposit, Yazd, IRAN). Minerals 2021, 11, 1304. [Google Scholar] [CrossRef]
- Safronov, N. Dispersion haloes of ore deposits and their use in exploration. Probl. Sov. Geol. 1936, 4, 41–53. [Google Scholar]
- Carranza, E.J.M. Primary geochemical characteristics of mineral deposits: Implications for exploration. Ore Geol. Rev. 2012, 45, 1–4. [Google Scholar] [CrossRef]
- Ziaii, M. Lithogeochemical Exploration Methods for Porphyry Copper Deposit in Sungun, NW Iran. Master’s Thesis, Moscow State University (MSU), Moscow, Russia, 1996; p. 98. [Google Scholar]
- Safari, S.; Ziaii, M.; Ghoorchi, M. Integration of singularity and zonality methods for prospectivity map of blind mineralization. Int. J. Min. Geo-Eng. 2016, 50, 189–194. [Google Scholar]
- Likas, A.; Vlassis, N.; Verbeek, J.J. The global k-means clustering algorithm. Pattern Recognit. 2003, 36, 451–461. [Google Scholar] [CrossRef] [Green Version]
- Saha, S.; Bandyopadhyay, S. A generalized automatic clustering algorithm in a multiobjective framework. Appl. Soft Comput. 2013, 13, 89–108. [Google Scholar] [CrossRef]
- Hezarkhani, A.; Ghannadpour, S.S. Geochemical Behavior Investigation Based on K-Means Clustering: Basics, Concepts and Case Study; LAP LAMBERT Academic Publishing: Saarbrücken, Germany, 2015. [Google Scholar]
- Shirazi, A.; Shirazy, A.; Saki, S.; Hezarkhani, A. Introducing a software for innovative neuro-fuzzy clustering method named NFCMR. Glob. J. Comput. Sci. Theory Res. 2018, 8, 62–69. [Google Scholar] [CrossRef]
- Shirazy, A.; Shirazi, A.; Hezarkhani, A. Behavioral Analysis of Geochemical Elements in Mineral Exploration:-Methodology and Case Study; LAP LAMBERT Academic Publishing: Saarbrücken, Germany, 2020. [Google Scholar]
- Chen, L.; Guan, Q.; Feng, B.; Yue, H.; Wang, J.; Zhang, F. A multi-convolutional autoencoder approach to multivariate geochemical anomaly recognition. Minerals 2019, 9, 270. [Google Scholar] [CrossRef] [Green Version]
- Rantitsch, G. The fractal properties of geochemical landscapes as an indicator of weathering and transport processes within the Eastern Alps. J. Geochem. Explor. 2001, 73, 27–42. [Google Scholar] [CrossRef]
- Nazarpour, A. Application of CA fractal model and exploratory data analysis (EDA) to delineate geochemical anomalies in the: Takab 1: 25,000 geochemical sheet, NW Iran. Iran. J. Earth Sci. 2018, 10, 173–180. [Google Scholar]
- Shuguang, Z.; Kefa, Z.; Yao, C.; Jinlin, W.; Jianli, D. Exploratory data analysis and singularity mapping in geochemical anomaly identification in Karamay, Xinjiang, China. J. Geochem. Explor. 2015, 154, 171–179. [Google Scholar] [CrossRef]
- Zuo, R.; Xia, Q.; Zhang, D. A comparison study of the C–A and S–A models with singularity analysis to identify geochemical anomalies in covered areas. Appl. Geochem. 2013, 33, 165–172. [Google Scholar] [CrossRef]
- Zuo, R.; Wang, J.; Chen, G.; Yang, M. Identification of weak anomalies: A multifractal perspective. J. Geochem. Explor. 2015, 148, 12–24. [Google Scholar] [CrossRef]
- Liu, Y.; Xia, Q.; Cheng, Q.; Wang, X. Application of singularity theory and logistic regression model for tungsten polymetallic potential mapping. Nonlinear Process. Geophys. 2013, 20, 445–453. [Google Scholar] [CrossRef] [Green Version]
- Turcotte, D.L. Fractals and Chaos in Geology and Geophysics, 2nd ed.; Cornell University: New York, NY, USA, 1997. [Google Scholar]
- Zuo, R.; Cheng, Q.; Agterberg, F.; Xia, Q. Application of singularity mapping technique to identify local anomalies using stream sediment geochemical data, a case study from Gangdese, Tibet, western China. J. Geochem. Explor. 2009, 101, 225–235. [Google Scholar] [CrossRef]
- Khan, S.A.; Naim, I.; Kusi-Sarpong, S.; Gupta, H.; Idrisi, A.R. A knowledge-based experts’ system for evaluation of digital supply chain readiness. Knowl.-Based Syst. 2021, 228, 107262. [Google Scholar] [CrossRef]
- Wang, C.-N.; Nguyen, N.-A.; Dang, T.-T.; Lu, C.-M.A. A compromised decision-making approach to third-party logistics selection in sustainable supply chain using fuzzy AHP and fuzzy VIKOR methods. Mathematics 2021, 9, 886. [Google Scholar] [CrossRef]
- Padma, T.; Shantharajah, S.; Ramadoss, P. Hybrid Fuzzy AHP and Fuzzy TOPSIS Decision Model for Aquaculture Species Selection. Int. J. Inf. Technol. Decis. Mak. 2022, 21, 999–1030. [Google Scholar] [CrossRef]
- Shirazy, A.; Shirazi, A.; Heidarlaki, S.; Ziaii, M. Exploratory Remote Sensing Studies to Determine the Mineralization Zones around the Zarshuran Gold Mine. Int. J. Sci. Eng. Appl. 2018, 7, 274–279. [Google Scholar] [CrossRef]
- Payamani, A.; Babaei, B.; Dehghan, S.; Harouni, H.A. Applying various satellite image processing methods on Aster and Landsat ETM+ data to identify and separate the alteration zones around gold mine of Akhtarchi, Khomein, Iran. Nexo Rev. Científica 2020, 33, 490–510. [Google Scholar] [CrossRef]
- Ziaii, M.; Carranza, E.J.M.; Ziaei, M. Application of geochemical zonality coefficients in mineral prospectivity mapping. Comput. Geosci. 2011, 37, 1935–1945. [Google Scholar] [CrossRef]
- Shirazi, A.; Shirazy, A.; Karami, J. Remote sensing to identify copper alterations and promising regions, Sarbishe, South Khorasan, Iran. Int. J. Geol. Earth Sci. 2018, 4, 36–52. [Google Scholar]
- Shirazy, A.; Hezarkhani, A.; Shirazi, A.; Khakmardan, S.; Rooki, R. K-Means Clustering and General Regression Neural Network Methods for Copper Mineralization probability in Chahar-Farsakh, Iran. Türkiye Jeol. Bülteni 2022, 65, 79–92. [Google Scholar]
- Shirazy, A. Investigation of Geochemical Sections in Exploratory Boreholes of Mesgaran Copper Deposit in Iran. Int. J. Res. Appl. Sci. Eng. Technol. 2021, 9, 2364–2368. [Google Scholar] [CrossRef]
- Alahgholi, S.; Shirazy, A.; Shirazi, A. Geostatistical studies and anomalous elements detection, Bardaskan Area, Iran. Open J. Geol. 2018, 8, 697–710. [Google Scholar] [CrossRef] [Green Version]
- Shirazy, A.; Hezarkhani, A.; Shirazy, A.; Timkin, T.V.; Voroshilov, V.G. Geophysical explorations by resistivity and induced polarization methods for the copper deposit, South Khorasan, Iran. Bull. Tomsk. Polytech. Univ. Geo Assets Eng. 2022, 333, 99–110. [Google Scholar] [CrossRef]
- Aali, A.A.; Shirazy, A.; Shirazi, A.; Pour, A.B.; Hezarkhani, A.; Maghsoudi, A.; Hashim, M.; Khakmardan, S. Fusion of Remote Sensing, Magnetometric, and Geological Data to Identify Polymetallic Mineral Potential Zones in Chakchak Region, Yazd, Iran. Remote Sens. 2022, 14, 6018. [Google Scholar] [CrossRef]
- Saaty, T.L. Fundamentals of Decision Making and Priority with the AHP; RWS Publications: Pittsbergh, PA, USA, 1994. [Google Scholar]
- Goepel, K.D. Implementation of an online software tool for the analytic hierarchy process (AHP-OS). Int. J. Anal. Hierarchy Process 2018, 10, 469–487. [Google Scholar]


| Elements | Cu | Au | Ag | Bi | Mo | Pb | Zn |
|---|---|---|---|---|---|---|---|
| Mean (ppm) | 38.88 | 2.53 | 0.16 | 0.85 | 1.27 | 19.15 | 107.75 |
| Median (ppm) | 38.84 | 1.10 | 0.13 | 0.30 | 1.15 | 15.40 | 98.57 |
| Mode (ppm) | 17.30 | 1.00 | 0.05 | 0.30 | 1.35 | 17.00 | 74.00 |
| Std. Deviation (ppm) | 69.35 | 25.10 | 0.51 | 4.00 | 2.26 | 27.28 | 44.03 |
| Variance (ppm2) | 4809.79 | 629.84 | 0.26 | 15.96 | 5.10 | 744.27 | 1938.20 |
| Skewness | 21.15 | 25.19 | 21.92 | 9.18 | 29.14 | 13.03 | 2.78 |
| Kurtosis | 500.87 | 659.82 | 523.89 | 95.78 | 987.58 | 204.39 | 21.20 |
| Range (ppm) | 1738.28 | 702.95 | 13.37 | 57.03 | 78.70 | 520.29 | 588.89 |
| Minimum (ppm) | 0.15 | 0.30 | 0.01 | 0.10 | 0.30 | 0.15 | 0.15 |
| Maximum (ppm) | 1738.43 | 703.25 | 13.38 | 57.13 | 79.00 | 520.44 | 589.04 |
| Geochemical Communities | Threshold Limit of Supra-Mineral Elements (Pb*Zn*Bi) |
|---|---|
| Background | Pb*Zn*Bi < 1584 |
| Anomaly | 1584 < Pb*Zn*Bi < 14,850 |
| Enrichment | Pb*Zn*Bi ≤ 14,850 |
| Geochemical Communities | Threshold Limit of Sub-Mineral Elements (Ag*Cu*Mo) |
|---|---|
| Background | Cu*Mo*Ag < 6.3 |
| Anomaly | 6.3 < Cu*Mo*Ag < 31 |
| Enrichment | Cu*Mo*Ag ≤ 31 |
| Main-Criteria Weighting | ||||||
| Geology | Geochemistry | Geophysics | Remote Sensing | Priority | Rank | |
| Geology | 1 | 0.33 | 2 | 1 | 17.90% | 2 |
| Geochemistry | 3 | 1 | 7 | 3 | 55.70% | 1 |
| Geophysics | 0.5 | 0.14 | 1 | 0.5 | 8.60% | 3 |
| Remote Sensing | 1 | 0.33 | 2 | 1 | 17.90% | 2 |
| Sub-Criteria Weighting | ||||||
| Andesite | Basalt | Ophiolite | Priority | Rank | ||
| Geology | Andesite | 1 | 1 | 6 | 46.20% | 1 |
| Basalt | 1 | 1 | 6 | 46.20% | 1 | |
| Ophiolite | 0.17 | 0.17 | 1 | 7.70% | 2 | |
| Iron Oxide | Hydrothermal | Priority | Rank | |||
| Remote Sensing | Fe Oxide | 1 | 1 | 50.00% | 1 | |
| Hydrothermal | 1 | 1 | 50.00% | 1 | ||
Publisher’s Note: MDPI stays neutral with regard to jurisdictional claims in published maps and institutional affiliations. |
© 2022 by the authors. Licensee MDPI, Basel, Switzerland. This article is an open access article distributed under the terms and conditions of the Creative Commons Attribution (CC BY) license (https://creativecommons.org/licenses/by/4.0/).
Share and Cite
Shabani, A.; Ziaii, M.; Monfared, M.S.; Shirazy, A.; Shirazi, A. Multi-Dimensional Data Fusion for Mineral Prospectivity Mapping (MPM) Using Fuzzy-AHP Decision-Making Method, Kodegan-Basiran Region, East Iran. Minerals 2022, 12, 1629. https://doi.org/10.3390/min12121629
Shabani A, Ziaii M, Monfared MS, Shirazy A, Shirazi A. Multi-Dimensional Data Fusion for Mineral Prospectivity Mapping (MPM) Using Fuzzy-AHP Decision-Making Method, Kodegan-Basiran Region, East Iran. Minerals. 2022; 12(12):1629. https://doi.org/10.3390/min12121629
Chicago/Turabian StyleShabani, Ali, Mansour Ziaii, Mehrdad Solimani Monfared, Adel Shirazy, and Aref Shirazi. 2022. "Multi-Dimensional Data Fusion for Mineral Prospectivity Mapping (MPM) Using Fuzzy-AHP Decision-Making Method, Kodegan-Basiran Region, East Iran" Minerals 12, no. 12: 1629. https://doi.org/10.3390/min12121629